
Modeling low-carbon US electricity futures to explore impacts on
12
LETTER • OPEN ACCESS Modeling low-carbon US electricity futures to explore impacts on national and regional water use To cite this article: S Clemmer et al 2013 Environ. Res. Lett. 8 015004 View the article online for updates and enhancements. You may also like The water implications of generating electricity: water use across the United States based on different electricity pathways through 2050 J Macknick, S Sattler, K Averyt et al. - The effect of natural gas supply on US renewable energy and CO 2 emissions Christine Shearer, John Bistline, Mason Inman et al. - Shifting primary energy source and NO x emission location with plug-in hybrid vehicles Deniz Karman - Recent citations Assessment of regional water demand for coal-based power plants in India: exploring its regional impact on other cross-sectoral water stress Dharmesh Kumar Singh and Shresth Tayal - An integrated assessment framework for the decarbonization of the electricity generation sector Ankit Gupta et al - Effects of implausible power plant lifetime assumptions on US federal energy system projected costs, greenhouse gas emissions, air pollution, and water use L Mathias Zacarias and Emily Grubert - This content was downloaded from IP address 219.100.37.238 on 23/10/2021 at 01:16
Transcript of Modeling low-carbon US electricity futures to explore impacts on

LETTER • OPEN ACCESS
Modeling low-carbon US electricity futures toexplore impacts on national and regional wateruseTo cite this article: S Clemmer et al 2013 Environ. Res. Lett. 8 015004
View the article online for updates and enhancements.
You may also likeThe water implications of generatingelectricity: water use across the UnitedStates based on different electricitypathways through 2050J Macknick, S Sattler, K Averyt et al.
-
The effect of natural gas supply on USrenewable energy and CO2 emissionsChristine Shearer, John Bistline, MasonInman et al.
-
Shifting primary energy source and NOxemission location with plug-in hybridvehiclesDeniz Karman
-
Recent citationsAssessment of regional water demand forcoal-based power plants in India: exploringits regional impact on other cross-sectoralwater stressDharmesh Kumar Singh and ShresthTayal
-
An integrated assessment framework forthe decarbonization of the electricitygeneration sectorAnkit Gupta et al
-
Effects of implausible power plant lifetimeassumptions on US federal energy systemprojected costs, greenhouse gasemissions, air pollution, and water useL Mathias Zacarias and Emily Grubert
-
This content was downloaded from IP address 219.100.37.238 on 23/10/2021 at 01:16

IOP PUBLISHING ENVIRONMENTAL RESEARCH LETTERS
Environ. Res. Lett. 8 (2013) 015004 (11pp) doi:10.1088/1748-9326/8/1/015004
Modeling low-carbon US electricityfutures to explore impacts on national andregional water use
S Clemmer1, J Rogers1, S Sattler1, J Macknick2 and T Mai2
1 Union of Concerned Scientists, Cambridge, MA 02238-3780, USA2 National Renewable Energy Laboratory, Golden, CO 80401-3305, USA
E-mail: [email protected], [email protected], [email protected],[email protected] and [email protected]
Received 4 August 2012Accepted for publication 17 December 2012Published 16 January 2013Online at stacks.iop.org/ERL/8/015004
AbstractThe US electricity sector is currently responsible for more than 40% of both energy-relatedcarbon dioxide emissions and total freshwater withdrawals for power plant cooling (EIA2012a Annual Energy Outlook 2012 (Washington, DC: US Department of Energy), Kennyet al 2009 Estimated Use of Water in the United States 2005 (US Geological Survey Circularvol 1344) (Reston, VA: US Geological Survey)). Changes in the future electricity generationmix in the United States will have important implications for water use, particularly given thechanging water availability arising from competing demands and climate change andvariability. However, most models that are used to make long-term projections of theelectricity sector do not have sufficient regional detail for analyzing water-related impacts andinforming important electricity- and water-related decisions. This paper uses the NationalRenewable Energy Laboratory’s Regional Energy Deployment System (ReEDS) to model arange of low-carbon electricity futures nationally that are used to calculate changes in nationalwater use (a sample result, on water consumption, is included here). The model also producesdetailed sub-regional electricity results through 2050 that can be linked with basin-level watermodeling. The results will allow for sufficient geographic resolution and detail to be relevantfrom a water management perspective.
Keywords: electricity, water, climate, modeling
S Online supplementary data available from stacks.iop.org/ERL/8/015004/mmedia
1. Introduction
How the United States generates electricity matters froma range of perspectives. Different electricity mixes havedifferent implications for costs to consumers, land and waterresources, and air emissions including heat-trapping gases
Content from this work may be used under the termsof the Creative Commons Attribution-NonCommercial-
ShareAlike 3.0 licence. Any further distribution of this work must maintainattribution to the author(s) and the title of the work, journal citation and DOI.
such as carbon dioxide. As electricity sector decisions aremade, assessing the suite of impacts to other sectors at boththe national and regional level is important. For example, in2011, nearly 90% of electricity in the United States came fromthermoelectric (coal, natural gas, and nuclear) power plants(EIA 2012b). According to the US Geological Survey, powerplants accounted for 41% of total freshwater withdrawalsin 2005, and as much as two-thirds in certain states in theSoutheastern United States (Kenny et al 2009). While powerplants represent a much smaller portion of overall freshwaterconsumption (Solley et al 1998), they can have important
11748-9326/13/015004+11$33.00 c© 2013 IOP Publishing Ltd Printed in the UK

Environ. Res. Lett. 8 (2013) 015004 S Clemmer et al
impacts in places with low water quantities or high watertemperatures (Averyt et al 2012). Since the relative mix offuels and cooling technologies used to generate electricitydefines the total quantities of water used (Macknick et al2011), increasing demands for electricity and a changingelectricity generation mix can have important implications fornational, regional, and local water budgets.
This paper details a component of a multi-yearresearch project to analyze the water implications ofdifferent electricity pathways in the United States (Unionof Concerned Scientists 2012). Here we describe modelingaimed at generating a robust, policy-relevant set of electricitygeneration futures that are likely to have appreciably differentwater profiles. Because of the large role of the power sectorin contributing to and potentially mitigating climate change,several of our scenarios incorporate deep cuts in carbonemissions in the electricity sector.
For this work, we draw on analyses of current power plantwater use (Averyt et al 2012, Macknick et al 2011). Otherrelevant work has projected future water use by the powersector (Roy et al 2012, Elcock 2008, e.g.) or explored powersector vulnerabilities based on the characteristics of particularplants and their water resources (Van Vliet et al 2012, Hartoet al 2011, Elcock and Kuiper 2010, NETL 2009, e.g.).
The broader body of electricity–water pathways researchwhose foundation is the electricity scenarios described in thismanuscript is unique in that we model a range of electricityfutures for the US and link detailed sub-regional electricityresults from that modeling with basin-level water modeling.This allows us to produce results with sufficient geographicresolution and detail to be relevant from a water managementperspective. The electricity modeling also incorporates manyrecent changes in energy costs, technologies, policies, andregulations that will have important impacts on the futureelectricity mix in the US.
2. Methodology
The sections below describe our choice of model and keyassumptions and scenarios we incorporated into the modeling
2.1. Electric sector model
We used the Regional Energy Deployment System (ReEDS)electricity model developed by the National RenewableEnergy Laboratory (NREL) to generate future scenarios ofthe contiguous US power sector from 2010 to 2050. ReEDSis a long-term capacity-expansion and dispatch model thatrepresents all major generation technologies, including coal(supercritical and integrated gasification combined cycle orIGCC), natural gas combined cycle (CC), natural gas com-bustion turbines, fossil fuels with carbon capture and storage(CCS), nuclear, hydropower, wind, solar photovoltaics (PV),concentrating solar power (CSP), geothermal, biopower,and storage. ReEDS provides a detailed representationof electricity generation and transmission systems in theUS and addresses a variety of issues related to powersystem operations and infrastructure expansion, including
accessibility and cost of transmission, regional quality ofrenewable resources, seasonal and diurnal load and generationprofiles, variability and uncertainty of wind and solar power,and the influence of variability on electricity reliability(Short et al 2011). (See supplemental material available atstacks.iop.org/ERL/8/015004/mmedia for more informationon transmission and integration issues.)
ReEDS is a linear program that finds the least-costoptimal solution sequentially for each two-year period from2010 to 2050. The optimization is subject to a large numberof constraints, including balancing electricity supply anddemand, meeting planning and operating reserves, observingrenewable resource limits, and limiting system flexibilitybased on fleet characteristics. Policy or other scenario-specificconstraints can be added in the model (see section 2.3 forgeneration requirements used in this analysis). In addition,the sequential structure of the model allows for non-linearstatistical calculations to be made between each optimizationperiod to dynamically account for the variability of windand solar resources. These statistical estimates include thecapacity value, increased forecast error reserve requirements,and curtailment of wind and solar generation, and help toensure that the system remains reliable (within the resolutionof the model) for any future scenario. Electricity demandand the costs for generator, transmission, and other powersector infrastructure are exogenously defined. Key cost andperformance assumptions used in this analysis are presentedin section 2.2. The remaining data inputs are detailed in NREL(2012) and the full model documentation can be found atShort et al (2011). Since ReEDS does not directly includedistributed generation sources in its capacity-expansiondecision-making, we used the NREL Solar DeploymentSystem (SolarDS) model to project future solar photovoltaicdevelopment in the residential and commercial sectors(Denholm et al 2009).
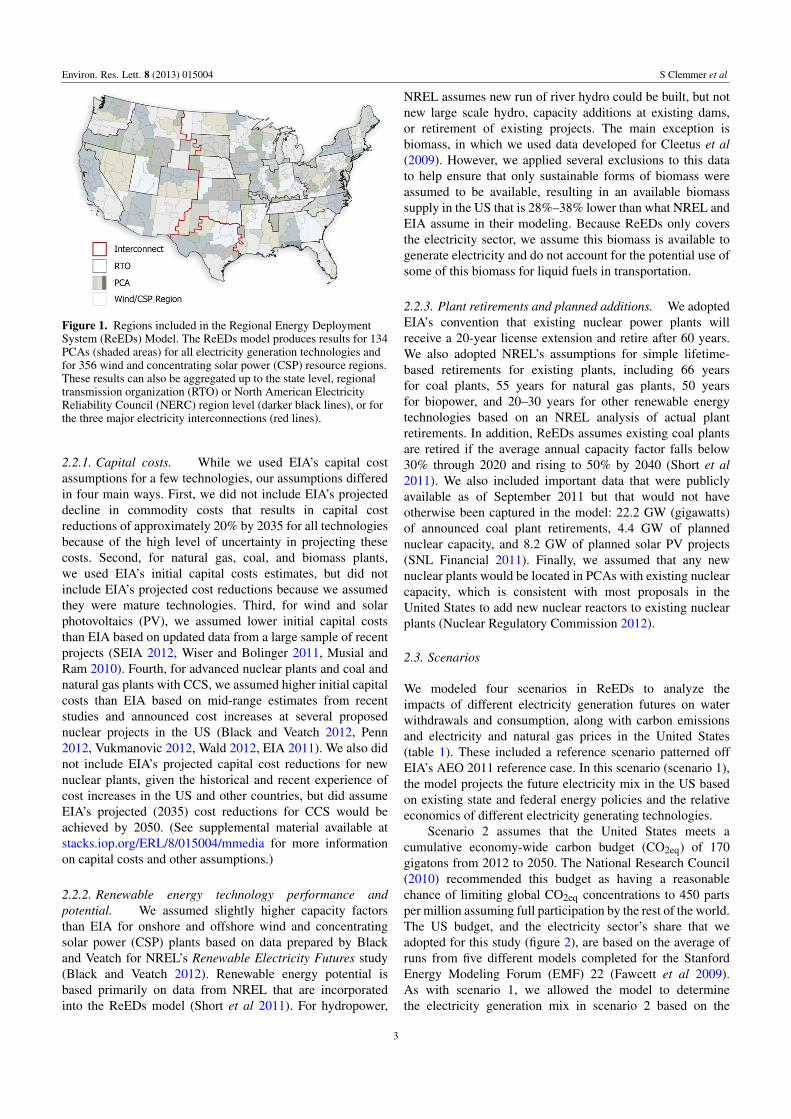
For purposes of our water-oriented electricity research,ReEDS offers the advantage of yielding results distributedamong 134 ‘power control authorities’ (PCAs) for mosttechnologies and 356 ‘resource regions’ for wind andconcentrating solar power technologies (figure 1). That degreeof spatial resolution is much greater than is available through,for example, the US Energy Information Administration’s(EIA) National Energy Modeling System (NEMS), whichonly produces results for 22 electricity supply regions. Greaterresolution is important for analyzing water impacts at relevantgeographic scales, the subject of additional work under thisproject (Macknick et al 2012, Sattler et al 2012).
2.2. Key assumptions
The cost and performance assumptions for different electricitygenerating technologies came primarily from EIA’s AnnualEnergy Outlook 2011 (AEO 2011) reference case (EIA 2011).This includes EIA’s assumptions for coal and natural gasprices, heat rates, capacity factors, operation and maintenancecosts, and financing costs. We also adopted EIA’s projectionsfor electricity demand, which increases at 0.8% per year onaverage in the US between 2010 and 2035. We assumed thisgrowth rate would continue to 2050.
2
Environ. Res. Lett. 8 (2013) 015004 S Clemmer et al
Figure 1. Regions included in the Regional Energy DeploymentSystem (ReEDs) Model. The ReEDs model produces results for 134PCAs (shaded areas) for all electricity generation technologies andfor 356 wind and concentrating solar power (CSP) resource regions.These results can also be aggregated up to the state level, regionaltransmission organization (RTO) or North American ElectricityReliability Council (NERC) region level (darker black lines), or forthe three major electricity interconnections (red lines).
2.2.1. Capital costs. While we used EIA’s capital costassumptions for a few technologies, our assumptions differedin four main ways. First, we did not include EIA’s projecteddecline in commodity costs that results in capital costreductions of approximately 20% by 2035 for all technologiesbecause of the high level of uncertainty in projecting thesecosts. Second, for natural gas, coal, and biomass plants,we used EIA’s initial capital costs estimates, but did notinclude EIA’s projected cost reductions because we assumedthey were mature technologies. Third, for wind and solarphotovoltaics (PV), we assumed lower initial capital coststhan EIA based on updated data from a large sample of recentprojects (SEIA 2012, Wiser and Bolinger 2011, Musial andRam 2010). Fourth, for advanced nuclear plants and coal andnatural gas plants with CCS, we assumed higher initial capitalcosts than EIA based on mid-range estimates from recentstudies and announced cost increases at several proposednuclear projects in the US (Black and Veatch 2012, Penn2012, Vukmanovic 2012, Wald 2012, EIA 2011). We also didnot include EIA’s projected capital cost reductions for newnuclear plants, given the historical and recent experience ofcost increases in the US and other countries, but did assumeEIA’s projected (2035) cost reductions for CCS would beachieved by 2050. (See supplemental material available atstacks.iop.org/ERL/8/015004/mmedia for more informationon capital costs and other assumptions.)
2.2.2. Renewable energy technology performance andpotential. We assumed slightly higher capacity factorsthan EIA for onshore and offshore wind and concentratingsolar power (CSP) plants based on data prepared by Blackand Veatch for NREL’s Renewable Electricity Futures study(Black and Veatch 2012). Renewable energy potential isbased primarily on data from NREL that are incorporatedinto the ReEDs model (Short et al 2011). For hydropower,
NREL assumes new run of river hydro could be built, but notnew large scale hydro, capacity additions at existing dams,or retirement of existing projects. The main exception isbiomass, in which we used data developed for Cleetus et al(2009). However, we applied several exclusions to this datato help ensure that only sustainable forms of biomass wereassumed to be available, resulting in an available biomasssupply in the US that is 28%–38% lower than what NREL andEIA assume in their modeling. Because ReEDs only coversthe electricity sector, we assume this biomass is available togenerate electricity and do not account for the potential use ofsome of this biomass for liquid fuels in transportation.
2.2.3. Plant retirements and planned additions. We adoptedEIA’s convention that existing nuclear power plants willreceive a 20-year license extension and retire after 60 years.We also adopted NREL’s assumptions for simple lifetime-based retirements for existing plants, including 66 yearsfor coal plants, 55 years for natural gas plants, 50 yearsfor biopower, and 20–30 years for other renewable energytechnologies based on an NREL analysis of actual plantretirements. In addition, ReEDs assumes existing coal plantsare retired if the average annual capacity factor falls below30% through 2020 and rising to 50% by 2040 (Short et al2011). We also included important data that were publiclyavailable as of September 2011 but that would not haveotherwise been captured in the model: 22.2 GW (gigawatts)of announced coal plant retirements, 4.4 GW of plannednuclear capacity, and 8.2 GW of planned solar PV projects(SNL Financial 2011). Finally, we assumed that any newnuclear plants would be located in PCAs with existing nuclearcapacity, which is consistent with most proposals in theUnited States to add new nuclear reactors to existing nuclearplants (Nuclear Regulatory Commission 2012).
2.3. Scenarios
We modeled four scenarios in ReEDs to analyze theimpacts of different electricity generation futures on waterwithdrawals and consumption, along with carbon emissionsand electricity and natural gas prices in the United States(table 1). These included a reference scenario patterned offEIA’s AEO 2011 reference case. In this scenario (scenario 1),the model projects the future electricity mix in the US basedon existing state and federal energy policies and the relativeeconomics of different electricity generating technologies.
Scenario 2 assumes that the United States meets acumulative economy-wide carbon budget (CO2eq) of 170gigatons from 2012 to 2050. The National Research Council(2010) recommended this budget as having a reasonablechance of limiting global CO2eq concentrations to 450 partsper million assuming full participation by the rest of the world.The US budget, and the electricity sector’s share that weadopted for this study (figure 2), are based on the average ofruns from five different models completed for the StanfordEnergy Modeling Forum (EMF) 22 (Fawcett et al 2009).As with scenario 1, we allowed the model to determinethe electricity generation mix in scenario 2 based on the
3

Environ. Res. Lett. 8 (2013) 015004 S Clemmer et al
Table 1. Electricity modeling scenarios.
Scenario Key assumptions and targets Key sources
(1) Reference case Existing state and federal policies Patterned off EIA’s AEO 2011 reference case, withupdates to select assumptions.
(2) Carbon budget, notechnology targets
Electricity sector contribution to a 170-GtC02eqeconomy-wide US carbon (equivalent) budgetthrough 2050
National Research Council (2010) and Fawcett et al(2009).
(3) Carbon budget and highernuclear and coal with carboncapture and storage (CCS)
• 29% nuclear generation by 2035 and 36% by2050
Upper end of range of estimates from Lovins (2011),National Research Council (2010), Specker (2010),Fawcett et al (2009), EIA (2009), and EPA (2009).• 15% coal with CCS generation by 2035 and
30% by 2050
(4) Carbon budget and higherenergy efficiency andrenewable energy
• 20% reduction in electricity use by 2035 and35% by 2050
Upper end of range of estimates from NREL (2012),Laitner et al (2012), Lovins (2011), NationalResearch Council (2009), Fawcett et al (2009),Granade et al (2009), and Cleetus et al (2009).
50% renewable generation by 2035 and 80% by2050
Figure 2. US electricity sector carbon budget. Fawcett et al suggestthat to achieve an economy-wide budget of 170 GtCO2eq, the UnitedStates would reduce emissions 83% below 2005 levels by 2050,which is similar to proposals introduced in Congress in 2009–2010(Waxman and Markey 2009, Kerry 2010). Fawcett et al and themodeling for the Congressional proposals showed that near-termcarbon reductions would most economically come from theelectricity sector, given the technology-switching options available.Based on the average of runs from five different models fromFawcett et al, we assumed that the electricity sector would accountfor 76% of the 2010–2050 cumulative economy-wide emissionsreductions.
relative economics of different technologies, subject to thisemissions budget. Carbon credit banking and borrowing werenot allowed in scenario 2; the annual power sector carbonemissions were determined a priori for all scenarios with anemissions budget.
Scenarios 3 and 4 included the same US CO2 emissionsbudget for the electricity sector plus targets for specific low-and no-carbon technologies. The technologies and targetswe chose are ones that numerous studies described belowhave shown could potentially achieve the greatest emissionreductions in the next 40 years, and that would likely produceappreciably different modeling results with respect to wateruse. For each technology or group of technologies, we adoptedaggressive targets to illustrate a range of possible outcomesand impacts given the uncertainty around technology costs
and innovation, fuel costs, energy policies, deployment andsiting issues, and other factors that will determine whichlow-carbon technologies are likely to be the biggest winners.While the technology targets are specified at the national level,the model determines the geographic distribution of thesetechnologies at the regional level based on relative economics,resource potential, electricity demand and other factors. Forcoal and renewable energy, the model also determines the mixand geographic distribution of different technologies includedthese categories (e.g. wind, solar, geothermal, or biopower).
For scenario 3, we assumed high levels of nuclear powerand coal plants with CCS. We assumed nuclear generationwould grow from approximately 20% of the US electricitymix today to 29% in 2035 and 36% in 2050, while coal withCCS would grow to 15% of the generation mix by 2035 and30% by 2050. We based these levels on the upper end of arange of projections from the EMF 22 study, EIA and USEnvironmental Protection Agency (EPA) analyses of federalclimate and energy legislation (EIA 2012c, 2009, EPA 2009),the Electric Power Research Institute (Specker 2010, Lovins2011). We also assume that new nuclear (beyond the 4.4 GWof planned additions we included in the model) and CCSplants would not be built until after 2020, which is consistentwith current proposals and the long lead time that is necessaryfor these plants.
For scenario 4, we assumed that the emissions reductionswould be met by aggressive deployment of energy efficiencyand renewable energy technologies over the next 40 years.We assumed that energy-efficient technologies and buildingswould reduce US electricity demand 20% by 2035 and35% by 2050 compared to the reference case, or about1% per year on average starting in 2016 (Laitner et al2012, Lovins 2011, National Research Council 2010, Fawcettet al 2009, Granade et al 2009). Several states are alreadyachieving or have adopted efficiency targets of between1% and 2.5% per year. We assumed electricity generationfrom renewable energy technologies, including wind, solar,geothermal, biomass, and hydropower, will grow from about10% in 2010 to 50% in 2035 and 80% by 2050. Thesetargets are based primarily on the 2012 NREL RenewableElectricity Futures study (NREL 2012), which analyzed the
4

Environ. Res. Lett. 8 (2013) 015004 S Clemmer et al
Figure 3. National electricity generation by scenario. Scenario 1, reference case; scenario 2, carbon budget, no technology targets;scenario 3, carbon budget with coal with CCS and nuclear targets; scenario 4, carbon budget with efficiency and renewable energy targets.Bus-bar demand is the amount of energy that needs to be delivered from the point of generation. Gas includes combustion turbine andcombined cycle (CC) plants. Solar photovoltaics (PV) include residential, commercial, and utility scale systems.
feasibility and impacts of integrating high levels of renewableenergy (30–90%) into the US electricity grid, as well as otherearlier studies (Lovins 2011, National Research Council 2009,Fawcett et al 2009, Cleetus et al 2009). For this scenario,we also adopted NREL’s (2012) assumption that includedUS Geological Survey mid-range estimates for undiscoveredhydrothermal sites in the geothermal supply curve. These siteshave reservoirs with sufficient naturally occurring thermalenergy, water, and permeability to be able to use conventional,commercially available technology to generate electricity.
We assume that additional (beyond existing state andfederal) policies and incentives would be needed to achievethe carbon budget and technology-specific targets, but wedid not attempt to identify or prescribe what the policieswould be and we did not include any new incentives orsubsidies in the analysis. While we also did not fully evaluatethe technical feasibility of achieving the technology-specifictargets, some of the external studies we used to definethe targets did include this information. In addition, wedid not explicitly model a high natural gas case becausenatural gas was the dominant source of new generationin the reference case, and natural gas with CCS played asignificant role in the second scenario, as shown in more detailbelow.
3. Results
Using the ReEDS model to explore the four scenarios, wecompare the impact of each carbon budget scenario to thereference case. The ReEDS model determines the mix ofelectricity generation technologies at the national and regionallevels to meet the carbon budget and technology targets, whichwe use to calculate the impacts on national water withdrawalsand consumption from the electricity sector. The model alsoprojects the impact on electricity and natural gas prices underthese scenarios.
3.1. National electricity generation
Under the reference case (scenario 1), electricity generationfrom coal-fired power plants steadily decreases over thecourse of the projection, representing a 37% reductionbetween 2010 and 2050 (figure 3). This decline in coalgeneration is initially due to the announced coal plantretirements included in the model resulting primarily fromlow natural gas prices, implementation of EPA regulations,and state requirements for energy efficiency and renewableenergy. Toward the end of the projection, coal generationdeclines due to existing coal plants retiring at the end of their
5

Environ. Res. Lett. 8 (2013) 015004 S Clemmer et al
assumed 66-year lifetime and the higher cost of new coalplants compared with natural gas. Nuclear generation alsostays near current levels through 2032, then steadily falls tonear zero by 2050 due to the assumed 60-year lifetime forexisting nuclear plants and the relatively high cost of buildingnew plants.
Most of the new generation needed in the reference caseto replace this reduction in coal and nuclear generation andmeet the modest growth in electricity demand is projected tocome from natural gas, which more than triples to provide57% of total US electricity generation in 2050. Renewableenergy generation also more than triples by 2030, due in largepart to state renewable electricity standards and federal taxcredits (in the early years), and increases more than six-foldby 2050, due to projected cost reductions that make sometechnologies economically competitive.
Under each of the carbon budget scenarios, allconventional coal generation (i.e., plants without CCS) isretired by 2030 because of its significantly higher carbonintensity compared to other technologies. Natural gas, withlower direct emissions and low fuel costs, also plays asignificant intermediary role in each of these scenarios.Renewable energy generation also grows significantly underall the carbon budget scenarios. Wind and solar powerexperience the largest growth, contributing 37–54% oftotal generation by 2050, while geothermal and biopowerexperience more modest growth.
In scenario 2, coal generation drops to zero by 2030.Natural gas plays a larger role in the early years and, with thelater addition of CCS. Renewable energy technologies makethe biggest contribution in this case, providing 45% of USelectricity by 2030 and 66% by 2050, as several technologiesare more cost-effective alternatives for meeting the carbonbudget than building new nuclear or coal with CCS plants.Wind and solar (PV and CSP) increase to 60% of totalUS electricity by 2050, to help meet the emission reductiontargets.
For scenario 3, the nuclear and coal with CCS targetsbegin in 2020 and increase to provide two-thirds of totalgeneration by 2050. Natural gas generation increases in theearly years to replace some of the decline in conventional coalgeneration. But as the targets for nuclear and coal with CCSincrease, natural gas decreases to 2% of the generation mixby the end of the projection, providing generation largely forbalancing output from a variety of resources for meeting peakdemands. Renewable energy generation led by wind and solaralso increases under this scenario to provide approximatelyone-third of total generation by 2050, however, this is less thanhalf of the growth seen in scenarios 2 and 4.
Finally, in scenario 4, energy efficiency plays a muchlarger role, eliminating the projected growth in electricitydemand and reducing electricity use 20% by 2030 and 35%by 2050 compared to the reference case. A diverse mix ofrenewable energy technologies contributes to meeting the80% by 2050 target. Wind and solar PV make the biggestcontributions, providing 55% of total generation by 2050.However, some wind generation (8% of total generation in2050) is curtailed in this scenario, primarily during periods
with strong winds and low electricity demand. Dispatchablerenewable energy technologies such as geothermal, biomass,CSP with storage, and hydropower—that can generallygenerate electricity when needed similar to coal, nuclear andnatural gas plants—also make an appreciable contribution.
3.2. Regional electricity generation
Changes in regional generation are also important to consider,as most generation and transmission decisions are made at thestate and regional levels. The electricity generation mix variesgreatly in different regions of the United States under ourfour scenarios due to regional differences in existing capacity,renewable energy resource potential, transmission capacity,electricity demand and other factors. While scenarios 2–4specify a national carbon budget and minimum penetrationlevels for specific technologies, the model determines howeach region will contribute to these national targets based onthese factors. In this paper, we focus on the US Southwestand Southeast, where water demands of electricity productionare particularly relevant and where there are significantdifferences in the current and projected electricity mix.
3.2.1. Southwest. The Southwest (figure 4) currently relieson natural gas (36% of total generation) and coal (33%)to meet most of its electricity needs, while the contributionfrom nuclear (14%) is smaller than the national average. Thecontribution from hydro (10%) and other renewable energysources (7%) is higher than the national average, as this regionhas a wide range of high quality renewable resources andrelatively strong renewable energy policies in place. Under thereference case (scenario 1), non-hydro renewable generationincreases to more than 38% and natural gas generation growsto 39% of total generation by 2050, replacing retiring nuclearand coal plants.
Under the carbon budget scenarios, all conventional coalcapacity in the region (as at the national level) is projected toretire and gas generation sharply declines by 2030. Renewablegeneration also increases appreciably under these scenarios,ranging from 66% by 2050 in scenario 3 to over 95% by2050 in scenario 4. Under scenario 2, CSP with storage,solar PV and wind provide most of the renewable generation.Under scenario 4, geothermal generation provides a muchlarger share of the renewable generation (36% by 2050),as it becomes economically viable later in the forecastto develop currently undiscovered hydrothermal geothermalsites represented in the ReEDS model for this scenario. Underscenario 3, all of the existing nuclear plants are replacedwith new nuclear capacity, resulting in an overall increasein nuclear generation in the region to 19% by 2050. Coalwith CCS also replaces most conventional coal generation,providing 14% of the region’s generation by 2050.
3.2.2. Southeast. In the Southeast (figure 5), the generationmix under each of the scenarios is much different than theSouthwest. In 2010, the Southeast relied heavily on coal(47%) and nuclear (27%) to generate most of its electricity,
6

Environ. Res. Lett. 8 (2013) 015004 S Clemmer et al
Figure 4. Electricity generation in the southwest, by scenario. Scenario 1, reference case; scenario 2, carbon budget, no technology targets;scenario 3, carbon budget with coal with CCS and nuclear targets; scenario 4, carbon budget with efficiency and renewable energy targets.For purposes of this analysis, the region includes California, Nevada, Arizona, Utah, New Mexico, Colorado, and Wyoming. Bus-bardemand is the amount of energy that needs to be delivered from the point of generation. Gas includes combustion turbine and combinedcycle (CC) plants. Solar photovoltaics (PV) include residential, commercial, and utility scale systems.
while the contribution from natural gas (17%) was smallerthan the national average. However, under the reference case,gas generation is projected to provide nearly three-quarters ofthe region’s total generation by 2050, as it replaces retiringcoal and nuclear plants and meets most of the projectedincrease in electricity demand.
Under the carbon budget scenarios, all conventional coalcapacity in the Southeast is projected to be retired by 2030,which is consistent with the results at the national level and inthe Southwest. The modeling also shows that the Southeasthas relatively good solar PV, biomass and offshore windresources, which results in those technologies appreciablyincreasing their share under scenarios 2 and 4 (27%–28% PV,9%–26% biomass and 12%–15% offshore wind by 2050). Wealso see a significant amount of gas with CCS under scenario2 (29% in 2050). With a large fraction of the nation’s existingnuclear capacity located in the southeast and our assumptionlimiting new nuclear facilities to PCAs with existing nuclearcapacity, scenario 3 sees significant growth in nuclear powerin the region (to 68% of generation by 2050), along withsignificant growth in coal with CCS (23% by 2050).
3.3. National electricity sector water consumption
Projections for power plant cooling water use can becalculated using electricity generation figures (by fuel and
cooling technology type) and average water use (withdrawalsor consumption) per unit of electricity for each type, asdescribed in Macknick et al (2012). For the purposes ofthis manuscript, we illustrate the changes in national waterconsumption, which captures evaporative losses from thecooling process. (Water withdrawals, another potentiallyimportant metric, can involve considerably higher volumesthan water consumption, though much of the water may bereturned back to the environment, at a higher temperature;consumption is the net of withdrawals and returns.) Suchan approach shows wide variations by scenario (figure 6),with the scale and direction of the differences varying overthe course of the projection. Under scenario 1, for example,national water consumption increases slightly (0.6%) by2030, as increased electricity demand is met primarily withnatural gas combined cycle plants, with no substantial changein coal and nuclear generation. However, by 2050, waterconsumption is 460 billion gallons (34.2%) lower than 2010levels, as coal and nuclear generation is substantially reducedand replaced with natural gas and renewable generation.
Under scenario 3, national water consumption declinesby 470 billion gallon (35.0%) by 2025, then increases above2010 levels (190 billion gallons, or 21.7%) by 2050, asexisting coal plants retire and new coal with CCS andnuclear facilities utilizing recirculating cooling technologiesincrease. Scenarios 2 and 4 follow a similar decreasing
7
Environ. Res. Lett. 8 (2013) 015004 S Clemmer et al
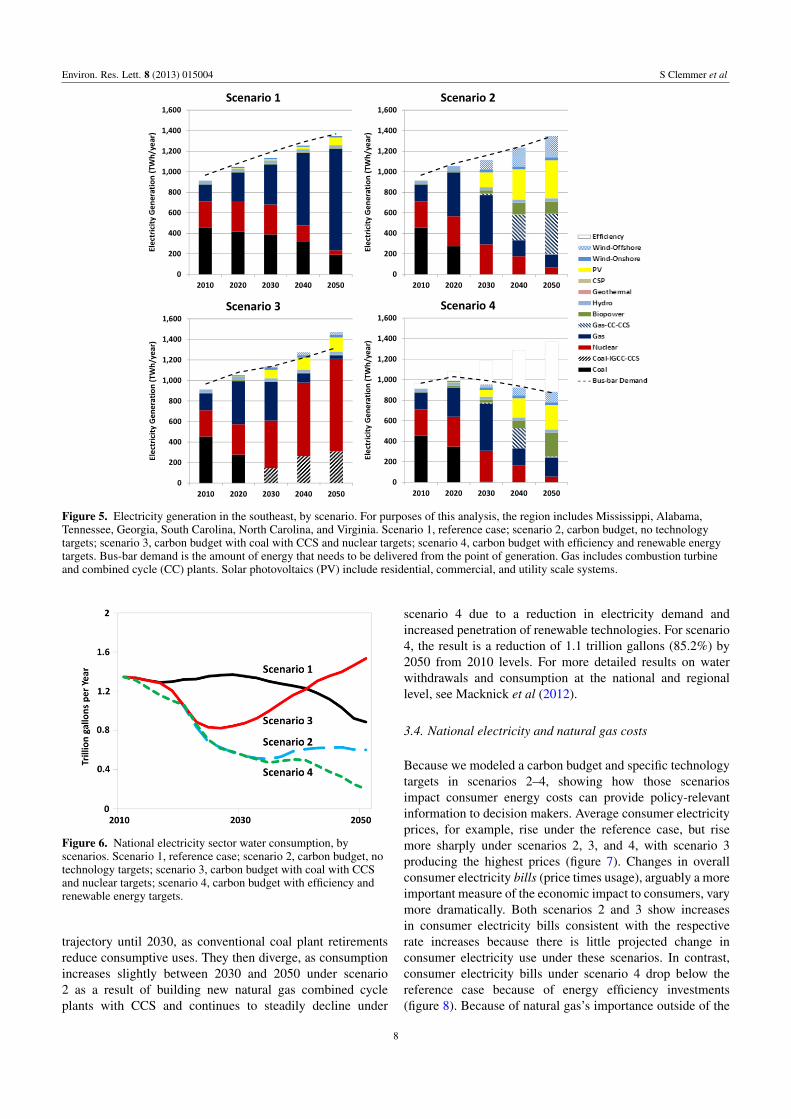
Figure 5. Electricity generation in the southeast, by scenario. For purposes of this analysis, the region includes Mississippi, Alabama,Tennessee, Georgia, South Carolina, North Carolina, and Virginia. Scenario 1, reference case; scenario 2, carbon budget, no technologytargets; scenario 3, carbon budget with coal with CCS and nuclear targets; scenario 4, carbon budget with efficiency and renewable energytargets. Bus-bar demand is the amount of energy that needs to be delivered from the point of generation. Gas includes combustion turbineand combined cycle (CC) plants. Solar photovoltaics (PV) include residential, commercial, and utility scale systems.
Figure 6. National electricity sector water consumption, byscenarios. Scenario 1, reference case; scenario 2, carbon budget, notechnology targets; scenario 3, carbon budget with coal with CCSand nuclear targets; scenario 4, carbon budget with efficiency andrenewable energy targets.
trajectory until 2030, as conventional coal plant retirementsreduce consumptive uses. They then diverge, as consumptionincreases slightly between 2030 and 2050 under scenario2 as a result of building new natural gas combined cycleplants with CCS and continues to steadily decline under
scenario 4 due to a reduction in electricity demand andincreased penetration of renewable technologies. For scenario4, the result is a reduction of 1.1 trillion gallons (85.2%) by2050 from 2010 levels. For more detailed results on waterwithdrawals and consumption at the national and regionallevel, see Macknick et al (2012).
3.4. National electricity and natural gas costs
Because we modeled a carbon budget and specific technologytargets in scenarios 2–4, showing how those scenariosimpact consumer energy costs can provide policy-relevantinformation to decision makers. Average consumer electricityprices, for example, rise under the reference case, but risemore sharply under scenarios 2, 3, and 4, with scenario 3producing the highest prices (figure 7). Changes in overallconsumer electricity bills (price times usage), arguably a moreimportant measure of the economic impact to consumers, varymore dramatically. Both scenarios 2 and 3 show increasesin consumer electricity bills consistent with the respectiverate increases because there is little projected change inconsumer electricity use under these scenarios. In contrast,consumer electricity bills under scenario 4 drop below thereference case because of energy efficiency investments(figure 8). Because of natural gas’s importance outside of the
8

Environ. Res. Lett. 8 (2013) 015004 S Clemmer et al
Figure 7. Average consumer electricity prices. Scenario 1,reference case; scenario 2, carbon budget, no technology targets;scenario 3, carbon budget with coal with CCS and nuclear targets;scenario 4, carbon budget with efficiency and renewable energytargets. Average consumer electricity prices represent the average ofprices in the residential, commercial, and industrial sectors. Pricesrise under each of the scenarios based on varying technology andgeneration mixes, fuel use and price, new transmission lines andnew storage capacity. Under the reference case (scenario 1),electricity prices increase 34% over current levels by 2050 due toincreases in natural gas and coal prices and investments in newpower plants to meet the growth in electricity demand and to replaceretired capacity. Scenario 3 shows the greatest increases inelectricity prices compared to the reference case, 30% higher in2030 and 25% higher in 2050. Scenario 4 shows a more modestprice increases, with prices 14% higher than the reference case in2030 and 9% higher in 2050.
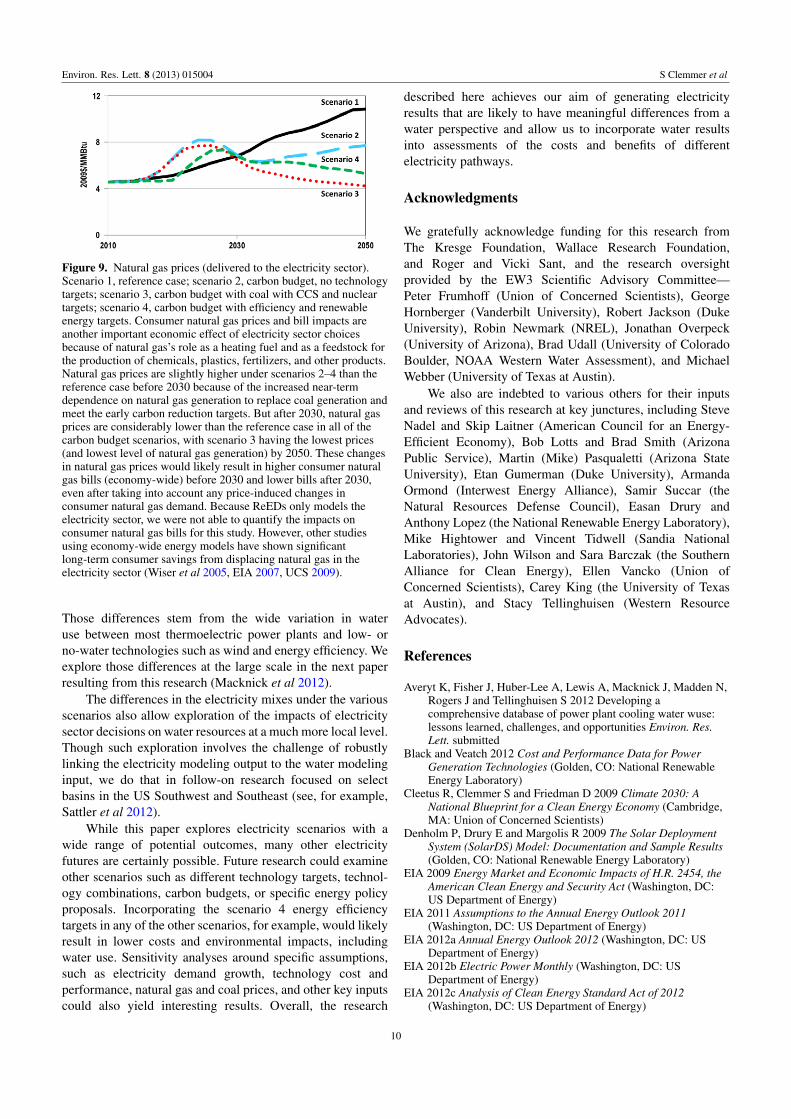
electricity sector—as a heating fuel and feedstock (plastics,chemicals, fertilizers)—changes in its pricing as a result ofchanges in natural use in the electricity sector can havebroad implications. In scenarios 2–4, gas prices are initiallyhigher than the reference case because of the increasednear-term dependence on natural gas to help meet carbonreduction targets, but then drop below the reference case asgas generation declines, with scenario 3 having the lowestprices by 2050 (figure 9).
Importantly, these changes in electricity and naturalgas prices are result of implementing a carbon budget andtechnology targets in the electricity sector only. They do notreflect changes in technology and fuel choices in the othersectors, and the resulting impact on energy prices and usagethat would result from an economy-wide carbon budget. Forexample, projected changes in consumer electricity bills donot include a potential increase in electric vehicles to reduceCO2 from the transportation sector or changes in natural gasdemand in the buildings and industry sectors that would resultfrom changes in natural gas prices.
4. Conclusions
The different electricity futures described in this paper willall have important economic and environmental implicationsand trade-offs at both the national and regional levels. Forexample, while the reference case is projected to havethe lowest electricity prices, it also has the highest waterconsumption through 2040, highest long-term natural gasprices, and least diversified electricity mix. This scenarioalso has the highest carbon emissions, which would pose
Figure 8. Total consumer electricity bills. Scenario 1, referencecase; scenario 2, carbon budget, no technology targets; scenario 3,carbon budget with coal with CCS and nuclear targets; scenario 4,carbon budget with efficiency and renewable energy targets. Bothscenarios 2 and 3 show increases in overall residential, commercial,and industrial consumer electricity bills (calculated as the averageprice times total consumption) largely consistent with the priceincreases. There is little change in consumer electricity use inscenarios 1–3 as increases in electricity demand due to populationgrowth, economic growth and other factors are mostly offset byefficiency improvements in energy technologies and buildings.Under scenario 4, however, significant reductions in electricity usedue to more aggressive investments in energy efficiency more thanoffset price increases, resulting in savings on consumer electricitybills. Under that scenario, consumer electricity bills would be $63billion or 13% lower than under the reference case by 2035 and$214 billion or 31% lower by 2050. While we did not calculate theinvestment or program costs that would be needed to realize thosesavings, a 2008 study estimated annual costs of $36 billion (in2009$) to achieve a similar level of reduction in electricity use in2035, increasing to $62 billion to achieve a similar reduction in2050 (Cleetus et al 2009). If costs were similar or even considerablyhigher than these estimates, electricity consumers would still seesignificant net annual savings. Other studies (Laitner et al 2012,Lovins 2011, Granade et al 2009, National Research Council 2009)have also shown that electricity bill savings from energy efficiencytypically more than offset investment costs.
significant risks to the climate, public health, and the economyfrom the projected impacts of unchecked climate change thatare also not included in this analysis.
While the reference case will involve considerablechanges to our energy system, achieving any of the carbonbudget and high technology penetration scenarios willarguably involve more fundamental transformations. Thosetransformations may include significant benefits in termsof reduced climate change impacts and greater electricsystem diversity, but will also require major operationaland infrastructure changes, as well as other economic andenvironmental benefits and risks not considered. Investingin new nuclear and coal with CCS facilities to significantlyreduce carbon emissions is projected to result in the highestlong-term water consumption and the highest electricitycosts. In contrast, investing in renewable energy and energyefficiency to meet emission reduction targets is projected toresult in significant water savings, lower costs, and even netsavings to consumers.
Importantly, for purposes of the broader body ofelectricity–water work for which the electricity modelingdescribed in this paper is the first step, different electricitymixes are also likely to have very different water profiles.
9
Environ. Res. Lett. 8 (2013) 015004 S Clemmer et al
Figure 9. Natural gas prices (delivered to the electricity sector).Scenario 1, reference case; scenario 2, carbon budget, no technologytargets; scenario 3, carbon budget with coal with CCS and nucleartargets; scenario 4, carbon budget with efficiency and renewableenergy targets. Consumer natural gas prices and bill impacts areanother important economic effect of electricity sector choicesbecause of natural gas’s role as a heating fuel and as a feedstock forthe production of chemicals, plastics, fertilizers, and other products.Natural gas prices are slightly higher under scenarios 2–4 than thereference case before 2030 because of the increased near-termdependence on natural gas generation to replace coal generation andmeet the early carbon reduction targets. But after 2030, natural gasprices are considerably lower than the reference case in all of thecarbon budget scenarios, with scenario 3 having the lowest prices(and lowest level of natural gas generation) by 2050. These changesin natural gas prices would likely result in higher consumer naturalgas bills (economy-wide) before 2030 and lower bills after 2030,even after taking into account any price-induced changes inconsumer natural gas demand. Because ReEDs only models theelectricity sector, we were not able to quantify the impacts onconsumer natural gas bills for this study. However, other studiesusing economy-wide energy models have shown significantlong-term consumer savings from displacing natural gas in theelectricity sector (Wiser et al 2005, EIA 2007, UCS 2009).
Those differences stem from the wide variation in wateruse between most thermoelectric power plants and low- orno-water technologies such as wind and energy efficiency. Weexplore those differences at the large scale in the next paperresulting from this research (Macknick et al 2012).
The differences in the electricity mixes under the variousscenarios also allow exploration of the impacts of electricitysector decisions on water resources at a much more local level.Though such exploration involves the challenge of robustlylinking the electricity modeling output to the water modelinginput, we do that in follow-on research focused on selectbasins in the US Southwest and Southeast (see, for example,Sattler et al 2012).
While this paper explores electricity scenarios with awide range of potential outcomes, many other electricityfutures are certainly possible. Future research could examineother scenarios such as different technology targets, technol-ogy combinations, carbon budgets, or specific energy policyproposals. Incorporating the scenario 4 energy efficiencytargets in any of the other scenarios, for example, would likelyresult in lower costs and environmental impacts, includingwater use. Sensitivity analyses around specific assumptions,such as electricity demand growth, technology cost andperformance, natural gas and coal prices, and other key inputscould also yield interesting results. Overall, the research
described here achieves our aim of generating electricityresults that are likely to have meaningful differences from awater perspective and allow us to incorporate water resultsinto assessments of the costs and benefits of differentelectricity pathways.
Acknowledgments
We gratefully acknowledge funding for this research fromThe Kresge Foundation, Wallace Research Foundation,and Roger and Vicki Sant, and the research oversightprovided by the EW3 Scientific Advisory Committee—Peter Frumhoff (Union of Concerned Scientists), GeorgeHornberger (Vanderbilt University), Robert Jackson (DukeUniversity), Robin Newmark (NREL), Jonathan Overpeck(University of Arizona), Brad Udall (University of ColoradoBoulder, NOAA Western Water Assessment), and MichaelWebber (University of Texas at Austin).
We also are indebted to various others for their inputsand reviews of this research at key junctures, including SteveNadel and Skip Laitner (American Council for an Energy-Efficient Economy), Bob Lotts and Brad Smith (ArizonaPublic Service), Martin (Mike) Pasqualetti (Arizona StateUniversity), Etan Gumerman (Duke University), ArmandaOrmond (Interwest Energy Alliance), Samir Succar (theNatural Resources Defense Council), Easan Drury andAnthony Lopez (the National Renewable Energy Laboratory),Mike Hightower and Vincent Tidwell (Sandia NationalLaboratories), John Wilson and Sara Barczak (the SouthernAlliance for Clean Energy), Ellen Vancko (Union ofConcerned Scientists), Carey King (the University of Texasat Austin), and Stacy Tellinghuisen (Western ResourceAdvocates).
References
Averyt K, Fisher J, Huber-Lee A, Lewis A, Macknick J, Madden N,Rogers J and Tellinghuisen S 2012 Developing acomprehensive database of power plant cooling water wuse:lessons learned, challenges, and opportunities Environ. Res.Lett. submitted
Black and Veatch 2012 Cost and Performance Data for PowerGeneration Technologies (Golden, CO: National RenewableEnergy Laboratory)
Cleetus R, Clemmer S and Friedman D 2009 Climate 2030: ANational Blueprint for a Clean Energy Economy (Cambridge,MA: Union of Concerned Scientists)
Denholm P, Drury E and Margolis R 2009 The Solar DeploymentSystem (SolarDS) Model: Documentation and Sample Results(Golden, CO: National Renewable Energy Laboratory)
EIA 2009 Energy Market and Economic Impacts of H.R. 2454, theAmerican Clean Energy and Security Act (Washington, DC:US Department of Energy)
EIA 2011 Assumptions to the Annual Energy Outlook 2011(Washington, DC: US Department of Energy)
EIA 2012a Annual Energy Outlook 2012 (Washington, DC: USDepartment of Energy)
EIA 2012b Electric Power Monthly (Washington, DC: USDepartment of Energy)
EIA 2012c Analysis of Clean Energy Standard Act of 2012(Washington, DC: US Department of Energy)
10

Environ. Res. Lett. 8 (2013) 015004 S Clemmer et al
Elcock D 2008 Baseline and Projected Water Demand Data forEnergy and Competing Water Use Sectors (Chicago, IL:Argonne National Laboratory)
Elcock D and Kuiper J 2010 Water Vulnerabilities for ExistingCoal-fired Power Plants (Chicago, IL: Argonne NationalLaboratory)
EIA (Energy Information Administration) 2007 Energy andEconomic Impacts of Implementing Both a 25-PercentRenewable Portfolio Standard and a 25-Percent RenewableFuel Standard by 2025 (Washington, DC: US Department ofEnergy)
EPA (Environmental Protection Agency) 2009 EPA analysis of theAmerican Clean Energy and Security Act of 2009: H.R. 2454in the 111th Congress (Washington, DC: EPA)
Fawcett A A, Katherine V C, de la Chesnaye F C, Reilly J M andWeyant J P 2009 Overview of EMF 22 US transition scenariosEnergy Econ. 3 S198–211
Granade H C, Creyts J, Farese P, Nyquist S and Ostrowski K 2009Unlocking Energy Efficiency in the US Economy (Stamford,CT: McKinsey & Company)
Harto C B, Yan Y E, Demissie Y K, Elcock D, Tidwell V C,Hallett K, Macknick J, Wigmosta M S and Tesfa T K 2011Analysis of Drought Impacts on Electricity Production in theWestern and Texas Interconnections of the United States(Chicago, IL: Argonne National Laboratory)
Kenny J F, Barber N L, Hutson S S, Linsey K S, Lovelace J K andMaupin M A 2009 Estimated Use of Water in the United Statesin 2005 (US Geological Survey Circular vol 1344) (Reston,VA: US Geological Survey)
Kerry J F 2010 Clean Energy Jobs and American Power Act(Washington, DC: Library of Congress)
Laitner J A, Nadel S, Elliott R N, Sachs H and Khan A S 2012Long-term Energy Efficiency Potential: What the EvidenceSuggests (Washington, DC: American Council for anEnergy-Efficient Economy)
Lovins A 2011 Reinventing Fire: Bold Business Solutions for theNew Energy Era (White River Junction, VT: Chelsea GreenPublishing Company)
Macknick J, Newmark R, Heath G and Hallett K C 2011 A Reviewof Operational Water Consumption and Withdrawal Factorsfor Electricity Generating Technologies (Golden, CO: NationalRenewable Energy Laboratory)
Macknick J, Sattler S, Averyt K, Clemmer S and Rogers J 2012 Thewater implications of generating electricity: water use acrossthe United States based on different electricity pathwaysthrough 2050 Environ. Res. Lett. 7 045803
Musial W and Ram B 2010 Large-Scale Offshore Wind Power in theUnited States: Assessment of Opportunities and Barriers(Golden, CO: National Renewable Energy Laboratory)
National Energy Technology Laboratory (NETL) 2009 Impact ofDrought on US Steam Electric Power Plant Cooling WaterIntakes and Related Water Resource Management Issues(Washington, DC: US Department of Energy)
National Renewable Energy Laboratory (NREL) 2012 RenewableElectricity Futures Study ed M M Hand, S Baldwin, E DeMeo,J M Reilly, T Mai, D Arent, G Porro, M Meshek andD Sandor (Washington, DC: US Department of Energy)
National Research Council 2009 America’s Energy Future: RealProspects for Energy Efficiency in the United States(Washington, DC: National Academies Press)
National Research Council 2010 Limiting the Magnitude of FutureClimate Change (Washington, DC: The National AcademiesPress)
Nuclear Regulatory Commission 2012 Location of Projected NewNuclear Power Reactors (www.nrc.gov/reactors/new-reactors/col/new-reactor-map.html)
Penn I 2012 Progress energy raises price tag, delays start date ofLevy nuclear plant Tampa Bay Times (www.tampabay.com/news/business/energy/progress-energy-raises-price-tag-delays-start-date-of-levy-nuclear-plant/1227830)
Roy S B, Chen L, Girvetz E H, Maurer E P, Mills W B andGrieb T M 2012 Projecting water withdrawal and supply forfuture decades in the US under climate change scenariosEnviron. Sci. Technol. 46 2545–56
Sattler S, Macknick J, Yates D, Flores-Lopez F, Lopez A andRogers J 2012 Linking electricity and water models to assesselectricity choices at water-relevant scales Environ. Res. Lett.7 045804
Solar Energy Industries Association (SEIA) and GTM Research2012 US Solar Market Insight Report: 2011 Year-in-Review(Washington, DC: SEIA/GTM Research)
Short W, Sullivan P, Mai T, Mowers M, Uriarte C, Blair N,Heimiller D and Martinez A 2011 Regional EnergyDeployment System (ReEDS) (Golden, CO: NationalRenewable Energy Laboratory)
SNL Financial 2011 Downloaded data on coal plant retirements andnuclear and solar facility planned additions as of September2011
Solley W B, Pierce R R and Perlman H A 1998 Estimated Use ofWater in the United States in 1995 (US Geological SurveyCircular vol 1200) (Reston, VA: US Geological Survey)
Specker S 2010 Framing the Discussion: 2010 Summer Seminar(Chicago, IL: Electric Power Research Institute)
Union of Concerned Scientists 2009 Clean Power Green Jobs: ANational Renewable Electricity Standard Will Boost theEconomy and Protect the Environment (Cambridge, MA:Union of Concerned Scientists)
Union of Concerned Scientists 2012 The Energy and Water in aWarming World Initiative: About EW3 (www.ucsusa.org/ew3)
Van Vliet M T H, Yearsley J R, Ludwig F, Vogele S,Lettenmaier D P and Kabat P 2012 Vulnerability of US andEuropean electricity supply to climate change Nature Clim.Change 2 676–81
Vukmanovic O 2012 UK nuclear build requires taxpayerrescue—Citi Reuters (http://uk.reuters.com/article/2012/05/08/uk-nuclear-britain-edf-idUKBRE8470XC20120508)
Wald T 2012 A higher price tag for a nuclear project The New YorkTimes (http://green.blogs.nytimes.com/2012/05/11/a-higher-price-tag-for-a-nuclear-project/)
Waxman H A and Markey E J 2009 American Clean Energy andSecurity Act of 2009 (Washington, DC: Library of Congress)
Wiser R and Bolinger M 2011 2010 Wind Technologies MarketReport (Washington, DC: US Department of Energy, Office ofEnergy Efficiency and Renewable Energy)
Wiser R, Bolinger M and Clair M St 2005 Easing the Natural GasCrisis: Reducing Natural Gas Prices through IncreasedDeployment of Renewable Energy and Energy Efficiency(Berkeley, CA: Ernest Orlando Lawrence Berkeley NationalLaboratory)
11


![[CBOT] CBOT Electricity Futures and Options Reference and Applications Guide](https://static.fdocuments.us/doc/165x107/577d2f891a28ab4e1eb1fe34/cbot-cbot-electricity-futures-and-options-reference-and-applications-guide.jpg)