Modeling global pricing and launching of new drugs · Modeling Global Pricing and ... his helps in...
261
DOCTORAL THESIS Modeling Global Pricing and Launching of New Drugs Author: Borja García Lorenzo Las Palmas de Gran Canaria, April 2014
Transcript of Modeling global pricing and launching of new drugs · Modeling Global Pricing and ... his helps in...

DOCTORAL THESIS
Modeling Global Pricing and Launching of New Drugs
Author: Borja García Lorenzo Las Palmas de Gran Canaria, April 2014


DOCTORADO EN ECONOMÍA: APLICACIONES A LAS FINANZAS Y SEGUROS, A LA ECONOMÍA SECTORIAL, AL MEDIO AMBIENTE Y A LAS
INFRAESTRUCTURAS.
Modeling Global Pricing and Launching of New Drugs
Tesis doctoral presentada por D. Borja García Lorenzo
Dirigida por Dra. Beatriz González López-Valcárcel
La Directora, El Doctorando,
Las Palmas de Gran Canaria, abril de 2014


Existimos porque alguien piensa en nosotros,
y no al revés


Acknowledgments
Foremost, I would like to express my sincere gratitude to my advisor Dr. Beatriz
González López-Valcárcel for the continuous support of my Ph.D study and research, for
his patience, motivation, enthusiasm, constant feedback and immense knowledge. His
guidance helped me in all the time of research and writing of this thesis.
My sincere thanks also go to Dr. Izabela Jelovac and Dr. Margaret Kyle for offering
me the opportunities to enjoy my visiting scholars in the Groupe d’Analyse et Théorie
Economique (GATE) and the Toulouse School of Economics (TSE) respectively, for their
encouragement, insightful comments, and hard questions. I also thank Carlos J. Pérez for
his helps in the field of decision theory.
I thank my fellow officemates in the University of Las Palmas de Gran Canaria
(ULPGC): Reinaldo, Hicham, Rubén, Teresa and Federico for the stimulating discussions,
for the hard days we were working together, and for all the fun we have had in the last
years.
I gratefully acknowledge the funding received towards my PhD from the Canarian
Agency for Research, Innovation and Information Society of the Canarian Government
(ACIISI). Also, I thank IMS for providing the data for the empirical section, particuarly to
Miguel Martínez.
Last but not the least, I would like to thank my parents Roque and Pepa for
supporting my education without regard, and Naira, for her understanding, even so she
has not a Ph.D, she has supported me as if she was one. Friends around me have been a
great support to reach this moment. Thank you all.


Contents
List of Figures ............................................................................................................... XV
List of Tables .............................................................................................................. XVII
List of abbreviates ....................................................................................................... XIX
Introduction ................................................................................................................... 1
1 Chapter 1: Global Pricing and Launching of New Drugs: What Does the Theory Say?
What Do the Empirical Models Show? ........................................................................... 7
1.1 Introduction ................................................................................................................. 7
1.2 What does the theory say? ........................................................................................... 9
1.2.1 Launching as a result of bargaining process: trade‐offs between pricing and
launching .................................................................................................................................... 9
1.2.2 How the ERP is affecting the bargaining results in pricing and launching? ................ 10
1.2.3 Which role does PT play in the pharmaceutical market? ............................................ 13
1.2.4 How asymmetric information on quality of drugs may affect drug pricing and
launching? ................................................................................................................................ 14
1.2.5 Are important the headquarters location and the contacts among firms when
pricing drugs? ........................................................................................................................... 16
1.2.6 Which effects do arise in pricing and innovation when countries apply internal RP? 17
1.3 What do the empirical models show? ......................................................................... 20
1.3.1 Samples, Variables and Methods ................................................................................ 20
1.3.2 Factors influencing prices ............................................................................................ 24 1.3.2.1 Drug Characteristics ............................................................................................................ 24 1.3.2.2 Competition and substitutes .............................................................................................. 26 1.3.2.3 Regulation Characteristics .................................................................................................. 28 1.3.2.4 Country Characteristics ...................................................................................................... 30 1.3.2.5 Firm Characteristics ............................................................................................................ 31
1.3.3 Factors influencing launching ...................................................................................... 33 1.3.3.1 Drug Characteristics ............................................................................................................ 33 1.3.3.2 Competition and substitutes .............................................................................................. 34 1.3.3.3 Regulation Characteristics .................................................................................................. 34 1.3.3.4 Country Characteristics ...................................................................................................... 37 1.3.3.5 Firm Characteristics ............................................................................................................ 38
1.4 Discussion .................................................................................................................. 39
XII Modeling Global Pricing and Launching of New Drugs
2 Chapter 2: External Reference Pricing and Pharmaceutical Cost‐Containment. ...... 47
2.1 Introduction ............................................................................................................... 47
2.2 The model .................................................................................................................. 53
2.3 Price Setting and Sequential Launch ........................................................................... 63
2.3.1 The firm is trusted by the health agency ..................................................................... 63
2.3.2 The firm states the number of QALYs above the true value ....................................... 75
2.4 Comparing Policies: CEA vs. ERP .................................................................................. 75
2.5 Conclusions ................................................................................................................ 78
3 Chapter 3: Global Pricing and Launching of New Drugs. An Econometric Approach 81
3.1 Introduction ............................................................................................................... 81
3.2 Data description ......................................................................................................... 82
3.3 Replicating Danzon and Epstein (2008) ....................................................................... 85
3.3.1 The D&E model ............................................................................................................ 85
3.3.2 Data ............................................................................................................................. 86
3.3.3 Comparison of results ................................................................................................. 87 3.3.3.1 Launch equation ................................................................................................................. 87 3.3.3.2 Launch price equation ........................................................................................................ 89
3.4 Replicating Verniers et al. (2011) ................................................................................ 91
3.4.1 The Verniers et al. model ............................................................................................ 91
3.4.2 Data ............................................................................................................................. 94
3.4.3 Comparison of results ................................................................................................. 94 3.4.3.1 Launch window equation ................................................................................................... 94 3.4.3.2 Launch price equation ........................................................................................................ 97
3.5 New Pricing and Launching Model (NPLM) .................................................................. 98
3.5.1 The Model ................................................................................................................... 98
3.5.2 Data ........................................................................................................................... 102
3.5.3 Results ....................................................................................................................... 102 3.5.3.1 Launch delay equation ..................................................................................................... 102 3.5.3.2 Relative launch price equation ......................................................................................... 104
3.5.4 Discussion .................................................................................................................. 108
3.6 Conclusions .............................................................................................................. 110
Conclusions and further research ............................................................................... 113
A. Appendix A .......................................................................................................... 117
A.1. Method of Review ................................................................................................... 117
A.1.1 Search strategy .......................................................................................................... 117
A.1.2 Selection and Exclusion Criteria ................................................................................ 117
A.1.3 Search results ............................................................................................................ 118
B. Appendix B .......................................................................................................... 139
B.1 Decision tree and proofs ........................................................................................... 139
C. Appendix C .......................................................................................................... 147
Contents XIII
C.1. Variable definitions of Danzon and Epstein (2008) ................................................... 147
C.2. Variables definitions of Verniers et al. (2011) ........................................................... 162
C.3. Variable definitions of the NPLM ............................................................................. 169
C.4. Selection of parametric model ................................................................................. 173
Resumen en español .................................................................................................. 179
Motivación ........................................................................................................................ 179
Objetivos ........................................................................................................................... 183
Planteamiento y metodología ............................................................................................ 185
Revisión de la literatura ......................................................................................................... 185
Modelo teórico ....................................................................................................................... 187 Fijación de precios y lanzamiento secuencial ................................................................................... 200
Modelo empírico .................................................................................................................... 205 Réplica del modelo de Danzon y Epstein (2008) .............................................................................. 205 Réplica del modelo de Verniers et al. (2011) .................................................................................... 207 Nuevo modelo precio y lanzamiento (NPLM) ................................................................................... 210
Resultados ......................................................................................................................... 217
Revisión de la literatura ......................................................................................................... 217
Modelo teórico ....................................................................................................................... 219
Modelo empírico .................................................................................................................... 222
Conclusiones ...................................................................................................................... 228
References ................................................................................................................. 235


Contents XV
List of Figures FIGURE 2.1 OPTIMAL COUNTRY LAUNCH SEQUENCE UNDER A) ....................................................................................... 71
FIGURE 2.2 OPTIMAL COUNTRY LAUNCH SEQUENCE UNDER B) ....................................................................................... 72
FIGURE 2.3 OPTIMAL COUNTRY LAUNCH SEQUENCE UNDER C) ....................................................................................... 73
FIGURE 2.4 OPTIMAL COUNTRY LAUNCH SEQUENCE UNDER D) ...................................................................................... 74
FIGURE 2.5. ERP VS. CEA ..................................................................................................................................... 77
FIGURE A.1 FLOW DIAGRAM OF LITERATURE SCREENING PROCESS ............................................................................... 119
FIGURE B.1 DECISION TREE .................................................................................................................................. 140
FIGURE C.1. DENSITY FUNCTION OF DELAY IN MONTHS. RETAIL MARKET ..................................................................... 174
FIGURE C.2. DENSITY FUNCTION OF DELAY IN MONTHS. HOSPITAL MARKET ................................................................. 174
FIGURE C.3. WEIBULL, GAMMA. RETAIL MARKET ..................................................................................................... 175
FIGURE C.4. WEIBULL, INVERSE GAUSSIAN. RETAIL MARKET ....................................................................................... 175
FIGURE C.5. GOMPERTZ, GAMMA. RETAIL MARKET .................................................................................................. 175
FIGURE C.6.GOMPERTZ, INVERSE GAUSSIAN. RETAIL MARKET ..................................................................................... 176
FIGURE C.7. WEIBULL, GAMMA. HOSPITAL MARKET ................................................................................................. 176
FIGURE C.8. WEIBULL, INVERSE GAUSSIAN. HOSPITAL MARKET .................................................................................. 177
FIGURE C.9. GOMPERTZ, GAMMA. HOSPITAL MARKET .............................................................................................. 177
FIGURE C.10. GOMPERTZ,INVERSE GAUSSIAN. HOSPITAL MARKET .............................................................................. 177
FIGURA 4.1 DIAGRAMA DE FLUJO DEL PROCESO DE SELECCIÓN DE LA LITERATURA ............................................................ 187
FIGURA 4.2 ÁRBOL DE DECISION ............................................................................................................................ 199
FIGURA 4.3 REGIONES DE SECUENCIAS ÓPTIMAS DE LANZAMIENTO SI A) ........................................................................ 203
FIGURA 4.4 FUNCIÓN DE DENSIDAD DE RETRASO EN EL LANZAMIENTO EN MESES. MERCADO AMBULATORIO ........................ 212
FIGURA 4.5. RESIDUOS DE COX‐SNELL PARA EL MODELO WEIBULL, GAMMA. MERCADO AMBULATORIO ............................. 212
FIGURA 4.6 TRADE‐OFF ENTRE CEA Y ERP .............................................................................................................. 220


Contents XVII
List of Tables TABLE 2.1 PPR FOR OPTIMAL COUNTRY LAUNCH SEQUENCE (PI , QI) ................................................................................ 69 TABLE 2.2 COUNTRY LAUNCH SEQUENCE IN FIGURE 2.2 .............................................................................................. 71 TABLE 2.3. OPTIMAL COUNTRY LAUNCH SEQUENCE IN FIGURE 2.3 ................................................................................ 72 TABLE 2.4. OPTIMAL COUNTRY LAUNCH SEQUENCE IN FIGURE 2.4 ................................................................................ 73 TABLE 2.5. OPTIMAL COUNTRY LAUNCH SEQUENCE IN FIGURE 2.5 ................................................................................ 74 TABLE 3.1 DESCRIPTIVE STATISTICS. RETAIL MARKET .................................................................................................... 83 TABLE 3.2 DESCRIPTIVE STATISTICS. HOSPITAL MARKET ................................................................................................ 84 TABLE 3.3 RELATIVE PRICES PEARSON CORRELATION. RETAIL AND HOSPITAL MARKET ......................................................... 85 TABLE 3.4. BIVARIATE TEST. ERP VS. NO ERP ........................................................................................................... 85 TABLE 3.5. BIVARIATE TEST. EMA VS. NO EMA ........................................................................................................ 85 TABLE 3.6. LAUNCH DELAY EQUATION OF THE NPLM ................................................................................................ 103
TABLE 3.7. RELATIVE LAUNCH PRICE EQUATION OF THE NPLM .................................................................................... 106
TABLE A.1 OVERVIEW OF THEORETICAL STUDIES ....................................................................................................... 120
TABLE A.2. OVERVIEW OF EMPIRICAL STUDIES .......................................................................................................... 121
TABLE B.1. HEALTH AGENCY SURPLUS OF COUNTRY C................................................................................................ 143
TABLE B.2. HEALTH AGENCY SURPLUS OF COUNTRY D ............................................................................................... 143
TABLE C.1. LAUNCH EQUATION: D&E VS. UPDATED MODEL ....................................................................................... 153
TABLE C.2. LAUNCH PRICE EQUATION: D&E VS. UPDATED MODEL............................................................................... 157
TABLE C.3. LIST OF COUNTRIES. VERNIERS ET AL. VS. UM .......................................................................................... 165
TABLE C.4. LAUNCH WINDOW AND LAUNCH PRICE EQUATIONS. VERNIERS ET AL. VS. UPDATED MODEL ............................. 167 TABLE C.5. VARIABLE CLASSIFICATION OF THE NPLM ................................................................................................ 171 TABLE C.6. PROBIT SELECTION EQUATION OF NPML ................................................................................................. 171 TABLE C.7. GOODNESS OF FIT OF PARAMETRIC MODELS. RETAIL MARKET ....................................................................... 174 TABLE C.8. GOODNESS OF FIT OF PARAMETRIC MODELS. HOSPITAL MARKET ................................................................... 176 TABLA 4.1. PPR PARA LA SECUENCIA ÓPTIMA DE LANZAMIENTO (PI , QI) ......................................................................... 202 TABLA 4.2. REGIONES DE SECUENCIAS ÓPTIMAS DE LANZAMIENTO A) ........................................................................... 204 TABLA 4.3.BONDAD DEL AJUSTE DE LOS MODELOS PARAMÉTRICOS. MERCADO AMBULATORIO .......................................... 212 TABLA 4.4. ECUACIÓN DEL PRECIO RELATIVO DE LANZAMIENTO ................................................................................... 225 TABLA 4.5. ECUACIÓN DE RETRASO EN EL LANZAMIENTO ............................................................................................ 227

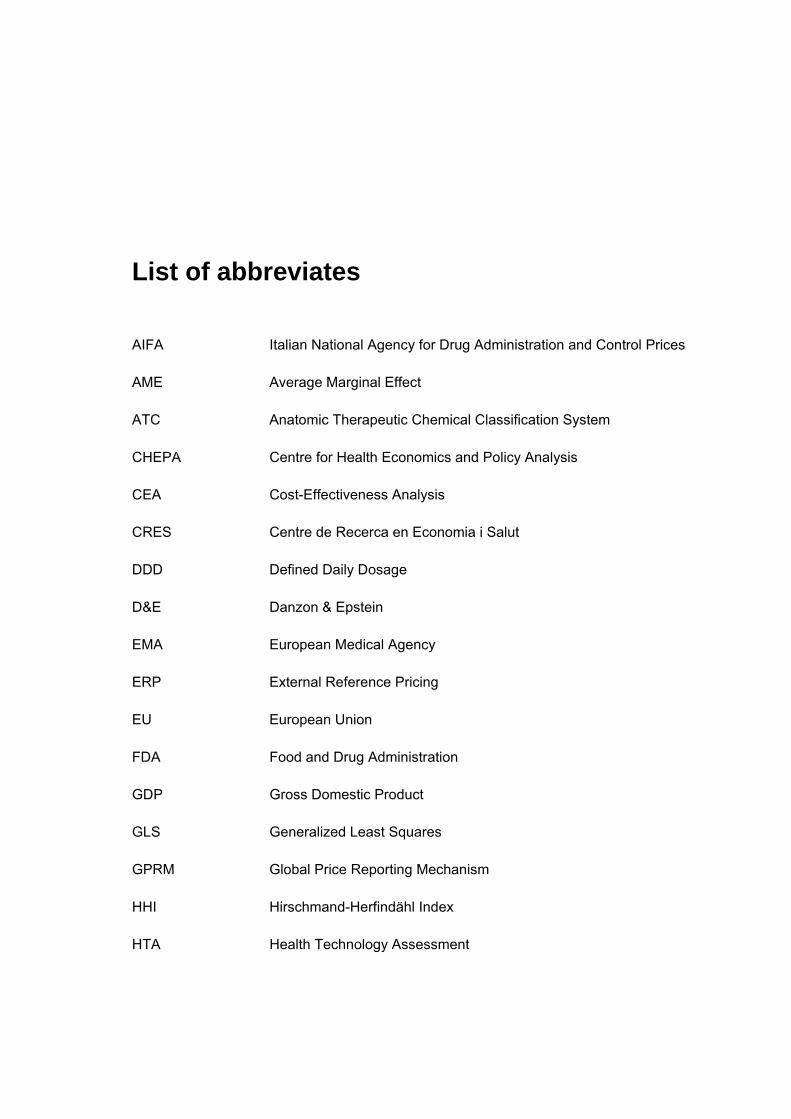
List of abbreviates
AIFA Italian National Agency for Drug Administration and Control Prices
AME Average Marginal Effect
ATC Anatomic Therapeutic Chemical Classification System
CHEPA Centre for Health Economics and Policy Analysis
CEA Cost-Effectiveness Analysis
CRES Centre de Recerca en Economia i Salut
DDD Defined Daily Dosage
D&E Danzon & Epstein
EMA European Medical Agency
ERP External Reference Pricing
EU European Union
FDA Food and Drug Administration
GDP Gross Domestic Product
GLS Generalized Least Squares
GPRM Global Price Reporting Mechanism
HHI Hirschmand-Herfindähl Index
HTA Health Technology Assessment

XX Modeling Global Pricing and Launching of New Drugs
ICER Incremental Cost-Effectiveness Ratio
IMF International Monetary Fund
IMR Inverse Mills Ratio
LSE London School of Economics
MES Minimum Efficacy Standard
MEPS Medical Expenditure Panel Survey
MLIC Middle and Low Income Country
NBER The National Bureau of Economic Research
NCE New Chemical Entities
NGO No-Governmental Organization
NICE National Institute for Health and Care Excellence
OECD Organisation for Economic Cooperation and Development
OF Objective Function
OLS Ordinary Least Squares
OTC Over-the-Counter
PC Price Cap
PE Public Expenses
PI Parallel Importer
PPI Producer Price Indexes
PPP Purchasing Power Parities
PPR Preliminary Results

Contents XXI
PRISMA Preferred Reporting Items for Systematic Reviews and
Meta-Analyses
PT Parallel Trade
QALY Quality-adjusted Life Years
R&D Research & Development
RP Reference Price
SU Standard Unit
UK United Kingdom
UM Updated Model
US United States
WtP Willingness to pay
3SLS Three-stage least squares


Introduction Pharmaceuticals are sold in a global market. This characteristic implies a specific
bargaining procedure between pharmaceutical firms and countries’ health agencies. On
the one hand, these firms make strategic decisions when launching medicines in different
countries and to maximize their global profits; and on the other hand, countries’ health
agencies implement pricing policies in order to control their pharmaceutical expenditure
and to guarantee access to medicines.
From the perspective of national health insurances, pricing policies within the
pharmaceutical market are a key factor in controlling public expenditure (Scherer, 1993,
Lobo, 2014)1. Particularly, the total pharmaceutical bill: across the Organisation for
Economic Cooperation and Development (OECD) countries in 2009, this bill is estimated
to have accounted for around 19% of health spending. In relation to the overall economy,
pharmaceutical spending accounts for an average 1.5% of GDP in OECD countries.
However, the dispersion around this average is high, pharmaceutical spending accounts
for less than 1% of GDP in Norway and Denmark, while it reaches close to 2.5% of GDP
in Greece, Hungary and the Slovak Republic. Expenditure on pharmaceuticals is
predominantly financed through third-party payers in most OECD countries – either
through the public health insurance, which accounts for around 60% of the total on
average, or through private insurance coverage, leaving an average of more than a third
of the total to be charged to households (OECD, 2011).
From the pharmaceutical industry view, pricing and launching a new drug is a
complex task directly connected to R&D policy, industrial policy and healthcare policy.
Hence, pricing and launching are major strategic decisions. In many countries, the price is
agreed with health care insurance providers (public or private). National pricing policies
1 The case of Spain as an example of the price regulation LOBO, F. 2014. La Intervención de Precios de los Medicamentos en España, Madrid, Springer..

Modeling Global Pricing and Launching of New Drugs
2
and strategies are essential elements in setting prices and making medicines available,
since drug pricing should contribute to enhancing social welfare and take into account the
interests of the industry, consumers and public insurers. Therefore, encouragement must
be provided to develop new medicines, make them available to consumers and, at the
same time, control pharmaceutical expenditure.
Pricing and launching involve trade-offs between public welfare and private profits,
between the interests of the manufacturer and those of the country. When countries set a
drug price, they risk the possibility of not providing it at the time they desire, which may
have consequences for the health and the welfare of the population (Lichtenberg, 2005).
In turn, a firm that delays the launch of a medicine in a country is also delaying the profits
to be derived from this country. However, in an increasingly globalized world, national
pricing/launching of drugs has become in fact an international matter and
interdependencies across countries should be taken into account. Both companies and
countries must act locally but think globally. Due to mechanisms like external reference
pricing (ERP, henceforth) and parallel trade (PT, henceforth) (Danzon et al., 2005,
Danzon and Epstein, 2008, Garcia Mariñoso et al., 2011), setting the price of a drug in a
particular country influences other countries’ pricing and launching. The use of ERP by
countries may make a firm apply international pricing strategies that may harm countries’
welfare. On the one hand, the firm may set a single price2, which may benefit high-price3
countries but harm low-price ones. On the other hand, the firm may either attempt to set
high4 prices in the first countries to avoid low-prices in later launches via ERP, or delay
launches in low-price countries to avoid spill-over effects. These strategies can harm low-
price countries, and may even harm high-price ones (Garcia Mariñoso et al., 2011).
Among existing drug pricing policies, most countries in the industrialized world
have implemented either Cost-Effectiveness Analysis (CEA, henceforth) or ERP at some
2 Two factors contribute to price uniformity between different markets: a) the threats of parallel imports, and b) the use of international reference pricing DANZON, P. M. & TOWSE, A. 2003. Differential Pricing for Pharmaceuticals: Reconciling Access, R&D and Patents. International Journal of Health Care Finance and Economics, 3, 183-205..
3 In the long run, consumers from high price countries will be worse off if this lower price results in lower than expected returns on R&D, and hence fewer new medicines than they would have been willing to pay for DANZON, P. M. 1997. Price Discrimination for Pharmaceuticals: Welfare Effects in the US and the EU. International Journal of the Economics of Business, 4, 310-322..
4 This company strategy will not work if the high-price country revises its prices downwards after launch DANZON, P. M. & TOWSE, A. 2003. Differential Pricing for Pharmaceuticals: Reconciling Access, R&D and Patents. International Journal of Health Care Finance and Economics, 3, 183-205, DANZON, P. M. 1997. Price Discrimination for Pharmaceuticals: Welfare Effects in the US and the EU. International Journal of the Economics of Business, 4, 310-322.

Introduction
3
point in time with the aim of controlling pharmaceutical expenditure, while still ensuring
access to medicines, mainly in on-patent medicines (Espin J et al., 2011, Rawlins, 2012).
In this thesis, ERP is defined as “the practice of setting a price cap for
pharmaceuticals, based on ex-manufacturer5 prices of identical or comparable products in
other countries” (Garcia Mariñoso et al., 2011). Most countries use ERP as a
pharmaceutical pricing strategy. The use of ERP as a mechanism to set pharmaceutical
prices is quite widely applied: 24 of the 30 OECD countries (Espin J et al., 2011) and
approximately 24 of the 28 EU Member States (Leopold et al., 2012) have used it.
However, ERP is not applied homogeneously in every country. There are a wide variety of
methods to design a foreign price index (Leopold et al., 2012, Espin J et al., 2011). It
mainly depends on each country’s basket, the type of prices collected6, the method used
(the lowest price, the average price, a percentage of the previous ones, etc.) and whether
a weighted-index7 is used or not. We also note that some countries take into account ERP
as a complementary pricing policy together with other pricing policies to help to make the
price decision, and therefore it is not exclusively applied as a blind pricing policy8. ERP is
used because of its simplicity at a technical and analytical level; collecting price
information abroad does not require a huge effort. Furthermore, ERP users think that the
prices taken as reference are roughly right, suitable or fair. However, they recognise that
it is difficult to assess if the resulting prices are appropriate, efficient or optimal in
accordance with any objective criterion. Additionally, if referencing countries set their
prices too high or too low, then any country later applying the ERP method may run the
risk of repeating the same mistake (Espin J et al., 2011).
CEA in health economics aims to estimate the ratio between the cost of a health-
related intervention and the benefit it produces in terms of the number of years lived in full
health by the beneficiaries. Cost is measured in monetary units, while benefit needs to be
expressed in gain of health measured by quantitative values. However, unlike cost– 5 Prices are ex-manufacturer prices.
6 Current price vs. price at launch
7 The most widely method used for new drugs is through non-weighted measures; such methods will not help to achieve the target of obtaining a comparable average level of prices. The application of weighted price indexes, comparable and useful as reference to the rest of countries, has been proposed DANZON, P. M. & CHAO, L. W. 2000. Cross-national price differences for pharmaceuticals: How large, and why? Journal of Health Economics, 19, 159-195..
8 Espín et al. state that “regulators might not always be able or willing to “impose” a certain price, but instead use the price computed as a benchmark or reference for negotiations, often alongside other criteria, such as cost-plus, internal or therapeutic pricing”.

Modeling Global Pricing and Launching of New Drugs
4
benefit analysis, the benefits do not have to be expressed in monetary terms. In
pharmaeconomics, it is usually expressed in quality-adjusted life years (QALYs)9
(National Institute for Health and Care Excellence (NICE), 2010). The incremental cost-
effectiveness ratio (ICER) is the ratio between the difference in costs and the difference in
benefits of two interventions. A firm knows this threshold for a given country; therefore, it
conducts CEA and calculates the number of QALYs gained if the drug were provided in
one country. Since the firm is aware of both threshold and number of QALYs, it offers the
country the drug at a certain price. However, the firm may upwardly distort the number of
QALYs to obtain greater profits. Then, it is the country that may revise the firm’s CEA
applying its own CEA to estimate a fair price. However, this CEA requires resources and
consequently an investment of money by the country.
On the whole, the trade-offs previously mentioned have driven theoretical and
empirical research, particularly in recent years. Besides, interdependences among
markets due to the implementation of ERP and the presence of PT may change pricing
and launching strategy and lead to small price differences globally.
First of all, this thesis aims to provide an overall perspective of original theoretical
and empirical analyses of global interdependencies with respect to drug pricing and
launching worldwide. Secondly, it attempts to find the main factors influencing both launch
prices and launch of new drugs. Then, a theoretical model based on a bargaining model
between a pharmaceutical firm and two countries’ health agencies is provided, which
aims to analyse the convenience of applying ERP instead of CEA as a cost-containment
policy on pharmaceutical expenditure. Ultimately, the thesis develops an empirical model
that aims at analyzing the trade-off between pricing and launching and the impact of ERP
policy on pricing and launching.
This thesis is divided into three chapters. Each chapter deals with a specific area
ofresearch; therefore, each chapter has its own introduction, development and
conclusions. The first chapter describes the current state of knowledge in this area, the
second chapter develops a theoretical model and the third chapter provides evidence
9 The QALY is a measure of disease burden, including both the quality and the quantity of life lived. The QALY model requires utility independent, risk neutral, and constant proportional trade-off behaviour. The QALY is based on the number of years of life that would be added by the intervention. Each year in perfect health is assigned the value of 1.0 down to a value of 0.0 for being dead. If the extra years are not lived in full health, for example if the patient loses a limb, or goes blind or has to use a wheelchair, then the extra life-years are given a value between 0 and 1 to account for this.

Introduction
5
based on the development of an empirical model.
Chapter 1 provides a systematic survey of original scientific studies up to April
2012 based on PRISMA (Preferred Reporting Items for Systematic reviews and Meta-
Analyses). This chapter reviews what we know about the main factors influencing both
launch prices and launch of new drugs, and also, whether there are any common general
patterns that could be derived from economic models to explain the strategic games
played by governments, public insurers and pharmaceutical companies. Finally, it
evaluates if there is any empirical evidence of these factors in OECD countries and if ERP
and PT make the markets inseparable in launching and pricing.
Chapter 2 suggests a game based on a bargaining model involving sequential
launching of one drug by one firm across two countries based on a “take-it-or-leave-it-
offer” procedure that has been developed under asymmetric information (Muthoo, 1999).
The model is based on the best pharmaceutical firm strategy to sequentially launch a new
product, given the size of the countries, the CEA cost, the launch delay cost and the
prices set by each pricing policy. In brief, the country chooses either to apply ERP without
any additional cost or use CEA, with its corresponding investment of money. Then, the
firm chooses its optimal country launch sequence. We introduce two important
innovations that are particularly noteworthy: firstly, we include different types of countries
depending on their ERP. Thus, we differentiate the type of country based on their formula
of foreign prices to implement ERP criteria, either the minimum or the average price
observed. Secondly, we introduce the launch delay cost and the cost related to applying
CEA to check if the firm declares the true QALY of the drug or not.
Chapter 3 evaluates two studies (Danzon and Epstein, 2008, Verniers et al., 2011)
where econometric models of pricing and launching have been applied. The same data
treatment and methodology conducted by the two studies have been implemented with
our database. On the one hand, we replicate the study of Danzon and Epstein published
in 2008 (Danzon and Epstein, 2008) with our database containing more recent data, and
we compare our results with theirs. Danzon and Epstein (Danzon and Epstein, 2008) data
cover the years 1992-2003, while our data cover the period 2004-2010. Then, we look at
the study of Verniers et al. published in 2011 (Verniers et al., 2011) to check if the results
have changed due to the use of more recent data (2010 vs. 2008), and if the results are
robust for the choice of the list of countries. Verniers et al. (Verniers et al., 2011) applied
Modeling Global Pricing and Launching of New Drugs
6
their model to a large dataset of countries, both rich and poor; however, we restrict our
application to developed countries. Afterwards, this thesis develops an empirical model
that focuses on the analysis of the trade-off between pricing and launching as well as the
impact of ERP policy on pricing and launching controlling for molecules, regulation and
country characteristics. It develops two equations consisting of a launch delay equation
and a launch price equation. The contribution of this chapter to the previous literature
studied involves an analysis of data at presentation level10, the consideration of the
relative launch price11 as an endogenous variable in the launch price equation, the study
of the launch delay as a duration time variable and the analysis of the inpatient market.
Additionally, we introduce the country size and the country purchasing power as
additional explanatory variables in the same model. We use data from IMS Health
database on 56 new molecules launched in 20 countries belonging to 11 therapeutic
classes, all of them approved through the centralised procedure by the EMA, during the
study period, 2004-2010. We have collected yearly inpatient and outpatient sales in
euros at ex-manufacturer price and unit volume (IMS SU). The number of molecule-
presentation-country observations are 1 and 1 for the launch equation and the launch
price equation respectively.
10 We define two products with the same presentation when both products belong to the same molecule i and have the same quantity of active ingredient per standard unit (SU) (see definition of SU in Chapter 3 section 3.3.2).
11 Defined in Appendix C.3.

1 Chapter 1: Global Pricing and Launching of New Drugs: What Does the Theory Say? What Do the Empirical Models Show?
1.1 Introduction
The total pharmaceutical bill across OECD countries in 2009 is estimated to have
accounted for around 19% of health spending. In relation to the overall economy,
pharmaceutical spending accounts for 1.5% of GDP on average in OECD countries.
However, the dispersion around this average is high, pharmaceutical spending accounts
for less than 1% of GDP in Norway and Denmark, while it reaches close to 2.5% of GDP
in Greece, Hungary and the Slovak Republic. Expenditure on pharmaceuticals is
predominantly financed through third-party payers in most OECD countries – either
through the public health insurance, which accounts for around 60% of the total on
average, or through private insurance coverage, leaving an average of more than a third
of the total to be charged to households. Hence, pricing policies within the pharmaceutical
market are a key factor in controlling public expenditure in this field (OECD, 2011).
Pharmaceutical price regulation is high on policy agendas in many countries,
either because countries have just reformed, intend to reform or question their practices.
This is why this chapter proposes to review what we know about the main factors
influencing both launch prices and launch of new drugs: firms’ pricing strategies,
regulators’ pricing policies, and the empirical evidence in OECD countries.
Pricing and launching in the pharmaceutical industry is a complex task directly
connected to R&D policy, industrial policy and healthcare policy. From the perspective of

8 Modeling Global Pricing and Launching of New Drugs
the pharmaceutical companies, pricing and launching are their major strategic decisions.
The price may be agreed with health care insurance providers (public or private). At this
point, national pricing policies and strategies are important elements in setting prices and
making medicines available. Drug pricing should contribute to enhancing social welfare,
taking into account the interests of the national industry, consumers and public insurers.
Therefore, encouragement must be provided to developing new medicines, making them
available to consumers, yet, at the same time, controlling pharmaceutical expenditure.
Pricing and launching a medicine involve trade-offs between public welfare and private
profits, between the interests of the manufacturer and those of the country. A firm that
delays the launch of a medicine in a country is also delaying the profits to be derived from
this country. However, in an increasingly globalized world, national pricing/launching of
drugs has become in fact an international matter and interdependencies across countries
should be taken into account. Both companies and countries must act locally but think
globally. Due to mechanisms like external reference pricing (ERP) and parallel trade (PT)
(Danzon et al., 2005, Danzon and Epstein, 2008, Garcia Mariñoso et al., 2011), setting
the price of a drug in a particular country influences pricing and launching in other
countries. For instance, by delaying the launch of a new drug in a low-price country, a
company manages to prevent this low price from over spilling into other countries through
reference pricing.
The trade-offs we mentioned have driven theoretical and empirical research
particularly in recent years. What are the main factors influencing both launch prices and
launch of new drugs? Are there any common general patterns that could be derived from
economic models to explain the strategic games played by governments, public insurers
and pharmaceutical companies? Is there any empirical evidence of these factors in OECD
countries? Do ERP and PT make markets inseparable in launching and pricing?
This chapter tries to answer these questions. We performed a systematic review of
the literature from the period 1995-April 2012 and synthesize the main facts, ideas and
results from them. Our search covers theoretical and empirical models. Details of the
search can be found in Appendix A. The rest of this chapter is organized as follows. In
Section 1.2, the theoretical studies are discussed. Section 1.3 examines the empirical
studies identified, followed by a discussion in Section 1.4.
Chapter 1: Global Pricing and Launching of New Drugs: What Does the Theory Say?
What Do the Empirical Models Show?
9
1.2 What does the theory say?
In this section, we ask whether there are common general patterns that could be
derived from economic models to explain the strategic games played by governments,
public insurers and pharmaceutical companies. Table A.1 summarizes the main
characteristics of the articles that met the selection criteria for theoretical studies (see
Appendix A).
We firstly describe under which conditions pricing and launching occurs and,
according to the paper of Danzon et al., which factors determine the drug pricing and
launching (Danzon et al., 2005). More recently, Danzon and Epstein (Danzon and
Epstein, 2008), based on the theoretical model developed by Danzon et al. (Danzon et
al., 2005), include more explanatory factors. Both papers show intuitively how these
factors affects drug pricing and launching. In the literature, we find further papers that
theoretically examine and predict the former factors.
Each paper assumes different hypothesis to develop their corresponding
theoretical models. Mainly, these hypotheses concern the number and types of firms and
countries considered; the design of objective functions; the type of drug sold; the
information available and the timing of decisions. The common hypothesis considered by
the most theoretical papers is that markets are not separable, which implies that both
pricing and launching occur worldwide.
1.2.1 Launching as a result of bargaining process: trade-offs between pricing and launching
Two papers analyse the conditions under which drug launching and pricing arise.
Danzon et al. focus on launching (Danzon et al., 2005) and later, Danzon and Epstein
anlayze pricing (Danzon and Epstein, 2008). The first paper considers a market where a
pharmaceutical firm sells a drug in at least more than one market (country), which are not
separable. One country, which regulates prices, offers a price and the firm can accept it or
refuse it. The authors assume that the government has a reservation or maximum offer
price that depends positively on the price of existing products, the ICER and on the
country per capita income. On the other hand, the firm has also a reservation or minimum
ask price below which it will not launch in the country. The ask price depends negatively

10 Modeling Global Pricing and Launching of New Drugs
on the country size and positively on the country per capita income. This means that as
long as the country size is large, the regulator will have greater bargaining power to
negotiate prices with the pharmaceutical industry. By contrast, a high GDP per capita is
related to a high willingness to pay for a drug. Also, the ask price depends positively on
the country propensity for spillovers due to the use of ERP policy and parallel exports.
This means that whether the country is a potential referenced country (see 2.2. below) or
a potential parallel exporter (see 2.3 below), the firm will increase its reservation price.
The bargaining results in the launch of the product if the country’s maximum offer price
equals or exceeds the firm’s minimum ask price. If this condition is not met the delay
occurs, moreover, the greater this difference, the longer the delay in launch. Danzon and
Epstein (Danzon and Epstein, 2008) work under the same hypothesis as Danzon et al.
(Danzon et al., 2005). In this case, they also contemplate the bargaining results in price
and add more variables as explanatory factors of pricing and launching. One of them is
the regulatory regime, which can be an internal reference price (RP) or ERP; both are
expected to positively affect prices because substitute prices, either at home or abroad,
are expected to increasing prices (see 2.2. and 2.6. below). The other variable added, the
firm’s location, is measured by the fixed costs, which are expected to be lower if the
launching firm is located in the country analysed (see 2.5. below). Now, the bargaining
results in a price agreed within the range between the offer price of the country and ask
price of the firm. Then the launch is likely to occur when the offer price of the country
equals or exceeds the ask price of the firm. The authors underline that the trade-offs
between price and delay are expected to differ across markets and across products within
markets.
1.2.2 How the ERP is affecting the bargaining results in pricing and launching?
Both Danzon et al. and Danzon and Epstein consider that the propensity of being
a reference country may positively affect the price of a drug (Danzon et al., 2005, Danzon
and Epstein, 2008). This argument is supported by the extended use of ERP by countries
as a cost-containment policy (see Leopold et al. (Leopold et al., 2012)). Basically, ERP
consists of setting a price cap for pharmaceuticals, based on prices of identical or
comparable products in other countries. Despite the method of calculation (see Leopold et
al., Richter, Stargardt and Schreyögg (Leopold et al., 2012, Richter, 2008, Stargardt and
Schreyögg, 2006), we think that, whether a country is taken as reference by other

Chapter 1: Global Pricing and Launching of New Drugs: What Does the Theory Say?
What Do the Empirical Models Show?
11
countries when pricing medicines, it is reasonable to consider that firm’s incentive will be
to set high prices in the reference country. As discussed by Richter (Richter, 2008), the
firm is better off launching its drug in high-price countries first, to influence prices in other
countries to its advantage. In this sense, García-Mariñoso et al. (Garcia Mariñoso et al.,
2011) directly analyse the effects of an ERP policy on a referencing country on the
negotiation in this country and, furthermore, the incentive of the referencing country to
apply ERP. To go into this idea, the authors consider one pharmaceutical firm, one on-
patent drug and two countries operating a positive list of reimbursed pharmaceuticals,
where patients pay a fixed and exogenous co-payment. Countries differ in the population
size and the level of co-payment. A model of negotiation process as a Nash bargaining
game is designed through which the authors compare independent price negotiations to
the situation in which one country (the referencing country) engages in ERP. Two different
scenarios are analysed, under “weak threats”12 if the drug is not reimbursed, or under
“tough threats”13 if the drug is banned. In the case of ERP with weak threats, when the
referencing country engages in ERP, the price negotiated in the referenced country
increases. The total surplus generated by the negotiation between the referenced country
and the firm increases14. This shows that the implicit negotiation power of the firm is
higher when the referencing country engages in ERP as compared with independent
negotiations. As Danzon et al. and Danzon and Epstein had suspected (Danzon and
Epstein, 2008, Danzon et al., 2005), García-Mariñoso et al. (Garcia Mariñoso et al., 2011)
show the fact that the referencing country engaged in ERP policy harms the referenced
country in terms of high price and lower outputs. The same authors also examine the
incentives to apply ERP policy rather than independent negotiations. Under the same
hypothesis stated above, they state that a country has an incentive to engage in ERP if its
co-payment levels are high when compared with the referenced country. This preference
decreases as the size of the referencing country increases, and as co-payments of both
countries converge. First, the referencing country size increases the ERP negotiated
12 Under “weak threats”, if the negotiations fail, the firm can still sell the drug at any price of its choice, but with no subsidy.This assumption is motivated by the fact that, in Europe, price-negotiating agencies have a minor role in the authorization of drugs.
13 Some countries outside Europe, such as Brazil or Canada, are known to threaten the firms with not authorizing drug sales if negotiations fail or if the firm does not accept ERP.
14 In this model, ERP is based on the price of a single reference country. However, results are highly sensitive to the modalities of the ERP.

12 Modeling Global Pricing and Launching of New Drugs
between the referenced country and firm in two ways. The pie to be shared between both
parties is larger, and the firm has a stronger disagreement payoff while the disagreement
payoff of the referenced country remains the same. Second, as the negotiated price is
shown to be increasing with the patients’ co-payment (see (Jelovac, 2008)), if the co-
payment in the referenced country decreases with respect to the referencing country then,
the ERP will decrease and therefore the difference between the price independently
negotiated and the ERP will decrease. Then, they conclude that only small countries
should be observed to engage in ERP and/or ERP should be based on prices in large
countries (or a large group of countries). The analysis yields an analogous prediction if
one substitutes “large country” by ‘small co-payment country’ and vice versa.
The authors further extend their analysis to account for competition between the
firm’s pharmaceutical product and a therapeutic substitute that is already present on the
market in both countries. This extension adds realism, particularly, it makes the weak
threats scenario compatible with the observation that, in most European markets, being
excluded from the public funding may be almost as bad as being banned, as sales out of
the positive list of reimbursed drugs are negligible if subsidized therapeutic substitutes are
available. Now, two drugs, 1 and 2, with similar therapeutic indications are considered.
Each drug is produced by a different firm (firm 1 and firm 2). Both drugs are off patent and
one is the generic substitute of the other15. The consumer perceives them to be different
but face the same co-payment, although this co-payment may differ among countries. The
drug 2 is already listed in both the referenced and the referencing markets. The two drugs
are horizontally differentiated á la Hotelling (see (Hotelling, 1929)). As the independent
price negotiations lead to a higher price in the referencing country, the firm will reject low
prices in the referenced countries knowing that they will face a price cap in the
referencing one. Main results continue to hold in this extension: ERP benefits the
referencing country and harms the referenced country as well as the firm.
On the other hand, under tough threats (see footnote 13), the firm suffers a
harsher punishment in the case that negotiations fail (drug is banned). The main result
with weak threats remains, i.e., ERP benefits the referencing country and harms the firm,
15 Lobo and Feldman have also modelled the role of trademarks, advertising and generic names on competition FELDMAN, R. & LOBO, F. 2013. Competition in prescription drug markets: the roles of trademarks, advertising, and generic names. European Journal of Health Economics, 14, 667-675, LOBO, F. & FELDMAN, R. 2013. Generic Drug Names and Social Welfare. Journal of Health Politics Policy and Law, 38, 573-597..

Chapter 1: Global Pricing and Launching of New Drugs: What Does the Theory Say?
What Do the Empirical Models Show?
13
but the referenced country is not affected by the ERP.
1.2.3 Which role does PT play in the pharmaceutical market?
As mentioned earlier in the section above, the firm prefers firstly launching its drug
in high-price countries to influence prices in other countries to its advantage. This
strategic behaviour may be not so useful if PT exists. As Danzon et al. and Danzon and
Epstein commented, to be a parallel exporter country might influence positively on prices
(Danzon et al., 2005, Danzon and Epstein, 2008). The reason has been clearly explained
by Richter (Richter, 2008). We note that Richter considers that PT implies a loss of
income for the firm, since it stops selling a certain amount at a higher price than in the
absence of PT, the author includes PT as variable into objective function firm. As
expected, in order to compensate this loss of income, the firm will have to increase the
price. The author proposes a mathematical optimization problem for the firm, considering
that the firm sells a drug across all countries and over all time periods and the lowest
price country will be the parallel exporter one. This is quantified as the sum of the
differences between the lowest price among all countries and the price stated in each
country, multiplied by the quantity lost16 in the parallel importer country.
Ganslandt and Maskus (Ganslandt and Maskus, 2004) go further and, not only
consider PT as potential loss of income for the original manufacturer, but also investigate
how PT firms behave and how the presence of PT affects equilibrium prices in the parallel
importer (PI) and exporter countries. They develop a simple model of parallel imports in
which an original manufacturer competes in its home market (Sweden) with PI firms and
all firms set prices simultaneously. The authors suppose that the quantity to trade is
exogenously given, and it is all sold. This idea is supported by the fact that in high-price
markets the PI quantity rarely exceeds 10%, except in a few major products. A model of
two countries is considered, with a high-income and a low-income country. The high-
income country is unregulated, the low-income country has a price cap set by the
government and the drug sold is an on-patent drug without substitutes. A marginal and a
fixed cost of engaging in PT also exist. Given the quantity chosen by PI firms, the profit-
maximizing price is calculated. The authors compare a model under a limited PI quantity
16 The quantity lost is calculated multiplying the market share lost by the quantity sold in the parallel importer country.

14 Modeling Global Pricing and Launching of New Drugs
to another model that allows unlimited PI quantity. Under an unlimited quantity of PI, an
“arbitrage-free” price arises, and consequently a price convergence from the high-income
country to the low-income one. However, under a limited quantity of PI, the most real case
as stated above, the manufacturing firm has an incentive to adapt to PT rather than to set
an arbitrage-free price in its market. In this case, the equilibrium price of high-income
country converges to the low-income one plus a variable trade cost17. As expected, there
is an effect of competition, whereby the equilibrium price in the high-income country falls
in the number of PI firms. Also, the authors identify that the equilibrium number of PI firms
increases in the size of the market but decreases in the low-income country price and in
the fixed and variable trade cost.
1.2.4 How asymmetric information on quality of drugs may affect drug pricing and launching?
One of the factors influencing pricing and launching considered by Danzon et al.
and Danzon and Epstein, has been the ICER that affects positively drug prices (Danzon
et al., 2005, Danzon and Epstein, 2008). This measure may be interpreted as a
price/quality indicator of the drug. In the literature, under different hypotheses, we can
observe that information about quality matters. Two papers have considered the
asymmetric information about either the quality drugs or the demand of quality drugs, to
analyse the pricing and launching drugs (Atella et al., 2012, García-Mariñoso and Olivella,
2012). Atella et al. (Atella et al., 2012) propose a model of asymmetric information on the
quality of the drugs, to find out how two types of regulatory regimes, one focused on
quality and another on price control, affect drug prices, and furthermore, how the price
regulation affects, ultimately, the quality of the drugs. On the other hand, García-Mariñoso
and Olivella (García-Mariñoso and Olivella, 2012) propose a sequential launching and
analyse how the informational spillovers, issued from the asymmetric information about
the quality drugs, affects the drug pricing. The informational spillovers are defined as the
claim of lower prices by one country, generated by the knowledge about lower prices in
other countries. The notion that low prices may overspill to other countries even in the
absence of PT or ERP is here introduced, different from the previous research.
Atella et al. (Atella et al., 2012) compare two regulatory regimes. Under the first
17 The price in the low-income country is taken as given.

Chapter 1: Global Pricing and Launching of New Drugs: What Does the Theory Say?
What Do the Empirical Models Show?
15
regime the government fixes a minimum efficacy standard (MES), this regime
corresponds to the regulatory structure of the pharmaceutical market in the United States.
Under the second regime, in addition to a MES, the government fixes a price cap (PC);
this regime corresponds to the structure in many other countries as Italy. The model
considers two countries that differ in their demand for drug efficacy, and one firm, which
produces two types of drug, low and high-efficacy, but it cannot distinguish between high
and low-type buyers. Regarding the paper of Atella et al. (Atella et al., 2012), this paper
introduces patient co-payments, the discount’s factor on profits and on quality from the
country.
Whether the government fixes a MES that binds the low efficacy drug, then the
efficacy and the price of the low efficacy drug increases to meet the MES and to cover the
drug marginal cost. Instead, the efficacy of the high-efficacy drug is not affected and its
price may be lower. However, if the regulation imposes too high efficacy standards, low-
type buyers would be excluded form the market. There exists a minimum efficacy
threshold that optimally balances the higher R&D costs with the higher efficacy drugs
delivered to low-type buyers. This optimal level is just below the level that excludes low-
type buyer from the market.
Whether a PC that binds on the high-type drug is considered (but not on the low-
type drug), the firms respond producing high-type drugs lower in quality at a price
correspondingly lower. Under both regimes, the efficacy and the price of the low efficacy
drug increases to meet the MES and to cover marginal cost respectively, however, the
efficacy of the high-type drugs may be undermined if the government fixes a PC that
binds the high-type drugs, but also that the consumer of high-type drugs will save money.
Finally, the net welfare will depend upon how binding is the price control and on the
relative size of the two groups of buyers.
It has been shown above how different types of regulation may affect on drug
quality and pricing under asymmetric information about the buyers. Garcia-Mariñoso and
Olivella (García-Mariñoso and Olivella, 2012) assume the asymmetric information on the
other side. The countries (i.e. the buyers) do not know about the type of the firm, thus, the
firm may be of high or low quality, and this information is in the hands of the firm. As the
authors propose a sequential launching, the countries will have their prior beliefs and

16 Modeling Global Pricing and Launching of New Drugs
there may exist informational spillovers. Thus, whether a low price is fixed in the country
where the drug is first launched, this reveals private information (the quality of the firm
concerning the production and distribution costs) to subsequent players concerning the
price, and therefore, the following countries will also demand for low prices. Now, low
prices may overspill to other countries even in the absence of PT or ERP. The reason is
that countries that would in principle make generous price offers whether observe the firm
accepting a low price elsewhere, they might change their mind and become aggressive.
Along a dynamic game, now it is the firm, which accepts or rejects the offer from the
country thus, the game is based on a “take it or leave it offer”. Countries may be
aggressive or non-aggressive18.
According to the firm strategic behaviour, although information spillovers can be
avoided by launching in all countries simultaneously, the firm will prefer to delay if (from
more to less expected) (i) the firm is sufficiently patient (high discount’s factor19); (ii) the
aggressive country has a sufficient population; (iii) co-payments differ enough across
countries; and (iv) countries have relatively pessimistic priors on quality. Interestingly, the
authors present a counterargument to the statement that delay only occurs in small
countries, thus it could happen that the country that suffers delay is the largest in size (as
long as the rest of the factors mentioned go in the right direction) (García-Mariñoso and
Olivella, 2012).
1.2.5 Are important the headquarters location and the contacts among firms when pricing drugs?
Different from other studies, Cabrales and Jiménez-Martín (Cabrales and
Jimenez-Martin, 2007) consider that the firm is located in the countries analysed. There
are two countries, one of them regulates prices under ERP (the referencing country) and
the other does not (the referenced country). One of the main contributions is that the firm
profits are now maximized together with the consumer surplus by the regulator. The
authors compare the maximizing price in two situations, when headquarters are located in
18 The aggressiveness will positively depend on the co-payment; the larger is the co-payment, the more aggressive the price offers will be. We already mentioned that if a country has observed a low price acceptation in a previous country, it will update its beliefs and become aggressive. The third factor is dynamic and forward-looking. Being aggressive today may lead the firm to reject the price offer in order to avoid the aggressiveness of future agencies.
19 The discount factor is the factor by which a future cash flow must be multiplied in order to obtain the present value. The higher the discount factor is, the greater the present value is assessed.

Chapter 1: Global Pricing and Launching of New Drugs: What Does the Theory Say?
What Do the Empirical Models Show?
17
the regulated country or in the unregulated one. This theoretical model predicts that the
price set by the regulator is slightly higher for the local multinational than for the foreign
one, and as the size of the referenced country grows with respect to the referencing
country, the price of the foreign multinational converges to the local multinational one. In
this regard, if we assume that the countries that are stricter regulators were relatively
small in size; this would imply that they could not influence substantially the prices in
favour of the local multinationals.
Not only the location of firms matters, but also the contacts between firms
competing in the same markets. The multimarket contact theory implies that more
contacts between firms competing in the same markets may induce more collusion. This
collusion support prices above the equilibrium prices. At this regard, Coronado et al.
(Coronado et al., 2007) try to predict the effect of multimarket contact structure on the
equilibrium prices under two different regimes, the price regulation and the free pricing,
and ultimately to know if price regulation may affect multimarket contact effect. For this,
the authors propose a game infinitely repeated where prices are set simultaneously. The
firms can collude and support prices above the equilibrium prices. In case of deviation,
the firms will be penalized reverting to the equilibrium prices. It is also supposed that the
maximum sustainable price (in collusion) depends positively on the discount factor, i.e.,
the future profits are more valuable, and therefore the short run benefits from deviation
are accordingly less preferred. Taking into account the hypothesis above described, the
model predicts that the effect of multimarket contact structure increases the equilibrium
prices but this effect is undermined in regulated countries.
In summary, the theoretical models predict that both the firm location and the
multimarket contact not only affect drug pricing but also, their effects depends on price
regulation regimes.
1.2.6 Which effects do arise in pricing and innovation when countries apply internal RP20?
Danzon and Epstein (Danzon and Epstein, 2008), extending the paper of Danzon
20 Internal reference pricing, as opposed to the ERP, compares product prices within a single country.
18 Modeling Global Pricing and Launching of New Drugs
et al. (Danzon et al., 2005), they consider as influencing factor the RP as regulatory
regime being expected to positively affect on prices. At this regard, two papers examine,
on the one hand, how the RP policy affects the equilibrium prices and the firm pricing
strategies (Miraldo, 2009), on the other hand, how the RP policy influences the intensity of
research and the introduction of new pioneer in the market (Bardey et al., 2010). Both
papers compare the outputs under no regulation and under RP policy. Furthermore, other
authors have deeply studied the RP policy from an international perspective (Lopez-
Casasnovas and Puig-Junoy, 2000, Puig-Junoy, 2010a, Puig-Junoy, 2010b) and
particularly the Spanish case (Mestre-Ferrandiz, 2003b, Moreno-Torres et al., 2009, Puig-
Junoy, 2007)
The model developed by Miraldo (Miraldo, 2009) considers two pharmaceutical
firms, a continuum of consumers uniformly distributed and a market of drugs horizontally
differentiated à la Hotelling (Hotelling, 1929). Each firm produces two distinct variety of
drug. Each consumer is assumed to have a most preferred drug that is given by her
location on the line segment. Indeed, the constant marginal cost of distance is the loss in
utility incurred by a consumer.
Miraldo studies the explicit RP formulations and considers a different timing of
implementation of the policy. The author analyses a finite dynamic game, in which
duopolists compete by non-cooperatively setting prices in two subsequent periods. In the
first stage, the two pharmaceutical firms set the prices for one variety. At the beginning of
the second, the government fixes the RP level, and then, the firms set prices for the
second variety of drugs. Therefore, at the last stage, the firms’ profits depend via demand
not only on the pricing strategies but also on the RP level fixed previously by the
government.
The RP policy is introduced as reimbursement scheme21. Miraldo shows that
under the RP policy, the equilibrium prices are at least as high as the equilibrium prices
without RP. As a main contribution, when both RP rules are compared, the minimum and
the weighted average, the author states that firm set higher prices at first stage when the
21 In countries, such as Germany and Spain, where pharmaceuticals are reimbursed through a RP system, patients are typically reimbursed a lump sum amount for any homogeneous pharmaceutical cluster, independently of the drug variety bought. There are several criteria to cluster drugs and the replicated model applies to countries that use chemical and therapeutic criteria. The first criterion clusters drugs with the same active ingredient and therefore refers to patent expired drugs. The second criterion clusters drugs that have the same therapeutic function and therefore, within the same cluster one can find patent protected drugs.

Chapter 1: Global Pricing and Launching of New Drugs: What Does the Theory Say?
What Do the Empirical Models Show?
19
RP is calculated as a weighted average than when the minimum policy is applied. The
firm pricing strategy in the second period (when already the RP level has been fixed) will
depend on the weights of each price. If they are high (i.e., for sufficiently high and low
values of the weights), the minimum policy makes firms to fix lower prices than the
weighted average rule. But if the weights are similar, results will be ambiguous; they will
depend on consumers’ preferences, on the degree of horizontal differentiation and on the
discount factor. Anyway, in a symmetric market, in order to avoid higher prices, the
regulator should implement a policy where the reference pricing consists of the minimum
observed price.
In turn, Bardey et al. (Bardey et al., 2010) evaluate the long run impact of RP on
pharmaceutical innovation and on health expenditure. The paper is based on a dynamic
model with three players: the firms (innovators/producers), the regulator and the
consumers22. Both horizontal and vertical differentiations are considered. Vertical
differentiation has different levels (therapeutic classes). To simplify, there are two levels,
C and N, designing respectively current and new. Patients obtain utility from the treatment
of the drug, perceive its side effects, pay a price for the drug and receive a
reimbursement. They also assume that drugs are produced at zero cost and when a drug
is introduced in the level N, producers of level C have no sales. The price negotiations are
developed à la Rubinstein (see Rubinstein (Rubinstein, 1982)). The firms choose the level
of research investment, and then negotiate introductory prices for new drugs with the
regulator. The innovation process is deterministic and can discover a new product either
in the same level as existing products (horizontal innovation or follower), or in a superior
level (vertical innovation or pioneer). There exist a cost of bringing an innovation.
Bardey et al. authors compare how the dynamic of innovation behaves without RP
and under RP. Thus, in terms of delay of introduction, the application of RP yields the
delay of followers, and the delay of pioneers if only if the price is above some threshold.
In the long run, allowing innovation to occur in level C (prior to the discovery of the first
level N drug), the follower may be never introduced (short sequence), or it can be
introduced before the pioneer of level C (long sequence). Again, both sequences are
22 The relation between the patient and the physician is considered a relation of perfect agency; therefore they are viewed as a single agent, the consumer.

20 Modeling Global Pricing and Launching of New Drugs
compared without RP and under RP. In this case, there exist a threshold under which, an
equilibrium with a short sequence exists, and above which, an equilibrium with a long
sequence so does. The introduction of RP makes all prices be smaller and makes this
threshold increase.
When RP is applied, there may be countervailing effects on the introductory time
of the pioneer. On the one hand, the profitability of a pioneer is reduced because its price
decreases when the follower is introduced. Instead, the delay of introduction of the
follower increases, allowing the producer of a pioneer to benefit from a longer period of
monopoly situation. The global effect of RP is thus ambiguous. Two antagonist effects of
the RP regulation are found: a decrease in price reduces the incentives to create pioneer
drugs; but however, the introduction of followers is delayed, which gives positive
incentives to launch pioneers. Consequently, the net effect within a class is ambiguous.
1.3 What do the empirical models show?
Theoretical models and frameworks explain the strategic games played by
governments, public insurers and pharmaceutical companies, and undoubtedly they also
suggest factors influencing both launch prices and launch of new drugs. This section
shows empirical evidence on these factors.
The articles retrieved are first classified according to the two outcome variables
evaluated, price and launch; and secondly, the impact factors influencing each outcome
variable are explored and classified into drug, competition, regulation, country and firm
characteristics.
1.3.1 Samples, Variables and Methods
Table A.1 and Table A.2 summarize the main characteristics of the 17 studies that
met the selection searching criteria. The papers retrieved examine the determinants of
pricing or launching new drugs focusing on drug, brand competition, regulation, country or
firm effects (Borrell, 2007, Cabrales and Jimenez-Martin, 2007, Coronado et al., 2007,
Danzon and Epstein, 2008, Danzon et al., 2011, Danzon et al., 2005, Heuer et al., 2007,
Kanavos and Vandoros, 2011, Kyle, 2006, Kyle, 2007, Lanjouw, 2005, Kanavos P and
Costa-Font J, 2005, Verniers et al., 2011, Danzon and Chao, 2000, Timur et al., 2011,
Atella et al., 2012). Two studies analyse both pricing and launching (Danzon and Epstein,

Chapter 1: Global Pricing and Launching of New Drugs: What Does the Theory Say?
What Do the Empirical Models Show?
21
2008, Verniers et al., 2011), but only one considers pricing and launching simultaneously
(Verniers et al., 2011).
Five articles have developed a theoretical model as a basis for empirical analysis
(Cabrales and Jimenez-Martin, 2007, Coronado et al., 2007, Danzon and Epstein, 2008,
Danzon et al., 2005, Atella et al., 2012). Empirical papers have developed multivariate
causal models, controlling for variables mainly classified according to drug, competition,
regulation, country and firm characteristics.
Regarding pricing, most papers explain the price level within a given period of time
(Borrell, 2007, Cabrales and Jimenez-Martin, 2007, Coronado et al., 2007, Danzon et al.,
2011, Kanavos and Vandoros, 2011, Kanavos P and Costa-Font J, 2005, Danzon and
Chao, 2000, Timur et al., 2011, Atella et al., 2012), although two take both prices at
launch time as dependent variable (Danzon and Epstein, 2008, Verniers et al., 2011).
Prices are generally taken at ex-manufacturer level (Cabrales and Jimenez-Martin, 2007,
Coronado et al., 2007, Danzon and Epstein, 2008, Danzon et al., 2011, Kanavos and
Vandoros, 2011, Verniers et al., 2011, Danzon and Chao, 2000) but are also taken at
wholesale (Borrell, 2007, Kanavos P and Costa-Font J, 2005) and retail (Kanavos and
Vandoros, 2011, Timur et al., 2011) levels. In every article, log transformations of the
price are used. The articles that develop a theoretical model as a basis for empirical
analysis estimate a reduced-form equation of the theoretical form (Cabrales and Jimenez-
Martin, 2007, Coronado et al., 2007, Danzon and Epstein, 2008, Danzon et al., 2005).
Different estimation methods are employed depending on the nature of the data, with
ordinary least squares (OLS) being most commonly employed (Borrell, 2007, Danzon and
Epstein, 2008, Danzon et al., 2011, Ganslandt and Maskus, 2004, Kanavos P and Costa-
Font J, 2005, Danzon and Chao, 2000, Atella et al., 2012), while Danzon and Epstein use
the generalized least squares (GLS) (Danzon and Epstein, 2008) and Kanavos and
Costa-Font apply two step least squares (2SLS) and two step generalized least squares
(2SGLS) (Kanavos P and Costa-Font J, 2005). Other estimating methods applied include
differences-in-differences regressions (Danzon et al., 2011), a Heckman selection model
with a first-stage clog-log regression (Danzon and Epstein, 2008) and Tobit regressions
(Kanavos P and Costa-Font J, 2005, Verniers et al., 2011).
Launching studies have analysed how quickly a drug is made available in a given

22 Modeling Global Pricing and Launching of New Drugs
country, using diverse measures to evaluate the launch of a medicine into a market.
These include logit and probit models, measuring the probability of a new drug being
launched in a given country within a certain period23 after the first appearance (Heuer et
al., 2007, Lanjouw, 2005), while other papers have analysed this question using discrete-
time hazard models, examining the probability of placing a new drug on the market in time
t when it has failed to enter by month t-1 after global launch (Danzon and Epstein, 2008,
Danzon et al., 2005, Kyle, 2007, Lanjouw, 2005, Kyle, 2006). This probability will be
called henceforth, launch hazard. Only Verniers et al. studies as the dependent variable
the launch window, i.e., the difference, in months, between the first worldwide launch and
the subsequent launch in a specific country (Verniers et al., 2011). Kyle estimates a
negative-binomial model to estimate the number of countries where the drug has been
launched (Kyle, 2007).
Samples vary widely across papers. In the main, three types of data are used:
data (collected yearly, monthly or quarterly) at product level (Borrell, 2007, Cabrales and
Jimenez-Martin, 2007, Coronado et al., 2007, Danzon et al., 2011, Kanavos P and Costa-
Font J, 2005, Verniers et al., 2011, Atella et al., 2012), molecule level (Danzon and
Epstein, 2008, Danzon et al., 2005, Heuer et al., 2007, Kyle, 2006, Kyle, 2007, Lanjouw,
2005, Timur et al., 2011) or both (Kanavos and Vandoros, 2011, Danzon and Chao,
2000), including: i) Sales series by volume and value (euros/dollars); ii) Launch dates; iii)
Aggregated data, including medicine, market, country and firm characteristics. In all the
empirical articles, the impacts of these characteristics on prices and launches are
evaluated through econometric models. The numbers of molecules/products, the
countries selected and the period of time analysed vary considerably. The data sources
used are in most cases IMS databases, occasionally complemented with other
databases. These differences in samples are presented in detail in Table A.2.
Different specifications of competition and substitutes were found, with articles
using therapeutic substitutes defined either at the molecule (Danzon and Chao, 2000,
Danzon and Epstein, 2008, Timur et al., 2011) or the product level (Danzon et al., 2011,
Kyle, 2006, Verniers et al., 2011). Most papers define the therapeutic class according to
the Anatomical Therapeutic Chemical (ATC) Classification System at different levels (1, 3
and 4) (WHO, 2012). Danzon and Epstein simply distinguish between “superior” and
23 Eight months, two and ten years.
Chapter 1: Global Pricing and Launching of New Drugs: What Does the Theory Say?
What Do the Empirical Models Show?
23
“inferior” subclasses (Danzon and Epstein, 2008) (see also (Berndt et al., 2007)).
Many empirical papers introduce the price regulation level of countries as an
explanatory variable when studying medicines pricing or launching. Both the criteria and
the definitions used to classify the price regulation level may vary slightly among papers,
ranging from a simple differentiation between whether countries regulate or not (Heuer et
al., 2007, Kyle, 2007, Kanavos P and Costa-Font J, 2005, Verniers et al., 2011) to
whether extensive regulation is applied, as in Lanjouw (Lanjouw, 2005), to other types of
classification which divide the degrees of regulation into two (less regulated and more
regulated) as Coronado et al. (Coronado et al., 2007) or three (low, medium and high) as
Cabrales and Jiménez-Martín (Cabrales and Jimenez-Martin, 2007).
Apart from the country fixed effects, country characteristics are mainly related to
variables based on demographics (Heuer et al., 2007, Kyle, 2006, Kyle, 2007, Lanjouw,
2005, Verniers et al., 2011) and income (Borrell, 2007, Cabrales and Jimenez-Martin,
2007, Danzon et al., 2011, Heuer et al., 2007, Kyle, 2006, Kyle, 2007, Lanjouw, 2005,
Verniers et al., 2011). The papers selected mainly use two demographic variables, the
population size and the population structure (Kyle, 2007, Lanjouw, 2005) while income
measures are defined as GDP or GDP per capita (Borrell, 2007, Cabrales and Jimenez-
Martin, 2007, Danzon et al., 2011, Heuer et al., 2007, Kyle, 2006, Kyle, 2007, Lanjouw,
2005, Verniers et al., 2011). Together with income level, income distribution is also
included as a country characteristic (Borrell, 2007, Danzon et al., 2011, Lanjouw, 2005).
The amount of R&D expenditure has been measured as a percentage of GDP (Lanjouw,
2005). Membership of the EMA24 (European Medical Agency) has also been included in
the econometric analysis and it is considered in the empirical contribution of this thesis
(see chapter 3) as a country characteristic (Verniers et al., 2011, Lanjouw, 2005).
Firm characteristics can also influence drug prices and market entry. In the papers
retrieved, these features at company level mainly concern the firm’s size (Cabrales and
Jimenez-Martin, 2007, Coronado et al., 2007, Danzon et al., 2005), experience (Danzon
et al., 2005, Kyle, 2006, Kyle, 2007), type (Cabrales and Jimenez-Martin, 2007) and
location (Danzon and Epstein, 2008, Kyle, 2006, Kyle, 2007, Verniers et al., 2011,
24 Before EMEA.
24 Modeling Global Pricing and Launching of New Drugs
Cabrales and Jimenez-Martin, 2007, Coronado et al., 2007, Danzon et al., 2005). Firm
size is constructed as the total corporation sales corrected by excluding sales of the
product under analysis (Cabrales and Jimenez-Martin, 2007, Coronado et al., 2007,
Danzon et al., 2005). Experience was measured through the firm’s worldwide outpatient
sales at the beginning of the study period (Danzon et al., 2005), the number of years it
has been active in the country (Kyle, 2006) and the number of countries in which it has
launched any medicine (Kyle, 2007). The firm type variable is strongly related to firm
location. The simplest criterion considers whether or not the headquarter is located in the
country (Danzon and Epstein, 2008, Danzon et al., 2005, Kyle, 2006, Kyle, 2007, Verniers
et al., 2011); other papers distinguish among local non-multinational, local multinational
and international multinational firms (Cabrales and Jimenez-Martin, 2007) or, among local
originator, solo licensee and local co-marketer firms (Danzon and Epstein, 2008).
1.3.2 Factors influencing prices
1.3.2.1 Drug Characteristics
The longer a product has been in the market, the lower its price tends to be; thus,
new medicines enjoy price premiums compared to those already in the market. At the
same time, this is consistent with the hypothesis that newer molecules offer improved
therapeutic quality25, which is associated with high prices (Cabrales and Jimenez-Martin,
2007, Coronado et al., 2007, Danzon and Chao, 2000, Kanavos and Vandoros, 2011,
Timur et al., 2011, Atella et al., 2012). The same is true with respect to the strength of the
medicine and the number of different presentations (Danzon and Chao, 2000, Danzon
and Epstein, 2008, Timur et al., 2011), which are associated with higher prices. This is
coherent with the generally accepted positive relationship between strength and
therapeutic value, when a medicine contains more quantity of active ingredient and when
adding perceived value in health, it is generally accept to pay more. Contrary, price
decreases with pack size (Danzon and Chao, 2000, Timur et al., 2011) and it is also in
line with Verniers et al. (Verniers et al., 2011), who finds that the higher the required daily
dosage of a medicine, the lower the price per gram of this medicine. These results are
consistent with economies of scale in packaging.
25 There exist differences among therapeutic definitions.
Chapter 1: Global Pricing and Launching of New Drugs: What Does the Theory Say?
What Do the Empirical Models Show?
25
Whether we look at abroad, a higher mean global price of the medicine positively
affects the drug price, and moreover, the more countries in which the molecule is present,
the greater this positive effect is. Note, however, that when there is no average global
price26, i.e. when the drug is very innovative, the price is higher than when a global
reference exists (Cabrales and Jimenez-Martin, 2007). Furthermore, Verniers et al. find
an inverted U-shaped effect of the launch window on the launch price in which launch
price is highest at moderate delay. Considering on-patent products, the authors explain
that, at moderate launch windows, the firm can still make money under patent protection.
At very long delay, regulator and firm will agree more easily a relatively low launch price
as a prelude to generic competition. However, at very short delay, the firm will accept a
lower launch price more easily enjoying the full life of patent protection in order to
recuperate the R&D investment. This hypothesis about low prices at very short delay may
face the widely used ERP, the presence of PT and the spillover effects.(Verniers et al.,
2011).
Some authors have highlighted differences in therapeutic categories (Danzon and
Chao, 2000, Verniers et al., 2011). Moreover, the significant country-therapeutic category
interaction implies that therapeutic category effects differ across countries, owing to such
factors as category-specific differences in medical norms, insurance, regulation and OTC
share (Danzon and Chao, 2000).
The results published by these studies suggest that, in general, different degrees
of regulation do not distort the effects of the above attributes. However, Danzon et al.
(Danzon and Chao, 2000) have found that some effects may change depending on the
country regulation level. We mention here some examples. Regarding therapeutic
innovation, there is a tighter correlation between medicine prices and quality in the USA
than in Italy, where price controls are applied. Furthermore, molecule age elasticity is
most negative (2.66 or greater) in France, Italy and Japan, which have the strictest price
regulation. The effect of drug strength is significantly negative in Japan, where the
practice of polypharmacy27 may reduce the value of strong pills. In turn, the price is
independent of the number of presentation forms in the USA and Canada, but for other
26 There is no mean global price because the medicine has been launched in a single country.
27 Prescribing several different drugs simultaneously.

26 Modeling Global Pricing and Launching of New Drugs
countries, as mentioned above, the elasticity is significantly positive. This is consistent
with the hypothesis that introducing line extensions is one means of achieving a price
increase in countries that do not permit higher prices for established products. The price
elasticity with respect to the number of forms is largest in Japan, which presents the
greatest price reduction over the product life cycle and hence where there exist strong
incentives to introduce new forms and thus obtain a higher price (Danzon and Chao,
2000). In addition, Danzon and Chao show that the global diffusion28 as an indicator of
therapeutic value obtains higher prices in unregulated markets, although this effect is
insignificant or small at best in less regulated markets such as the UK, Canada and
Germany, but is significantly negative in strictly regulated countries such as France, Italy
and Japan (Danzon and Chao, 2000). Besides, Coronado et al. show that the product
market share is expected to be significantly positive only in the least regulated countries.
1.3.2.2 Competition and substitutes
In general, therapeutic substitutes do not appear to exert competitive pressure on
price. Danzon and Chao (Danzon and Chao, 2000) show that, competition from
therapeutic substitute molecules appears to have small significant negative effects in
France, Italy, Germany and the UK, but the interpretation is unclear. The most plausible
explanation is that regulators use implicit reference pricing, setting prices for new
products based on prices of established products (Danzon and Chao, 2000). Timur et al.
do not find significant effect on price from therapeutic substitutes, however, different from
Danzon and Chao (Danzon and Chao, 2000). Timur et al. estimate the pool of data and
do not show specific results for countries. In this case, Timur et al. suggest that substitute
molecules with a higher price might not receive reimbursement, and substitution is not
always possible in regulated countries because of prescribing or consumption
preferences. Furthermore, the effect of delayed entry for therapeutic substitutes has been
also analysed, and the coefficients obtained for the USA and Canada imply that
successive molecules enter at lower prices, however these lower prices are not
sufficiently low to fully erode the first mover’s advantage. Other country interactions are
generally positive, but significant only in Germany.
On the contrary, only Verniers et al. (Verniers et al., 2011) find that competition
28 The number of countries where the medicine has already been sold.

Chapter 1: Global Pricing and Launching of New Drugs: What Does the Theory Say?
What Do the Empirical Models Show?
27
drives down launch prices when estimating the pool of data. In this case, this different
result can be supported by the use of a richer sample. Furthermore, Danzon and Epstein
collect data for superior and inferior medicines. They state that while the prices of
competitors are positively related to launch prices, the prices of inferior medicines do not
affect those of superior ones, and vice versa, which means that dynamic competition
between subclasses is based on non-price product attributes (Danzon and Epstein,
2008).
For middle and low income countries (MLICs), Lanjouw finds that competition from
other originator medicines does not appear to be effective at reducing prices in retail
channels in these countries (Lanjouw, 2005).
Most papers found generic competition to negatively affect prices (Cabrales and
Jimenez-Martin, 2007, Coronado et al., 2007, Danzon and Chao, 2000, Danzon and
Epstein, 2008, Danzon et al., 2011, Timur et al., 2011). However, Danzon an Epstein
(Danzon and Epstein, 2008) only find that the effect of generic prices in inferior class,
which may reflect a selection effect: late entrants in inferior subclasses launch only if they
expect to receive high prices relative to competing generics. In turn, Cabrales and
Jiménez-Martín, and Coronado et al. (Cabrales and Jimenez-Martin, 2007, Coronado et
al., 2007) find a significant and negative effect in a large majority of countries. However,
the presence of generics on a market does not mean that brand name products will
reduce their prices. According to Coronado et al., in some cases, the presence of
generics will have the impact of concentrating brand name products over the inelastic
portion of the demand, which will then increase the price of these products. Hence, the
expected sign of the number of generics will be positive29. Interestingly, Danzon and Chao
(Danzon and Chao, 2000) find that generic competition is significant in unregulated or
less regulated markets but regulation undermines generic competition in strict regulatory
systems. As Coronado et al. (Coronado et al., 2007), Danzon and Chao find positive
effects of generic competition but they explain that multi-source suppliers in these
countries are usually licensed co-marketers rather than competing generic manufacturers
or minor ‘‘new’’ products that enter to obtain a higher regulated price. Danzon et al.
(Danzon et al., 2011) find that in MLICs the number of generic competitors only weakly 29 The US, Germany, The Netherlands, the UK and France.
28 Modeling Global Pricing and Launching of New Drugs
affects prices to retail pharmacies, may be because uncertain quality leads to competition
on brand rather than price. Contrary, tendered procurement attracts multi-national generic
suppliers and significantly reduces prices for originators and generics, compared to prices
to retail pharmacies.
Only Kanavos and Vandoros (Kanavos and Vandoros, 2011) find that generics is
non-significant. They point out the existence of the generics paradox, particularly in the
US, where prices of off-patent originator brands do not decline post-patent expiry, but,
rather, increase faster than prices of in-patent originator brands.
1.3.2.3 Regulation Characteristics
When examining price regulation regimes through explicit regulation variables, the
most of the literature does not find significant influences on prices (Kanavos P and Costa-
Font J, 2005, Verniers et al., 2011, Kanavos and Vandoros, 2011, Danzon and Epstein,
2008, Atella et al., 2012). Only Kanavos et al. find that countries with “free-pricing”
systems (the US and Germany) present higher prices significantly positive. As explicit
price regulation policy, they only find that the explicit use of HTA (Health Technology
Assessment) has a significant negative effect on prices (Kanavos and Vandoros, 2011).
In this sense, Atella et al. proposes that rather than higher or lower prices, under a price
control regime (as in Italy), there is greater price variability than in a free price regime (as
in the US) (Atella et al., 2012).
Although not introducing explicit regulation variables in the econometric models,
Danzon and Epstein and Atella et al. (Atella et al., 2012, Danzon and Epstein, 2008)
retrieve information from price regulation characteristics. In this sense, Atella et al. find a
positive relationship between quality and price in a free price regime (as in the US), but
also find a negative relationship between drug price and drug quality in a price control
regime (as in Italy), which suggests that price regulations have created perverse
incentives (Atella et al., 2012). Also, Danzon and Epstein interestingly observe that launch
prices increase with the level of the lowest price previously received in other high-price
EU countries, whereas the effects of a previous launch in low-price EU countries are
insignificant. This is also true for non-EU countries, but only for superior medicines. This
result is consistent with the hypothesis that launching first in high-price EU markets can
influence prices in low-price ones. That evidence about a sequential launch prices
validates the theory that a launch delay in low-price markets may ultimately yield higher

Chapter 1: Global Pricing and Launching of New Drugs: What Does the Theory Say?
What Do the Empirical Models Show?
29
prices in these markets through spillovers from higher-price ones (Danzon and Epstein,
2008). This theory is shown by Stargardt and Schreyögg (Stargardt and Schreyögg,
2006). They develop an analytical model in their paper, which analyses direct and indirect
impact due to the use of ERP from the referenced to the referencing country. The authors
estimate the impact of drug price changes in Germany30 on drug prices in other countries
using ERP in the former EU-15. The authors use the formulas applied by each
referencing country and then, they calculate the partial differential of these formulas with
respect to a 1 euro price reduction in Germany. They do not only know the formula (the
average, the minimum, a percentage, etc. see Leopold (Leopold et al., 2012)) but also the
basket of countries used by each referencing country. They differentiate the direct impact
(caused by Germany to other countries) and the indirect impact (caused by the
referencing countries that have taken Germany in their baskets, to other referencing
countries). The authors state that the relationship between the direct and indirect impact
of a price change depends mainly on the scheme applied to set prices. For instance, the
price is either determined by the lowest of foreign prices (e.g. Portugal), the average of
foreign prices (e.g. Ireland) or a weighted average of foreign prices (e.g. Italy). If the
respective drug is marketed in all referenced countries and prices are regularly updated, a
price reduction of €1.00 in Germany will reduce prices in the former EU-15 countries from
€0.15 in Austria to €0.36 in Italy. Whether we distinguish between direct and indirect
impact, almost more than (about) the 50% of the total impact in Austria comes from the
indirect impact (0.08 euros), however, only 1% of the total impact in Italy is due to the
indirect impact (0.03 euros). Both Austria and Italy include 14 and 12 countries in their
ERP scheme respectively, but we observe how Italy, which uses a weighted average, is
less harmed by undue indirect impact. Thus, to avoid the negative effects of ERP and
determine prices in order to reduce the direct and indirect impact of individual countries, a
weighted formula of prices containing as many countries as possible should be used.
Surprisingly, the literature does not find a direct effect on pricing when ERP is
applied. This result is robust among different specifications, but it could be explained by
the database collected. In Verniers et al. (Verniers et al., 2011), the database was limited
to the drugs launched as of February 1994 but the ERP had not been widely applied by 30 Germany is chosen because is one of the largest pharmaceutical markets in the world, it is characterised by relatively high prices and it is referenced by most referencing countries scheme.

30 Modeling Global Pricing and Launching of New Drugs
that time (Leopold et al., 2012). In Kanavos and Vandoros (Kanavos and Vandoros,
2011), the prices of branded originators do not correspond to launch prices; therefore,
competition can also lead to downward pressure of off-patent originator brands, but the
ERP is applied on new drugs at launch time. On the other hand, when the ERP is found to
have effect on launching, the database comprises prices at launch time between 1995
and 2005.
Even more, Kanavos and Costa-Font have found that PT does not influence prices
downwards in importing countries (Kanavos P and Costa-Font J, 2005). Furthermore,
Danzon and Epstein show that the presence of PT is insignificant for superior medicines,
but significant and negative for inferior ones, indicating that the presence of PT reduces
launch prices mainly for late entrants into older subclasses (Danzon and Epstein, 2008).
Furthermore, Danzon et al. make an interesting contribution for MLICs concerning
price regulation policies. They compare the two different ways to provide medicine in
MLICs: tendered procurement mechanism by NGOs and standard retail channels. In
these terms, they find that originator brands purchased through tendered procurement
mechanisms by NGOs tend to lower originator prices, compared to those obtained
through standard retail channels. These large procurement effects may reflect not only
price-competitive tendering but also a greater willingness of originators to grant discounts
to a separate distribution channel that targets lower income customers and is less prone
to price spillovers to other countries (Danzon et al., 2011).
1.3.2.4 Country Characteristics
In most studies, country characteristics are included in the econometric models in
order to capture price differences among countries. The variable most commonly included
is that of country GDP per capita (Cabrales and Jimenez-Martin, 2007, Danzon and
Epstein, 2008, Borrell, 2007, Danzon et al., 2011). This is coherent with the generally
accepted positive relationship between wealth and greater willingness to pay. Thus, the
country-level fixed effects controlled by GDP per capita show that although the lower-
income EU countries such as Spain, Portugal and Greece regulate medicine prices, they
have relatively high medicine prices with respect to GDP, whereas higher-income EU
countries have lower medicine prices relative to their per capita GDP. Then, Danzon and
Epstein suggest that ERP has contributed to the price convergence of medicines among
EU countries relative to GDP (Danzon and Epstein, 2008). In turn, Kanavos and

Chapter 1: Global Pricing and Launching of New Drugs: What Does the Theory Say?
What Do the Empirical Models Show?
31
Vandoros (Kanavos and Vandoros, 2011) state that as we move towards newer
molecules over time by launch date, there is upward price convergence across the study
countries overall. This is partly explained by ERP and the launch sequence for new
products, whereby new products are first launched in less-regulated countries followed by
price-regulated countries. This launch sequence influences in part the final price in price-
regulated countries. According to the convergence above mentioned, Cabrales and
Jiménez-Martín (Cabrales and Jimenez-Martin, 2007) observe that the US does not
present higher prices than other countries. Contrary to the conventional wisdom about
countries regulatory regimes, the fixed effect of the US is significantly lower than that of
Canada (but not for all specifications), France or Italy. The authors interpret that if
average prices in the US are higher than in other countries it is not because other
countries engage in “free riding regulation”, but because the US per-capita income is
higher, in fact, in many cases, the US pays less, not more, than countries of similar
income or lower income (such as Eastern European countries). The authors also interpret
that as the US market size is larger and more competitive than the other countries, it
provides with some protection with respect to similarly rich countries. This contradictory
result may be result of the innovations introduced with respect to the previous empirical
literature in the subject. Mainly, they estimate pricing equations separately for each
country, they do not restrict the sample in any way and identify the effect of time-invariant
variables by following a two-stage procedure (Cabrales and Jimenez-Martin, 2007).
For MLICs, Borrell shows evidence of a persistent positive relationship between
drug prices and per capita income in MLICs (Borrell, 2007). In addition, the income
distribution within countries has also been considered by Danzon et al. and Borrell
(Borrell, 2007, Danzon et al., 2011). Borrell suggests that income effects alone are
unlikely to achieve affordable prices in low-income countries. Thus, although per capita
income effects are positive, the negative effect of the income distribution implies that the
poorest countries face with the highest relative prices. Moreover, skewed income
distributions appear to exacerbate high drug prices relative to per capita incomes in
MLICs (Danzon et al., 2011), however, Borrell reports ambiguous effects (Borrell, 2007).
1.3.2.5 Firm Characteristics
Some studies have examined how certain firm characteristics may influence prices

32 Modeling Global Pricing and Launching of New Drugs
(Cabrales and Jimenez-Martin, 2007, Coronado et al., 2007, Danzon and Epstein, 2008,
Kanavos and Vandoros, 2011, Verniers et al., 2011). Coronado et al. show that the firm
size have a high significant positive effect on prices, indicating that large companies enjoy
higher prices either because its products are of higher quality or perceived as such
(Coronado et al., 2007). However, Cabrales and Jiménez-Martín find this effect significant
and negative, but small (Cabrales and Jimenez-Martin, 2007). As the definition variable
and the sample is the same, except the number of countries considered, we think that the
use of more variables concerning the firm characteristics may undermine this issue.
Another question widely mentioned concerns the type and location of the firm.
Danzon and Epstein do not find price premium for medicines launched by local firms
(Danzon and Epstein, 2008). In addition, Cabrales and Jiménez-Martín firstly check
differences in location for multinational firms between local and foreign multinationals, and
contrary to conventional wisdom, in most countries, is found that countries do not
distinguish between local and foreign multinationals. However, Verniers et al., different
from former results, find that firms obtain higher launch prices in their domestic market
than they do in foreign ones (Verniers et al., 2011). These different findings may be due to
differences in samples. Verniers et al. have collected a richer sample of countries where
we can find more MLICs where usually headquarters are not held, while the most of
countries collected by Cabrales and Jiménez-Martín and Danzon and Epstein are middle
and high-income countries (Cabrales and Jimenez-Martin, 2007, Danzon and Epstein,
2008). Additionally, Cabrales and Jiménez-Martín also compare between local non-
multinational firms and multinational firms and find that local non-multinational firms tend
to have lower prices than any multinational (Cabrales and Jimenez-Martin, 2007).
Furthermore, as in the theoretical models, Coronado et al. analyse the existence
of a multimarket contact effect and try to find whether more contacts between firms
competing in the same markets may induce more collusion. They empirically show that
multimarket contacts have a positive influence on prices for the firm in less regulated
countries31, and unstable effects in regulated countries32. This suggests that in more
regulated markets there exist distortions that interact with market forces. For instance, the
product market share is significant and positive only in the least regulated countries.
31 The US, Canada, Germany, the Netherlands and the UK.
32 France, Spain, Italy and Japan.

Chapter 1: Global Pricing and Launching of New Drugs: What Does the Theory Say?
What Do the Empirical Models Show?
33
Moreover, reducing prices in more competitive markets compared to the existing level
may discourage entry and may have a negative dynamic effect in the development of the
industry. This may help predict the undesirable effects of public interventions (Coronado
et al., 2007).
1.3.3 Factors influencing launching
1.3.3.1 Drug Characteristics
As expected, potential prices and volumes positively affect launching (Danzon et
al., 2005), although according to Danzon and Esptein, the volume is not significant
(Danzon and Epstein, 2008). This insignificant effect of volume contrasts with significant
positive effects in Danzon et al. (Danzon et al., 2005). These different findings may reflect
differences in sample countries and drugs, in addition to the use of more detailed
measures of country-class prices and other characteristics. As previously found for prices,
the speed of launch increases with the medicine’s importance33 but falls with its age (Kyle,
2007). Furthermore, peculiarities have been found depending on the type of medicine
evaluated. Thus, there are significant differences among therapeutic classes (Danzon et
al., 2005, Verniers et al., 2011), for instance, there is a higher probability of never
launching for inferior medicines than for superior ones (Danzon and Epstein, 2008).
Interestingly, Verniers et al. observe an U-shaped effect of launch price on the
launch delay; launch price is highest at moderate launch delay. As expected, at very long
launch delay, we will expect a relatively low launch price as a prelude to generic
competition. This relationship shows the trade-off for the pharmaceutical firm between the
price and the launch delay (Verniers et al., 2011).
Regarding the international context, from the first global launch the launch hazard
pattern is first decreasing and then increasing34. This idea is generally accepted; there is
a threshold at which the firm will not be worried about the spillover effects from the ERP
and the presence of PT. On the other hand, the number of countries where the medicine
has already been launched affects significant and positively, with the exception of prior 33 Drug’s share of Medline citation for therapeutic class.
34 Quadratic effect.
34 Modeling Global Pricing and Launching of New Drugs
launch in the three lowest price EU countries, Spain, Portugal and Greece. This pattern
confirms that firms delay the launch in low-price EU countries until it has taken place in
higher-price ones (although this is not the case for inferior medicines). Furthermore, a
prior launch in a high-price country has a stronger effect on launching in a low-price one
than vice versa. This effect is even larger when the countries are both EU members
(Danzon and Epstein, 2008).
1.3.3.2 Competition and substitutes
With respect to market factors, the launch hazard is positively affected by
competitor prices (Danzon and Epstein, 2008, Kyle, 2006, Kyle, 2007), although it does
not seem to influence when the endogenous variable is studied as launch window instead
of launch hazard (Verniers et al., 2011). These differences may come from the definition
of the variable to measure the competition. Verniers et al. construct a Herfindahl–
Hirschman index35 for each drug in each country, however, Danzon and Epstein use the
competitor prices and Kyle includes the measure by Djankov et al. (Djankov et al., 2002).
Furthermore, cross-class price effects are insignificant, indicating that competition occurs
within subclasses rather than between subclasses, and that dynamic competition is driven
by product characteristics other than price (Danzon and Epstein, 2008).
Concerning generic competition, Danzon and Epstein (Danzon and Epstein, 2008)
find that the effects of number of generic competitors are negative but statistically
insignificant, providing further evidence that availability of older, cheaper generic
substitutes is not a significant deterrent to the launch of new brand products, even in older
subclasses where generics are more numerous, possibly because generic substitution is
mostly within molecules rather than between molecules.
1.3.3.3 Regulation Characteristics
The question of regulation has been widely analysed. The most common finding is
that price regulation tends to produce a launch delay (Danzon et al., 2005, Kyle, 2006,
Kyle, 2007, Lanjouw, 2005). When price regulation reduces prices below the level
expected given a country’s per capita income, this problem is exacerbated and launch
35 This index is constructed by summing the squared market shares (MS) (based on revenues in the IMS Health data) of the m drugs in the same ATC4 category as drug i at the time of launch of drug i in country j.

Chapter 1: Global Pricing and Launching of New Drugs: What Does the Theory Say?
What Do the Empirical Models Show?
35
delays may extend even to high-income countries. Controlling for expected price, the
models show that such delays have been observed in countries with strict regulation and
in those traditional parallel exporters, either performing negative country fixed effect
(Danzon et al., 2005), or directly introducing dummy variables concerning price regulation
(Kyle, 2006, Kyle, 2007, Lanjouw, 2005) or via the average price competitors in the
country (Danzon and Epstein, 2008).
Various degrees of regulation have been explored. Lanjouw (Lanjouw, 2005)
examine separately high and low-income countries. For high-income countries, all price
regulation – whether moderate or extensive – tends to reduce the probability of a
medicine being launched within two years after first launch, while for lower-income
countries, extensive price controls clearly lower the probability of new medicines reaching
consumers quickly. On the other hand, moderate price control does not appear to have a
significant influence on entry in this case. However, as in the richer countries, the effect of
moderate price regulation depends on a country’s income level. For example, in low-
income countries the existence of a national formulary positively affects launch hazard
(which is not the case for the higher-income countries). One would expect its direct effect
to be negative, but within the lower-income country group this variable may be acting as a
proxy for bureaucratic competence.
On the other hand, Kyle (Kyle, 2007) and Verniers et al. (Verniers et al., 2011)
show that entry actually appears more likely in countries using internal RP. Both papers
show that direct price controls are not significant factors on launch delay or do affect
negatively the drug launch hazard. Therefore, there is some evidence that indirect
controls may be preferable to direct ones from the standpoint of attracting new medicines.
Kyle (Kyle, 2007) also suggests that the effect of price controls is not restricted to
an individual market, but affects the launch of a medicine in other markets as well. From
this idea, Heurer et al. (Heuer et al., 2007) introduce the ERP as explanatory factor and
find that countries using ERP to determine their prices present a significantly lower
probability of launch within the first eight months. Specifically, the two forms of
international comparison based on a formula of foreign prices – either determining prices
directly from such a formula, or using it as an informal basis for the decision – have
impacts that are negative but different. This difference may derive from the fact that, if a

36 Modeling Global Pricing and Launching of New Drugs
strict rule is applied, there is less room to negotiate higher prices and therefore
companies delay the launch of new products. Moreover, Kanavos and Vandoros
(Kanavos and Vandoros, 2011) state that the ERP may yield that new products are first
launched in less-regulated countries followed by price-regulated countries. However,
Verniers et al. do not find the use of ERP as significant factor affecting the launch delay.
These different results may come from the use of different samples. Heurer et al. analyse
the data for the former EU-15, where the use of ERP is more pronounced (see Leopold et
al. (Leopold et al., 2012)), whereas the sample used by Verniers et al. includes 50
countries worldwide where the use of ERP might not be so orthodox (see Espín J. et al.
(Espin J et al., 2011)).
Furthermore, when considering the presence of PT, no significant effects have
been reported on launch hazard in the importing country; PT risk is more likely to lead to
non-launch or launch delay in the parallel export country (Danzon and Epstein, 2008).
Some studies have examined how the role of the EMA as a centralized
mechanism for marketing approval within Europe has affected the drug launch. Kyle firstly
analyses the countries price ranking and finds that a negative and significant effect
implies that high-price markets are less attractive for launch, although this effect is
quantitatively small. When an interaction term with the post-1995 period is included
considering the beginning of the EMA period, which implies a PT more widespread, it
appears that launch hazard in higher-price countries is more likely. Parallel traders can
essentially arbitrage price differences across countries in the EU, entry into high-price
countries should be more attractive, and entry into low-price ones less so, as imports of
drugs from low-price countries could crowd out sales in higher-price markets (Kyle, 2007).
Moreover, there is some evidence that the establishment of the EMA in 1995 succeeded
in speeding up access to new medicines for consumers, increasing the launch hazard
within 2 years (Lanjouw, 2005). Also, Verniers et al. finds that firms launch faster in
countries belonging to the EMA zone (Verniers et al., 2011).
Additionally, Lanjouw (Lanjouw, 2005) evaluates different levels of patent rights or
protection as factor affecting launch hazard for MLICs. They concluded that short-term
product and long-term process patent regimes both tend to encourage faster launches
(Lanjouw, 2005, Verniers et al., 2011). Verniers et al. (Verniers et al., 2011) reach the
same conclusion.

Chapter 1: Global Pricing and Launching of New Drugs: What Does the Theory Say?
What Do the Empirical Models Show?
37
1.3.3.4 Country Characteristics
Population and GDP per capita are both expected to positively affect drug launch.
We might think that a country with a large population may have a large potential demand
and a high-income country would be willing to pay a high price. Therefore, both may get a
rapid access to medicines. However, when these effects are econometrically analysed
their estimated influence depends on the sample and the specification used. Using a
sample in which all countries are large and relatively wealthy, Kyle (Kyle, 2006) reveals
that population and per capita GDP are not especially important determinants. But when
Kyle (Kyle, 2007) analyses a sample of countries with more variance, as expected, high-
income countries and countries with larger populations are likely to have earlier launches.
However, the coefficient of GDP per capita becomes negative and statistically
insignificant while more detailed variables of price regulation are introduced in the model,
such as internal RP36 or pharmacoeconomic evidence37. Additionally, Kyle also shows that
a medicine that has previously been launched in a high-price market is much more likely
to enter an additional market than one that was previously launched in a low-price market.
Also, Danzon et al. (Danzon et al., 2011) confirm that the resulting interconnectedness
across countries contributes to the launch delay or non-launch of new medicines in low-
price EU countries, as firms seek to avoid spillovers to prices in higher-price EU countries.
Similar results are found when Heurer et al., with a wide sample (60 countries),
test only for general country characteristics such as GDP per capita, drug expenditure,
and population size and structure in addition to health indicators. A higher GDP per capita
and a larger population indicate a large potential market and therefore have a positive
impact on the probability of a launch within eight months. However, when variables for the
regulatory scheme such as the use of ERP or the application of internal RP are included,
the effects for GDP per capita and population become insignificant (Heuer et al., 2007).
So, these two important country characteristics that are very relevant to price
bargaining with the industry could be undermined by the country pricing policy. However,
Verniers et al. that takes into account 50 countries worldwide find that population size is 36 Therapeutic class reference pricing: a reference-pricing scheme, in which the patient is responsible for paying the price difference between his chosen drugs and a reference drug defined by the government.
37 Pharmacoeconomic evidence presents the cost effectiveness of a treatment with a new drug as the ratio of the cost of treatment (including the drug price, hospital stays, surgery, and so on) to relevant measures of its effect.
38 Modeling Global Pricing and Launching of New Drugs
statistically significant and negatively affects the delay launch, even including variables
concerning the country regulatory scheme. But in this case no variable regarding the
country wealth was included (Verniers et al., 2011).
Interestingly, Lanjouw (Lanjouw, 2005) analyses the MLICs and includes
regulatory variables, find that the existence of a larger population and a higher level of
GDP per capita increase the likelihood of a country having a medicines available on the
market within two years after the first launch. Furthermore, the age composition of a
country’s population is a significant determinant of the speed of medicine launch. Drugs
are more likely to reach the market in countries with many children and those with a high
proportion of elderly persons. Among the high-income countries, having a larger
proportion of children seems to be the most important factor. Income distribution also
appears to be an important determinant of market entry. When interacted with the GDP
per capita, is statistically significant and show a pronounced pattern across high-income
and MLICs. Then, a lower-income country is more likely to get new drugs if it is unequal,
ensuring that it has a wealthy “elite”. On the other hand, a high-income country is better
off with a more equal distribution as this generates the largest “middle class”. Equality
becomes less important as average income increases.
1.3.3.5 Firm Characteristics
All the papers examined show that domestic firms tend to enter the market with
short delays (Danzon and Epstein, 2008, Danzon et al., 2005, Kyle, 2006, Kyle, 2007,
Verniers et al., 2011). Similarities between a firm’s home market and the potential launch
market greatly increase the probability of launch; the existence of a common border and
language provides about half the advantage of domestic status (Kyle, 2006). But Kyle
shows medicines invented by firms headquartered in price-controlled countries are less
likely to be introduced in additional markets and therefore price regulation level matters
(Kyle, 2007).
Danzon and Epstein interestingly differ among type of local firms. They differ
among local originator firm, local licensee and local co-marketers38. The drugs produced
38 Local Originator identifies a molecule’s originator corporation launching in its country of domicile; Solo Licensee identifies a locally-domiciled, licensed corporation that launched the molecule in at least one country by itself; and Local Co-marketer identifies a locally-domiciled, licensee corporation that launched together with another firm in its home country and did not launch alone in any country.

Chapter 1: Global Pricing and Launching of New Drugs: What Does the Theory Say?
What Do the Empirical Models Show?
39
by local originator firms have a significantly greater local advantage than compounds that
are simply sold by local licensee firms or local co-marketers (Danzon and Epstein, 2008).
The firm’s experience also seems to contribute to the earlier entry of medicines into the
market (Danzon et al., 2005, Kyle, 2006, Kyle, 2007). However, Kyle points out firms with
many medicines in their portfolios tend to launch in fewer countries (Kyle, 2007).
1.4 Discussion
This review tries to know what are the main factors influencing both launch prices
and launch of new drugs at international level. An important conclusion is that pricing and
launching a medicine are two inseparable issues in the global market.
The results predicted from the theoretical models explain the strategic games
played by governments, public insurers and pharmaceutical companies. Although the
models proposed do not reflect the whole reality of the global pricing and launching
process and differ in the hypothesis assumed, they do provide insight into the main issues
that the literature has significantly considered. We distinguish two types of factors. Firstly,
we have observed factors that directly affect drug pricing and launching, such as the
regulation pricing policy, the presence of PT and the firm characteristics. And secondly,
we have also found other determinants that not only impact directly but also indirectly,
affecting the measure in which the first types of factors influence drug pricing and
launching, such as country size and the level of co-payments.
The price regulation policies seem to be one of the most robust factors affecting
the drug pricing and launching. The literature has particularly underlined the direct price
controls such as the use of the ERP (Garcia Mariñoso et al., 2011), the indirect price
controls such as the internal RP (Miraldo, 2009) and the MES + PC, which include both
types (Atella et al., 2012). At this regard, the use of the ERP affects referenced countries.
Their prices increase as consequence of the engagement to the ERP by the referencing
country (Garcia Mariñoso et al., 2011). In turn, the internal RP has been found influencing
positively the firm pricing strategies. Firms set higher prices at first stage when they
anticipate that the RP pricing policy will be applied in the second stage. As in the case of
ERP, the extent of this effect will basically depend on the rule used by the regulator for
40 Modeling Global Pricing and Launching of New Drugs
calculate the RP level, either the minimum or the weighted average (Miraldo, 2009). Price
regulation regimes not only affect prices, they also may affect R&D and the quality of
drugs. In these terms, Bardey et al., under different hypothesis than Miraldo (Miraldo,
2009), find that the RP yields a decrease in price, this decreasing in price reduces the
incentives to create pioneer drugs; however, the introduction of followers is delayed,
which gives positive incentives to launch pioneers. The net effect within a class is
ambiguous (Bardey et al., 2010). In turn, the quality of drugs may be affected by
regulation regimes. When a price cap is applied together with a MES, whether the
regulator fixes a price cap that binds the high-type quality drugs and a MES that only
binds the low-type quality ones, then not only the price of the high-type drug will decrease
but also its efficacy will be negatively affected (Atella et al., 2012).
The presence of PT appears to be also an important factor. The model proposed
by Ganslandt and Maskus (Ganslandt and Maskus, 2004) predicts that the price in high-
income countries (the parallel importers) converges to the low-income ones (plus a trade
cost). However, Heurer et al. (Richter, 2008) suggest that PT should be considered as a
loss of income for the original manufacturer. Intuitively, in order to compensate this loss of
income, the firm should increase the drug price in the parallel importer country.
The firms as economic agents can also influence prices and launching. Cabrales
and Jiménez-Martín predict that the price set by the regulator is weakly higher for a local-
multinational than for a foreign one (Cabrales and Jimenez-Martin, 2007). Not only the
location of firms matters, but also the contacts between firms competing in the same
markets. Thus, an increasing in the multimarket contact structure induces higher levels of
collusion and therefore higher prices. However, this effect will be undermined in countries
with price regulation (Coronado et al., 2007).
The country size and the level of co-payments affect direct and indirectly the drug
pricing and launching. Both have been widely used as variable to design the theoretical
models. The country size seems to be one of the most important determinants in the
theoretical models.
Concerning the price regulation, the preferences to engage to ERP policy
decrease as the size of the referencing country and as the level of co-payments of
referencing and referenced countries converge (Garcia Mariñoso et al., 2011). When a
regulation regime based on a direct PC in addition to a MES is applied, as the MES
Chapter 1: Global Pricing and Launching of New Drugs: What Does the Theory Say?
What Do the Empirical Models Show?
41
makes improve the low-type quality drug and increases its price, but makes worsen the
efficacy in high-type drugs and decreases its price, then the net welfare will depend on
the size of both drug buyers (Atella et al., 2012). Also, the size of the country parallel
importer influences positively the number of PI firms, consequently, the drug price
decreases in the parallel importer country (the high-income country) (Ganslandt and
Maskus, 2004). Furthermore, the population size is also taken into account when firms
decide where to firstly launch a drug in the presence of informational spillovers
concerning asymmetric information on drug quality. Although the information spillovers
can be avoided by launching in all countries simultaneously, the preference to delay
launch will depend positively on the relative country size and on the difference in the
levels of co-payments between countries (García-Mariñoso and Olivella, 2012). Besides,
the population size is also taken into account by the firms. Given that a local non-
multinational receive a weak price premium with respect to a multinational39 in a regulated
country, as the country size of the foreign multinational increases, its price converges to
that of the local multinational (Cabrales and Jimenez-Martin, 2007).
From the perspective of the regulator, concerning the application of ERP, the
literature recommends to engage to ERP only to small countries and/or apply an ERP
based on prices in large countries (or large group of countries); the same applies if one
substitutes “large country” by “small co-payment country” and vice versa (Garcia
Mariñoso et al., 2011). Also, a minimum RP level is advised in order to avoid major
increasing price level with respect to the average RP (Miraldo, 2009). And furthermore, a
MES policy together with a PC should be applied when the welfare lost due to the high-
type drug buyers is not large enough to undermine the welfare gained due to the low-type
drug (Atella et al., 2012).
From the perspective of the firm, the loss of income coming from PT should be
considered and the firm should set a higher price than without PT. However, since the
ERP is widely used by countries and PT does exist, the markets are inseparable. Thus,
the highest drug price is not always the best option for the firm, nor a low drug price
always the worst option in a given country. What may have been an optimal pricing
strategy in a single country is no longer optimal when considering the ERP and PT 39 Either local or foreign.

42 Modeling Global Pricing and Launching of New Drugs
(Ganslandt and Maskus, 2004, Richter, 2008). Furthermore, in the presence of
informational spillovers on quality, the launch delay should occur in the non-aggressive
country. Regarding the firm location, multinational firms should settled down in large
countries in order to better compete with local multinational firms (Cabrales and Jimenez-
Martin, 2007).
On the other hand, the empirical literature collects an amount of econometric
models which have identified and measured the influence of the most significant factors
affecting prices and launches of medicines in different countries. The use of different
samples may prevent from doing comparisons.
Demographic and income country features, and regulation regimes, seem to be
the most important factors affecting drug pricing and launching in the empirical literature.
Moreover, the drug characteristics as strength, packsize and presentation forms are
significantly related to the price, but it is the therapeutic value, which robustly affect
pricing and launching. The firm location turns up an important factor for the launching
decision but price premiums due to headquarters location appear ambiguous. Generic
competition generally drives down prices; however, there are some different effects,
which deserve some comments. In turn, the brand competition factors do not appear to
exert competitive pressure on prices.
The country size, the GDP per capita and income distribution are three country
characteristics shown as the most significant factors influencing pricing and launching.
Ceteris paribus, higher-income countries pay higher drug prices (Cabrales and Jimenez-
Martin, 2007, Danzon and Epstein, 2008) and have a more rapid access to medicines
than lower-income countries (Danzon et al., 2011, Heuer et al., 2007, Kyle, 2007,
Lanjouw, 2005); furthermore, populated countries also enjoy a higher probability of launch
(Heuer et al., 2007, Kyle, 2007, Lanjouw, 2005, Verniers et al., 2011). Additionally, an
unequal income distribution positively affects the drug launch hazard in lower-income
countries via a wealthy “elite”. On the other hand, a more equal distribution makes the
same effect in high-income countries via a largest “middle class”. However, we should
note that the country pricing policies might undermine the effects of these important
factors. Contrary, interestingly, Cabrales and Jiménez-Martín observe lower prices in the
US than in other countries as Canada, France or Italy, and contrary to the conventional
wisdom about countries regulatory regimes (Cabrales and Jimenez-Martin, 2007).
Chapter 1: Global Pricing and Launching of New Drugs: What Does the Theory Say?
What Do the Empirical Models Show?
43
In the empirical review, the most common finding is that price regulation tends to
produce launch delay. Such as delays have been observed in countries with strict
regulation and in traditional parallel exporters. Particularly, Heurer et al. show that
countries using the ERP have a lower probability of launch (Heuer et al., 2007), and
Stargardt and Schreyögg state that the use of ERP have positive direct and indirect
impact on the referencing countries. At this regard, they propose to use as many
countries as possible in the formula (Stargardt and Schreyögg, 2006), which partially
coincides with the recommendations from the theoretical model of García-Mariñoso et al.
(Garcia Mariñoso et al., 2011). However, Stargardt and Schreyögg further recommend
avoiding countries using ERP, in order to prevent undue impacts; and integrate the
market volumes of the referenced countries into the index in order to avoid high prices
and launch delays in countries with small markets (Stargardt and Schreyögg, 2006). In
turn, Kyle shows that there is evidence from the standpoint of attracting new medicines
that indirect price controls such as RP may be preferable to the direct ones such as
pharmacoeconomic evidence or price freeze (Kyle, 2007). Furthermore, the belonging to
the EMA make launches more likely, particularly in higher-price countries (Kyle, 2007,
Verniers et al., 2011). On the other hand, as explicit price regulation, only the explicit use
of HTA has a significant effect on prices (Kanavos and Vandoros, 2011).
The therapeutic quality, the strength, the pack size, the number of presentations
number of the drug and the product life cycle are very significant factors on pricing. The
therapeutic quality, the strength and the number of presentations make increase the price,
the pack size and the product life cycle affect negatively (Cabrales and Jimenez-Martin,
2007, Coronado et al., 2007, Danzon and Chao, 2000, Kanavos and Vandoros, 2011,
Timur et al., 2011, Danzon and Epstein, 2008). Also, the literature importantly considers
the sequential launch of a drug and the effect on its price. Commonly, the higher are the
prices previously set, the higher will be the drug price in a country. We note that when
there is no average global price40, what can be interpreted as a drug innovative character,
the price is higher than when previous prices exist (Cabrales and Jimenez-Martin, 2007).
Therapeutic innovation also influences positively the launching. It has been observed that
a prior launch in a high-income country has a stronger effect on launching in a low-income
40 There is no mean global price because there are no countries to be calculated.

44 Modeling Global Pricing and Launching of New Drugs
country than vice versa. Also, the fact of launching first in high-price EU markets positively
affects launch prices in the low-price ones via ERP (Danzon and Epstein, 2008).
Although the papers analysed appear to agree on drug characteristics, differences in
therapeutic categories (Danzon and Epstein, 2008, Danzon et al., 2005, Kyle, 2007,
Lanjouw, 2005, Verniers et al., 2011).
From the perspective of the firms, it has been shown that all multinational firms
obtain a price advantage. By contrast, domestic firms tend to enter the market with short
delays (Danzon and Epstein, 2008, Danzon et al., 2005, Kyle, 2006, Kyle, 2007, Verniers
et al., 2011), however, it is not clear that they receive price premiums (Cabrales and
Jimenez-Martin, 2007, Danzon and Epstein, 2008, Verniers et al., 2011). These last
results do not support the theoretical model that predict that local-multinational firms
receive price premiums compared to foreign multinational ones (Cabrales and Jimenez-
Martin, 2007). Only Verniers et al. find that domestic firms obtain higher prices in their
domestic markets, but they do not make differences between multinational and non-
multinational firms. In any case, the literature shows that the contact among firms in
unregulated markets induces higher prices through price collusion (Coronado et al.,
2007).
Most papers find generic competition to negatively affect prices (Cabrales and
Jimenez-Martin, 2007, Coronado et al., 2007, Danzon and Chao, 2000, Danzon and
Epstein, 2008, Danzon et al., 2011, Timur et al., 2011). Interestingly, price regulation is
found to undermine generic competition in strict regulatory systems. However, the
presence of generics may increase the price of brand names products (Cabrales and
Jimenez-Martin, 2007, Coronado et al., 2007).
In general, except for the case of tendering procurement in MLICs, brand
competition does not seem to exert a significant competitive pressure on prices, to the
contrary, several authors find that brand competitor prices affect positively launch hazard
(Danzon and Epstein, 2008, Kyle, 2006, Kyle, 2007). Only Danzon and Epstein indicate
that competition occurs within subclasses rather than between subclasses, and that
dynamic competition is driven by product characteristics other than price (Danzon and
Epstein, 2008).
Contrary to the theoretical model that predicts that the presence of PT reduces
prices in high-income countries (Ganslandt and Maskus, 2004), the empirical literature

Chapter 1: Global Pricing and Launching of New Drugs: What Does the Theory Say?
What Do the Empirical Models Show?
45
does not find robust effects on it (Kanavos P and Costa-Font J, 2005). By contrast, PT
risk is more likely to lead to non-launch or launch delay in the parallel export while it has a
lower impact on the importing country.


2 Chapter 2: External Reference Pricing and Pharmaceutical Cost-Containment.
2.1 Introduction
Pharmaceuticals are sold on a global market. This characteristic gives rise to a
specific bargaining procedure between pharmaceutical firms and countries’ health
agencies. On the one hand, a firm makes strategic decisions to sequentially launch
medicines in different countries and to maximize global profits; and on the other hand,
countries’ health agencies implement pricing policies in order to control their
pharmaceutical expenditure and yet guarantee access to medicines.
Among existing drug pricing policies, most countries in the industrialized world
have implemented either Cost-Effectiveness Analysis (CEA) or External Reference
Pricing (ERP) at some point in time with the aim of controlling pharmaceutical expenditure
but still ensuring access to medicines, mainly for on-patent medicines (Espin J et al.,
2011, Rawlins, 2012).
According to the OECD, ERP, also referred to as External Price Benchmarking or
International Reference Pricing, is defined as “the practice of comparing pharmaceutical
prices across countries” and it is further indicated that, “there are various methods applied
and different country baskets used” (Paris et al., 2008). In this thesis, we use the ERP
definition from Garcia-Mariñoso et al. (Garcia Mariñoso et al., 2011): “ERP consists of
setting a price cap for pharmaceuticals, based on ex-manufacturer prices of identical or
comparable products in other countries”.
ERP is not applied homogeneously in every country. There are a wide variety of
methods used to design a foreign price index (Leopold et al., 2012, Espin J et al., 2011). It
48 Modeling Global Pricing and Launching of New Drugs
mainly depends on each country’s basket, date of prices41, the method used (the lowest
price, the average price, a percentage of the previous ones, etc.) and whether a
weighted-index42 is used or not. We also note that some countries take into account ERP
as a complementary pricing policy together with other pricing policies to help to make the
price decision, thus it is not exclusively applied as a blind pricing policy43. ERP is used
because of its simplicity at technical or analytical level; it does not require a huge task to
collect price information abroad. Furthermore, ERP users think that those prices taken as
a reference are approximately right, suitable or fair. However, they mention that it is
difficult to assess if the resulting prices are appropriate, efficient or optimal in accordance
with any objective criterion. Therefore, if referencing countries set their prices too high or
too low, then any country later applying the ERP method may run the risk of repeating the
same mistake (Espin J et al., 2011).
The basic trade-off faced by a pharmaceutical firm is the following. If a firm delays
a launch in a referencing (low-price) country, it will also delay profits that could be derived
from this country. However, on the positive side, it avoids this low price from overspilling
into other countries due to ERP strategy or parallel trade (Danzon and Epstein, 2008,
Danzon and Towse, 2003, Garcia Mariñoso et al., 2011). By contrast, when countries set
a drug price, they risk the possibility of not providing the drug at the time they desire,
which may have consequences for the health and the welfare of the population
(Lichtenberg, 2005). The use of ERP by countries may make firms apply international
pricing strategies that can harm countries’ welfare. On the one hand, a firm may set a
single price44 which may benefit the high-priced45 countries but harm the low-priced ones,
41 Current price vs. price at launch
42 The most widely method used for new drugs is through non-weighted measures; such methods will not help to achieve the target of obtaining a comparable average level of prices. The application of weighted price indexes, comparable and useful as reference to the rest of countries, has been proposed DANZON, P. M. & CHAO, L. W. 2000. Cross-national price differences for pharmaceuticals: How large, and why? Journal of Health Economics, 19, 159-195..
43 Espín et al. state that “regulators might not always be able or willing to “impose” a certain price, but instead use the price computed as a benchmark or reference for negotiations, often alongside other criteria, such as cost-plus, internal or therapeutic pricing”
44 Two factors contribute to price uniformity between different markets: a) threats of parallel imports, and b) the use of international reference pricing DANZON, P. M. & TOWSE, A. 2003. Differential Pricing for Pharmaceuticals: Reconciling Access, R&D and Patents. International Journal of Health Care Finance and Economics, 3, 183-205..
45 In the long run, consumers from high price countries will be worse off if this lower price results in lower expected returns on R&D, and hence fewer new medicines than they would have been willing to pay for DANZON, P. M. 1997. Price Discrimination for Pharmaceuticals: Welfare Effects in the US and the EU. International Journal of the Economics of Business, 4, 310-322..

Chapter 2: External Reference Pricing and Pharmaceutical Cost-Containment 49
and on the other hand, the firm may either attempt to set high46 prices in first countries to
avoid low prices in later launches via ERP, or delay launches in low-priced countries to
avoid the spill-over effects. These strategies may harm low-priced countries, and they
may even harm high-priced ones (Garcia Mariñoso et al., 2011). Also, another strategy
exists for firms to avoid spill-over effects from ERP. This consists of setting high prices
and granting confidential rebates or discounts to referenced countries. This strategy
allows firms to guarantee lower prices in referenced countries and avoids information
spill-overs of low prices to referencing countries (Espin J et al., 2011).
Most countries use ERP as a pharmaceutical pricing strategy. The use of ERP as
a mechanism to set pharmaceutical prices is quite widely applied: 24 of the 30 OECD
countries (Espin J et al., 2011) and approximately 24 of the 28 EU Member States
(Leopold et al., 2012) have used it.
CEA in health economics aims to estimate the ratio between the cost of a health-
related intervention and the benefit it produces in terms of the number of years lived in full
health by the beneficiaries. Cost is measured in monetary units, while benefit needs to be
expressed as a gain in health measured by quantitative values. However, unlike cost–
benefit analysis, the benefits do not have to be expressed in monetary terms. In
pharmaeconomics, it is usually expressed in quality-adjusted life years (QALYs)47
(National Insitute for Health and Care Excellence (NICE), 2010). The ICER is the ratio
between the difference in costs and the difference in benefits of two interventions. So, an
example in which the costs and gains, respectively, are 140,000 euros and 3.5 QALYs,
would yield an ICER of 40,000 euros per QALY. Commonly, each country has a different
threshold to pay for one QALY. If we suppose that such a country has a threshold of
30,000 euros per QALY, any drug which has an ICER of more than 30,000 euros per
additional QALY gained is likely to be rejected and any drug which has an ICER of less
than or equal to 30,000 euros per extra QALY gained is likely to be accepted as cost-
effective (WHO, 2003). However, drugs do not always yield a single ICER. We note that
other authors have studied in depth CEA according to Bayesian models (Negrin and
46 This company strategy will not work if the high-price country revises its prices downwards after launch
47 The QALY is a measure of disease burden, including both the quality and the quantity of life lived. The QALY model requires utility independent, risk neutral, and constant proportional tradeoff behaviour. The QALY is based on the number of years of life that would be added by the intervention. Each year in perfect health is assigned the value of 1.0 down to a value of 0.0 for being dead. If the extra years are not lived in full health, for example if the patient looses a limb, or goes blind or has to use a wheelchair, then the extra life-years are given a value between 0 and 1 to account for this.

50 Modeling Global Pricing and Launching of New Drugs
Vazquez-Polo, 2006, Negrin and Vazquez-Polo, 2008, Negrin et al., 2010, Moreno et al.,
2010)
A pharmaceutical firm knows this threshold48. It would also carry out a CEA and
obtain the number of QALYs gained if its drug were provided in one country. Since the
firm is aware of both threshold and number of QALYs, it offers the country the drug at a
certain price just below the threshold. However, the firm may upwardly distort the number
of QALYs to obtain greater profits. Then, it is the country that may revise the firm’s CEA
applying its own CEA to reveal a fair price. However, this CEA requires resources and
consequently an investment of money by the country.
Previous literature has developed games based on bargaining models between
pharmaceutical firms and countries’ health agencies to set drug prices in an international
context. Garcia-Mariñoso et al. (Garcia Mariñoso et al., 2011) examine the effects of
using ERP by referencing countries on referenced countries’ welfare via a bargaining
model. They find that a country has an incentive to engage in ERP if its co-payment levels
are high when compared to other countries. This preference decreases as the relative
size of the country engaging in ERP increases. They also find that these effects harm
referenced countries’ welfare. Furthermore, García-Mariñoso and Olivella (García-
Mariñoso and Olivella, 2012) present a negotiation model based on a “take-it-or-leave-it”
procedure that examines the conditions under which a firm can use launch delay and the
consequent information spill-overs49 to reject low prices. The notion that low prices may
overspill to other countries even in the absence of parallel trade or ERP is introduced here
differently from previous research.
Furthermore, other theoretical papers (Jelovac and Houy, 2013, Richter, 2008)
deal with pharmaceutical firms’ strategies and countries’ pharmaceutical pricing policies
but are not based on bargaining models. In this regard, Richter (Richter, 2008) proposes
48 We note that this threshold does not have to be a single threshold. There exists currently an interesting discussion about the social value of a QALY that determines such a threshold DONALDSON, C., BAKER, R., MASON, H., JONES-LEE, M., LANCSAR, E., WILDMAN, J., BATEMAN, I., LOOMES, G., ROBINSON, A. & SUGDEN, R. 2011. The social value of a QALY: raising the bar or barring the raise? BMC health services research, 11, 8, MASON, H., JONES�LEE, M. & DONALDSON, C. 2009. Modelling the monetary value of a QALY: a new approach based on UK data. Health Economics, 18, 933-950, NIHR, H. 2010. Weighting and valuing quality-adjusted life-years using stated preference methods: preliminary results from the Social Value of a QALY Project. Health Technology Assessment, 14, PINTO-PRADES, J. L., LOOMES, G. & BREY, R. 2009. Trying to estimate a monetary value for the QALY. Journal of Health Economics, 28, 553-562, ROBINSON, A., GYRD-HANSEN, D., BACON, P., BAKER, R., PENNINGTON, M. & DONALDSON, C. 2013. Estimating a WTP-based value of a QALY: The ‘chained’approach. Social Science & Medicine, 92, 92-104.
49 Information spillovers are essentially the demand for lower prices in a country generated by the knowledge about lower prices in other countries.

Chapter 2: External Reference Pricing and Pharmaceutical Cost-Containment 51
a mathematical optimization problem for a firm with examples in which international price
dependencies play an important role. This model can help countries to understand the
implication of their ERP policies on a global repeated pricing game. On the other hand,
Jelovac and Houy (Jelovac and Houy, 2013) analyse the timing decisions of
pharmaceutical firms to launch a new drug in countries using ERP. When all countries
reference the prices in all other countries and in all previous periods of time, then there is
no withdrawal of drugs in any country, and in any period of time and there is no incentive
to delay the launch of a drug in any country. However, these results do not hold when the
countries only reference a subset of all countries or when the reference is only on the
latest period prices.
Concerning empirical studies, Danzon and Epstein (Danzon and Epstein, 2008)
interestingly observe that launch prices increase with the level of the lowest price
previously received in other high-price EU countries, whereas the effects of a previous
launch in low-price EU countries are insignificant. This result is consistent with the
hypothesis that launching first in high-price EU markets can influence prices in low-price
ones. This evidence about sequential launch prices validates the theory that a launch
delay in low-price markets may ultimately yield higher prices in these markets through
spillovers from higher-price ones. This theory is shown by Stargardt and Schreyögg
(Stargardt and Schreyögg, 2006). They analyse the direct and indirect impact of the use
of ERP from the referenced to the referencing country. They estimate the impact of drug
price changes in Germany50 on drug prices in other countries using ERP in the former
EU-15. The authors use the formulas applied by each referencing country and then, they
calculate the partial differential of these formulas with respect to a 1 euro price reduction
in Germany. The authors state that the relationship between the direct and indirect impact
of a price change depends mainly on the scheme applied to set prices. Thus, to avoid the
negative effects of ERP and determine prices in order to reduce the direct and indirect
impact of individual countries, a weighted formula of prices containing as many countries
as possible should be used.
Surprisingly, only one out of three studies finds a direct effect on pricing when
ERP is applied. These results could be explained by the different databases collected.
50 Germany is chosen because it is one of the largest pharmaceutical markets in the world, it is characterised by relatively high prices and it is referenced by most cross-referencing countries schemes.

52 Modeling Global Pricing and Launching of New Drugs
The only time ERP was found to have an effect on launching, the database comprised
prices at launch time between 1995 and 2005. However, in Verniers et al. (Verniers et al.,
2011), the database was limited to drugs launched as of February 1994, though ERP had
not been widely applied at that time (Leopold et al., 2012). In Kanavos and Vandoros
(Kanavos and Vandoros, 2011), the prices of branded originators do not correspond to
launch prices; therefore, competition can also lead to downward pressure on off-patent
originator brands, however ERP is only applied on new drugs at launch time.
In addition, Heurer et al. (Heuer et al., 2007) find that countries using ERP to
determine their prices present a significantly lower probability of launch within the first
eight months. Moreover, Kanavos and Vandoros (Kanavos and Vandoros, 2011) state
that the ERP may result in new products being launched first in less-regulated countries
and, then, followed by launches in price-regulated ones. However, Verniers et al. do not
find the use of ERP as significant factor affecting the launch delay. These different results
may come from the use of different samples. Heurer et al. (Heuer et al., 2007) analyse
the data for the former EU-15, where the use of ERP is more pronounced (see Leopold et
al. (Leopold et al., 2012)), whereas the sample used by Verniers et al. includes 50
countries worldwide, where the use of ERP might not be so common (see Espín J. et al.
(Espin J et al., 2011))
We suggest a game based on a bargaining model involving the sequential
launching of one pharmaceutical by one firm across two countries based on a take-it-or-
leave-it-offer procedure that is developed under asymmetric information (Muthoo, 1999).
Each country has a different ICER or willingness to pay (WtP, henceforth) for one QALY
provided by a new on-patent medicine offered by one firm as monopoly producer. The
firm claims that the medicine produces certain number of QALYs Yw, and offers the
medicine at ex-manufacturer price to the country with a high WtP, and at price to
the country with low WtP. In turn, the countries communicate its price based on their
previously chosen pricing policy. In brief, each country chooses between applying ERP
without any additional cost and CEA with its corresponding investment. Then, the firm
choses its optimal country launch sequence. We introduce two important innovations that
are particularly worth mentioning: firstly, we include two different types of countries
depending on their ERP. Thus, we differentiate the type of country based on their formula
of foreign prices to implement ERP criteria, either the minimum or the average price
pF pF

Chapter 2: External Reference Pricing and Pharmaceutical Cost-Containment 53
observed. Secondly, we introduce the launch delay cost and the cost related to applying
CEA for countries to check if the firm declares the true QALY of the drug or not.
This chapter is organized as follows. In Section 2, we present the model. In
Section 3, we solve the game and calculate the best strategy for the firm. In Section 4,
using a given optimal country launch sequence, we compare countries’ welfare under
both types of pricing policies, CEA and ERP. Finally, we draw some conclusions.
2.2 The model
Players
Consider two countries, C and D. Each country i (i = C, D) submits a price based
on its pricing policy either CEA or ERP, which has been previously chosen. Each country i
has a WtP for one QALY achieved by providing one first-line on-patent pharmaceutical.
We also consider a firm that behaves as monopoly producer of this first-line on-patent
pharmaceutical, decides the order of countries and sells the medicine to the countries
during two periods (in stage 3 and 4, see Timing later on). The firm is not located in any of
the countries i (i = C, D). This drug is aimed at treating chronic conditions without any co-
payment. It is authorized via a centralized procedure51; thus, countries are not able to not
authorize this drug. They are just able to not list it for reimbursement. The drug has
already been launched in j countries (j = 1,2,3…J, ) at price . Hence, the players
of the game are one pharmaceutical company and one health agency in each country i.
Consumers
Consumers in each country are defined as those patients that may be treated by
the drug sold by the pharmaceutical firm. Hence, the demand for this drug in a country i (i
= C, D) is defined as the prevalence rate of the chronic diseases for which it may be
51 In the European Union, the centralized procedure is required for biotechnology products as well as for orphan medicines but is optional for other pharmaceuticals. In all cases, the European Commission approves market authorization, following the recommendations of the EMA. Market authorization can be also achieved via the mutual recognition procedure where firms demand authorization in one Member State and file for mutual recognition in other countries. However, our analysis only focuses on the centralized procedure, that is the most prevalent.
j i pj

54 Modeling Global Pricing and Launching of New Drugs
(2.1)
prescribed. This prevalence rate and therefore such demand, is given exogenously by qi52
and represents the country size.
The drug is provided without co-payment; therefore, consumers will not be
charged for consuming it. The health agency of each country will be the only payer.
Consequently, we assume that the in-patients’ total demand for the drug is exogenous
and given by qi.
Health Agencies
Health agencies care about the gross benefit provided by this drug, represented
by the number of QALY achieved, associated to the prevalence rate qi of its country,
denoted by Bi, then
with
Each country has a different ICER threshold for one QALY and this is defined as
WtP. We note that this threshold may represent a measure of opportunity cost or the
consumption value of health (Claxton et al., 2013). Countries do state their WtP.
Particularly, country C has a low WtP denoted by , and country D has a high WtP
denoted by . Y is the number of QALYs of the drug. Therefore, the Bi represents the
monetary value of health.
52 We note that qi does not significantly change over the years as the medicine is prescribed for patients with chronic conditions.
Bi WtPi Y qi
WtPWtP if country D
WtP if country C
WtPC
WtPD

Chapter 2: External Reference Pricing and Pharmaceutical Cost-Containment 55
(2.2)
Countries care about public expenses (PE) since patients do not have to pay for
the drug.
with
r unit cost of delay one period for one patient
PEi piqi i rqi ia
pi
piCEA WtPiY if CEA
with Y YF if the firm is honest
YiCEA otherwise
with WtPWtP if country D
WtP if country C
pIh if ERP with h , min
i 1 if launch delay in country i
0 otherwise
i 1 if country i applies CEA
0 otherwise
YiCEA YF
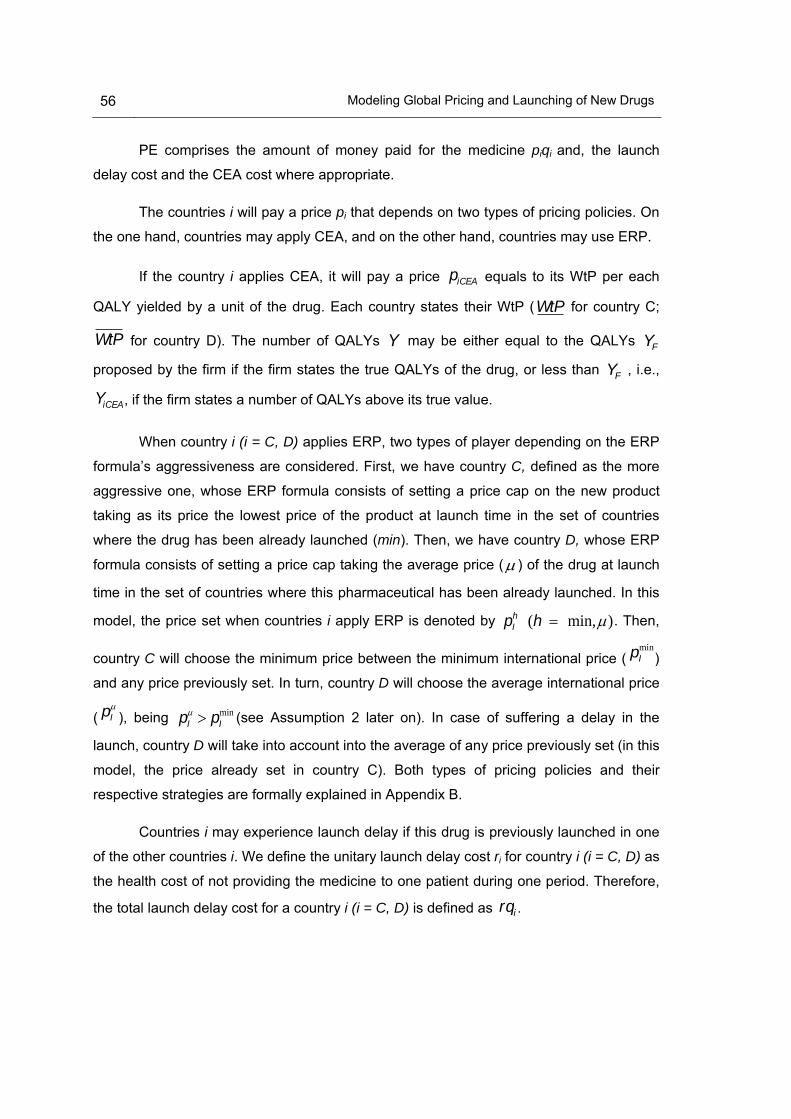
56 Modeling Global Pricing and Launching of New Drugs
PE comprises the amount of money paid for the medicine piqi and, the launch
delay cost and the CEA cost where appropriate.
The countries i will pay a price pi that depends on two types of pricing policies. On
the one hand, countries may apply CEA, and on the other hand, countries may use ERP.
If the country i applies CEA, it will pay a price equals to its WtP per each
QALY yielded by a unit of the drug. Each country states their WtP ( for country C;
for country D). The number of QALYs may be either equal to the QALYs
proposed by the firm if the firm states the true QALYs of the drug, or less than , i.e.,
, if the firm states a number of QALYs above its true value.
When country i (i = C, D) applies ERP, two types of player depending on the ERP
formula’s aggressiveness are considered. First, we have country C, defined as the more
aggressive one, whose ERP formula consists of setting a price cap on the new product
taking as its price the lowest price of the product at launch time in the set of countries
where the drug has been already launched (min). Then, we have country D, whose ERP
formula consists of setting a price cap taking the average price ( ) of the drug at launch
time in the set of countries where this pharmaceutical has been already launched. In this
model, the price set when countries i apply ERP is denoted by . Then,
country C will choose the minimum price between the minimum international price ( )
and any price previously set. In turn, country D will choose the average international price
( ), being pI pI
min (see Assumption 2 later on). In case of suffering a delay in the
launch, country D will take into account into the average of any price previously set (in this
model, the price already set in country C). Both types of pricing policies and their
respective strategies are formally explained in Appendix B.
Countries i may experience launch delay if this drug is previously launched in one
of the other countries i. We define the unitary launch delay cost ri for country i (i = C, D) as
the health cost of not providing the medicine to one patient during one period. Therefore,
the total launch delay cost for a country i (i = C, D) is defined as .
piCEA
WtP
WtP Y YF
YF
YiCEA
pIh (h min,)
pImin
pI
rqi

Chapter 2: External Reference Pricing and Pharmaceutical Cost-Containment 57
(2.3)
(2.4)
(2.5)
(2.6)
We note that countries i (i = C, D) applying CEA invest an amount of money to
verify if the number of QALY stated by the firm YF is true or not. This investment is
assumed equal across countries with a monetary amount a.
We assume that the objective of a health agency is to the maximize benefits
provided by the drug and to reduce the public expenses (PE) associated with its
purchase. Therefore, the objective function (OF) of the health agency can be written as,
OFi Bi PE (WtPiY pi )qi i rqi ia
Now, let us define several assumptions.
Assumption 1
The WtP per QALY of country D is strictly higher than that of country C.
Prices and proposed by the firm to country C and D, respectively, are defined as
the WtPi times the QALYs stated by the firm,
Then, the price proposed by the firm to country D is higher than the offered to
WtPD WtPWtPC WtP
pF
pF
pFWtPCYF
pF WtPDYF
pF pF
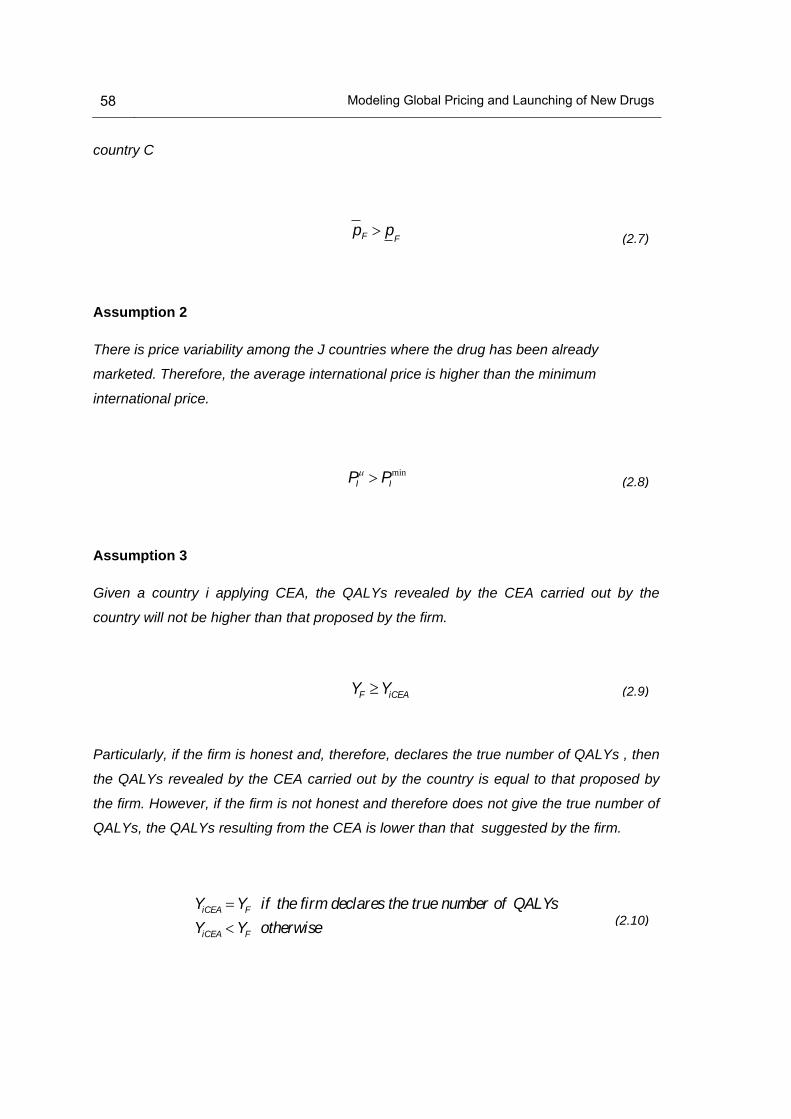
58 Modeling Global Pricing and Launching of New Drugs
(2.7)
(2.8)
(2.9)
(2.10)
country C
Assumption 2
There is price variability among the J countries where the drug has been already
marketed. Therefore, the average international price is higher than the minimum
international price.
Assumption 3
Given a country i applying CEA, the QALYs revealed by the CEA carried out by the
country will not be higher than that proposed by the firm.
Particularly, if the firm is honest and, therefore, declares the true number of QALYs , then
the QALYs revealed by the CEA carried out by the country is equal to that proposed by
the firm. However, if the firm is not honest and therefore does not give the true number of
QALYs, the QALYs resulting from the CEA is lower than that suggested by the firm.
pF pF
PI PI
min
YiCEA YF if the firm declares the true number of QALYs
YiCEA YF otherwise
YF YiCEA

Chapter 2: External Reference Pricing and Pharmaceutical Cost-Containment 59
(2.11)
(2.12)
(2.13)
Consequently, the price resulting from the application of CEA will not be higher than that
proposed by the firm,
piCEA piF if the firm trusted by the health agency
piCEA piF otherwise
Then, owing to the scientific evidence showed by the CEA, assuming that the marginal
cost (mc) of producing the pharmaceutical is zero (mc=0) and given that the firm is profit
maximizing, the firm will always sell at CEA price53.
Assumption 4
Given both countries i applying CEA, the number of QALYs revealed by the research,
YiCEA,, will be the same for both countries.
Assumption 5
The countries’ beliefs about the firm’s honesty are the same for both countries i (i = C,D).
Assumption 6
Under assumptions 3 and 5, the price expected by the country i (i = C,D) when applying
CEA is, 53 We note that the firm knows the countries i (i = C,D) WtP, therefore if it is too low (below a given threshold), the firm does not even initiate negotiations to launch in that country.
Pr(YF YiCEA) , i
Pr(YF YiCEA) 1 , i

60 Modeling Global Pricing and Launching of New Drugs
(2.14)
(2.15)
(2.16)
(2.17)
Then, under Assumption 1 and 5, the price expected by country D is larger than the price
expected by country C,
Assumption 754
If the price proposed by the firm is higher (lower) than the international reference price,
, then the price discovered by country when applying CEA will also be higher
(lower). Therefore, the CEA expected price will not be lower (higher) than the
international reference price.
Assumption 855
The average between the average international reference price and the country C price is
approximately equal to the average international reference price. Therefore, it is assumed
that J is large enough that the average price is not affected by a further observation.
54 This assumption guarantees the trade-off between choosing CEA and ERP. If country i applies CEA, it will pay a higher price to avoid having the drug launch delayed.
55 The Assumption 8 makes simpler the results and does not affect the conclusions obtained.
piF (1) piCEA E pi CEA
E pD CEA E pC CEA
pF
pIh piCEA
E pi CEA
If pF pIh piCEA pI
h E pi CEA pI
h
If pF pIh piCEA pI
h E pi CEA pI
h

Chapter 2: External Reference Pricing and Pharmaceutical Cost-Containment 61
(2.18)
(2.19)
Given p I
pj
j1
J
J
then,
pj pC
j1
J
J 1
p I with pC
p Imin
pF
pCEAC
Assumption 9
The price difference between the international reference price and the price proposed by
the firm is the same regardless of the type of country. Thus, the incentive to apply ERP is
also the same regardless of the type of country (high or low WtP), more formally
The Firm
The pharmaceutical industry is characterized by high fixed costs (F) (Mestre-
Ferrandiz, 2012, Mestre-Ferrandiz, 2013) and low mc (mc=0). Hence, F > 0 stands for the
fixed costs of R&D, safety approval process and marketing the drug in all countries. They
are fixed and independent of the number of people or countries that use the drug. The
firm sells the drug to country i (i = C, D) at price pi. This price pi is the maximum price at
which the firm and the health agencies agree56. If the country’s price comes from a CEA
policy, under assumption 3, the firm will always sell at CEA price. However, if the country
price comes from an ERP policy, the firm will be able to accept or refuse it. Should it
refuse, the firm will delay launch in such a country. Therefore the firm commits to
launching the drug and to satisfying the whole demand in this country (qi) at price pi.
Selling this pharmaceutical product without subsidization is not considered as an option.
Thus, we assume that the objective of a monopoly producer of a medicine is to maximize
56 We are aware that purchaser bodies such as hospital or pharmacy bodies may achieve discounts from this price pi, but they are not considered in this thesis.
pImin p
F pI
pF

62 Modeling Global Pricing and Launching of New Drugs
(2.20)
the accumulated profits function during the length of the sales (two periods, stage 3 and
4, see timing), which can be written as,
OFF pitqit FiC
D
t1
2
with
qit 0 if the drug is not marketed in country i in time t
Also, we assume that the firm is not located in any of the countries i (i = C,D).
Timing
The timing of this game is as follows. The game has 4 stages. In stage 1,
countries C and D choose their pricing policies, CEA or ERP, and the firm proposes a
price for the drug. In stage 2, countries communicate their prices according to their pricing
policies. In stage 3, as launching is sequential (say launch first in C and then in D or vice
versa), the firm chooses the country launch sequence, i.e., it chooses between delaying in
country D or delaying in country C, and sells the drug in the first country of the sequence.
In stage 4, the firm sells the drug in the second country. Since the firm is profit
maximazing, the firm sells in both countries i (i=C, D).
A priori, notice that country i (i=C, D) can choose between a pricing policy that
eventually requires an investment of money, CEA, and another pricing policy with no
charges, ERP. However, applying ERP, the country may have the drug launch delayed if
the firm the international reference price is lower than de price proposed, whereas,
applying CEA, the country risks not making a useful investment if the firm gives the true
number of QALYs.
In order to show the timing more clearly, see the decision tree in Appendix B.

Chapter 2: External Reference Pricing and Pharmaceutical Cost-Containment 63
Assumption 10
Drug launching is sequential and the firm keeps selling the drug in stage 4 to the country
where the drug has previously been launched.
Assumption 11
If only one country i (i= C,D) applies ERP and the international reference price is lower
than the price proposed by the firm, the firm will punish such a country i by delaying
launch in it. If both countries i (i= C,D) apply ERP and the international reference prices
are lower than the prices proposed by the firm, the firm will delay launch only in the
country i (i= C,D) according to the country that offers the lowest income.
2.3 Price Setting and Sequential Launch
Players maximize their objective function and we solve the game applying backward
induction. For both cases, when the firm claims a number of QALYs above the true
number of QALYs, and when it claims the true QALYs of the drug, then, we can solve for
each country’s pricing policy: i) no countries apply ERP, ii) only country D applies ERP, iii)
only country C applies ERP and, iv) both countries apply ERP, we calculate the conditions
of the optimal country launch sequence for the firm, either first country C and second
country D, or vice versa. The proof can be checked in Appendix B. In Section 4, we will
compare the countries’ surplus for each pricing policy, given the optimal country launch
sequence.
2.3.1 The firm is trusted by the health agency
i) No countries apply ERP
Since both countries C and D apply CEA, countries C and D will pay and
respectively according to (2.11). Since the firm is trusted by countries i (i= C,D),
under assumption 1, countries C and D will equivalently pay
and correspondingly.
pCCEA
pDCEA
pF
pF

64 Modeling Global Pricing and Launching of New Drugs
(2.21)
(2.22)
(2.23)
Notice that, under assumption 11, the incomes of the country where the drug has been
first launched are multiplied by two.
Concerning the health agencies’ surpluses, we note that the price considered by
countries C and D when applying CEA is an expected price according to assumptions 5
and 6, since both countries have uncertainty about the number of QALYs stated by the
firm.
the firm’s profits are,
and the health agencies’ surplus are57,
OFC (WtPCYF E pC CEA
)qC a if C, D (WtPCYF p
F)qC a rqC otherwise
OFD (WtPDYF E pD CEA
)qD a rqD if C, D (WtPDYF pF )qD a otherwise
57 Note that health agencies do not know if the firm has given the true number of QALYs or not. Therefore, they only know the expected price.
OF 2p
FqC pFqD F if C, D
pFqC 2pFqD F otherwise

Chapter 2: External Reference Pricing and Pharmaceutical Cost-Containment 65
(2.24)
PPR58 1
{C, D} if
pF
pF
qD
qC
{C, D} otherwise
If no countries apply ERP, the firm chooses to delay launch in country D, if and only if the
price ratio country C to country D is greater than the size ratio country D to country C,
otherwise the firm will delay launch in country C. Since the price ratio is less than unity,
then a necessary condition for the sequence {C,D} is that country C must be larger than
the D’s.
ii) Only country D applies ERP
Country D decides to apply ERP in stage 1. If the average international price is
lower than the price proposed by the firm, i.e., , under assumption 11, the firm
delays the launch in country D. Since the pricing policies are set ex-ante, if ,
country D will pay in any case. However, as country C applies CEA, it will pay .
Since the firm gives the true number of QALYs, under assumption 1, it will equivalently
pay .
Concerning the health agencies’ surpluses, we note that the price considered by
country C when applying the CEA is an expected price according to assumptions 5 and 6,
since the country C has uncertainty about the number of QALYs given by the firm.
the firm’s profits are,
58 Preliminary result.
pI pF
pI pF
pI pCCEA
pF

66 Modeling Global Pricing and Launching of New Drugs
(2.26)
(2.28)
(2.27)
(2.25) OFF 2p
FqC p
I qD F if C, D p
FqC 2p I
qD F otherwise
and the health agencies’ surpluses are,
PPR 2
{C, D} if p
F
pI
qD
qC
{C, D} otherwise
If only country D applies ERP, the firm will choose to delay launch in country D if and only
if the price ratio country C to country D is larger than the size ratio country D to country C,
otherwise the firm will delay launch in country C. Specifically, the price ratio is the ratio
between the CEA price and the average international reference price. Since the price ratio
is less than unity, then a necessary condition for the sequence {C,D} is that country C
must be larger than the D’s.
iii) Only country C applies ERP
Country C decides to apply ERP in stage 1. If the minimum international price is
lower than the price proposed by the firm, i.e., . The firm delays the launch in
OFC (WtPCYF E[pC ]CEA)qC a if C, D (WtPCYF E[pC ]CEA)qC a rqC otherwise
OFD (WtPDYF pI
)qD rqD if C, D (WtPDYF pI
)qD otherwise
pImin p
F

Chapter 2: External Reference Pricing and Pharmaceutical Cost-Containment 67
(2.30)
(2.29)
(2.31)
(2.32)
country C. Since the pricing policies are set ex-ante, if , the country C will pay
in any case. In turn, country D applies CEA and it will pay . Since the firm
gives the true number of QALYs, under assumption 1, it will pay the equivalent of .
Concerning the health agencies’ surpluses, we note that the price considered by the
country D when applying CEA is an expected price according to assumptions 5 and 6,
since country D is uncertain about the number of QALYs stated by the firm.
the firm’s profits are,
OFF 2pI
minqC pFqD F if C, D pI
minqC 2pFqD - F otherwise
and the health agencies’ surpluses are,
PPR 3
{C, D} if pI
min
pF
qD
qC
{C, D} otherwise
pImin p
F
pImin pDCEA
pF
OFC (WtPCYF pI
min )qC if C, D (WtPCYF pI
min )qC rqC otherwise
OFD (WtPDYF E[pD ]CEA)qD a rqD if C, D (WtPDYF pF )qD a otherwise

68 Modeling Global Pricing and Launching of New Drugs
(2.35)
(2.34)
(2.33)
If only country C applies ERP, the firm chooses to delay launch in country D if and only if
the price ratio country C to country D is larger than the size ratio country D to country C,
otherwise the firm will delay launch in country C. Specifically, if the price ratio is the ratio
between the CEA price and the minimum international reference price. Since the price
ratio is less than unity, then a necessary condition for the sequence {C,D} is that country
C must be larger than the D’s.
iv) Both countries C and D apply ERP
Both countries decide to apply ERP in stage 1. If one of the reference international
prices is lower than the price proposed by the firm, i.e., or , the firm
delays the launch in such country. In the event that both countries hold such a condition,
under Assumption 11, the firm will sell the drug to one of the countries i at stage 3. Since
the pricing policies are set ex-ante, both countries C and D will pay international reference
prices and respectively.
the firm’s profits are,
OFF 2pI
minqC pIqD F if C, D
pIminqC 2pI
qD F otherwise
and the health agencies’ surpluses are,
pI pF pI
min pF
pImin pI
OFC (WtPCYF pI
min )qC if C, D (WtPCYF pI
min )qC rqC otherwise
OFD (WtPDYF pI
)qD rqD if C, D (WtPDYF pI
)qD otherwise

Chapter 2: External Reference Pricing and Pharmaceutical Cost-Containment 69
(2.36)
PPR 4
{C, D} if pI
min
pI qD
qC
{C, D} otherwise
If both countries apply ERP, the firm chooses to delay launch in country D if, and only if,
the price ratio between country C and country D is larger than the size ratio country D to
country C, otherwise the firm will delay launch in country C. Specifically, the price ratio is
the ratio between the minimum and the average international reference price. Since the
price ratio is less than unity, then C country must be larger than D country.
In Table 2.1, we summarize the PPR 1, 2, 3 and 4. We show for each combination
of pricing policies i), ii), iii) and iv), under which conditions (pD, pC, qC, qD) the firm chooses
its optimal country sequence. In brief, we note that there is a trade-off between prices and
country sizes under each pair of pricing policies.
Table 2.1 PPR for optimal country launch sequence (pi , qi)
We define the four sets of possible combinations of firm offer prices and ERP:
a)
b) min
IFIF ppandpp
c)
d) pF pI
and pF pI
min
pF pI and p
F pI
min
pF pI and p
F pI
min
Sequence / Pricing
Strategy
i) No countries apply ERP
ii) Only country D
applies ERP
iii) Only country C
applies ERP
iv) Both countries
apply C and D
{C,D}
{D,C}
pF
pF
qD
qC
pF
pI
qD
qC
pImin
pF
qD
qC
pImin
pI qD
qC
pF
pF
qD
qC
pF
pI
qD
qC
pImin
pF
qD
qC
pImin
pI qD
qC

70 Modeling Global Pricing and Launching of New Drugs
In the following figures (Figure 2.1, 2.2, 2.3 and 2.4), we show under which pair of
pricing policies ( i), ii), iii) and iv) ) and which pairs of price ratios and country size ratios
the firm chooses its optimal country sequence to launch the drug. Below each figure, we
present additional tables (Table 2.2, 2.3, 2.4 and 2.5) containing detailed information
relating to each figure. Each figure shows the optimal launching sequence under the
regions of price ratios and country size ratios.
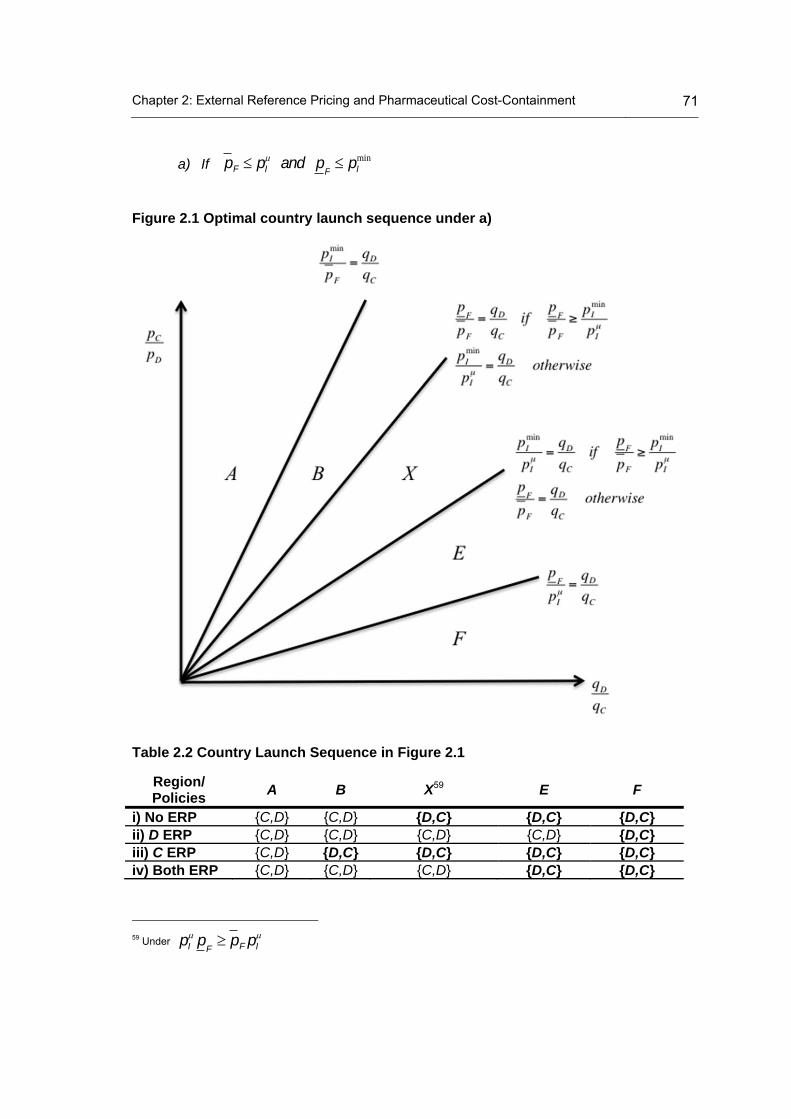
Chapter 2: External Reference Pricing and Pharmaceutical Cost-Containment 71
a) If
Figure 2.1 Optimal country launch sequence under a)
Table 2.2 Country Launch Sequence in Figure 2.1
Region/ Policies
A B X59 E F
i) No ERP {C,D} {C,D} {D,C} {D,C} {D,C} ii) D ERP {C,D} {C,D} {C,D} {C,D} {D,C} iii) C ERP {C,D} {D,C} {D,C} {D,C} {D,C} iv) Both ERP {C,D} {C,D} {C,D} {D,C} {D,C}
59 Under pI
pF pF pI
pF pI and p
F pI
min
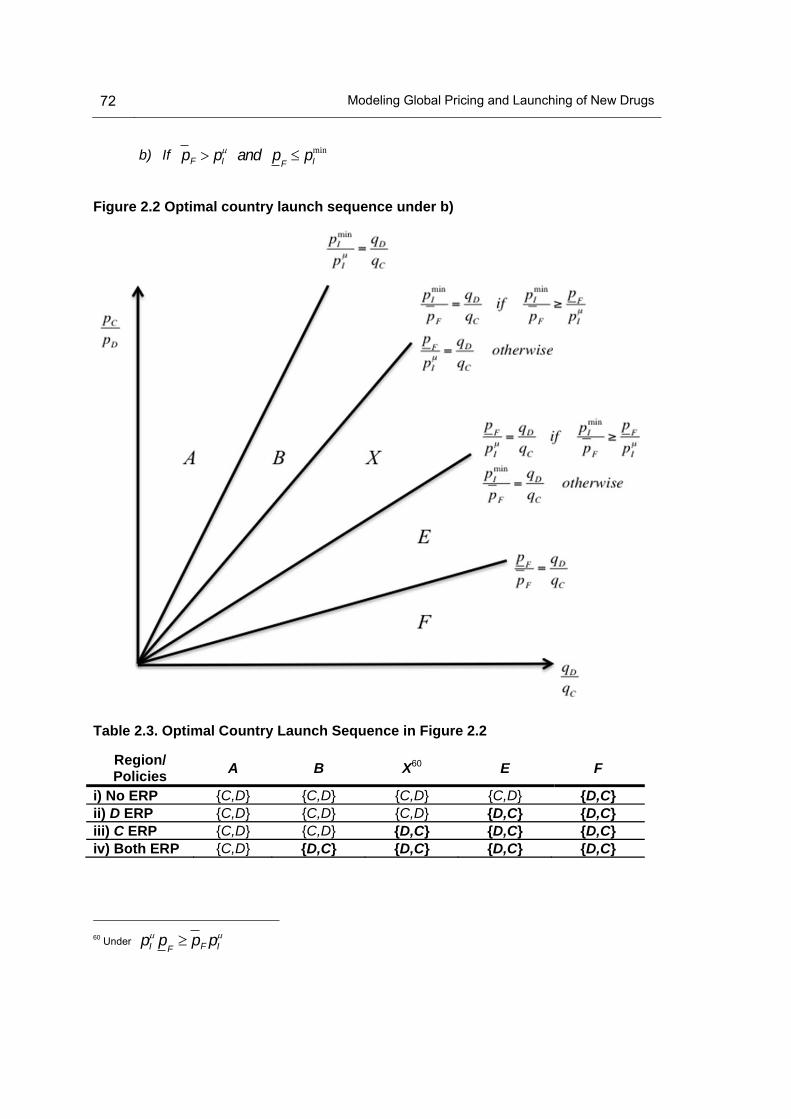
72 Modeling Global Pricing and Launching of New Drugs
b) If pF pI
and pF pI
min
Figure 2.2 Optimal country launch sequence under b)
Table 2.3. Optimal Country Launch Sequence in Figure 2.2
Region/ Policies
A B X60 E F
i) No ERP {C,D} {C,D} {C,D} {C,D} {D,C} ii) D ERP {C,D} {C,D} {C,D} {D,C} {D,C} iii) C ERP {C,D} {C,D} {D,C} {D,C} {D,C} iv) Both ERP {C,D} {D,C} {D,C} {D,C} {D,C}
60 Under pI
pF pF pI

Chapter 2: External Reference Pricing and Pharmaceutical Cost-Containment 73
c) If
Figure 2.3 Optimal country launch sequence under c)
Table 2.4. Optimal Country Launch Sequence in Figure 2.3
Region/ Policies
A B X61 E F
i) No ERP {C,D} {D,C} {D,C} {D,C} {D,C} ii) D ERP {C,D} {C,D} {C,D} {D,C} {D,C} iii) C ERP {C,D} {C,D} {D,C} {D,C} {D,C} iv) Both ERP {C,D} {C,D} {C,D} {C,D} {D,C}
61 Under pI
pF pF pI
pF pI and p
F pI
min

74 Modeling Global Pricing and Launching of New Drugs
d) If pF pI
and pF pI
min
Figure 2.4 Optimal country launch sequence under d)
Table 2.5. Optimal Country Launch Sequence in Figure 2.4
Region/ Policies
A B X62 E F
i) No ERP {C,D} {C,D} {D,C} {D,C} {D,C} ii) D ERP {C,D} {C,D} {D,C} {C,D} {D,C} iii) C ERP {C,D} {D,C} {C,D} {D,C} {D,C} iv) Both ERP {C,D} {C,D} {C,D} {D,C} {D,C}
62 Under pI
pF pF pI

Chapter 2: External Reference Pricing and Pharmaceutical Cost-Containment 75
2.3.2 The firm states the number of QALYs above the true value
This part of the tree has a similar solution to that solved above. For reasons of
brevity, we just highlight the differences.
In this case, if the country applies ERP, as in the previous case, it will not be able
to discover the real value of the drug and it will pay the international reference price ,
which may be higher or lower than the price revealed when applying CEA. However, if the
country decides to apply CEA, it will reveal a lower number of QALYs than those
proposed by the firm . Consequently, the country will pay a lower price than the
price proposed by the firm . Therefore, on the one hand, it is now less likely for the firm
to accept the international reference prices than in the case of being honest, which
implies that countries applying ERP will be more likely to experience launch delays. Also,
the regions under which the firm chooses its optimal launching sequence change (Figures
2.2, 2.3, 2.4 and 2.5). On the other hand, the expected value of the drug price for the
countries will be higher when the firm states a number of QALYs above its true
value than when it does not. The implications of this issue will be explained in section 4.
2.4 Comparing Policies: CEA vs. ERP
In this section, given the optimal countries launch sequence by the firm under PPR
1, 2, 3 and 4, we compare the countries’ welfare under each pricing policy, CEA and ERP,
to know which of them is more convenient for countries. Thus, since we have solved the
problem by backward induction, we have carried out this comparison for each country
given the optimal country launch sequence for the firm. We have made this comparison in
three steps. Firstly, we have compared the best outcome for each country under the same
pricing policy and under the same country launch sequence, i.e., using CEA (ERP) under
{C, D} and {D, C}, respectively. Then, in a second step, we have compared the best
outcomes between ERP and CEA for each country launch sequence. In a third step, we
have compared the best pricing policy under each country launch sequence. Thus, we
have Condition 1. The proof can be checked in Appendix B.
pIh
YiCEA
YFpiCEA
pF
pIh
E[pi ]CEA

76 Modeling Global Pricing and Launching of New Drugs
(2.38)
(2.39)
(2.40)
Condition 1
If country i does not suffer from delay launch under any pricing policy or, under both
pricing policies, country i will be better off applying ERP when the unitary cost of carrying
out CEA is higher than the difference between the international reference pricing and
the expected price of country i under CEA (henceforth, the price difference). In addition,
the smaller the population size is, the more attractive will be the use of ERP, since the
unitary cost of CEA increases.
If country i suffers from delay launch when applying ERP but not under the use of CEA,
the delay cost (r) will make CEA more attractive,
Analogously, if country i suffers from delay launch when applying CEA but not under ERP,
the delay cost (r) will make ERP more attractive,
In order to show graphically Condition 1, we plot the following figure,
pIh
a
qi
pIh E[pi ]CEA
a
qi
pIh E[pi ]CEA r
a
qi
pIh E[pi ]CEA r
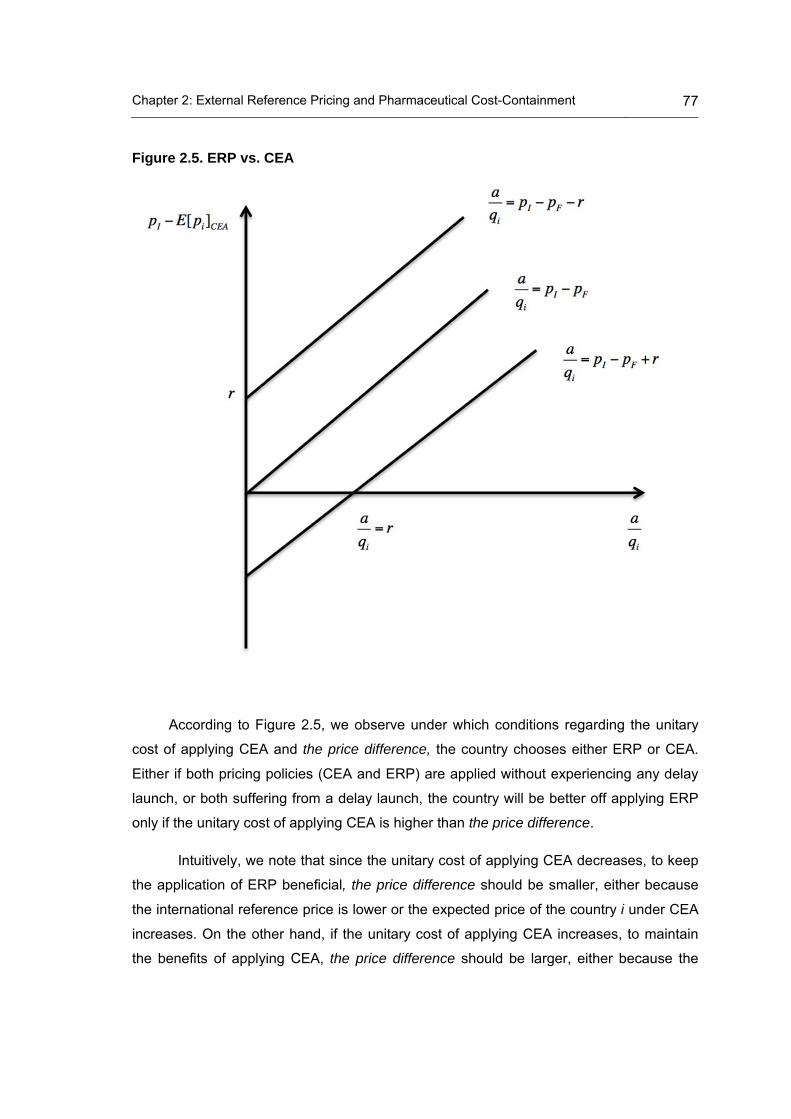
Chapter 2: External Reference Pricing and Pharmaceutical Cost-Containment 77
Figure 2.5. ERP vs. CEA
According to Figure 2.5, we observe under which conditions regarding the unitary
cost of applying CEA and the price difference, the country chooses either ERP or CEA.
Either if both pricing policies (CEA and ERP) are applied without experiencing any delay
launch, or both suffering from a delay launch, the country will be better off applying ERP
only if the unitary cost of applying CEA is higher than the price difference.
Intuitively, we note that since the unitary cost of applying CEA decreases, to keep
the application of ERP beneficial, the price difference should be smaller, either because
the international reference price is lower or the expected price of the country i under CEA
increases. On the other hand, if the unitary cost of applying CEA increases, to maintain
the benefits of applying CEA, the price difference should be larger, either because the

78 Modeling Global Pricing and Launching of New Drugs
international reference price goes up or the expected price of the country i under CEA
decreases.
However, when we compare both pricing policies, on the one hand, if only the
country applying CEA suffers from launch delay, even though the price difference is
higher than the unitary cost of applying CEA, the unitary delay cost associated with CEA
may compensate this higher difference and make ERP more worthwhile. On the other
hand, if only the country applying ERP experiences launch delay, and the unitary cost of
applying CEA is higher than the price difference, the delay cost of applying ERP may
offset a high unitary cost of CEA and make CEA more attractive than ERP for the country.
Then, when the price difference is negative, i.e., the expected price of the country i
under CEA is higher than the international reference price and there is also a launch
delay when applying CEA, ERP will always be chosen by the country. Similarly, if there is
no delay applying CEA, intuitively, the unitary cost of applying CEA must be higher than
the unitary delay cost induced by applying ERP to offset the negative price difference and
therefore to keep ERP attractive, despite the delay launch.
Importantly, we note that the expected price will be higher when the firm
declares a number of QALYs above its true value than when it does not, which implies
that ERP will be more attractive for the countries when the firm is not trusted by countries
i (i = C, D).
2.5 Conclusions
Using a model where one firm sells an on-patent drug to two countries, which
differ in their WtP (ICER), population size, pricing policy (ERP vs. CEA) and ERP formula,
one of our main results is that the optimal country launch sequence depends on the
relative price and the relative country size. The relative price depends on the countries’
pricing policy (ERP or CEA) and the ERP formula.
Given the optimal country launch sequence, our other overall result is that a
country is better off applying ERP instead of CEA if the unitary cost of CEA is higher than
the price difference, i.e., the difference between the international reference price and the
expected price of the country under CEA. The cost of delaying may affect this decision if
only one of the pricing policies is applied with delay. Thus, if ERP is applied with delay,
E[pi ]CEA

Chapter 2: External Reference Pricing and Pharmaceutical Cost-Containment 79
the delay cost will make it less attractive with respect to CEA, and analogously, the same
applies for CEA with respect to ERP.
Basically, the higher the cost of CEA and the lower the international reference
price is, then the more attractive the use of ERP is. In brief, we have compared two
pricing policies: one of them, ERP, does not require any investment, and the other, CEA,
needs an investment of money. In these terms, the smaller the population size is, the
more attractive the use of ERP will be, since the unitary cost of CEA increases.
The application of ERP will be more attractive than CEA when the firm is not
honest, however, it will be more likely to experience launch delays when it is not honest.
Therefore, the convenience, in this case, will depend on how many more QALYs above
the true number the firm states its drug has and the delay cost.
We accept that a wider variety of factors than already used in the model that may
affect the bargaining process. For example, the formulas used to apply ERP may be other
than the average or the minimum, more than two periods could be considered, firms may
offer one single price or launch simultaneously and the effectiveness revealed by CEA
could be different among countries. Also, we accept that assumption 9 constrains the firm
strategy since one price pF is set, the other is implicitly set as well. Besides, other factors
such as the population age structure or the lobbying activity of the pharmaceutical
industry (Abraham, 2002) may also need to be considered.
However, we consider that this chapter has provided insights into the way a
country’s WtP and its pricing policies affect the optimal launch sequence of a firm.
Additionally, given an optimal launch sequence, we propose under what conditions,
regarding country size and pricing policy, it is better off applying CEA or applying ERP for
country i (i = C, D).


3 Chapter 3: Global Pricing and Launching of New Drugs. An Econometric Approach
3.1 Introduction
Pharmaceuticals are sold in a global market that involves a specific bargaining
procedure between pharmaceutical firms and countries’ health agencies. On the one
hand, firms sequentially launch medicines in different countries to maximize global profits,
therefore pricing and launching are their major strategic decisions. On the other hand,
countries’ health agencies implement pricing policies to control their pharmaceutical
expenditure and to guarantee access to medicines. Indeed, pharmaceutical price
regulation is high on policy agendas in several countries, either because countries have
just reformed, intend to reform or question their practices (see Chapter 1 section 1.1).
Among existing drug pricing policies, most countries in the industrialized world have
implemented ERP at some time with the aim of controlling their pharmaceutical
expenditure and ensuring access to medicines, mainly in on-patent medicines (see
Chapter 2 section 2.1).
In this chapter, we aim to analyze the trade-off between pricing and launching and
the impact of ERP policy on pricing and launching from an empirical point of view. We
develop a model that focuses on both issues, controlling for molecules, regulation and
country characteristics. We replicate the study of Danzon and Epstein, published in 2008,
and the study of Verniers et al. published in 2011. Thus, we aim to test how the situation
has changed applying the same methodology to more recent data, and in the case of the
second study, to a different list of countries.
The previous literature concerning the trade-off between pricing and launching has
been already discussed in detail in Chapter 1 in Section 1.2.3 at a theoretical level and in
Section 1.2.4 from an empirical point of view. Furthermore, literature concerning the

82 Modeling Global Pricing and Launching of New Drugs
impact of ERP policy has also been theoretically and empirically discussed in Chapter 1 in
sections 1.2.2 and 1.4.2, respectively. Additionally, in chapter, 2 we developed a
theoretical model that analyses the convenience of applying ERP as an alternative to
CEA as a cost-containment policy on pharmaceutical expenditure. Particularly, chapter 2,
section 2.1, provides insights into the implementation of ERP policy.
In this chapter, we develop a two-equation empirical model consisting of a launch
delay equation and a relative launch price equation. Previously, we replicate two studies
(Danzon and Epstein, 2008, Verniers et al., 2011) using our database to compare their
results with those obtained from our updated data and different list of countries.
We use data from IMS Health database on 56 new molecules launched in 20
countries belonging to 11 therapeutic classes, all of them approved through the
centralised procedure by the EMA, during the study period, 2004-2010. We have
collected yearly inpatient and outpatient sales in euros at ex-manufacturer price and unit
volume (IMS SU).
Our contribution to the previous literature analysed in Chapter 1, section 1.3,
consists of the analysis of data at presentation level63, the consideration of the relative
launch price64 as an endogenous variable in the relative launch price equation, the study
of the launch delay as a duration time variable and the analysis of the inpatient market.
Additionally, we introduce country size and country purchasing power as additional
explanatory variables.
3.2 Data description
In Tables 3.1, 3.2, 3.3, 3.4 and 3.5, we show the descriptive statistics of our
database. 75% of the countries belong to the EMA and 70% of the countries apply ERP.
No all molecules have been launched in all countries. In the retail market countries
belonging to the EMA experience shorter launch delays and pay lower relative launch
price on average than countries out of the EMA. In the hospital market, the pattern of
launch delays is similar to the retail market, while countries belonging to the EMA and
63 We define two products with the same presentation when both products belong to the same molecule i and have the same quantity of active ingredient per standard unit (see definition of standard unit in Chapter 3 section 3.3.2).
64 Defined later in Appendix C.3.
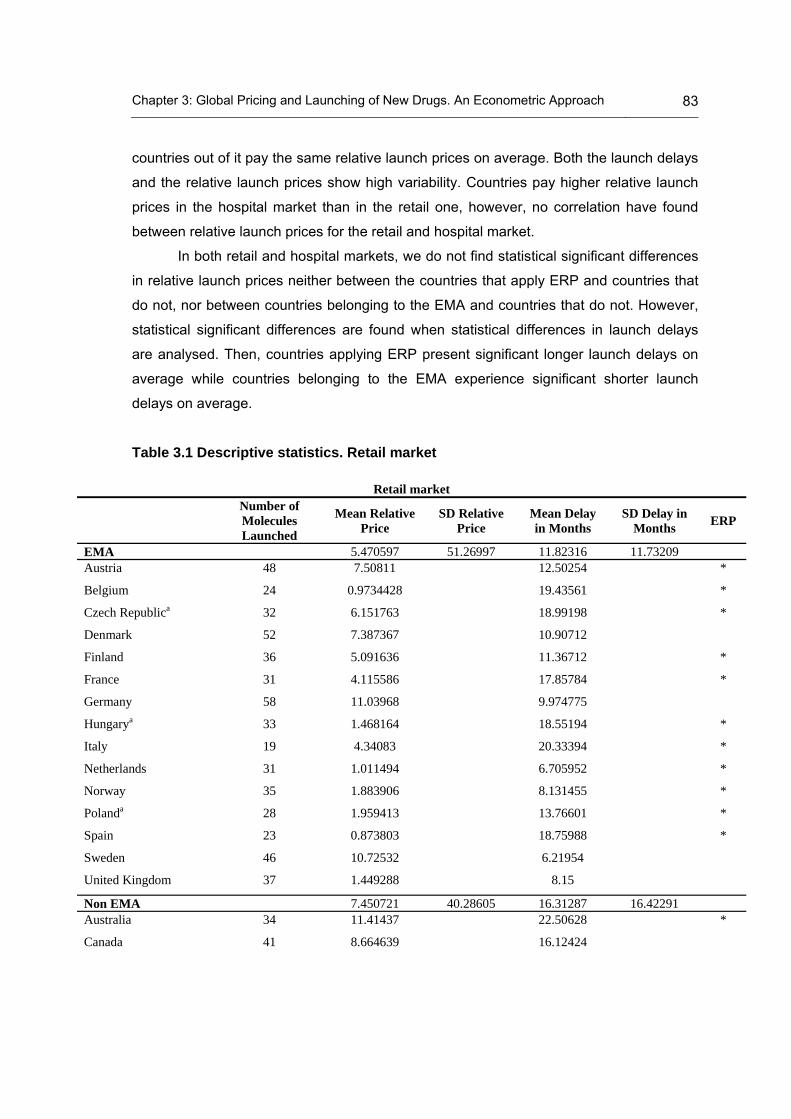
Chapter 3: Global Pricing and Launching of New Drugs. An Econometric Approach 83
countries out of it pay the same relative launch prices on average. Both the launch delays
and the relative launch prices show high variability. Countries pay higher relative launch
prices in the hospital market than in the retail one, however, no correlation have found
between relative launch prices for the retail and hospital market.
In both retail and hospital markets, we do not find statistical significant differences
in relative launch prices neither between the countries that apply ERP and countries that
do not, nor between countries belonging to the EMA and countries that do not. However,
statistical significant differences are found when statistical differences in launch delays
are analysed. Then, countries applying ERP present significant longer launch delays on
average while countries belonging to the EMA experience significant shorter launch
delays on average.
Table 3.1 Descriptive statistics. Retail market
Retail market
Number of Molecules Launched
Mean Relative Price
SD Relative Price
Mean Delay in Months
SD Delay in Months
ERP
EMA 5.470597 51.26997 11.82316 11.73209 Austria 48 7.50811 12.50254 *
Belgium 24 0.9734428 19.43561 *
Czech Republica 32 6.151763 18.99198 *
Denmark 52 7.387367 10.90712
Finland 36 5.091636 11.36712 *
France 31 4.115586 17.85784 *
Germany 58 11.03968 9.974775
Hungarya 33 1.468164 18.55194 *
Italy 19 4.34083 20.33394 *
Netherlands 31 1.011494 6.705952 *
Norway 35 1.883906 8.131455 *
Polanda 28 1.959413 13.76601 *
Spain 23 0.873803 18.75988 *
Sweden 46 10.72532 6.21954
United Kingdom 37 1.449288 8.15
Non EMA 7.450721 40.28605 16.31287 16.42291 Australia 34 11.41437 22.50628 *
Canada 41 8.664639 16.12424

84 Modeling Global Pricing and Launching of New Drugs
Retail market
Number of Molecules Launched
Mean Relative Price
SD Relative Price
Mean Delay in Months
SD Delay in Months
ERP
Japan 27 4.778401 34.7982 *
Switzerland 47 10.82668 15.38667 *
United States 62 7.842861 6.343363
a:CountriesthatjointtheEMAduringthestudyperiod;*:CountriesapplyingERP.
Table 3.2 Descriptive statistics. Hospital market
Hospital market
Number of Molecules Launched
Mean Relative Price
SD Relative Price
Mean Delay in Months
SD Delay in Months
ERP
EMA 12.43664 71.40279 11.42848 11.38087 Austria 44 14.05914 12.04966 *
Belgium 22 18.32661 16.71733 *
Czech Republica 31 16.08996 19.83333 *
Denmark 52 11.27124 11.44528
Finland 35 15.11979 9.185088 *
France 30 12.74718 17.39222 *
Germany 56 12.88087 10.01222
Hungarya 28 15.39054 20.26437 *
Italy 19 10.99761 22.70952 *
Netherlands 31 8.352865 7.192381 *
Norway 35 13.02232 7.750926 *
Polanda 25 8.212163 13.00641 *
Spain 22 12.09223 18.39067 *
Sweden 46 16.21124 7.570139
United Kingdom 36 4.784038 8.495
Non EMA 13.32901 60.59304 16.25211 16.42291 Australia 34 20.39585 21.96126 *
Canada 36 9.132268 15.19402
Japan 27 2.832625 32.43333 *
Switzerland 45 16.75053 15.06879 *
United States 62 11.91477 4.975661
a:CountriesthatjointtheEMAduringthestudyperiod;*:CountriesapplyingERP.

Chapter 3: Global Pricing and Launching of New Drugs. An Econometric Approach 85
Table 3.3 Relative prices Pearson correlation. Retail and hospital market
Retail market Hospital market Retail market 1
Hospital market -0.0192 1
p-value 0.7349
Table 3.4. Bivariate Test. ERP vs. No ERP
Price Delay Group / Market Retail market Hospital market Retail market Hospital market
Mean Mean Mean Mean ERP 5.015412 11.16336 16.19557 17.42601 NO ERP 8.090827 13.10127 9.252808 9.14058 p-value 0.2155 0.5698 0.0000 0.0000
Table 3.5. Bivariate Test. EMA vs. No EMA
Price Delay Group / Market Retail market Hospital market Retail market Hospital market
Mean Mean Mean Mean EMA 5.470597 12.48235 11.82316 13.53388 NO EMA 7.450721 12.48235 16.31287 17.3578 p-value 0.4284 0.9945 0.0000 0.0000
3.3 Replicating Danzon and Epstein (2008)
In this section, we replicate the study by Danzon and Epstein (Danzon and
Epstein, 2008) (D&E, henceforth) with our updated database to compare their results with
those obtained from our more recent data. D&E data cover the years 1992-2003 for 111
molecules in 15 countries belonging to 12 therapeutic classes. Our data cover the period
2004-2010 for 71 molecules in 20 countries belonging to 11 therapeutic classes. The
same data treatment and methodology conducted by D&E have been implemented on our
database.
3.3.1 The D&E model
D&E estimate separately a launch proportional hazard and a launch price
equation. They first estimate a launch proportional hazard model based on a clog-log
regression with molecule-clustered standard errors. They also estimate a random effects
clog-log model to test for molecule-level heterogeneity. Subsequently, the marginal
86 Modeling Global Pricing and Launching of New Drugs
effects for each independent variable are calculated. Particularly, the marginal effects for
continuous covariates are calculated as the Average Marginal Effect (AME). By contrast,
the marginal effect for a categorical covariate is the discrete change from the base level
(x=0) to the level referring to the presence of the attribute (x=1).
Then, a launch price model is estimated under a Heckman two-step procedure
(Heckman, 1979) to account for possible selection bias produced by the correlation
between the propensity to launch and the launch price. In the first-stage, the launch
proportional hazard model described above is estimated. Then, the Inverse Mills Ratio
(IMR) (Lee, 1983)65 is calculated and introduced as a control variable in the launch price
equation. This equation is estimated by OLS with molecule-clustered standard errors. Its
dependent variable is the logarithm of the volume-weighted mean price for each
molecule-country-year observation. To account for unobserved molecule characteristics,
they also report results from a GLS molecule random effects estimator.
3.3.2 Data
D&E use data from IMS Health’s Midas database on drugs in 15 countries for 12
therapeutic classes, all of which experienced the launch of a new subclass shortly before
or during the study period, 1992-2003. D&E collect quarterly data on outpatient sales at
ex-manufacturer prices and unit volume (IMS SU)66. After the data were screened for
internal consistency, revenue was adjusted for inflation using country-quarter specific
Producer Price Indexes (PPI) available from the International Monetary Fund (IMF), with
2003 as the base year, and converted to US dollars using the average 2003 country-
specific exchange rate. Price per dose for each drug was calculated on a quarterly basis
as the ratio of total revenues to SU sold67.
65 The IMR for molecule i in country j and time t, Mijt, is calculated using the predicted probability of launch p̂ijt from a
clog-log regression as Mijt [1( p̂ijt )]
( p̂ijt ), where is the standard Normal density function and is the standard
Normal distribution function.
66 The IMS SU is a proxy for a dose for each formulation e.g. one tablet or capsule, 5ml. for liquids. The IMS price data for the US do not reflect off-invoice discounts given by manufacturers to health plans and hence are upward biased for manufacturer net revenues.
67 Multiple form-3 level formulations are combined (e.g. tablets and capsules, possibly of different strength) in a given country and quarter into a single observation and define the price as the volume-weighted average price per unit. Identical forms that were launched by different co-marketing companies were also averaged.
[] ()

Chapter 3: Global Pricing and Launching of New Drugs. An Econometric Approach 87
We also use data from IMS Health database. However, we only consider new
launch drugs. Our data corresponds to 20 countries for 11 therapeutic classes during the
period 2004-2010, all of them approved by the centralised procedure of the EMA. We
have also collected outpatient sales at ex-manufacturer price. Differently from D&E, our
frequency is yearly. The same procedure as D&E is applied for the inflation adjustment
using the PPI available from the IMF; however, we use 2005 as the base year.
Furthermore, since we collected the prices in euros, they have been converted into USD
dollars applying the exchange rates from the IMF. The drug price has been calculated as
in D&E. Although D&E distinguish between Superior and Inferior molecules, we have not
taken into account such a difference, since we have only included new launch drugs,
therefore, we will compare the D&E results from Superior subclasses with our regression
results, as our new launch drugs may never belong to an Inferior (old) subclass as
defined by D&E. D&E classify countries into three categories: high-price EU, low-price EU
and high-price non-EU, with Germany being the reference country. Since the sample of
countries is not exactly the same, the number of countries by category where the
molecule has been previously launched cannot be directly compared.
In Appendix C.1, we report the variable definitions and why certain variables have
not been included in our updated model. In Tables C.1 and C.2, we show the comparison
between the results from D&E and our model.
3.3.3 Comparison of results
3.3.3.1 Launch equation
The sample of D&E is larger than in our updated model (23.400 vs. 3609) because
their study period was longer, the number of molecule-level clusters was larger (111 vs.
71), and as we mentioned our data are yearly and the data of D&E are quarterly. This
could have implications for the results. Results commented below are shown in Table C.1.
In the D&E model, the number of high-price EU and non-EU countries where the
molecule is launched and competitor drug prices appear as robust predictors of the
launch delay of a molecule. Therefore, the more the molecule is spread in high-price
countries, the higher is the propensity to launch, while firms seem to delay launch in low-
price EU countries until launch has occurred in high-price EU countries. In our updated

88 Modeling Global Pricing and Launching of New Drugs
model, we find similar results, on the one hand, as we only find effects in high-price EU
countries68, we may state that firms delay launch even in high price non-EU countries until
launch has occurred in high-price EU countries. On the other hand, we have not been
able to include the competitor drug prices in the updated model as we explain in detail in
the Appendix C.1. Furthermore, the launch delay is significantly related to the time
elapsed since the global launch in both models. However, this negative effect is offset
when the launch delay is very long under the D&E model (positive quadratic effect), while
in the updated model, the quadratic effect is not statistically significant.
With the aim of analyzing the spillover effects, D&E consider the number of
countries where the drug has already been launched as an explanatory variable of the
propensity of launch. The authors distinguish between different groups of countries using
specific country dummies, e.g. Germany or UK make up one group, and Sweden and the
Netherlands another. In the updated model, since both studies have different countries,
we have grouped the five D&E variables into three, according to an alternative
specification of D&E69. Though variables in D&E and our updated model are not exactly
comparable, we observe that the marginal effect of having launched in high-price EU and
high-price non-EU countries is positive and statistically significant, while the marginal
effect of having launched in low-price EU is significant and negative. These results also
support the hypothesis that launch in low-priced EU countries is adversely affected by the
risk of spillovers to higher-price EU and non-EU countries through ERP and PT. We may
conclude that firms delay launch in low-price EU countries until launch has occurred in
higher-price EU and non-EU countries. Our results support more strongly this hypothesis
than the D&E model, due to the negative effect of launching in a low-price EU country on
the propensity of launch.
Concerning the types of firm, in D&E the three types of firm considered are
statistically significant and positive. Therefore, launch is more likely for molecules from
firms that are domiciled domestically. Indeed, the marginal effect of being a Local
Originator firm on the propensity of launch is greater than being a Solo Licensee or Co-
marketer. This evidence supports the hypothesis that Local Originators have local R&D
68 In Table C.1 only the variable Num Already Launched (Spain, Portugal, Greece) is not statistically significant. See explained in the next paragraph how countries have been grouped in D&E and in our updated model.
69 This specification distinguishes among high-price EU, low-price EU and high-price non-EU countries.

Chapter 3: Global Pricing and Launching of New Drugs. An Econometric Approach 89
activities, and are, thus, likely to be larger, have greater regulatory expertise and are
viewed as more valuable to the local economy than Co-marketers, with Solo Licensees in
the middle. In the updated model, being a Local Corporation, either Originator or Solo
Licensee, does not present differences in launching.
When introducing the country-fixed effects, taking Germany as reference, we
observe a similar pattern in both models with marginal effects statistically significant and
negative. Indeed, Germany enjoys earlier drug launches on average than the rest of
countries. In both models, therapeutic class Fixed-effects are included and are significant.
However D&E do not report these results, so we have not compared them.
Regarding alternative specifications, the clog-log with random effects estimates
are generally similar to the clog-log estimates with robust clustered standard errors. The
country-fixed effects are mostly not statistically significant under random effects.
3.3.3.2 Launch price equation
The sample of D&E has a similar size to our sample (950 vs. 762) because
although our study period is shorter and the number of molecule-level clusters is smaller
than that of D&E (109 vs. 71), we analyse the data at pharmaceutical presentation level,
while D&E conduct their study at molecule level. Both R-Squared are high (0.89 vs. 0.87).
Results commented on below are shown in Table C.2. D&E focus on estimates that
include GDP per capita; excluding GDP changes mainly the country fixed-effects. Year
fixed-effects are also included. However, D&E omit the therapeutic class effects because
they are highly collinear with competitor prices and because of the order of entry within
class. Since our model does not include either the competitor prices variable or the order
of entry within class variable (see Appendix C.1.), there will not be any collinear problems.
We have been able then to include the therapeutic class effects in our updated model.
First, we observe that launch prices are influenced by the propensity to launch70,
since the IMR presents a statistically significant coefficient; however, the launch delay
does not affect the drug pricing in either D&E or the updated model. Concerning other
explanatory factors affecting launch prices, according to the D&E model, the price of
established products in a country is significantly related to the launch price of new 70 D&E do not report the coefificent for the IMR in Table C.2, but its significance is reported in the text.

90 Modeling Global Pricing and Launching of New Drugs
products. Also, the order in which a molecule is launched in each country-subclass
influences positively the launch price. However, as in the launch equation, we have not
been able to include these variables in our updated model as we explain in detail in
Appendix C.1.
In both models, launch prices increase with the minimum price previously set in
other high-price EU country. However, the effect on launch prices of the minimum price
previously set in high-price non-EU countries is different under each model, positive under
the D&E model and negative under ours. Only our updated model reports a significant
and positive effect from a minimum price set in low-price EU countries. Furthermore, if
prices in high-price EU countries are missing, it also affects positively the launch price.
This could indicate that countries setting the launch price with no reference in the EU may
pay high launch prices. We note that when we estimate with random effects, the effects
from low-price EU and high-price non-EU countries become statistically significant. Then,
we observe that the lowest price previously set in other low-price EU country affects
positively the launch price but more slightly than the effect from the high-price EU country
price. Interestingly, both the minimum price previously set in a high-price non-EU country
and the absence of a minimum price from high-price non-EU countries affect negatively
the launch price. This may indicate that spillover effects also occur either between EU and
non-EU countries or among non-EU countries. Furthermore, since the effect of the former
is greater, it may show that the net effect on the launch price of a previous launch in at
least one high-price non-EU country is positive. On the other hand, the absence of a
minimum price from low-price EU countries means countries do not have a reference from
this type of countries, and therefore it cannot be included into their reference basket,
which results in paying higher prices than if prices from low-price EU countries were
available. The results from the updated model with clustered standard errors support the
occurrence of spillover effects from high-price EU countries to low-price EU countries, and
therefore, that the ERP only concerns EU countries. However, the updated model with
random effects supports the suggestion that spillover effects occur in all directions.
In both models, per capita income does not seem to statistically affect the launch
price. Concerning the type of firms, under our updated model the drugs sold by a Solo
Licensee firm obtain lower launch prices than drugs sold by other types of firms. D&E do
not find any significant effect related to the type of firm.

Chapter 3: Global Pricing and Launching of New Drugs. An Econometric Approach 91
Furthermore, regarding the product’s characteristics, the effect of strength, as
expected, is slightly statistically significant and positive, while the packsize affects
negatively the launch price. Under the updated model, strength seems to not have any
significant effect on the launch price. However, we have not included the variables related
to packsize in the updated model as we explain in detail in the Appendix C.1. When
introducing the administration route, the more robust result in both models is that
injectable drugs are statistically more expensive than other types such as oral solid
formulations.
In the launch price equation, both models found some launch price differences
among countries. The observed pattern is that all significant coefficients are negative;
Germany seems to present higher prices on average than the rest of the countries. The
random effects in the D&E model show that some country dummies are positive.
However, our updated model does not support the hypothesis that firms sell drugs at
single price in order to avoid spillovers effects.
As mentioned earlier, D&E do not include the therapeutic class fixed-effects due to
collinear problems with variables. Since our updated model does not include either the
competitor prices variable or the order of entry within class variable, there will not be any
collinear problems. We have been able to include the therapeutic class effects in our
updated model. We have taken the ATC-A (Alimentary tract and metabolism) as
reference and we have found some significant fixed-effects; however, in none of the
models year fixed-effects were significant.
3.4 Replicating Verniers et al. (2011)
In this section, the methodology conducted in a study published by Verniers et al.
in 2011 (Verniers et al., henceforth) (Verniers et al., 2011) is applied to our database to
compare whether results have changed due to the use of more recent data (2010 vs.
2008) and if the results are still robust using a different choice of the list of countries. They
applied their model to a set of a large set of countries, rich and poor, and we restrict our
application to developed countries.
3.4.1 The Verniers et al. model
Verniers et al. consider, on the one hand, the launch window of drug i in country j

92 Modeling Global Pricing and Launching of New Drugs
(3.1)
(b)
( ), defined as the difference, in months, between the first worldwide launch and the
subsequent launch in the specific country j. The launch price is defined as the natural-
logarithm-transformed of the ex-manufacturer price at launch per gram of drug i in country
j ( ). Verniers et al. consider that censoring occurs for drug-country combinations for
which we do not observe a launch at the end of the observation window. Censoring time
(Cij) is defined as the time between the drug- and country-specific launch date and the
end of the observation period. Since the actual values of and are not observed
because right censoring is present, observed values are denoted by and such
that,
Moreover, we only observe the observations for which and thus .
The structural equations are:
LWij* 1LPij
* 2 (LPij*)2 'Zij1 uij1
LPij* 1LWij
* 2 (LWij*)2 'Zij 2 uij 2
where Zij1 and Zij1 are defined as additional explanatory variables. Zij1 comprises the
country size, the health expenditure per capita and the use of certain pricing policies such
as the ex-manufacturer price regulation, the profit control, the ERP, the internal RP and
the pharmaco-economic regulation. Also, it comprises the strength of patent protection,
the EMA and the firm’s home country variables. Additionally, it comprises the four
dimensions identified by Hofstede (Hofstede, 1984, Hofstede, 2001): uncertainty
avoidance, masculinity, individualism and power distance. The variable of competition and
the variable of summer are also comprised in this Zij1 variable. Zij2 includes the same
variables of Zij1 except from the summer and the EMA variable. However, it further
includes the inflation rate and the daily dosage (DDD).
LWij*
LPij*
LWij* LPij
*
LWij LPij
LWij* Cij LPij LPij
*
(a)
(3.2) (b)
(a)
* *
ij ij ij ij
ij ij
LW LW if LW C
LW C otherwise

Chapter 3: Global Pricing and Launching of New Drugs. An Econometric Approach 93
Following Garen (1984) (Garen, 1984), Verniers et al. consider the launch window
and the launch price as endogenous variables. Therefore, the firm and the regulator may
both decide a launch window with the goal of influencing the launch price and select the
level of launch price also with the goal of influencing the launch window. The omitted
variables in the error terms of the launch window and launch price equations include non-
observable strategic variables used by the firm and the regulator to select the optimal
value for the launch window and launch price, respectively. These strategic variables
would be expected to correlate with the launch price and the launch window,
correspondingly.
Verniers et al., to account for the endogeneity between the launch prices and
launch window, estimate a system of simultaneous equations using a three-stage least
squares (3SLS) procedure, as in Bayus et al. (Bayus et al., 2007). Additionally, the
authors correct for right-censoring and selectivity using the procedure described in Vella
(Vella, 1993) or Wooldridge (Wooldridge, 2002). Random country effects are included in
the equations to account for the fact that there are repeated observations across
countries for most drugs.
On the one hand, to estimate the structural launch window equation, they first
estimate the reduced form of the launch price equation by a Tobit regression of the
second type (to account for the fact that we only observe prices if the drug has already
been launched). This launch price equation contains two variables that influence launch
price but not launch window, namely the defined DDD and the inflation rate, which serve
as instruments for the launch price in the launch window equation. The generalized
residuals of the reduced launch price equation are added to the launch window equation
as a correction term. However, we only use one instrument in our updated model, since
we have not been able to calculate DDDs in our database71. On the other hand, to
estimate the structural launch price equation, Verniers et al. first estimate the reduced
form of the launch window equation by a Tobit regression of the first type (to account for
right censoring). This launch window equation contains two variables that influence
launch window but not launch price, namely, summer and ema, which serve as
instruments for the launch window in the launch price equation. In this case, we have
71 For some molecules of our database, the DDD depends on patient characteristics. Therefore, a unique DDD for each molecule could not be used.

94 Modeling Global Pricing and Launching of New Drugs
included both instruments in our model. The generalized residuals of the reduced launch
window equation as a correction term are added to the launch price equation.
3.4.2 Data
Verniers et al. collect data from the IMS Health database on drugs in 50 countries
(see Table C.3 in Appendix C.2) for 5 therapeutic classes, all of which experienced a
launch during the study period, 1994-2008. They have collected yearly data on outpatient
sales at ex-manufacturer prices. Price per gram in US dollars for each drug has been
calculated. To make drug prices comparable across countries, the drug prices in local
currencies were converted to US dollars using the currency conversion rate at launch.
We also use data from IMS Health database. However, we only consider the new
launch drugs in 20 developed countries for 11 therapeutic classes during the study period
2004-2010, all of them approved by the centralised procedure of the EMA. We have also
collected outpatient sales yearly at ex-manufacturer price. Since we have collected the
prices in euros, euros have been converted into US dollars applying the exchange rates
from the IMF. Finally, the drug price has been calculated as done by Verniers et al. Thus,
we also use the price per gram in US dollars for each in order to make results
comparable.
In Appendix C.2, we report the variable definitions. We distinguish among those
variables that we define as in Verniers et al and those that we cannot use or we define
differently. In Table C.4, we show the results from both models to be compared.
3.4.3 Comparison of results
3.4.3.1 Launch window equation
The sample of Verniers et al. is larger than our sample (1711 vs. 505) because
their study period is longer and the sample of countries is larger (50 vs. 20). As expected,
in both models, launch price affects negatively the launch window, i.e., the higher the
price a country pays for a drug, the shorter the delay the country will suffer. Also, both
models find a positive quadratic effect that offsets the above mentioned negative effect
(U-shaped effect). Furthermore, both models find a positive and significant coefficient of
the selectivity variable, suggesting endogeneity of prices in the launch equation. This

Chapter 3: Global Pricing and Launching of New Drugs. An Econometric Approach 95
finding may indicate that health regulators act strategically in delaying market access for
expensive drugs, which is against the interests of the drug company.
Concerning the regulation variables, although researchers have not examined the
direct effect of profit control on launch window, Verniers et al. argue that it may slow
market access. However, in our updated model, profit control regulation seems to affect
the launch window negatively. Indeed, the only country applying profit control in our
dataset is the UK, which does not suffer particularly from long launch delays. ERP72 may
show counterintuitive effects (Hunter, 2005). First, when a country applies ERP, firms will
try to gain market access as early as possible to minimize the number of reference
countries. Second, ERP may push prices upward rather than downward. Typically,
regulators that seek early drug access are more willing to agree to higher prices. Thus,
the likelihood of a reference country having a high price is higher early in the life cycle
than it is later on, as we discussed in chapter 2. Consequently, the reference set of a
country is likely to contain a greater number of countries with high prices early in the life
cycle as compared to later in the life cycle. Our updated model shows a significant and
negative coefficient for this regulation variable; therefore, it confirms the hypothesis
proposed by Verniers et al. As said by Verniers et al., typically, therapeutic referencing
delays launch because the administrative procedure requires an examination of
therapeutic similarities, delaying market access. However, and contrary to the results
obtained by Verniers et al., our updated model reports a negative and significant
coefficient for this variable. Therefore, those countries using therapeutic reference pricing
experience shorter launch delays.
Pharmacoeconomic evidence, in addition to the clinical evidence required to gain
therapeutic approval from institutes such as the FDA (Food and Drug Administration) or
EMA, also requires evidence on the cost effectiveness of the drug in the local population,
and it must be submitted according to complicated administrative procedures. This
requirement often causes a delay in market access similar to therapeutic reference pricing
(Wilking et al., 2005) as we discusses in chapters 1 and 2. Results reported by our
updated model seem to support the results and the hypothesis proposed by Verniers et
al.
72 This variable is named by Verniers et al.as Cross-country reference pricing.

96 Modeling Global Pricing and Launching of New Drugs
Concerning the strength of patent protection, it is known that high strength of
patent protects the firm from bio-equivalent price competition. Thus, a higher strength of
patent protection in a country may yield quicker access to drugs. In both models, those
countries with strong patent protection show shorter launch delays.
Other country characteristics considered are population size, health expenditure
per capita and dummies for the firm’s home country. The bargaining power given by the
population size is shown in our updated model since the effect of this variable is
significant and negative. Therefore, it supports the hypothesis and the results shown by
the Verniers et al. model. Regarding health expenditure per capita, Verniers et al. propose
that firms may be more eager to launch in countries with high health expenditures per
capita, as these countries may have a more favourable attitude towards new drugs.
However, higher health expenditures per capita could lower health regulators’ aspirations
to provide quick market access to new drugs (Comanor and Schweitzer, 2007). In both
models, the effect of health expenditure per capita on the launch window is significant and
positive, supporting the second idea proposed by Verniers et al. Concerning a firm’s
location, under the Verniers et al. model, firms with a greater familiarity with the home
market's therapeutic needs or health regulators' favouritism toward these firms may lead
to a faster launch (Kyle, 2006). In this case, both models support the hypothesis
described above.
A variable exclusively affecting the launch window is the dummy equal to one if the
country belongs to the EMA. According to Verniers et al., belonging to the EMA should
affect negatively the launch window. Although market access and price negotiations take
place at country level, the drug approval process in Europe is centralized. It is expected
that launch windows in EMA countries are shorter than those in non- EMA countries
because of differences in administrative efficiencies. Again, the Verniers et al. model
supports this hypothesis while our updated model shows a high significant positive effect
(countries not belonging to the EMA enjoy shorter launch delays than countries belonging
to the EMA). This could be due to the differences in the sample of countries. In our
database, only countries not belonging to the EMA are high-price countries. In the
Verniers et al. database there are a lot of low-price countries and very low-price countries.
Out of the four dimensions identified by Hofstede (Hofstede, 1984, Hofstede,
2001)) concerning a country’s national culture- uncertainty avoidance, masculinity,
Chapter 3: Global Pricing and Launching of New Drugs. An Econometric Approach 97
individualism and power distance (defined in Appendix C.2) – only the masculinity and the
power distance present the same effects in both models and support the hypothesis
stated by Verniers et al., the more masculine the society is and the more bureaucratic it is
(higher power avoidance), the longer the launch window is. Verniers et al. expected and
showed that, on the one hand, low subjective health perceptions (high level of uncertainty
avoidance) may encourage health regulators to allow prompt access to new drugs and to
be less price sensitive, and on the other hand, countries showing a greater satisfaction
toward health care and spending more money on healthcare (high level of individualism)
enjoy shorter launch windows than collectivist countries. However, our updated model
presents the opposite effects.
Finally, the drug therapeutic fixed-effects (not reported) seem to be statistically
significant under the Verniers et al. model and in our updated model.
3.4.3.2 Launch price equation
Regarding the explanatory factors of the launch price equation, under our updated
model, the launch window does not seem to affect the launch price, while the Verniers et
al. model finds a significant and positive effect (negative for the quadratic term) as
expected under their hypothesis. Indeed, Verniers et al. propose an inverted U-shaped
effect of launch window on launch price in which launch price is highest for moderate
launch windows. For these moderate launch windows, a firm can still make money under
patent protection if the price is high enough to make up for local market entry
expenditures. For very short launch windows, a firm will accept a lower launch price more
easily because the drug enjoys a full lifetime under patent protection, so the firm can
recover R&D expenditure and gains resources for international market access
immediately. For very long launch windows, a firm and a health regulator will agree more
easily on a relatively low launch price as a prelude to generic competition.
Regarding the regulation variables, neither of the models find any significant effect
on launch prices, except from the strength of patent protection, where only the Verniers et
al. model finds a negative and significant effect as expected: stronger patent protection
may impose a downward pressure on launch prices because pharmaceutical firms can be
more lenient on prices if there is sufficient time left under patent protection to recover
R&D expenditure.

98 Modeling Global Pricing and Launching of New Drugs
Among other country characteristics considered such as population size, health
expenditure per capita and the firm home’s country, only the firm home’s country seems
to be statistically significant and positive, but only under the Verniers et al. model,
supporting their hypothesis. As previously mentioned, a greater familiarity with the home
market's therapeutic needs or health regulators' favouritism toward these firms may lead
to a higher launch price (Wagner and McCarthy, 2004). The drug therapeutic fixed-effects
(not reported) are not statistically significant.
3.5 New Pricing and Launching Model (NPLM)
3.5.1 The Model
We estimate the launch delay and the relative launch price equations separately,
and each of them is estimatedfor retail and for hospital distribution channels. We have
also tried to estimate a system of both equations to account for endogeneity. However,
the available instrument of the relative launch price equation is weak73.
We use a parametric duration model of the hazard of launching in time t, given the
observed explanatory variables, with right-censored data to model the launch delay of the
molecule i in country j, which is defined as the time elapsed in months from the first global
launch of the molecule i and its launch in country j. We have specified the shape of the
hazard rate, i.e. its time-dependency, with a Weibull distribution that assumes a
monotonic hazard with respect to time. Since we have not been able to observe all
variables affecting the launch delay, we have controlled for the unobserved heterogeinity
introducing a gamma frailty distribution for the random error term, The model selection
has followed the method proposed by Kiefer (Kiefer, 1988) (see Appendix C.4). We
estimate a right-censored model since all the drugs in our data set were launched
between January 2004 and December 2010; however, not all drugs had been launched in
all 20 countries by the end of our observed period. Therefore, our data contain right-
censored observations. Our parametric duration model for the hazard of launching does
not allow the use of time-varying covariates74; instead we have used the data collected in
73 We selected the variable inflation as the instrument for the launch price in the launch equation. The correlation between inflation and launch price was weak (0.02), therefore, we should not use it as instrument.
74 Since we reject the null hypothesis of the log-rank test, then the assumption of proportional hazard is not satisfied, we should not neither incorporate time-varying nor use the standard Cox regression. Furthermore, the extended Cox model allows incorporating time-varying covariates but we should not use it since it does not allow incorporating censoring.
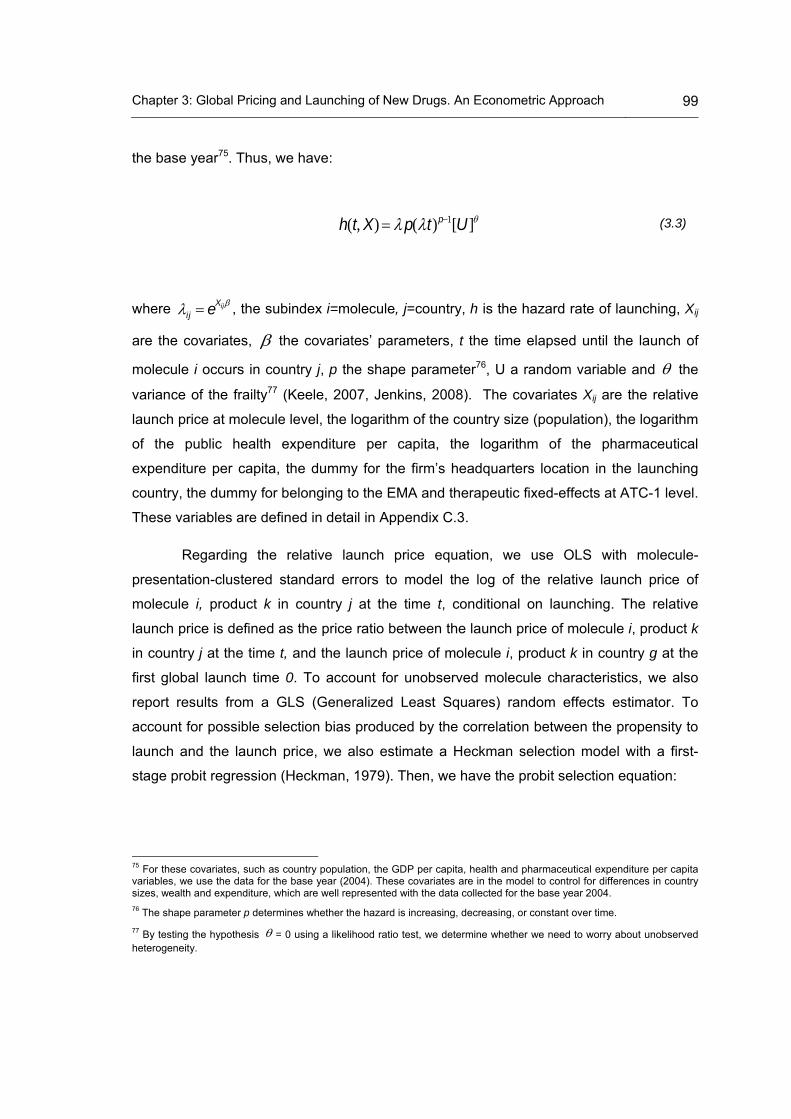
Chapter 3: Global Pricing and Launching of New Drugs. An Econometric Approach 99
the base year75. Thus, we have:
where , the subindex i=molecule, j=country, h is the hazard rate of launching, Xij
are the covariates, the covariates’ parameters, t the time elapsed until the launch of
molecule i occurs in country j, p the shape parameter76, U a random variable and the
variance of the frailty77 (Keele, 2007, Jenkins, 2008). The covariates Xij are the relative
launch price at molecule level, the logarithm of the country size (population), the logarithm
of the public health expenditure per capita, the logarithm of the pharmaceutical
expenditure per capita, the dummy for the firm’s headquarters location in the launching
country, the dummy for belonging to the EMA and therapeutic fixed-effects at ATC-1 level.
These variables are defined in detail in Appendix C.3.
Regarding the relative launch price equation, we use OLS with molecule-
presentation-clustered standard errors to model the log of the relative launch price of
molecule i, product k in country j at the time t, conditional on launching. The relative
launch price is defined as the price ratio between the launch price of molecule i, product k
in country j at the time t, and the launch price of molecule i, product k in country g at the
first global launch time 0. To account for unobserved molecule characteristics, we also
report results from a GLS (Generalized Least Squares) random effects estimator. To
account for possible selection bias produced by the correlation between the propensity to
launch and the launch price, we also estimate a Heckman selection model with a first-
stage probit regression (Heckman, 1979). Then, we have the probit selection equation:
75 For these covariates, such as country population, the GDP per capita, health and pharmaceutical expenditure per capita variables, we use the data for the base year (2004). These covariates are in the model to control for differences in country sizes, wealth and expenditure, which are well represented with the data collected for the base year 2004.
76 The shape parameter p determines whether the hazard is increasing, decreasing, or constant over time.
77 By testing the hypothesis = 0 using a likelihood ratio test, we determine whether we need to worry about unobserved heterogeneity.
h(t, X) p(t)p1[U]
ij eXij
(3.3)

100 Modeling Global Pricing and Launching of New Drugs
P(Lijkt 1) 0 ijkt Xijkt Uijkt
where the subindex i=molecule, j=country, k=product and t=year. Then, Lijkt is a
dummy variable equal to 1 if the molecule i has been launched in country j at time t.
Then, Xijkt is the vector of explanatory variables and Uijkt is the random term.
The explanatory variables in this model are: the launch delay of molecule i in
country j, the logarithm of the GDP per capita of country j at time t, country size
(population) of country j at time t, public heath expenditure per capita of country j at time t,
pharmaceutical expenditure per capita of country j at time t, the dummy for the use of
ERP policy in country j, the firm’s home country=1 if the headquarters’ firm of launching
the molecule i is located in country j, EMA=1 if the country j belongs to the EMA at time t
and the ATC fixed-effects of molecule i. These explanatory variables are defined in more
detail in Appendix C.3. See results in Table C.6 Appendix C.3.
The relative launch price equation is:
RPijkt Pijkt
Pizg0
0 'Zijkt Vijkt
where the subindex i=molecule, k=product, j=country, g=country where first global
launched occurred and t=year. Then, is the relative launch price, is the launch
price in country j at time t, and is the launch price in country g at the first global launch
time 078. Then, is the vector of explanatory variables and is the random term.
The explanatory variables in this model are the same that in the probit selection
model besides the square of the launch delay, the year fixed-effect and the IMR from the
selection probit equation (see Appendix C.3. for definition).
78 When two countries or more experience the first global launch, i.e., country g is represented by two or more countries, then is calculated as the weighted-volume average of the price of each country g.
RPijkt Pijkt
Pijko
Zijkt Vijkt
Pijko
(3.5)
(3.4)
Chapter 3: Global Pricing and Launching of New Drugs. An Econometric Approach 101
We mainly focus on the effect of launch price on the launch delay and vice versa,
and on the effect of the application of ERP on both the launch price and the launch delay.
We expect that countries paying high prices experience short launch delays (see Chapter
1, sections 2.1 and 3.3.1) and in turn, that countries suffering from launch delays pay
lower relative launch prices (see Chapter 1, sections 2.1 and 3.2.1). We also expect that
applying ERP is effective, so countries applying this pricing policy suffer from longer delay
launch (see Chapter 1 sections 2.2 and 3.3.3) and pay lower relative launch prices (see
Chapter 1, sections 2.2 and 3.2.3)
To show this, we have controlled for country characteristics regarding the
bargaining power of the country, such as the country size and the country purchasing
power (GDP) (see Chapter 1 sections 3.2.4 and 3.3.4). We expect that countries with a
large population experience short launch delays and pay lower prices for new drugs, while
countries with high-incomes have quicker market access but are expected to pay higher
prices. Other country features concern health investment and the attitude of firms towards
countries with a high public health and pharmaceutical expenditure per capita. We expect
that the increase in these variables may shorten the launch delay and mean countries pay
high prices. Since countries with high public health expenditure should be more worried
about the availability of drugs in their market, they are expected to pay higher prices and
try to have the new drug available as soon as possible. Similarly, countries with a high
pharmaceutical expenditure per capita are willing to pay higher prices and therefore, firms
are interested in launching earlier in those countries.
Also, we have controlled for the firm’s headquarters location. We expect that
countries hosting the firm’s headquarter experience shorter launch delays and pay higher
prices. We think that hosting the firm’s headquarter could generate other types of profits
for the country that mean the country will have the drug available in its market as soon as
possible and at a higher relative launch price (e.g. employment, incomes from taxes, etc.
; see Chapter 1, sections 2.5 and 3.3.5). Furthermore, since our database contains
countries belonging to the EMA and other countries outside of it, and given that drug
approval processes take varying times depending on the organization (the FDA, the EMA,
etc.), we expect that the EMA dummy variable affects the launch delay (see Chapter 1
section 3.3.3)
102 Modeling Global Pricing and Launching of New Drugs
Additionally, we have also controlled for the therapeutic class fixed-effects and the
time trend; however, the country fixed effects have not been included because the
variable of greatest interest, the one measuring the use of price controls, has little within
country variation.
3.5.2 Data
We used the database described above (see section 3.1 of this chapter). The price
per SU for each product k was calculated on a yearly basis as the ratio of total revenues
to SU sold. Two products k are considered the same as they present the same quantity of
SU and the same administration route. For each molecule-country providing two or more
identical products with different packsizes79, the volume-weighted average price was
calculated. Also, we note that the USA sales were collected at inpatient and outpatient
level through different sales channels (e.g. drugstores, foodstores, mail service, etc. for
inpatient sales, and hospital, non-federal hospitals, home health care, etc. for
outpatients). Furthermore, we note that sales from Denmark, the Netherlands and
Sweden were jointly collected by IMS (inpatient and outpatient). The relative launch price
for the whole database was calculated as noted in the above section 3.5.1. Besides the
variables already defined in the previous section 3.5.1, we used additional variables such
as the relative launch price and the pharmaceutical expenditure per capita. Also, we
introduce country size and the GDP per capita as additional explanatory variables in the
same model. In Appendix C.3 the variable definitions and classifications are reported in
Table C.3.
3.5.3 Results
3.5.3.1 Launch delay equation
Now, we present the results from the analysis of the duration of the launch delay
from the molecule global launch. This analysis has been conducted by the estimation of a
Weibull model controlling for unobserved heterogeinity. Results are shown in Table 3.6.
In the analysis of the retail sales, the model reports a statistically significant hazard
ratio slightly lower than unity for the relative launch price of the molecule. Higher relative
79 E.g. Tablets 150MG 28 and Tablets 150MG 56.

Chapter 3: Global Pricing and Launching of New Drugs. An Econometric Approach 103
launch prices affect negatively the probability of having the molecule launched. This
unexpected result indicates that countries that experience longer launch delays pay
Table 3.6. Launch delay equation of the NPLM
Retail Hospital Variables Hazard Ratio Hazard Ratio
Relative Price (at molecule level) 0.9934*** 0.9949*** [0.0017] [0.0014] Log of Country size in 2004 (population) 0.8754** 0.8746** [0.0492] [0.0467] Log of GDP per capita in 2004 4.2414** 3.2867** [2.9975] [2.1143] Log of Health Expenditure per capita in 2004 0.4584 0.6324 [0.2581] [0.3465] Log of Pharmaceutical Expenditure pc in 2004 0.8243 0.5657 [0.3031] [0.2016] IRP 0.3838*** 0.3712*** [0.0714] [0.0659] Firm’s home country 1.0816 1.2849 [0.3358] [0.3963] EMA 1.6443*** 1.5136*** [0.2479] [0.1955] ATC-1 B 2.5813 2.9381 [0.6169] [0.7006] C 0.5827 0.6983 [0.1693] [0.2024] D 2.6959 2.9717 [0.8045] [0.9475] G 0.3353 0.3347 [0.1011] [0.1037] J 0.7837 0.6636 [0.1686] [0.1343] L 0.6780 0.5443 [0.1329] [0.1032] M 0.4678 0.2891 [0.1683] [0.0972] N 1.4022 1.2241 [0.2861] [0.2531] R 13.2524 13.9722 [7.1829] [7.7269] S 0.6492 0.9355 [0.2343] [0.3175] T 0.6209 0.8516 [0.3703] [0.3427] V 0.8353 0.7506 [0.2777] [0.2233] Observations 732 921 AIC 38.1443 37.9427 Significance(sign.)levels(two‐sided):*:p<0.10;**:p<0.05;***:p<0.01.;[]:standarderror;n.r.:no‐reported;‐:no‐included;RC:referencecategory.SeedefinitionofvariablesinAppendixC.3.

104 Modeling Global Pricing and Launching of New Drugs
higher prices than countries with a shorter market access. However, we should remark
that the extent of this effect is negligible and ultimately we may interpret that different
relative launch prices do not yield large differences in launch delays. Furthermore, as
expected, the use of ERP policy generates a lower probability of launch. This may
indicate that firms try to avoid the spillover effects by delaying launch in countries rather
than using ERP. As some of the countries applying ERP policy are potential exporter
countries, this could be another reason why firms delay launch in these countries.
Regarding other country characteristics, it is observed that larger countries suffer
from longer launch delays. This unexpected result shows that the bargaining power due to
country size (population size) has no effect on a quick market access. The factors that
seem to have an important positive effect on the probability of launching a molecule are
the GDP per capita and belonging to the EMA. However, other indicators such as public
health or pharmaceutical expenditure do not affect the probability of launch. Even, the
firms with their headquarters in the launching country do not launch in it first instead of in
others.
At molecule level, the model reports statistically significant differences among
different ATC-1 classes, taking the A-class as the reference category.
When we analyse hospital sales, we do not observe major changes with respect to
retail sales. Factors influencing the launch delay and their signs remain the same. We
should just mention that GDP per capita is now statistically significant at 10% (very close
to the 5%). There is no huge change in the extent of the influence of the significant
covariates. As in the analysis of retail sales, the model reports statistically significant
differences at ATC-1 level.
3.5.3.2 Relative launch price equation
When we analyse the retail sales, the relative launch price is conditioned by the
launching, since the IMR80 coefficient is statistically significant. Regarding the variables on
80 Following Heckman HECKMAN, J. J. 1979. Sample selection bias as a specification error. Econometrica: Journal of the econometric society, 153-161., the IMR of molecule i in country j and time t, IMRijt , is calculated using the score of
launching from the probit regression as where is the standard Normal density and
is the standard Normal distribution function.
X ' IMRijt (X ')
(X ')() ()
Chapter 3: Global Pricing and Launching of New Drugs. An Econometric Approach 105
which we focus our study, we note that the launch delay seems to have no statistically
significant effect on the relative launch price. This result may indicate that the firms have
prioritized to avoid the spillover effects from ERP and PT as opposed to making profits
from some late sales at lower prices. Indeed, it seems that countries no longer benefit
from lower prices in exchange for having the product available with a certain delay.
Furthermore, we observe that the use of ERP does not affect significantly the relative
launch price. Particularly, it seems that countries applying ERP policy do not pay lower
relative launch prices than countries that do not use it. This unexpected result shows that
the use of ERP is not effective, either because some countries may directly take the
reference price, or because other countries may not apply ultimately ERP as a unique
criterion, or because firms do not sell at that price (see Chapter 2 section 2.1).
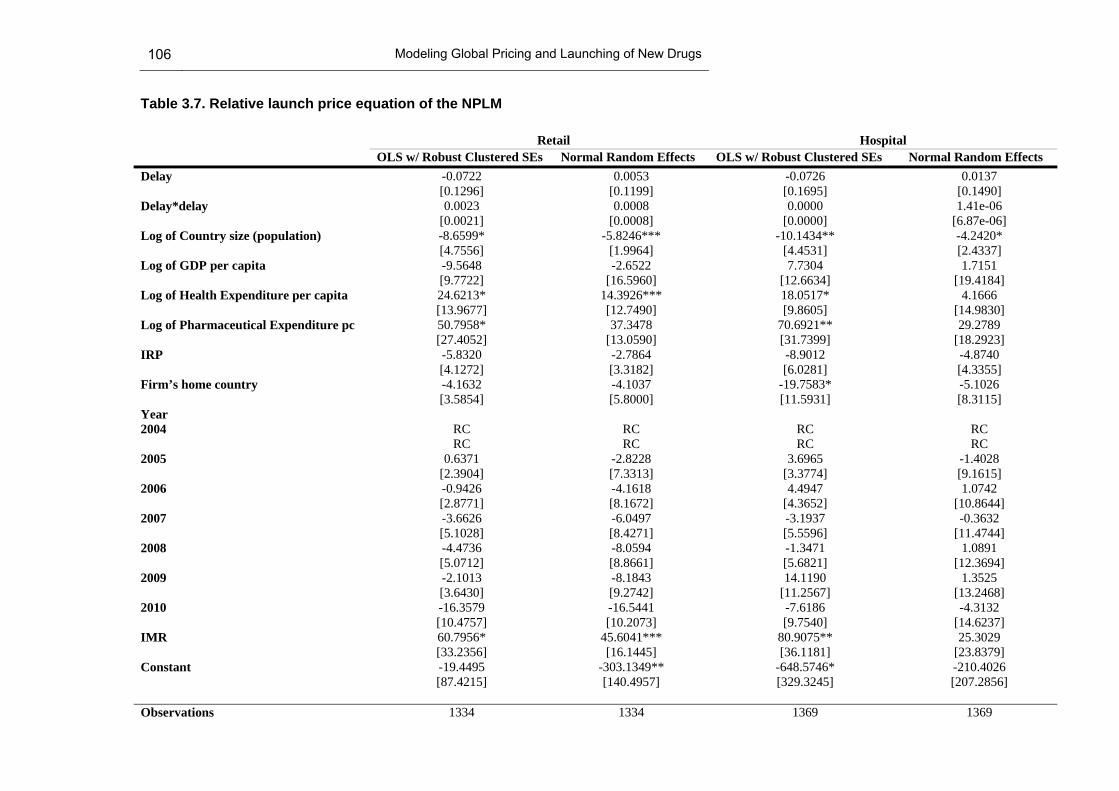
106 Modeling Global Pricing and Launching of New Drugs
Table 3.7. Relative launch price equation of the NPLM
Retail Hospital OLS w/ Robust Clustered SEs Normal Random Effects OLS w/ Robust Clustered SEs Normal Random Effects Delay -0.0722 0.0053 -0.0726 0.0137 [0.1296] [0.1199] [0.1695] [0.1490] Delay*delay 0.0023 0.0008 0.0000 1.41e-06 [0.0021] [0.0008] [0.0000] [6.87e-06] Log of Country size (population) -8.6599* -5.8246*** -10.1434** -4.2420* [4.7556] [1.9964] [4.4531] [2.4337] Log of GDP per capita -9.5648 -2.6522 7.7304 1.7151 [9.7722] [16.5960] [12.6634] [19.4184] Log of Health Expenditure per capita 24.6213* 14.3926*** 18.0517* 4.1666 [13.9677] [12.7490] [9.8605] [14.9830] Log of Pharmaceutical Expenditure pc 50.7958* 37.3478 70.6921** 29.2789 [27.4052] [13.0590] [31.7399] [18.2923] IRP -5.8320 -2.7864 -8.9012 -4.8740 [4.1272] [3.3182] [6.0281] [4.3355] Firm’s home country -4.1632 -4.1037 -19.7583* -5.1026 [3.5854] [5.8000] [11.5931] [8.3115] Year 2004 RC RC RC RC RC RC RC RC 2005 0.6371 -2.8228 3.6965 -1.4028 [2.3904] [7.3313] [3.3774] [9.1615] 2006 -0.9426 -4.1618 4.4947 1.0742 [2.8771] [8.1672] [4.3652] [10.8644] 2007 -3.6626 -6.0497 -3.1937 -0.3632 [5.1028] [8.4271] [5.5596] [11.4744] 2008 -4.4736 -8.0594 -1.3471 1.0891 [5.0712] [8.8661] [5.6821] [12.3694] 2009 -2.1013 -8.1843 14.1190 1.3525 [3.6430] [9.2742] [11.2567] [13.2468] 2010 -16.3579 -16.5441 -7.6186 -4.3132 [10.4757] [10.2073] [9.7540] [14.6237] IMR 60.7956* 45.6041*** 80.9075** 25.3029 [33.2356] [16.1445] [36.1181] [23.8379] Constant -19.4495 -303.1349** -648.5746* -210.4026 [87.4215] [140.4957] [329.3245] [207.2856] Observations 1334 1334 1369 1369

Chapter 3: Global Pricing and Launching of New Drugs. An Econometric Approach 107
Retail Hospital OLS w/ Robust Clustered SEs Normal Random Effects OLS w/ Robust Clustered SEs Normal Random Effects Number of Molecule-presentation-level Clusters
69 69 70 70
R-squared 0.1776 0.1744 0.1952 0.1952 Significance(sign.)levels(two‐sided):*:p<0.10;**:p<0.05;***:p<0.01.;[]:standarderror;n.r.:no‐reported;‐:no‐included;RC:referencecategory.SeedefinitionofvariablesinAppendixC.3.
108 Modeling Global Pricing and Launching of New Drugs
Furthermore, other country characteristics such as pharmaceutical and health
public expenditure per capita do seem to affect significantly the relative launch price.
Indeed, as expected, countries with high pharmaceutical and public health expenditures
per capita pay higher relative launch prices. In addition, the results show that countries
with a high bargaining power, since they have a large population, pay lower relative
launch prices on average (see Chapter 2 section 2.1). As we account for unobserved
molecule characteristics, we also report results from a GLS random effects estimator. The
results slightly change when we estimate this alternative specification. Particularly, only
the country size and public health expenditure per capita remain as significant factors
influencing the relative launch prices.
When we analyse the hospital sales, we observe that, compared to the retail
market, significant results remain. Furthermore, in this analysis, the firm’s headquarters’
location has a slightly significant and negative effect on the relative launch price.
Therefore, drugs launched by firms with their headquarters in the launching country set
lower prices than drugs launched by firms with their headquarters outside the launching
country. This unexpected effect will be discussed later on in this chapter, and it can be
compared with the results reported in the literature in Chapter 1 Section 3.2.5. Similar to
the retail market, when we report the results from a GLS random effects estimator, the
only significant effect that remains is the country size, the rest of variables affecting the
relative launch price become insignificant. Even, the IMR does not affect significantly the
relative launch price, only being significant in the retail market for both specifications and
in the hospital market for the OLS molecule-clustered estimate.
3.5.4 Discussion
Our contribution to the previous literature analysed in Chapter 1, sections 2 and 3,
firstly consists of the analysis of the database at presentation level, the analysis of the
relative launch price as endogenous variable in the launch price equation, the study of the
launch delay as a duration time variable and the analysis of the inpatients market. In this
chapter, we have carried out an analysis of the trade-off between pricing and launching
and the impact of ERP policy on both pricing and launching.
In this regard, we have observed that the launch delay does not significantly affect
the relative launch price; however, the relative launch price does affect launch delay, but
the extent of the influence is quite low. In addition, the results show that the use of ERP

Chapter 3: Global Pricing and Launching of New Drugs. An Econometric Approach 109
makes countries experience longer launch delays but does not lead to paying lower
relative launch prices. These results may have several implications on the bargaining
process. Indeed, we may think that firms do not want to play the game in which, countries
reject a firm’s offer knowing that over the time they will obtain lower prices. Besides, we
observe that firms delay launches in countries using ERP policy; however, these countries
do not necessarily pay lower prices. This last result may indicate that ERP policy is not
effective in “pricing terms” but it is in “launching terms”. It seems that firms do not accept
lower prices in exchange for delaying launches from countries applying ERP. These
results may suggest that firms basically delay launches because countries probably
cannot afford to have the product available straight from the global launch, and even not
having the product. In contrast to previous literature, where firms sometimes delay launch
to avoid spillover effect, in our study, we show that firms may use a more aggressive
strategy, which does not allow countries to have the products available with a launch
delay in exchange for paying lower relative launch prices. Under this strategy, firms
would avoid the spillover effects from ERP policy and PT, though they would lose profits
from sales in those countries where the molecule is not ultimately launched.
Furthermore, among other country characteristics, we observe that the bargaining
power of country size is effective to obtain lower prices; however, this country
characteristic does not seem to be an influencing factor on achieving shorter launch
delays, even more, unexpectedly, countries with a large country size find lower
probabilities to have a product launched. In the same line, we have observed that GDP
per capita does not affect the relative launch price; however, other country characteristics,
more specifically ones affecting pharmaceutical consumption, such as pharmaceutical
and health public expenditure per capita, affect positively the relative launch price. Exactly
the opposite effect occurs for the launch delay. The pharmaceutical and the public health
expenditure do not seem to result in countries experiencing shorter launch delays.
Indeed, what does make countries have products available in the short-term is a high
level of wealth per capita. We may say that wealthy countries have the products available
in the short-term, and the countries that ultimately pay high relative launch prices are
those that allocate large budgets to public health and the pharmaceutical expenditure.
On the basis of the results, firms neither make discounts nor launch in the short-
term in those countries where they have their headquarters. Only in the hospital market
do we observe that countries obtain lower prices from this type of firms than from foreign
110 Modeling Global Pricing and Launching of New Drugs
ones. So far, the previous literature has either not found any significant price premiums
for local firms or has found a positive significant and expected effect. Note that these
studies collected data not only in high-income but also in low-income countries where
firms’ headquarters are not usually located, therefore, the positive effect found could be
due not exclusively to the firm’s location but also to the country’s wealth. Furthermore,
countries belonging to the EMA enjoy shorter market access on average than countries
outside of the EMA regime.
3.6 Conclusions
Conclusions from replicating the D&E model
The updated model presents some differences from the D&E model. We must note
that our sample starts in 2004, immediately after the D&E sample finishes. Also, the lists
of countries and products are not exactly the same in both models. This may justify
differences in results. The D&E model is robust among different specifications, while our
updated model presents some alterations. The most remarkable differences in results
between the D&E model and the updated one concern the spillover effects and the effects
of the type of firms.
The updated model finds that the number of low-price EU countries affects
negatively the propensity of launch, which may confirm that low-price countries are
suffering longer launch delays, while the D&E model does not find any significant effect.
Furthermore, the updated model finds that the minimum price set in the low-price EU
affects positively the launch price, which may show that spillover effects also exist among
low-price countries, while the D&E model does not. Moreover, the minimum price set in
high-price non-EU countries presents a negative effect on the launch price (positive in the
D&E model) which may indicate that spillover effects occur among EU and high-price
non-EU countries. To have no reference prices from low-price EU and high-price non-EU
countries only seems to have effect in the updated model. No references from low-price
EU countries yields a positive effect due to two different situations, either that spillover
also occurs among low-price countries, or that being first means paying higher prices. No
references from high-price non-EU countries may indicate either that these countries are
also taken as reference by EU countries or that launch prices in the EU could be higher
than the launch price out of the EU.
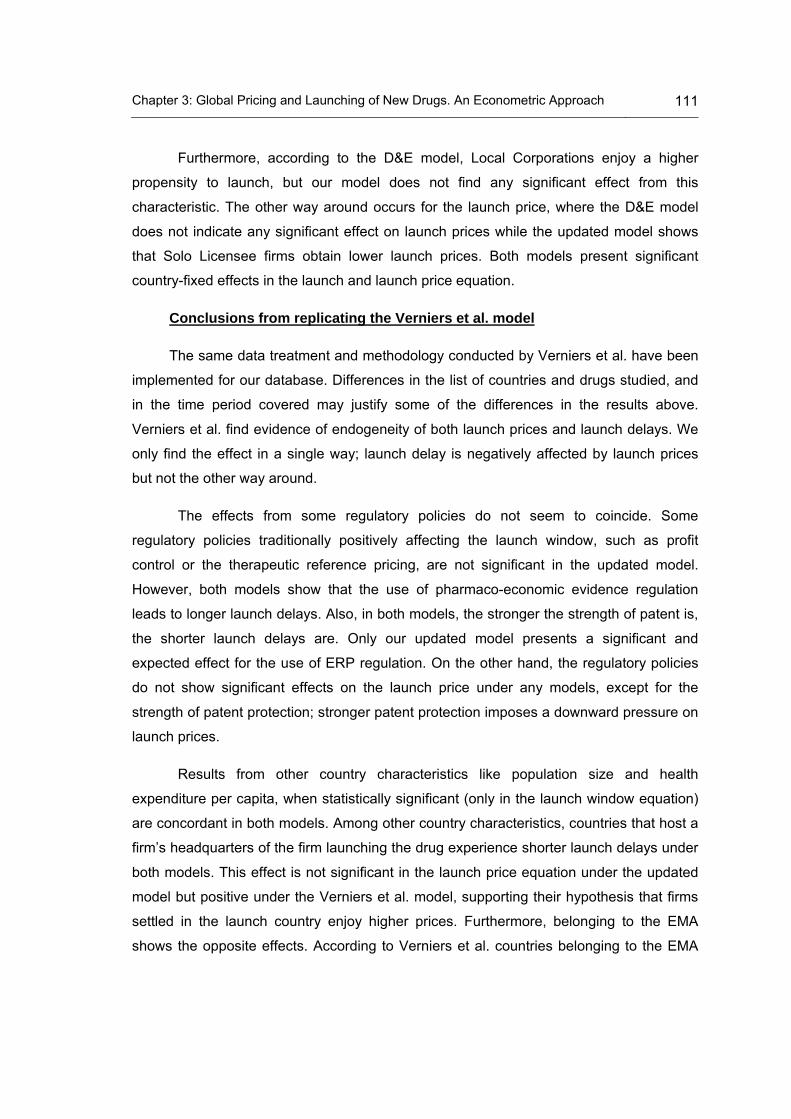
Chapter 3: Global Pricing and Launching of New Drugs. An Econometric Approach 111
Furthermore, according to the D&E model, Local Corporations enjoy a higher
propensity to launch, but our model does not find any significant effect from this
characteristic. The other way around occurs for the launch price, where the D&E model
does not indicate any significant effect on launch prices while the updated model shows
that Solo Licensee firms obtain lower launch prices. Both models present significant
country-fixed effects in the launch and launch price equation.
Conclusions from replicating the Verniers et al. model
The same data treatment and methodology conducted by Verniers et al. have been
implemented for our database. Differences in the list of countries and drugs studied, and
in the time period covered may justify some of the differences in the results above.
Verniers et al. find evidence of endogeneity of both launch prices and launch delays. We
only find the effect in a single way; launch delay is negatively affected by launch prices
but not the other way around.
The effects from some regulatory policies do not seem to coincide. Some
regulatory policies traditionally positively affecting the launch window, such as profit
control or the therapeutic reference pricing, are not significant in the updated model.
However, both models show that the use of pharmaco-economic evidence regulation
leads to longer launch delays. Also, in both models, the stronger the strength of patent is,
the shorter launch delays are. Only our updated model presents a significant and
expected effect for the use of ERP regulation. On the other hand, the regulatory policies
do not show significant effects on the launch price under any models, except for the
strength of patent protection; stronger patent protection imposes a downward pressure on
launch prices.
Results from other country characteristics like population size and health
expenditure per capita, when statistically significant (only in the launch window equation)
are concordant in both models. Among other country characteristics, countries that host a
firm’s headquarters of the firm launching the drug experience shorter launch delays under
both models. This effect is not significant in the launch price equation under the updated
model but positive under the Verniers et al. model, supporting their hypothesis that firms
settled in the launch country enjoy higher prices. Furthermore, belonging to the EMA
shows the opposite effects. According to Verniers et al. countries belonging to the EMA

112 Modeling Global Pricing and Launching of New Drugs
show shorter launch delays, however, our updated model reports that these countries
experience longer launch delays than in countries outside of the EMA.
Finally, both models present significant therapeutic class fixed-effects. However,
the four dimensions identified by Hofstede (Hofstede, 1984, Hofstede, 2001) concerning a
country’s national culture present different effects in both models.
Conclusions of the NPLM
Under the NPLM, the pricing and launching seem to be no longer related to each
other. Differences exist in prices across countries but not due to the launch delay. Firms
do not accept lower prices in exchange for delaying launches, even from countries
applying ERP policy, therefore, ERP policy seems to not be effective in “pricing terms” but
is in “launching terms”. These results may lead to several implications in the bargaining
process. We suggest that firms basically delay launches because countries probably
cannot afford to have the product available straight from the global launch, and ultimately
end up not having the product launched. While the firms often delay launch to avoid
spillover effects, under our study, we show that the firms may conduct a more aggressive
strategy that does not allow countries to pay lower prices in exchange for experiencing
longer launch delays. Under this strategy the firms would avoid the spillover effects from
IRP policy and PT, but they would also lose profits from sales in countries where the
molecule is not ultimately launched.
Regarding other country characteristics, our study shows that wealthy countries
have the products available in a shorter period, but the countries that ultimately pay high
relative launch prices are those that allocate large budgets to public health and
pharmaceutical expenditure. Countries belonging to the EMA seem to enjoy shorter
launch delays than the countries outside of it; however, there are no significant price
differences between countries under the EMA regime and countries outside of it.
In general, the results in the retail market and the hospital market do not show
huge differences, but we highlight the firm with headquarters in the launching country
bargains lower prices with the country concerned just in the hospital market.
Conclusions and further research
Our systematic review shows that demographic and income country features, and
regulation regimes, seem to be the most important factors affecting drug pricing and
launching. However, price regulation can undermine the effects of these important factors.
Drug characteristics like strength, packsize and presentation forms are significantly
related to the price. Also, supported by previous studies, belonging to the EMA’s
therapeutic category robustly affects the launch delay and the launch price. The
therapeutic value is shown in the previous literature as a robust factor-influencing drug
pricing and launching. Additionally, firm location turns out to be an important factor for the
launching decision; however, price premiums due to headquarters location appear
ambiguous.
When replicating the D&E model with more recent data, we find some new
patterns compared with the D&E results concerning the spillover effects and the type of
firms. Therefore, we determine that low-price countries suffer longer launch delays and
spillover effects also exist among low-price countries: spillover effects also occur
between EU and high-price non-EU countries. Furthermore, Local Corporations do not
have a higher propensity to launch any longer; however Solo Licensee firms do obtain,
nowadays, lower launch prices.
Replicating Verniers et al. with more recent data and a different list of countries
yields new outcomes. The most important outcome is that the endogeneity of both launch
prices and launch delays found by Verniers et al. is no longer found; only the launch delay
is negatively affected by the launch price. The effects of some regulatory policies on the
launch delay do not generally seem to coincide. Again, similar to the D&E, in our updated
model, firm location loses its effect on drug launching and pricing.
One of the most important conclusions of this doctoral thesis is that, in contrast to
previous models, pricing and launching seem to be no longer related to each other.

114 Modeling Global Pricing and Launching of New Drugs
Differences in prices exist across countries but not due to the launch delay. Firms do not
accept lower prices in exchange for delaying launches, even from countries applying ERP
policies, therefore, ERP seems to not be effective in “pricing terms” but it is in “launching
terms”. These results may hold several implications for the bargaining process. We
suggest that firms basically delay launches because countries probably cannot afford to
have the product available straight from the global launch, or ultimately not having the
product launched. While firms used to delay launch to avoid spillover effects, in our study,
we show that firms conduct a more aggressive strategy that does not allow countries to
pay lower prices in exchange for experiencing longer launch delays. Under this strategy,
firms would avoid the spillover effects from ERP and PT, but they would also lose profits
from sales in countries where the molecule is not ultimately launched.
Regarding other country characteristics, being a large country helps to have more
rapid market access and obtain lower prices. Furthermore, wealthy countries have the
products available within a shorter period, but the countries that ultimately pay high
relative launch prices are those that allocate large budgets to public health and
pharmaceutical expenditure. Firm location no longer affects the price and neither does the
launch delay. Countries belonging to the EMA seem to enjoy shorter launch delays than
the countries outside of it; however, there are no significant price differences between
countries inside the EMA’s regime and countries outside of it.
In general, the results in the retail market and the hospital market do not show
huge differences, but we highlight the firm with headquarters in the launching country
bargains lower prices with the country concerned just in the hospital market.
In view of the overall perspective concerning the main factors influencing launch
prices and launch of new drugs based on theoretical studies, we mainly distinguish two
types of factors. Firstly, we have observed factors that directly affect drug pricing and
launching, such as the presence of PT, the firm’s characteristics and the regulation pricing
policies, for example ERP, internal RP or MES + PC. Secondly, our review shows other
determinants that not only impact directly but also indirectly, affecting the measures of the
first types of factors that influence drug pricing and launching, such as country size and
the level of co-payments.
According to our theoretical model, given the optimal country launch sequence, we
conclude that the smaller the population size is, the more attractive the use of ERP will

Conclusions and further research 115
be, since the unitary cost of CEA increases. Note that ERP does not require any
investment, however CEA does. Therefore, the use of ERP is helpful to relatively small
countries compared to the use of CEA. This result confirms some statements on this
issue that have not been previously shown. ERP is a low-cost pricing policy; however, we
have now more information about why countries apply this type of pricing policy fully
aware that it may be not fair.
We also conclude that the optimal country launch sequence depends on the
relative prices and the relative country sizes. There is a trade-off between price and
volume, which affects the country launch sequence. In addition, the relative price depends
on the countries’ pricing policies, ERP and CEA, and subsequently, on the ERP formula.
Particularly, a country is better off applying ERP instead of CEA, if the difference between
the international reference price and the expected price of country i under CEA is not
higher than the unitary cost of CEA. This result is affected by the delay cost if only one of
the pricing policies is applied with delay.
From the perspective of the regulator, concerning the application of ERP, the
previous theoretical literature recommends only small countries to engage in ERP and/or
apply ERP based on prices in large countries (or large group of countries); the same
applies if one substitutes “large country” by “small co-payment country” and vice versa.
Also, a minimum RP level is recommended to avoid major increases in price level with
respect to the average RP. Furthermore, an MES policy together with a PC should be
applied when the welfare loss due to high-type drug buyers is not large enough to
outweigh the welfare gained due to the low-type drug.
From the perspective of the firm, the literature recommends that the loss of income
coming from PT should be taken into account and the firm should set a higher price than
without PT. However, since ERP is widely used by countries and PT does exist, the
markets are inseparable. Therefore, the highest drug price is not always the best option
for the firm and the lowest drug price is not always the best option in a given country.
What may have been an optimal pricing strategy in a single country is no longer optimal
when considering ERP and PT.
Our theoretical model shows that there is a trade-off between prices and volumes
affecting the country launch sequence. Also, it provides information about ERP, an issue
116 Modeling Global Pricing and Launching of New Drugs
widely discussed in the literature. In any case, we accept that a greater variety of factors
may exist than already used in the model, which affect the bargaining process. Further
theoretical models may need to be designed, for example, ERP formulas may be other
than the average or the minimum, firms may offer one single price, etc. Besides, other
factors such as the population age structure or the lobbying activity of the pharmaceutical
industry may also be taken into account.
Despite the limitations caused by the lack of data, this is the first study that
indicates that pricing and launching a medicine are no longer two inseparable issues.
However, we consider that further analysis is needed concerning the use of larger
samples at country and drug level, in order to achieve more accurate comparisons.
Particularly, in the analysis of ERP, further research should take into account the
interdependencies that occur between countries due to ERP. We have controlled for this
pricing policy through a dummy variable, but richer insights could be obtained by
collecting data on the reference basket of each country that applies it.
Behind the idea that pricing and launching are no longer related to each other,
prices may be converging to a single price, at least, under the EMA countries. An
interesting avenue of future research could be the analysis of price convergence through
time series analysis, particularly, based on the cointegration theory. This work requires
long-term data of pricing and launching. This further study may demonstrate some of the
hypotheses stated in this thesis about the future lines of pharmaceutical industry strategy.
A limitation of the data concerning the hospital market is that we cannot take into
account price discounts due to the volume purchased. Another interesting line of
research would be to test the benefits of centralized purchasing. There are countries
traditionally applying this type of purchasing through regional and national hospital bodies,
such as Denmark or Norway. Particularly, in Spain, a new mechanism has been
implemented in the Public Sector Procurement Act, which was introduced in 2013. A
centralized frame agreement for drug procurement has been established. This new
mechanism is a further step within a major health sector reform to reduce pharmaceutical
expenditure and ensure the sustainability of the Spanish Health System. In this context,
interrupted time series analysis may be applied to test if this new drug purchasing policy
is being effective. Again, gathering data directly from hospitals seems to be the toughest
issue.

A. Appendix A
A.1. Method of Review
A.1.1 Search strategy
The following main databases were searched in April 2012, using combinations of key
terms in both UK and US English and addressing the period from January 1995 to April
2012: PubMed, EconLit and Web of Knowledge. The search was then complemented by
another, using the same keywords, in the following scientific centres advised by experts:
the NBER (The National Bureau of Economic Research), the University of York, the
CHEPA (Centre for Health Economics and Policy Analysis), the LSE (London School of
Economics) Health, the CRES (Centre de Recerca en Economia i Salut) at University
Pompeu Fabra, and the School of Economics at Erasmus University Rotterdam. Finally,
some documents referenced by experts were also included. We searched separately for
“ ("pharmaceutical* pric*") and (new or launch* or patent), ("drug* pric*") and [new or
launch* or patent) and ("medicine* pric*") and (new or launch* or patent).
A.1.2 Selection and Exclusion Criteria
The references found in the search were systematically assessed by reviewing the
title, abstract and publication type to identify relevant articles. All relevant articles meeting
the inclusion criteria were retrieved, following a two-stage selection strategy.
In the first stage, selection criteria were applied to all the studies under review. In
the second stage, the studies selected in the first stage were individually screened to
evaluate the theoretical and empirical contributions made in each case. In the first stage,
we only included studies satisfying the criteria stated in Figure A.1. Each article was
sequentially evaluated against the four criteria, from the first to the fourth: i) to be an

118 Modeling Global Pricing and Launching of New Drugs
original article, ii) to be published in scientific journal, iii) to be written in English language
and iv) to be focused on patented drug pricing or launching. As soon as a criterion was
not met, the article was excluded.
In the second stage, the full text of each article selected was retrieved. We
selected only original theoretical contributions developing new analytical insights and
original suggestions, and empirical papers developing a causal model focusing on the
price of drug or on a measure of drug launch as dependent variable accounting for a
cross-country sample
A.1.3 Search results
The selection process and the number of articles excluded and retained at each
stage are summarized in the PRISMA (Preferred Reporting Items for Systematic reviews
and Meta-Analyses) in Figure A.1 (Moher et al., 2009). The search delivered a total of
1183 articles. Then, we applied the selection and exclusion criteria in first and second
stage as above explained. A total of 65 articles met all four criteria in the first stage of our
selection strategy. These 65 studies were evaluated for inclusion in the second stage.
Finally, 22 full articles were retrieved. Twelve of these had a theoretical focus and 17
were empirical.

Appendix A 119
Figure A.1 Flow diagram of literature screening process
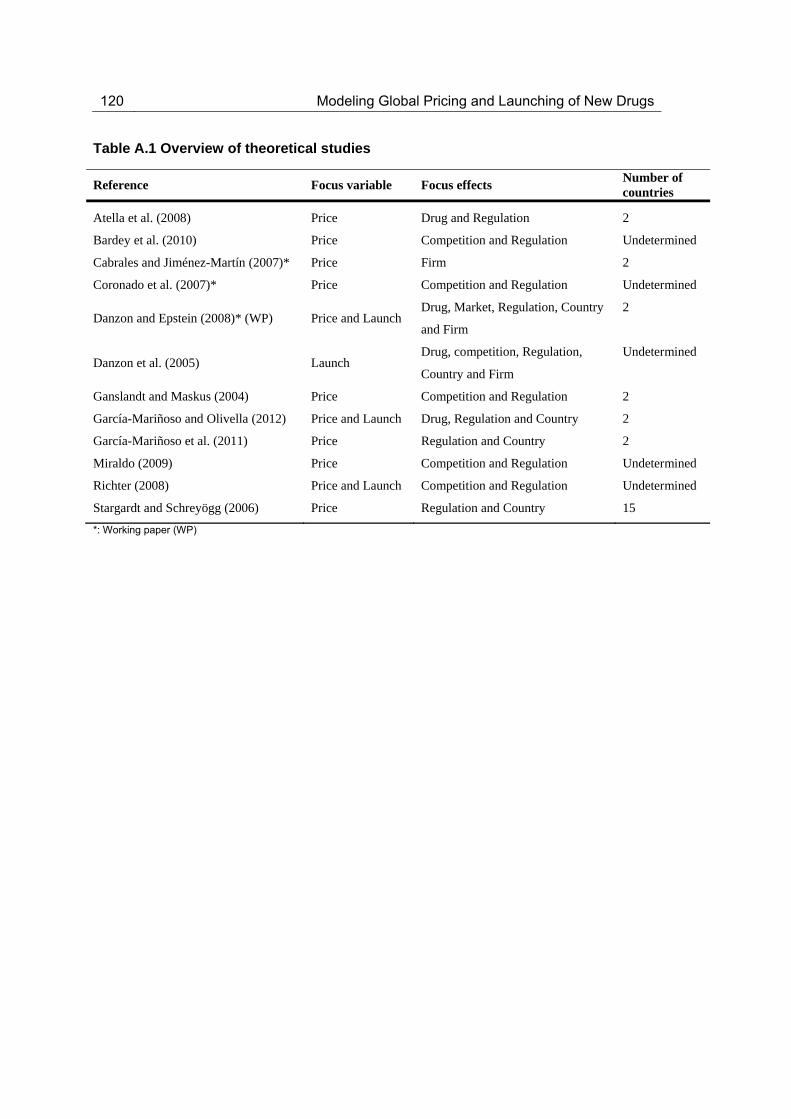
120 Modeling Global Pricing and Launching of New Drugs
Table A.1 Overview of theoretical studies
Reference Focus variable Focus effects Number of countries
Atella et al. (2008) Price Drug and Regulation 2
Bardey et al. (2010) Price Competition and Regulation Undetermined
Cabrales and Jiménez-Martín (2007)* Price Firm 2
Coronado et al. (2007)* Price Competition and Regulation Undetermined
Danzon and Epstein (2008)* (WP) Price and Launch Drug, Market, Regulation, Country
and Firm
2
Danzon et al. (2005) Launch Drug, competition, Regulation,
Country and Firm
Undetermined
Ganslandt and Maskus (2004) Price Competition and Regulation 2
García-Mariñoso and Olivella (2012) Price and Launch Drug, Regulation and Country 2
García-Mariñoso et al. (2011) Price Regulation and Country 2
Miraldo (2009) Price Competition and Regulation Undetermined
Richter (2008) Price and Launch Competition and Regulation Undetermined
Stargardt and Schreyögg (2006) Price Regulation and Country 15
*: Working paper (WP)

Appendix A 121
Table A.2. Overview of empirical studies
Reference Dependent Variable Focus Effecta Independent Variables Sample Period Data Source TFc
Atella et al. (2008)**
Price level (n.a.) Regulation
* (-) QI (drug quality indicator, defined as one over the $/QALY measure) US (dummy variable which equals 1 if the price is referred to an U.S. brand name) * (+) US*QI
181 products
Only Patent products
n.a.
MEPSc / AIFAc
x
Borrell (2007) Price level (wholesale) Regulation
* (+) Original drug in patent regime * (+) Original drug in no-patent regime Generics after patent expiration Country Mean income Country income inequality (GINI,%) * (+) Number of doses per day Efficacy of the drug Adverse reactions of the drug Years in the US market (1-12 years) * (-) 5 * (-) 7 * (-) 8 * (-) 9 (n.a.) Therapeutic Fixed Effects
15 products
All type of products (NCE, Patent, off-patent,generics)
1995-2000
IMS HEALTH
Cabrales and Jiménez-Martín
(2007)** Price level (ex-factory) Firms
The market share of all national products in the ATC4 market HHI-local (The Hirschmand-Herfindähl concentration index for national ¯rms in the ATC4 market) * (-) Firm size New (A dummy taking one if the product was first
All products at ATC-4
All type of products (NCE, Patent, off-patent,generics)
1998-2003
IMS HEALTH
x

122 Modeling Global Pricing and Launching of New Drugs
Reference Dependent Variable Focus Effecta Independent Variables Sample Period Data Source TFc
observed in the previous year) * (+) Dummy of absence of a global price of reference * (+) Average global price of the molecule in US real $ * (+) A dummy taking one if the corporation is local-non multinational A dummy taking one if the corporation is local but multinational Number of identified generics in the market Berry index (it measures the degree of specialization of the corporation) * (+) Fpc (Fraction of public consumption in GDP) GDP per capita (Fraction of public consumption in GDP) * (+) GDP per capita in US dolars Reg (Level of regulation: 1 low, 2 medium, 3 high) * (-) Fpc*Reg2 * (-) Fpc*Reg3 * (+) GDP*Reg2 * (+) GDP*Reg3 * (-) Molage (Time elapsed since the molecule was launched to December 31, 2003) Log of the number of market a molecule is present Cesnormol (A dummy taking one if the molecule was launched before January 1, 1991)

Appendix A 123
Reference Dependent Variable Focus Effecta Independent Variables Sample Period Data Source TFc
Censorlag (Censormol_lag_1) * (-) Generic (A dummy taking one if the product is generic)
Coronado et al. (2007)** Price level (ex-factory) Regulation
HHI (Herfindähl-Hirschman Index) *(+) Firm size lag *(-) New product lag * (+) Global Price in USD for product j belonging to firm i Binary variable, taking 1 if product j is a compound of molecules * (+) Market share of product j in market k * Number of generic products in market k Time elapsed up to 2003 since molecule (market) k was launched Corporation share in market k excluding product j's share Binary variable, taking 1 if molecule age is censored in the sample Binary variable, taking 1 if product j was launch date is censored in the sample Binary variable, taking 1 if product j is a generic) Weighted average multimarket contact variable for firm i in market k Alternative weighted average multimarket contact variable in market k
All products at ATC-4.
All type of products (NCE, Patent, off-patent,generics)
1998-2004
IMS HEALTH
x
Danzon and Chao
(2000a)b Price level (ex-factory) Drug and Brand
Competition
Strength Molecule Age (months from the first product launch each country to September 1992) Form codes (The number of distinct
171 molecules / 5690 products
All type of products (NCE, Patent,
off-patent,generics)
10/1991-09/1992
IMS HEALTH

124 Modeling Global Pricing and Launching of New Drugs
Reference Dependent Variable Focus Effecta Independent Variables Sample Period Data Source TFc
formulation of strengths in the molecule) Global penetration (number of countries in which the molecule is available out of the seven countries in sample) Packsize Number of manufacturers of the molecule Therapeutic substitute molecules (ATC3) Therapeutic substitute molecules entry lag ( lag in months between each molecule launch date and the first launch of the molecule, ATC3)
Danzon and Chao
(2000b)b Price level (ex-factory) Brand Competition and
Regulation
Strength Molecule Age (months from the first product launch each country to September 1992) Form codes (The number of distinct formulation or strengths in the molecule) Packsize Number of manufacturers of the molecule Generic Entry Lag (lag in months between the product’s own launch date and the launch date of the first product in the molecule) Therapeutic substitute molecules (ATC3) Products per Therapeutic Substitute Molecule Therapeutic substitute molecules entry lag ( lag in months between each molecule launch date and the first launch of the molecule, ATC3)
171 molecules / 5690 products
All type of products (NCE, Patent, off-patent,generics)
10/1991-09/1992
IMS HEALTH
Danzon and
Epstein (2008)**
Price at launch (ex-factory) and Launch window
Brand Competition and Regulation
S=Superior ; I=Inferior * (+) S Expected Drug Price Superior Brands (lag) Superior Brand’s Price Missing
375 molecules
All type of products (NCE, Patent, off-patent,generics)
QI/1992-QIV/2003
IMS HEALTH

Appendix A 125
Reference Dependent Variable Focus Effecta Independent Variables Sample Period Data Source TFc
* I (-) Expected Drug Price Inferior Brands (lag) Inferior Drug Price Missing Expected Drug Volume (lag) Number of Generic Manufacturer in Superior Subclass Number of Generic Manufcaturer in Inferior Subclass * I(-) Generics’ Price Missing * I(+)First Brand Launch in Country-Subclass * S(+) I(+) Second Brand Launch in Country-Subclass * S(+) I(+) Third or Fourth Brand Launch in Country-Subclass * S(+) Min Own Price in High-price EU Missing
* S(+) I(+) Min Own Price in High-Price EU Min Own Price in Low-price EU Missing Min Own Price in Low-Price EU * I(-) Min Own Price High-price non-EU Missing * S(+) Min Own Price in Hi-Price non-EU Number of low-price EU countries a molecule has already launched Number of high-price EU countries a molecule has already launched Number of high-price non-EU countries a molecule has already launched Number of molecules in Superior Subclass

126 Modeling Global Pricing and Launching of New Drugs
Reference Dependent Variable Focus Effecta Independent Variables Sample Period Data Source TFc
* S(-) Number of molecules in Inferior Subclass PIc Share in Subclass * S(+) GDP per Capita
* S(-) Country-Specific Quarterly Producer Price Index * S(+) Strenght * S(-) I(-) Pack size Form: Oral Solid Delayed * S(+) I(+) Form: Injectable Form: Other * S(-) I(-) Time since Global Launch * S(+) I(+) Time since Global Launch Squared * I(+) First Global Launch before 1990 First Global Launch in [1996-end] * S(+) I(+) Launch by Local Originator Corporation * S(+) I(+) Launch by Solo Licensee Corporation * S(+) I(+) Launch by Local Co-marketer Corporation Exchange rate ( US to EUR) * S() I() Country fixed effects (n.a.) ATC fixed effects
Danzon et al.
(2005) Hazard Launch Regulation *(+) Expected Drug Price *(+) Expected Drug Volume
85 molecules
Only NCE (New Chemical Entities)
09/1994-09/1998
IMS HEALTH
x

Appendix A 127
Reference Dependent Variable Focus Effecta Independent Variables Sample Period Data Source TFc
*(+) Firm’s Global Launch Experience (sales)
*(+) The originator firm’s home country *(+) GDP per capita * Country fixed effects * ATC fixed effects
Danzon et al. (2011)** Price level (ex-factory) Regulation and Country
* (-) IMS*GENERIC indicator ( IMS: a dummy taking one if the drug is sold through standard retail channels; GENERIC: a dummy taking one if the the generic is present in a country-year) * (-) GPRM*BRAND indicator (GPRM: a dummy taking one if the drug is procured by NGOs; a dummy taking one if the drug is the originator is present in a country-year) * (-) GPRM*GENERIC indicator ( GPRM: a dummy taking one if the drug is procured by NGOs; a dummy taking one if a generic is present in a country-year) * (+) Per capita income country * (-) GINI coefficient GINI missing indicator HIV prev. (HIV country prevalence rate) * (-) The number of tender generic products in the same therapeutic class-country-year * (-) The number of retail generic products in the same therapeutic class-country-year The number of originator products in the same therapeutic class-country-year * (+) Originator molecule flag
All type of products (NCE, Patent, off-patent,generics)
01/2004-06/2008
IMS HEALTH / GPRMc

128 Modeling Global Pricing and Launching of New Drugs
Reference Dependent Variable Focus Effecta Independent Variables Sample Period Data Source TFc
* (+) Generic molecule flag
Heuer et al. (2007)** Hazard Launch Regulation
Country GDP per capita Size of the country population A dummy taking one if the country use ERP A dummy taking one if the country use other direct price controls such as cost-effectiveness, etc.) A dummy taking one if the country use RP * (-) A dummy taking one if the country use ERP explicitily * (-) A dummy taking one if the country use ERP as a basis for their decision making criteria
35 molecules
Only NCE
01/1995-12/2005
IMS HEALTH
Kanavos and Costa-Font
(2005) Price level (wholesale) Regulation
Total market size, defined as sales for all products Market share of each PI product within each product market and each importing country Average Euclidean Distance of latitude and longitude between each importing and exporting country capitals * (-) Exchange rate $ * (-) Purchasing Power Parities in importing country * (-) Market shares of generics consumption in a country (i ) * (-) Dummy variable for introduction of the clawback; Price regulation (Dummy variable for price regulation defined as the intervention of third party payer (national insurance company) or the government in terms of setting price of each product ( j )
19 molecules
All type of products (NCE, Patent, off-patent,generics)
QI/1997-QIV/2002
IMS HEALTH x
Kanavos and Price level (ex-factory and * (+) Number of years since molecule’s launch in 68 molecules / 100 products 2004,2007 IMS HEALTH

Appendix A 129
Reference Dependent Variable Focus Effecta Independent Variables Sample Period Data Source TFc
Vandoros (2011)
retail) the local market Age squared generics (dummy variable 1 if there is a generic competitor present in the market) * (+) Dummy variable for United States * (+) Dummy variable for United Kingdom * (+) Dummy variable for Mexico Dummy variable indicating the impact of Health Technology Assessment being explicitly used as a policy measure Dummy variable. Indicates the presence of reference pricing * (+) Dummy variable. Indicates the presence of free pricing Dummy variable. Indicates the explicit use of ERP) Exchange rate * () Therapeutic fixed effects
All type of products (NCE, Patent,
off-patent,generics)
Kyle (2006) Hazard Launch Firms
* (+) Drug importance (drug’s share of stock of Medline citations for class) * (+) Number of countries launched (Number of countries where the molecule has been launched) * (-) Number of countries launched squared * (+) Multinational (Firm has launched drugs in 10+ countries) * (+) Domestic firm (taking 1 if headquarters are located in the country) * (-) Portfolio (total number of firm’s drug)
1482 molecules
Only NCE and patent products
1980-2000
PJB Pc

130 Modeling Global Pricing and Launching of New Drugs
Reference Dependent Variable Focus Effecta Independent Variables Sample Period Data Source TFc
* (+) Common language Common border Common regulations * (+) Country experience (Count of firm’s other drugs launched in country) Country-class experience (count of firm’s drug in country-class market) * (+) Experience years (number of years firm has marketed in country) * (-) Price controls (dummy variable: country using price controls) Population (country population) Population squared GDP per capita * (-) Number of new drug in the market (Count of drugs in market launched less than 5 years ago) * (+) Number of new drug in the market squared (Count of drugs in market launched less than 5 years ago) * (-) Number of old drugs in market (Count of drugs in market launched more than 5 years ago) * (+) Number of old drugs in market squared (Count of drugs in market launched more than 5 years ago) Number of potential competitors (Count of drugs launched in class elsewhere in the world) Number of domestic incumbents Number of foreign incumbents Therapeutic fixed effects

Appendix A 131
Reference Dependent Variable Focus Effecta Independent Variables Sample Period Data Source TFc
(n.a.) Country fixed effects (n.a.) Year fixed effects
Kyle (2007) Hazard Launch Regulation
* (+) Number of drugs in the market (Count of drugs in therapeutic classcount market) Number of potential entrants * (+) Drug importance (Drug's share of stock of Medline citations for class) * (+) Number of countries launched in ( Number of countries where the molecule has been launched) * (+) Prior launch in a high-price country * (+) Prior launch in a low-price country * (-) Firm is headquartered in a price-controlled country * (-) Portfolio ( total number of firm’s drug) * (+) Domestic firm (taking 1 if headquarters are located in the country ) * (+) International experience (Count of countries in which firm has launched any drugs) * (+) Country experience ( Count of firm’s other drugs launched in country) * (-) Price freeze * (-) Price controls * (-) Supply-side controls * (-) Price Rank * (+) Price Rank*post-1995 period Prescribing budgets
1444 molecules
Only NCE and patent products
1980-1999
PJB P

132 Modeling Global Pricing and Launching of New Drugs
Reference Dependent Variable Focus Effecta Independent Variables Sample Period Data Source TFc
* (+) Therapeutic class reference pricing * (-) Pharmacoeconomic evidence * (+) Population (country population) * (-) GDP per capita * (-) Corruption score * (-) Market competition index * (-) Entry cost as percentage of GDP per capita (n.a) Therapeutic fixed effects (n.a.) Year fixed effects
Lanjouw (2005)** Hazard Launch Regulation and Country
MLICsc equation: Short process patent (< 15 years) * (+) Add Long process (only) patents Add Long process & product patents Some Price Control (dummy=1 if country has a formal price control mechanism but it is not extensive) * (-) Extensive Price Control (dummy = 1 if price control covers most of the market and/or is viewed as particularly restrictive) * (-) Essential Drug List Dummy =1 for national adoption of an EDL Standard Treatment Guidelines (dummy = 1 for national adoption of standard treatment guidelines) * (+) Health Expenditure Private Share of Health Expenditure R&D Expenditure * (+) Country Population
782 molecules
All type of products (NCE, Patent, off-patent,generics)
1982-2001
IMS HEALTH

Appendix A 133
Reference Dependent Variable Focus Effecta Independent Variables Sample Period Data Source TFc
* (+) GDPcapita * (+) Gini Coefficient * (-) Gini Coefficient x GDPcapita * (+) Percentage Population over 65 years * (-) Percentage Population between 15-64 years Population Growth GDP Growth Radios per capita 1990 (Average radios per person) Growth Radio 90-95 * (+) Doctors Rate 1990 Growth Doctors 90-95 (n.a.) ATC fixed-effect (n.a.) year of first launch High-income Countries * (+) Short process patent (< 20 years) * (+) Add Long process and/or product patents * (-) Some Price Control (dummy=1 if country has a formal price control mechanism but it is not extensive) * (-) Extensive Price Control (dummy = 1 if price control covers most of the market and/or is viewed as particularly restrictive) * (+) Some Price Control x GDPcapita * (-) Essential Drug List Dummy =1 for national adoption of an EDL Standard Treatment Guidelines (dummy = 1 for national adoption of

134 Modeling Global Pricing and Launching of New Drugs
Reference Dependent Variable Focus Effecta Independent Variables Sample Period Data Source TFc
standard treatment guidelines) Standard Treatment Guidelines National Formulary EMA * (-) Health Expenditure Private Share of Health Expenditure R&D Expenditure * (+) Country Population * (-) GDPcapita * (+) Gini Coefficient * (-) Gini Coefficient x GDPcapita Percentage Population over 65 years * (-) Percentage Population between 15-64 years * (-) Population Growth GDP Growth Doctors Rate 1990 Growth Doctors 90-95 (n.a.) ATC fixed-effect (n.a.) year of first launch
Timur et al. (2011) Price level (retail) Drug and Brand
Competition
* (-) Molecule age ( the number of years since the first product launch of each molecule in each country) * (+) Strength Form code ( the number of different product formulations for each molecule) * (-) Packsize
124 molecules
All type of products (NCE, Patent, off-patent,generics)
1994-2003
IMS HEALTH

Appendix A 135
Reference Dependent Variable Focus Effecta Independent Variables Sample Period Data Source TFc
* (-) Diffused molecules ( the number of sample countries in which the molecule is available) * (-) Generic competition ( number of manufacturers of the molecule) Therapeutic substitute molecule
Verniers et al. (2011)
Price at launch (ex-factory) and Launch window Regulation
Price equation * (+) Launch window * (-) Launch window squared Selectivity variable (generalizedresiduals) Ex-manufacturer price regulation Profit control regulation Cross-country reference pricing regulation Therapeutic reference pricing regulation Pharamco-economic evidence regulation Strenght of patent protection * (+) Population size Health expenditure per capita Uncertainity avoidance (country's national culture) Masculinity (country's national culture) Individualism ( country's national culture) Power distance ( country's national culture) * (+) Competition ( a Herfindahl–Hirschman index foreachdrugineachcountry)
58 products
All type of products, not including generics (NCE, Patent, off-patent)
02/1994-06/2008
IMS HEALTH

136 Modeling Global Pricing and Launching of New Drugs
Reference Dependent Variable Focus Effecta Independent Variables Sample Period Data Source TFc
* (+) Firm’s home country * (+) Daily dosage (DDD defined by the WHO) Inflation * () ATC fixed effects Launch equation: * (+) Launch price * (-) Launch price squared * (+) Selectivity variable (generalizedresiduals) Ex-manufacturer price regulation * (+) Profit control regulation Cross-country reference pricing regulation * (+) Therapeutic reference pricing regulation * (+) Pharamco-economic evidence regulation * (+) Strenght of patent protection * (-) Population size * (+) Health expenditure per capita * (-) Uncertainity avoidance (country's national culture) * (+) Masculinity (country's national culture) * (-) Individualism ( country's national culture) * (+) Power distance ( country's national culture) Competition (aHerfindahl–Hirschmanindexforeachdrugineachcountry)
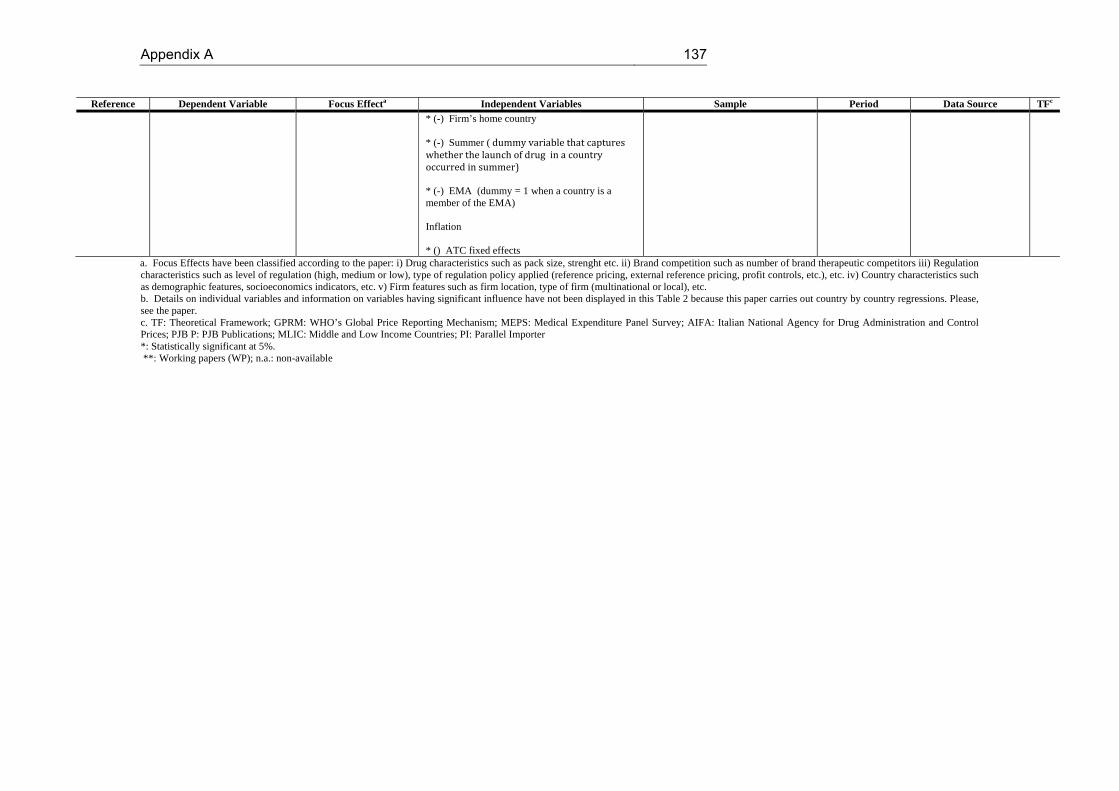
Appendix A 137
Reference Dependent Variable Focus Effecta Independent Variables Sample Period Data Source TFc
* (-) Firm’s home country * (-) Summer (dummyvariablethatcaptureswhetherthelaunchofdruginacountryoccurredinsummer)* (-) EMA (dummy = 1 when a country is a member of the EMA) Inflation * () ATC fixed effects
a. Focus Effects have been classified according to the paper: i) Drug characteristics such as pack size, strenght etc. ii) Brand competition such as number of brand therapeutic competitors iii) Regulation characteristics such as level of regulation (high, medium or low), type of regulation policy applied (reference pricing, external reference pricing, profit controls, etc.), etc. iv) Country characteristics such as demographic features, socioeconomics indicators, etc. v) Firm features such as firm location, type of firm (multinational or local), etc. b. Details on individual variables and information on variables having significant influence have not been displayed in this Table 2 because this paper carries out country by country regressions. Please, see the paper. c. TF: Theoretical Framework; GPRM: WHO’s Global Price Reporting Mechanism; MEPS: Medical Expenditure Panel Survey; AIFA: Italian National Agency for Drug Administration and Control Prices; PJB P: PJB Publications; MLIC: Middle and Low Income Countries; PI: Parallel Importer *: Statistically significant at 5%. **: Working papers (WP); n.a.: non-available


B. Appendix B
B.1 Decision tree and proofs
ERP countries formulas
pERPminC
pImin min p
1, p
2...p
j...p
J if {C,D}
pImin min p
1, p
2...p
j...p
J, p
D if {D,C}
pERPD
pI
pj
J
j1
pC
J 1 if {C,D}
pI
pj
J
j1
J
if {D,C}
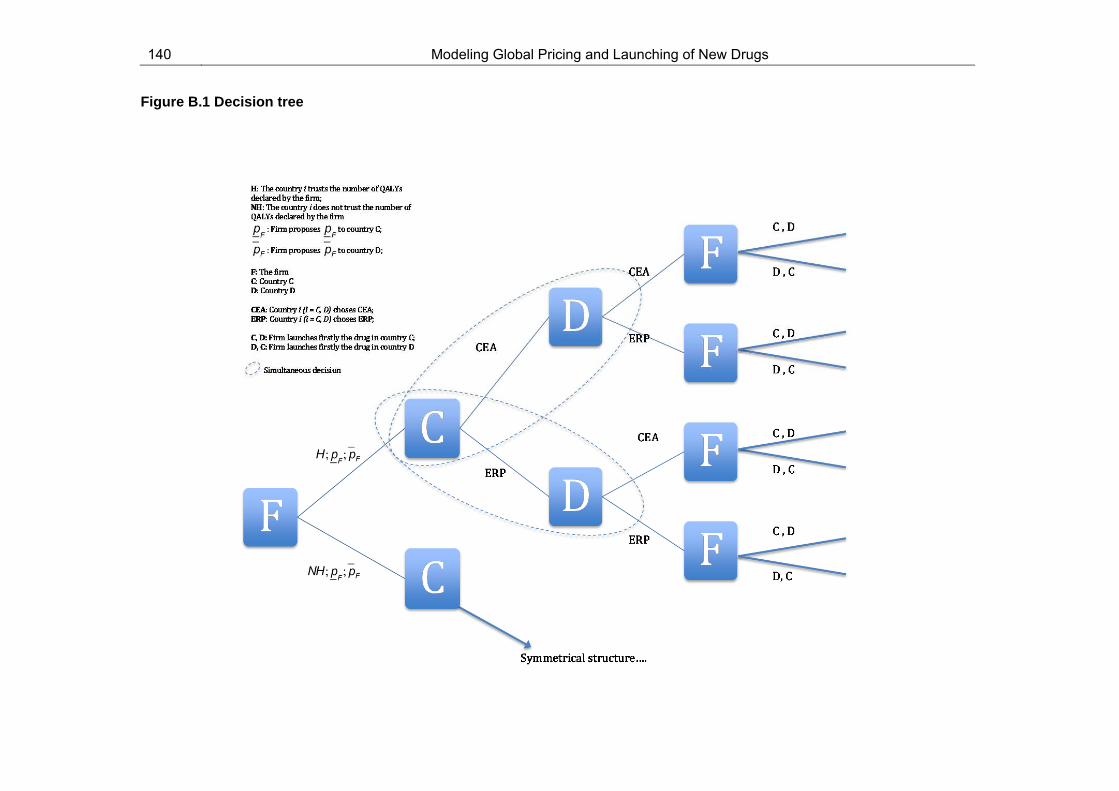
140 Modeling Global Pricing and Launching of New Drugs
Figure B.1 Decision tree
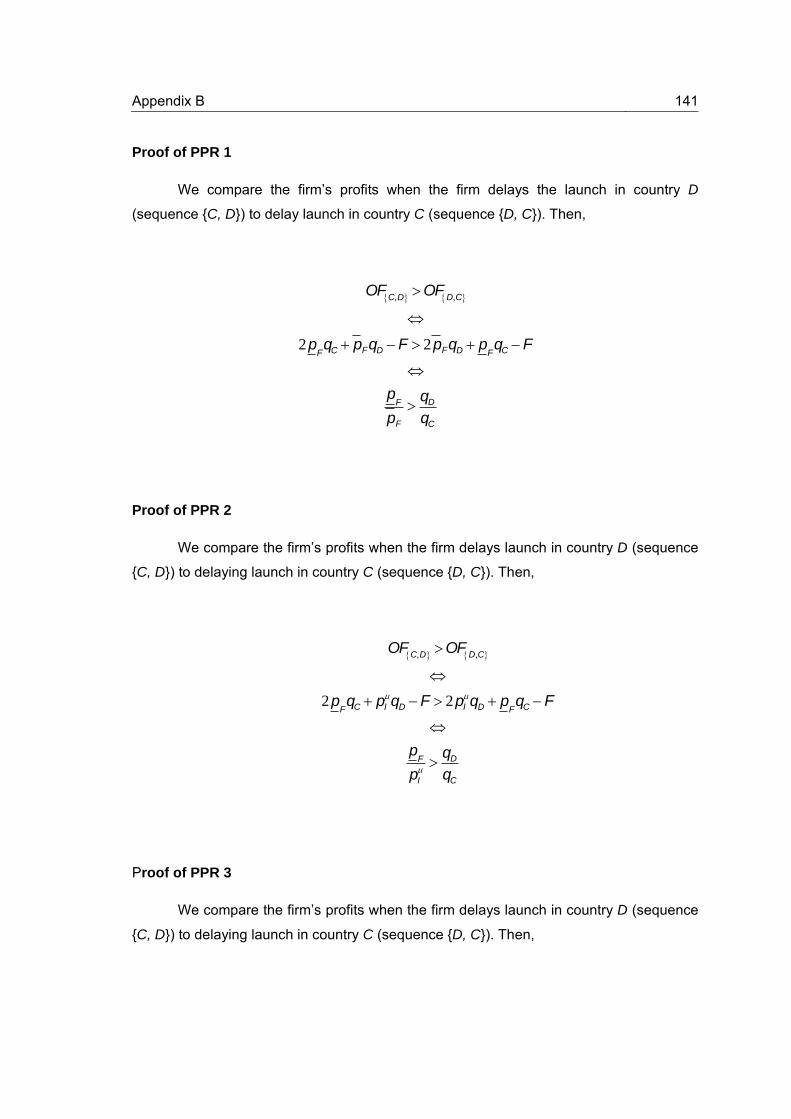
Appendix B 141
Proof of PPR 1
We compare the firm’s profits when the firm delays the launch in country D
(sequence {C, D}) to delay launch in country C (sequence {D, C}). Then,
Proof of PPR 2
We compare the firm’s profits when the firm delays launch in country D (sequence
{C, D}) to delaying launch in country C (sequence {D, C}). Then,
Proof of PPR 3
We compare the firm’s profits when the firm delays launch in country D (sequence
{C, D}) to delaying launch in country C (sequence {D, C}). Then,
OF C,D OF D,C
2pFqC pFqD F 2pFqD p
FqC F
p
F
pF
qD
qC
OF C,D OF D,C
2pFqC pI
qD F 2pIqD p
FqC F
p
F
pI
qD
qC
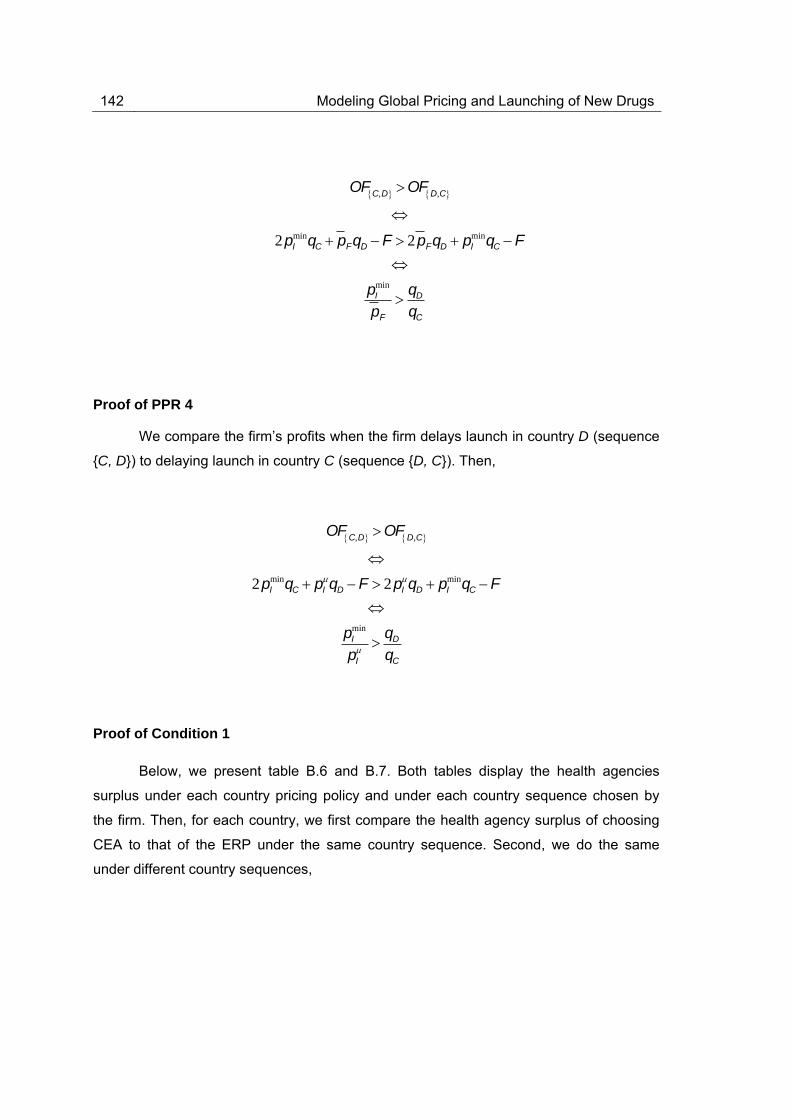
142 Modeling Global Pricing and Launching of New Drugs
Proof of PPR 4
We compare the firm’s profits when the firm delays launch in country D (sequence
{C, D}) to delaying launch in country C (sequence {D, C}). Then,
Proof of Condition 1
Below, we present table B.6 and B.7. Both tables display the health agencies
surplus under each country pricing policy and under each country sequence chosen by
the firm. Then, for each country, we first compare the health agency surplus of choosing
CEA to that of the ERP under the same country sequence. Second, we do the same
under different country sequences,
OF C,D OF D,C
2pIminqC pFqD F 2pFqD pI
minqC F
pImin
pF
qD
qC
OF C,D OF D,C
2pIminqC pI
qD F 2pIqD pI
minqC F
pImin
pI qD
qC

Appendix B 143
Table B.1. Health Agency surplus of country C
Country C {C,D} {D,C}
i) and iii) CEA OFC (WtPYF pF)qC a OFC (WtPYF p
F)qC a r
ii) and iv) ERP OFC (WtPYF pImin )qC OFC (WtPYF pI
min )qC r
Table B.2. Health Agency surplus of country D
Country D {C,D} {D,C}
i) and iii) CEA OFD (WtPYF pF )qD a OFD (WtPYF pF )qD a r
ii) and iv) ERP OFD (WtPYF pI )qD OFD (WtPYF pI
)qD r
Country C
So, we firstly operate for country C under sequence {C,D}. Notice that the surplus
under i) CEA and iii) CEA is the same. Analogously, the surplus under ii) ERP and iv)
ERP is also the same. Then, it is enough to compare only one of the surpluss when
applying the CEA to one of the surplus applying the ERP. So, under the sequence {C,D}:
ii) ERP i) CEA
(WtPYF pImin )qC (WtPYF p
F)qC a
a
qi
pImin p
F
Then, we also operate for country C under sequence {D,C}. Notice that the surplus
under i) CEA and iii) CEA is the same. Analogously, the surplus under ii) ERP and iv)
ERP is the same. Therefore, we just need to compare one of the surplus when applying
CEA to one of them applying the ERP.

144 Modeling Global Pricing and Launching of New Drugs
iv) ERP i) CEA
(WtPYF pImin )qC r (WtPYF p
F)qC a r
a
qi
pImin p
F
Second, we compare the health agency surplus of choosing CEA to that of the
ERP under the different country sequences. Since i) CEA and iii) CEA present the same
surplus under {C,D} and {D,C} we choose only one of each sequence to compare, for
example, i) CEA. As ii) ERP and iv) ERP also present the same surplus under {C,D} and
{D,C}, we can choose only one of each sequence to make the comparison, for example,
ii) ERP.
ii) ERP{D,C} i) CEA{C,D}
(WtPYF pImin )qC r (WtPYF p
F)qC a
a
qC
pImin p
F r
qC
ii) ERP{C,D} i) CEA{D,C}
(WtPYF pImin )qC (WtPYF p
F)qC a r
a
qC
pImin p
F r
qC

Appendix B 145
Country D
So, we firstly operate for country D under sequence {C,D}. Notice that the surplus
under i) CEA and ii) CEA is the same. Analogously, the surplus under iii) ERP and iv)
ERP is also the same. Then, it is enough to compare only one of the surpluss when
applying CEA to one of the surplus applying ERP. So, under the sequence {C,D}:
iii) ERP i) CEA
(WtPYF pI )qD r (WtPYF pF )qD a r
aqD
pI pF
Then, we also operate for country D under sequence {D,C}. Notice that the
surpluss under i) CEA and ii) CEA are the same. Analogously, the surpluss under iii) ERP
and iv) ERP are the same. Therefore, it is enough to compare only one of the surplus
when applying CEA to one of the surplus applying ERP.
iii) ERP i) CEA
(WtPYF pI )qD (WtPYF pF )qD a
aqD
pI pF
Second, we compare the health agency surplus of choosing CEA to that of the
ERP under the different country sequences. Since i) CEA and ii) CEA present the same
surplus under {C,D} and {D,C}, we choose only one of each sequence to compare, for
example, i) CEA. As iii) ERP and iv) ERP also present the same surplus under {C,D} and

146 Modeling Global Pricing and Launching of New Drugs
{D,C}, we can choose only one of each sequence to make the comparison, for example,
iii) ERP.
iii) ERP{D,C} i) CEA{C,D}
(WtPYF pI )qD (WtPYF pF )qD a r
aqC
pI pF
rqC
iii) ERP{C,D} i) CEA{D,C}
(WtPYF pI )qD r (WtPYF pF )qD a
aqC
pI pF
rqC

C. Appendix C
C.1. Variable definitions of Danzon and Epstein (2008)
Log Avg Price of Superior Brands (Lag 1Q): The (log lagged) unweighted average
price of competitor brand (originator and licensed, including parallel imports) products in
the same therapeutic class as a comprehensive measure of the direct effect of price
regulation on the expected price for a new drug. We have not included this variable in the
updated model because our database has only new launches, differently to the D&E
database, therefore, we have not been able to measure it, and additionally, because we
do not distinguish between superior and inferior drugs.
Superior Brand’s missing D.V.: A dummy variable equals to 1 whether the product k
has no superior brand competitors in country j in year t, and equals to 0 otherwise. We
have not included this variable in the updated model because our database has only new
launches, differently to the D&E database, and additionally, because we do not
distinguish between superior and inferior drugs.
Log Avg Price of Inferior Brands (Lag 1Q): The (log lagged) unweighted average price
of competitor brand (originator and licensed, including parallel imports) products in the
same therapeutic class as a comprehensive measure of the direct effect of price
regulation on the expected price for a new drug. We have not included this variable in the
updated model because our database has only new launches, differently to the D&E
database, therefore, we have not been able to measure it, and additionally, because we
do not distinguish between superior and inferior drugs.
Inferior Brand’s missing D.V.: A dummy variable equals to 1 whether the product k has
no inferior brand competitors in country j in year t, and equals to 0 otherwise. We have not
148 Modeling Global Pricing and Launching of New Drugs
included this variable in the updated model because our database has only new launches,
differently to the D&E database, and additionally, because we do not distinguish between
superior and inferior drugs.
Num Generic Manufs per Molc in Superior Subclass: Number of Generics
Manufacturers per Molecule in country j for superior subclass. We have not included this
variable since we only deals with on-patent molecules.
Num Generic Manufs per Molc in Inferior Subclass: Number of Generics
Manufacturers selling the drug s in country j for inferior subclass. We have not included
this variable since we only deals with on-patent molecules.
Generics Brand’s missing D.V: A dummy variable equals to 1 whether the product k has
no generics competitors in country j in year t, and equals to 0 otherwise. We have not
included this variable since we only deals with on-patent molecules.
No molecule in Superior Subclass: Since we do not distinguish between superior and
inferior drugs, we have not included this variable.
No molecule in Inferior Subclass: Since we do not distinguish between superior and
inferior drugs, we have not included this variable.
Time Since Global Launch (Yrs): number of years elapsed since the drug s global
launch until the drug s launch in country j. Note that under the updated model as we have
collected the launch time in month/year, we have considered each launch the first day of
the month.
Time Since Global Launch squared (Yrs): variable Time Since Global Launch squared.
First Global Launch Before 1990 D.V.: An indicator (=1) for molecules launched before
1990 controls for their relatively old age. Molecules launched during 1990-1995 are the
reference category (=0). Since the D&E database has not only the new launches but also
the drugs already launched into the market, they could differ between old and new
molecules, however, as our database has only new launches between 2006 and 2010, we
have not considered any drug as “old drug”.
First Global Launch in (1996-end) D.V.: An indicator for molecules launched since 1996
tests for effects of the EMA regime. Molecules launched during 1990-1995 are the

Appendix C 149
reference category.
Num Already Launched (UK, Germany): number of countries between the UK and
Germany where the drug s has already been launched at the time of launch of drug s in
country j. Under the updated model81 this variable considers the number of high-price EU
countries where the drug s has already been launched at the time of launch of drug s in
country j.
Num Already Launched (Sweden, Netherlands): number of countries (Sweden,
Netherlands) where the drug s has already been launched at drug s launch time in
country j. Under the updated model81 this variable is included in the variable “Num
Already Launched (UK, Germany)”.
Num Already Launched (Italy, France): number of countries (Italy, France) where the
drug s has already been launched at drug s launch time in country j. Under the updated
model81 this variable considers the number of low-priced EU countries where the drug s
has already been launched at the time of launch of drug s in country j.
Num Already Launched (Spain, Portugal, Greece): number of countries (Spain,
Portugal, Greece) where the drug s has already been launched at drug s launch time in
country j. Under the updated model81 this variable is included in the variable “Num
Already Launched (Italy, France)”.
Num Already Launched (Canada, Japan, Switzerland, USA): number of countries
(Spain, Portugal, Greece) where the drug s has already been launched at drug s launch
time in country j. Under the updated model81 this variable considers the number of high-
priced non-EU countries where the drug s has already been launched at the time of
launch of drug s in country j.
Any PI Share in Subclass D.V.: A dummy variable equals to 1 if any % of total sales of
drug s, is sold by parallel importers. Since we do not have information concerning parallel
trade, we have not included this variable.
First Brand Launch in Ctry-Subclass D.V.: A dummy variable equals to 1 whether the
81 Since our database has some different countries than that of D&E, we have grouped the countries by price level and their belonging to the EU, as D&E made for the variables concerning the Minimum Price (eg., Log Min Own Price in Hi-Price EU).

150 Modeling Global Pricing and Launching of New Drugs
launch of drug s in country j was the first entrant in country-subclass. Since our database
do not have the drugs already launched into the market, we have not included this
variable.
Second Brand Launch in Ctry-Subclass D.V.: A dummy variable equals to 1 whether
the launch of drug s in country j was the second entrant in country-subclass. Since our
database do not have the drugs already launched into the market, we have not included
this variable.
Third or Fourth Brand Launch in Ctry-Subclass D.V.: A dummy variable equals to 1
whether the launch of drug s in country j was the third or fourth entrant in country-
subclass. Since our database do not have the drugs already launched into the market, we
have not included this variable.
Log Min Own Price in Hi-Price EU (Lag 1Q): Logarithm of the lowest price received for
the molecule m in any country classified as high-price EU country where launch has
already occurred.
Log Min Own Price in Low-Price EU (Lag 1Q): Logarithm of the lowest price received
for the molecule m in any country classified as low-price EU country, where launch has
already occurred.
Log Min Own Price in Hi-Price non-EU (Lag 1Q): Logarithm of the lowest price received
for the molecule m in any country classified as high-price non-EU country where launch
has already occurred.
High-price EU Min Own Price Missing D.V.: A dummy variable equals to 1 whether the
molecule m has not been previously launched in any country classified as high-price EU
country.
Low-price EU Min Own Price Missing D.V.: A dummy variable equals to 1 whether the
molecule m has not been already launched in any country classified as low-price EU
country; otherwise equals to 0.
High-price non-EU Min Own Price Missing D.V.: A dummy variable equals to 1 whether
the molecule m has not been already launched in any country classified as high-price
non-EU country; otherwise equals to 0.

Appendix C 151
Launched by Local Originator D.V.: A dummy variable equals to 1 when identifying a
molecule’s originator corporation launching in its country of domicile; otherwise equals to
0.
Launched by Solo Licensee D.V.: A dummy variable equals to 1 when identifying a
locally-domiciled, licensed corporation that launched the molecule in at least one country
by itself.
Launched by Comarketed D.V.: A dummy variable equals to 1 when identifying a
locally-domiciled, licensee corporation that launched together with another firm in its
home country and did not launch alone in any country; otherwise equals to 0.
We note that the last three variables concerning the categories of firm are not
mutually exclusive; for example, a molecule with a small Local Originator could also have
a Solo Licensee or a Local Co-marketer as a marketing partner, all from the same
country. Therefore, all of them are included in the model and there is no common
reference category. We also note that we have not included the variable “Launched by
Co-marketed” in the updated model because there was no observation presenting this
characteristic.
USD to (ECU or Euro) Exchange Rate: Exchange rate USD/EURO.
Country-Specific Quarterly Producer Price Index: The Quarterly Producer Price Index
of country j in year t (price deflator).
Avg Pack Size (Up to 100): The average pack size of the available presentations (with
pack size lower than 100) in country j in year t. We have not included this variable
because we have found most observations missing for this variable.
Pack Size > 100 D.V.: A dummy variable equals to 1 whether the average pack size of
the available presentations, is greater than 100. We have not included this variable
because we have found most observations missing for this variable.
Avg Pill Strength (g): The average strength measured in grams of the available
presentations in country j in year t.
Form: Oral Solid Delayed D.V.: A dummy variable equals to 1 whether the form of the
presentation is Oral Solid.
152 Modeling Global Pricing and Launching of New Drugs
Form: Injectable D.V.: A dummy variable equals to 1 if the form of the presentation is
Injectable
Form: Other: A dummy variable equals to 1 if the form of the presentation is not neither
oral solid nor injectable
Log GDP per Capita: Logarithm of the Gross Domestic Product (GDP) of country j in
year t.
Country Fixed Effects: A dummy variable for each country j, to capture other country
specific factors that may affect launch delay and launch prices, as bureaucratically-driven
delays and parallel export risk. Germany is excluded as the reference country.
Year Fixed Effects: A dummy variable for each year t, included in some specifications.
Omitted in tables because its lack of significance.

Appendix C 153
Table C.1. Launch equation: D&E vs. Updated model
Coefficients Marginal Effects Clog-log with robust
clustered SEs Clog-log with Normal
REs Clog-log with robust
clustered SEs Clog-log with Normal
REs Variables D&E UM D&E UM D&E UM D&E UM
Log Avg Price of Superior Brands (Lag 1Q) 0.1138** ‐ 0.1442*** ‐ 0.0053* ‐ 0.0086*** ‐
[0.0552] ‐ [0.0476] ‐ [0.0027] ‐ [0.0032] ‐
Log Avg Price of Inferior Brands (Lag 1Q) 6.58E‐02 ‐ 0.0894* ‐ 3.10E‐03 ‐ 0.0053* ‐
[0.0612] ‐ [0.0506] ‐ [0.0029] ‐ [0.0031] ‐
Log Total Volume of All Drugs in Class (Lag 1Q) ‐0.0738 ‐ ‐0.0202 ‐ ‐0.0034 ‐ ‐0.0012 ‐
[0.0527] ‐ [0.0581] ‐ [0.0027] ‐ [0.0035] ‐ Num Generic Manufs per Molc in Superior Subclass (Lag 1Q)
‐0.004 ‐‐0.0079
‐‐0.0002
‐‐0.0005
‐
[0.0045] ‐ [0.0059] ‐ [0.0002] ‐ [0.0004] ‐ Num Generic Manufs per Molc in Inferior Subclass (Lag 1Q)
‐0.0016 ‐‐0.0014
‐‐0.0001
‐‐0.0001
‐
[0.0021] ‐ [0.0017] ‐ [0.0001] ‐ [0.0001] ‐
No Molecules in Superior Subclass D.V. 0.2585 ‐ 0.1416 ‐ 0.0135 ‐ 0.0089 ‐
[0.1848] ‐ [0.1947] ‐ [0.0105] ‐ [0.0129] ‐
No Molecules in Inferior Subclass D.V. ‐0.5880*** ‐ ‐0.5529 ‐ ‐0.0210*** ‐ ‐0.0264 ‐
[0.2181] ‐ [0.4677] ‐ [0.0074] ‐ [0.0181] ‐
Time Since Global Launch (Yrs) ‐0.6240*** ‐0.6185*** ‐0.4540*** ‐1.4765*** ‐0.0291*** ‐0.0930*** ‐0.0271*** ‐1.4765***
[0.0578] [0.2109] [0.0536] [0.1461] [0.0046] [0.0312] [0.0049] [0.1461]
Time Since Global Launch Squared (Yrs) 0.0231*** 0.0471 0.0158*** 0.1100*** 0.0011*** 0.0070 0.0009*** 0.1100***
[0.0027] [0.0398] [0.0030] [0.0280] [0.0002] [0.0060] [0.0002] [0.0280]
First Global Launch Before 1990 D.V. ‐0.0034 ‐ ‐0.2426 ‐ ‐0.0002 ‐ ‐0.0131 ‐
[0.1931] ‐ [0.2860] ‐ [0.0090] ‐ [0.0149] ‐
First Global Launch in [1996-end] D.V. ‐0.0497 ‐ ‐0.1018 ‐ ‐0.0023 ‐ ‐0.0058 ‐
[0.1479] ‐ [0.1907] ‐ [0.0066] ‐ [0.0108] ‐
Num Already Launched (UK, Germany) 0.5935*** 0.1137*** 0.4902*** 0.1351*** 0.0290*** 0.0171*** 0.0301*** 0.1351***
[0.0920] [0.0167] [0.0785] [0.0151] [0.0071] [0.0023] [0.0072] [0.0151]
Num Already Launched (Sweden, Netherlands) 0.5079*** ‐ 0.3935*** ‐ 0.0245*** ‐ 0.0239*** ‐
[0.0705] ‐ [0.0749] ‐ [0.0052] ‐ [0.0059] ‐
Num Already Launched (Italy, France) 0.2688*** ‐0.2323*** 0.3057*** ‐0.1625*** 0.0126** ‐0.0349*** 0.0185*** ‐0.1625***
[0.0986] [0.0519] [0.0840] [0.0340] [0.0055] [0.0072] [0.0058] [0.0340]

154 Modeling Global Pricing and Launching of New Drugs
Coefficients Marginal Effects Clog-log with robust
clustered SEs Clog-log with Normal
REs Clog-log with robust
clustered SEs Clog-log with Normal
REs Variables D&E UM D&E UM D&E UM D&E UM
Num Already Launched (Spain, Portugal, Greece) 0.067 ‐ ‐0.0409 ‐ 0.0031 ‐ ‐0.0024 ‐
[0.0661] ‐ [0.0654] ‐ [0.0030] ‐ [0.0040] ‐
Num Already Launched (Canada, Japan, Switzerland, USA) 0.1907*** 0.2293*** 0.1321** 0.2378*** 0.0089*** 0.0344*** 0.0079** 0.2378***
[0.0637] [0.0366] [0.0560] [0.0282] [0.0030] [0.0050] [0.0035] [0.0282]
Any PI Share in Subclass D.V. 0.0161 ‐ 0.067 ‐ 0.0008 ‐ 0.0041 ‐
[0.1536] ‐ [0.1510] ‐ [0.0072] ‐ [0.0092] ‐
Launch by Local Originator Corporation D.V. 1.3954*** 0.1504 1.5681*** 0.1603 0.1286*** 0.0233 0.1822*** 0.1603
[0.2676] [0.1099] [0.1626] [0.1788] [0.0458] [0.0177] [0.0420] [0.1788]
Launch by Solo Licensee Corporation D.V. 0.5481*** 0.4494 0.5646*** 0.0012 0.0328** 0.0752 0.0424*** 0.0012
[0.1765] [0.4546] [0.1551] [0.4065] [0.0130] [0.0841] [0.0157] [0.4065]
Launch by Local Co-marketer Corporation D.V. 0.5592*** ‐ 0.3463* ‐ 0.0340** ‐ 0.0239 ‐
[0.1786] ‐ [0.1984] ‐ [0.0145] ‐ [0.0160] ‐
USD to (ECU or Euro) Exchange Rate 0.0945 ‐14.1664** ‐0.192 ‐21.722*** 0.0044 ‐2.1310*** ‐0.0115 ‐21.722***
[0.4523] [1.4340] [0.4216] [1.1970] [0.0209] [0.2154] [0.0255] [1.1970]
UK D.V. ‐0.243 ‐ 0.0540*** ‐0.1616 ‐0.0074 ‐0.0101 ‐0.0092 ‐0.009 ‐0.0074
[0.2096] [0.0907] [0.2000] [0.2250] [0.0085] [0.0155] [0.0111] [0.2099]
Netherlands D.V. ‐0.8790*** 0.0202 ‐0.7894*** +0.0892 ‐0.0276*** 0.0035 ‐0.0343*** 0.2115
[0.2465] [0.1088] [0.2194] [0.2324] [0.0082] [0.0190] [0.0106] [0.2250]
Sweden D.V. ‐0.7520** 0.1008 ‐0.5688** 0.0779 ‐0.0249** 0.0179 ‐0.0269** 0.0892
[0.2968] [0.0718] [0.2307] [0.2094] [0.0099] [0.0129] [0.0116] [0.2324]
France D.V. ‐1.2645*** ‐0.8017*** ‐1.2202*** ‐0.5192** ‐0.0340*** ‐0.1153*** ‐0.0452*** ‐0.5192
[0.2103] [0.1610] [0.2304] [0.2574] [0.0078] [0.0215] [0.0110] [0.2574]
Greece D.V. ‐1.2725*** ‐ ‐1.0673*** ‐ ‐0.0341*** ‐ ‐0.0418*** ‐
[0.2637] ‐ [0.2496] ‐ [0.0086] ‐ [0.0116] ‐
Italy D.V. ‐0.9829*** ‐0.9402*** ‐0.8500*** ‐0.7843*** ‐0.0296*** ‐0.1305*** ‐0.0361*** ‐0.7843**
[0.2439] [0.1960] [0.2173] [0.3042] [0.0084] [0.0237] [0.0109] [0.3042]
Portugal D.V. ‐1.9128*** ‐ ‐1.7246*** ‐ ‐0.0405*** ‐ ‐0.0536*** ‐
[0.2319] ‐ [0.2522] ‐ [0.0084] ‐ [0.0115] ‐
Spain D.V. ‐0.8052*** ‐0.8177*** ‐0.6327*** ‐0.6889** ‐0.0261*** ‐0.1171*** ‐0.0292*** ‐0.6889**
[0.2007] [0.1738] [0.2181] [0.2869] [0.0079] [0.0223] [0.0112] [0.2869]
Canada D.V. ‐1.0640*** ‐0.4958*** ‐0.9515*** ‐0.2299 ‐0.0310*** ‐0.0769*** ‐0.0389*** ‐0.2299

Appendix C 155
Coefficients Marginal Effects Clog-log with robust
clustered SEs Clog-log with Normal
REs Clog-log with robust
clustered SEs Clog-log with Normal
REs Variables D&E UM D&E UM D&E UM D&E UM
[0.2341] [0.1228] [0.2103] [0.2231] [0.0084] [0.0190] [0.0108] [0.2231]
Japan D.V. ‐2.4793*** ‐1.2956*** ‐2.5477*** ‐0.8370*** ‐0.0436*** ‐0.1639*** ‐0.0613*** ‐0.8370***
[0.2353] [0.2266][0.2339]
[0.2794] [0.0083]
[0.0229][0.0114]
[0.2794]
Switzerland D.V. ‐1.0800*** ‐0.2259* ‐0.9100*** ‐0.1484 ‐0.0313*** ‐0.0373* ‐0.0378*** ‐0.1484
[0.2644] [0.1266] [0.2540] [0.2192] [0.0089] [0.0203] [0.0119] [0.2192]
USA D.V. ‐0.9119*** ‐0.0848 ‐0.9440*** ‐0.3566 ‐0.0283*** ‐0.0144*** ‐0.0387*** n.e.
[0.2876] [0.1109] [0.2336] [0.2189] [0.0085] [0.0188] [0.0104] n.e.
Brazil D.V. ‐1.1626*** ‐ ‐0.9768*** ‐ ‐0.0326*** ‐ ‐0.0395*** ‐
[0.2411] ‐ [0.2211] ‐ [0.0084] ‐ [0.0111] ‐
Mexico D.V. ‐1.3041*** ‐ ‐1.1008*** ‐ ‐0.0345*** ‐ ‐0.0426*** ‐
[0.2765] ‐ [0.2448] ‐ [0.0086] ‐ [0.0115] ‐
Austria D.V.
‐‐0.1206*
‐ ‐0.0957no sig
‐ ‐0.0204*** ‐ ‐0.0957
‐ [0.0694] ‐ [0.2108] ‐ [0.0117] ‐ [0.2108]
Belgium D.V. ‐ ‐1.0137*** ‐ ‐0.6231** ‐ ‐0.1381*** ‐ ‐0.6231**
‐ [0.1833] ‐ [0.2820] ‐ [0.0221] ‐ [0.2820]
Czech Republic D.V. ‐ ‐0.7642*** ‐ ‐0.6421** ‐ ‐0.1110*** ‐ ‐0.6421**
‐ [0.1831] ‐ [0.2552] ‐ [0.0235] ‐ [0.2552]
Denmark D.V. ‐ ‐0.0376 ‐ ‐0.0265 ‐ ‐0.0064 ‐ ‐0.0265
‐ [0.0615] ‐ [0.2013] ‐ [0.0106] ‐ [0.2013]
Finland D.V. ‐ ‐0.2771*** ‐ ‐0.1990 ‐ ‐0.0452** ‐ ‐0.1990
‐ [0.1304] ‐ [0.2342] ‐ [0.0209] ‐ [0.2342]
Germany D.V. RC RC RC RC RC RC RC RC
RC RC RC RC RC RC RC RC
Hungary D.V. ‐ ‐0.9181*** ‐ ‐0.5569** ‐ ‐0.1282*** ‐ ‐0.7843**
‐ [0.1966] ‐ [0.2464] ‐ [0.0238] ‐ [0.3042]
Norway D.V. ‐ ‐0.0440 ‐ 0.0225 ‐ ‐0.0075 ‐ 0.0225
‐ [0.1135] ‐ [0.2272] ‐ [0.0195] ‐ [0.2272]
Poland D.V. ‐ ‐0.5140*** ‐ ‐0.4264* ‐ ‐0.0794*** ‐ ‐0.4264*
‐ [0.1758] ‐ [0.2564] ‐ [0.0251] ‐ [0.2564]

156 Modeling Global Pricing and Launching of New Drugs
Coefficients Marginal Effects Clog-log with robust
clustered SEs Clog-log with Normal
REs Clog-log with robust
clustered SEs Clog-log with Normal
REs Variables D&E UM D&E UM D&E UM D&E UM
Australia D.V. ‐ ‐0.6305*** ‐ ‐0.3451 ‐ ‐0.0946*** ‐ n.e.
‐ [0.1544] ‐ [0.2377] ‐ [0.0213] ‐ n.e.
Constant ‐1.1015 9.5227*** ‐1.6217 15.842*** ‐ ‐ ‐ ‐
[0.9652] [1.0730] [1.0217] [1.0061] ‐ ‐ ‐ ‐
Num Observations 23,400 3609 23,400 3609 23,400 3609 23,400 3609
Number of Molecule- level Clusters 111 71 111 71 111 71 111 71
Model Log-Likelihood ‐3071.2 ‐1385.6 ‐3045.7 ‐1292.5 ‐ ‐ ‐ ‐
Mean of Dependent Variable 0.0378 0.09543 0.0378 0.09543 0.0378 0.09543 0.0378 0.09543 Significance(sign.)levels(two‐sided):*:p<0.10;**:p<0.05;***:p<0.01.;[]:standarderror;n.r.:no‐reported;‐:no‐included;RC:referencecategory;D&E:DanzonandEpstein,2008results;UM:Updatedmodelresults;D.V.:Dummyvariable;IMR:InverseMillsRatio
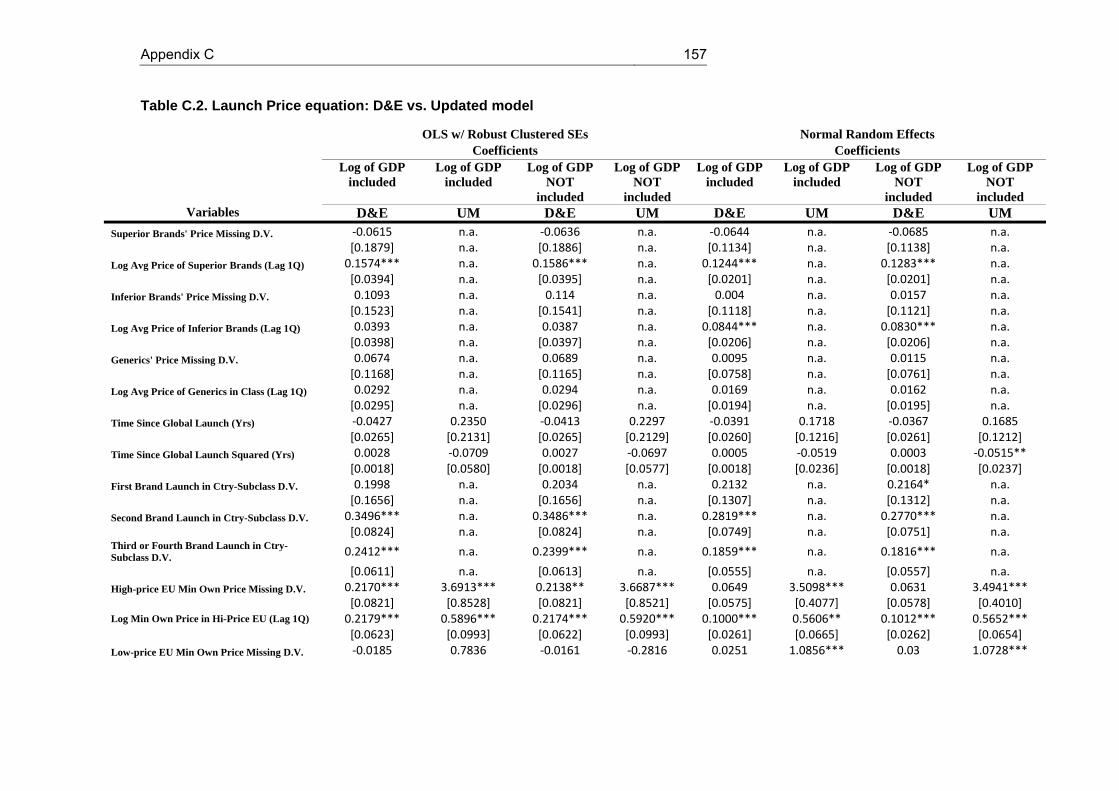
Appendix C 157
Table C.2. Launch Price equation: D&E vs. Updated model
OLS w/ Robust Clustered SEs Normal Random Effects Coefficients Coefficients Log of GDP
included Log of GDP
included Log of GDP
NOT included
Log of GDP NOT
included
Log of GDP included
Log of GDP included
Log of GDP NOT
included
Log of GDP NOT
included Variables D&E UM D&E UM D&E UM D&E UM
Superior Brands' Price Missing D.V. ‐0.0615 n.a. ‐0.0636 n.a. ‐0.0644 n.a. ‐0.0685 n.a. [0.1879] n.a. [0.1886] n.a. [0.1134] n.a. [0.1138] n.a. Log Avg Price of Superior Brands (Lag 1Q) 0.1574*** n.a. 0.1586*** n.a. 0.1244*** n.a. 0.1283*** n.a. [0.0394] n.a. [0.0395] n.a. [0.0201] n.a. [0.0201] n.a. Inferior Brands' Price Missing D.V. 0.1093 n.a. 0.114 n.a. 0.004 n.a. 0.0157 n.a. [0.1523] n.a. [0.1541] n.a. [0.1118] n.a. [0.1121] n.a. Log Avg Price of Inferior Brands (Lag 1Q) 0.0393 n.a. 0.0387 n.a. 0.0844*** n.a. 0.0830*** n.a. [0.0398] n.a. [0.0397] n.a. [0.0206] n.a. [0.0206] n.a. Generics' Price Missing D.V. 0.0674 n.a. 0.0689 n.a. 0.0095 n.a. 0.0115 n.a. [0.1168] n.a. [0.1165] n.a. [0.0758] n.a. [0.0761] n.a. Log Avg Price of Generics in Class (Lag 1Q) 0.0292 n.a. 0.0294 n.a. 0.0169 n.a. 0.0162 n.a.
[0.0295] n.a. [0.0296] n.a. [0.0194] n.a. [0.0195] n.a.
Time Since Global Launch (Yrs) ‐0.0427 0.2350 ‐0.0413 0.2297 ‐0.0391 0.1718 ‐0.0367 0.1685
[0.0265] [0.2131] [0.0265] [0.2129] [0.0260] [0.1216] [0.0261] [0.1212]
Time Since Global Launch Squared (Yrs) 0.0028 ‐0.0709 0.0027 ‐0.0697 0.0005 ‐0.0519 0.0003 ‐0.0515**
[0.0018] [0.0580] [0.0018] [0.0577] [0.0018] [0.0236] [0.0018] [0.0237]
First Brand Launch in Ctry-Subclass D.V. 0.1998 n.a. 0.2034 n.a. 0.2132 n.a. 0.2164* n.a.
[0.1656] n.a. [0.1656] n.a. [0.1307] n.a. [0.1312] n.a.
Second Brand Launch in Ctry-Subclass D.V. 0.3496*** n.a. 0.3486*** n.a. 0.2819*** n.a. 0.2770*** n.a.
[0.0824] n.a. [0.0824] n.a. [0.0749] n.a. [0.0751] n.a. Third or Fourth Brand Launch in Ctry- Subclass D.V. 0.2412*** n.a. 0.2399*** n.a. 0.1859*** n.a. 0.1816*** n.a.
[0.0611] n.a. [0.0613] n.a. [0.0555] n.a. [0.0557] n.a.
High-price EU Min Own Price Missing D.V. 0.2170*** 3.6913*** 0.2138** 3.6687*** 0.0649 3.5098*** 0.0631 3.4941***
[0.0821] [0.8528] [0.0821] [0.8521] [0.0575] [0.4077] [0.0578] [0.4010] Log Min Own Price in Hi-Price EU (Lag 1Q) 0.2179*** 0.5896*** 0.2174*** 0.5920*** 0.1000*** 0.5606** 0.1012*** 0.5652***
[0.0623] [0.0993] [0.0622] [0.0993] [0.0261] [0.0665] [0.0262] [0.0654]
Low-price EU Min Own Price Missing D.V. ‐0.0185 0.7836 ‐0.0161 ‐0.2816 0.0251 1.0856*** 0.03 1.0728***

158 Modeling Global Pricing and Launching of New Drugs
OLS w/ Robust Clustered SEs Normal Random Effects Coefficients Coefficients Log of GDP
included Log of GDP
included Log of GDP
NOT included
Log of GDP NOT
included
Log of GDP included
Log of GDP included
Log of GDP NOT
included
Log of GDP NOT
included Variables D&E UM D&E UM D&E UM D&E UM
[0.0524] [0.5238] [0.0527] [0.3580] [0.0483] [0.3777] [0.0485] [0.3724] Log Min Own Price in Low-Price EU (Lag 1Q) ‐0.0243
0.1286‐0.0234
.7813‐0.0221
0.2028***‐0.0188
0.2018***
[0.0394] [0.0824] [0.0390] [0.0660] [0.0279] [0.0715] [0.0280] [0.0702] High-price non-EU Min Own Price Missing D.V. 0.1054 0.0295 0.1076 0.0538 0.1019* ‐0.7910** 0.1049* ‐0.7322**
[0.0649] [0.4630] [0.0651] [0.4523] [0.0554] [0.3258] [0.0556] [0.3217] Log Min Own Price in Hi-Price non-EU (Lag 1Q) 0.2682*** 0.0173 0.2677*** 0.0162 0.1433*** ‐0.1467*** 0.1425*** ‐0.1442***
[0.0522] [0.0560] [0.0519] [0.0567] [0.0251] [0.0309] [0.0252] [0.0521]
Any PI Share in Subclass D.V. 0.022 n.a. 0.0232 n.a. 0.0207 n.a. 0.0236 n.a.
[0.0795] n.a. [0.0786] n.a. [0.0650] n.a. [0.0653] n.a.
Log GDP per Capita 0.862 0.7603 ‐ - 1.8350** 2.6070 ‐ ‐
[0.9232] [2.744] ‐ - [0.7426] [1.6017] ‐ ‐ Launch by Local Originator Corporation D.V. 0.0311 ‐0.1260 0.0332 ‐0.1271 0.0693 ‐0.1400 0.0739 ‐0.1413
[0.1009] [0.1064] [0.1011] [0.1054] [0.0694] [0.1480] [0.0696] [0.1486]
Launch by Solo Licensee Corporation D.V. ‐0.0742 ‐0.7741*** ‐0.0708 ‐0.7695 ‐0.0543 ‐0.2689 ‐0.0452 ‐0.2805
[0.0770] [0.2911] [0.0768] [0.2904] [0.0623] [0.3203] [0.0625] [0.3213] Launch by Local Co-marketer Corporation D.V. 0.0031
n.a.0.0038
n.a.0.0265
n.a.0.0288
n.a.
[0.0971] n.a. [0.0980] n.a. [0.0782] n.a. [0.0785] n.a.
USD to (ECU or Euro) Exchange Rate ‐0.1475 0.0745 ‐0.1373 ‐11.9437 ‐0.0265 2.5506 0.0042 ‐8.2194
[0.6339] [10.8946] [0.6234] [8.0278] [0.4524] [10.4129] [0.4542] [8.0960] Country-Specific Quarterly Producer Price Index ‐0.0089**
‐0.0226*‐0.0065
‐0.0139‐0.0088**
‐0.0194**‐0.0038
‐0.0117
[0.0044] [0.0113] [0.0039] [0.0091] [0.0044] [0.0091] [0.0039] [0.0078]
Avg Pack Size (Up to 100) ‐0.0118*** n.a. ‐0.0118*** n.a. ‐0.0094*** n.a. ‐0.0093*** n.a.
[0.0017] n.a. [0.0017] n.a. [0.0010] n.a. [0.0010] n.a.
Pack Size > 100 D.V. ‐1.1996*** n.a. ‐1.2014*** n.a. ‐0.9891*** n.a. ‐0.9930*** n.a.
[0.1880] n.a. [0.1888] n.a. [0.1114] n.a. [0.1118] n.a.
Avg Pill Strength (g) 0.4791* 6.69e‐08 0.4928** 6.41e‐08 0.0577 7.88e‐08 0.0766 7.48e‐08

Appendix C 159
OLS w/ Robust Clustered SEs Normal Random Effects Coefficients Coefficients Log of GDP
included Log of GDP
included Log of GDP
NOT included
Log of GDP NOT
included
Log of GDP included
Log of GDP included
Log of GDP NOT
included
Log of GDP NOT
included Variables D&E UM D&E UM D&E UM D&E UM
[0.2452] [7.09e‐08] [0.2457] [7.14e‐08] [0.2737] [1.66e‐07] [0.2738] 1.62e‐07
Form: Oral Solid D.V. ‐0.1014 1.0132*** ‐0.1092 1.0067** 0.1059 1.0828 0.0926 1.0512
[0.1994] [0.3894] [0.1988] [0.3903] [0.1823] [1.0963] [0.1829] [1.0632]
Form: Injectable D.V. 2.0793*** 2.2366*** 2.0865*** 2.2307*** 1.7654*** 2.8240** 1.7827*** 2.7787***
[0.3009] [0.6784] [0.3025] [0.6798] [0.0885] [1.1136] [0.0887] [1.0812]
Form: Other ‐0.0523 0.6951*** ‐0.0551 0.6929 0.0793 0.1795 0.0734 0.1724
[0.1683] [0.5717] [0.1663] [0.5697] [0.1702] [1.2235] [0.1708] [1.1869]
IMR n.r. 5.9640*** n.r. 5.8563*** n.r. 2.3759 n.r. 2.4453
n.r. [2.2320] n.r. [2.2150] n.r. [1.8211] n.r. [1.8211]
UK D.V. ‐0.3218*** ‐0.6239*** ‐0.2751*** ‐0.5530*** ‐0.2829*** ‐0.5943*** ‐0.1861** ‐0.5316***
[0.0957] [0.1362] [0.0827] [0.1198] [0.0875] [0.1994] [0.0784] [0.1962]
Netherlands D.V. ‐0.0707 ‐0.7173** ‐0.0734 ‐0.3280*** ‐0.0669 ‐0.6824** ‐0.0711 ‐0.3305*
[0.1034] [0.2771] [0.1022] [0.1195] [0.0798] [0.2910] [0.0802] [0.1946]
Sweden D.V. ‐0.1746 ‐0.5008** ‐0.0541 ‐0.2797 ‐0.3307** ‐0.4641** ‐0.0743 ‐0.2667
[0.1684] [0.1931] [0.0859] [0.1018] [0.1335] [0.2164] [0.0844] [0.1793]
France D.V. ‐0.2055* ‐0.3881* ‐0.2382** ‐0.5045** ‐0.1272 ‐0.3579 ‐0.1956** ‐0.4619**
[0.1117] [0.2225] [0.1098] [0.2037] [0.1003] [0.2296] [0.0969] [0.2212]
Greece D.V. 0.2805 n.a. ‐0.3932*** n.a. 1.1945** n.a. ‐0.2393** n.a.
[0.7187] n.a. [0.1198] n.a. [0.5893] n.a. [0.1050] n.a.
Italy D.V. ‐0.19 ‐0.0913 ‐0.3485*** ‐0.3319 0.0835 ‐0.1937 ‐0.2521*** ‐0.4067
[0.1922] [0.2619] [0.1031] [0.2120] [0.1664] [0.2931] [0.0970] [0.2625]
Portugal D.V. 0.373 n.a. ‐0.3098*** n.a. 1.2153** n.a. ‐0.2341** n.a.
[0.7279] n.a. [0.1107] n.a. [0.5961] n.a. [0.1077] n.a.
Spain D.V. 0.1941 ‐0.1741 ‐0.2498** ‐0.4009** 0.7733** ‐0.1734 ‐0.1710* ‐0.3766
[0.4840] [0.2483] [0.0992] [0.1890] [0.3931] [0.2726] [0.0928] [0.2433]
Canada D.V. 0.0439 ‐0.7178*** 0.0363 ‐0.4194** 0.0338 ‐0.6016** 0.0197 ‐0.3318
[0.1078] [0.2653] [0.1054] [0.1616] [0.0923] [0.2613] [0.0925] [0.2023]
Japan D.V. 0.1482 0.0281 0.5852*** ‐0.1411 ‐0.3752 ‐0.1481 0.5573*** ‐0.2937
[0.5017] [0.2205] [0.2021] [0.1590] [0.3967] [0.2511] [0.1221] [0.2339]

160 Modeling Global Pricing and Launching of New Drugs
OLS w/ Robust Clustered SEs Normal Random Effects Coefficients Coefficients Log of GDP
included Log of GDP
included Log of GDP
NOT included
Log of GDP NOT
included
Log of GDP included
Log of GDP included
Log of GDP NOT
included
Log of GDP NOT
included Variables D&E UM D&E UM D&E UM D&E UM
Switzerland D.V. ‐0.1417 ‐0.4329 0.2091** 0.0725 ‐0.6109* ‐0.3742 0.1389 0.0820
[0.4039] [0.3313] [0.0911] [0.1263] [0.3162] [0.3355] [0.0888] [0.1845]
United States D.V. 0.1838 ‐0.5044 0.5272*** 0.3065** ‐0.35 ‐0.4903 0.3833*** 0.2424
[0.4014] [0.5798] [0.1347] [0.1475] [0.3125] [0.4857] [0.0987] [0.1833]
Brazil D.V. 1.2852 n.a. ‐0.3136*** n.a. 3.1815** n.a. ‐0.2182** n.a.
[1.6940] n.a. [0.1111] n.a. [1.3787] n.a. [0.0940] n.a.
Mexico D.V. 0.9276 n.a. ‐0.2477** n.a. 2.3375** n.a. ‐0.1610* n.a.
[1.2631] n.a. [0.1215] n.a. [1.0153] n.a. [0.0960] n.a.
Austria n.a. ‐0.3591* n.a. ‐0.1733 n.a. ‐0.3222 n.a. ‐0.1562
n.a. [0.1835] n.a. [0.1249] n.a. [0.1993] n.a. [0.1716]
Belgium n.a. ‐0.0142 n.a. ‐0.0247 n.a. ‐0.0153 n.a. ‐0.0193
n.a. [0.1682] n.a. [0.1680] n.a. [0.2316] n.a. [0.2324]
Czech Republic n.a. 0.8090 n.a. ‐0.2704 n.a. 0.6424 n.a. ‐0.3248
n.a. [0.6225] n.a. [0.2980] n.a. [0.6308] n.a. [0.2090]
Denmark n.a. ‐0.6089** n.a. ‐0.3469*** n.a. ‐0.4866** n.a. ‐0.2537
n.a. [0.2334] n.a. [0.1258] n.a. [0.2279] n.a. [0.1768]
Finland n.a. ‐0.2701** n.a. ‐0.2677** n.a. ‐0.2217 n.a. ‐0.2193
n.a. [0.1224] n.a. [0.1219] n.a. [0.1862] n.a. [0.1870]
Germany n.a. RC n.a. RC n.a. RC n.a. RC
n.a. RC n.a. RC n.a. RC n.a. RC
Hungary n.a. 1.9018 n.a. 0.1550 n.a. 1.5965 n.a. 0.0256
n.a. [1.2119] n.a. [0.1473] n.a. [0.9888] n.a. [0.2063]
Norway n.a. ‐1.4516 n.a. ‐0.0860 n.a. ‐1.2198 n.a. 0.0085
n.a. [1.0064] n.a. [0.2214] n.a. [0.7818] n.a. [0.1987]
Poland n.a. 2.4426 n.a. 0.2093 n.a. 2.1297* n.a. ‐0.2193**
n.a. [1.4799] n.a. [0.1641] n.a. [1.2562] n.a. [0.1870]
Australia n.a. ‐1.052* n.a. ‐0.7313 n.a. ‐1.0074*** n.a. ‐0.7155***
n.a. [0.6270] n.a. [0.4934] n.a. [0.2623] n.a. [0.1927]
Year-2004 n.r. RC n.r. RC n.r. RC n.r. RC
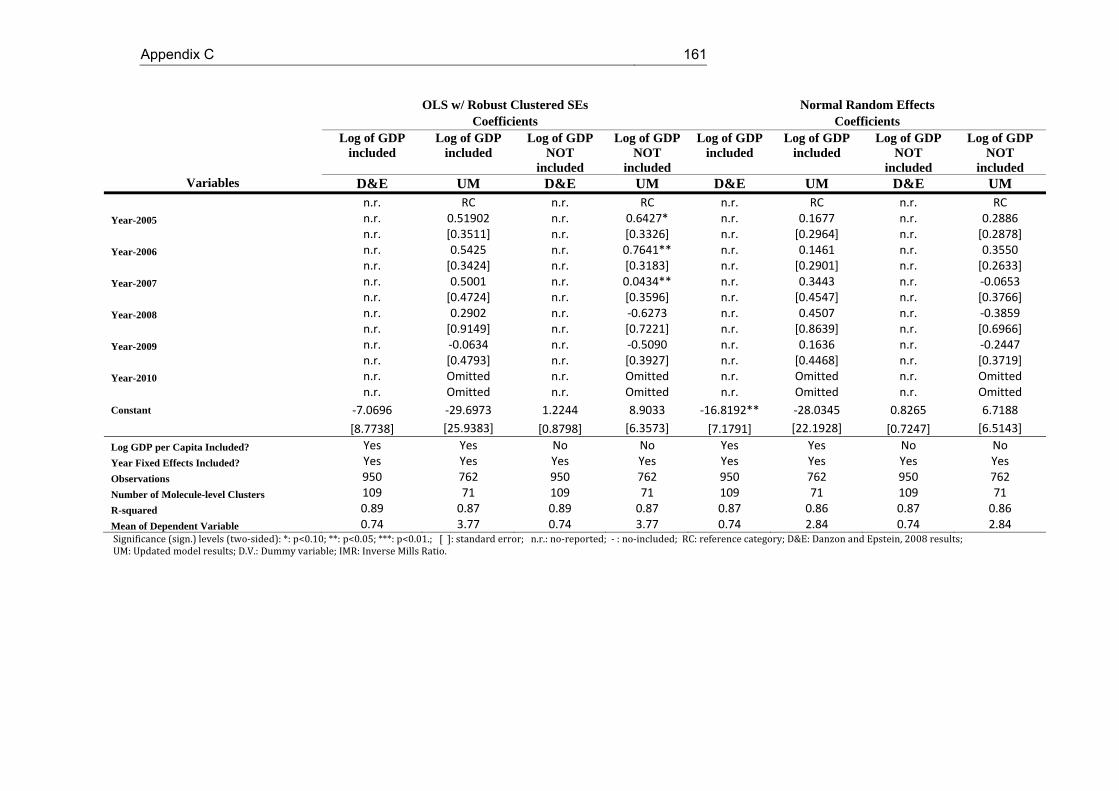
Appendix C 161
OLS w/ Robust Clustered SEs Normal Random Effects Coefficients Coefficients Log of GDP
included Log of GDP
included Log of GDP
NOT included
Log of GDP NOT
included
Log of GDP included
Log of GDP included
Log of GDP NOT
included
Log of GDP NOT
included Variables D&E UM D&E UM D&E UM D&E UM
n.r. RC n.r. RC n.r. RC n.r. RC
Year-2005 n.r. 0.51902 n.r. 0.6427* n.r. 0.1677 n.r. 0.2886
n.r. [0.3511] n.r. [0.3326] n.r. [0.2964] n.r. [0.2878]
Year-2006 n.r. 0.5425 n.r. 0.7641** n.r. 0.1461 n.r. 0.3550
n.r. [0.3424] n.r. [0.3183] n.r. [0.2901] n.r. [0.2633]
Year-2007 n.r. 0.5001 n.r. 0.0434** n.r. 0.3443 n.r. ‐0.0653
n.r. [0.4724] n.r. [0.3596] n.r. [0.4547] n.r. [0.3766]
Year-2008 n.r. 0.2902 n.r. ‐0.6273 n.r. 0.4507 n.r. ‐0.3859
n.r. [0.9149] n.r. [0.7221] n.r. [0.8639] n.r. [0.6966]
Year-2009 n.r. ‐0.0634 n.r. ‐0.5090 n.r. 0.1636 n.r. ‐0.2447
n.r. [0.4793] n.r. [0.3927] n.r. [0.4468] n.r. [0.3719]
Year-2010 n.r. Omitted n.r. Omitted n.r. Omitted n.r. Omitted
n.r. Omitted n.r. Omitted n.r. Omitted n.r. Omitted
Constant ‐7.0696 ‐29.6973 1.2244 8.9033 ‐16.8192** ‐28.0345 0.8265 6.7188
[8.7738] [25.9383] [0.8798] [6.3573] [7.1791] [22.1928] [0.7247] [6.5143]
Log GDP per Capita Included? Yes Yes No No Yes Yes No No
Year Fixed Effects Included? Yes Yes Yes Yes Yes Yes Yes Yes
Observations 950 762 950 762 950 762 950 762
Number of Molecule-level Clusters 109 71 109 71 109 71 109 71
R-squared 0.89 0.87 0.89 0.87 0.87 0.86 0.87 0.86
Mean of Dependent Variable 0.74 3.77 0.74 3.77 0.74 2.84 0.74 2.84 Significance(sign.)levels(two‐sided):*:p<0.10;**:p<0.05;***:p<0.01.;[]:standarderror;n.r.:no‐reported;‐:no‐included;RC:referencecategory;D&E:DanzonandEpstein,2008results;UM:Updatedmodelresults;D.V.:Dummyvariable;IMR:InverseMillsRatio.
162 Modeling Global Pricing and Launching of New Drugs
C.2. Variables definitions of Verniers et al. (2011)82
Launch window: the launch window of drug i in country j is the difference (in months)
between the month in which the drug was first launched anywhere in the world and the
month in which the drug was launched in country j. The month of launch is the first month
in which sales of the new drug are non-zero.
Launch price: The launch price of drug i in country j is the natural logarithm of the ex-
manufacturer price at launch (the selling price charged by the manufacturer to the
wholesaler) in US dollars per gram. To make drug prices comparable across countries,
the drug prices in local currencies are converted to US dollars using the currency
conversion rate at launch provided by the IMF.
Ex-manufacturer price regulation: A dummy variable that indicates the presence (= 1)
or absence (= 0) of a direct restriction of price levels by the regulator.
Profit control regulation: A dummy variable that indicates the presence (= 1) or absence
(= 0) of a threshold on the profits that drug companies can obtain.
Cross-country reference pricing regulation: A dummy variable that indicates the
presence (= 1) or absence (= 0) of the ERP in the country pricing policy.
Therapeutic reference pricing regulation: A dummy variable that indicates whether
health regulators generate a reference price for a cluster of therapeutically similar drugs,
above which price the patient is surcharged (= 1), or no such price is generated (= 0)
Pharmacoeconomic evidence regulation: A dummy variable that indicates whether
health regulators ask for some proof of the drug's cost effectiveness before launch (=1) or
not (=0).
Population size: The population size at the time of launch, measured by the natural
logarithm of the number of inhabitants of country j.
Health Expenditure: The natural logarithm of health expenditures per capita in country j
at the time of launch.
82 Variables preceded by (*) have not been included in the replicated model.

Appendix C 163
Strength of patent protection regulation: an index based on levels of patent laws
ranging from 0 to 5 for each country, representing weak to strong patent protection
(Ginarte and Park, 1997, Park and Wagh, 2002).
*Competition: the Herfindahl–Hirschman index for drug i in country j. This index is
constructed by summing the squared market shares (MS) (based on revenues in the IMS
Health data) of the m drugs in the same ATC4 category as drug i at the time of launch of
drug i in country j. A high Herfindahl-Hirschman index indicates that there is little
competition for drug i in country j. We have not included this variable in the updated
model because our database has only new launches, differently to the Verniers et al.
database (Verniers et al., 2011).
Firm’s home country: A dummy variable that indicates if the company's headquarters is
located in the country of launch j (=1) and 0 otherwise.
Selectivity variable: It is defined as the generalized residuals of the launch reduced
equation for the price equation, and the generalized residuals of the price equation for the
launch equation.
Summer: a dummy variable that captures whether the launch of drug i in country j
occurred in July or August for countries in the Northern Hemisphere or in January or
February for countries in the Southern Hemisphere.
EMA: a dummy variable that has the value 1 if a drug was launched in a country j that is
part of the EMA.
*Daily dosage: A drug i's defined daily dosage in grams is the assumed average
maintenance dose per day of a drug used for its main indication in adults (WHO
definition).
Inflation: the inflation rate (annual percentage change in GDP deflator) in country j at the
time of launch from the World Bank.
Anatomical therapeutic classes: Dummy variables for the therapeutic classes to which
drug i belongs. Verniers et al. treat the therapeutic class A10BG as the base category.
We treat the therapeutic class A as the reference category.
Power Distance: This quantitative index reflects the country’s degree to which a culture

164 Modeling Global Pricing and Launching of New Drugs
believes how institutional and organizational power should be distributed (equally or
unequally) and how the decisions of the power holders should be viewed (challenged or
accepted). In other words, people in high power distance cultures are much more
comfortable with a larger status differential than low power distance cultures. See
(Hofstede, 1984, Hofstede, 2001, Hofstede, 2012)
Individualism: This quantitative index describes the country’s degree to which a culture
relies on and has allegiance to the self or the group. See (Hofstede, 1984, Hofstede,
2001, Hofstede, 2012).
Masculinity: This quantitative index indicates the country’s degree to which a culture
values such behaviours as assertiveness, achievement, acquisition of wealth and caring
for others, social supports and the quality of life. See (Hofstede, 1984, Hofstede, 2001,
Hofstede, 2012).
Uncertainty Avoidance: This quantitative index refers to the extent to which a culture
feels threatened by ambiguous, uncertain situations and tries to avoid them by
establishing more structure. See (Hofstede, 1984, Hofstede, 2001, Hofstede, 2012).

Appendix C 165
Table C.3. List of countries. Verniers et al. vs. UM
Verniers et al. 2011 UM World Region and Countries North America Canada ✓Mexico Puerto Rico US ✓Western Europe Austria ✓Belgium ✓Denmark ✓Finland ✓France ✓Germany ✓Greece Ireland Italy ✓Luxemburg Netherlands ✓Norway ✓Portugal Spain ✓Sweden ✓Switzerland ✓UK ✓South America Argentina Brazil Chile Colombia Ecuador Peru Uruguay Venezuela Oceania Australia ✓New Zealand Asia Japan ✓Korea Philippines Eastern Europe Czech Republic ✓Estonia Hungary ✓Latvia Lithuania Poland ✓Slovakia Africa and the Middle East Egypt Jordan Kuwait
166 Modeling Global Pricing and Launching of New Drugs
Verniers et al. 2011 UM World Region and Countries Lebanon Morocco Saudi Arabia South Africa Tunisia United Arabic Emirates UM: Updated Model; ✓: Countries included in the UM

Appendix C 167
Table C.4. Launch Window and Launch Price equations. Verniers et al. vs. Updated Model
Hypothesized effect by
Verniers et al.
Launch Window Equation Hypothesized effect by
Verniers et al.
Launch price Equation
Variables Verniers et al. UM Verniers et al. UM
Constant ‐41.90*** ‐454.9407*** 3.19*** ‐21.4562
[5.99] [41.3960] [0.86] [47.2688]
Launch price ‐ ‐5.65*** ‐31.9941*** ‐ ‐
[0.8] [1.5060] ‐ ‐
Launch price^2 + 0.33*** 0.1684*** ‐ ‐
0.04 [0.0482] ‐ ‐
Launch window ‐ ‐ + 0.03*** 0.0672
‐ ‐ [5.10 x 10‐3] [0.1769]
Launch window^2 ‐ ‐ ‐ ‐1.79 x 10‐4*** ‐0.0015
‐ ‐ [5.89 x 10‐5] [0.0028]
Selectivity variable 2.77*** 29.8786*** ‐2.32 0.0108
[0.69] [1.3277] [2.81] [0.0959]
Ex-manufacturer price regulation + 3.75 12.0945 ‐ ‐0.14 1.3937
[2.55] [10.0227] [0.09] [11.0171]
Profit control regulation + 16.07*** ‐74.8528*** ‐ ‐0.14 ‐2.7865
[3.02] [10.1429] [0.11] [2.2248]
Cross-country reference pricing regulation ‐ ‐3.44 ‐74.2094*** + 0.06 ‐3.8411
[2.45] [5.1783] [0.12] [8.7102]
Therapeutic reference pricing regulation + 4.19** ‐36.1606*** ‐ ‐0.13 ‐2.0732
[1.92] [5.2288] [0.09] [8.0221]
Pharmaco-economic evidence regulation + 3.40* 19.3136*** ‐ ‐0.03 0.2929
[1.76] [5.1848] [0.09] [3.7278]
Strength of patent protection ‐ ‐5.96*** ‐70.0080*** ‐ ‐0.07* ‐3.2159
[1.89] [10.490] [0.09] [13.6724]
Population size ‐1.98** ‐73.3468*** 0.07 ‐2.2274
[0.79] [6.7747] [0.04] [3.2402]
Health expenditures per capita 19.23*** 113.5521*** 7.37 x 10‐3 5.0556
[1.75] [5.5933] [0.09] [11.6811]
Uncertainty avoidance ‐0.20*** 0.3786*** ‐1.45 x 10‐3 0.0141
[0.06] [0.0691] [2.82 x 10‐3] [0.0656]

168 Modeling Global Pricing and Launching of New Drugs
Hypothesized
effect by Verniers et al.
Launch Window Equation Hypothesized effect by
Verniers et al.
Launch price Equation
Variables Verniers et al. UM Verniers et al. UM
Masculinity 0.25*** 0.2802*** ‐1.71 x 10‐3 0.0063
[0.05] [0.0812] [2.33 x 10‐3] [0.0157]
Individualism ‐0.37*** 8.7132*** ‐3.62 x 10‐4 0.2624
[0.07] [0.8794] [3.22 x 10‐4] [0.4944]
Power distance 0.33*** 18.6091*** ‐6.04 x 10‐3 0.5755
[0.08] [1.8344] [3.82 x 10‐3] [0.9586]
Competition (reverse-scored) 2.57 n.a. 0.65*** n.a.
[2.38] n.a. [0.24] n.a.
Firm's home country ‐6.34*** ‐13.1345*** 0.44* ‐0.1680
[2.41] [1.7095] [0.23] [1.2266]
Summer ‐1.96* 1.8075* ‐ ‐
[1.14] [0.9471] ‐ ‐
EMA ‐4.01* 14.4236*** ‐ ‐
[2.14] [6.5522] ‐ ‐
Daily dosage ‐ ‐ ‐3.08* n.a.
‐ ‐ [0.18] n.a.
Inflation ‐ ‐ 9.79 x 10‐3 0.0844
‐ ‐ [8.29 x 10‐3] [0.0711]
Anatomical therapeutic classes n.r. *** n.r. *** n.r. *** n.r. ***
Observations 1711 505 1711 505
Adjusted R-Squared 0.26 0.53 0.66 0.38 Significance(sign.)levels(two‐sided):*:p<0.10;**:p<0.05;***:p<0.01.;[]:Standarderror;n.r.:no‐reported;n.a.:non‐available;‐:notincluded;UM:Updatedmodel
Appendix C 169
C.3. Variable definitions of the NPLM
Relative launch price: The relative launch price is the price ratio between the launch
price of molecule i, product k in country j at the time t, and the launch price of molecule i,
product k in country g at the first global launch time 0. Being country g the country where
the first global launching of molecule i has occurred. Both prices, numerator and
denominator, are measured at the ex-manufacturer price per standard unit.
Delay: the launch delay of molecule i in country j is the difference (in months) between
the month in which the drug was first launched anywhere in the world and the month in
which the drug was launched in the country j. The month of launch is the first month in
which sales of the new drug are non-zero.
External Reference Pricing (ERP): A dummy variable indicating if country j applies the
ERP (= 1) or (= 0) otherwise.
Log GDP per Capita: Logarithm of the Gross Domestic Product (GDP) of country j in
year t in Euros.
Log Population size (POP): The population size at time t, measured by the natural
logarithm of the number of inhabitants of country j.
Log Health Expenditure per capita (Exp_PublicHealth_percapita): The natural
logarithm of public health expenditures per capita in country j at time t in Euros.
Log Pharmaceutical Expenditure per capita (Exp_Pharma_percapita): The natural
logarithm of pharmaceutical expenditures per capita in country j at time t in Euros.
Log GDP per Capita (GDP2004): Logarithm of the Gross Domestic Product (GDP) of
country j in year 2004 in Euros.
Log Population size (POP2004): The population size in year 2004, measured by the
natural logarithm of the number of inhabitants of country j.
Log Health Expenditure per capita (HPE2004): The natural logarithm of public health
expenditures per capita in country j in year 2004 in Euros.
Log Pharmaceutical Expenditure per capita (PE2004): The natural logarithm of
pharmaceutical expenditures per capita in country j in year 2004 in Euros.

170 Modeling Global Pricing and Launching of New Drugs
EMA: A dummy variable that has the value 1 if a drug was launched in a country j that is
part of the EMA at the time of launching.
Home launched (HOME): A dummy variable that indicates if the company's headquarters
launching the molecule i is located in the country of launch j (=1) and 0 otherwise.
Inflation: the inflation rate (annual percentage change in GDP deflator) in country j at the
time of launch. Source: World Bank.
ATC: Dummy variables for the therapeutic classes to which molecule i could belong to an
ATC at level one (ATC-1). The therapeutic class A is used as reference category. The
therapeutic classes included are: A- Alimentary tract and metabolism, B- Blood and blood
forming organs, C- Cardiovascular system, D- Dermatologicals, G- Genito-urinary system
and sex hormones, J- Antiinfectives for systematic use, L- Antineoplastic and
immunomodulating agents, M- Musculo-skeletal system, N- Nervous system, R-
Respiratory system, S- Sensory organs and V- Various
Year Fixed Effects: A dummy variable for each year t. Reference year 2004.

Appendix C 171
Table C.5. Variable classification of the NPLM
Level / Time Time Invariant Time Variant
Molecule - ATC fixed effects (ATC)
Country
- External Reference Pricing (ERP) - Country Fixed Effect (CFE) - GDP per capita 2004 (GDP2004) - Population size 2004 (POP2004) - Pharmaceutical Expenditure per capita (HPE2004). - Public Health Expenditure per capita (PE2004).
- GDP per capita (GDP). - Population size (POP) - Pharmaceutical Expenditure per capita (Exp_Pharma_pc). - Public Health Expenditure per capita (Exp_PubHealth). - EMA (EMA)83.
Molecule-Country
- Delay (DELAY) - Home launched (HOME)
Molecule-Country-Presentation
-Relative price (RP)
Table C.6. Probit selection equation of NPML
Variables Retail HospitalDelay -0.0033*** -0.0022 [0.0007] [0.0008] Log of Country size (population) -0.0763*** -0.0634 [0.0193] [0.0159] Log of GDP per capita -0.7109 -0.4016 [0.5320] [0.4553] Log of Health Expenditure per capita 1.0860*** 0.8069 [0.3885] [0.3180] Log of Pharmaceutical Expenditure pc 0.5164*** 0.6106 [0.1083] [0.0960] IRP 0.0959** 0.0305 [0.0374] [0.0392] Firm’s home country -0.1846*** -0.2765
83 The EMA variable has been included in the launch equation of the NPLM as time invariant variable since only few countries of our database got into the EMA during the study period.

172 Modeling Global Pricing and Launching of New Drugs
Variables Retail Hospital
[0.0431] [0.0724] ema -0.2062*** -0.1657*** [0.0545] [0.0448] ATC A RC RC RC RC B -0.1834 -0.1478 [0.1658] [0.1249] C -0.0884 -0.1172 [0.1647] [0.1130] D -0.2234 -0.2476 [0.2056] [0.1260] G 0.1596 0.1589 [0.2248] [0.2095] J 0.1335 0.1676 [0.1760] [0.1489] L 0.0089 0.0105 [0.1756] [0.1401] M -0.1961 -0.0296 [0.2007] [0.1596] N 0.1631 0.1565 [0.2224] [0.2057] R -0.5232 -0.4502 [0.1494] [0.1191] S 0.1277 0.1722 [0.1713] [0.1384] T 0.2546 0.2735 [0.1499] [0.1146] V 0.4071 0.3979 [0.1539] [0.1253] Constant -4.0329 -5.843 [2.6845] [2.4505] Observations 6021 7585 Number of Molecule-presentation-level Clusters
69 71
R-squared 0.0463 0.0436 Significance(sign.)levels(two‐sided):*:p<0.10;**:p<0.05;***:p<0.01.;[]:Standarderror

Appendix C 173
C.4. Selection of parametric model
We have followed the method proposed by Kiefer (Kiefer, 1988). Basically, in a
first step, according to the empirical density function of the endogenous variable, as
shown in Figure C.1 and Figure C.2, in general terms, we have a monotonically
decreasing function. Then, the more suitable models are the Weibull and Gompertz
parametric models. These two models are often used with data presenting monotonically
failure rates, either increasing or decreasing. Since we have not been able to observe all
variables affecting the launch delay, it is likely to have unobservable heterogeneity. If so,
it would lead to a bias in the inferences concerning the relationship of dependency. The
most common way to control for the unobservable heterogeneity consists in introducing a
parametric distribution for the random error term and thus, to estimate the parameters of
the function which generates such error term. There is no a strict pattern to chose that
distribution. Based on the previous literature, the two distribution most used are the
Gamma (Lancaster, 1992, Klein and Moeschberger, 1997) and the Inverse Gaussian
(StataCorp, 2009). We estimate four different parametric models. In Table C.7 and C.8 we
show the AIC for measuring the goodness of fit and the statistical tests of the unobserved
heterogeneity. Another way to have an accurate selection model is based on the analysis
of the Cox-Snell generalized residuals. Then, if the model has been correctly selected, the
Cox-Snell residuals should present a form of a unit exponential function84. The Cox-Snell
residuals are shown in Figure C.3, C.4, C.5 and C.6 (for retail market), and Figure C.7,
C.8, C.9 and C.10 (for hospital market).
84 f (x) ex if x 0
0 otherwise
with 1

174 Modeling Global Pricing and Launching of New Drugs
Figure C.1. Density Function of Delay in Months. Retail Market
Figure C.2. Density Function of Delay in Months. Hospital Market
Table C.7. Goodness of fit of parametric models. Retail market
Weibull with Gamma
Heterogeneity
Weibull with Inverse Gaussian
Heterogeneity
Gompertz with Gamma
Heterogeneity
Gompertz with Inverse Gaussian
Heterogeneity AIC 38.14430201 38.142709 38.13897749 38.10271705
Heterogeneity (Ho= No heterogeneity) =29.32
p=0.000
=26.21
p=0.000
=81.28
p=0.000
=8.63
p=0.002
1
21
21
21
2

Appendix C 175
Figure C.3. Weibull, Gamma. Retail market
Figure C.4. Weibull, Inverse Gaussian. Retail market
Figure C.5. Gompertz, Gamma. Retail market
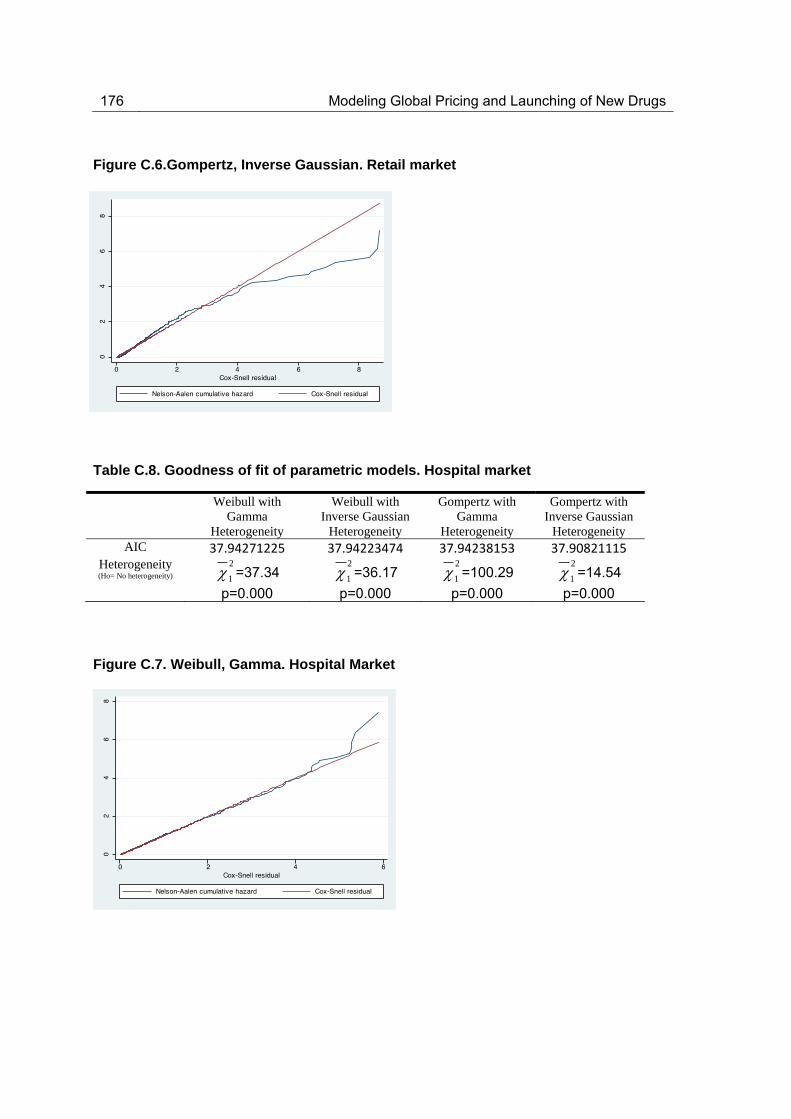
176 Modeling Global Pricing and Launching of New Drugs
Figure C.6.Gompertz, Inverse Gaussian. Retail market
Table C.8. Goodness of fit of parametric models. Hospital market
Weibull with Gamma
Heterogeneity
Weibull with Inverse Gaussian
Heterogeneity
Gompertz with Gamma
Heterogeneity
Gompertz with Inverse Gaussian
Heterogeneity AIC 37.94271225 37.94223474 37.94238153 37.90821115
Heterogeneity (Ho= No heterogeneity) =37.34
p=0.000
=36.17
p=0.000
=100.29
p=0.000
=14.54
p=0.000
Figure C.7. Weibull, Gamma. Hospital Market
1
21
21
21
2
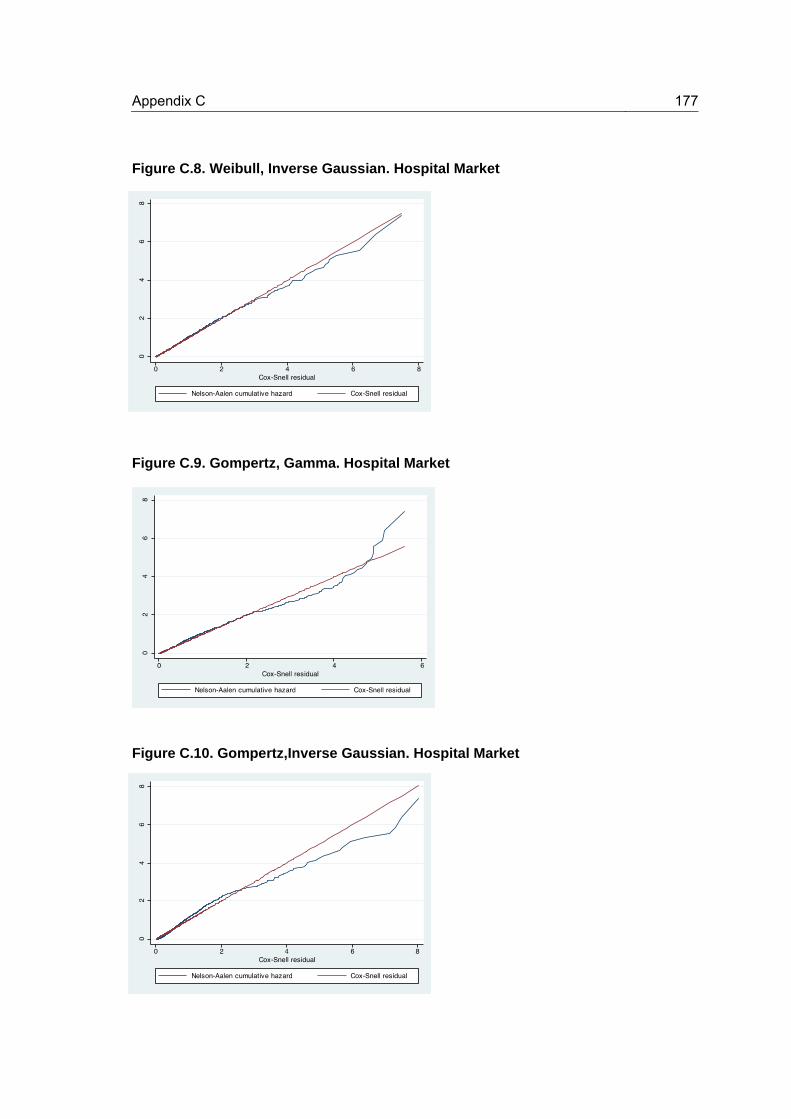
Appendix C 177
Figure C.8. Weibull, Inverse Gaussian. Hospital Market
Figure C.9. Gompertz, Gamma. Hospital Market
Figure C.10. Gompertz,Inverse Gaussian. Hospital Market


Resumen en español
Motivación
Los medicamentos se venden en un mercado globalizado. Esta característica
implica un proceso de negociación específico entre las empresas farmacéuticas y las
agencias de salud de los países. Por un lado, la empresa toma decisiones estratégicas
para lanzar los fármacos en diferentes países y para maximizar sus beneficios globales, y
por otro lado, las agencias de salud de los países implementan políticas de fijación de
precios con el fin de controlar el gasto farmacéutico y garantizar el acceso a los
medicamentos a la población.
Desde la perspectiva de los seguros nacionales de salud, las políticas de fijación
de precios en el mercado farmacéutico son un factor clave en el control del gasto público.
En particular, el gasto farmacéutico de los países pertenecientes a la Organización de
Cooperación y Desarrollo Económicos (OCDE) en 2009 se calcula que representa
alrededor del 19 % del gasto sanitario. En relación con la economía global, el gasto
farmacéutico supone en promedio un 1,5 % del PIB (Producto Interior Bruto) en los
países de la OCDE. Sin embargo, la dispersión en torno a este promedio es alta, para
algunos supone menos del 1 % del PIB como Noruega y Dinamarca, mientras que para
otros alcanza cerca del 2,5 % del PIB, en países como Grecia, Hungría y la República
Eslovaca. El gasto farmacéutico se financia principalmente a través de terceros
pagadores en la mayoría de los países de la OCDE - ya sea a través del seguro público
de salud, lo que representa en media alrededor de un 60 % del total, o por medio de la
cobertura de los seguros privados, dejando en media más de un tercio del total sobre los
hogares (OECD, 2011).
Desde la visión de la industria farmacéutica, los precios y el lanzamiento son tareas
complejas y conectadas directamente con la política de I+D (Investigación y Desarrollo),
industrial y sanitaria. Por lo tanto, los precios y el lanzamiento son sus principales
decisiones estratégicas. En muchos países, el precio se negocia con los proveedores de
seguros de salud (públicos o privados). En este punto, las políticas y estrategias de
fijación de precios son elementos esenciales en el establecimiento de los mismos y en el
acceso a los medicamentos. La fijación de precios de los medicamentos debe contribuir a
mejorar al bienestar social, teniendo en cuenta los intereses de la industria, los

180 Modelización de los Precios y Lanzamiento Global de Nuevos Medicamentos
consumidores y las aseguradoras públicas. Por lo tanto, se debe promocionar el
desarrollo de nuevos medicamentos, poniéndolos a disposición de los consumidores y
controlando el gasto farmacéutico.
El precio y el lanzamiento de un medicamentos envuelven un equilibrio entre el
bienestar público y los beneficios privados, entre los intereses de los fabricantes y los del
país. Cuando los países establecen un precio, corren el riesgo de no proporcionar el
medicamento en el momento que desean, lo que puede producir consecuencias para la
salud y el bienestar de la población (Lichtenberg, 2005). A su vez, la empresa, al retrasar
el lanzamiento de un medicamento en un país, está retrasando también la obtención de
los beneficios que se derivan de la venta en dicho país. Sin embargo, en un mundo cada
vez más globalizado, los precios/lanzamiento de medicamentos se ha convertido en una
cuestión internacional y por lo tanto, los flujos de información entre los países deberían
ser considerados. Tanto las empresas como los países deben actuar localmente pero
pensar globalmente. Debido a la existencia de mecanismos como los precios de
referencia externa (ERP, de ahora en adelante) y el comercio paralelo (PT, en adelante)
(Danzon and Epstein, 2008, Danzon et al., 2005, Garcia Mariñoso et al., 2011), la fijación
del precio de un medicamento en un país influye en los precios y lanzamientos de otros
países. El uso del ERP por determinados países puede provocar que la empresa aplique
determinadas estrategias de precios que puedan perjudicar el bienestar de otros países.
Por un lado, la empresa puede establecer un precio único85 que puede beneficiar a los
países con tradicionalmente precios elevados86, pero dañar a los países que
tradicionalmente han pagado precios bajos. Por otro lado, la empresa puede tratar de fijar
precios altos87 en los primeros países para evitar precios bajos en los últimos países a
través del ERP, o bien, retrasar el lanzamiento en países de precios bajos para evitar
efectos colaterales en el resto países. Concretamente, estas estrategias pueden
perjudicar a los países de precio bajo, e incluso también pueden perjudicar a los países
de precio alto (Garcia Mariñoso et al., 2011).
85 Dos factores contribuyen a la uniformidad de precios entre los distintos mercados: a) las amenazas de las importaciones paralelas, y b) el uso del ERP DANZON, P. M. & TOWSE, A. 2003. Differential Pricing for Pharmaceuticals: Reconciling Access, R&D and Patents. International Journal of Health Care Finance and Economics, 3, 183-205..
86 En el largo plazo los consumidores de los países de precio alto estarán peor si estos precios más bajos producen menores beneficios esperados para la I+D y, por tanto, un menor número de nuevos medicamentos de lo que hubieran estado dispuestos a pagar DANZON, P. M. 1997. Price Discrimination for Pharmaceuticals: Welfare Effects in the US and the EU. International Journal of the Economics of Business, 4, 310-322. .
87 Esta estrategia empresarial no funcionará si el país de alto precio revisa sus precios a la baja después del lanzamiento.

Resumen en español 181
Entre las políticas de precios de medicamentos, la mayoría de los países del
mundo industrializado han puesto en práctica en algún momento bien el análisis coste-
efectividad (CEA, en adelante) o el ERP con el objetivo de controlar el gasto farmacéutico
y garantizar el acceso a los medicamentos, particularmente en los medicamentos bajo
patente (Espin J et al., 2011, Rawlins, 2012).
En esta tesis, el ERP se define como " la práctica de fijar un precio máximo sobre
los fármacos, con base en los precios de fabricante de productos idénticos o similares en
otros países" (Garcia Mariñoso et al., 2011). La mayoría de los países utilizan el ERP
como política de fijación de precios de medicamentos. El uso de este sistema tiene una
aplicación bastante amplia: 24 de los 30 países de la OCDE (Espin J et al., 2011) y
aproximadamente 24 de los 28 Estados miembros de la Unión Europea lo han utilizado
(Leopold et al., 2012). Sin embargo, el ERP no se aplica de forma homogénea en todos
los países. Hay una amplia variedad de métodos para diseñar el índice de precios
externos de referencia (Espin J et al., 2011, Leopold et al., 2012). Depende
principalmente de la elección de los países de referencia, el tipo de precios tenidos en
cuenta88, el método utilizado (el precio más bajo, el precio medio, un porcentaje de los
anteriores, etc.) y si se utiliza un índice ponderado89 o no. También es importante señalar
que algunos países consideran el ERP como una política de precios complementaria a
otras políticas de precios con el fin de tomar la decisión final, por lo que no se aplica
exclusivamente como una política de precios a ciegas90. El ERP se utiliza debido a su
simplicidad a nivel técnico y analítico; recopilar información sobre los precios en el
extranjero no requiere una gran tarea. Los usuarios del ERP piensan que esos precios se
toman como referencia son más o menos correctos, adecuados o justos. Sin embargo,
reconocen que es difícil evaluar si los precios resultantes son apropiados, eficientes u
óptimos de acuerdo a cualquier criterio objetivo. Podemos pensar que si los países que
son tomados como referencia fijan sus precios demasiado altos o bajos, entonces
cualquier país después de aplicar el método de ERP puede correr el riesgo de repetir el
88 Precio actual vs. precio en el momento de lanzamiento
89 El método más frecuente llevado a cabo para fijar el precio de nuevos medicamentos se realiza a través de medidas no ponderadas; estos métodos no ayudan a alcanzar el objetivo de obtener un nivel medio de precios comparable. Se propone la aplicación de índices de precios ponderados con el fin de establecer un precio que sea comparable y útil como referencia para el resto de países DANZON, P. M. & CHAO, L. W. 2000. Cross-national price differences for pharmaceuticals: How large, and why? Journal of Health Economics, 19, 159-195..
90 Espín et al. afirman que "los reguladores no siempre podrían ser capaces o estar dispuestos a "imponer" un determinado precio, pero en su lugar sí utilizar un precio calculado como punto de referencia para las negociaciones junto con otros criterios, tales como el cost-plus o los precios de referencia interna".

182 Modelización de los Precios y Lanzamiento Global de Nuevos Medicamentos
mismo error (Espin J et al., 2011).
A su vez, el CEA en economía de la salud tiene como objetivo estimar la relación
entre el coste de una intervención relacionada con la salud y el beneficio que produce en
términos de la cantidad de años vividos con buena salud por los beneficiarios. El coste se
mide en unidades monetarias mientras que el beneficio necesita ser expresado en
valores cuantitativos relacionados con el aumento de la salud. Sin embargo, a diferencia
del análisis de coste-beneficio, los beneficios no tienen que expresarse en términos
monetarios. En farrmacoeconomía se expresa habitualmente en años de vida ajustados
por calidad (AVAC)91 (National Institute for Health and Care Excellence (NICE), 2010). El
ratio incremental de coste-efectividad (ICER) es la relación entre la diferencia de los
costes y la diferencia de los beneficios de dos intervenciones. La empresa conoce este
umbral en un determinado país; por lo tanto, la empresa lleva a cabo el CEA y calcula el
número de AVACs ganados si el medicamento se proporciona en un solo país. Dado que
la empresa es consciente tanto de umbral y el número de AVACs, ofrece al país el
medicamento a un precio determinado. No obstante, la empresa puede distorsionar al
alza el número de AVACs para obtener mayores beneficios. Entonces, es el país quién
podría revisar el CEA de la empresa y aplicar su propio CEA para revelar el precio justo.
Es importante señalar que este CEA requiere de recursos e inversión monetaria por parte
del país.
En general, las ventajas y desventajas antes mencionadas han impulsado la
investigación teórica y empírica particularmente en los últimos años. Además, la
interdependencia entre los mercados debido a la implementación del ERP y la presencia
del PT puede haber cambiado la estrategia de precios y lanzamiento, y podría llevar a
observar menores diferencias de precios en entre los países.
La tesis en primer lugar presenta una revisión sistemática que tiene como objetivo
ofrecer una perspectiva global de los análisis teóricos y empíricos originales de las
interdependencias globales con respecto a los precios de los medicamentos y al
lanzamiento, así como encontrar cuáles son los principales factores que influyen tanto en
91 El AVAC sirve para medir la carga de una enfermedad, incluyendo tanto la calidad como la cantidad de vida que se vive. El modelo de AVAC requiere una utilidad independiente, neutral al riesgo y una visión del trade-off constante y proporcional. El AVAC se basa en el número de años de vida ajustados por calidad que aportaría la intervención al paciente. Cada año, en perfecto estado de salud se le asigna el valor de 1,0 hasta un valor de 0,0 si se está muerto. Si los años de más no se viven con plena salud, por ejemplo, si el paciente pierde una extremidad, o si es ciego o tiene que usar una silla de ruedas, los años de vida adicionales se les asigna un valor entre 0 y 1 para tomar en cuenta esta carga.

Resumen en español 183
los precios como en los retrasos de lanzamiento de nuevos fármacos. Una vez alcanzado
el objetivo anterior, la tesis desarrolla una parte teórica y una parte empírica. De esta
manera, se desarrolla un modelo teórico basado en un modelo de negociación entre la
industria farmacéutica y dos agencias de salud de dos países cualesquiera. Este modelo
tiene como objetivo analizar la conveniencia de la aplicación del ERP en lugar del CEA
como política de contención del gasto farmacéutico. En última instancia, la tesis
desarrolla un modelo empírico que tiene por objeto el análisis del trade-off entre el precio
y el retraso en el lanzamiento de los fármacos, y el impacto de la política de ERP sobre
ambos, precio y momento de lanzamiento.
Esta tesis está organizada en tres capítulos. Cada capítulo podría suponer una
investigación individual, por lo que cada uno está dotado de introducción propia,
desarrollo y conclusiones. El primer capítulo articula lo que ya se conoce, el segundo
capítulo desarrolla un modelo teórico y el tercer capítulo muestra la evidencia basada en
el desarrollo de un modelo empírico.
Objetivos
El capítulo 1 proporciona una revisión sistemática basados en la metodología
PRISMA (Preferred Reporting Items for Systematic reviews and Meta-Analyses) (Moher
et al., 2009) de estudios científicos originales. Los trade-offs que hemos mencionado
anteriormente han impulsado la investigación teórica y empírica particularmente en los
últimos años. En este capítulo se revisa lo que sabemos sobre los principales factores
que influyen en los precios y en el retraso en el lanzamiento de nuevos fármacos, y si
existen además patrones generales que pudieran derivarse de modelos económicos con
el objetivo de explicar los intereses estratégicos de los gobiernos, las aseguradoras
públicas y la industria farmacéutica, si hay alguna evidencia empírica sobre dichos
factores en los países de la OCDE, y si el ERP y el PT hacen que los mercados sean
inseparables a la hora del lanzamiento y la fijación del precio.
El capítulo 2 sugiere un juego basado en un modelo de negociación en virtud de
lanzamiento secuencial de un nuevo medicamento por una farmacéutica en dos países
cualesquiera basado en un procedimiento de take-it-or-leave-it-offer bajo información
asimétrica (Muthoo, 1999). El modelo se basa en la mejor estrategia de la empresa

184 Modelización de los Precios y Lanzamiento Global de Nuevos Medicamentos
farmacéutica a la hora de lanzar secuencialmente un nuevo producto, teniendo en cuenta
el tamaño de los países, el coste de llevar a cabo un CEA por parte de los países, el
coste del retraso en el lanzamiento y los precios fijados por cada una de las políticas de
precios. De manera breve, el país elige entre aplicar el ERP sin ningún coste adicional y
el CEA con su correspondiente inversión. La empresa acepta o rechaza un precio y elige
su secuencia de países óptima de lanzamiento. Se introducen dos innovaciones
importantes que requieren especial atención: en primer lugar, incluimos dos diferentes
tipos de países en función del método de ERP aplicado, ya sea el precio mínimo o el
precio medio observado. En segundo lugar, introducimos el coste del retraso en el
lanzamiento y el coste relacionado con la aplicación del CEA para comprobar si la
empresa declara el verdadero valor de AVACs del medicamento.
El capítulo 3 replica en primer lugar dos estudios empíricos (Danzon and Epstein,
2008, Verniers et al., 2011) donde se han aplicado modelos econométricos de fijación de
precios y lanzamiento. El mismo tratamiento de datos y metodología llevada a cabo por
los dos estudios se han aplicado a nuestra base de datos. Por un lado, se replica el
estudio de Danzon y Epstein publicado en 2008 (Danzon and Epstein, 2008) con nuestra
base de datos que cuenta con datos más recientes, y se comparan nuestros resultados
con los suyos. Los datos de Danzon y Epstein (Danzon and Epstein, 2008) abarcan los
años 1992 a 2003, mientras que nuestros datos cubren el período 2004-2010. De manera
similar, se replica el estudio de Verniers et al. publicado en 2011 (Verniers et al., 2011)
para comprobar si los resultados han cambiado debido a la utilización de datos más
recientes (2010 vs. 2008) y si los resultados son robustos a la elección de la lista de
países. Verniers et al. (Verniers et al., 2011) aplica su modelo a una base de datos que
contiene un gran conjunto de países, ricos y pobres. Sin embargo, en esta tesis el
modelo se restringe a países desarrollados. Luego, se desarrolla un modelo empírico
centrado en el análisis del trade-off entre los precio y el retraso en el lanzamiento, así
como el impacto de la política de ERP en los precios y el lanzamiento, controlando por
las características de moléculas, de regulación y de país. Desarrollamos dos ecuaciones,
una para el retraso en el lanzamiento y la otra para el precio de lanzamiento. Utilizamos
los datos de la base de datos de IMS Health para 70 nuevas moléculas lanzadas en 20
países y pertenecientes a 11 clases terapéuticas diferentes, todas ellas aprobadas

Resumen en español 185
mediante el procedimiento centralizado de la EMA92 (Agencia Europea del Medicamento)
durante el período de estudio, 2004-2010. Se toman las ventas ambulatorias y
hospitalarias en euros a precio de fabricante y en unidad de volumen (IMS SU) con datos
anuales. La contribución de este capítulo a la literatura previa analizada consiste en el
análisis de los datos a nivel de presentación farmacéutica93, la consideración del precio
relativo de lanzamiento94 como variable endógena en la ecuación de precio de
lanzamiento, el estudio del retraso en el lanzamiento como variable de tiempo de
duración y el análisis del mercado hospitalario. Además, se introduce el tamaño del país
y el poder adquisitivo del país como variables explicativas adicionales en el modelo.
Planteamiento y metodología
Revisión de la literatura
En el capítulo 1 se lleva a cabo una revisión sistemática de la literatura de 1995 a
abril de 2012, y se sintetizan los principales hechos, ideas y resultados encontrados. La
búsqueda cubre los modelos teóricos y empíricos. El resto de este capítulo está
organizado de la siguiente manera. En un primer lugar se discuten los estudios teóricos.
Luego se examinan los estudios empíricos y finalmente se recoge una discusión.
La estrategia de búsqueda se llevó a cabo en abril de 2012 en las siguientes
bases de datos: PubMed, EconLit y Web of Knowledge, usando diferentes
combinaciones de palabras clave, tanto en inglés británico como americano, y abarcando
el período comprendido entre enero de 1995 a abril de 2012. Esta búsqueda se
complementó con otra adicional, utilizando las mismas palabras clave en NBER (The
National Bureau of Economic Research), la Universidad de York, el CHEPA (Centre for
Health Economics and Policy Analysis), la LSE (London School of Economics) Health, el
CRES (Centre de Recerca en Economia i Salut), y la Facultad de Economía de la
92 Antes EMEA.
93 Se definen dos productos con la misma presentación farmacéutica cuando ambos productos pertenecen a la misma molécula i y contienen la misma cantidad de principio activo por standard unit (SU). Véase la definición de SU en la sección 4.4 de este resumen.
94 Se define en el anexo de este resumen

186 Modelización de los Precios y Lanzamiento Global de Nuevos Medicamentos
Erasmus University Rotterdam. Por último, también se incluyeron algunos documentos
referenciados por expertos. Se hicieron búsquedas por separado utilizando la siguientes
palabras clave: “("pharmaceutical* pric*") and (new or launch* or patent), ("drug* pric*")
and [new or launch* or patent) and ("medicine* pric*") and (new or launch* or patent)”.
Las referencias encontradas en la búsqueda sistemática fueron evaluadas
mediante la revisión del título, el resumen y el tipo de publicación con el fin de identificar
los artículos relevantes. Todos los trabajos pertinentes que cumplieron los criterios de
inclusión fueron clasificados siguiendo una estrategia de selección de dos etapas.
En la primera etapa se aplicaron los criterios de selección para todos los estudios
analizados. En la segunda etapa, los estudios escogidos en la primera fueron
seleccionados individualmente para evaluar las aportaciones teóricas y empíricas
realizadas en cada caso. En la primera etapa, sólo se incluyeron los estudios que
cumplieron los criterios establecidos en la Figura 4.1. Cada artículo fue secuencialmente
evaluado en base a cuatro criterios, desde el primero al cuarto: ser un artículo original,
estar publicado en una revista científica, estar escrito en lengua inglesa y estar enfocado
en el precio y lanzamiento de medicamentos bajo patente. A medida que algún criterio no
se cumplía, el artículo era excluido.

Resumen en español 187
Figura 4.1 Diagrama de flujo del proceso de selección de la literatura
En la segunda etapa, se evaluó el texto completo de cada artículo seleccionado.
Se escogieron únicamente aportaciones teóricas originales en el desarrollo de nuevas
perspectivas de análisis y trabajos empíricos que desarrollasen un modelo causal cuya
variable endógena fuera el precio o el lanzamiento de un medicamento para una muestra
de al menos dos o más países.
Finalmente, la revisión consta de 22 artículos, 12 basados en modelos teóricos y
17 en modelos empíricos.
Modelo teórico
Se consideran dos países, C y D. Cada país i (i = C, D) y una sóla empresa
negocian la adquisición de un medicamento bajo patente. Cada país reacciona a la oferta
de la empresa y presenta un precio basado en su política de precios entre el CEA y el
ERP que ha elegido previamente. Cada país i tiene una disposicón a pagar (WtP, de aquí
en adelante) por AVAC por un nuevo medicamento y poniéndolo a disposición de la

188 Modelización de los Precios y Lanzamiento Global de Nuevos Medicamentos
población. Se considera también una empresa que se comporta como productor
monopolista del nuevo fármaco bajo patente que vende a las agencias de salud de los
países. La empresa no está localizada en niguno de los países i y decide el orden de
estos para el lanzamiento del medicamento. La empresa vende el medicamento durante
dos periodos. Este fármaco está destinado al tratamiento de enfermedades crónicas y no
requiere de ningún copago. El medicamento está autorizado mediante procedimiento
centralizado95. Por lo tanto, los países no son capaces de no autorizar el medicamento.
Ellos son solamente capaces de no introducir el medicamento en las listas de reembolso.
El medicamento ya ha lanzado en J (j= 1,2,3...J) países. Así, los jugadores del juego son
la empresa farmacéutica y una agencia de salud en cada país i.
Consumidores
Los consumidores en cada país se definen como aquellos pacientes que pueden
ser tratados por el medicamento vendido por la empresa farmacéutica. Por lo tanto la
demanda de un medicamento en un país i (i = C, D) se define como la tasa de
prevalencia de las enfermedades crónicas para las que el medicamento está indicado.
Esta tasa de prevalencia y por ende, la demanda, está representada exógenamente por
qi96
y representa el tamaño del país.
El medicamento se suministra sin copago alguno, por lo tanto, los consumidores
no tendrán que pagar por él. La agencia de salud de cada país será el único pagador de
la medicina. En consecuencia, se supone que la demanda total del fármaco es exógena y
está representado por qi.
Agencias de Salud
Las agencias de salud deben tener en cuenta el beneficio bruto proporcionado por
el medicamento, representado por el número de AVACs que genera, función de la tasa
de prevalencia qi de su país. Se denota por Bi,
95 En la UE, el proceso centralizado es necesario para productos biotecnológicos como para medicamentos huérfanos y otros fármacos opcionales. En cualquier caso, la Comisión Europea aprueba la autorización a tenor de los recomendaciones de la EMA. La autorización se puede obtener via procedimiento de reconocimiento mutuo donde las empresas solicitan autorización a un Estado Miembro y se archiva para el reconocimiento en otros países de la UE. No obstante, nuestro análisis solamente considera el procedimiento centralizado, que es el más prevalente.
96 Se debe señalar que qi no cambia significativamente a lo largo de los años ya que el medicamento está indicado para pacientes crónicos.
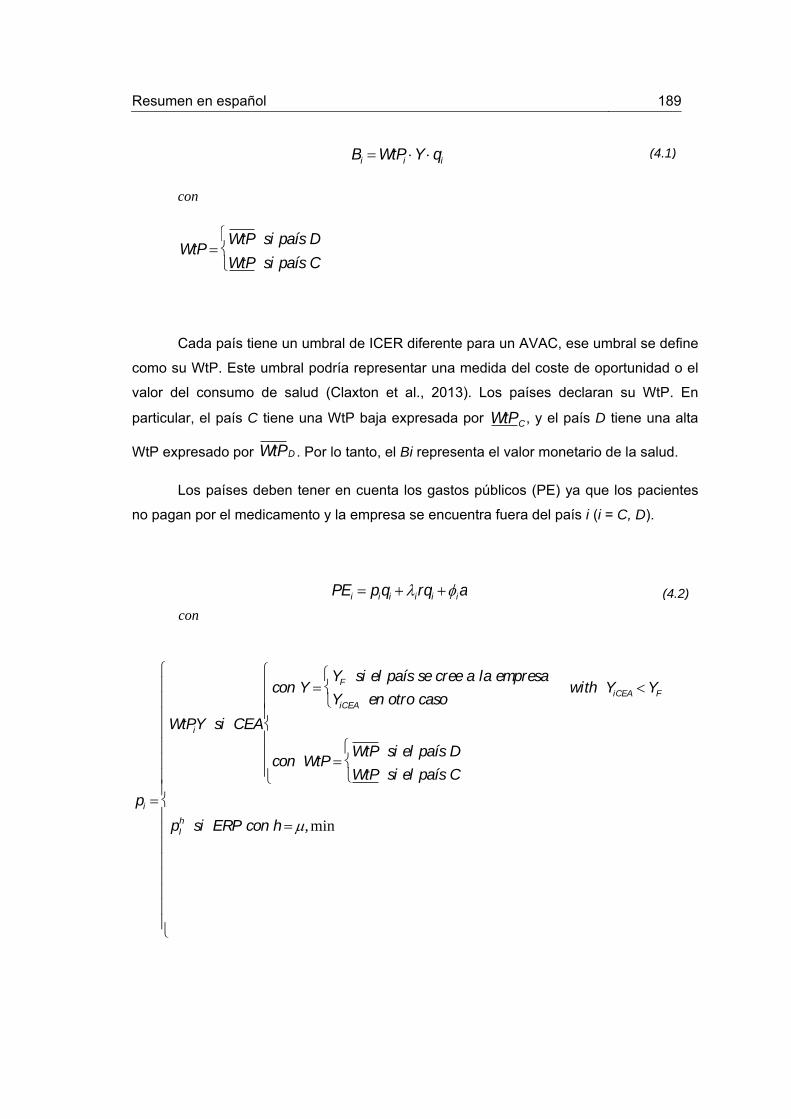
Resumen en español 189
con
WtP WtP si país D
WtP si país C
Cada país tiene un umbral de ICER diferente para un AVAC, ese umbral se define
como su WtP. Este umbral podría representar una medida del coste de oportunidad o el
valor del consumo de salud (Claxton et al., 2013). Los países declaran su WtP. En
particular, el país C tiene una WtP baja expresada por , y el país D tiene una alta
WtP expresado por . Por lo tanto, el Bi representa el valor monetario de la salud.
Los países deben tener en cuenta los gastos públicos (PE) ya que los pacientes
no pagan por el medicamento y la empresa se encuentra fuera del país i (i = C, D).
pi
WtPiY si CEA
con Y YF si el país se cree a la empresa
YiCEA en otro caso
with YiCEA YF
con WtPWtP si el país D
WtP si el país C
pIh si ERP con h ,min
Bi WtPi Y qi
WtPC
WtPD
PEi piqi i rqi ia
(4.1)
(4.2)
con
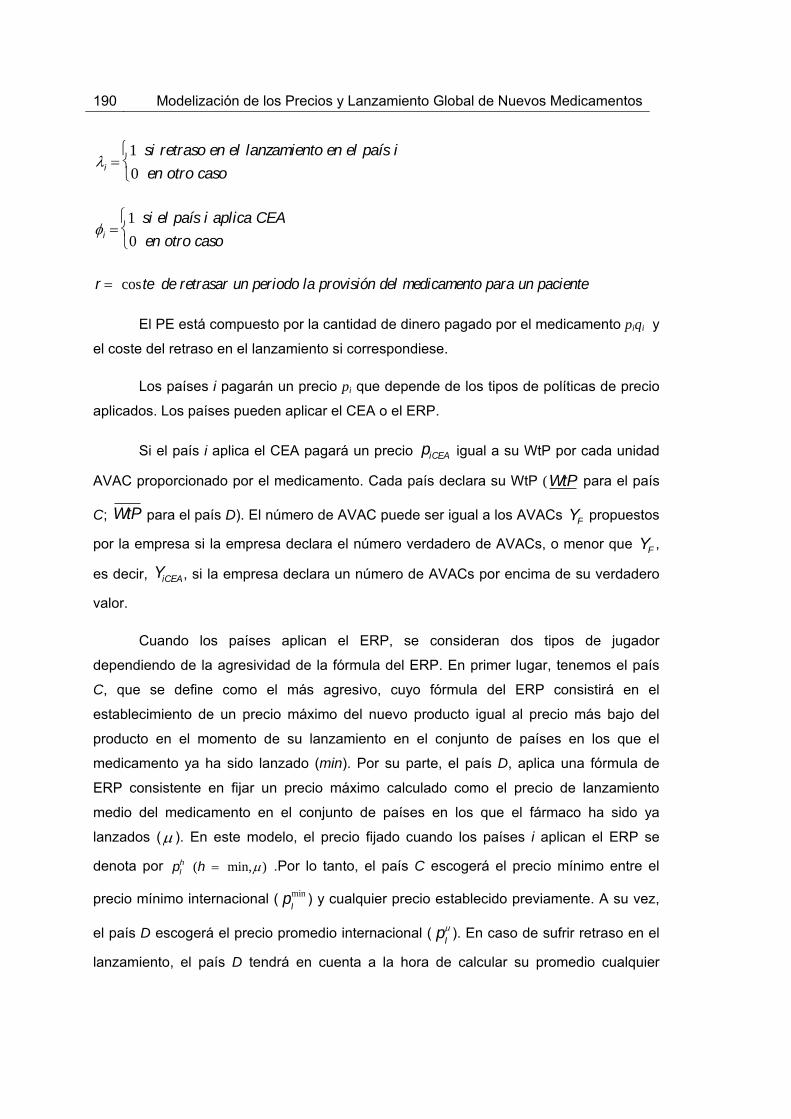
190 Modelización de los Precios y Lanzamiento Global de Nuevos Medicamentos
i 1 si retraso en el lanzamiento en el país i
0 en otro caso
i 1 si el país i aplica CEA
0 en otro caso
r coste de retrasar un periodo la provisión del medicamento para un paciente
El PE está compuesto por la cantidad de dinero pagado por el medicamento piqi y
el coste del retraso en el lanzamiento si correspondiese.
Los países i pagarán un precio pi que depende de los tipos de políticas de precio
aplicados. Los países pueden aplicar el CEA o el ERP.
Si el país i aplica el CEA pagará un precio igual a su WtP por cada unidad
AVAC proporcionado por el medicamento. Cada país declara su WtP ( para el país
C; para el país D). El número de AVAC puede ser igual a los AVACs propuestos
por la empresa si la empresa declara el número verdadero de AVACs, o menor que ,
es decir, , si la empresa declara un número de AVACs por encima de su verdadero
valor.
Cuando los países aplican el ERP, se consideran dos tipos de jugador
dependiendo de la agresividad de la fórmula del ERP. En primer lugar, tenemos el país
C, que se define como el más agresivo, cuyo fórmula del ERP consistirá en el
establecimiento de un precio máximo del nuevo producto igual al precio más bajo del
producto en el momento de su lanzamiento en el conjunto de países en los que el
medicamento ya ha sido lanzado (min). Por su parte, el país D, aplica una fórmula de
ERP consistente en fijar un precio máximo calculado como el precio de lanzamiento
medio del medicamento en el conjunto de países en los que el fármaco ha sido ya
lanzados ( ). En este modelo, el precio fijado cuando los países i aplican el ERP se
denota por .Por lo tanto, el país C escogerá el precio mínimo entre el
precio mínimo internacional ( pImin ) y cualquier precio establecido previamente. A su vez,
el país D escogerá el precio promedio internacional ( pI ). En caso de sufrir retraso en el
lanzamiento, el país D tendrá en cuenta a la hora de calcular su promedio cualquier
piCEA
WtP
WtP YF
YF
YiCEA
pIh (h min,)

Resumen en español 191
(4.5)
(4.4)
precio fijado previamente (en este modelo, el precio ya establecido en el país C). De
manera formal,
pERPminC
pImin min p
1, p
2...p
j...p
J si {C, D}
pImin min p
1, p
2...p
j...p
J, p
D en otro caso
pERPD
pI
pj
J
j1
pC
J 1 si {C,D}
pI
pj
J
j1
J
en otro caso
Cuando el país i aplica el CEA, está invirtiendo una cantidad de dinero a para
verificar si el número de AVACs del medicamento YF declarados por la empresa es cierto
o no. Esta inversión se define como cCEAi, siendo igual para todos los países.
El país i sufre un retraso en el lanzamiento si el medicamento se lanza
previamente en uno de los países i. Definimos el coste unitario del retraso en el
lanzamiento ri para el país i como el coste que supone en salud no suministrar el
medicamento a los pacientes durante un período. Por lo tanto, el coste total del retraso
en el lanzamiento para el país i se define como .
Suponemos que el objetivo de una agencia de salud es maximizar los beneficios
proporcionados por el medicamento menos los gastos públicos (PE) asociados a su
compra. Por lo tanto, la función objetivo (OF) de la agencia de salud se puede escribir
como,
OFi Bi PE (WtPiY pi )qi i rqi ia
rqi
(4.3)

192 Modelización de los Precios y Lanzamiento Global de Nuevos Medicamentos
(4.9)
(4.6)
(4.8)
(4.7)
Ahora, definiremos algunos supuestos que posibiliten el desarrollo y la resolución
del problema.
Supuesto 1
La WtP por AVAC de el país D es estrictamente mayor que la del país C.
Los precios y prouestos por la empresa a los países C y D respectivamente se
definen como el producto de WtPi por el número de AVACs declarados por la empresa
pFWtPCYF
pF WtPDYF
Por lo tanto, dado que la empresa maximiza sus beneficios, el precio propuesto por la
empresa al país D es estrictamente superior al ofrecido al país C
Supuesto 2
Existe variabilidad de los precios entre los J países donde el medicamento se ha lanzado
previamente. Por lo tanto, el precio medio internacional es estrictamente mayor que el
precio mínimo internacional.
WtPD WtPWtPC WtP
pF
pF
pF
pF
pF pF

Resumen en español 193
(4.12)
(4.13)
(4.11)
(4.10)
Supuesto 3
Dado un país que aplica el CEA, los AVACs revelados por el CEA llevado a cabo por el
país no serán superiores a los declarados por la empresa
Concretamente, si la empresa es honesta y por lo tanto declara el verdadero número de
AVACs, los AVACs revelados por el CEA llevado a cabo por el país serán iguales a los
declarados por la empresa. A su vez, si la empresa no es honesta y por lo tanto no
declara el verdadero número de AVACs, los AVACs revelados por el CEA serán
estrictamente inferiores a los sugeridos por la empresa.
YiCEA YF si la empresa declara el verdadero número de AVACs
YiCEA YF en otro caso
De esta manera, el precio que resulta de la aplicación del CEA no será superior al precio
propuesto por la empresa.
piCEA piF si la empresa declara el verdadero número de AVACs
piCEA piF en otro caso
PI PI
min
YF YiCEA

194 Modelización de los Precios y Lanzamiento Global de Nuevos Medicamentos
(4.14)
(4.15)
(4.16)
Por lo tanto, debido a evidencia científica mostrada por el CEA, asumiendo que los
costes marginales (mc) de producción son 0 (mc=0) y dado que la empresa maximiza
sus beneficios, el precio del CEA será siempre aceptado por la empresa97.
Supuesto 4
En caso de que ambos países i lleven a cabo el CEA, el número de AVACs revelado por
ambas investigaciones, YiCEA, será idéntico para ambos países.
Supuesto 5
La creencia de los países sobre la honestidad de la empresa a la hora de declarar el
número de AVACs que ofrece el nuevo medicamento es igual a e idéntica para ambos
países i (i = C,D).
Supuesto 6
Bajo los supuestos 3 y 5, el precio esperado por el país i (i = C,D) si llevara a cabo el
CEA es,
97 La empresa conoce el WtP de los países i (i = C,D), por lo tanto si el WtP es demasiado bajo (por debajo de un umbral dado), la empresa ni siquiera iniciará las negociaciones para lanzar en ese país.
Pr(YF YiCEA) , i
Pr(YF YiCEA) 1 , i
piF (1) piCEA E pi CEA

Resumen en español 195
(4.17)
(4.18)
(4.19)
Por lo tanto, bajo los supuestos 1 y 5, el precio esperado por el país D es estrictamente
superior al precio esperado por el país C.
Supuesto 798
Si el precio propuesto por la empresa es superior (inferior) que el precio de referencia
internacional , el precio revelado por el país cuando lleva a cabo el CEA será
también superior (inferior). Por lo tanto, el precio esperado del CEA no será
inferior (superior) al precio de referencia internacional.
Supuesto 899
El precio medio entre el precio medio de referencia internacional y el precio del país C es
aproximadamente igual al precio medio de referencia internacional. Por lo tanto, se
asume que el conjunto de J países es lo suficientemente grande que el precio medio no
se ve afectado por precios posteriores.
98 Este supuesto garantiza el trade-off entre la elección del CEA y el ERP. Si el país i aplica el CEA, pagará un precio más alto para evitar tener acceso al medicamento con retraso.
99 El supuesto 8 hace más sencillo los resultados y no afecta a las conclusiones obtenidas.
E pD CEA E pC CEA
pF
pIh piCEA
E pi CEA
If pF pIh piCEA pI
h E pi CEA pI
h
If pF pIh piCEA pI
h E pi CEA pI
h

196 Modelización de los Precios y Lanzamiento Global de Nuevos Medicamentos
(4.20)
(4.21)
Dado p I
pj
j1
J
J
entonces,
pj pC
j1
J
J1
p I con pC
p Imin
pF
pCEAC
Supuesto 9
La diferencia de precios entre el precio de referencia internacional y el precio propuesto
por la empresa es el mismo independientemente del tipo de país. De esta manera, el
incentivo para aplicar el ERP es el mismo independientemente del tipo de país (con WtP
baja o alta). De manera formal,
La empresa
Dado que la industria farmacéutica se caracteriza por presentar altos costes fijos
(F) y bajos costes marginales (mc=0), en este modelo asumimos que los costes
marginales de producir el medicamento son cero (Berndt et al., 1996, Cockburn and Anis,
1998, Suslow, 1996). Así, F> 0 representa los costes fijos de I+D, del proceso de
aprobación y comercialización de los medicamentos en todos los países. Estos costes
son fijos e independientes del número de personas o países que utilicen los
medicamentos. La empresa vende el medicamento al país i (i = C, D) al precio pi. Este
precio pi es el precio máximo al cual las agencias de salud y la empresa farmacéutica
acuerdan pagar y vender el nuevo fármaco100. Si el precio del país proviene de aplicar un
CEA, dada la evidencia científica, la empresa aceptará dicho precio. A su vez, si el precio
del país proviene de aplicar el ERP, la empresa podrá aceptarlo o rechazarlo. En el caso
de rechazarlo, la empresa retrasará el lanzamiento en dicho país. En todo caso,
independientemente del momento, la empresa se compromete a poner en marcha el
100 Somos conscientes que las asociaciones organizadas de compra como asociaciones de hospitales o de farmacias podrían obtener determinados descuentos al precio pi, no obstante, no han podido ser considerados en esta tesis.
pImin p
F pI
pF

Resumen en español 197
(4.22)
medicamento y servir a toda la demanda en este país (qi) a precio pi. La venta del
medicamento sin subvenciones no se considera una opción alternativa. De esta manera,
se supone que el objetivo del productor monopolista de la medicina es maximizar la
función de los beneficios acumulados por ventas (dos periodos) y se puede escribir
como,
OFF pitqit FiC
D
t1
2
con
qit 0 si el medicamento no se comercializa en el país i en el año t
Se asume también que la empresa no está localizada en ninguno de los países i (i
= C,D).
El timing
El timing de este juego se desarrolla de la siguiente manera. El juego tiene 4
etapas. En la etapa 1, los países C y D eligen sus políticas de fijación de precios: CEA o
ERP y la empresa propone un precio para el nuevo medicamento. En la etapa 2, los
países comunican sus precio de acuerdo a sus políticas de precio. En la etapa 3, dado
que el lanzamiento es secuencial (digamos primero el país C y luego el país D, o
viceversa), la empresa elige la secuencia de lanzamiento, es decir, si retrasar el
lanzamiento en el país D o en el país D, y vende el medicamento al primer país de la
secuencia. En la etapa 4, la empresa vende el medicamento en el segundo país. Dado
que la empresa maximiza sus beneficios, vende siempre en ambos países i (i=C, D).
A priori, se debe señalar que el país i (i =C, D) puede elegir entre una política de
fijación de precios que finalmente requiere una inversión monetaria, el CEA, y otra
política que no implica ningún tipo de inversión, el ERP. Sin embargo, aplicando el ERP
el país corre el riesgo de que su precio sea rechazado por la empresa y por lo tanto sufra
algún retraso en el lanzamiento. A su vez, aplicando el CEA, el país se arriesga a realizar
una inversión inútil si la empresa declara el verdadero número de AVACs. Para mostrar

198 Modelización de los Precios y Lanzamiento Global de Nuevos Medicamentos
el timing de manera más clara, véase el árbol de decisión en la figura 4.2.
En general, los jugadores maximizan su función objetivo y resuelven el juego
aplicando inducción hacia atrás. En ambos casos, cuando la empresa declara el
verdadero número de AVACs y cuando declara un número inferior al mismo, el juego se
resuelve para cada par de políticas de fijación de precios posible: i) ningún país aplica el
ERP, ii) solamente el país D aplica el ERP, iii) solamente el país C aplica el ERP y, iv)
ambos países aplican el ERP. De esta manera, se calculan las condiciones de la
secuencia óptima de lanzamiento para el empresa, bien primero el país C y luego D, o
viceversa. Luego, dada la secuencia óptima de lanzamiento, se compara el output de los
países para cada política de precios.
En este resumen se muestra cómo se ha operado para un par de las cuatro
posibles combinaciones de políticas de precios. Concretamente se muestra a
continuación el par ii) donde solamente el país D aplica el ERP. En primer lugar, cuando
la empresa declara un número de AVACs por encima de su valor verdadero, y en
segundo lugar, cuando la empresa declara el número verdadero de AVACs.
Supuesto 10
El lanzamiento del medicamento es secuencial y la empresa sigue vendiendo en la Etapa
4 al país donde ya vendió previamente en la Etapa 3.
Supuesto 11
Si solamente uno de los países i (i = C,D) aplica el ERP y la empresa rechaza su precio,
la empresa retrasará el lanzamiento en dicho país i. Sin embargo, si ambos países
aplican ERP y la empresa rechaza sus precios, la empresa elegirá su secuencia óptima
de lanzamiento de acuerdo al país que le ofrezca mayor ingreso en virtud del precio pi y
la cantidad a vender qi.

Resumen en español 199
Figura 4.2 Árbol de decision

200 Modelización de los Precios y Lanzamiento Global de Nuevos Medicamentos
(4.23)
Fijación de precios y lanzamiento secuencial
El problema se resuelve para cada combinación possible de pol´íticas de precio i)
ningún país aplicael ERP, ii) solamente el país D aplica el ERP, iii) solamente el país D
aplica el ERP, y iv) ambos países aplican el ERP. En este resumen, a modo de ejemplo,
resolveremos el caso ii).
La empresa declara un número de AVACs de acuerdo a su valor verdadero
ii) Únicamente el país D aplica ERP
El país D decide aplicar ERP en la etapa 1. Si el precio medio internacional es
inferior al precio propuesto por la empresa, es decir, pI pF , bajo el supuesto 11, la
empresa retrasa el lanzamiento en el país D. Dado que las políticas regulatorias de
precio se fijan ex-ante, si pI pF , el país D pagará pI
en cualquier caso. A su vez, el
país C lleva a cabo el CEA y pagará pF. Dado que la empresa declara el verdadero
número de AVACs, bajo el supuesto 1, pagará .
En relación al excedente de las agencias de salud, se debe señalar que el precio
considerado por el país C cuando aplica el CEA es un precio esperado de acuerdo a los
supuesos 5 y 6, dado que el país C tiene incertidumbre sobre el número de AVACs
declarados por la empresa.
los beneficios de la empresa son,
OFF 2p
FqC p
I qD F if C, D p
FqC 2p I
qD F en otro caso
y el excedente de las agencias de salud son,
pF

Resumen en español 201
(4.24)
(4.25)
(4.26)
OFC (Wtp
CYF E[pC]CEA)qC a if C, D
(WtPCYF E[pC ]CEA)qC a rqC en otro caso
OFD (WtpDYF pI
)qD rqD if C, D (WtPDYF pI
)qD en otro caso
PPR101
{C, D} if p
F
pI
qD
qC
{D,C} en otro caso
Si únicamente el país D aplica el ERP, la empresa opta por retrasar el lanzamiento en el
país D si y sólo si el ratio de precios entre el país C y el país D es mayor que el ratio de
tamaños de los países entre D y C, en otro caso la empresa retrasará el lanzamiento en
el país C. La relación de precios es el ratio entre el precio del CEA y el precio medio de
referencia internacional. Dado que la relación de los precios es menor que la unidad,
entonces, una condición necesaria para que la empresa elija la secuencia {C, D} es que
el país C debe ser estrictamente mayor que el país D.
En la Tabla 4.1 se resumen los PPR correspondientes a cada uno de los pares de
políticas. Se muestra para cada par de políticas de fijación de precio i), ii), iii) and iv), bajo
qué condiciones (pD, pC, qC, qD) la empresa elige su secuencia óptima de lanzamiento. Se
pone de manifiesto que siempre existe un trade-off entre los precios y los tamaños de los
países.
101 PPR: Resultado preliminar
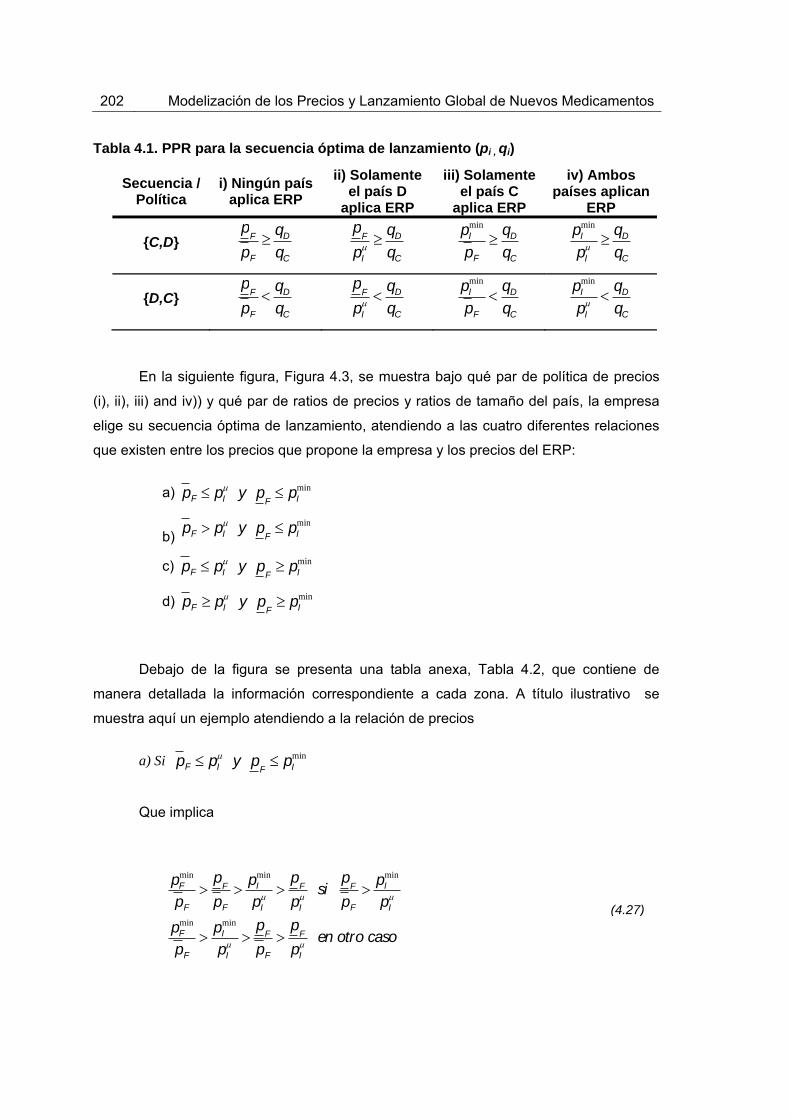
202 Modelización de los Precios y Lanzamiento Global de Nuevos Medicamentos
(4.27)
Tabla 4.1. PPR para la secuencia óptima de lanzamiento (pi , qi)
En la siguiente figura, Figura 4.3, se muestra bajo qué par de política de precios
(i), ii), iii) and iv)) y qué par de ratios de precios y ratios de tamaño del país, la empresa
elige su secuencia óptima de lanzamiento, atendiendo a las cuatro diferentes relaciones
que existen entre los precios que propone la empresa y los precios del ERP:
a) pF pI y p
F pI
min
b) pF pI
y pF pI
min
c) pF pI y p
F pI
min
d) pF pI y p
F pI
min
Debajo de la figura se presenta una tabla anexa, Tabla 4.2, que contiene de
manera detallada la información correspondiente a cada zona. A título ilustrativo se
muestra aquí un ejemplo atendiendo a la relación de precios
a) Si pF pI y p
F pI
min
Que implica
pFmin
pF
p
F
pF
pImin
pI
pF
pI si
pF
pF
pImin
pI
pFmin
pF
pImin
pI
pF
pF
p
F
pI en otro caso
Secuencia / Política
i) Ningún país aplica ERP
ii) Solamente el país D
aplica ERP
iii) Solamente el país C
aplica ERP
iv) Ambos países aplican
ERP
{C,D}
{D,C}
pF
pF
qD
qC
pF
pI
qD
qC
pImin
pF
qD
qC
pImin
pI qD
qC
pF
pF
qD
qC
pF
pI
qD
qC
pImin
pF
qD
qC
pImin
pI qD
qC
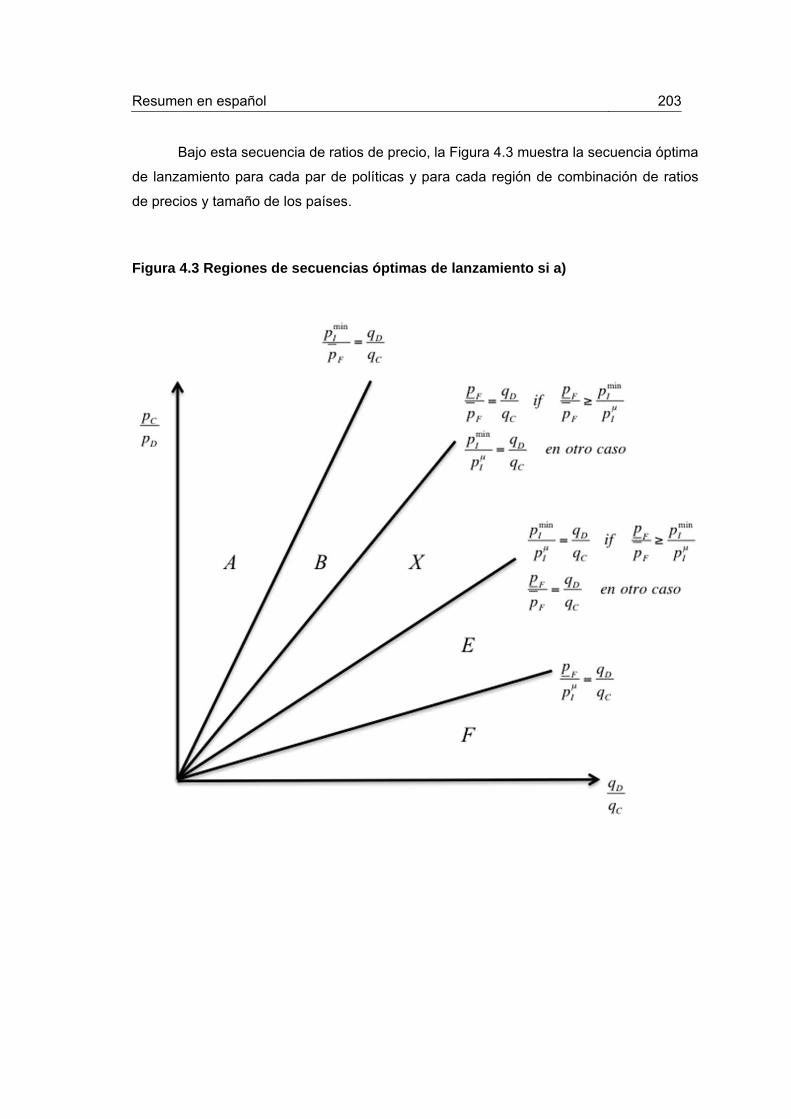
Resumen en español 203
Bajo esta secuencia de ratios de precio, la Figura 4.3 muestra la secuencia óptima
de lanzamiento para cada par de políticas y para cada región de combinación de ratios
de precios y tamaño de los países.
Figura 4.3 Regiones de secuencias óptimas de lanzamiento si a)
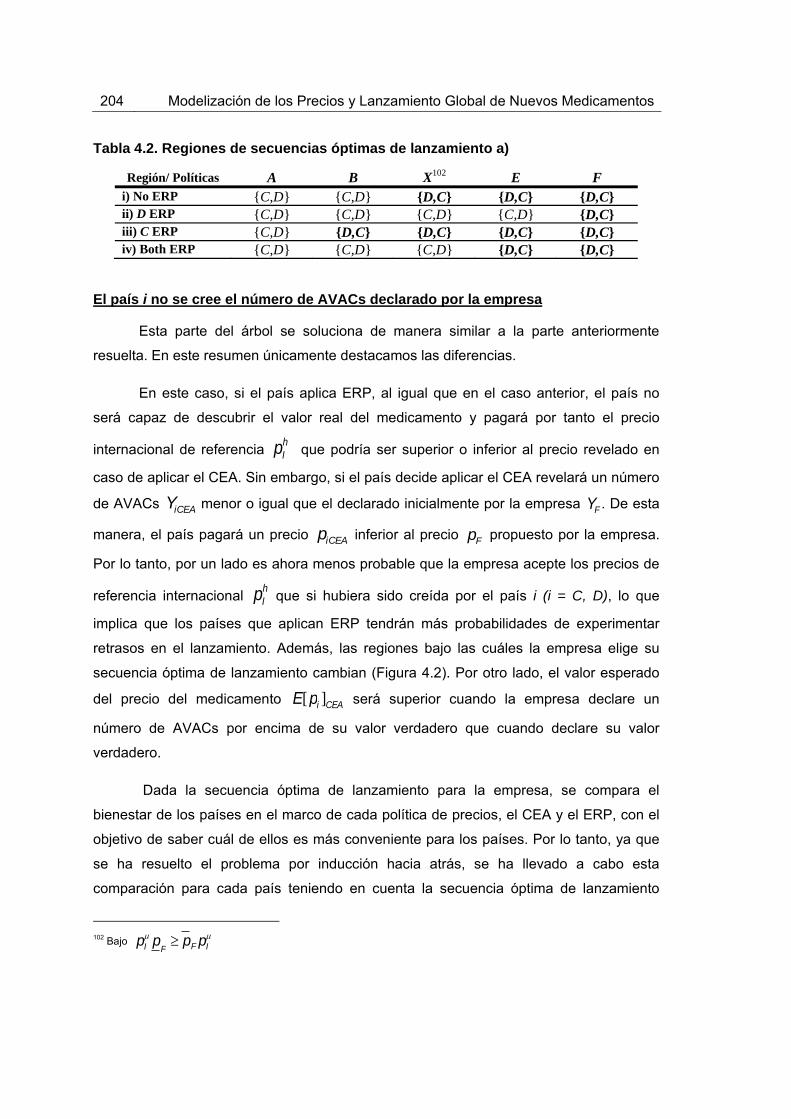
204 Modelización de los Precios y Lanzamiento Global de Nuevos Medicamentos
Tabla 4.2. Regiones de secuencias óptimas de lanzamiento a)
Región/ Políticas A B X102 E F i) No ERP {C,D} {C,D} {D,C} {D,C} {D,C} ii) D ERP {C,D} {C,D} {C,D} {C,D} {D,C} iii) C ERP {C,D} {D,C} {D,C} {D,C} {D,C} iv) Both ERP {C,D} {C,D} {C,D} {D,C} {D,C}
El país i no se cree el número de AVACs declarado por la empresa
Esta parte del árbol se soluciona de manera similar a la parte anteriormente
resuelta. En este resumen únicamente destacamos las diferencias.
En este caso, si el país aplica ERP, al igual que en el caso anterior, el país no
será capaz de descubrir el valor real del medicamento y pagará por tanto el precio
internacional de referencia pIh que podría ser superior o inferior al precio revelado en
caso de aplicar el CEA. Sin embargo, si el país decide aplicar el CEA revelará un número
de AVACs YiCEA menor o igual que el declarado inicialmente por la empresa YF . De esta
manera, el país pagará un precio piCEA inferior al precio pF propuesto por la empresa.
Por lo tanto, por un lado es ahora menos probable que la empresa acepte los precios de
referencia internacional pIh que si hubiera sido creída por el país i (i = C, D), lo que
implica que los países que aplican ERP tendrán más probabilidades de experimentar
retrasos en el lanzamiento. Además, las regiones bajo las cuáles la empresa elige su
secuencia óptima de lanzamiento cambian (Figura 4.2). Por otro lado, el valor esperado
del precio del medicamento E[pi ]CEA será superior cuando la empresa declare un
número de AVACs por encima de su valor verdadero que cuando declare su valor
verdadero.
Dada la secuencia óptima de lanzamiento para la empresa, se compara el
bienestar de los países en el marco de cada política de precios, el CEA y el ERP, con el
objetivo de saber cuál de ellos es más conveniente para los países. Por lo tanto, ya que
se ha resuelto el problema por inducción hacia atrás, se ha llevado a cabo esta
comparación para cada país teniendo en cuenta la secuencia óptima de lanzamiento
102 Bajo pI
pF pF pI

Resumen en español 205
para la empresa. Esta comparación se ha llevado a cabo en tres pasos. En primer lugar,
se ha comparado el mejor resultado para cada país bajo la misma política de precios y en
la misma secuencia de lanzamiento del país, es decir, utilizando el CEA (ERP) bajo las
secuencias {C, D} y {D, C}, respectivamente. Luego, en un segundo paso, se han
comparado los mejores resultados entre el ERP y el CEA para cada secuencia de
lanzamiento. En un tercer paso, se ha comparado la mejor política de precios para cada
secuencia de lanzamiento.
Modelo empírico
En el capítulo 3 desarrollamos un modelo empírico basado en dos ecuaciones,
una ecuación de precio relativo de lanzamiento y otra ecuación de retraso en el
lanzamiento. Previamente, llevamos a cabo la réplica de dos trabajos con nuestra base
de datos, con el objetivo de saber si el uso de una base de datos más reciente y una lista
diferente de países podría influir en los resultados aún utilizando la misma metodología.
Hemos utilizado los datos de la base de datos de IMS Health para 70 nuevas
moléculas lanzadas en 20 países y pertenecientes a 11 clases terapéuticas diferentes,
todas ellas aprobadas mediante el procedimiento centralizado de la EMA103 durante el
período de estudio, 2004-2010. Se han tomado las ventas ambulatorias y hospitalarias en
euros a precio de fabricante y en unidad de volumen (IMS SU) con datos anuales. Los
ingresos se ajustaron por la inflación usando el IPP (Índice de Precios del Productor)
específicos disponibles en el FMI (Fondo Monetario Internacional) tomando 2005 como
año base.
Réplica del modelo de Danzon y Epstein (2008)
Replicamos el estudio de Danzon y Epstein (Danzon and Epstein, 2008) (D&E, a
partir de ahora) con nuestra base de datos con el objetivo de comparar nuestros
resultados, obtenidos de datos más recientes, con lo suyos. La base de datos de D&E
abarca los años 1992-2003 para 11 moléculas pertenecientes a 12 clases terapéuticas
en 15 países que experimentaron el lanzamiento de una nueva subclase poco antes o
durante el período de estudio. D&E recogen datos trimestrales sobre ventas ambulatorias
103 Antes EMEA
206 Modelización de los Precios y Lanzamiento Global de Nuevos Medicamentos
en euros y en volumen (IMS SU) a precio de fabricante104. D&E ajustan por inflación
usando el IPP disponibles en el FMI, con 2003 como año base y convertido a dólares
utilizando el promedio del tipo de cambio específico para cada país en 2003. Se calcula
el precio por dosis de cada fármaco como el ratio entre los ingresos totales y las SU
vendidas en cada trimestre105. El mismo tratamiento de datos y metodología llevados a
cabo por D&E se han aplicado a nuestra base de datos con el objetivo de obtener una
comparación lo más precisa posible, aunque con ciertas limitaciones que comentaremos
en esta sección.
D&E estiman por separado una ecuación de lanzamiento y una ecuación de
precio de lanzamiento. Estiman en primer lugar el modelo de lanzamiento basado en una
regresión clog-log, ajustando los errores estándar por grupos de moléculas. También
estiman un modelo clog-log de efectos aleatorios para tener en cuenta la heterogeneidad
a nivel de molécula. Posteriormente, calculan los efectos marginales para cada variable
independiente. En particular, los efectos marginales para las variables continuas se
calcularon como el Average Marginal Effect (AME). El efecto marginal de las variables
categóricas se calculó como el cambio discreto del nivel base (x = 0) al nivel de
referencia que supone la presencia del atributo (x = 1).
El modelo de precio de lanzamiento se estima en virtud del procedimiento en dos
pasos de Heckman (Heckman, 1979) para tener en cuenta el posible sesgo de selección
producido por la correlación entre la probabilidad de lanzamiento y el precio. En la
primera etapa se estima un modelo lanzamiento basado en una regresión cloglog de
acuerdo a la ecuación de lanzamineto descrita anteriormente. Se calcula la razón inversa
Mills (IMR) (Lee, 1983)106 y se introduce como variable de control en la ecuación precio
104 La unidad definida como la SU de IMS representa la dosis minima de administración de cada formulación como por ejemplo un comprimido o cápusla para sólidos, o 5ml. para líquidos. Los datos de precios de IMS para los EEUU no reflejan descuentos fuera de facture dados por los fabricantes a determinados planes de salud y por lo tanto están sesgados al alza al contabilizar los ingresos netos del fabricante.
105 Diferentes presentaciones farmacéuticas aparecen en un determinado país y trimestre (ej: pastillas y capsulas, posiblemente con diferente cantidad de principio activo). Por lo tanto, para convertir las observaciones existentes en un país y un trimestre en una única observación se define el precio medio ponderado por volumen por unidad. Las presentaciones farmacéuticas idénticas que han sido lanzado por diferentes empresas que comparten la venta del medicamento se incluyeron también en el cálculo de dicho precio. 106 La IMR para la molécula i in el país j y en el momento t, Mijt, se calcula usando la probabilidad predicha de lanzamiento
de la regresión clog-log como , donde es la función de densidad de la Normal
estándar y la función de distribución de la Normal estándar.
p̂sjt Msjt [1( p̂sjt )]
( p̂sjt )[]
()

Resumen en español 207
de lanzamiento. Esta ecuación de precio se estima por mínimos cuadrados ordinarios
(MCO) con errores estándar agrupados por moléculas. La variable dependiente es el
logaritmo del precio promedio ponderado por volumen para cada observación molécula-
país-año. Para tener en cuenta las características de la molécula no observadas D&E
también ofrecen los resultados del estimador de mínimos cuadrados generalizados
(MCG) con efectos aleatorios en la molécula.
En el tratamiento de datos se aplica el mismo procedimiento de D&E para el
ajuste de la inflación utilizando el IPP disponible en el FMI, sin embargo, se toma 2005
como año base. Las ventas en euros han sido convertidas a dólares aplicando el tipo de
cambio del FMI. El precio de los medicamentos se ha calculado de acuerdo a la
metodología de D&E. Aunque D&E distinguen entre moléculas superiores e inferiores, en
este trabajo no hemos tenido en cuenta esta diferencia ya que solamente hemos incluido
el lanzamiento de nuevos medicamentos, por lo tanto, compararemos los resultados de
D&E de la subclase de moléculas superiores con los resultados de nuestra regresión,
entendiendo que los nuevos medicamentos bajo patente no pueden pertenecer a la
subclase de moléculas inferiores definida por D&E. D&E clasifican los países en tres
categorías: de precio alto en UE (Unión Europea), de precio bajo en la UE y de precio
alto fuera a la UE, siendo Alemania el país de referencia. Dado que la muestra de países
no es exactamente la misma, el número de países por cada categoría en los que la
molécula ha sido lanzadas previamente no puede ser comparado de manera directa.
Réplica del modelo de Verniers et al. (2011)
Replicamos el estudio de Verniers et al. (Verniers et al., 2011) con nuestra base
de datos para comparar si los resultados han cambiado debido a la utilización de datos
más recientes (2010 vs. 2008) y si los resultados son robustos a la elección de la lista de
países. Verniers et al. aplicaron su modelo a un gran conjunto de países, ricos y pobres,
mientras que nosotros restringimos nuestra réplica a países desarrollados.
Verniers et al. tienen en cuenta, por un lado, el retraso en el lanzamiento del
medicamento i en el país j ( ), que se define como la diferencia medida en meses
entre el primer lanzamiento a nivel mundial y el lanzamiento posterior en el país
específico j. El precio de lanzamiento se define como logaritmo natural transformado del
precio de fabricante por cada gramo del medicamento i en el país j en el momento de su
LWij*

208 Modelización de los Precios y Lanzamiento Global de Nuevos Medicamentos
(a)
(b)
(4.29)
(4.28)
lanzamiento ( ). Verniers et al. consideran que se produce censura para las
medicamentos de los países para los que el lanzamiento al final del periodo de
observación no se ha producido. De esta manera, el tiempo de censura (Cij ) se define
como el tiempo entre la fecha de lanzamiento del medicamento en cada país y el final del
período de observación. Dado que los valores reales de y no se observan
debido a la existencia de censura por la derecha, los valores observados de y se
indican de tal manera que,
LWij LWij* if LWij
* Cij
LWij Cij otherwise
Además, solamente observamos las observaciones con LWij* Cij y por tanto,
LPij LPij*
Las ecuaciones estructurales son:
Donde Zij1 y Zij2 son definidas como variables explicativas. Las variables Zij1 y Zij2
comprenden el tamaño del país, el gasto en sanidad per cápita y el uso de determinadas
políticas regulatorias de precios como regulación directa del precio de fabricante, control
de beneficios, el uso del ERP, el uso del sistema de RP (precios de referencia) y la
evaluación económica como cuarta barrera. Además, comprenden el grado de protección
de la patente, la pertenencia a la EMA y la localización de la empresa. La variable de
competencia y la variable verano están también comprendidas en la variable Zij1. Zij2
LPij*
LWij* LPij
*
LWijLPij
LWij* 1LPij
* 2 (LPij*)2 'Zij1 uij1
LPij* 1LWij
* 2 (LWij*)2 'Zij 2 uij 2
(b)
(a)
Resumen en español 209
incluye las mismas variables que Zij1 excepto la variable verano y la variable EMA. Sin
embargo, incluye la tasa de inflación y la DDD.
De acuerdo a Garen (Garen, 1984), Verniers et al. consideran el retraso de
lanzamiento y el precio de lanzamiento como variables endógenas. Por lo tanto, la
empresa y el regulador pueden decidir el retraso del lanzamiento con el objetivo de influir
en el precio de lanzamiento, y seleccionar el precio de lanzamiento con el objetivo de
influir en el retraso en del lanzamiento. Las variables omitidas contenidas en los términos
de error de ambas ecuaciones incluyen variables estratégicas no observables utilizadas
por la empresa y el regulador para elegir el valor óptimo del retraso y del precio,
respectivamente. Se puede esperar que estas variables estratégicas estarían
correlacionadas con el precio de lanzamiento y el retraso del lanzamiento
correspondientemente.
Verniers et al. para tener en cuenta la endogeneidad entre los precios y los
retrasos en el lanzamiento estiman un sistema de ecuaciones simultáneas usando un
procedimiento de mínimos cuadrados en tres etapas (MC3E), como en Bayus et
al.(Bayus et al., 2007). Además, los autores corrigen la censura a la derecha y el sesgo
de selección utilizando el procedimiento descrito en Vella (Vella, 1993) o Wooldridge
(Wooldridge, 2002). Incluyen los efectos aleatorios de los países en ambas ecuaciones
para tener en cuenta el hecho de que existen observaciones repetidas en todos los
países para la mayoría de los medicamentos.
Por un lado, para estimar la ecuación estructural de lanzamiento, Verniers et al.
primero estiman la forma reducida de la ecuación de precio de lanzamiento a través de
una regresión Tobit de tipo II (para tener en cuenta el hecho de que sólo observamos
precios si el medicamento ya se ha lanzado). Esta ecuación de precio contiene dos
variables que influyen únicamente en el precio pero no en el retraso de lanzamiento, la
dosis diaria definida (DDD) y la tasa de inflación, que sirven como instrumentos para el
precio en la ecuación de lanzamiento. Los residuos generalizados de la ecuación
reducida de precio se añaden a la ecuación de lanzamiento como término de corrección.
Sin embargo, nosotros solamente usamos un instrumento en el modelo ya que no hemos
sido capaces de calcular la DDD para la mayoría de las moléculas. Por otro lado, para
estimar la ecuación estructural del precio, Verniers et al. estiman primero la forma
reducida de la ecuación de lanzamiento a través de una regresión Tobit de tipo I (para
tener en cuenta de la censura a la derecha). Esta ecuación de lanzamiento contiene dos
210 Modelización de los Precios y Lanzamiento Global de Nuevos Medicamentos
variables que influyen sobre el lanzamiento pero no sobre los precios, la variable summer
y la EMA, que sirven como instrumentos para el retraso en el lanzamiento en la ecuación
de precio. En este caso se han incluido los dos instrumentos en el modelo replicado. Los
residuos generalizados de la ecuación reducida de lanzamiento se añaden como término
de corrección a la ecuación de precio.
Verniers et al . recopilan la base de datos IMS Health sobre medicamentos en de
5 grupos terapéuticos en 50 países durante el período de estudio, 1994-2008. Recogen
datos anuales sobre las ventas ambulatorias a precios de fabricante. Calculan el precio
por gramo en dólares estadounidenses para cada fármaco. Para hacer que los precios de
medicamentos sean comparables entre países, los precios en moneda local se
convirtieron a dólares utilizando el tipo de cambio vigente en el momento del
lanzamiento.
En nuestra réplica también utilizamos los datos de la base de datos de IMS
Health. Sin embargo, sólo tenemos en cuenta el lanzamiento de los nuevos
medicamentos en 20 países desarrollados para 11 clases terapéuticas durante el período
de estudio 2004-2010, todos ellos aprobados por el procedimiento centralizado de la
EMA. También hemos recogido las ventas ambulatorias por año a precio de fabricante.
Los precios en euros han sido convertidos a dólares USD aplicando el tipo de cambio del
Fondo Monetario Internacional. Por último, el precio del medicamento se ha calculado
como Verniers et al., por lo tanto, también se utiliza el precio por gramo en dólares
estadounidenses con el fin de hacer comparables los resultados.
Nuevo modelo precio y lanzamiento (NPLM)
Estimamos las ecuaciones de retraso en el lanzamiento y precio relativo de
lanzamiento por separado, y cada una de ellas se estima para el mercado ambulatorio y
el mercado hospitalario. Hemos tratado de estimar un sistema de ecuaciones para tener
en cuenta la endogeneidad entre el retraso en el lanzamiento y el precio, sin embargo, el
instrumento disponible para la ecuación de precio es débil107.
Usamos un modelo paramétrico de duración del riesgo de lanzamiento de un
medicamento en el tiempo t dadas las variables explicativas observadas, con los datos
107 Seleccionamos la variable inflación como instrumento del precio en la ecuación de lanzamiento. La correlación entre la inflación y el precio de lanzamiento es muy baja (0.02), por lo tanto no deberíamos usarla como instrumento.

Resumen en español 211
censurados a la derecha para modelizar el retraso del lanzamiento de la molécula i en el
país j, que se define como el tiempo transcurrido entre el mes del primer lanzamiento a
nivel mundial de la molécula i y su lanzamiento en el país j. Se especifica la forma de la
tasa de riesgo, es decir, su dependencia del tiempo, con una distribución de Weibull que
asume una relación monótona respecto al tiempo. Puesto que no hemos sido capaces de
observar todas las variables que afectan al retraso en el lanzamiento hemos controlado
por la heterogeneidad no observada introduciendo una distribución gamma para el
término aleatorio del error. La selección del modelo ha seguido el método propuesto por
Kiefer (Kiefer, 1988). En un primer paso, de acuerdo con la función de densidad de la
variable endógena, como se muestra en las Figura 4.4 y 4.5, en términos generales,
tenemos una función monótonamente decreciente. En base a estas formas los modelos
más adecuados son los modelos paramétricos Weibull y Gompertz. Estos dos modelos
son de uso frecuente con datos que presentan tasa de fracaso monótonas, ya sea en
aumento o en disminución. La forma más común para el control de la heterogeneidad no
observable consiste en la introducción de una distribución paramétrica para el término de
error aleatorio y por lo tanto, estimar los parámetros de la función que genera tal término
de error. No hay un patrón estricto para elegir esa distribución. Basados en la literatura
previa, las dos distribuciones más utilizadas son la Gamma (Klein and Moeschberger,
1997, Lancaster, 1992) y la inversa de Gauss (StataCorp, 2009). De acuerdo a esto,
estimamos cuatro modelos paramétricos diferentes. En las Tabla 4.2 se muestra el AIC
(Criterio de Información de Akaike) para medir la bondad de ajuste de los modelos y las
pruebas estadísticas de la heterogeneidad no observada. Otra forma de selección de los
modelos se basa en el análisis de los residuos generalizadas de Cox-Snell. Si el modelo
ha sido seleccionado correctamente los residuos de Cox-Snell deberían presentar una
forma cercana a la función exponencial unitaria. Las figuras y tablas mostradas aquí en
relación a la selección del modelo de lanzamiento se refieren únicamente al mercado
ambulatorio. Idéntico proceso y resultado arroja el mercado hospitalario.
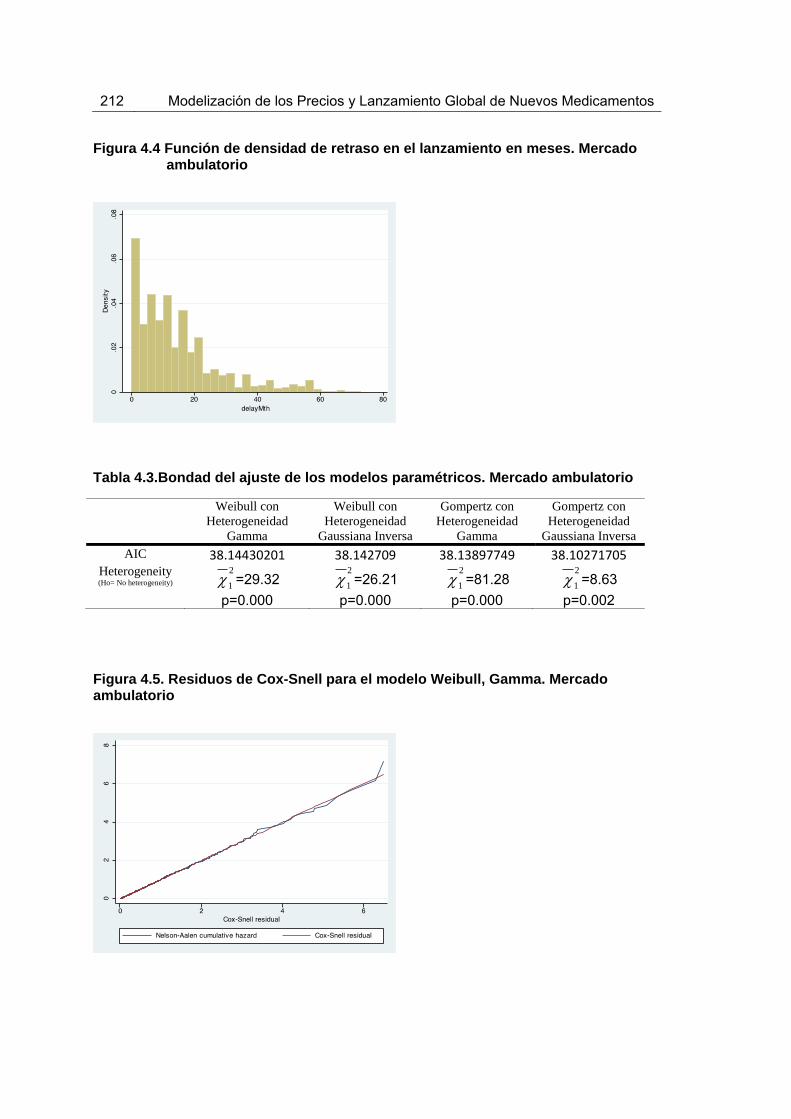
212 Modelización de los Precios y Lanzamiento Global de Nuevos Medicamentos
Figura 4.4 Función de densidad de retraso en el lanzamiento en meses. Mercado
ambulatorio
Tabla 4.3.Bondad del ajuste de los modelos paramétricos. Mercado ambulatorio
Weibull con Heterogeneidad
Gamma
Weibull con Heterogeneidad
Gaussiana Inversa
Gompertz con Heterogeneidad
Gamma
Gompertz con Heterogeneidad
Gaussiana Inversa AIC 38.14430201 38.142709 38.13897749 38.10271705
Heterogeneity (Ho= No heterogeneity) =29.32
p=0.000
=26.21
p=0.000
=81.28
p=0.000
=8.63
p=0.002
Figura 4.5. Residuos de Cox-Snell para el modelo Weibull, Gamma. Mercado ambulatorio
1
21
21
21
2

Resumen en español 213
(4.30)h(t, X) p(t)p1[U]
De acuerdo al proceso descrito anteriormente se estima un modelo de duración
paramétrico Weibull con heterogeneidad Gamma. Concretamente, estimamos un modelo
censurado a la derecha ya que todas los medicamentos en nuestro conjunto de datos se
lanzaron entre enero de 2004 y diciembre de 2010, sin embargo no todos los fármacos
se habían lanzado en los 20 países a finales de nuestro período de observación. Por lo
tanto, nuestros datos contienen observaciones censuradas a la derecha. El modelo
paramétrico de duración para el riesgo de lanzamiento no tiene en cuenta el uso de
covariables que varíen en el tiempo108, en su lugar se han utilizado los datos recogidos
en el año base109. Por lo tanto, tenemos:
donde el subíndice i=molécula, j=país, h es la tasa de riesgo de poner en
marcha, Xij son las covariables, los parámetros de las covariables, t el tiempo
transcurrido hasta el lanzamiento de la molécula i en el país j, p el parámetro de la forma
funcional110, U la variable aleatoria y la varianza de la heterogeneidad no observada111
(Jenkins, 2008, Keele, 2007). Las covariables Xij incluyen el precio relativo de
lanzamiento a nivel de molécula, el logaritmo del tamaño del país (población), el
logaritmo del gasto público en salud per cápita, el logaritmo del gasto farmacéutico per
cápita, la variable dicotómica que señala la ubicación de la sede de la empresa en el país
de lanzamiento, la variable dicotómica pertenecer a la EMA y los efectos fijos de la clase
terapéutica a la que pertenece el medicamento a nivel ATC-1 (Categoría Anatómica
Terapéutica-1).
108 Ya que rechazamos la hipótesis nula del lg-rank test, el supuesto de proporcionalidad no se cumple, por lo tanto no deberíamos incluir variables cambiantes en el tiempo ni usar el modelo de regression de Cox. El modelo de Cox extendido permite incorporar variables que cambian en el tiempo pero no deberíamos usarlo ya que no permite incorporar censura. 109 Para las covariables que atienden a características del país como población, PIB per cápita, gasto en salud y gasto farmacéutico per cápita, usamos el dato del primer año o año base (2004). Estas variables se incluyen en el modelo para controlar por las diferencias entre tamaño, riqueza y capacidad de gasto de los países, bien representadas por los datos del año 2004.
110 El parámetro p de la forma funcional determina si la probabilidad crece, decrece o permanece constante a lo largo del tiempo.
111 Contrastando la hipótesis de usando el test de razón de verosimilitudes, se puede determinar si se debe controlar por la heterogeneidad no observada.
ij eXij
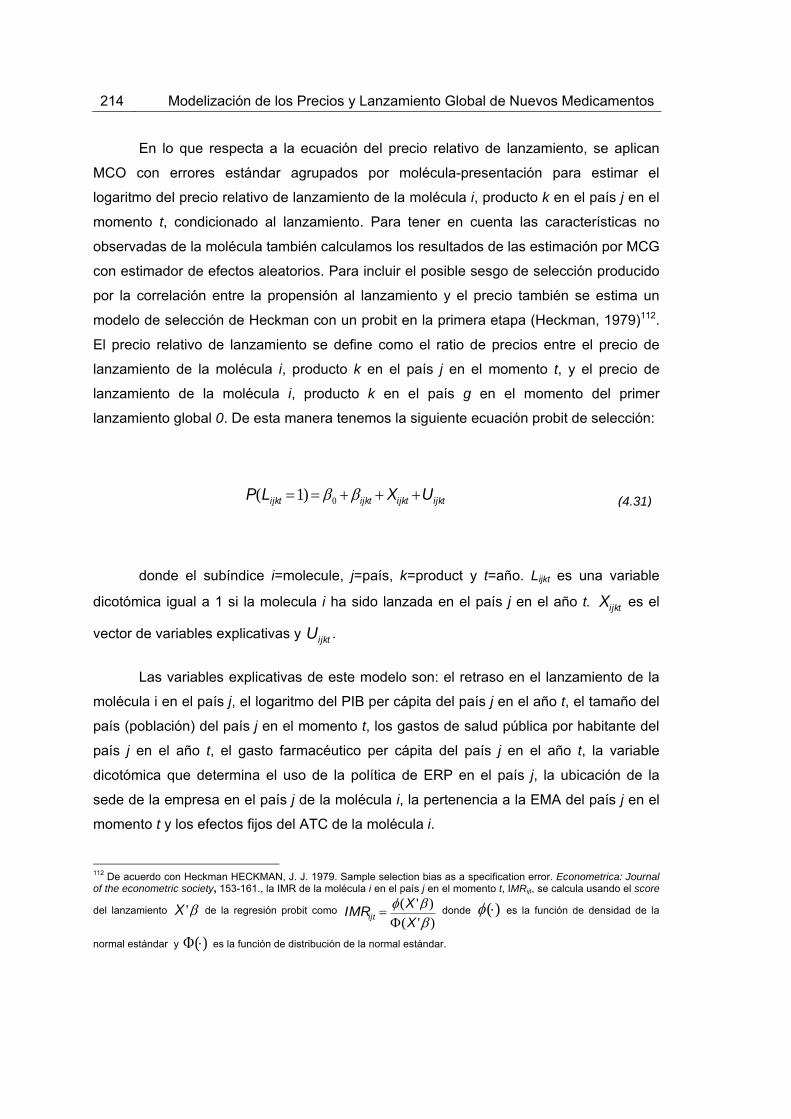
214 Modelización de los Precios y Lanzamiento Global de Nuevos Medicamentos
En lo que respecta a la ecuación del precio relativo de lanzamiento, se aplican
MCO con errores estándar agrupados por molécula-presentación para estimar el
logaritmo del precio relativo de lanzamiento de la molécula i, producto k en el país j en el
momento t, condicionado al lanzamiento. Para tener en cuenta las características no
observadas de la molécula también calculamos los resultados de las estimación por MCG
con estimador de efectos aleatorios. Para incluir el posible sesgo de selección producido
por la correlación entre la propensión al lanzamiento y el precio también se estima un
modelo de selección de Heckman con un probit en la primera etapa (Heckman, 1979)112.
El precio relativo de lanzamiento se define como el ratio de precios entre el precio de
lanzamiento de la molécula i, producto k en el país j en el momento t, y el precio de
lanzamiento de la molécula i, producto k en el país g en el momento del primer
lanzamiento global 0. De esta manera tenemos la siguiente ecuación probit de selección:
P(Lijkt 1) 0 ijkt Xijkt Uijkt
donde el subíndice i=molecule, j=país, k=product y t=año. Lijkt es una variable
dicotómica igual a 1 si la molecula i ha sido lanzada en el país j en el año t. Xijkt es el
vector de variables explicativas y Uijkt .
Las variables explicativas de este modelo son: el retraso en el lanzamiento de la
molécula i en el país j, el logaritmo del PIB per cápita del país j en el año t, el tamaño del
país (población) del país j en el momento t, los gastos de salud pública por habitante del
país j en el año t, el gasto farmacéutico per cápita del país j en el año t, la variable
dicotómica que determina el uso de la política de ERP en el país j, la ubicación de la
sede de la empresa en el país j de la molécula i, la pertenencia a la EMA del país j en el
momento t y los efectos fijos del ATC de la molécula i.
112 De acuerdo con Heckman HECKMAN, J. J. 1979. Sample selection bias as a specification error. Econometrica: Journal of the econometric society, 153-161., la IMR de la molécula i en el país j en el momento t, IMRijt, se calcula usando el score
del lanzamiento de la regresión probit como donde es la función de densidad de la
normal estándar y es la función de distribución de la normal estándar.
X ' IMRijt (X ')
(X ')()
()
(4.31)

Resumen en español 215
RPijkt Pijkt
Pizg0
0 'Zijkt Vijkt
donde el subíndice i=molécula, k=producto, j=país, g=país del primer lanzamiento a nivel
mundial y t = año. es el precio de lanzamiento relativa, es el precio de
lanzamiento en el país j en el momento t, y es el precio de lanzamiento en el país g
en el momento del primer lanzamiento global 0, es el vector de variables explicativas
y Vijkt es el término aleatorio de error.
Las variables explicativas de este modelo son las mismas que en la ecuación
probit de selección además del cuadrado del retraso en el lanzamiento, la tendencia
durante el periodo observado y la IMR de la ecuación probit de selección.
El modelo estudia el efecto del precio de lanzamiento sobre retraso de
lanzamiento y viceversa. Además, pretende observar el efecto de la aplicación de la
política de ERP tanto sobre el precio y retraso del lanzamiento. Se espera que los países
que pagan precios altos experimenten menores retrasos en el lanzamiento y a su vez,
que los países que sufren mayores retrasos en el lanzamiento paguen menores precios
relativos de lanzamiento. También se espera que el uso del ERP sea eficaz, por lo que
los países que apliquen esta política de precios sufran mayores retrasos en el
lanzamiento y paguen menores precios de lanzamiento.
Para mostrar lo comentado en el párrafo anterior hemos controlado por las
características del país en cuanto a la capacidad de negociación del mismo, como su
tamaño y poder adquisitivo (PIB). Se espera que los países con gran volumen de compra
experimenten menores retrasos en el lanzamiento y paguen precios más bajos para los
nuevos medicamentos, mientras que los países con mayor poder adquisitivo, se espera
que también tengan un acceso al mercado más rápido, pero a precios más altos. Otras
características de los países que hemos tomado en cuenta son el gasto en salud y el
gasto farmacéutico público per cápita. Se espera que el aumento de estas variables
pueda acortar el retraso en el lanzamiento e implica pagar precios más altos. Esta idea
RPijkt Pijkt
Pijko
Zijkt
(4.32)

216 Modelización de los Precios y Lanzamiento Global de Nuevos Medicamentos
se basa en que dado que los países con un elevado gasto en salud pública deberían
estar más preocupados por la disponibilidad de los medicamentos en su mercado, se
espera que paguen precios más altos y traten de tener el nuevo fármaco disponible lo
antes posible. A su vez, los países con un elevado gasto farmacéutico per cápita se
presume que estarían dispuestos a pagar precios más altos y, por lo tanto, las empresas
estarían interesadas en lanzar los medicamentos con prioridad en estos países.
Además, hemos controlado por la ubicación de la sede de la empresa. Se espera
que los países que acogen la sede de la empresa experimenten menores retrasos y
paguen precios más altos. Creemos que la localización de la sede de la empresa en el
país de lanzamiento podría generar otro tipo de beneficios para el país que motiven que
el país tenga disponible el medicamento en su mercado tan pronto como sea posible y a
un precio relativo de lanzamiento superior (por ejemplo, el empleo, los ingresos
procedentes de los impuestos, etc.). Además, dado que la base de datos contiene países
pertenecientes a la EMA y países ajenos, y sabiendo que los procesos de aprobación de
medicamentos no tardan los mismo dependiendo del órgano correspondiente (la Food
and Drug Administration (FDA), la EMEA, etc.), se espera que la variable dicotómica
EMA afecte al retraso en el lanzamiento del nuevo fármaco.
También hemos controlado por los efectos fijos de la clase terapéutica a la que
pertenece el medicamento a nivel ATC-1 y por la tendencia temporal, sin embargo, los
efectos fijos de país no se han incluido porque la variable de mayor interés, que mide el
uso de los controles sobre precios, tiene poca variación dentro del país.
Hemos utilizado la base de datos de IMS Health descrita previamente al comienzo
de la sección empírica de esta Tesis. El precio por SU para cada producto k se calculó
sobre una base anual como el ratio de los ingresos totales y las SU vendidas. Dos
productos k son considerados idénticos si presentan la misma cantidad de SU y la misma
vía de administración. Para cada combinación molécula-país que proporciona dos o más
productos idénticos pero con diferentes packsizes113, se calcula el precio promedio
ponderado por volumen.
113 Ej: Pastillas 150MG 28 and Pastillas 150MG 56.

Resumen en español 217
Resultados
Revisión de la literatura
Los resultados obtenidos de la revision de modelos teóricos explican las
estrategias utilizadas por los gobiernos, los aseguradores públicos y las compan´ías
farmacéuticas. Aunque los modelos propuestos difieren en las hipótesis asumidas y no
reflejan la realidad del lanzamiento de medicamentos y de la fijación de precios en todo
su conjunto, aportan información sobre las principales cuestiones que la literature ha
analizado. Distinguimos dos tipos de factores: primero, los factores que afectan
directamente al precio y al lanzamiento como las políticas de regulación de precios, la
existencia de PT y las características de las compañías farmacéuticas. Por otro lado,
otros factores que no solamente afectan directa sino también indirectamente al
lanzamiento y al precio influyendo en el grado de influencia de los primeros, como el
tamaño del país y el nivel de los copagos farmacéuticos.
La literatura destaca la regulación directa de los precios como el uso del ERP, el
control indirecto como el RP interno y el MES+PC (Estándar Mínimo de Eficacia+Control
de Precios) que incluye ambos tipos, directo e indirecto. El resultado de estas tres
políticas es muy sensible a su diseño. El ERP afecta al precio de los países que son
tomados de referencia mientras que el nivel elegido en el diseño del RP afecta al alza los
precios fijados por la industria y al lanzamiento de nuevos fármacos. El esquema del
MES+PC puede afectar no solamente al precio, sino también a la inversión en I+D y a la
calidad del fármaco.
La presencia de PT hace converger los precios entre los países importadores y
exportadores. Las pérdidas procedentes del PT deben ser consideradas por las
empresas como una pérdida de ingresos a la hora de hacer su balance. Se propone que
las empresas exportadoras incrementen sus precios en los países importadores.
Las empresas como agentes económicos tienen una importante influencia en el
lanzamiento y en los precios de los medicamentos. Las empresas que tienen su sede en
el país de lanzamiento parecen fijar precios en ese país ligeramente superiores al resto
de países. Además, un incremento en el contacto entre empresas que venden en
diferentes países induce a altos niveles de colusión y por tanto a precios superiores,
218 Modelización de los Precios y Lanzamiento Global de Nuevos Medicamentos
aunque este efecto colusivo parece ser menor en aquellos países donde los precios
están altamente regulados.
El tamaño del país y el nivel de copago afectan de manera indirecta a algunos de
los factores anteriormente descritos. La preferencia de aplicar ERP se reduce cuando
nivel de copago entre el país de referencia y el país que referencia converge. Cuando el
MES+PC mejora la calidad de un medicamento de baja calidad e incrementa su precio,
pero reduce la calidad del fármaco de alta calidad y reduce su precio, el resultado final
dependerá del tamaño de los grupos de compradores de calidad alta y de calidad baja. El
tamaño del país importador influye positivamente en el número de empresas
importadoras y por ende en el precio del medicamento en el país importador. Asimismo,
los precios en un país entre una empresa local y una multinacional extranjera convergen
cuando el tamaño del país de la multinacional extranjera aumenta. Además, ante la
posibilidad de filtración de información entre países sobre la calidad de un producto,
aunque la empres podría evitar esta situación lanzando simultáneamente el fármaco, la
preferencia de la empresa sobre dónde retrasar el lanzamiento depende positivamente
del tamaño relativo de los países y de los niveles de copago.
La literatura empírica recoge modelos econométricos que han identificado y
medido la influencia de los factores que afectan al lanzamiento y al precio de manera
significativa. El uso de diferentes muestras debe hacer cauta la comparación.
Características demográficas y económicas de los países, y los niveles de
regulación del mercado farmacéutico, son los factores más importantes. No obstante, la
regulación de los precios podría debilitar los efectos de estos factores importantes. Con
el apoyo de estudios anteriores, la pertenencia a la EMA y la innovación terapéutica
afecta fuertemente el retraso en el lanzamiento y el precio de lanzamiento
respectivamente. Las características del medicamento como la cantidad de principio
activo, el tamaño y la forma de presentación, se han mostrado significativamente
relacionados con el precio en la literatura anterior. El valor terapéutico aparece en la
literatura anterior como un factor influyente y robusto en el precio y lanzamiento de
nuevos medicamentos. La localización de la empresa es importante a la hora de lanzar
un medicamento pero su efecto sobre los precios parece ambiguo.
El tamaño del país, el PIB per capita y la distribución de la renta son tres factores
que afectan de manera robusta al lanzamiento y al precio. Los países con rentas más
Resumen en español 219
altas pagan precios más altos y tienen un acceso más rápido a los medicamentos;
además, los países más poblados también disfrutan de una mayor probabilidad de
lanzamiento. Asimismo, una distribución de la renta menos equitativa afecta
positivamente a la probabilidad de lanzamiento en países de renta baja a través de una
élite poderosa. Una distribución de la renta más equitativa tiene el mismo efecto en
países de renta alta a través de una clase media pudiente.
El resultado más común de esta revisión demuestra que la regulación de precios
tiende a producir retrasos en el lanzamiento. Esto ha sido observado en países de
regulación estricta y en países tradicionalmente exportadores. Algunos ejemplos estudian
el uso del ERP, de la evaluación económica como cuarta barrera o la congelación de
precios.
La calidad terapéutica, la concentración del principio activo y el número de
presentaciones afectan positivamente a los precios. El pack size y el ciclo de vida del
producto lo hace negativamente.
Modelo teórico
La Figura 4.6 presenta la relación entre el coste unitario de aplicar el CEA y la
diferencia de precios entre el precio internacional de referencia y el precio esperado. De
acuerdo a esta relación, el país i (i = C,D) podrá elegir su política de precios más
conveniente, bien el ERP o el CEA.

220 Modelización de los Precios y Lanzamiento Global de Nuevos Medicamentos
(4.33)
Figura 4.6 Trade-off entre CEA y ERP
Si el país i no sufre retraso en el lanzamiento bajo ninguna de las política de precios, o
bien, bajos las dos políticas, el país i estará mejor aplicando ERP cuando el coste unitario
del CEA sea mayor que la diferencia entre el precio internacional de referencia y el precio
esperado del país i bajo el CEA. Cuanto menor sea el tamaño de la población, más
atractivo será el ERP ya que el coste unitario del CEA aumenta.
a
qi
pIh E[pi ]CEA

Resumen en español 221
(4.34)
(4.35)
Si el país i sufre retraso en el lanzamiento cuando aplica ERP, pero no si aplica CEA, el
coste del retraso (r) hará más atractiva el CEA,
a
qi
pIh E[pi ]CEA r
De manera análoga, si el país i sufre retraso en el lanzamiento cuando aplica CEA, pero
no si aplica ERP, el coste del retraso (r) hará más atractiva el ERP,
a
qi
pIh E[pi ]CEA r
Intuitivamente, desde que el coste unitario del CEA decrece, para que ERP siga
siendo conveniente, la diferencia de precios debería ser menor, bien porque el precio
internacional de referencia baja o el precio esperado del país i cuando aplica CEA
aumenta. De otro modo, si el coste unitario de aplicar CEA crece, para que CEA siga
siendo ventajoso, la diferencia de precios debería aumentar, bien porque el precio
internacional de referencia crece o porque el precio esperado de el país i cuando aplica
CEA decrece.
Sin embargo, cuando comparamos ambas políticas de precio y solamente el país i
que aplica CEA sufre retraso en el lanzamiento, incluso siendo la diferencia de precios
más alta que el coste unitario de aplicar CEA, el coste unitario del retraso del CEA podría
compensar esta diferencia y hacer más ventajoso el ERP. De manera análoga, si
solamente el país i que aplica ERP sufre retraso en el lanzamiento, incluso siendo que el
coste unitario de aplicar CEA superior a la diferencia de precios, el coste unitario del
retraso del ERP podría compensar esta diferencia y hacer más atractivo el CEA.
Cuando la diferencia de precios es negativa, es decir, el precio esperado del país i
aplicando CEA es superior que el precio internacional de referencia, y el país que aplica
222 Modelización de los Precios y Lanzamiento Global de Nuevos Medicamentos
el CEA sufre retraso en el lanzamiento, el ERP será siempre preferido por el país i.
El precio esperado será superior cuando el país no se crea el número de
AVACs declarado de la empresa que cuando se lo crea. Esto implica que ERP será más
atractivo para los países cuando el país no se crea el número de AVACs.
Modelo empírico
Cuando replicamos el modelo de D&E, el número de países de precio alto de
dentro y fuera de la UE donde el medicamento se ha lanzado anteriormente, y los precios
de los competidores, son los factores más robustos que afectan al lanzamiento de
medicamentos. Las empresas retrasan el lanzamiento en países de precio bajo hasta
que el medicamento está disponible en los países de precio alto. Nuestro modelo
encuentra resultados similares. Encontramos incluso que las empresa retrasan el
lanzamiento en países de precio alto fuera de la UE hasta lanzarlos en países de precio
alto de la UE. D&E encuentran que dependiendo de los diferentes tipos de empresas:
empresa local que produce medicamentos originales, empresa local que solamente
vende con licencia y empresa comercializadora junto con otra, afectan de manera
significativa a la hora del lanzamiento. La primera tiene mayor probabilidad de
lanzamiento que las otras dos. Nuestro modelo no encuentra efectos significativos de
estas características. D&E no presentan los efectos de las dummies de país aunque
reporta que son significativas. Nuestro modelo muestra que Alemania disfruta de
menores retrasos en el lanzamiento de medicamentos en media que el resto de países.
En ambos modelos, el de D&E y el nuestro, el precio mínimo previamente fijado
en otros países presenta efectos diferentes sobre el precio de lanzamiento. Los países
que fijan su precio de lanzamiento sin ninguna referencia de la UE pagan precio más
altos. La transmisión de información sobre los precios entre países para fijar sus propios
precios ocurre entre países dentro de la UE, fuera de la UE y entre países de la UE y
fuera de ella. Sin embargo, D&E muestran que esta relación solamente se sucede entre
los países de la UE. A diferencia que en la ecuación de lanzamiento, D&E no encuentran
ningún efecto sobre el precio del tipo de empresa que venda el fármaco. Sin embargo,
nuestro modelo encuentra que las empresas que venden solamente con licencia
presentan precios más bajos que el resto de empresas. Ninguno de los modelos no
encuentra ningún efecto de la renta per cápita sobre los precios. La concentración del
E[pi ]CEA

Resumen en español 223
principio activo afecta positivamente al precio en el modelo de D&E pero nuestro modelo
no encuentra efecto significativo de esta variable. En ambos modelos, la vía de
administración presenta un resultado robusto, siendo los medicamentos inyectables más
caros que otro tipo de fármacos como los orales. En ambos modelos también, Alemania
presenta en media precios superiores al resto de países.
Nuestra réplica de Verniers et al. con datos más recientes y una selección
diferente de países arroja nuevos resultados. El resultado más importante es que el
carácter endógeno de precios de lanzamiento y del retraso encontrado por Verniers et al.
no se observa con nuestros datos, sólo el retraso en el lanzamiento se ve afectado
negativamente por el precio de lanzamiento en una dirección. Los efectos de algunas
políticas regulatorias sobre el retraso en el lanzamiento no parecen cumplirse de manera
general. Algunas políticas de regulación que tradicionalmente afectan al retraso en el
lanzamiento, como el control sobre los beneficios o los precios de referencia interna, no
son significativas en el modelo que se replica. Sin embargo, ambos modelos muestran
que el uso de la evaluación económica como cuarta barrera provoca mayores retrasos en
el lanzamiento. Además, en ambos modelos también, mientras más fuerte es la
protección sobre la patente, los países disfrutan de menores retrasos en el lanzamiento.
Sólo el modelo que se replica presenta un efecto significativo y esperado para el uso del
ERP. Por otro lado, las políticas de regulación no muestran efectos significativos en el
precio de lanzamiento bajo ninguno de los modelos, excepto la protección de la patente;
en este caso una mayor protección de patentes supone una presión a la baja sobre los
precios de lanzamiento. Una vez más, igual que con el modelo de D&E, la ubicación de la
empresa ya no tiene efecto sobre el lanzamiento y la fijación de precios de nuevos
medicamentos.
En nuestro modelo, el precio no presenta efecto significativo sobre el lanzamiento.
El uso del ERP afecta negativamente a la probabilidad de lanzamiento. Sin embargo, y a
diferencia de estudios anteriores, los países de mayor tamaño (mayor población) parece
sufrir mayores retrasos. Este resultado no esperado muestra que el poder de negociación
debido al tamaño del país no tiene efecto sobre un acceso más rápido a los
medicamentos. Los factores que tienen un importante efecto positivo en la probabilidad
de lanzamiento son la renta per cápita y la pertenencia a la EMA. Sin embargo, otros
indicadores como el gasto público en salud y en el gasto farmacéutico. Tampoco el
hecho de que la empresa esté localizada en el país de lanzamiento parece no estar

224 Modelización de los Precios y Lanzamiento Global de Nuevos Medicamentos
relacionado con un lanzamiento precoz.
Bajo nuestro modelo, el retraso en el lanzamiento no afecta significativamente al
precio relativo de lanzamiento. Este resultado podría indicar que las empresas priorizan
evitar los efectos del ERP y del PT frente a poder generar ingresos de esas ventas más
tardías a precios más bajos. De hecho, los países ya no se benefician de pagar precios
inferiores a cambio de acceder más tarde a los medicamentos. Además, observamos que
el ERP no afecta al precio de lanzamiento. Los países que aplican ERP no pagan precios
relativos más bajos que aquellos países que no aplican esta política de precios. Este
resultado no esperado muestra que el uso de ERP no es efectivo, bien porque algunos
países podrían tomar el precio de referencia directamente, porque otros países podrían
no aplicar ERP en último término como criterio exclusivo, o porque las empresas no
están dispuestas a vender a los precios que resultan de aplicar ERP. Además, otras
características como el gasto público en salud y el gasto farmacéutico per cápita afectan
significativamente el precio relativo de lanzamiento. De hecho, los países con un alto
gasto público en salud y un gasto farmacéutico pagan precios relativos superiores.
También, los países con mayor población, que disfrutan de un mayor poder de
negociación, pagan precios más bajos en medio. En general, los resultados para el
mercado ambulatorio y el mercado hospitalario no muestran grandes diferencias.

Resumen en castellano 225
Tabla 4.4. Ecuación del precio relativo de lanzamiento
Ambulatorio Hospitalario
MCO - ESs Robustos Agrupados Efectos aleatorios MCO ESs Robustos Agrupados Efectos aleatoriosRetraso -0.0722 0.0053 -0.0726 0.0137 [0.1296] [0.1199] [0.1695] [0.1490] Retraso*Retraso 0.0023 0.0008 0.0000 1.41e-06 [0.0021] [0.0008] [0.0000] [6.87e-06] Log del Tamaño del País (población) -8.6599* -5.8246*** -10.1434** -4.2420*
[4.7556] [1.9964] [4.4531] [2.4337] Log del PIB per cápita -9.5648 -2.6522 7.7304 1.7151
[9.7722] [16.5960] [12.6634] [19.4184] Log del Gasto en Salud per cápita 24.6213* 14.3926*** 18.0517* 4.1666
[13.9677] [12.7490] [9.8605] [14.9830] Log del Gasto Farmacéutico per cápita 50.7958* 37.3478 70.6921** 29.2789
[27.4052] [13.0590] [31.7399] [18.2923] ERP -5.8320 -2.7864 -8.9012 -4.8740 [4.1272] [3.3182] [6.0281] [4.3355] País sede de la empresa -4.1632 -4.1037 -19.7583* -5.1026
[3.5854] [5.8000] [11.5931] [8.3115] Año 2004 RC RC RC RC RC RC RC RC 2005 0.6371 -2.8228 3.6965 -1.4028 [2.3904] [7.3313] [3.3774] [9.1615] 2006 -0.9426 -4.1618 4.4947 1.0742 [2.8771] [8.1672] [4.3652] [10.8644] 2007 -3.6626 -6.0497 -3.1937 -0.3632 [5.1028] [8.4271] [5.5596] [11.4744] 2008 -4.4736 -8.0594 -1.3471 1.0891 [5.0712] [8.8661] [5.6821] [12.3694]

226 Modelización de los Precios y Lanzamiento Global de Nuevos Medicamentos
Niveldesignificación(amboslados):*:p<0.10;**:p<0.05;***:p<0.01.;[]:ErrorEstándar;n.r.:nomostrado;‐:noincluido;RC:categoríadereferencia
Ambulatorio Hospitalario MCO - ESs Robustos Agrupados Efectos aleatorios MCO ESs Robustos Agrupados Efectos aleatorios 2009 -2.1013 -8.1843 14.1190 1.3525 [3.6430] [9.2742] [11.2567] [13.2468] 2010 -16.3579 -16.5441 -7.6186 -4.3132 [10.4757] [10.2073] [9.7540] [14.6237] IMR 60.7956* 45.6041*** 80.9075** 25.3029 [33.2356] [16.1445] [36.1181] [23.8379] Constant -19.4495 -303.1349** -648.5746* -210.4026 [87.4215] [140.4957] [329.3245] [207.2856] Observaciones 1334 1334 1369 1369 Número de Molécula-presentación-grupo 69 69 70 70
R-cuadrado 0.1776 0.1744 0.1952 0.1952
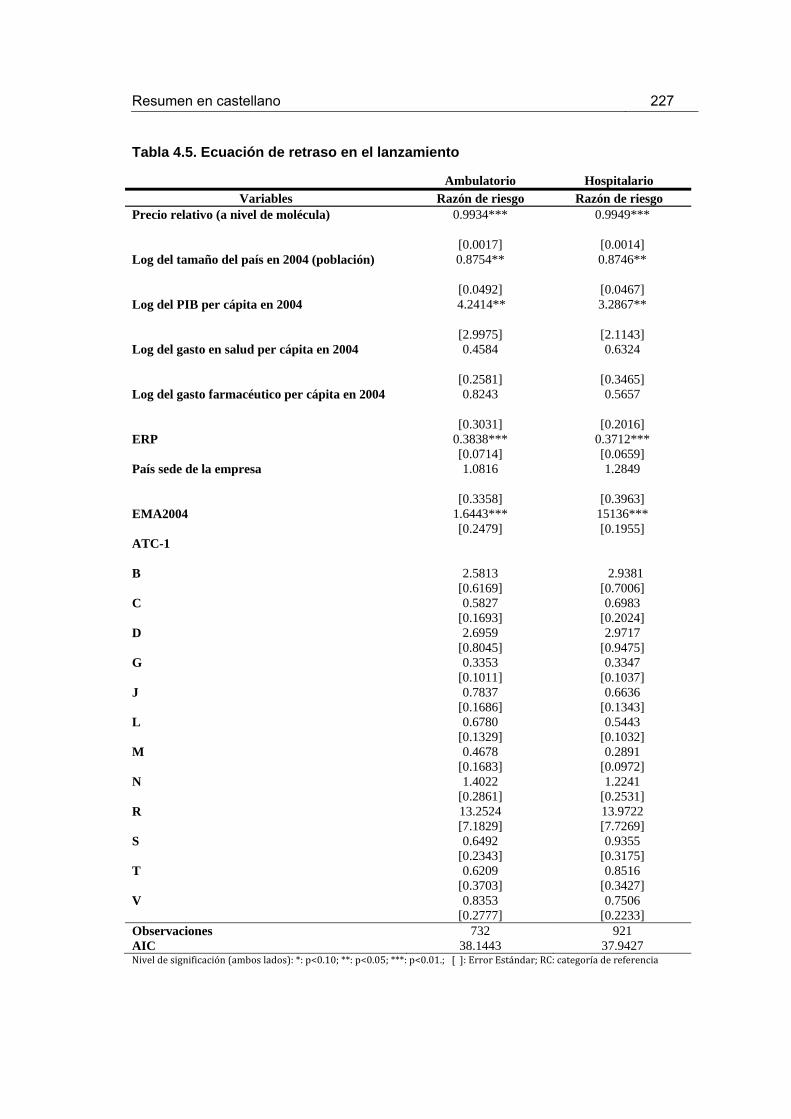
Resumen en castellano 227
Tabla 4.5. Ecuación de retraso en el lanzamiento
Ambulatorio Hospitalario Variables Razón de riesgo Razón de riesgo
Precio relativo (a nivel de molécula) 0.9934*** 0.9949***
[0.0017] [0.0014] Log del tamaño del país en 2004 (población) 0.8754** 0.8746**
[0.0492] [0.0467] Log del PIB per cápita en 2004 4.2414** 3.2867**
[2.9975] [2.1143] Log del gasto en salud per cápita en 2004 0.4584 0.6324
[0.2581] [0.3465] Log del gasto farmacéutico per cápita en 2004 0.8243 0.5657
[0.3031] [0.2016] ERP 0.3838*** 0.3712*** [0.0714] [0.0659] País sede de la empresa 1.0816 1.2849
[0.3358] [0.3963] EMA2004 1.6443*** 15136*** [0.2479] [0.1955] ATC-1 B 2.5813 2.9381 [0.6169] [0.7006] C 0.5827 0.6983 [0.1693] [0.2024] D 2.6959 2.9717 [0.8045] [0.9475] G 0.3353 0.3347 [0.1011] [0.1037] J 0.7837 0.6636 [0.1686] [0.1343] L 0.6780 0.5443 [0.1329] [0.1032] M 0.4678 0.2891 [0.1683] [0.0972] N 1.4022 1.2241 [0.2861] [0.2531] R 13.2524 13.9722 [7.1829] [7.7269] S 0.6492 0.9355 [0.2343] [0.3175] T 0.6209 0.8516 [0.3703] [0.3427] V 0.8353 0.7506 [0.2777] [0.2233] Observaciones 732 921 AIC 38.1443 37.9427 Niveldesignificación(amboslados):*:p<0.10;**:p<0.05;***:p<0.01.;[]:ErrorEstándar;RC:categoríadereferencia

228 Modelización de los Precios y Lanzamiento Global de Nuevos Medicamentos
Conclusiones
Existen similitudes y disparidades de nuestros resultados empíricos en relación
con la literatura empírica anterior. La revisión sistemática muestra que las características
demográficas e ingresos de los países, y los regímenes de regulación, parecen ser los
factores más determinantes que afectan a los precios y al lanzamiento de los nuevos
medicamentos. No obstante, la regulación de los precios podría debilitar los efectos de
estos factores importantes. Con el apoyo de estudios anteriores, la pertenencia a la EMA
y la innovación terapéutica afecta fuertemente el retraso en el lanzamiento y el precio de
lanzamiento respectivamente. Las características del medicamento como la cantidad de
principio activo, el tamaño y la forma de presentación, se han mostrado
significativamente relacionados con el precio en la literatura anterior. Estas últimas
características del medicamento no se han incluido en el NPLM ya que hemos analizado
los datos a nivel de presentación. El valor terapéutico, que aparece en la literatura
anterior como un factor influyente y robusto en el precio y lanzamiento de nuevos
medicamentos, tampoco fue incluido en el NPLM debido a la disponibilidad de datos. A
diferencia de estudios anteriores, no hemos ecnontrado influencia de la localización de la
empresa.
Al replicar el modelo de D&E con datos más recientes, se encuentran algunos
nuevos patrones acerca de los spillover effects y el tipo de empresas que venden el
nuevo medicamento. Los países con precios bajos sufren mayores retrasos en el
lanzamiento y que también existen spillover effects entre los países que tradicionalmente
tienen precios bajos. Además, se observa que los spillover effects se producen entre
países pertenecientes a la UE y países fuera de la misma. Por otra parte, parece que las
empresas locales no gozan ya de una mayor probabilidad de lanzamiento en su país,
pero sin embargo las empresas que disfrutan de la licencia de venta exclusiva de un
nuevo medicamento obtienen precios de lanzamiento más bajos.
Nuestra réplica de Verniers et al. con datos más recientes y una selección
diferente de países arroja nuevos resultados. El resultado más importante es que el
carácter endógeno de precios de lanzamiento y del retraso encontrado por Verniers et al.
no se observa con nuestros datos, sólo el retraso en el lanzamiento se ve afectado
negativamente por el precio de lanzamiento en una dirección. Los efectos de algunas
políticas regulatorias sobre el retraso en el lanzamiento no parecen cumplirse de manera

Resumen en castellano 229
general. Algunas políticas de regulación que tradicionalmente afectan al retraso en el
lanzamiento, como el control sobre los beneficios o los precios de referencia interna, no
son significativas en el modelo que se replica. Sin embargo, ambos modelos muestran
que el uso de la evaluación económica como cuarta barrera provoca mayores retrasos en
el lanzamiento. Además, en ambos modelos también, mientras más fuerte es la
protección sobre la patente, los países disfrutan de menores retrasos en el lanzamiento.
Sólo el modelo que se replica presenta un efecto significativo y esperado para el uso del
ERP. Por otro lado, las políticas de regulación no muestran efectos significativos en el
precio de lanzamiento bajo ninguno de los modelos, excepto la protección de la patente;
en este caso una mayor protección de patentes supone una presión a la baja sobre los
precios de lanzamiento. Una vez más, igual que con el modelo de D&E, la ubicación de la
empresa ya no tiene efecto sobre el lanzamiento y la fijación de precios de nuevos
medicamentos.
Una de las conclusiones más importantes es que, a diferencia de los modelos
anteriores, la fijación de precios y el lanzamiento parecen no estar relacionados entre sí.
Existen diferencias de precios entre países, pero no debido al retraso en el lanzamiento.
Las empresas no aceptan precios más bajos a cambio de lanzamientos tardíos, incluso
de los países que aplican la política de ERP, por lo tanto, la política de precios basada en
el ERP parece no ser efectiva en términos de “precios", pero lo hace en términos de
“lanzamiento". Estos resultados pueden conllevar implicaciones en el proceso de
negociación. Sugerimos que las empresas, básicamente, retrasan el lanzamiento porque
los países probablemente no pueden permitirse el lujo de tener el producto disponible
inmediatamente después del primer lanzamiento a nivel mundial, y en última instancia no
acceder al producto. Mientras que las empresas solían retrasar el lanzamiento para evitar
determinados efectos secundarios, en nuestro estudio mostramos que las empresas son
capaces de llevar a cabo una estrategia más agresiva que no permita a los países pagar
precios más bajos a cambio de experimentar mayores retrasos en el lanzamiento. Bajo
dicha estrategia, las empresas evitarían los efectos derivados de la política de ERP y del
PT, pero sin embargo perderían los beneficios de las ventas asociadas a los países
donde el medicamento se lanza.
En cuanto a otras características del país, tener una gran demanda potencial
ayuda a tener un acceso más rápido al mercado y obtener precios más bajos. Los países
ricos tienen los productos disponibles en un corto plazo, pero los países que en última

230 Modelización de los Precios y Lanzamiento Global de Nuevos Medicamentos
instancia pagan altos precios de lanzamiento son los que asignan grandes presupuestos
para la salud y gasto farmacéutico. La ubicación de la empresa parece no afectar al
precio ni retraso en el lanzamiento. Los países pertenecientes a la EMA parecen disfrutar
de menores retrasos que los países fuera de ella, sin embargo no encontramos
diferencias de precios significativas entre los países EMA y el resto.
En general, los resultados para el mercado ambulatorio y el mercado hospitalario
no muestran grandes diferencias.
Dada la perspectiva global sobre los principales factores que influyen en los
precios y el lanzamiento de nuevos fármacos basados en estudios teóricos, se distinguen
principalmente dos tipos de factores. En primer lugar, aquellos que inciden directamente
en los precios y el lanzamiento, tales como la presencia de PT, las características de las
empresas y las políticas de regulación de precios, por ejemplo, el ERP, el RP interno y el
MES+PC. En segundo lugar, la revisión arroja otros determinantes que no sólo tienen un
impacto directo sino también indirecto, afectando a la medida en la cual los anteriores
factores influyen en el precio y lanzamiento de los nuevos fármacos, tales como el
tamaño del país y el nivel de copagos.
De acuerdo con nuestro modelo teórico, dada una secuencia óptima de
lanzamiento, llegamos a la conclusión de que a medida que el país es más pequeño y
por lo tanto su demanda potencial, el coste unitario del CEA crece y el uso del ERP es
más atractivo. Debemos tener en cuenta que el ERP no requiere ningún tipo de inversión,
sin embargo, el CEA sí. El uso del ERP es útil para los países relativamente pequeños en
comparación con el uso de CEA. Este resultado confirma algunas declaraciones sobre
este tema en la literatura anterior que no se han demostrado aún. El ERP es una política
de precios de bajo coste.
Se concluye también que la secuencia óptima de lanzamiento de la empresa
depende de los precios relativos y el tamaño relativo de los países. Hay un trade-off entre
precio y volumen de venta que afecta directamente a la secuencia de lanzamiento. A su
vez, el precio relativo depende de la política de precios (ERP o CEA) y, posteriormente,
de la fórmula y composición del ERP (precio mínimo o precio medio). Concretamente, un
país se encuentra en una mejor situación aplicando el ERP en lugar del CEA, si y sólo si
la diferencia entre el precio de referencia internacional y el precio esperado del país i en
el marco del CEA no es mayor que el coste unitario del CEA. Este resultado se ve
Resumen en castellano 231
afectado por el coste del retraso en el lanzamiento. Si uno de los países sufre retraso en
el lanzamiento, el coste del retraso afectaría negativamente al beneficio de aplicar
cualquiera de las dos políticas en el país en cuestión.
Desde la perspectiva del regulador, la literatura anterior recomienda aplicar el
ERP sólo a los países pequeños y/o basado en los precios de países grandes (o un gran
número de países); lo mismo aplica si uno sustituye "país grande" por "pequeño co-
pago" y viceversa. Además, se recomienda un nivel mínimo de RP para evitar un nivel de
precios cada vez mayor con respecto al promedio del RP. Por otra parte, conviene aplicar
una política mixta de MES+PC cuando el bienestar perdido por los compradores de
medicamentos de tipo alto114 no es lo suficientemente grande como para anular el
bienestar ganado por los compradores de tipo bajo115.
Desde la perspectiva de la empresa, dado que el ERP se utiliza frecuentemente
por los países donde se practica el PT, los mercados son inseparables. Un claro ejemplo
es el caso del PT. La literatura sugiere que la pérdida de ingresos procedentes del PT
debería ser contabilizada por la empresa que debería establecer por tanto un precio más
alto que en ausencia de importaciones paralelas. Por lo tanto, el precio más alto para un
medicamento no es siempre la mejor opción para la empresa, ni el precio más bajo es
siempre la peor opción para un país determinado. Lo que podría ser una estrategia de
precios óptima en un solo país podría dejar de serlo cuando ERP y PT entran en juego.
Nuestro modelo teórico muestra que existe un trade-off entre el precio y el
volumen que afecta a la secuencia de lanzamiento por parte de la empresa. Se
proporciona información acerca de un tema ampliamente señalado por la literatura
previa. El uso del ERP parece ser beneficioso para los países pequeños en comparación
con el uso de CEA. Además de ser una política de precios de bajo coste tenemos ahora
más información acerca de por qué los países aplican este tipo de política de precios
siendo totalmente conscientes de que podría no ser una política óptima. En cualquier
caso, somos conscientes de que pueda haber otros factores que afecten a la
negociación. De esta manera se podrían diseñar otros modelos teóricos que contengan
114 Compradores de medicamentos de alta eficacia (ver ATELLA, V., BHATTACHARYA, J. & CARBONARI, L. 2012. Pharmaceutical Price Controls and Minimum Efficacy Regulation: Evidence from the United States and Italy. Health Services Research, 47, 293-308.).
115 Compradores de medicamentos de baja eficacia (ver ibid.).

232 Modelización de los Precios y Lanzamiento Global de Nuevos Medicamentos
por ejemplo fórmulas de ERP diferentes a la media o el mínimo, o modelos donde las
empresas ofreciesen un precio único a todos los países, etc. Además, otros factores
como la estructura de edad de la población o el lobby de la industria farmacéutica
también podrían tenerse en cuenta. No obstante, la inclusión de estas características
simultáneamente complicaría excesivamente el modelo.
A pesar de las limitaciones originadas por la falta de datos, este es el primer
estudio que indica que la fijación de precios y el lanzamiento de un medicamento no son
dos cuestiones inseparables. No obstante, consideramos que sería conveniente realizar
otros análisis que cuenten con muestras más grandes en número de medicamentos y
países con el fin de lograr una comparación más precisa. Concretamente, en el análisis
del ERP, una futura investigación podría tener en cuenta las interdependencias que se
producen entre los países debidas al ERP. Se ha analizado el efecto de esta política de
precios a través de una variable dicotómica, pero se podrían obtener puntos de vista más
interesantes mediante la recopilación de datos sobre el conjunto de países de referencia
que cada país considera.
Detrás de la idea de que la fijación de precios y el lanzamiento de nuevos
fármacos ya no están relacionados entre sí, los precios podrían estar convergiendo a un
único precio, al menos, en los países de la EMA. Una futura línea de investigación podría
ser analizar si los precios de lanzamiento de nuevos medicamentos han convergido
durante los últimos años a través del análisis de series temporales, en particular, basado
en la teoría de cointegración. Este trabajo requiere de datos de precios y lanzamientos
que abarquen periodos largos de tiempo. Este nuevo estudio podría mostrar algunas de
las hipótesis planteadas en esta tesis acerca de las líneas de estrategia de la industria
farmacéutica.
Si atendemos al mercado hospitalario, no podemos olvidar de los descuentos
sobre precios que se producen en este ámbito, debidos a los grandes volumenes de
compras. Una futura investigación podría dedicarse a contrastar la eficacia de las
compras centralizadas. Hay países como Dinamarca o Noruega que aplican desde hace
tiempo este tipo de compra a nivel regional y nacional. Concretamente, en España, la
articulación de estas adquisiciones se efectúa a través de un nuevo mecanismo previsto
en la Ley de Contratos del Sector Público, mediante la adopción de un acuerdo marco
centralizado de adquisiciones de medicamentos y productos sanitarios. Este nuevo

Resumen en castellano 233
mecanismo da un paso más en la racionalización y cohesión en el Sistema Nacional de
Salud, y supone el cumplimiento de las principales medidas de la reforma sanitaria para
reducir el gasto farmacéutico, entre otros, y garantizar la sostenibilidad del Sistema
Nacional de Salud. En este caso, se podría contrastar si esta nueva política de compra
de medicamentos ha sido efectiva con un diseño quasi-experimental. Una vez más, la
recopilación de los datos directamente de los hospitales parece ser el problema más
difícil.


References
ABRAHAM, J. 2002. The pharmaceutical industry as a political player. Lancet, 360, 1498-1502.
ATELLA, V., BHATTACHARYA, J. & CARBONARI, L. 2012. Pharmaceutical Price Controls and Minimum Efficacy Regulation: Evidence from the United States and Italy. Health Services Research, 47, 293-308.
BARDEY, D., BOMMIER, A. & JULLIEN, B. 2010. Retail price regulation and innovation: reference pricing in the pharmaceutical industry. J Health Econ, 29, 303-16.
BAYUS, B. L., KANG, W. & AGARWAL, R. 2007. Creating Growth in New Markets: A Simultaneous Model of Firm Entry and Price*. Journal of Product Innovation Management, 24, 139-155.
BERNDT, E. R., COCKBURN, I. M. & GRILICHES, Z. 1996. Pharmaceutical Innovations and Market Dynamics: Tracking Effects on Price Indexes for Antidepressant Drugs. Brookings Papers on Economic Activity: Microeconomics 1996,.
BERNDT, E. R., DANZON, P. M. & KRUSE, G. B. 2007. Dynamic competition in pharmaceuticals: cross-national evidence from new drug diffusion. Managerial and Decision Economics, 28, 231-250.
BORRELL, J. R. 2007. Pricing and patents of HIV/AIDS drugs in developing countries. Applied Economics, 39, 505-518.
CABRALES, A. & JIMENEZ-MARTIN, S. 2007. The Determinants of Pricing in Pharmaceuticals: Are U.S. Prices Really Higher than Those of Canada? SSRN eLibrary.
CLAXTON, K., MARTIN, S., SOARES, M., RICE, N., SPACKMAN, E., HINDE, S., DEVLIN, N., SMITH, P. C. & SCULPHER, M. 2013. Methods for the Estimation of the NICE Cost Effectiveness Threshold. York: Centre for health Economics, University of York.
COCKBURN, I. M. & ANIS, A. H. 1998. Hedonic Analysis of Arthritis Drugs. National Bureau of Economic Research Working Paper Series, No. 6574.
COMANOR, W. S. & SCHWEITZER, S. O. 2007. Determinants of drug prices and expenditures. Managerial and Decision Economics, 28, 357-370.
CORONADO, F. J., JIMÉNEZ-MARTÍN, S. & MARÍN, P. L. 2007. Multimarket Contact in Pharmaceutical Markets. SSRN.
DANZON, P. M. 1997. Price Discrimination for Pharmaceuticals: Welfare Effects in the US and the EU. International Journal of the Economics of Business, 4, 310-322.
DANZON, P. M. & CHAO, L. W. 2000. Cross-national price differences for pharmaceuticals: How large, and why? Journal of Health Economics, 19, 159-195.
DANZON, P. M. & EPSTEIN, A. J. 2008. Effects of Regulation on Drug Launch and Pricing in Interdependent Markets. National Bureau of Economic Research, Inc, NBER Working Papers: 14041.

236 Modelling Global Pricing and Launching of New Drugs
DANZON, P. M., MULCAHY, A. W. & TOWSE, A. K. 2011. Pharmaceutical Pricing in Emerging Markets: Effects of Income, Competition and Procurement. National Bureau of Economic Research Working Paper Series, No. 17174.
DANZON, P. M. & TOWSE, A. 2003. Differential Pricing for Pharmaceuticals: Reconciling Access, R&D and Patents. International Journal of Health Care Finance and Economics, 3, 183-205.
DANZON, P. M., WANG, Y. R. & WANG, L. 2005. The impact of price regulation on the launch delay of new drugs - evidence from twenty-five major markets in the 1990s. Health Economics, 14, 269-292.
DJANKOV, S., LA PORTA, R., LOPEZ-DE-SILANES, F. & SHLEIFER, A. 2002. The Regulation of Entry. Quaterly Journal of Economics, 117.
DONALDSON, C., BAKER, R., MASON, H., JONES-LEE, M., LANCSAR, E., WILDMAN, J., BATEMAN, I., LOOMES, G., ROBINSON, A. & SUGDEN, R. 2011. The social value of a QALY: raising the bar or barring the raise? BMC health services research, 11, 8.
EKELUND, M. & PERSSON, B. 2003. Pharmaceutical pricing in a regulated market. Review of Economics and Statistics, 85, 298-306.
ESPIN J, ROVIRA J & OLRY DE LABRY A 2011. WHO/HAI Project on Medicine Prices and Availability. Review Series on Pharmaceutical Pricing Policies and Interventions. Working Paper 1: External Reference Pricing.
FELDMAN, R. & LOBO, F. 2013. Competition in prescription drug markets: the roles of trademarks, advertising, and generic names. European Journal of Health Economics, 14, 667-675.
GANSLANDT, M. & MASKUS, K. E. 2004. Parallel imports and the pricing of pharmaceutical products: Evidence from the European Union. Journal of Health Economics, 23, 1035-1057.
GARCIA MARIÑOSO, B., JELOVAC, I. & OLIVELLA, P. 2011. External referencing and pharmaceutical price negotiation. Health Economics, 20, 737-756.
GARCÍA-MARIÑOSO, B. & OLIVELLA, P. 2012. Informational spillovers and strategic launch delay of pharmaceutical drugs. Mimeo.
GAREN, J. 1984. The returns to schooling: A selectivity bias approach with a continuous choice variable. Econometrica: Journal of the econometric society, 1199-1218.
GINARTE, J. C. & PARK, W. G. 1997. Determinants of patent rights: A cross-national study. Research Policy, 26, 283-301.
GRABOWSKI, H., VERNON, J. & DIMASI, J. A. 2002. Returns on research and development for 1990s new drug introductions. Pharmacoeconomics, 20, 11-29.
HECKMAN, J. J. 1979. Sample selection bias as a specification error. Econometrica: Journal of the econometric society, 153-161.
HEUER, A., MEJER, M. & NEUHAUS, J. 2007. The National Regulation of Pharmaceutical Markets and the Timing of New Drug Launches in Europe. Kiel advanced studies working papers, No. 437.
HOFSTEDE, G. 1984. Culture's consequences: International differences in work-related values, sage.
HOFSTEDE, G. 2012. Hofstede Centre [Online]. Available: http://geert-hofstede.com/the-hofstede-centre.html.
HOFSTEDE, G. H. 2001. Culture's consequences: Comparing values, behaviors, institutions and organizations across nations, Sage.
HOTELLING, H. 1929. Stability of competition. Economic Journal, 39, 41-57.

References 237
HUNTER, D. 2005. Guaranteed future pain and suffering: The recent research on drug price controls. Heritage Foundation WebMemo.
JELOVAC, I. 2008. On the relationship between the negotiated price of pharmaceuticals and the patients’ co-payment. Center for Economic Development, Hong Kong University of Science and Technology WP 0208.
JELOVAC, I. & HOUY, N. 2013. Drug launch timing and international reference pricing. GATE Lyon St Etienne WP 1301.
JENKINS, S. P. 2008. Survival Analysis
. Unpublished manuscript: Institute for Social and Economic Research, University of Essex, Colchester. Ohio State University.
KANAVOS P & COSTA-FONT J 2005. Pharmaceutical parallel trade in Europe: stakeholder and competition effects. Economic Policy, 20, 751-798.
KANAVOS, P. G. & VANDOROS, S. 2011. Determinants of branded prescription medicine prices in OECD countries. Health Economics Policy and Law, 6, 337-367.
KEELE, L. 2007. Cross validation tests for frailty models. Unpublished manuscript, Ohio State University.
KIEFER, N. M. 1988. Economic duration data and hazard functions. Journal of economic literature, 26, 646-679.
KLEIN, J. P. & MOESCHBERGER, M. L. 1997. Statistics for biology and health. Survival analysis: techniques for censored and truncated data.
KYLE, M. K. 2006. The role of firm characteristics in pharmaceutical product launches. RAND Journal of Economics, 37, 602-618.
KYLE, M. K. 2007. Pharmaceutical price controls and entry strategies. Review of Economics and Statistics, 89, 88-99.
LANCASTER, T. 1992. The econometric analysis of transition data, Cambridge university press.
LANJOUW, J. O. 2005. Patents, Price Controls, and Access to New Drugs: How Policy Affects Global Market Entry. National Bureau of Economic Research Working Paper Series, No. 11321.
LEE, L.-F. 1983. Generalized econometric models with selectivity. Econometrica: Journal of the econometric society, 507-512.
LEOPOLD, C., VOGLER, S., MANTEL-TEEUWISSE, A. K., DE JONCHEERE, K., LEUFKENS, H. G. & LAING, R. 2012. Differences in external price referencing in Europe: a descriptive overview. Health Policy, 104, 50-60.
LICHTENBERG, F. R. 2005. The Impact of New Drug Launches on Longevity: Evidence from Longitudinal, Disease-Level Data from 52 Countries, 1982–2001. International Journal of Health Care Finance and Economics, 5, 47-73.
LOBO, F. 2014. La Intervención de Precios de los Medicamentos en España, Madrid, Springer.
LOBO, F. & FELDMAN, R. 2013. Generic Drug Names and Social Welfare. Journal of Health Politics Policy and Law, 38, 573-597.
LOPEZ-CASASNOVAS, G. & PUIG-JUNOY, J. 2000. Review of the literature on reference pricing. Health Policy, 54, 87-123.
LU, Z. J. & COMANOR, W. S. 1998. Strategic pricing of new pharmaceuticals. Review of Economics and Statistics, 80, 108-118.
MASON, H., JONES�LEE, M. & DONALDSON, C. 2009. Modelling the monetary value of a QALY: a new approach based on UK data. Health Economics, 18, 933-950.
MESTRE-FERRANDIZ, J. 2003b. Reference prices: The Spanish way. Investigaciones Económicas, 27, 125-149.

238 Modelling Global Pricing and Launching of New Drugs
MESTRE-FERRANDIZ, J. 2012. The R&D Cost of a New Medicine London: Office of Health Economics.
MESTRE-FERRANDIZ, J. 2013. Increasing R&D costs for new medicines. Chemistry & Industry, 77, 44-44.
MIRALDO, M. 2009. Reference pricing and firms' pricing strategies. J Health Econ, 28, 176-97.
MOHER, D., LIBERATI, A., TETZLAFF, J., ALTMAN, D. G. & GROUP, A. T. P. 2009. Reprint—Preferred Reporting Items for Systematic Reviews and Meta-Analyses: The PRISMA Statement. Physical Therapy, 89, 873-880.
MORENO, E., GIRON, F. J., VAZQUEZ-POLO, F. J. & NEGRIN, M. A. 2010. Optimal healthcare decisions: Comparing medical treatments on a cost-effectiveness basis. European Journal of Operational Research, 204, 180-187.
MORENO-TORRES, I., PUIG-JUNOY, J. & BORRELL, J. R. 2009. Generic Entry into the Regulated Spanish Pharmaceutical Market. Review of Industrial Organization, 34, 373-388.
MUTHOO, A. 1999. Bargaining Theory with Applications, Cambridge University Press. NATIONAL INSITUTE FOR HEALTH AND CARE EXCELLENCE (NICE). 2010.
Measuring effectiveness and cost effectiveness: the QALY [Online]. NICE. Available: http://www.nice.org.uk/newsroom/features/measuringeffectivenessandcosteffectivenesstheqaly.jsp.
NATIONAL INSTITUTE FOR HEALTH AND CARE EXCELLENCE (NICE). 2010. Measuring effectiveness and cost effectiveness: the QALY [Online]. NICE. Available: http://www.nice.org.uk/newsroom/features/measuringeffectivenessandcosteffectivenesstheqaly.jsp.
NEGRIN, M. A. & VAZQUEZ-POLO, F. J. 2006. Bayesian cost-effectiveness analysis with two measures of effectiveness: the cost-effectiveness acceptability plane. Health Economics, 15, 363-372.
NEGRIN, M. A. & VAZQUEZ-POLO, F. J. 2008. Incorporating model uncertainty in cost-effectiveness analysis: A Bayesian model averaging approach. Journal of Health Economics, 27, 1250-1259.
NEGRIN, M. A., VAZQUEZ-POLO, F. J., MARTEL, M., MORENO, E. & GIRON, F. J. 2010. Bayesian Variable Selection in Cost-Effectiveness Analysis. International Journal of Environmental Research and Public Health, 7, 1577-1596.
NIHR, H. 2010. Weighting and valuing quality-adjusted life-years using stated preference methods: preliminary results from the Social Value of a QALY Project. Health Technology Assessment, 14.
OECD 2011. Health at a Glance 2011: OECD Indicators. Paris. PARIS, V., DOCTEUR, E. & MOÏSE, P. 2008. Pharmaceutical pricing polices in a global
market. OECD Health Policy Studies. Paris. PARK, W. G. & WAGH, S. 2002. Index of patent rights. Economic freedom of the world:
2002 annual report, 33-43. PINTO-PRADES, J. L., LOOMES, G. & BREY, R. 2009. Trying to estimate a monetary
value for the QALY. Journal of Health Economics, 28, 553-562. PUIG-JUNOY, J. 2007. The impact of generic reference pricing interventions in the statin
market. Health Policy, 84, 14-29. PUIG-JUNOY, J. 2010a. Policies encouraging price competition in the generic drug
market: Lessons from the European experience. Gaceta Sanitaria, 24, 193-199.

References 239
PUIG-JUNOY, J. 2010b. Impact of European Pharmaceutical Price Regulation on Generic Price Competition A Review. Pharmacoeconomics, 28, 649-663.
PUIG-JUNOY, J. 2012. Lecturas sobre Economía del Sector Biofarmacéutico, Madrid, Springer Healthcare.
PUIG-JUNOY, J. & GONZÁLEZ LÓPEZ-VALCÁRCEL, B. 2014. Launch prices for new pharmaceuticals in the heavily regulated and subsidized Spanish market. Health Policy, Forthcoming.
RAWLINS, M. D. 2012. Crossing the fourth hurdle. Br J Clin Pharmacol, 73, 855-60. RICHTER, A. 2008. Assessing the impact of global price interdependencies.
Pharmacoeconomics, 26, 649-659. ROBINSON, A., GYRD-HANSEN, D., BACON, P., BAKER, R., PENNINGTON, M. &
DONALDSON, C. 2013. Estimating a WTP-based value of a QALY: The ‘chained’approach. Social Science & Medicine, 92, 92-104.
RUBINSTEIN, A. 1982. Perfect Equilibrium in a Bargaining Model. Econometrica, 50, 97-109.
SCHERER, F. M. 1993. PRICING, PROFITS, AND TECHNOLOGICAL-PROGRESS IN THE PHARMACEUTICAL-INDUSTRY. Journal of Economic Perspectives, 7, 97-115.
SCHERER, F. M. 2004. The pharmaceutical industry-Prices and progress. New England Journal of Medicine, 351, 927-932.
STARGARDT, T. & SCHREYÖGG, J. 2006. Impact of Cross-Reference Pricing on Pharmaceutical Prices: Manufacturers’ Pricing Strategies and Price Regulation. Applied Health Economics and Health Policy, 5, 235-247.
STATACORP 2009. Stata Statistical Software. College Station, TX: StataCorp LP. SUSLOW, V. Y. 1996. Measuring Quality Change in the Market for Anti-Ulcer Drug. In:
HELMS, R. M. & (ED) (eds.) In Competitive Strategies in the Pharmaceutical Industry. Washington, DC: American Enterprise Institute: AEI Press.
TIMUR, A., PICONE, G. & DESIMONE, J. 2011. Has the European union achieved a single pharmaceutical market? International Journal of Health Care Finance and Economics, 11, 223-244.
VELLA, F. 1993. A simple estimator for simultaneous models with censored endogenous regressors. International Economic Review, 441-457.
VERNIERS, I., STREMERSCH, S. & CROUX, C. 2011. The global entry of new pharmaceuticals: A joint investigation of launch window and price. International Journal of Research in Marketing, 28, 295-308.
WAGNER, J. L. & MCCARTHY, E. 2004. International differences in drug prices. Annu. Rev. Public Health, 25, 475-495.
WHO 2003. Making Choices in Health: WHO Guide to Cost-Effectiveness Analysis Geneva, World Health Organization.
WHO. 2012. ATC/DDD Index 2012 [Online]. Available: http://www.whocc.no/atc_ddd_index/.
WILKING, N., JÖNSSON, B. & I STOCKHOLM, H. 2005. A pan-European comparison regarding patient access to cancer drugs. Karolinska Institutet.
WOOLDRIDGE, J. M. 2002. Econometric analysis of cross section and panel data, The MIT press.