Modeling Electro-manipulation of Bio/Nano...
88
1 Modeling Electro-manipulation of Bio/Nano Materials Wing Kam Liu, Walter P. Murphy Professor Director of the NSF Summer Institute on Nano Mechanics and Materials Department of Mechanical Engineering Northwestern University 2145 Sheridan Rd., Evanston, IL 60208 Email: [email protected] http://tam.mech.northwestern.edu/wkl/liu.html With Contributions from: Yaling Liu, Albert To, Xavier Diego, Adrian Kopacz, Jaehyun Chung (University of Washington)
Transcript of Modeling Electro-manipulation of Bio/Nano...

1
Modeling Electro-manipulation of Bio/Nano Materials
Wing Kam Liu, Walter P. Murphy ProfessorDirector of the NSF Summer Institute on Nano Mechanics and Materials
Department of Mechanical EngineeringNorthwestern University
2145 Sheridan Rd., Evanston, IL 60208Email: [email protected]
http://tam.mech.northwestern.edu/wkl/liu.html
With Contributions from:
Yaling Liu, Albert To, Xavier Diego, Adrian Kopacz, Jaehyun Chung (University of Washington)

2
Outline
• From Immersed Boundary Method to Immersed Finite Element Method
• Applications on blood rheology and pulmonary gas diffusion
• Bio-Nano interface: measurement of cell adhesion
• IEFEM: Coupled electrokinetics and fluid-structure interaction
• Applications on dielectrophoretic assembly of nanowires
• Applications on manipulation of biomaterials
• Future work and Conclusion
3
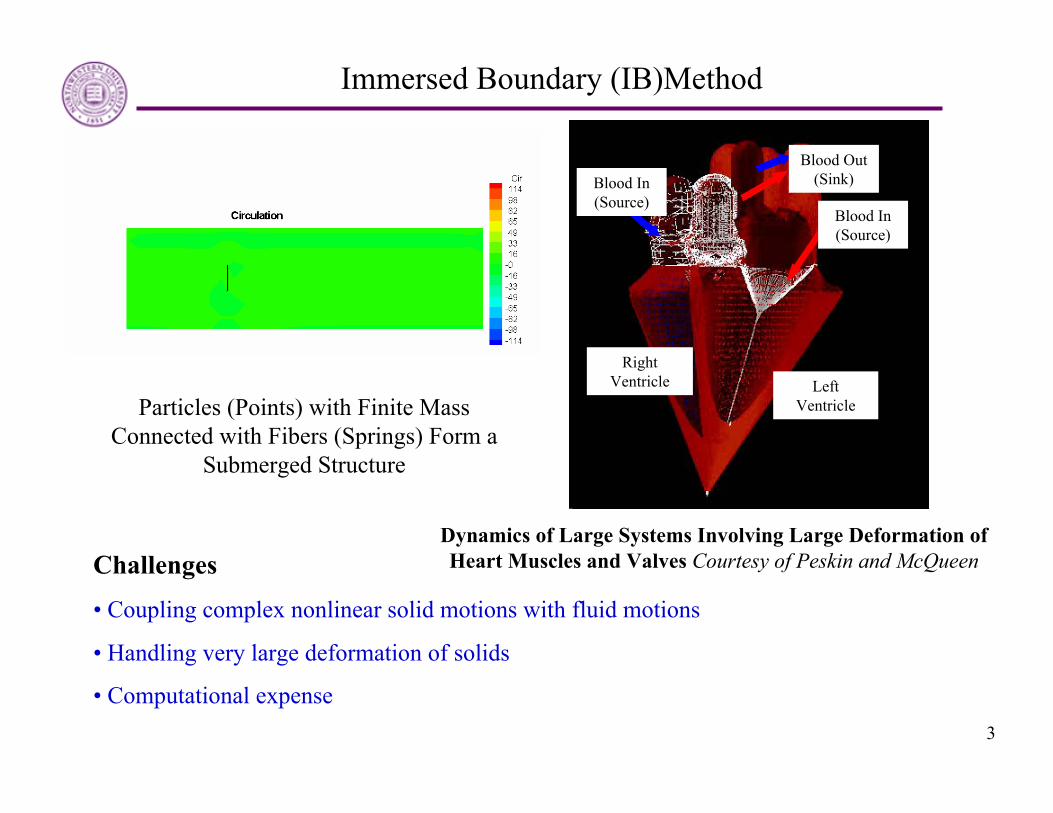
Dynamics of Large Systems Involving Large Deformation of Heart Muscles and Valves Courtesy of Peskin and McQueen
Left Ventricle
Right Ventricle
Blood In (Source)
Blood In (Source)
Blood Out (Sink)
Challenges
• Coupling complex nonlinear solid motions with fluid motions
• Handling very large deformation of solids
• Computational expense
Particles (Points) with Finite Mass Connected with Fibers (Springs) Form a
Submerged Structure
Immersed Boundary (IB)Method
4
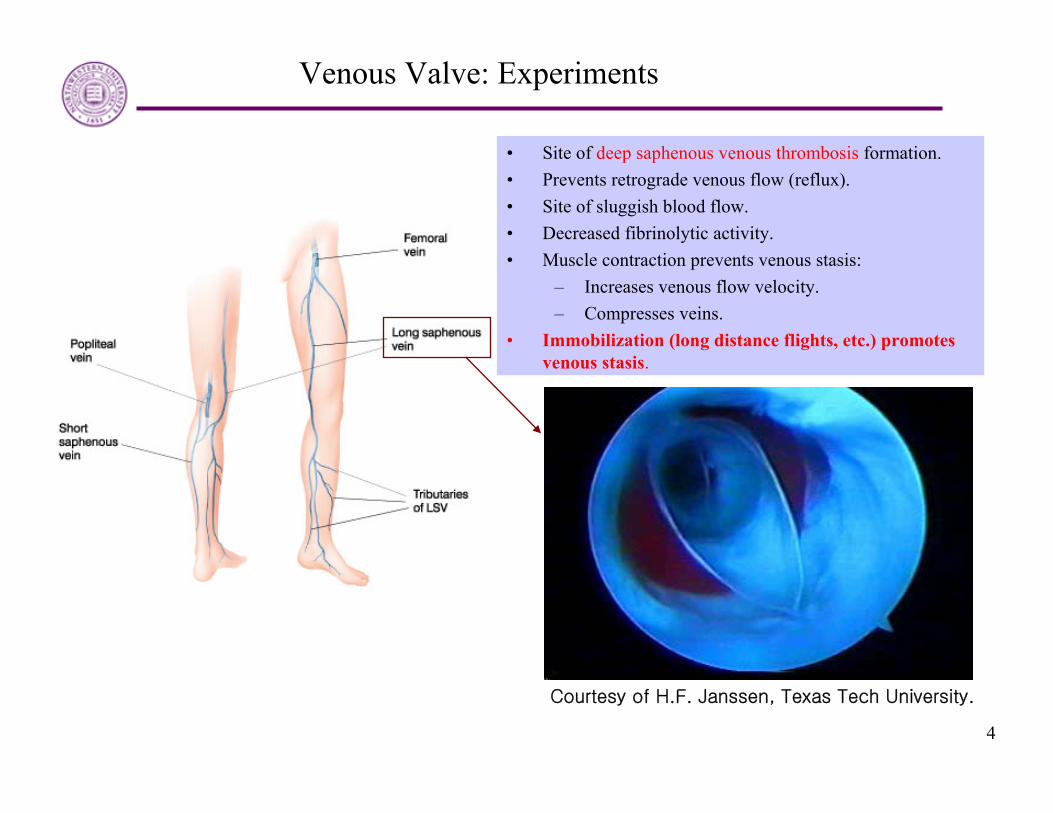
Courtesy of H.F. Janssen, Texas Tech University.
• Site of deep saphenous venous thrombosis formation.• Prevents retrograde venous flow (reflux). • Site of sluggish blood flow.• Decreased fibrinolytic activity. • Muscle contraction prevents venous stasis:
– Increases venous flow velocity.– Compresses veins.
• Immobilization (long distance flights, etc.) promotes venous stasis.
Venous Valve: Experiments

5
Venous Valve: comparison of the experimental and computational results
Comparison between experiment and simulation at 4 different time steps

6
Constant shear flow
Immersed Finite Element Method
Movie

7
Multiscale Modeling of Bio-Complexity
310 m− 610 m− 7 810 10 m− −−
Organic-scale Vessel-scale SubcellularCellular-scale
Bio-fibers, Fukui et al., NWU
RBC aggregation
Cell-ECM interaction
110 m−
Focal adhesion complex
Non-Newtonian blood model
Thrombus deposition model
Computational angioplasty stent surgery modeling (Gay,
Zhang, and Liu)
Vascular Atherogenesis and Growth of Intimal Hyperplasia(IH)(Dr. Shu Liu, NWU)
left atrium
left ventricle
right atrium
rightventricle
artery
α-actinin
vinculin
cappingprotein
fibronectin
actinfilament
paxillin
fibronectin receptor (integrin)
50 nm
talin
Hughes et al., TexasLiu et al., NWU
Actin filaments
Molecular-scale
910 m−
Self-organization of microtubules, Surrey et al.
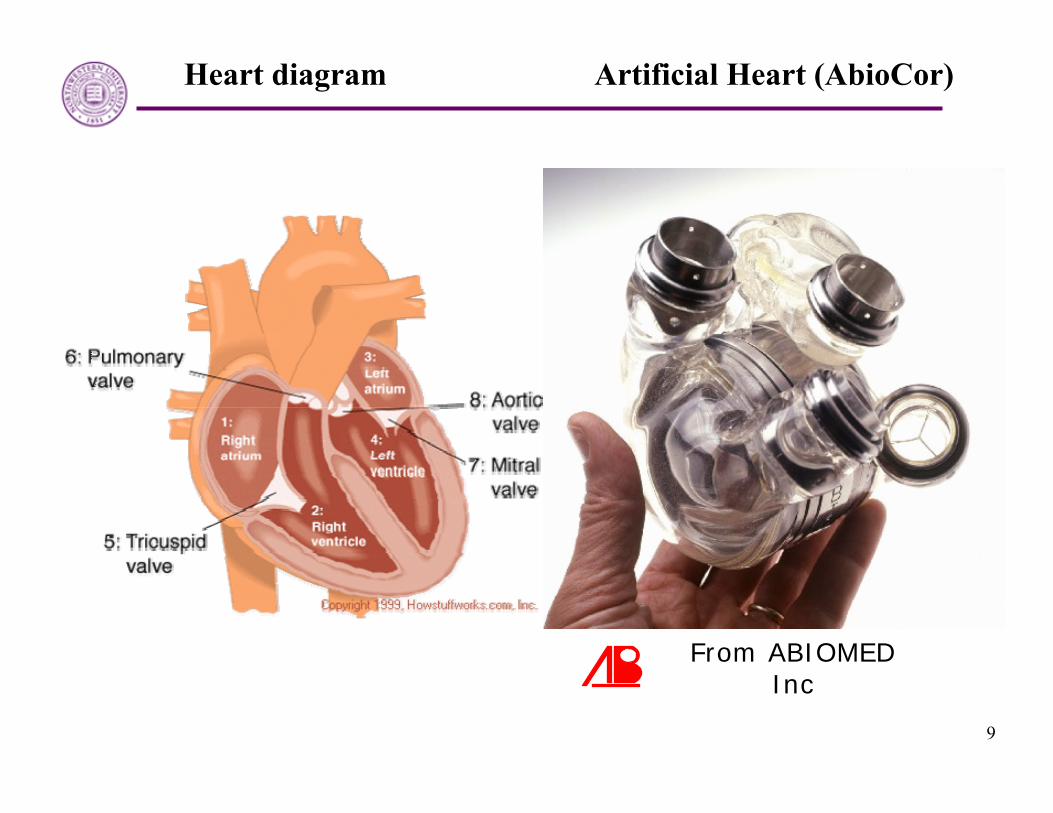
ABIOMED Artificial heart

8
Motivation
• Arterial diseases are one of leading causes of death in western countries-More than 700,000 die from heart failure each year in the US-About 6,000 patients receive support services after cardiac surgerywith 20 to 40% survival rate
• The impact of newer mechanical circulatory support for advanced heart failure has not yet been realized
-Further work needed to establish the role of mechanical support for myocardial recovery-Thrombus deposition on flexible shell surfaces is ubiquitous in human cardiovascular system
-Lead to widespread disorders—from chronic venous insufficiency to life-threatening thromboembolic phenomena
• Thrombus deposition on mechanical valves and artificial devicesseverely limits the life span of these implants and contributes to various complications such as heart attack
9
Heart diagram Artificial Heart (AbioCor)
From ABIOMED, Inc.

10
Survival with Artificial Heart
16 months (longestliving recipient) From ABIOMED, Inc.

11
AbioCor - Principle of Operation
• Mimics native heart• Responds to demand• Few moving parts
AbioCor has two blood pumping chambers•The right side pumps blood into the lungs•the left side pumps the blood into the body
Left VentricleRight Ventricle
Oxygen Poor Blood from Superior/Inferior Vena Cava
Blood out to Pulmonary
Arteries
Oxygen Rich Blood from
Pulmonary Veins
Blood out to Aorta
Left AtriumRight Atrium

12
• A catheter (2 to 3 mm in diameter) with a deflated balloon on the tip is inserted through the artery in the groin or arm.
• The catheter is directed to the narrowed artery of the heart.
• The balloon is then inflated by connecting it to a special pump. The balloon is inflated and deflated several times to squeeze the plaque deposits against the wall of the artery.
• As the balloon is inflated, it compresses the fatty deposits or calcium accumulations that make up the coronary blockage.
• The deflated balloon and wire are withdrawn.
Angioplasty
http://www.jomed.com/patientinfo/stents/stents/html/g.html
13
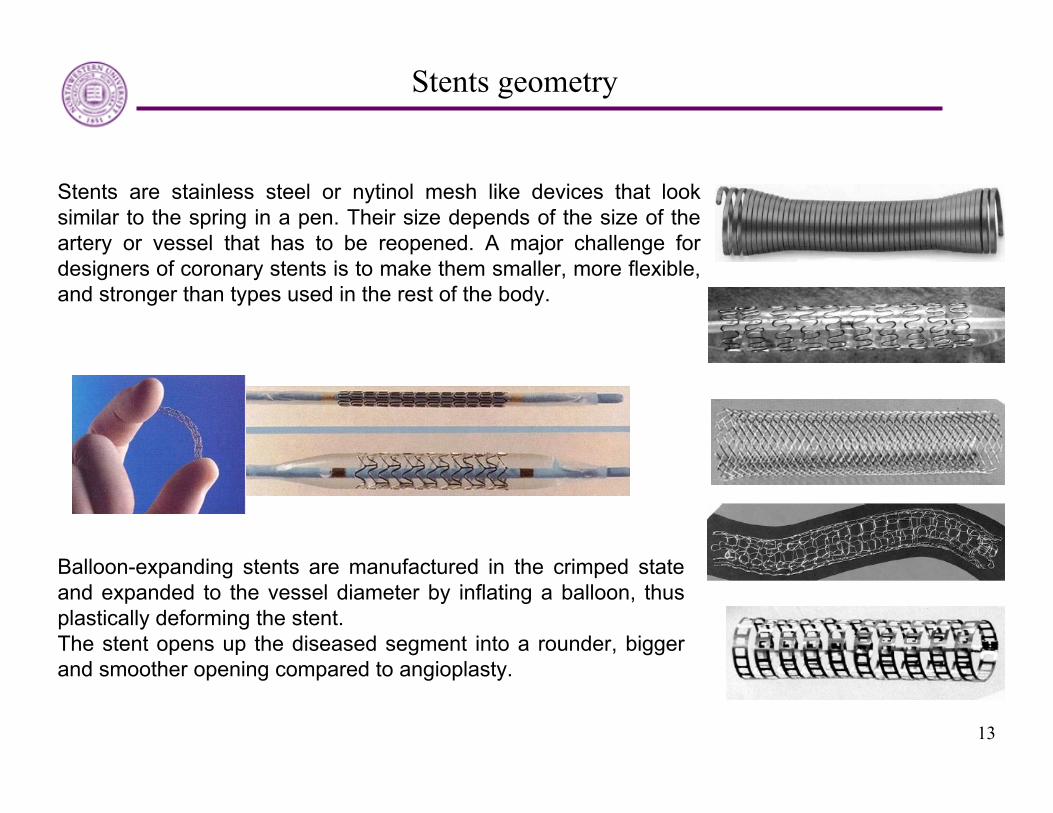
Stents geometry
Balloon-expanding stents are manufactured in the crimped state and expanded to the vessel diameter by inflating a balloon, thusplastically deforming the stent. The stent opens up the diseased segment into a rounder, bigger and smoother opening compared to angioplasty.
Stents are stainless steel or nytinol mesh like devices that look similar to the spring in a pen. Their size depends of the size of the artery or vessel that has to be reopened. A major challenge for designers of coronary stents is to make them smaller, more flexible, and stronger than types used in the rest of the body.

14
Surgical procedure
http://www.jomed.com/patientinfo/stents/stents/html/g.html

15
Simulation of the Stent Deployment Process
Shaded movie Velocity profile
IFEM Applications in biological system
Blood Rheology:-influence of blood cell aggregation on blood viscosity-gas diffusion in pulmonary capillaries
Cell adhesion/migration on an substrate

17http://tam.northwestern.edu/summerinstitute/Home.htm http://tam.northwestern.edu/wkl/liu.html
The depletion mediated aggregation model
D Ew wγ = +
• Two basic models for RBC aggregation-Adsorption model: adsorption of plasmatic polymers at surfaces -Depletion model: exclusion of plasmatic polymers at surfaces
• Neu et al. (Biophysical Journal, 2003) introduced the first microscopic model for depletion mediated RBC aggregation
polymersDepletion region
dRBC aggregation (blood cells, fibrin clot)From Dennis Kunkel at http://www.denniskunkel.com/
Depletion interaction energy(leads to attractive force)
Electrostatic energy(leads to repulsive force)
Attachment region

18
Shear of a RBC rouleau at different shear rates
low shear rate 0.25s-1
median shear rate 0.5s-1
high shear rate 3.0s-1
Stick together
Partially separated
Totally separated
•Blood viscosity is shear-rate dependent–Microscopic: Aggregation of individual cells–Macroscopic: Break up of the aggregates at different shear rates lead to different apparent viscosities
Multiphysics modeling: shear-rate dependent blood viscosity
19
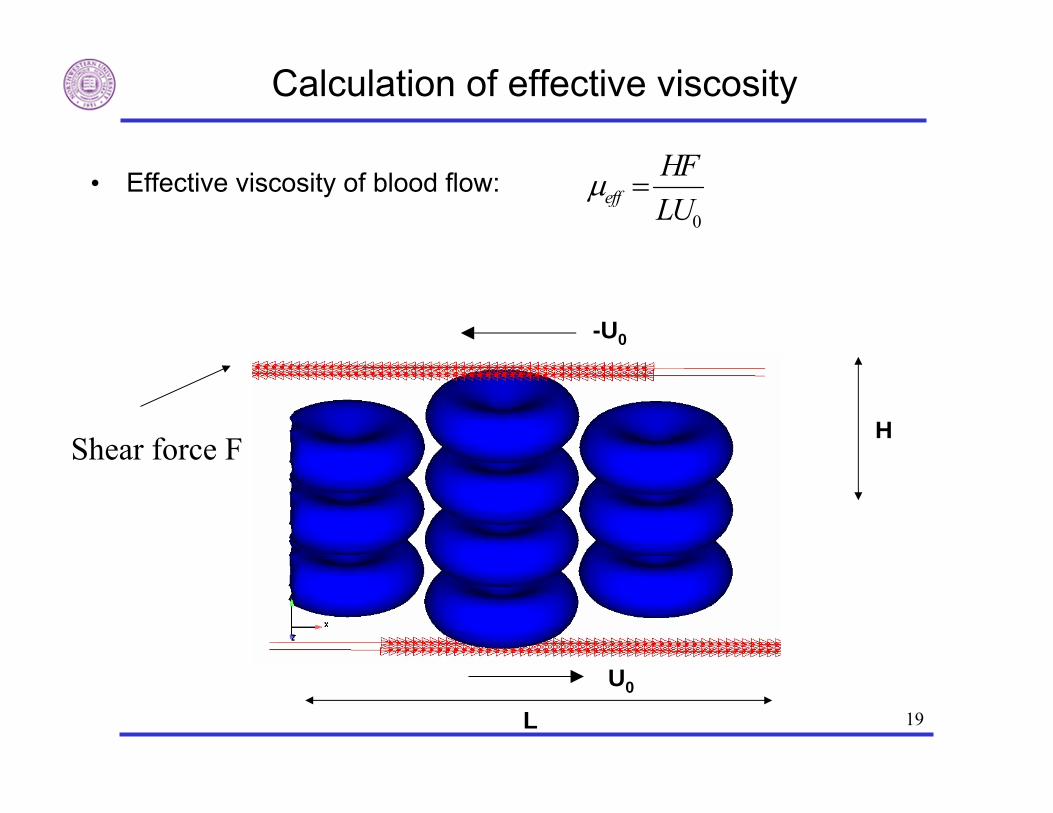
Calculation of effective viscosity
• Effective viscosity of blood flow:0
effHFLU
μ =
L
-U0
H
U0
Shear force F

20
Effective viscosity of the blood flow
Bulk aggregates Discrete cells Cell layers
•The simulated shear rate dependent viscosity of the blood flow qualitatively agrees with experimental results
• Other simulated phenomena
• Fahraeus-Lindqvist effect• Influence of cell rigidity
10-2 10-1 100 101 10210-2
10-1
100
Visc
osity
) (P
oise
)
Shear Rate (1/Sec)
Calculated Viscosity vs. Shear Rate
Chien data at 0.3g/100mL fibrinoginChien data at 0.04g/100mL fibrinoginSimulated result
21
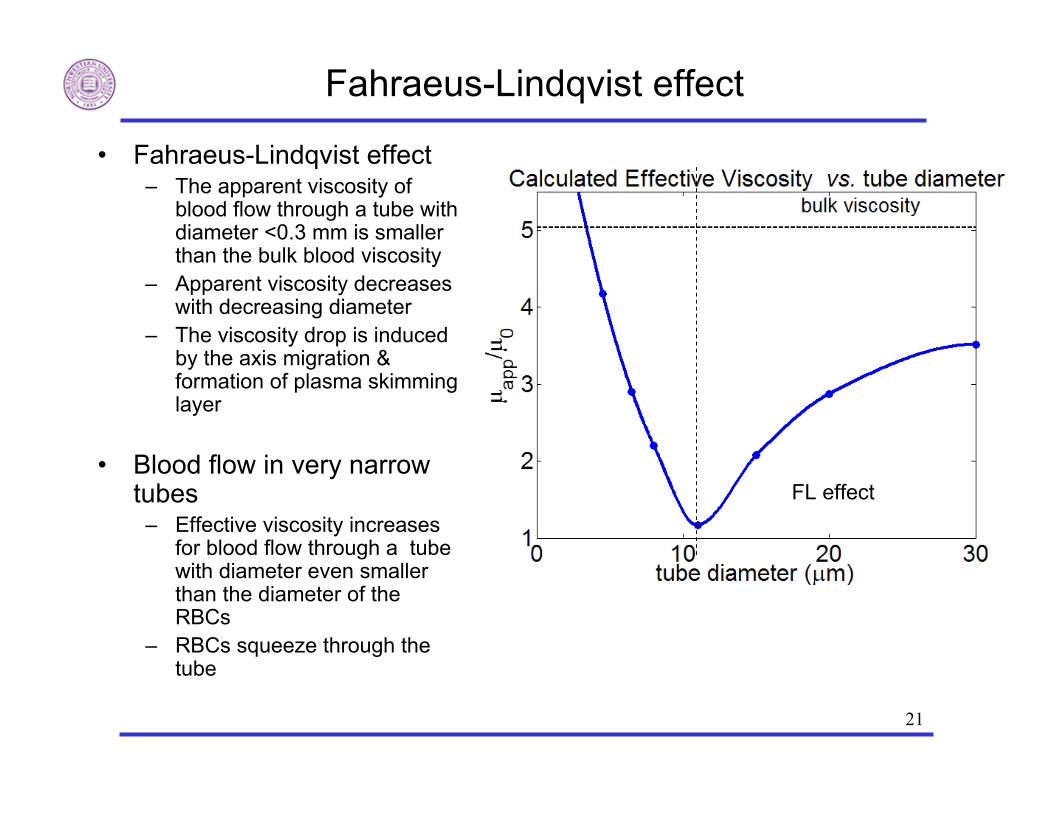
Fahraeus-Lindqvist effect
• Fahraeus-Lindqvist effect– The apparent viscosity of
blood flow through a tube with diameter <0.3 mm is smaller than the bulk blood viscosity
– Apparent viscosity decreases with decreasing diameter
– The viscosity drop is induced by the axis migration & formation of plasma skimming layer
• Blood flow in very narrow tubes
– Effective viscosity increases for blood flow through a tube with diameter even smaller than the diameter of the RBCs
– RBCs squeeze through the tube
FL effect

22
Movies of RBCs flow in tubes with different diameters
In-flow 10μm/s
D=11μm
D=15μm
D=30μm
D=8μm

23
Gas diffusion in pulmonary capillaries
Tissue
RBCs flow in capillary
Alveolar air
Capillary flow
5μm1μm
Alveolar airP=1 Torr
P=0 Torrv
PA
Tissue
Diffusion flux
Diffusive transport : 2 0D Pα ∇ =
Gas flux:PDn
α ∂∂
Diffusion capacity: flux
MA
dAD
PΓ
⋅∫
Comparable concept in electricity:electric current 1conductance
voltageIV R
= = =
P is gas pressure (in Torr)α is Bunsen solubility coefficient in lung tissue, D is diffusion coefficient
P=1 Torr
Connie et. al, 1999

24
Influence of RBC dynamics on diffusion capacity• Gas diffusion in pulmonary capillaries• IFEM simulation shows that the gas diffusion capacity decreases as the RBC deforms
0 0.2 0.4 0.6 0.81.02
1.04
1.06
1.08
1.1
1.12
1.14
1.16
1.18
Time (s)
DM
( μm
3 .s-1
.torr-1
)
30μm/s
Nonuniform gas flux on cell surface

25
Influence of RBC distribution on diffusion capacity
uniform
Non-uniform (random)
cluster
Clustering of RBCs inbranching capillary networks
60μm

26
Cell migration and adhesion
Wolf et al., 2003
Wolf et al., 2003
• Cell motility plays a crucial role in
– Cell differentiation, growth
– Wound healing, embryogenesis, vessels generation
• Cell motility is a complex coupled biochemical/mechanical process
• External mechanical environment influences cell organization and initiate migration
• Rigid surface strengthens focal adhesions• Soft surface weakens cell adhesions
Sensing Internal structure remodeling Directed cell movement

27
Cell migration is guided by external environment
Different types of external factors that influence cell organization and initiate movement
(A) Chemotaxis• chemical attractor/repellent
gradients induce direct migration towards/away from the emitter
(B) Haptotaxis.
• Spatial variations in adhesion
• inhomogeneous ligand density (C) Topographic guidance• Cell reacts to surfacecurvature & prefers to align along the axis of minimal curvature of the surface, where minimal distortion of the cytoskeleton occurs
(D) Durotaxis induced by different ECM rigidity. • Rigid surface strengthens focal adhesions & increases traction force• Soft surface weakens cell adhesions & allows easier detachment
(E) Mechanotaxis induced by fluid shear stress or static mechanical strain of the substrate.
(F) Contact guidance• Cell orients along ECM fiber
Sensing
↓
Internal structure remodeling
↓
Directed cell movement
Our focus

28
Focus and goals of this study• Focus of this study :DUROTAXIS• cell’s response to the mechanical properties of its environment.
• Main goals: • develop a a model capable of reproducing the path cell of
migration, velocity and shape of a cell lying on an elastic substrate. • The components considered are: • actin–myosin filament, adhesion sites and the cytoplasmatic
membrane
Migration
Li et .,2005
Strengthening Focal Adhesions
Increase of Traction force
Discher , 2005

29
Experimental observation• Cell migrates in the
direction of increasing stiffness of the substrate
Lo et al.,2000 performed experiments with cultured 3T3fibroblasts cells
Cell accumulation on stiffer regions of PDM Substrates. Grey et al,2002
Cell path and cell accumulation in a stiff-radial-gradient gel, Wong et al.,2003
30
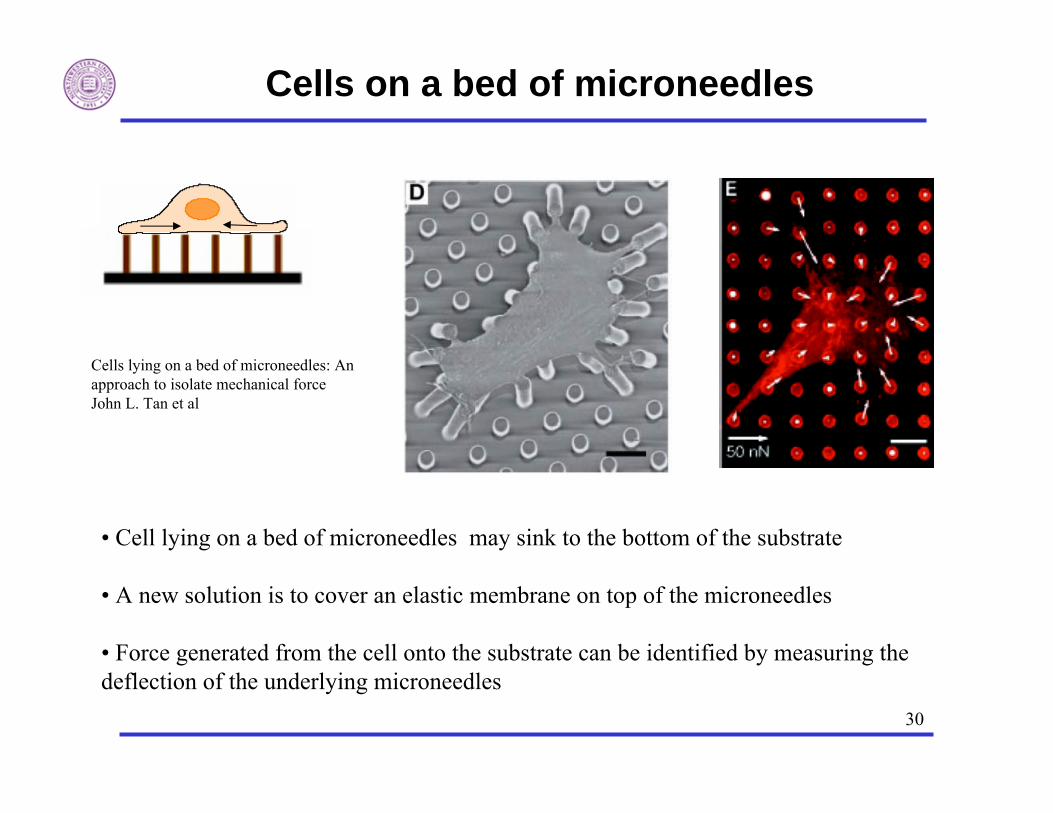
• Cell lying on a bed of microneedles may sink to the bottom of the substrate
• A new solution is to cover an elastic membrane on top of the microneedles
• Force generated from the cell onto the substrate can be identified by measuring the deflection of the underlying microneedles
Cells lying on a bed of microneedles: An approach to isolate mechanical force John L. Tan et al
Cells on a bed of microneedles
31
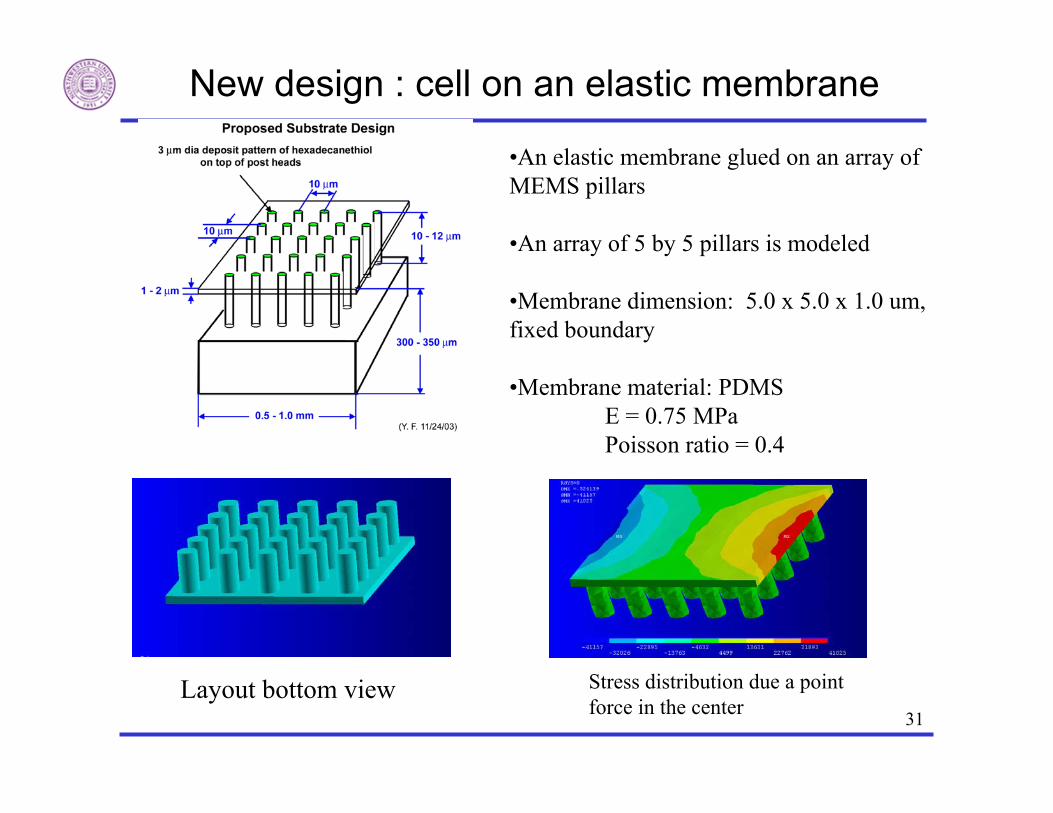
New design : cell on an elastic membrane
Stress distribution due a point force in the center
Layout bottom view
•An elastic membrane glued on an array of MEMS pillars
•An array of 5 by 5 pillars is modeled
•Membrane dimension: 5.0 x 5.0 x 1.0 um, fixed boundary
•Membrane material: PDMS E = 0.75 MPaPoisson ratio = 0.4

32
Bio-nano sensors for the study of cell adhesion
• Design and modeling of MEMS/NEMS devices for cellular force measurement
Wolf et al., 2003movie
Dia: 3µmMeasured adhesion force distribution profile at the cell-substrate interface.
Tan et al., 2002
The light square areas are coated with fibronection(to enable focal adhesion)
3 patterns with different spacings
Substrates with printed fibronectin patternsAbel, Fukui, and Liu (NWU)
1µm
Jae, Fukui, Liu, Ruoff CNT based NEMS sensor
Assembly of CNTs across parallel electrodes
movie
<10pN10-300nN 10-200nNForce resolution:
33
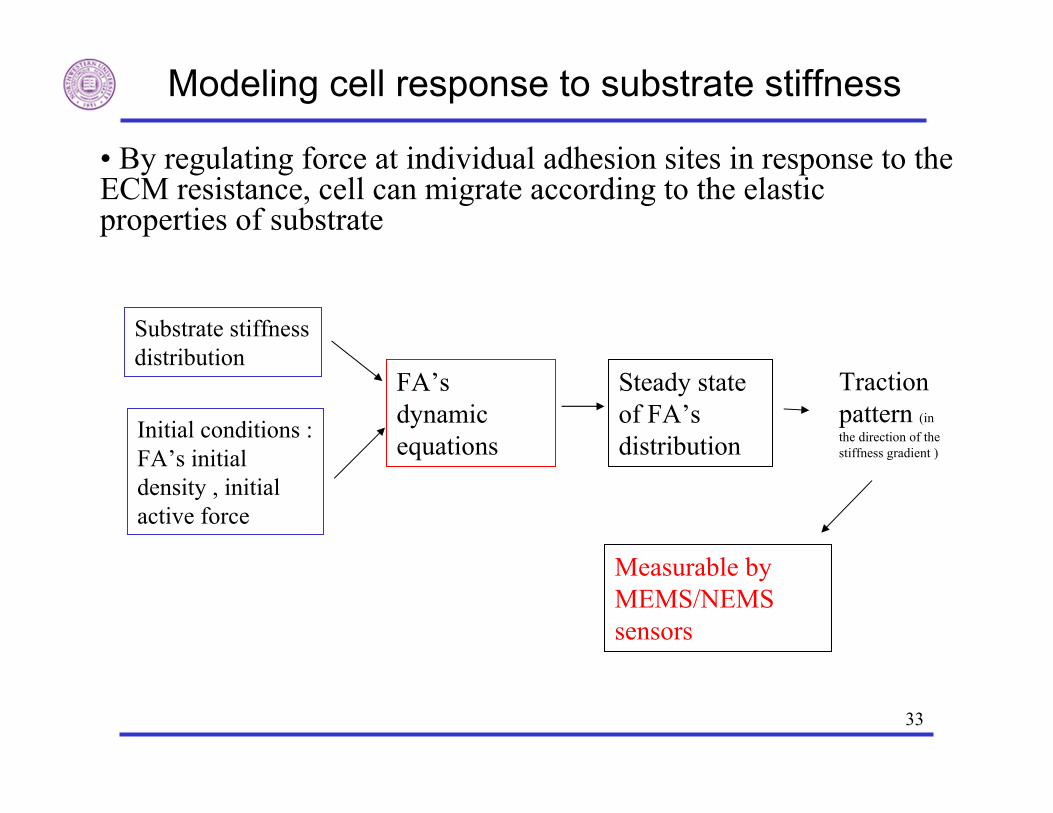
Modeling cell response to substrate stiffness
• By regulating force at individual adhesion sites in response to the ECM resistance, cell can migrate according to the elastic properties of substrate
Substrate stiffness distribution
Initial conditions : FA’s initial density , initial active force
FA’s dynamic equations
Steady state of FA’s distribution
Traction pattern (in the direction of the stiffness gradient )
Measurable by MEMS/NEMS sensors
34
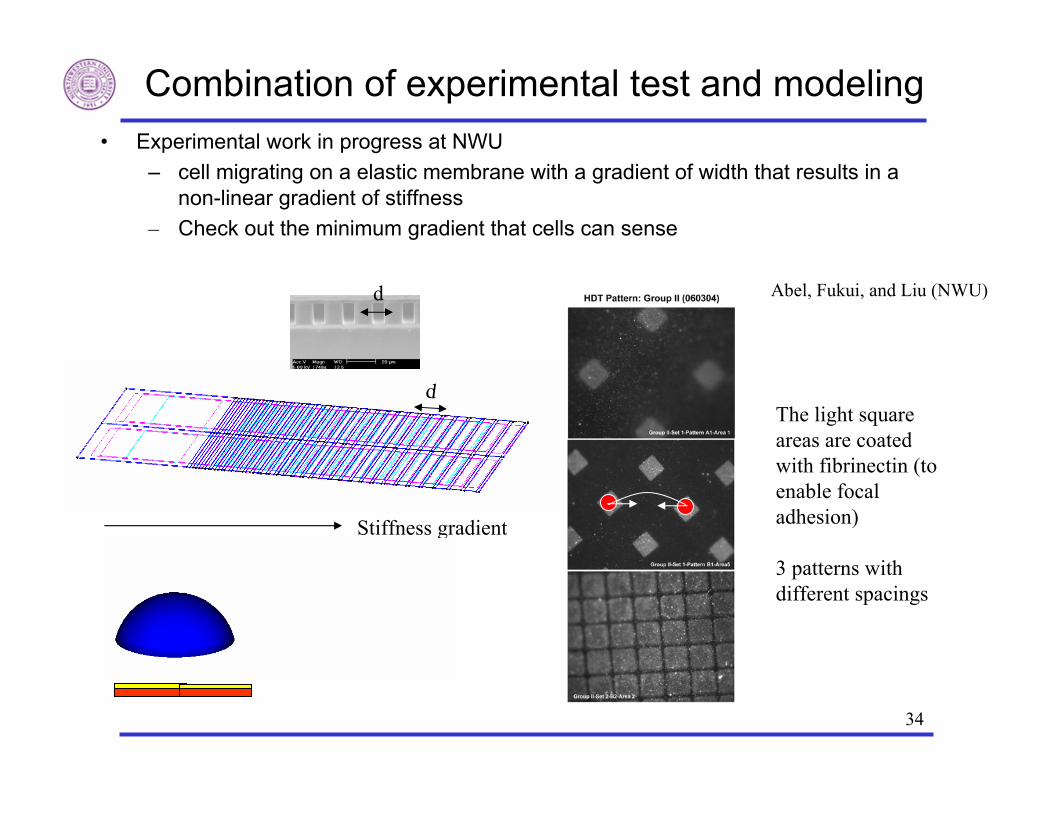
Combination of experimental test and modeling• Experimental work in progress at NWU
– cell migrating on a elastic membrane with a gradient of width that results in a non-linear gradient of stiffness
– Check out the minimum gradient that cells can sense
Stiffness gradient
Abel, Fukui, and Liu (NWU)
The light square areas are coated with fibrinectin (to enable focal adhesion)
3 patterns with different spacings
d
d

35
Cell adhesion/migration on elastic substrate
Juhee Hong, Junghoon Lee, Seoul National Univ
M. Glucksberg, Abel , Liu, NWU
0 20 40 60 80 1001
1.2
1.4
1.6
1.8
2
Length (μm)
Effe
ctiv
e st
iffne
ss o
f sub
stra
te
fixed edge
peaks of effective stiffness appear at pillar regions
• Cells know where pillars are through the nonuniform stiffness
• Cells align in high stiffness region, i.e., regions close to pillars
• How cells “sense” the environment?
36
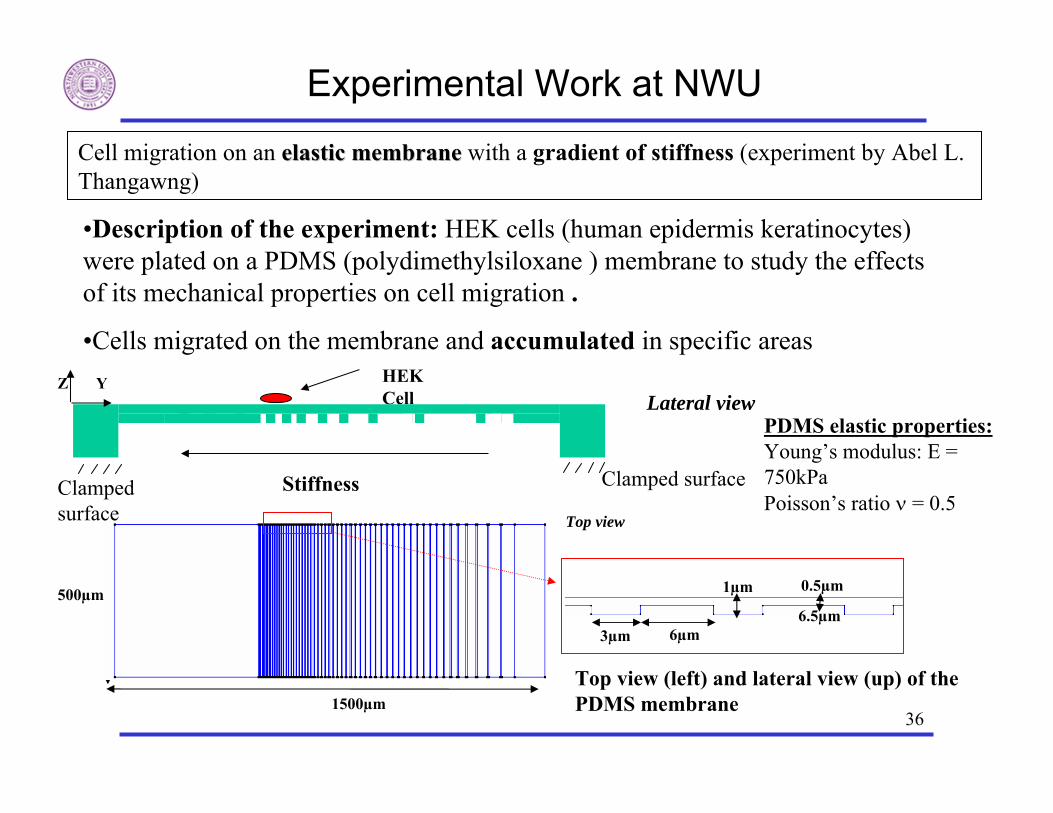
Experimental Work at NWU
Cell migration on an elastic membraneelastic membrane with a gradient of stiffness (experiment by Abel L. Thangawng)
PDMS elastic properties:Young’s modulus: E = 750kPa Poisson’s ratio ν = 0.5
Top view (left) and lateral view (up) of the PDMS membrane
Clamped surface
Z Y
•Description of the experiment: HEK cells (human epidermis keratinocytes) were plated on a PDMS (polydimethylsiloxane ) membrane to study the effects of its mechanical properties on cell migration .
•Cells migrated on the membrane and accumulated in specific areas
1500µm
500µm
3µm
1µm 0.5µm
6µm6.5µm
HEK Cell
StiffnessClamped surface
Lateral view
Top view

37
Cells accumulate in 4 regions of the membrane
Blue rectangles :accumulation region Green lines: patterned region Red rectangles: non-accumulation region
DUROTAXIS: cells migrate to stiffer regions
stiffnessy
A B C D
Observations:
•In general, cells accumulate in the stiffest regions A and D, but some also accumulate in less stiff regions B and C.
•The patterned membrane is affecting the migration of the cells since the local and global stiffnesses of the membrane are modified by the patterns (ridges).

38
Effective stiffness and experimental results
HYPOTHESIS: stiffness profiles explains accumulation regions
A
Region A: Cells accumulate in the ‘thick region’. Cells coming from the right can sense the stiffness gradient and migrate into the stiff region A.
A
B
Region B: Cells get trapped here because stiffness gradient is too small to be sensed by the cells.
B
CRegion C: Cells accmulate here because they sense stiffer regions (B and D) to their left and right.
C
D
Region D: Cells that were originally here stay here
D

39
Model of adhesion-contraction
Cell migration is a complex process that can be divided in 5 steps (Sheetz)
A: extension of the leading edgeB: adhesion to extracellular matrix contactsC: contraction of the cytoplasmD: release from contact sitesF: recycling membrane receptors from the rear to the front
The model that is going to be presented deals with C-D steps of cell migration : adhesion to extracellularmatrix contacts, contraction of the cytoplasm and release from contact sides.

40
Mechanical model
Cell membrane
FA
KS
KE
F
The local system of the cell membrane, focal adhesion, and stress fiber is modeled as a 1D viscoelastic model:
EdxF K xdt
β= + EFF
F:stress fiber contractile forceK :effectivespring constant of the stress fiber and focal adhesionβ:viscous coefficient of cell membranex:FA displacement along the membrane
41
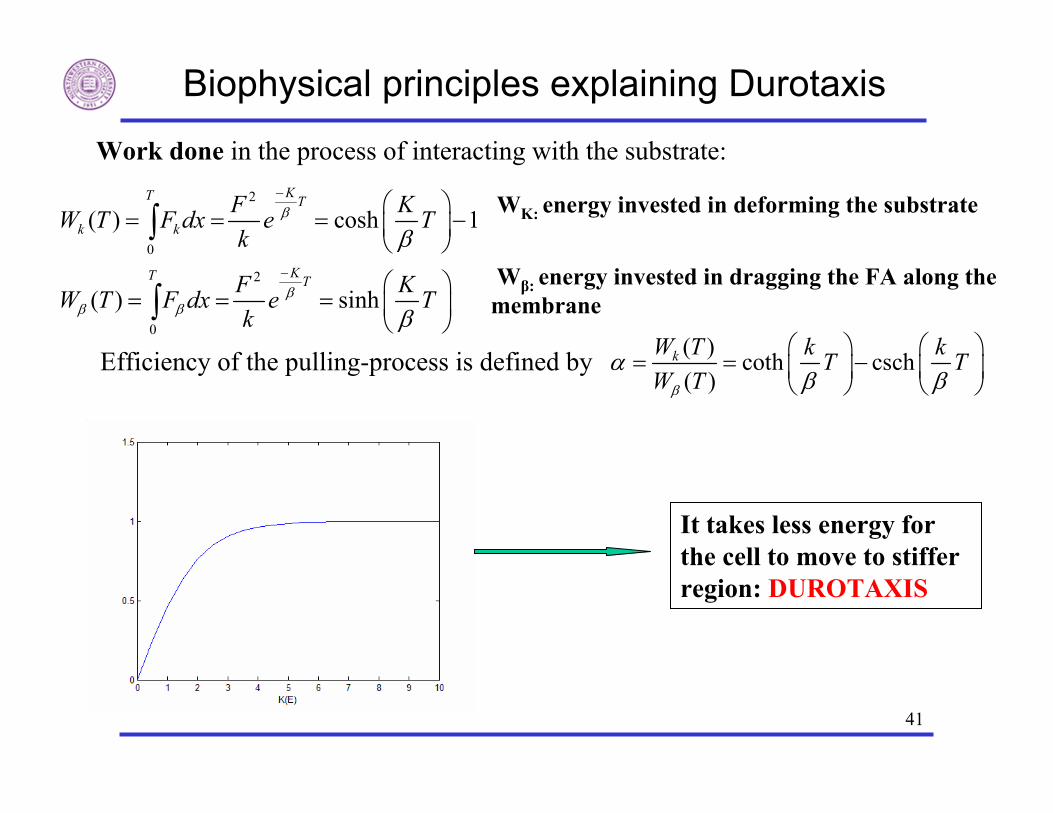
Biophysical principles explaining Durotaxis
Work done in the process of interacting with the substrate:
Efficiency of the pulling-process is defined by
2
0
2
0
( ) cosh 1
( ) sinh
KT T
k k
KT T
F KW T F dx e Tk
F KW T F dx e Tk
β
ββ β
β
β
−
−
⎛ ⎞= = = −⎜ ⎟
⎝ ⎠
⎛ ⎞= = = ⎜ ⎟
⎝ ⎠
∫
∫( ) coth csch( )
kW T k kT TW Tβ
αβ β
⎛ ⎞ ⎛ ⎞= = −⎜ ⎟ ⎜ ⎟
⎝ ⎠ ⎝ ⎠
WK: energy invested in deforming the substrate
Wβ: energy invested in dragging the FA along the membrane
It takes less energy for the cell to move to stiffer region: DUROTAXIS

Bio-nano sensors for the study of cell adhesion• Design and modeling of MEMS/NEMS devices for cellular force
measurement
Dia: 3μmMeasured adhesion force distribution profile at the cell-substrate interface.
Tan et al., 2003
Jae, Fukui, Liu, Ruoff CNT based NEMS sensor
<10pN10-300nNForce resolution:
Hong, Lee, Abel, Fukui, Liu,cell on a elastic membrane supported by a bed of microneedles
10-400nN

Immersed Electrokinetic Finite Element Method:
Coupled electrokinetics and fluid-structure interaction

44
Nanomanufacturing of electronic/molecular devices
Cross-bar array of Si NWs with electrical connection using an e-beam lithography. Y. Huang et al., Science
off
Source: http://www.nantero.com/nram.html
Rueckes et al., Science
Electric field guided assembly of NWsJ. Chung, U. Washington
Carbon Nanotube Based Memory Devices Carbon Nanotube Assembly Method
•A production chip requires millions of these CNT ribbons to be assembled precisely between the micro electrodes
Challenge

45
Challenges
• Proposed new assembly method: combine fluid flow and e-field
• -room temperature fabrication• -high packing density with high yield• -compatible with mass parallel integration• may improve density of integrated circuits (ICs) by
1000~10000 times
• NW assembly methods•growth method : high temperature•chemical patterning : complex chemical modifications•magnetic fields : not for individual assembly•electric fields (e-fields) : low yield, work locally•fluid flow : not directly positioned
http://www.azonano.com/details.asp?ArticleID=15.

46
Dielectrophoresis
*Darker color means higher e-field.
Polarization of a particle under nonuniform field.
Imbalance of force on the induced dipole of a particle.
Particle is more polarizable than medium: Positive DEP.
Particle is less polarizable than medium : Negative DEP.
Positive DEP Negative DEP
Dielectrophoretic force is proportional to polarizability.

47
From:http://www.ibmm-microtech.co.uk/microeng/dielectrophoresis/dielectrophoresis.php
Dielectrophoresis

48
Dielectrophoresis (DEP) force for small particles
( )= ⋅∇F p E
2DEP m fRe | |Kε= Γ ⋅ ∇F E
Where the geometrical factor for a sphere is 32 aπΓ =
• Induced by dipole moment under a non-uniform electric field
• The force exerted by an electric field (E) on dipole moment p:
•In AC field, the time-averaged force on a particle given by the Effective Dipole Moment (EDM) theory is
q+q-
Pohl, JonesAsokan et al,2003
is the complex permitivity of the medium (m) and particle (p)ε2 1 2 1(ε ε ) (ε 2ε )fK ∗ ∗ ∗ ∗= − / +Polarization factor

49
General DEP formulation
0 012
M εε εε δ= − ⋅σ EE E E
For an AC field of ( , ) ( ) j tE t E e ω=r r 1 2M = +σ T T
where * * 21
1 Re( )(( ) )4
Eε= + −T EE E E I is the time-averaged stress tensor
2T is the instantaneous term that vanishes by time averaging.
1( )dDEP AΓ
< >= ⋅∫F T n 1( )dr AΓ
< >= × ⋅∫τ n T n
The time averaged DEP force and rotational torque on an arbitrary shaped particle are:
• EDM is valid only for particles much smaller than the characteristic lengths of the e-field, and only derived for spherical or oblate particles
• A general expression for the DEP force on any point of a continuous domain is given through the Maxwell Stress Tensor (MST) theory
0 0
( ) ( )1( )2
fρ
ε ε
εε εε δ
+ ⋅∇
= ∇⋅ − ⋅∇
= ∇⋅ − ⋅
E p EE E E E
EE E E

50
Electrophoresis
Electrostatic attraction between charged particles and electrodes
Example: DNA electrophoresis
Courtesy of Jae-Hyun Chung, University of Washington

51
DNA electrophoresis0V
100V
•Analytical technique to separate DNA upon the size using electrophoresis
•Negatively charged DNA moves toward a positive electrode.
•Due to their length, DNA molecules are separated.
Note: the leftmost and rightmost markers are a standard DNA ladders showing the number of base pairs. For example, 1kb means DNA having 1000base-pairs.
K.-H. Lee, et al,MircoTAS, pp. 163-166, 2003
Moving direction

52http://tam.northwestern.edu/summerinstitute/Home.htm http://tam.northwestern.edu/wkl/liu.html
• Drag force induced by flow (including electroosmotic flow)
• Electrophoretic force (EP)
• Dielectrophoresis (DEP) force
• Other factors playing minor roles
– Brownian motion
– Temperature change due to heat up by E field
Forces in electromechanical problems
Electrohydrodynamic (EHD) forces
Spherical particle 10μm above two planar electrodes with a spacing of 20 μm, density=1g cm-3, viscosity=0.78Pa·s
10-3 10-2 10-1 100 101
10-2
100
102
104
Particle size (μm)
Dis
plac
emen
t in
one
seco
nd (μ
m)
DEP at 0.05V/μm
Gravity
Brownian motion
DEP at 0.5V/μm
Our study
Thermal induced buoyancy10-9
Temperature increase ~10-4 K

53http://tam.northwestern.edu/summerinstitute/Home.htm http://tam.northwestern.edu/wkl/liu.html
Equations for different factors
• DEP force
• Brownian motion
3 2DEP f2π Re | | ,F a Kε= ⋅ ∇ E
| | 2 2 /Bx Dt k Tt γΔ = =
• Thermal effect2
2VTk
σΔ =Temperature increase:
Buoyancy force due to temperature2
2
f
theramlVf g
T kρ σ⎛ ⎞∂
= ⎜ ⎟∂⎝ ⎠
Where ε and σ are the permittivity and conductivity of the mediumk is the thermal conductivity of the medium fRe K is the polarization factorγ is the viscosity of the medium

54
Compressible Navier-Stokes Fluid
Elastic Solid
Fluid-Solid Interface
Electric field
Velocity
Pressure
fΩsΩ
sΓ
Configuration of the problem
E
s
f
i n i n
s
f
Ω
Ω
vv
fΩ
Γ
fρ
sΓ
x
particle path
su
sv
v
stΩ
sρ sεX
0sΩ
sσfσ
+
-
fε
• Primary variables
• Domain description
solidfluid
f in fp Ω
• Major charge carriers– Inherent charge carriers, i.e., electrons– Ions in fluid
55
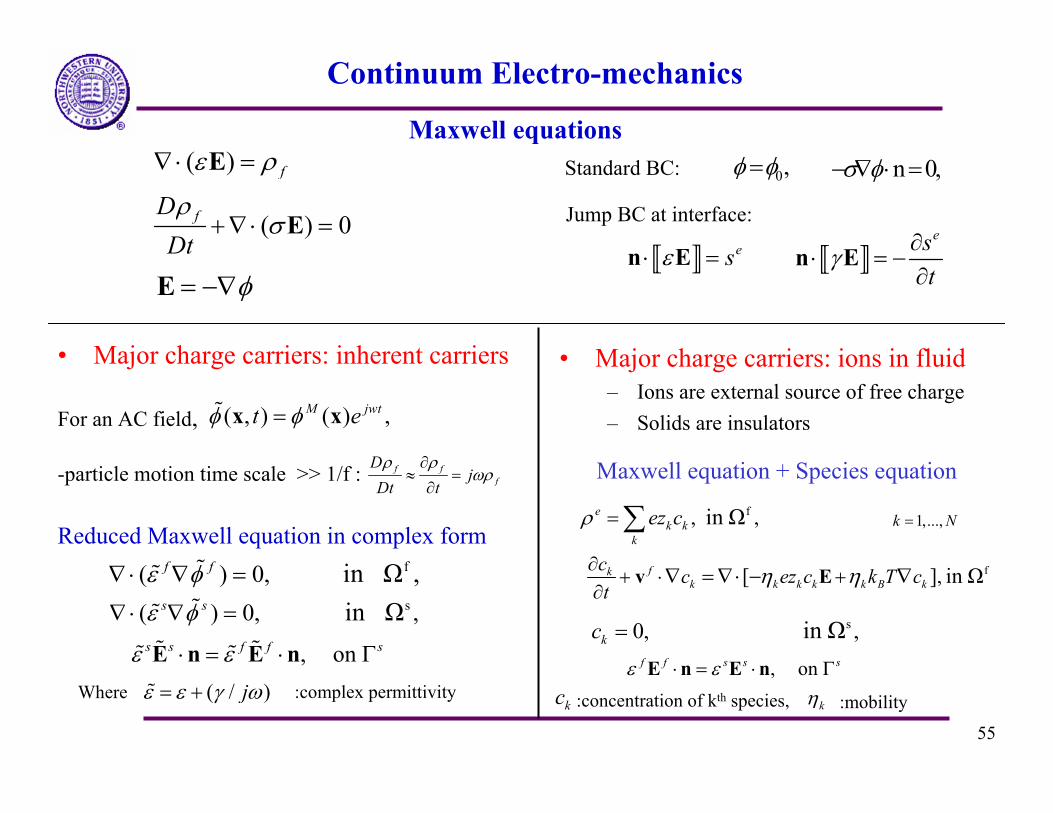
Continuum Electro-mechanics
Where
Reduced Maxwell equation in complex form
( / )jε ε γ ω= + :complex permittivity
( ) fε ρ∇ ⋅ =E
( ) 0fDDtρ
σ+∇⋅ =E
φ= −∇Eesε⋅ =n E
est
γ ∂⋅ = −
∂n E
n 0,σ φ− ∇ ⋅ =0,φ φ=Standard BC:
Jump BC at interface:
Maxwell equations
For an AC field,
-particle motion time scale >> 1/f : f ff
Dj
Dt tρ ρ
ωρ∂
≈ =∂
( , ) ( ) ,M jwtt eφ φ=x x
f( ) 0, in Ω ,f fε φ∇ ⋅ ∇ =s( ) 0, , in Ωs sε φ∇ ⋅ ∇ =
, on s s f f sε ε⋅ = ⋅ ΓE n E n
• Major charge carriers: ions in fluid– Ions are external source of free charge– Solids are insulators
• Major charge carriers: inherent carriers
Maxwell equation + Species equation
f,[ ] in Ωfkk k k k k B k
c c ez c k T ct
η η∂+ ⋅ +
∂∇ =∇⋅ − ∇v E
f, ,in Ωek k
k
ez cρ =∑
s0, , in Ωkc =
1,...,k N=
:concentration of kth species,kc kη :mobility
, on f f s s sε ε⋅ = ⋅ ΓE n E n

56
Immersed formulation of IEFEM
f f in Ω = Ω ΩM f sρ ρ ∪ ∪Γ=∇⋅ + + + ,v σ g σ F
• Augmented fluid momentum equation
• Augmented electric field equation– Inherent charge carriers
– Ions
( ) 0, in Ω,f Qε φ∇ ⋅ ∇ + =
( ) 0, in Ω.f Sε φ∇⋅ ∇ + =
f,[ ] in Ω ,kk k k k B k
Dc ez c k T cDt
η η+=∇⋅ − ∇E
s
s
(( ) )0 Ω \Ω
, in Ω , in
s f s
Qε ε φ⎧∇ ⋅ − ∇⎪= ⎨
⎪⎩
) )( )( ( in Ω0 in Ω
f fs s s s
f
ρ ρ⎧ −⎪⎨⎪⎩
− +∇⋅ − ,=
,gv σ σ
s
f
(( ) ) , in Ω , in Ω
s f s
eS
ε ε φ
ρ⎧∇⋅ − ∇⎪= ⎨⎪⎩−
Maxwell stress tensor
* * 2M 1 Re( )(( ) | | )4
ε= + −EE E E E Iσ
f, ,in Ωek k
kez cρ =∑

57
Eulerian-to-Lagrangian (E-L) Mapping
X
( , )s tx X
trajectory
su
sv
0sΩ
stΩ
xEulerian Coordinate
Lagrangian Coordinate
Eulerian function Lagrangian function0( , ) ( ( , ), ), st t tψ ψ≡ ∀ ∈ΩX x X X
• Mapping function– FEM shape function– RKPM Dirac delta function

58
Weak formulation of immersed system
0
0
f m c
1
( , , , , ) ( )
((ρ ρ )( ) )
( ) 0,
ρ ( ) :e
s
s
sm
e
sE
s M
R p p d d q d
q dt
d
φ η ηΩ Ω Ω
Ω
−
Ω
≡ ⋅ + ∇ − ∇ ⋅ ⋅∇ + ∇
∂ ∂− − − + ⋅
∂ ∂
⎛ ⎞∂ ∂⎡ ⎤+ − + : ∇ = ∀⎜ ⎟⎢ ⎥⎜ ⎟∂ ∂⎣ ⎦⎝ ⎠
− ∑∫ ∫ ∫
∫
∫ X
v u w x w x v w x
v xg E w XX
x xσ σ σ w XX X
v g σ σ
,V∈w
0
( , )( , , , ) 1 ( , ) , s
s s s smap
tR p p t d Vt
Ω
∂⎛ ⎞≡ − + ⋅ ∀ ∈⎜ ⎟∂⎝ ⎠∫x Xv u v X w X w
f( , , ) , cR p qd q MΩ
≡ ∀ ∈∇⋅∫v u xv
0
_
1 1
( )
( ) ( ) ( ) , s
fe inherent
s f
R md
m d m P
φ ε φ
ε ε φ
Ω
− −
Ω
≡ ∇ ⋅∇
⎛ ⎞ ⎛ ⎞∂ ∂ ∂⎡ ⎤ ⎡ ⎤+ − ∇ ⋅ ∇ ∀ ∈⎜ ⎟ ⎜ ⎟⎢ ⎥ ⎢ ⎥⎜ ⎟ ⎜ ⎟∂ ∂ ∂⎣ ⎦ ⎣ ⎦⎝ ⎠ ⎝ ⎠
∫
∫ X X
x
x x x XX X X
0
_
1 1
( )
( ) ( ) ( ) , s
fe ions f
s f
R md md
m d m P
φ ε φ ρ
ε ε φ
Ω Ω
− −
Ω
≡ ∇ ⋅∇ −
⎛ ⎞ ⎛ ⎞∂ ∂ ∂⎡ ⎤ ⎡ ⎤+ − ∇ ⋅ ∇ ∀ ∈⎜ ⎟ ⎜ ⎟⎢ ⎥ ⎢ ⎥⎜ ⎟ ⎜ ⎟∂ ∂ ∂⎣ ⎦ ⎣ ⎦⎝ ⎠ ⎝ ⎠
∫ ∫
∫ X X
x x
x x x XX X X 0
0
1
( ) [ ]
( )
,
s
s
ion k k k k k B k k
kk k
k k k
R c ez c k T c s d
c c s dt
c s d s S
η η
α
Ω
−
Ω
Ω
≡ + ⋅∇
∂ ∂ ∂⎡ ⎤− + ⋅∇ ⎢ ⎥∂ ∂ ∂⎣ ⎦
∂+ ∀ ∈
∂
− ∇∫
∫
∫
X
E x
x xv XX X
x XX

59
Coupling of e-field with fluid-structure interaction problems
fluid domain
moving particles
electrodes
(a) Particle, Lagrangian mesh
(b) Fluid domain, Navier-Stocks flow, Eulerian mesh
(c) Electric field, Eulerian mesh with particle domains tracked separately (electric properties different from the fluid are assigned for domains occupied by particles)
(d) Coupled electrohydrodynamic modeling of the assembly of suspended particles between micro-electrodes

60
Applications of IEFEM
• Trapping of a rigid spherical particle
• Assembly of rigid non-spherical particles
• Electro-manipulation of a single deformable cell
• Electro-manipulation of multiple cells
• Electric field induced stretching of DNAs
• Electrokinetic detection of viruses
DEP dominant(major charge carrier: electrons)
DEP & Electroosmosis flow(major charge carrier: electrons and ions)

61
Attraction of a rigid spherical particle
E-field contour
+ -
3 4 5 6 7 82
3
4
5
6
7
8x 10-12
log(Frequency) (Hz)
DEP
(N)
DEP VS. AC frequencyEffective DipoleNumerical
3 4 5 6 7 80
0.5
1
1.5
2
2.5
3 x 10-13
log(Frequency) (Hz)
DEP
(N)
DEP (AC frequency)Effective DipoleNumerical
(a) h= 10 μm
h
(b) h= 5 μm
2DEP fRe ( ),f K Eε= Γ ⋅ ∇FEffective Dipole theory:
2 μm
020fε ε=
0 =100sε ε
0.0056 s/mfσ =
=0.0112 s/msσ
8 μm4V 0V

62
3D Nanowire assembly simulation
Two steps are involved in the assembly process of NWs between semi-circular shaped electrodes
– Attraction induced by DEP force– Alignment induce by DEP torque
Top view3D view

63
NW assembly between rectangular shaped electrodes
Top viewExperimental pattern by
Chung et. al
When two NWs deposit close to each other, a third NW with a longer length may be deposited to connect the opposite two ends of the deposited NWs---because a high e-field region is created at the ends of the deposited NWs.To prevent: transport and pre-orient by fluid flow

64
Snap shorts of cross-linking process

65
Combine a shear flow and a e-field in NW assembly
Microfluidic device for NW assembly
Cross section
Peristaltic pump
ChamberChamber
NWs
Solution
air
Electrodes
AC potential
Proposed microfluidic device to combine fluid flow and e-field to assemble individual NWsJ. Chung, U. Washington , W.K. Liu, Northwestern
GlassPDMS
ElectrodesSi
Assembly process
NW suspension in solutionNW suspension in solution
NW Transport (~1mm) by fluid flowNW Transport (~1mm) by fluid flow
1st alignment by shear flow1st alignment by shear flow
Near field transport (0~5μm) by e-field Near field transport (0~5μm) by e-field
2nd alignment by electric dipole2nd alignment by electric dipole
Deposition by electrostatic attraction Deposition by electrostatic attraction
Individual NW assemblyIndividual NW assembly

66
Prediction from simulation
Pre-orientation induced by shear flow before NWs enter effective zone
Precise alignment and deposition induced by e-field at effective zone
Height of whole channel
~1mm
3D view
side view
Flow direction

67
NW assembly at different shear rate
High shear rate5s-1
Median shear rate 2.5s-1
Low shear rate 1.25s-1
Flow direction 3D view side view

68
Comparison between simulation and experiments
(b)
Single deposition Failure single depositionSymmetric
multiple deposition2 NWs deposition

69
Design criteria : DEP force
+ -
- +
(b)
(a) A NW aligns across a pair of parallel rectangular-shaped electrodes;
(b) Cross-sectional view: non-uniform electric field between two parallel rectangular-shaped electrodes. Electric fields near the NW are distorted. The DEP force will attract the NW toward the gap;
(c) The DEP force on a NW for various gap sizes. The nominal e-field strength (the field strength at the middle point) is kept at 0.5v/μm. DEP force is maximum at a ratio ~0.79.
(a)
(c)
0 0.5 1 1.5 2
-1.6
-1.4
-1.2
-1
-0.8
-0.6
-0.4
-0.2
0
Gap length/NW length
DEP
(pN
)
DEP VS. Length ratio
70
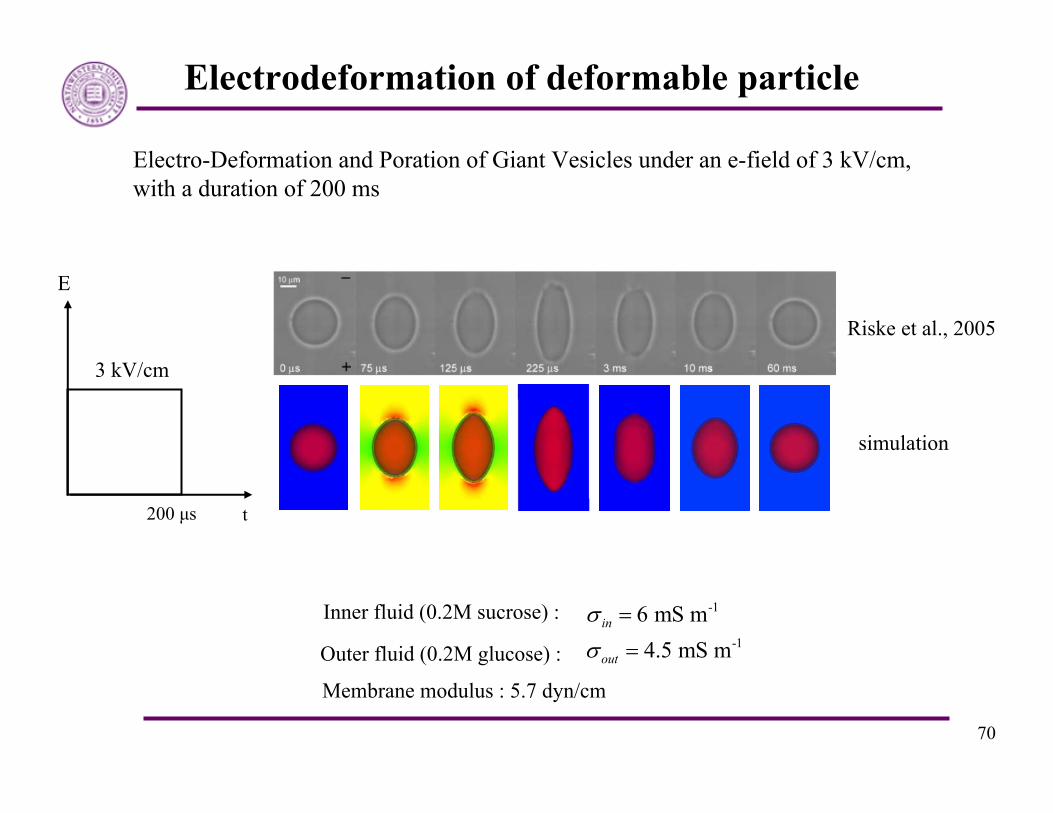
Electrodeformation of deformable particle
Electro-Deformation and Poration of Giant Vesicles under an e-field of 3 kV/cm,with a duration of 200 ms
Riske et al., 2005
simulation
Inner fluid (0.2M sucrose) : -16 mS minσ =
Outer fluid (0.2M glucose) :
Membrane modulus : 5.7 dyn/cm
-14.5 mS moutσ =
3 kV/cm
200 μs
E
t

71
Dynamic process of electrodeformation
2
2( ) Edx d xF x K x mdt d t
β= + +
( ) (1 )K tFx t e
Kβ−
= −
β
EK
Degree of deformation (a/b)history
• Determine the electrical property of cells• Determine the mechanical property of the membrane
experiment
simulation
a b
•Simplified analytical model
Time0 50 100 150 2000
0.2
0.4
0.6
0.8
1
Dip
lace
men
t
TimeWithout inertial effect With inertial effect
0 50 100 150 2000
0.2
0.4
0.6
0.8
1
Dip
lace
men
tti
72
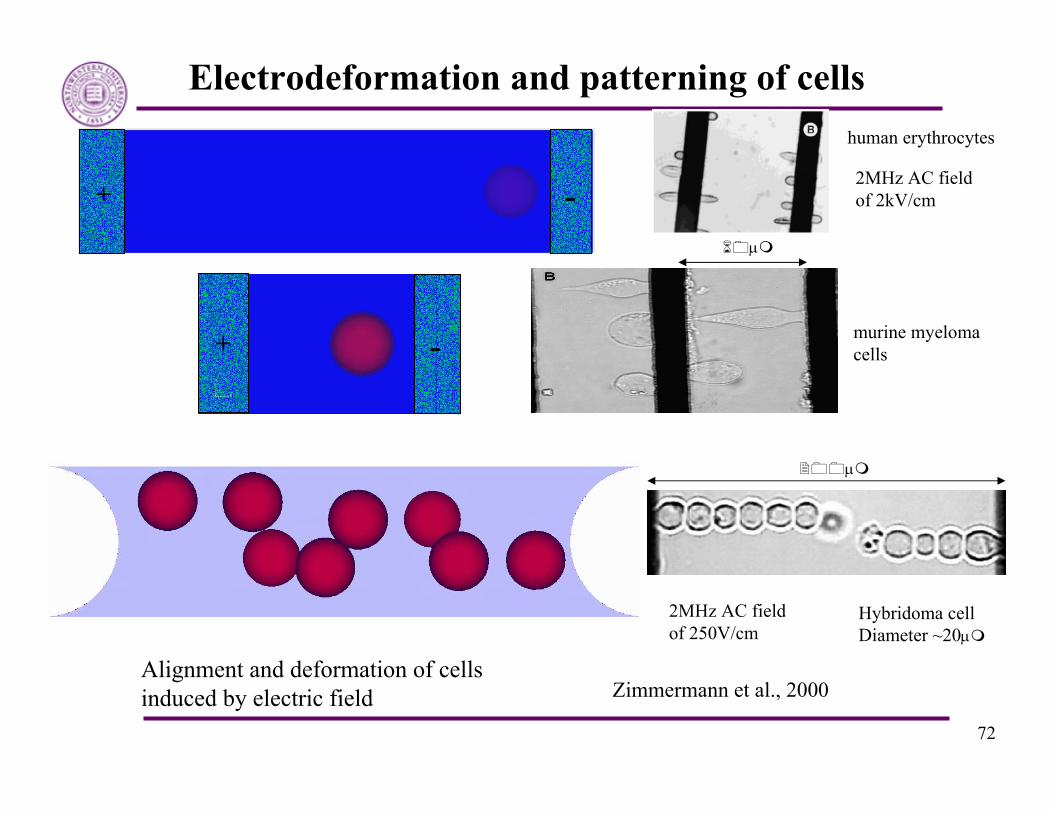
Electrodeformation and patterning of cells
Alignment and deformation of cellsinduced by electric field Zimmermann et al., 2000
-+
+ -
2MHz AC field of 250V/cm
Hybridoma cellDiameter ~20μ
2MHz AC field of 2kV/cm
human erythrocytes
murine myelomacells
μ
μ

73
Electroosmosis flow
The electroosmosis flow is driven by the electric static force applied onto the charged double layer
2E Epρ ρ μ ρ+= ∇⋅ + = −∇ + ∇ vv σ E E
The charge density of the double layer is described by the zeta potential:2 /Eψ ρ ε= −∇
Using Debye and Huckel approximation, simplify it to be2 2ψ ψκ=∇
0Thus, exp( )ψ ψ yκ= − is the solution for a infinite long channel in y direction is the potential induced by the charged ionsψ1 is called Debye length, usually in order of nmκ −
0 is called the zeta potential, y is the distance from the wallψ
Electroosmotic flow+ -Silica Velocity profile

74
μεψ x
sEu 0−=
Usually the diffuse layer very thin (<20nm) and thus, a slip boundary at the electrode surface:
0the zeta potential 135mvψ =2viscosity of ethenal 1.2mNs/mμ =
10permitivity of ethenal 2.1 F/meε −=
Electroosmosis flow
MacInnes et al proposed a steady state solution in 2D:2 2
2 2 0xdp d ψ d uεE μ
x y dy− − + =∂ ∂
22
2 0xdp d uε ψE μ
x dyκ− − + =
∂
21 ( )2 2 s
dp y hyu udxμ
= − +
Velocity profile
su
<20nm

75
AC electroosmosis flow
The charge relaxation time of a liquid:
+ ---- - - - - +++ + + + +Et
En Et
En
F=qDEt F=qDEt
/τ ε σ=
1/(2 )f πτ<• If the AC frequency , charge on electrodes and in EDL alternates according to potential sign change
• The flow direction doesn’t change with potential sign change
, are fluid permitivity and conductivityε σ
μεψ x
sEu 0−= + -
( )su x ( )su x

76
CNTs rotation induced by local electroosmosis flow
Cross section view Cross section view
2 CNTs
AC field 100 Hz, 0.5v/μm, parallel electrodes gap size: 5 μmLocal electroosmosis flows near the edges of electrodes induce vortices and lead to CNTs rotation
J. Chung, UW

77
Electroosmosis flow induced aggregation
Trau et al., Langmuir,2003
Electroosmosis flow induced aggregation (side view).The model in the literature assume the electroosmosis flow generated at each sphere are independent.The influence of neighboring spheres on the flow pattern are included here.
Sapozhnikov et al, dynamic self-assembly of granular media

78
22 uF
1GOhmHeater
Signal Generator
DNA solution
Electrodes
DNA
Experimental setup for DNA deposition
λ-DNA dissolved and diluted using ultrapure water.
The DNA stock solution was heated up to 100 ˚C so that dsDNA denaturizes into ssDNAstrand.

79
DNA stretching with CEGA (AFM images)
Stretched λ-DNA Height profile (the height of DNA strand is ~1nm)
A single DNA molecule was stretched between two electrodes, when a composite electric field was applied. The similar results at the same experimental condition were repeatedly observed. The height of DNA was around 1nm, which shows that it is a single strand DNA (unpublished results; J. Chung).

80
DNA stretching with CEGA (SEM images)
Stretched DNA Magnified view
A DNA molecule stretched with the electric field was observed under SEM. In a few minutes of illumination of electron beam, the DNA molecule was blown by the electron beam and observed. The similar images were observed in repeated experiments (unpublished results; J. Chung).

81
DNA stretching
• Bead-spring model of DNA
• AC electrokinetic-induced conformational changes of long molecules
– Electrokinetic force : attraction force
– Electroosmotic flow : elongation force+ -
DNA in solution : coiled form DNA in sequencing: stretched formAtomistic structure of DNA Bead spring model of DNA
bead
spring

82
DNA stretching
The stretching of a DNA chain between two semi-spherical shaped electrodes.
J. Chung, UW
DNA motion driven by coupled fluid/electric field

83
+ --Illustration of using frequency-dependent DEP force to sort different types of viruses.
Virus Detection by NEMS
Physical properties of the viruses
85~280 (length) 10~16 (diameter)
Inovirus
20015050Bacteriophage UrLambda
802060Bacteriophage P22
100Influenza virus
250 (membrane included)Herpes simplex virus
Total length, nmTail size, nmHead size, nm
(a) Herpes simplex virus (HSV)
(b) Influenza virus
(c) Bacteriophage P22
(d) Bacteriophage UrLambda
(e) Inovirus
•Virus detection•Transportation of virus by nanofluidic channel•Selective deposition of virus according to sizes & electrical properties
Nanofracture Inc., U. Washington, NWUNIH proposal pending

84
Virus Detection by NEMS
•Virus detection•Selective deposition of three virus according to electrical properties
PDMS fluidic Channel
Chung et al., UW
3808Conductivity (mS/m)
30370Permittivity
65 (in length)100 (diameter)85~280 (length) 10~16 (diameter)
Size (nm)
BacteriophageInfluenza Inovirus
Bacteriophage
InovirusInfluenza
t=0 ms
t=16 ms t=24 ms
t=8 ms
Selective deposition of Influenza at 5Mhz
5MHz to select Influenza
1MHz to select Inovirus

85
Electrical detection of single viruses
Patolsky et al, PNAS, 2004
How do we know a virus is deposited—conductance change

86
Conclusion• Developed Immersed Electrokinetic Finite Element Method for fluid-solid
interaction problems under an electric field– IFEM is coupled with electromechanics to model electric field guided manipulation of
bio/nano materials
– Interface is tracked automatically; no mesh update algorithm needed
• Blood rheology– Shear rate dependent blood viscosity
– Cell adhesion on an elastic substrate
• Electric field guided assembly nanowires on MEMS
– Modeled the 3D dynamic assembly process
– Proposed and validated a new design for both high yield and high precision assembly
Future research• DEP manipulation and sorting of cells and biomolecules• Biocompatibility of artificial heart valves
87
References• Wing Kam Liu, Karpov EG, Zhang S, Park HS An Introduction to Computational Nano
Mechanics and Materials. Computer Method in Applied Mechanics and Engineering 193 (17-20), 1529-1578, 2004
• Y.L. Liu, J.H. Chung, W.K. Liu, and R.S. Ruoff. Dielectrophoretic assembly of nanowires. Journal of Physical Chemistry B, accepted, 2006.
• Y.L. Liu and W. K. Liu. Rheology of red blood cell aggregation by computer simulation. Journal of Computational Physics, accepted, 2006.
• W. K. Liu, Y. L. Liu, D. Farrell, L. Zhang, X. S. Wang, Y. Fukui, N. Patankar, Y. J. Zhang, C. Bajaj, J. Lee, J. H. Hong, X. Y. Chen, H. Y. Hsu. Immersed finite element method and its applications to biological systems. Computer Methods in Applied Mechanics and Engineering, 195(13-16):1722–1749, 2006.
• Kim D.W. Tang S.Q. Liu, W.K. Mathematical foundations of the immersed finite element method. Computational Mechanics, DOI 10.1007/s00466-005-0018-5, 2006
• L. Zhang, A. Gerstenberger, X.Wang, and W.K. Liu. Immersed finite element method. Computer Methods in Applied Mechanics and Engineering, 193(21-22):2051–2067, May 2004.
• W. K. Liu, E. G. Karpov, and H. S. Park. Nano Mechanics and Materials : Theory, Multiple Scale Analysis, and Applications. Springer, 2005.
• S. Li, and W. K. Liu, Meshfree Particle Methods, Springer, 2004.• T. Belytschko, W. K. Liu, and B. Moran, Nonlinear Finite Elements for Continua and
Structures, Wiley, 2000.

88
References• Bjorn Neu, Samuel O. Sowemimo-Coker, and Herbert J. Meiselman. Cell-Cell Affinity of
Senescent Human Erythrocytes. Biophysical Journal, 85:75–84, 2003• Connie C. W. Hsia, Robert L. Johnson, JR., Dipen Shah. Red cell distribution and the recruitment of
pulmonary diffusing capacity. Journal of applied physiology 86(5):1460-7,1999.• Katarina Wolf, Regina Müller, Stefan Borgmann, Eva.-B. Bröcker, and Peter Friedl. Blood,
102,(9):3262-3269,2003• Sheetz, M. P.,(1999) Biochem. Soc. Symp. 65,233–243• John L. Tan, Joe Tien, Dana M. Pirone, Darren S. Gray, Kiran Bhadriraju, and Christopher S. Chen.
Cells lying on a bed of microneedles: An approach to isolate mechanical force. PNAS,41:484–1489, 2003
• Thomas Rueckes, Kyoungha Kim,Ernesto Joselevich, Greg Y. Tseng, Chin-Li Cheung, Charles M. Lieber. Carbon Nanotube-Based Nonvolatile Random Access Memory for Molecular Computing. Science 289(5476):pp. 94 - 97, 2000
• M. Trau, D. A. Saville, and I. A. Aksay. Assembly of colloidal crystals at electrode interfaces. Langmuir, 13(24):6375–6381, 1997.
• J. H. Chung, K. H. Lee, J. H. Lee, and R. S. Ruoff. Toward large-scale integration of carbon nanotubes. Langmuir, 20(8):3011–3017, 2004.
• K. A. Riske and R. Dimova. Electro-deformation and poration of giant vesicles viewed with high temporal resolution. Biophysical Journal, 88(2):1143–1155, 2005.
• U. Zimmermann, U. Friedrich, H. Mussauer, P. Gessner, K. Hamel, and V. Sukhoruhov. Electromanipulation of mammalian cells: Fundamentals and application. Transactions on Plasma Science, 28(1):72–82, 2000.
• M. V. Sapozhnikov, Y. V. Tolmachev, I. S. Aranson, and W.-K. KwokDynamic Self-Assembly and Patterns in Electrostatically Driven Granular Media . Phys. Rev. Lett. 90, 114301 (2003)


![A Novel Silicon-based Wideband Nano Switch For RF Applications€¦ · wireless communication system [2]. The emerging - Nano Electro-Mechanical-Systems (NEMS) technology is expected](https://static.fdocuments.us/doc/165x107/5e8fa1a758b3860e692fcb39/a-novel-silicon-based-wideband-nano-switch-for-rf-applications-wireless-communication.jpg)