Modeling CAD Data in ArcGIS - Esri
6
40 ArcUser January–March 2002 www.esri.com Modeling CAD Data in ArcGIS by Mike Price, ESRI Engineering and drafting professionals in industries such as transportation, civil engineer- ing, construction, mining, and emergency man- agement use computer-aided design (CAD) technology. CAD drawings can be readily loaded into ArcGIS to enhance spatial analy- sis. Engineers manage spatial data by separat- ing it into many named or numbered layers and may assign elevation values to CAD entities or even build drawings in true three-dimen- sional space. A layer in a CAD drawing is not the same thing as a layer in ArcMap. In a CAD file, a layer is a set of similar features. CAD drawings of geographic locations are often created in local coordinate systems or even in “paper inches,” rather than coordinates that are useful for GIS. The October–December 2000 and January– March 2001 issues of ArcUser magazine fea- tured tutorials on using CAD data in ArcView 3.x by using the CAD Reader extension and a world file to model and register this data in coordinate space. This article introduces Build this directory structure to hold the files used in this tutorial. What You Will Need • ArcGIS 8.1 Desktop (ArcInfo, ArcEditor, or ArcView license) • Pentium III computer that meets ArcGIS requirements • 50 MB of free disk space the powerful CAD loading, management, and analysis tools available in ArcGIS by showing how to load a standard CAD drawing, evaluate its layers and data attributes, build thematic legends for CAD layers, and register the draw- ing in another coordinate system. About the Model The CAD data for this exercise depicts a por- tion of the southeastern coast of New Hamp- shire, near the village of Rye Beach. These drawings, created in AutoCAD, are registered in New Hampshire State Plane using North American Datum of 1983 (NAD83) and are in feet. The grid files used in this exercise are projected in Universal Transverse Merca- tor using the North American Datum of 1927 (UTM NAD27) Zone 19 and are in meters. Getting the Sample Data Before downloading the sample data, set up a directory structure for storing files using Win- dows Explorer or another file management program. 1. Make a directory off the root directory called NH_CAD. Under this directory, make two subdirectories—DWGFiles and GRD- Files. 2. Under the DWGFiles subdirectory, make another subdirectory called NHSPN83F. 3. Under the GRDFiles subdirectory, make another subdirectory called UTM27Z19. 4. Download the self-extracting archives, CADFiles.exe and GRDFiles.exe, from the ArcUser Online Web site (www.esri.com/ arcuser). 5. Double-click on the CADFiles.exe, and extract the INDEX.DWG, PARCELS.DWG, and Wldfile1.wld into the DWGFiles\ NHSPN83F subdirectory. 6. Double-click on GRDFiles.exe, and unzip these files into the GRDFiles\UTM27Z19 sub- directory. Unzipping will automatically create the HLSHDGRD1, INFO, and TOPOGRD1 subfolders and the proper INFO relationships. Figure 1 shows the finished directory struc- ture. CAD and ArcCatalog CAD drawings usually have many layers. Each represents a different type of geographic or engineering feature. A single drawing can have vector layers for streets, water mains, and parcel boundaries that contain points, poly- lines, polygons, and annotation features on each layer. CAD drawings can represent geo- graphic features such as contour lines, spot elevations, drainages, and lakes. Not every feature type (point, polyline, polygon, annota- tion) will be present in every CAD drawing. CAD drawings can be accessed directly in ArcCatalog. The following CAD formats are supported by ArcCatalog. • AutoCAD drawing files (.dwg) up to Auto- CAD 2000 • All ASCII, binary, and partial drawing interchange files (.dxf) that comply with DXF standards • MicroStation design files (.dgn) up to Ver- sion 7 ArcCatalog can preview data in two modes—Table and Geography. Table preview shows the attributes for a layer. In Geography preview, ArcCatalog draws CAD features with Figure 1
Transcript of Modeling CAD Data in ArcGIS - Esri
40 ArcUser January–March 2002 www.esri.com
Modeling CAD Data in ArcGIS
by Mike Price, ESRI
Engineering and drafting professionals in industries such as transportation, civil engineer-ing, construction, mining, and emergency man-agement use computer-aided design (CAD) technology. CAD drawings can be readily loaded into ArcGIS to enhance spatial analy-sis. Engineers manage spatial data by separat-ing it into many named or numbered layers and may assign elevation values to CAD entities or even build drawings in true three-dimen-sional space. A layer in a CAD drawing is not the same thing as a layer in ArcMap. In a CAD file, a layer is a set of similar features. CAD drawings of geographic locations are often created in local coordinate systems or even in “paper inches,” rather than coordinates that are useful for GIS. The October–December 2000 and January–March 2001 issues of ArcUser magazine fea-tured tutorials on using CAD data in ArcView 3.x by using the CAD Reader extension and a world file to model and register this data in coordinate space. This article introduces
Build this directory structure to hold the files used in this tutorial.
What You Will Need• ArcGIS 8.1 Desktop (ArcInfo, ArcEditor, or ArcView license)• Pentium III computer that meets ArcGIS requirements• 50 MB of free disk space
the powerful CAD loading, management, and analysis tools available in ArcGIS by showing how to load a standard CAD drawing, evaluate its layers and data attributes, build thematic legends for CAD layers, and register the draw-ing in another coordinate system.
About the ModelThe CAD data for this exercise depicts a por-tion of the southeastern coast of New Hamp-shire, near the village of Rye Beach. These drawings, created in AutoCAD, are registered in New Hampshire State Plane using North American Datum of 1983 (NAD83) and are in feet. The grid files used in this exercise
are projected in Universal Transverse Merca-tor using the North American Datum of 1927 (UTM NAD27) Zone 19 and are in meters.
Getting the Sample DataBefore downloading the sample data, set up a directory structure for storing files using Win-dows Explorer or another file management program.1. Make a directory off the root directory called NH_CAD. Under this directory, make two subdirectories—DWGFiles and GRD-Files. 2. Under the DWGFiles subdirectory, make another subdirectory called NHSPN83F. 3. Under the GRDFiles subdirectory, make another subdirectory called UTM27Z19.4. Download the self-extracting archives, CADFiles.exe and GRDFiles.exe, from the ArcUser Online Web site (www.esri.com/arcuser). 5. Double-click on the CADFiles.exe, and extract the INDEX.DWG, PARCELS.DWG, and Wldfile1.wld into the DWGFiles\NHSPN83F subdirectory.6. Double-click on GRDFiles.exe, and unzip these files into the GRDFiles\UTM27Z19 sub-directory. Unzipping will automatically create the HLSHDGRD1, INFO, and TOPOGRD1 subfolders and the proper INFO relationships. Figure 1 shows the finished directory struc-ture.
CAD and ArcCatalogCAD drawings usually have many layers. Each represents a different type of geographic or engineering feature. A single drawing can have vector layers for streets, water mains, and parcel boundaries that contain points, poly-lines, polygons, and annotation features on each layer. CAD drawings can represent geo-graphic features such as contour lines, spot elevations, drainages, and lakes. Not every feature type (point, polyline, polygon, annota-tion) will be present in every CAD drawing. CAD drawings can be accessed directly in ArcCatalog. The following CAD formats are supported by ArcCatalog.• AutoCAD drawing files (.dwg) up to Auto-CAD 2000• All ASCII, binary, and partial drawing
interchange files (.dxf) that comply with DXF standards• MicroStation design files (.dgn) up to Ver-sion 7 ArcCatalog can preview data in two modes—Table and Geography. Table preview shows the attributes for a layer. In Geography preview, ArcCatalog draws CAD features with
Figure 1
www.esri.com ArcUser January–March 2002 41
Hands On
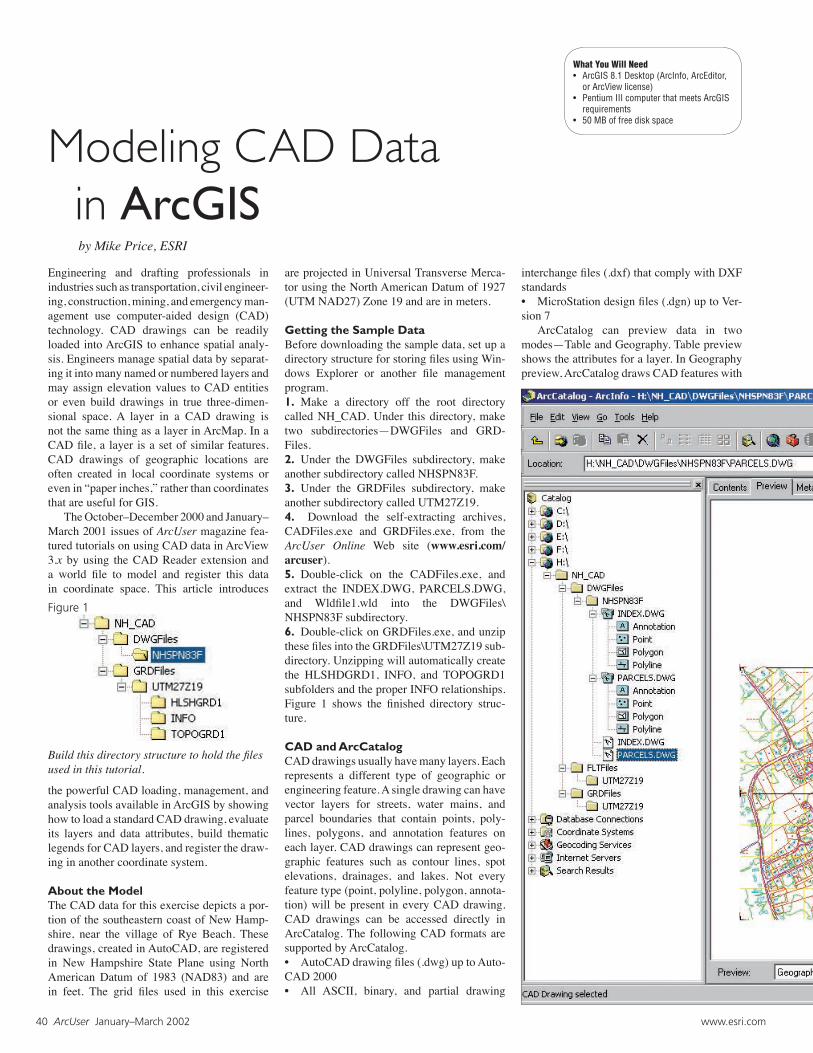
Explore the CAD drawings in the sample datasets in ArcCatalog by clicking on the Contents, Preview, and Metadata tabs.
Open the Edit Metadata icon on the toolbar and select the Spatial Reference. Click on the General tabs and choose Spatial Reference. Add the projection, datum, and spheroid information.
the same default symbology it uses when drawing shapefiles and coverages. For each CAD drawing, ArcCatalog dis-plays both a CAD dataset layer and a CAD drawing layer in the Catalog tree. A CAD data-set contains point, line, polygon, and annota-tion feature classes and is denoted by an icon composed of three blue sheets of paper with a drafting compass symbol. For example, the polyline feature class for a CAD dataset rep-resents all polyline features in all layers of the drawing and all attributes associated with those layers. Additional feature attributes may be stored in separate tables. The symbology of a layer file created from a CAD feature class can be modified, the join attributes stored in separate tables, and the features to be dis-played can be specified. A CAD drawing layer is used only for dis-play and is represented in the Catalog tree by an icon with a single white sheet containing a drafting compass. Individual CAD layers can be turned off or on, but ArcMap draws all the CAD entities according to the color specified in the CAD drawing file. View PARCELS.DWG and INDEX.DWG, the two CAD drawings in the sample dataset. Start ArcCatalog and navigate to NH_CAD\DWGFiles\NHSPN83F and select PARCELS.DWG. With Geography selected as the preview mode for ArcCatalog, click on the Contents, Preview, and Metadata tabs and explore PARCELS.DWG. Look at INDEX.DWG. Notice that only minimal meta-data, actually just partial bounding coordi-nates, is provided for these CAD drawings.
Adding MetadataIn the left pane of ArcCatalog, select the drawing layer (white, single sheet icon) for INDEX.DWG. In the right pane, click on the Metadata tab and select Spatial. The drawing
Continued on page 42

42 ArcUser January–March 2002 www.esri.com
Modeling CAD Data in ArcGISContinued from page 41extents are provided, but there is no regis-tration information. These CAD files are in New Hampshire State Plane, which has just one zone, and the datum is NAD83. The spher-oid is the Geodetic Reference System 1980 (GRS80). The metadata for these files needs to be updated using ArcCatalog.1. If the Metadata toolbar is not already open, choose View > Toolbars > Metadata from the ArcCatalog menu. 2. Click on the Edit Metadata button (white paper with pencil icon).3. In the dialog box, click on the Spatial Ref-erence tab. Click on the General tab. From the choices along the top of this dialog box,
CAD files can be dragged and dropped from ArcCatalog into ArcMap.
Create legends for each data type after verifying that all the layers are turned on.
choose Spatial Reference. In the Spatial Ref-erence dialog box, type in or choose from the drop-down box the correct entries for Pro-jected Coordinate System Name (e.g., New Hampshire State Plane), Horizontal Datum Name (e.g., North American Datum of 1983), and Ellipsoid Name (e.g., Geodetic Reference System 1980).4. Click Save, and click on the Spatial Meta-data tab in ArcCatalog. Now the projected coordinate system name reads New Hampshire State Plane. Click on Details to see informa-tion on the datum and spheroid. Use Windows Explorer or another file manager to navigate to NH_CAD\DWGFiles\NHSPN83F. A new file
containing this metadata, Index.dwg.xml, has just been created. When sharing CAD or other files, be sure to include the metadata files (indicated by an .xml file extension). Select the drawing layer for PARCELS.DWG, and enter the same projec-tion information for it. Open PARCELS.DWG as a Dataset type, and check its projection metadata. The spatial horizontal coordinate system information is now available for the dataset layers. A word of caution: These CAD drawings, unlike coverages, shapefiles, grids, or triangulated irregular network (TIN) files, lack sufficient registration information to be projected on the fly by ArcMap.
www.esri.com ArcUser January–March 2002 43
Hands On
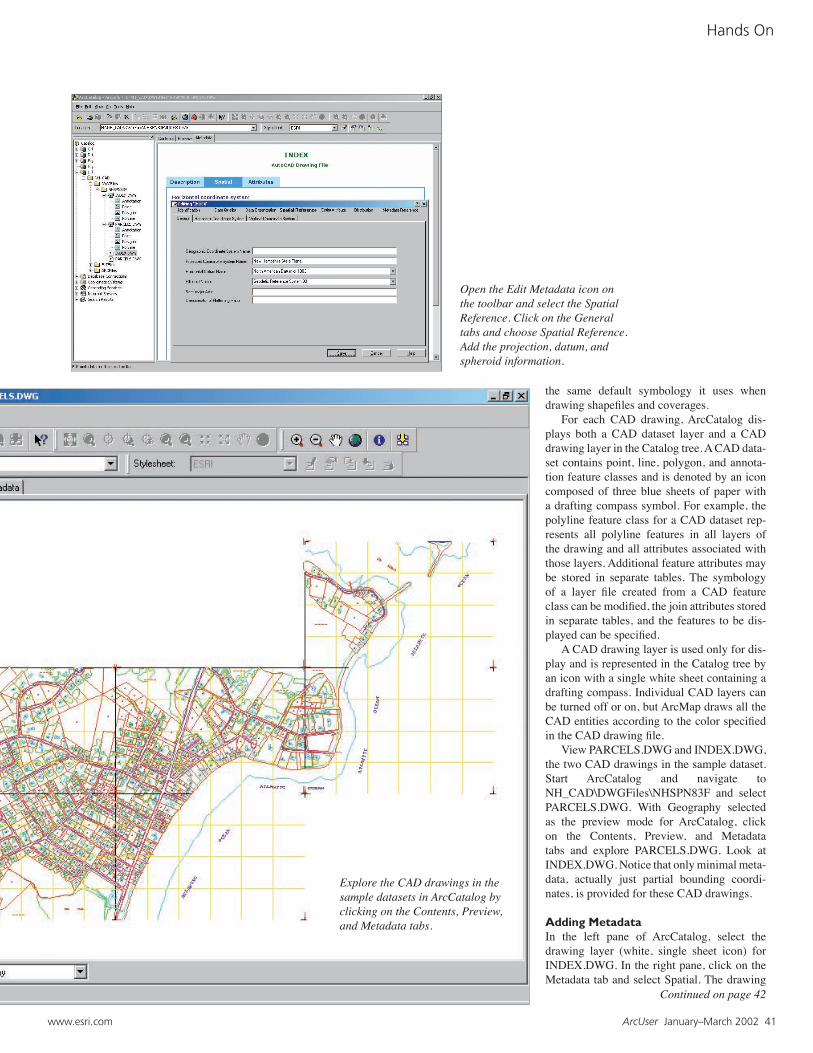
Rename the new Data Frame, set map and display units to meters, specify the projection and datum, load Topogrd1 and HlshGrd1, and set the transparency of Hlshgrd1 to 60 percent
CAD and ArcMapCAD files can be dragged and dropped from ArcCatalog into ArcMap.1. Start an ArcMap session by double-click-ing on the Launch ArcMap icon on theArcCatalog toolbar.2. Resize the ArcCatalog and ArcMap win-dows so both are accessible. 3. Hold down the left mouse button on the dataset icon (three blue sheets icon) for INDEX.DWG, drag it to the ArcMap canvas, and release it. The four Index data types will display in ArcMap.4. Drag and drop the PARCELS.DWG data-set icon from ArcCatalog to ArcMap.
ArcMap automatically stacks data types in a logical manner with the polygon layer on the bottom followed by the polyline, point, and annotation layers. If necessary, drag the INDEX.DWG data below the PARCELS.DWG data. Inspect both datasets by turning each data type on individually. Very simple symbol-ogy has been created for each dataset. Save this ArcMap document as Nh_cad01.mxd in the NH_CAD directory. Hint: To quickly turn off all data in the Table of Contents, hold down the Control key and uncheck the box next to any displayed theme. Next, load the drawing layers for
INDEX.DWG and PARCELS.DWG by drag-ging and dropping them from ArcCatalog to ArcMap. These layers should load near the top of the Table of Contents. Move the INDEX.DWG layer below PARCELS.DWG, and make only the drawing representations vis-ible. Right-click on INDEX.DWG, the draw-ing layer, and choose Zoom to Layer from the context menu to see the extent of this layer. Notice that the options available from the con-text menu are limited. Use Zoom, Pan, and the other navigation tools to explore the datasets and verify that all data for both files is dis-played. Save the document. Study the map coordinates displayed in the lower right part of the ArcMap interface. ArcMap lists the units for these coordinates as unknown. Check the width of a typical road-way using the Measure tool. These values, between 35 and 60, strongly suggest that the map unit is feet. Right-click on the Layers Data Frame in the Table of Contents and choose Properties. Click on the General tab and set both the map and display units to feet so that this data can be properly scaled, measured, and buffered. Still in the Data Frame Properties dialog box, rename the Data Frame from Layers to Rye Beach, NH NH State Plane NAD83. Click OK to close Data Frame Properties. Save the docu-ment.
CAD Data Legends in ArcMapArcMap alphanumerically sorts and displays the layers contained within a CAD drawing. CAD engineers often freeze or turn off layers to hide them or protect them from editing. When adding CAD data to ArcMap, verify that all layers are available by right-clicking on the layer and choosing Properties > Drawing Layers. Individual CAD layers can be turned off and on in this dialog box and easily filtered while being imported into ArcGIS. Copying a data theme to the ArcMap clipboard, pasting it back into the View, and turning CAD layers off and on can allow thematic display of many data types while using only one CAD file as the source. Using this capability in ArcMap, the next step will be to thematically map the INDEX.DWG Polyline layer and represent each type of line data in this CAD drawing.1. Turn off all the layers. Turn on only INDEX.DWG Polyline.2. Right-click on INDEX.DWG Polyline, and choose Zoom to Layer to zoom to the extent of this layer. Note that many more choices are available from the context menu for dataset layers.3. Right-click on the INDEX.DWG Polyline layer again, and choose Properties > Drawing Layers. All nine layers should be active. If not,
Continued on page 44

Modeling CAD Data in ArcGISContinued from page 43
44 ArcUser January–March 2002 www.esri.com
click on the Enable All button in this dialog box.4. To create a Categories legend (similar to a Unique Values legend in ArcView 3.x), click on the Symbology tab, and choose Categories. Under Categories, choose Unique Values.5. Under Value Field, select Layer from the drop-down box, and click on the Apply All Values button. Only five layers—Grid, Roads, Study_Area, Townline, and Water—are avail-able as polylines.6. Modify the legend by selecting one of the color schemes that comes with ArcMap avail-able from the Layer Properties dialog box or by double-clicking on each line type for INDEX.DWG Polyline and changing the line color and/or line style using the Symbol Selec-tor. 7. Using the same technique, build thematic legends for the polygon, polyline, and point layers for the INDEX and PARCELS CAD drawings. Before building each legend, verify that all layers are turned off by right-clicking on each layer in the Table of Contents and choosing Properties > Drawing Layers. After creating legends, open the table for each data type by right-clicking on the layer and choos-ing Open Attribute Table to inspect the data. Save the document.
Adding DEM DataNow for the fun stuff! The grid files in GRDFiles\UTM27Z19 were created from United States Geological Survey digital ele-vation model (DEM) data in UTM NAD27. Bringing in the CAD drawings with this terrain data will show the relationships among storm water channels, beach erosion, and housing developments. 1. Choose Insert > New Data Frame from the ArcMap menu. 2. Right-click on the new Data Frame and choose Properties > General. Rename the layer Rye Beach, NH UTM NAD27 Zone 19. Set map and display units to meters. 3. Still in the Data Frame Properties dialog box, click on the Coordinate System tab. Click on the Predefined folder, then the Projected Coordinate Systems folder, and then the UTM folder. Locate UTM NAD27 Zone 19, and select it. Click OK.4. Click on the Add Data button, and nav-igate to the GRDFiles\UTM27Z19 folder. Load TOPOGRD1 and HLSHDGRD1 into the Rye Beach, NH UTM NAD27 Zone 19 data frame.5. Place HLSHDGRD1 at the top of the Table of Contents. Set its transparency at 60 percent by choosing View > Toolbars > Effects. In the Effects toolbar, choose HLSHDGRD1 from the drop-down box, and move the transpar-ency slider to 60 percent.
Use the world file to place Parcels Polyline in UTM NAD27 coordinate space.
6. Check the map coordinates shown in the lower right corner of the interface. These values should be in meters. Study the terrain, identifying the approx-imate location of the coastline. The hum-mocky pattern of low lying landforms look like glacial end moraine and outwash. Load the CAD drawings into the Rye Beach, NH UTM NAD27 Zone 19 data frame to see relationships between the geomorphology and development. Right-click on each PARCEL or INDEX dataset layer, and choose Copy from the context menu. Right-click on the Rye Beach, NH UTM NAD27 Zone 19 data frame, and choose Paste Layer from the con-text menu. Try to view the CAD layers with TOPOGRD1 and HLSHDGRD1. The CAD

www.esri.com ArcUser January–March 2002 45
Hands On
Once the world file has been applied to all the layers, the data on each can be compared.
layers won’t display with TOPOGRD1 and HLSHDGRD1 because they are still projected in New Hampshire State Plane.
Moving CAD Data into Other Project Space with a World FilePrevious tutorials on using CAD data in ArcView 3.x employed a world file to register CAD drawings in UTM. A world file is a simple text file with a .wld extension that includes the x and y coordinates of a CAD point, first in local coordinates and then in UTM coordinates. World files can also be used to register CAD drawings in ArcMap.1. Right-click on INDEX.DWG Polyline, and choose Properties from the context menu. 2. Click on the Transformations tab. Make
sure the radio button next to World File is clicked. Check the Enable Transformations box, and browse the location of the world file in the DWGFiles\NHSPN83F subdirec-tory. Click OK. This will apply the world file to all the INDEX.DWG layers.3. Use the same process to apply the world file to PARCELS.DWG. Zoom to the extent of INDEX.DWG Poly-gon, and check the registration relative to TOPOGRD1 and HLSHDGRD1. All CAD data should be in UTM NAD27 Zone 19 meters. Enhance the three-dimensional effect by moving the HLSHDGRD1 layer just above INDEX.DWG Polygon.
Analyzing the ModelLook carefully at how residential development is set back from the coast. Zoom in, and use the Measure tool to see that typical setback distances are 100 to 150 meters. Observe how roads, especially in western areas, are built on ridges that place them above marshy areas. Again, check out the hummocky terrain. Imag-ine how difficult it might be for surface water to flow directly to the ocean. Notice, too, that surface drainages include a significant buffer of open space, with minimal development.
These observations, and more, can only be made after the CAD drawings are registered with digital terrain. CAD world files are really something!
SummaryArcGIS contains powerful CAD tools. This exercise demonstrated how to load CAD data directly into ArcGIS and display, explore, and test it. Applying a world file can register CAD files, created in local coordinates, in projected coordinate space. Combining and registering CAD files with other terrain data and using the cartographic display features of ArcGIS provided a better understanding of the Rye Beach area. Visit the ArcUser Online Web site (www.esri.com/arcuser) to download the sample dataset for this exercise.