Modeling and Simulation of the Off-gas in an Electric … steelmaking in an electric arc furnace...
16
Modeling and Simulation of the Off-gas in an Electric Arc Furnace THOMAS MEIER, KARIMA GANDT, THOMAS ECHTERHOF , and HERBERT PFEIFER The following paper describes an approach to process modeling and simulation of the gas phase in an electric arc furnace (EAF). The work presented represents the continuation of research by Logar, Dovzˇ an, and S ˇ krjanc on modeling the heat and mass transfer and the thermochemistry in an EAF. Due to the lack of off-gas measurements, Logar et al. modeled a simplified gas phase under consideration of five gas components and simplified chemical reactions. The off-gas is one of the main continuously measurable EAF process values and the off-gas flow represents a heat loss up to 30 pct of the entire EAF energy input. Therefore, gas phase modeling offers further development opportunities for future EAF optimization. This paper presents the enhancement of the previous EAF gas phase modeling by the consideration of additional gas components and a more detailed heat and mass transfer modeling. In order to avoid the increase of simulation time due to more complex modeling, the EAF model has been newly implemented to use an efficient numerical solver for ordinary differential equations. Compared to the original model, the chemical components H 2 ,H 2 O, and CH 4 are included in the gas phase and equilibrium reactions are implemented. The results show high levels of similarity between the measured operational data from an industrial scale EAF and the theoretical data from the simulation within a reasonable simulation time. In the future, the dynamic EAF model will be applicable for on- and offline optimizations, e.g., to analyze alternative input materials and mode of operations. DOI: 10.1007/s11663-017-1093-7 ȑ The Minerals, Metals & Materials Society and ASM International 2017 I. INTRODUCTION ELECTRIC steelmaking in an electric arc furnace (EAF) is the main process route for steel scrap recycling and the second most important steel production route in the world. As an energy-intensive process, the EAF is responsible for approximately 3 pct of the total industrial electricity consumption and a significant lever for energy efficiency optimization. [1] As the off-gas flow represents an energy output of 20 to 30 pct of the total EAF energy input, the off-gas is in the focus of current developments to increase the energy and resource efficiency of the EAF. As one of the main continuously measurable process values, the off-gas composition can be utilized to improve the process control and allows conclusions to be made concerning the process behavior. Here, process models have proven their applicability for process control and their capability to contribute toward a more detailed understanding of heat and mass transfer during the melting process. In times of continuously growing com- putational capacity, the complexity of the dynamic process simulation models has increased due to the consideration of more and more phenomena. Logar et al. [2–4] presented a comprehensive deterministic EAF model, which is based on fundamental physical and mathematical equations. The model includes all main thermal, chemical, and mass transfer phenomena in the EAF. These are implemented via first-order ordinary differential equations (ODEs). It was further developed and enhanced with a more detailed simulation of the arc heat distribution and a modified chemical module. [5,6] Due to the lack of off-gas data from the validation furnace, the gas phase was simplified. Five chemical components are taken into account and chemical reactions are only considered for post-combustion. As one of the best recently published EAF models, it was found to be suitable a starting point for further development of the gas phase modeling, which is described within this paper, which is therefore a continuation of the work done by Logar et al. A detailed literature review shows that there are other papers addressing the modeling of the gas phase in an EAF, but with different approaches and simplifications. Opitz and Treffinger [7] use the model of Logar et al. to design a dynamic, physics-based model of a complete EAF THOMAS MEIER, KARIMA GANDT, THOMAS ECHTERHOF, and HERBERT PFEIFER are with the Department for Industrial Furnaces and Heat Engineering, RWTH Aachen University, Kopernikusstrasse 10, 52074 Aachen, Germany. Contact e-mail: [email protected] Manuscript submitted March 24, 2017. Article published online September 28, 2017. METALLURGICAL AND MATERIALS TRANSACTIONS B VOLUME 48B, DECEMBER 2017—3329
Transcript of Modeling and Simulation of the Off-gas in an Electric … steelmaking in an electric arc furnace...
Modeling and Simulation of the Off-gas in an ElectricArc Furnace
THOMAS MEIER, KARIMA GANDT, THOMAS ECHTERHOF ,and HERBERT PFEIFER
The following paper describes an approach to process modeling and simulation of the gas phase inan electric arc furnace (EAF). The work presented represents the continuation of research byLogar, Dovzan, and Skrjanc on modeling the heat and mass transfer and the thermochemistry inan EAF. Due to the lack of off-gas measurements, Logar et al. modeled a simplified gas phaseunder consideration of five gas components and simplified chemical reactions. The off-gas is oneof the main continuously measurable EAF process values and the off-gas flow represents a heatloss up to 30 pct of the entire EAF energy input. Therefore, gas phase modeling offers furtherdevelopment opportunities for future EAF optimization. This paper presents the enhancement ofthe previous EAF gas phase modeling by the consideration of additional gas components and amore detailed heat and mass transfer modeling. In order to avoid the increase of simulation timedue to more complex modeling, the EAF model has been newly implemented to use an efficientnumerical solver for ordinary differential equations. Compared to the original model, the chemicalcomponents H2, H2O, and CH4 are included in the gas phase and equilibrium reactions areimplemented. The results show high levels of similarity between the measured operational datafrom an industrial scale EAF and the theoretical data from the simulation within a reasonablesimulation time. In the future, the dynamic EAF model will be applicable for on- and offlineoptimizations, e.g., to analyze alternative input materials and mode of operations.
DOI: 10.1007/s11663-017-1093-7� The Minerals, Metals & Materials Society and ASM International 2017
I. INTRODUCTION
ELECTRIC steelmaking in an electric arc furnace(EAF) is the main process route for steel scrap recyclingand the second most important steel production route inthe world. As an energy-intensive process, the EAF isresponsible for approximately 3 pct of the total industrialelectricity consumption and a significant lever for energyefficiency optimization.[1] As the off-gas flow represents anenergy output of 20 to 30 pct of the total EAF energyinput, the off-gas is in the focus of current developments toincrease the energy and resource efficiency of the EAF. Asone of the main continuously measurable process values,the off-gas composition can be utilized to improve theprocess control and allows conclusions to be madeconcerning the process behavior. Here, process modelshave proven their applicability for process control andtheir capability to contribute toward a more detailed
understanding of heat and mass transfer during themelting process. In times of continuously growing com-putational capacity, the complexity of the dynamic processsimulation models has increased due to the considerationof more and more phenomena. Logar et al.[2–4] presented acomprehensive deterministic EAF model, which is basedon fundamental physical and mathematical equations.The model includes all main thermal, chemical, and masstransfer phenomena in the EAF. These are implementedvia first-order ordinary differential equations (ODEs). Itwas further developed and enhanced with a more detailedsimulation of the arc heat distribution and a modifiedchemical module.[5,6] Due to the lack of off-gas data fromthe validation furnace, the gas phase was simplified. Fivechemical components are taken into account and chemicalreactions are only considered for post-combustion. As oneof the best recently published EAFmodels, it was found tobe suitable a starting point for further development of thegas phase modeling, which is described within this paper,which is therefore a continuation of the work done byLogar et al.A detailed literature review shows that there are other
papers addressing the modeling of the gas phase in anEAF, but with different approaches and simplifications.Opitz and Treffinger[7] use the model of Logar et al. todesign a dynamic, physics-based model of a complete EAF
THOMAS MEIER, KARIMA GANDT, THOMAS ECHTERHOF,and HERBERT PFEIFER are with the Department for IndustrialFurnaces and Heat Engineering, RWTH Aachen University,Kopernikusstrasse 10, 52074 Aachen, Germany. Contact e-mail:[email protected]
Manuscript submitted March 24, 2017.Article published online September 28, 2017.
METALLURGICAL AND MATERIALS TRANSACTIONS B VOLUME 48B, DECEMBER 2017—3329
plant which consists of four sub-systems (vessel, electricsystem, electrode regulation, and off-gas system). Matsonand Ramirez[8,9] consider six chemical elements in theoff-gas and determine the reaction rates with a chemicalequilibrium algorithm by Gibbs free energy minimization.The simulation calculation time is not mentioned and isassumed slow compared to other approaches. Further-more, the results of the gas phase simulation are notcompared to measured data and the curves show aconstant behavior over long periods. MacRosty andSwartz[10] consider all relevant species in the gas zoneand assume chemical equilibrium in each zone. The modeldoes not address gas radiation and requires a highcomputing capacity. Nyssen et al.[11] published anotherEAF model. The model seems to include all majorprocesses, but no details are given in the publication.
The objective of this work was to consider all majormeasurable gas components in an EAF process model.Therefore, in addition to CO, CO2, N2, O2, and CH4,the components H2, H2O, and CH4 are also included inthe gas phase of this study. The components areconsidered in chemical reactions for post-combustion,major equilibrium reactions, and dissociation. To pre-vent the increase of simulation time, the EAF model wasnewly implemented in MATLAB to use the internalODE-solver instead of the fixed step Euler method,which was chosen by Logar et al.
The further development is based on an industrialscale 140 t EAF. The operational data of the EAF areused for the model parametrization and final validationof the simulation results. The input powers and massflows of the periphery are used as input data for thesimulation. The simulation results are evaluated con-cerning off-gas composition, temperature, and energy.
II. MODELING
Within this section, the approach of modeling theoff-gas is described as an enhancement to the EAFprocess model developed by Logar et al.[2,3] Therefore,the paper follows the basic assumptions and simplifica-tions as addressed in part 1[2] and part 2[3] of the EAFmodel publication from Logar et al., which are alsovalid for this enhanced model and will not be repeated inthis paper. The EAF is divided into eight different zones:
(1) Solid scrap (sSc),(2) Liquid scrap (lSc),(3) Solid slag (sSl),(4) Liquid slag (lSl),(5) Gas phase (gas),(6) Walls (wall),(7) Electrode/s (el),(8) Electric arc/s (arc).
Each zone and chemical component has assignedphysical properties, i.e., specific heat capacity Cp,density q, molar mass M, etc. The values used for theparameters are listed in Appendix in Table V.
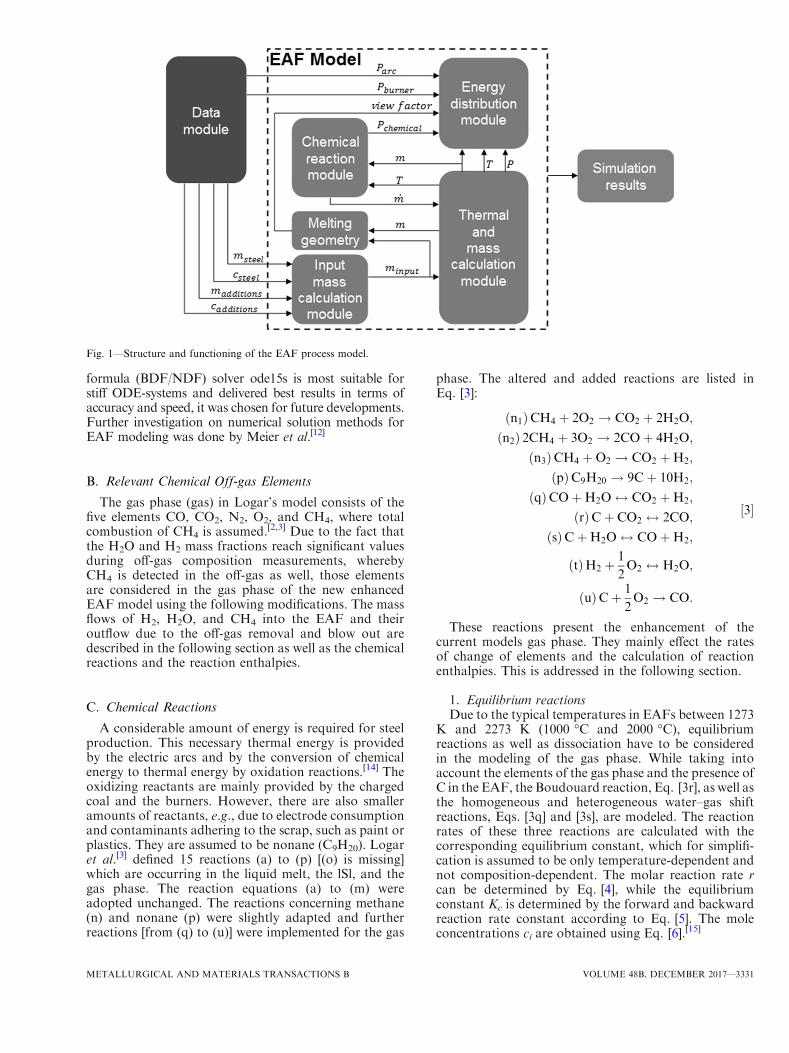
Within and between the defined phases inside theEAF vessel, thermo-chemical reactions, as well as heatand mass transfer take place. Figure 1 gives a schematic
overview of the enhanced model structure and the basicfunctioning.
A. New Model Implementation
To overcome the contradiction between simulationaccuracy, simulation calculation time, and numericalintegration time steps, the EAF model has been newlyimplemented to use efficient ODE-solving methodswithin the software MATLAB. While Logar et al.[2] useda fixed step Euler method with a chosen time step of10�4 seconds, numerical integration methods with avariable calculation of the integration time step haveproven their efficiency to solve complex ODE-systems.[12]
The usage of the MATLAB ODE-solving methodsrequired several model modifications. Sudden changescaused by if-else conditions were replaced by continuousalgorithms to realize on/off behavior. In detail, thevariable that has to be switched is multiplied with amodified hyperbolic tangent function, which results invalues of zero and one with a continuous transition.Furthermore, the calculation of the melting geometry isperformed by modeling the scrap heap as a body ofrevolution around the middle axis of the EAF. A variableangle of the borehole in the scrap is used to determine thegeometrical data for the view factor calculation.[13]
As a consequence of mass transfer between thedifferent phases, mixing temperatures have to be calcu-lated. Because the step size is not directly known duringthe simulation, the calculation of the mixing tempera-ture is directly integrated into the calculation of thetemperature change rates. In a general way, this isdetermined according to Eq. [1]:
dTxx
dt¼
_Qxx � ðTxx � TadditionÞCp;addition _maddition
mxxCp;xx: ½1�
A phase xx (with mass mxx, temperature Txx, and heatcapacity Cp,xx) changes its temperature due to adding amass (with mass flow _maddition; temperature Taddition, and
heat capacity Cp,addition) by the temperature rate dTxx
dt:
The resulting net heat flow is _Qxx; which is positive ornegative, depending on the temperature difference(Txx � Taddition). One example is the temperaturechange of the liquid steel melt (lSc), which is calculatedaccording to Eq. [2]:
dTlSc
dt¼ 1
mlScCp;lSc
_QlSc � _msolidifyksSc þ TlSc � Tmelt;sSc
� �_msScCp;lSc
�
� TlSc � Tairð Þ _mO2�lanceCp;O2þ _mC�injCp;C
� ��;
;
½2�
where _QlSc denotes the net heat flow of the liquid melt,_msolidify represents a negative mass flow to the scrap ifsolidification occurs and ksSc is the latent heat offusion, _msSc is the negative mass change rate of scrap,_mO2�lance and _mC�inj are the injection of oxygen andcarbon into the melt, and Ti are the correspondingtemperatures with the ambient temperature Tair.After the re-implementation, it was found that the
ODE-system of the model is stiff. As the multi-step back-ward differentiation formula/numerical differentiation
3330—VOLUME 48B, DECEMBER 2017 METALLURGICAL AND MATERIALS TRANSACTIONS B
formula (BDF/NDF) solver ode15s is most suitable forstiff ODE-systems and delivered best results in terms ofaccuracy and speed, it was chosen for future developments.Further investigation on numerical solution methods forEAF modeling was done by Meier et al.[12]
B. Relevant Chemical Off-gas Elements
The gas phase (gas) in Logar’s model consists of thefive elements CO, CO2, N2, O2, and CH4, where totalcombustion of CH4 is assumed.[2,3] Due to the fact thatthe H2O and H2 mass fractions reach significant valuesduring off-gas composition measurements, wherebyCH4 is detected in the off-gas as well, those elementsare considered in the gas phase of the new enhancedEAF model using the following modifications. The massflows of H2, H2O, and CH4 into the EAF and theiroutflow due to the off-gas removal and blow out aredescribed in the following section as well as the chemicalreactions and the reaction enthalpies.
C. Chemical Reactions
A considerable amount of energy is required for steelproduction. This necessary thermal energy is providedby the electric arcs and by the conversion of chemicalenergy to thermal energy by oxidation reactions.[14] Theoxidizing reactants are mainly provided by the chargedcoal and the burners. However, there are also smalleramounts of reactants, e.g., due to electrode consumptionand contaminants adhering to the scrap, such as paint orplastics. They are assumed to be nonane (C9H20). Logaret al.[3] defined 15 reactions (a) to (p) [(o) is missing]which are occurring in the liquid melt, the lSl, and thegas phase. The reaction equations (a) to (m) wereadopted unchanged. The reactions concerning methane(n) and nonane (p) were slightly adapted and furtherreactions [from (q) to (u)] were implemented for the gas
phase. The altered and added reactions are listed inEq. [3]:
n1ð ÞCH4 þ 2O2 ! CO2 þ 2H2O;
n2ð Þ 2CH4 þ 3O2 ! 2COþ 4H2O;
n3ð ÞCH4 þO2 ! CO2 þH2;
ðpÞC9H20 ! 9Cþ 10H2;
ðqÞCOþH2O $ CO2 þH2;
ðrÞCþ CO2 $ 2CO;
ðsÞCþH2O $ COþH2;
ðtÞH2 þ1
2O2 $ H2O;
ðuÞCþ 1
2O2 ! CO:
½3�
These reactions present the enhancement of thecurrent models gas phase. They mainly effect the ratesof change of elements and the calculation of reactionenthalpies. This is addressed in the following section.
1. Equilibrium reactionsDue to the typical temperatures in EAFs between 1273
K and 2273 K (1000 �C and 2000 �C), equilibriumreactions as well as dissociation have to be consideredin the modeling of the gas phase. While taking intoaccount the elements of the gas phase and the presence ofC in the EAF, the Boudouard reaction, Eq. [3r], as well asthe homogeneous and heterogeneous water–gas shiftreactions, Eqs. [3q] and [3s], are modeled. The reactionrates of these three reactions are calculated with thecorresponding equilibrium constant, which for simplifi-cation is assumed to be only temperature-dependent andnot composition-dependent. The molar reaction rate rcan be determined by Eq. [4], while the equilibriumconstant Kc is determined by the forward and backwardreaction rate constant according to Eq. [5]. The moleconcentrations ci are obtained using Eq. [6].[15]
Fig. 1—Structure and functioning of the EAF process model.
METALLURGICAL AND MATERIALS TRANSACTIONS B VOLUME 48B, DECEMBER 2017—3331
r ¼ kfYI
i¼1
ci½ �v0i � kb
YI
i¼1
ci½ �v00i ; ½4�
Kc ¼kfkb
; ½5�
ci ¼mi
MiVgas: ½6�
Here, v0i and v00i represent the stoichiometric coeffi-cients of the forward (¢) and backward (¢¢) reaction.
It is not possible to easily derive kf and kb from Kc orother data available to the model. Therefore, to be ableto solve the equation, the backward reaction rateconstant is assumed to be kb = 1, leading to thesimplified Eq. [7]. In addition, in Eq. [10] an empiricalvelocity coefficient is added.
r ¼ Kc
YI
i¼1
ci½ �v0i �
YI
i¼1
ci½ �v00i : ½7�
Kc can be determined by the idea of the free Gibbsenergy minimization through Eqs. [8] and [9]:
Kp ¼ exp�DRG
0
RmT
� �¼
Y
i
pip0
� �mi
e
; ½8�
Kc ¼ Kpp0
RmT
� �P mi
; ½9�
where Kp is the standard equilibrium constant, DRG0
represents the free standard enthalpy, p0 is the pressureat standard conditions, pi is the partial pressure, andRm is the molar gas constant.
The equilibrium constant Kc is pre-calculated for eachof the three equilibrium reactions with the help of thechemical equilibrium toolbox MediumModel[16] withinMATLAB, based on the ‘‘NASA Glenn Coefficients forCalculating Thermodynamic Properties of IndividualSpecies’’ and stored in a temperature-dependent data-base. The database is evaluated at each time step with acorresponding temperature to obtain the equilibriumconstant Kc-(n) for the equilibrium reaction [n = (q), (r),and (s)]. The mass change for each element is thencalculated using Eq. [10]:
dmi
dt¼ rðnÞmiVðnÞMikdgas�ðnÞ; ½10�
where V(n) is the available volume for the reaction andkdgas-(n) is an empirical velocity coefficient. Thesevelocity coefficients either were taken from Logaret al.[3] or were developed during the parameterizationof the modified model using the available operatingdata. They are listed in Table II in Appendix.
In contrast to the described equilibrium reactionsabove, the dissociation of H2O, which is the reversereaction of Eq. [3t], is modeled using a simplifiedempirical approach which is described later.
2. Rate of change of carbon (C)Since carbon is involved in reactions within the gas
phase, the equations of the carbon mass transfer were
modified in comparison to those of Logar et al.[3] Inaccordance with Logar and for a better overview, themass flows of the respective elements i are divided basedon their physical–chemical cause. These individual massflows are denoted by the variable xidj (j = number forthe individual mass flow). With their summation, the netmass flow of the element i ( _mi) is determined.The rate of change of carbon is calculated for three
different masses of C in the EAF: first, the mass of Cpresent in the EAF (mC-L), second, the dissolved C in theliquid melt (mC-D), and third, the C from charge coal(mcoal).The following mechanisms are relevant for the mass of
C in the EAF (mC-L): C is injected in the furnace (x1d1).This injected C and the C present in the EAF are used inthe decarburization of the melt (x1d2). Furthermore, C isdissolved in the melt (x1d3). C is formed during thedissociation of combustible material. This amount andthe C from charged coal are available for further reactions(x1d4). During the oxidation of C to CO with the oxygenof the gas phase (x1d5) and with leak air (x1d6), C is used.Finally, C is taking part in the heterogeneous water–gasreaction Eq. [3s] (x1d7). The rate of change of C present inthe EAF ( _mC�L) is given by Eq. [11]:
x1d1 ¼ _mC�inj;
x1d2 ¼ �kdC�LmFeOm0:75C�L
mlSl� 0:6x1d1
� �1� VsSc
VsSc;basket
� �3
;
x1d3 ¼kdC�3m
0:75C�LTlScCp;lSc
Tair
Tmelt;sSc
kC þ Cp;C Tmelt;sSc � Tair
� � ;
x1d4 ¼ �x1coald1 � _mcomb9MC
MC9H20
;
x1d5 ¼ �K4sSc�lSckdC�5m
0:75C�Lc
0:5O2�gas;
x1d6 ¼0; mC<1 kg;
�wO2�airKleakair�O2�COð1Þ _mleakair2MC
MO2
; mC>1 kg;
(
x1d7 ¼ �rðsÞVðsÞMCkdgas�ðsÞ;
_mC�L ¼X7
j¼1
x1dj:
½11�The equation for the variable x1d2 is an empirical
equation, which was developed during the parameteriza-tion of the adapted model using the available operatingdata. kdC-L is the constant decarburization velocity andmlSl is the total slag mass. The second summand (0.6x1d1)represents a direct reaction of injected C with FeO. VsSc isthe actual bulk volume of the sSc and VsSc,basket is theinitial charged volume of sSc. The factor causes thechemical reaction in the simulation to start with increas-ing molten mass. If the furnace is full of scrap, theinjected C does not reach the melt surface.The equation for x1d3 is also an empirical equation,
which resulted from the adaptation of Logar’s equationduring parameterization. The equation is dependent onthe constant dissolving velocity kdC-3, the temperaturesof the melt TlSc, of the ambient air Tair and the scrap’sliquidus temperature Tmelt,sSc, the heat capacities of C
3332—VOLUME 48B, DECEMBER 2017 METALLURGICAL AND MATERIALS TRANSACTIONS B
Cp,C and the melt Cp,lSc, and the latent heat of fusion ofC kC.
The combustible material consists of nonane and isdenoted by _mcomb:
kdC-5 is the constant C oxidation velocity. KsSc–lSc isthe exposure coefficient of the liquid bath, because thereactionary surface of the melt decreases with increasingsSc volume. cO2�gas is the concentration of oxygen in thegas phase.
wO2�air is the mass fraction of O2 in the ambient air,which is sucked in as leak air _mleakair through the slag doorand other gaps. Kleakair�O2�COð1Þ is the fraction of leak airavailable for direct C combustion to CO. The equation isdivided into two cases, because otherwise the simulationwould lead to negative masses as calculation results.
The calculations of x1d5 and x1d6 are based on theempirical reaction kinetic approach according toEq. [12] for the reaction given by Eq. [13]:
� d[cA�dt
¼ k cA½ �mA cB½ �mB ; ½12�
mAj jAþ mBj jB ! mCj jCþ mDj jD; ½13�
where A and B are reactants with the concentration cAor cB. The stoichiometric coefficients are signified withm, while k is the corresponding reaction rate.
The calculation of the molar reaction rate r(s) in x1d7follows Eqs. [14] and [15]. The database for Kc isevaluated for the assumed average temperature betweenthe gas phase and the lSc. The reaction volume V(s) isdetermined for each equilibrium reaction n by Eq. [16]as a fraction of the total gas volume Vgas.
Kc�ðsÞ ¼ fTgas þ TlSc
2
� �; ½14�
rðsÞ ¼ Kc�ðsÞc�1H2O
� cCOcH2; ½15�
VðnÞ ¼ xðnÞVgas: ½16�
Only in case of a negative relative furnace pressure pr,the total mass flow of leak air enters the furnace. This isdetermined by Eq. [17] with KPR representing a constantdefining the ratio between mass flow and pressure:
_mleakair ¼0; pr>0;KPRpr; pr<0:
�½17�
The rate of change of C from coal _mcoal is determinedby the following mechanisms: C is charged with coalwithin the scrap baskets. The reactive mass flow of C(x1coald1) is transferred from mcoal to mC-L for decar-burization, dissolving, and combustion. Analogous tox1d5 and x1d6, the amount of C from coal decreases dueto the combustion of C to CO with the oxygen from thegas phase (x1coald2) and from the leak air (x1coald3). Cis taking part in the Boudouard reaction Eq. [3r](x1coald4). The mass change _mcoal is given by Eq. [18]:
x1coald1 ¼ �kdC�4m0:75coal
ffiffiffiffiffiffiffiffiffiffiffiffiffiffiffiffiffiffiffiffiffiffiffiffiffiffiffi
1� VsSc
VsSc;basket
s
;
x1coald2 ¼ �kdC�6m0:75coalc
0:5O2�gas;
x1coald3 ¼0; mcoal<1 kg;
�wair�O2Kleakair�O2�COð2Þ _mleakair
2MC
MO2
; mcoal>1 kg;
(
x1coald4 ¼ �rðrÞVðrÞMCkdgas�ðrÞ;
_mcoal ¼X4
j¼1
x1coaldj:
½18�
kdC-4 and kdC-6 represent the coal reactivity coeffi-cients. The equations for x1coald1 and x1coald2 aredeveloped empirical equations, which were validatedby means of parametrization. The calculation of r(r)follows Eqs. [19] and [20], whereby the database for Kc
is evaluated for the assumed average temperature.
Kc�ðrÞ ¼ fTgas þ TlSc
2
� �; ½19�
rðrÞ ¼ Kc�ðrÞc�1CO2
� c2CO: ½20�
The rate of change of dissolved C in the liquid melt( _mC�D) is determined according to Logar’s descriptionwith a few enhancements and is given by Eq. [21]:
x2d1 ¼ �kdC�D XC � XeqC
� �;
x2d2 ¼ �kdC�1 XC � XeqC
� �_mO2;lanceKO2�CO
2MC
MO2
;
x2d3 ¼ �x1d3;
x2d4 ¼ �kdMn�1 XMnO � XeqMnO�1
� � MC
MMnO;
x2d5 ¼ �kdC�2 XC � XeqC
� �_mO2�lanceKO2�CO2
2MC
MO2
;
_mC�D ¼X5
j¼1
x2dj; ½21�
where Xi and Xeqi are the molar fractions and equilib-
rium molar fractions, respectively, kdC-D is the FeOdecarburization rate, kdC-1 and kdC-2 are the oxidationrates of C to CO and CO2, respectively, kdMn-1 is theMnO decarburization rate, and KO2�CO and KO2�CO2
are representing the fractions of the lanced oxygenused for direct oxidization. The two change rates _mC�L
and _mC�D can be further improved by the solutionpresented by Fathi et al.[5] All other rates of changefor the components of the steel and slag zone are notchanged and are implemented according to Logaret al.[3]
3. Rate of change of carbon monoxide (CO)The rate of change of carbon monoxide in the gas
phase ( _mCO) is implemented by nine mechanisms: CO isextracted with the off-gas (x9d1) and through openings(x9d4). CO is produced during the incomplete oxidationof C from coal, injected carbon (x9d2), and CH4 (x9d8).Furthermore, sources are electrode oxidation and the
METALLURGICAL AND MATERIALS TRANSACTIONS B VOLUME 48B, DECEMBER 2017—3333
oxidation of coal (x9d6). CO is consumed by the COpost-combustion (x9d3) and changed due to the equilib-rium reactions of the homogeneous water–gas shiftreaction (x9d5), the Boudouard reaction (x9d7), and theheterogeneous water–gas reaction (x9d9). The rate ofchange of CO is obtained by Eq. [22]:
x9d1¼� hdu1mCO
ðkuu2þhdÞmgas;
x9d2¼� x1d2þx1d5þx1d6þx1coald2þx1coald3ð
þx2d1þx2d2þx2d4ÞMCO
MC;
x9d3¼�kdCO�1mCOc0:5O2�gas� _mO2�postKO2�post�CO
2MCO
MO2
;
x9d4¼�KPRpr
mCO
mgas; pr>0;
0; pr<0;
(
x9d5¼ rðqÞVðqÞMCOkdgas�ðqÞ;
x9d6¼� _melMCO
MC;
x9d7¼�x1coald42MCO
MC;
x9d8¼� x15d5þx15d8ð Þ MCO
MCH4
;
x9d9¼�x1d7MCO
MC;
_mCO¼X9
j¼1
x9dj: ½22�
The equation for x9d1 is equal to Logar et al.’s[3]
implementation with hd being the characteristic dimen-sion of the duct area at the slip gap, u1 is the off-gasmass flow, ku is a dimensionless constant and set to thesame value as proposed by Bekker et al.,[17] and u2 is theslip gap width.
kdCO-1 is the reaction velocity of the CO post-com-bustion. In order to promote this reaction in the EAF, anoxygen mass flow _mO2�post is injected via lance. Further-more, KO2�post�CO is the fraction of this post-combustionO2 mass flow used for CO post-combustion.
The outflow of gas through openings is modeledanalogously to the inflow of leak air in Eq. [16]. If anoverpressure prevails in the vessel, furnace gas is discharged.
The reaction rate r(q) of x9d5 is determined with theequilibrium constant Kc-(q) by Eqs. [23] and [24]:
Kc�ðqÞ ¼ f Tgas
� �; ½23�
rðqÞ ¼ Kc�ðqÞc�1COc
�1H2O
� cCO2cH2
: ½24�
kdgas-(q) is the reaction velocity of the homogeneouswater–gas shift reaction and is—like all other reactionvelocities kd—given in Table II in Appendix.
The graphite electrode oxidizes during the EAFoperation. A minor mass of C ( _mel) releases, whichcan react with the gas phase. The correspondingcalculation is described in Logar et al.[3]
4. Rate of change of carbon dioxide (CO2)The rate of change of carbon dioxide in the gas phase
( _mCO2) is determined by the followingmechanisms: CO2 is
extracted with the off-gas (x10d1) and flows out throughopenings (x10d7). CO2 arises from CO post-combustion(x10d2), CH4 combustion (x10d4 and x10d6), and fromdissolved C oxidation (x10d8). CO2 takes part in theequilibrium reactions of the homogeneouswater–gas shiftreaction (x10d3) and the Boudouard reaction (x10d5). Therate of change of CO2 is obtained by Eq. [25]:
x10d1 ¼ � hdu1mCO2
ðkuu2 þ hdÞmgas;
x10d2 ¼ �MCO2
MCOx9d3;
x10d3 ¼ �x9d5MCO2
MCO;
x10d4 ¼ �x15d4MCO2
MCH4
;
x10d5 ¼ x1coald4MCO2
MC;
x10d6 ¼ �x15d6MCO2
MCH4
;
x10d7 ¼�KPRpr
mCO2
mgas; pr>0;
0; pr<0;
(
x10d8 ¼ �x2d5MCO2
MC;
_mCO2¼
X8
j¼1
x10dj:
½25�
5. Rate of change of nitrogen (N2)The rate of change of nitrogen ( _mN2
) is determined bythe extraction with the off-gas (x11d1) and the outflowthrough openings (x11d2 for pr> 0). For a negativerelative pressure, N2 is sucked in with the leak air (x11d2for pr< 0). Furthermore, N2 is injected together with theinjected O2, CH4, and C mass flows (x11d3). Compared toLogar et al.,[3] the rate of change of N2 is supplementedby x11d3 and determined by Eq. [26]:
x11d1 ¼ � hdu1mN2
ðkuu2 þ hdÞmgas;
x11d2 ¼�KPRpr
mCO
mgas; pr>0;
wN2�air _mleakair; pr<0;
(
x11d3 ¼ _mCH4�injwN2�in�natgas
wCH4�in�natgas
þ _mO2�lance þ _mO2�post þ _mO2�CH4�inj
� �
wN2�in�oxygen
wO2�in�oxygen;
_mN2¼
X3
j¼1
x11dj;
½26�
where all wi are the mass fractions of the following massflows. wN2�air is the mass fraction of N2 in the leak air,
3334—VOLUME 48B, DECEMBER 2017 METALLURGICAL AND MATERIALS TRANSACTIONS B
wN2�in�natgas and wCH4�in�natgas are the mass fractions ofN2 and CH4 in the injected natural gas, respectively,wN2�in�oxygen and wO2�in�oxygen are the mass fractions ofN2 and O2 in the injected oxygen mass flows. Therefore,the considered O2 is injected via lance for the reductionof Fe ( _mO2�lance), via tuyere for post-combustion( _mO2�post), and via the burner system ( _mO2�CH4�inj).
6. Rate of change of oxygen (O2)The rate of change of oxygen in the gas zone ( _mO2
) isdetermined by the following mechanisms: O2 is extractedwith the off-gas (x12d1) and flows out through openings inthe EAF vessel (x12d7 for pr> 0). For a negative relativepressure, O2 is sucked in with leak air (x12d7 for pr< 0).Further, a residual O2 mass flow remains of all O2 lancedinto the gas phase (x12d2) due to incomplete oxidationreactions, e.g., during the oxidation of dissolved C in theliquid melt (x2d2 and x2d5), Si (x3d2), Cr (x5d2), P (x6d2),and Fe (x7d3). O2 is injected with the natural gas thoughthe burner system into the EAF ( _mO2�CH4�inj), whichreacts with CH4 in different burner zones (x15di) andleaves a residual O2 mass flow (x12d3). O2 is injected( _mO2�post) for CO post-combustion (x9d3) and leaves aresidualmass flow (x12d4). Theoxidation of the electrodesconsumesO2 (x12d5) aswell as the combustion of coal andC in the EAF (x12d6). In addition, the post-combustion ofCH4 (x12d8) also uses up O2. The post-combustion of H2
(x13d4) is combined with the dissociation of H2O (x14d5)in the change of O2 (x12d9). The total rate of change of O2
is determined with Eq. [27]:
x12d1 ¼� hdu1mO2
ðkuu2 þ hdÞmgas;
x12d2 ¼ _mO2�lanceþx2d2MO2
2MCþx2d5
MO2
MCþx3d2
MO2
MSi
þx5d23MO2
4MCrþx6d2
5MO2
4MP�x7d3
MO2
2MFeO;
x12d3 ¼ _mO2�CH4�injþx15d42MO2
MCH4
þx15d53MO2
2MCH4
þx15d6MO2
MCH4
;
x12d4 ¼ _mO2�postþx9d3MO2
2MCO;
x12d5 ¼ _melMO2
2MC;
x12d6 ¼ x1d5þx1d6þx1coald2þx1coald3ð ÞMO2
2MC;
x12d7 ¼�KPRpr
mO2
mgas; pr>0;
wair�O2_mleakair; pr<0;
(
x12d8 ¼ x15d83MO2
2MCH4
;
x12d9 ¼ x13d4MO2
2MH2
�x14d5MO2
2MH2O;
_mO2¼X9
j¼1
x12dj:
½27�
7. Rate of change of hydrogen (H2)The rate of change of hydrogen in the gas zone ( _mH2
)is determined by the following mechanisms: H2 is
extracted with the off-gas (x13d1) and flows outthrough openings (x13d2). There is an assumed H2
residual mass flow caused by an incomplete CH4
combustion from burners (x13d3). H2 is producedduring the dissociation of combustible materials(x13d7) and H2 is consumed during post-combustion(x13d4). Furthermore, H2 takes part in the equilibriumreactions of the heterogeneous (x13d5) and homoge-neous water–gas reactions (x13d6). The rate of changeis obtained by Eq. [28]:
x13d1 ¼ � hdu1mH2
ðkuu2 þ hdÞmgas;
x13d2 ¼�KPRpr
mH2
mgas; pr>0;
0; pr<0;
(
x13d3 ¼ �x15d62MH2
MCH4
;
x13d4 ¼ �kdH2�postmH2c0:5O2�gas;
x13d5 ¼ �x1d7MH2
MC;
x13d6 ¼ �x9d5MH2
MCO;
x13d7 ¼ � _mcomb10MH2
MC9H20
;
_mH2¼
X7
j¼1
x13dj;
½28�
where kdH2�post is the reaction rate constant of the H2
post-combustion.
8. Rate of change of water vapor (H2O)The rate of change of water vapor in the gas zone
( _mH2O) is determined by the following mechanisms:H2O is extracted with the off-gas (x14d1) and flowsout through openings (x14d2) and enters the EAF viathe electrode cooling (x14d3). To decrease the elec-trode consumption, the graphite electrode is equippedwith a water spray cooling system at its top. Thewater ( _mwater�in) flows down the electrode and evap-orates, whereby a part of the steam is assumed toenter the EAF vessel. Furthermore, H2O is a productof the CH4 (x14d4 and x14d6) and H2 combustion(x14d7). H2O takes part in the equilibrium reactionsof the heterogeneous (x14d8) and homogeneouswater–gas reactions (x14d9). x14d5 describes a simpli-fied exponential approach for the dissociation ofwater, as the dissociation is encouraged by atten-dance of metal oxides.[18] The rate of change isobtained by Eq. [29]:
x14d1 ¼ � hdu1mH2O
ðkuu2 þ hdÞmgas;
x14d2 ¼�KPRpr
mH2O
mgas; pr>0;
0; pr<0;
(
x14d3 ¼ � _mwater�in;
x14d4 ¼ �x15d82MH2O
MCH4
;
METALLURGICAL AND MATERIALS TRANSACTIONS B VOLUME 48B, DECEMBER 2017—3335
x14d5 ¼ �kdH2O expmH2O
5
�;
x14d6 ¼ � x15d4 þ x15d5ð Þ 2MH2O
MCH4
;
x14d7 ¼ �x13d4MH2O
MH2
;
x14d8 ¼ x1d7MH2O
MC;
x14d9 ¼ �x9d5MH2O
MCO;
_mH2O ¼X9
j¼1
x14dj:
½29�
9. Rate of change of methane (CH4)The rate of change of methane in the gas zone ( _mCH4
)is determined by the following mechanisms: CH4 isextracted with the off-gas (x15d1) and flows out throughopenings (x15d2). Natural gas, which consists mainly ofCH4, is injected through the burner system (x15d3). TheCH4 is assumed to react in three different ways (x15d4,x15d5, and x15d6) and, finally, CH4 is post-combusted(x15d7). The rate of change is obtained by Eq. [30]:
x15d1 ¼� hdu1mCH4
ðkuu2þ hdÞmgas;
x15d2 ¼�KPRpr
mCH4
mgas; pr>0;
0; pr<0;
(
x15d3 ¼ _mCH4�inj;
x15d4 ¼�Kburn�ðn1Þx15d3; Z�ZSt�ðn1Þ;
�KO2�CH4�injKburn�ðn1Þ _mO2�CH4�injMCH4
2MO2
; Z>ZSt�ðn1Þ;
(
x15d5 ¼�Kburn�ðn2Þx15d3; Z�ZSt�ðn2Þ;
�KO2�CH4�injKburn�ðn2Þ _mO2�CH4�inj2MCH4
3MO2
; Z>ZSt�ðn2Þ;
(
x15d6 ¼�Kburn�ðn3Þx15d3; Z�ZSt�ðn3Þ;
�KO2�CH4�injKburn�ðn3Þ _mO2�CH4�injMCH4
MO2
; Z>ZzSt - (n3);
(
x15d7 ¼�kdCH4�postmCH4c1:5O2�gas;
_mCH4¼X7
j¼1
x15dj;
½30�
where kdCH4�post represents the reaction rate of CH4
post-combustion. It is assumed that there are three differentreaction zones of the burner flame due to the non-premixedsupply of CH4 and O2. Within the reaction volumes, therespective reactions of Eqs. [6n1], [6n2], and [6n3] take place.Therefore, Kburn-(n1), Kburn-(n2), and Kburn-(n3) are the corre-sponding percentages of the reaction volumes.
The reaction rates are limited by the ratio of O2 toCH4. The stoichiometric mixture fraction ZSt-(ni) accord-ing to Peters[19] is compared with the actual mixturefraction Z of the supplied gas mass flows, which isdefined according to Eq. [31]:
Z ¼ _mCH4�inj
_mCH4�in þ _mO2�CH4�inj: ½31�
The stoichiometric mixing fraction ZSt-(ni) is obtainedin general by Eq. [32] and for the three reactionsaccording to Eqs. [33] through [35]:
ZSt�ðniÞ ¼mCH4;iMCH4
mCH4;iMCH4þ mO2;iMO2
wCH4�in�natgas
wO2�in�oxygen
; ½32�
ZSt�ðn1Þ ¼MCH4
MCH4þ 2MO2
wCH4�in�natgas
wO2�in�oxygen
; ½33�
ZSt�ðn2Þ ¼MCH4
MCH4þ 3
2MO2
wCH4�in�natgas
wO2�in�oxygen
; ½34�
ZSt�ðn3Þ ¼MCH4
MCH4þMO2
wCH4�in�natgas
wO2�in�oxygen
: ½35�
For Z £ ZSt, the natural gas mass flow x15d3 iscompletely consumed and for Z>ZSt the reaction rateis limited by the available fraction of the burner oxygen.KO2�CH4�inj is the fraction of the injected O2 mass flowavailable for direct CH4 combustion. This empirical factoris calculated according to the coverage of the burnernozzle openings by scrap (e.g., after scrap charging). Inthis case, only an insufficient mixing of the two gases CH4
and O2 is assumed, which leads to an incomplete reactionof CH4. KO2�CH4�inj is calculated with Eq. [36], which hasbeen empirically derived based on the scrap meltdownprogress in front of the burner nozzle:
KO2�CH4�inj ¼ 1� 0:75msSc
msSc;basket
� �2
; ½36�
where msSc,basket represents the mass of scrap chargedinto the EAF.Together with the scrap, combustible materials like
grease, oils, and paints enter into the EAF. Thesematerials are taken into account as a mass of nonane(C9H20) and it is assumed that C9H20 dissociates beforefurther reactions take place. The dissociation follows theempirical approach in Eq. [37], which has been adoptedfrom Logar et al.[3] and adjusted to improve theagreement of simulation and measurement results.
_mcomb ¼ �kdcombm0:75comb 1:1� VsSc
VsSc;basket
� �2
: ½37�
D. Reaction Enthalpies
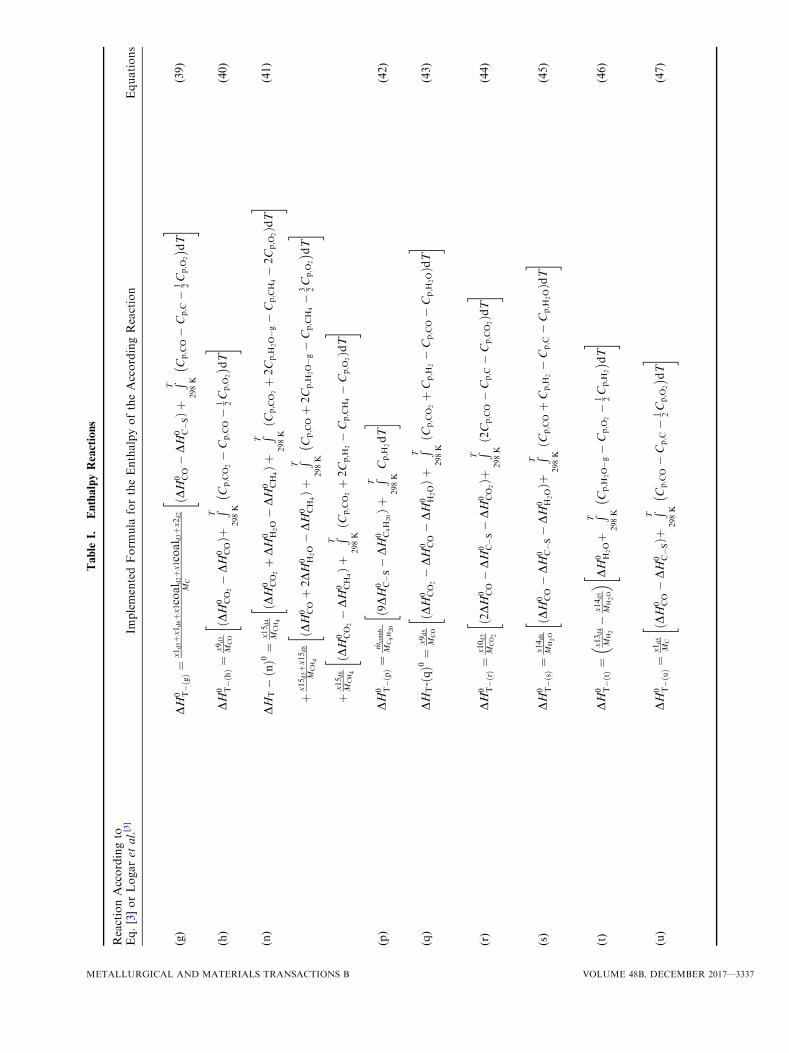
Chemical reactions lead to a conversion of energy.Exothermic or endothermic reactions are releasing orconsuming energy to the corresponding zone or phase inwhich the reaction takes place. The enthalpy of the reactionsis therefore computedaccording toLogar et al.[3] byEq. [39]:
DH0T ¼
XDH0
298 ðproductsÞ �X
DH0298 ðreactantsÞ
þZT
298 K
XCp ðproductsÞ �
XCp ðreactantsÞ
h idT;
½38�
3336—VOLUME 48B, DECEMBER 2017 METALLURGICAL AND MATERIALS TRANSACTIONS B
Table
I.EnthalpyReactions
ReactionAccordingto
Eq.[3]orLogaret
al.[3]
ImplementedForm
ula
fortheEnthalpyoftheAccordingReaction
Equations
(g)
DH
0 T�ðgÞ¼
x1d5þx1d6þx1coal d
2þx1coal d
3þx2d2
MC
ðDH
0 CO�DH
0 C�SÞþ
RT
298K
Cp;CO�C
p;C�
1 2C
p;O
2
�� d
T
"#
(39)
(h)
DH
0 T�ðhÞ¼
x9d3
MCO
ðDH
0 CO
2�DH
0 COÞþ
RT
298K
Cp;CO
2�C
p;CO�
1 2C
p;O
2
�� d
T
"#
(40)
(n)
DH
T�ðnÞ0
¼x15d4
MCH4
ðDH
0 CO
2þDH
0 H2O�DH
0 CH
4Þþ
RT
298K
ðCp;CO
2þ2C
p;H
2O�g�C
p;CH
4�2C
p;O
2ÞdT
"#
þx15d5þx15d8
MCH4
ðDH
0 COþ2DH
0 H2O�DH
0 CH
4Þþ
RT
298K
Cp;COþ2C
p;H
2O�g�C
p;CH
4�
3 2C
p;O
2
�� dT
"#
þx15d6
MCH4
ðDH
0 CO
2�DH
0 CH
4Þþ
RT
298K
ðCp;CO
2þ2C
p;H
2�C
p;CH
4�C
p;O
2ÞdT
"#
(41)
(p)
DH
0 T�ðpÞ¼
_ mcomb
MC9H20
ð9DH
0 C�S�DH
0 C9H
20Þþ
RT
298K
Cp;H
2dT
"#
(42)
(q)
DH
T-ðq
Þ0¼
x9d5
MCO
ðDH
0 CO
2�DH
0 CO�DH
0 H2OÞþ
RT
298K
ðCp;CO
2þC
p;H
2�C
p;CO�C
p;H
2OÞdT
"#
(43)
(r)
DH
0 T�ðrÞ¼
x10d5
MCO2
ð2DH
0 CO�DH
0 C�S�DH
0 CO
2Þþ
RT
298K
ð2C
p;CO�C
p;C�C
p;CO
2ÞdT
"#
(44)
(s)
DH
0 T�ðsÞ¼
x14d8
MH2O
ðDH
0 CO�DH
0 C�S�DH
0 H2OÞþ
RT
298K
ðCp;COþC
p;H
2�C
p;C�C
p;H
2OÞdT
"#
(45)
(t)
DH
0 T�ðtÞ¼
x13d4
MH2
�x14d5
MH2O
�
DH
0 H2Oþ
RT
298K
Cp;H
2O�g�C
p;O
2�
1 2C
p;H
2
�� dT
"#
(46)
(u)
DH
0 T�ðuÞ¼
x1d5
MC
ðDH
0 CO�DH
0 C�SÞþ
RT
298K
Cp;CO�C
p;C�
1 2C
p;O
2
�� dT
"#
(47)
METALLURGICAL AND MATERIALS TRANSACTIONS B VOLUME 48B, DECEMBER 2017—3337
with DH0298 being the standard enthalpy of formation
at standard temperature and pressure. By using theactual variables and reaction indices presented inEq. [3] and by Logar et al.,[3] the change of enthalpy isobtained for the implemented reactions according toEqs. [39] through [47] in Table I.
Compared to Logar et al.,[3] the enthalpy of thereaction of the combustibles C9H20 is calculated accord-ing to the dissociation reaction in Eq. [3p], where C9H20
and C are assumed with standard temperature. All otherreaction enthalpies DH0
T�ðaÞ to DH0T�ðmÞ are implemented
according to Logar et al.[3] with adaptions in theequations for DH0
T�ðgÞ and DH0T�ðhÞ:
The energy of the chemical reactions are allocated tothe heat balance of the corresponding zones lSc and gasvia the heats QlSc-chem and Qgas-chem according toEqs. [48] and [49]:
QlSc�chem ¼XðmÞ
vari¼ðaÞDH0
T�ðvariÞ � DH0T�ðhÞ; ½48�
Qgas�chem ¼XðuÞ
vari¼ðnÞDH0
T�ðvariÞ þ DH0T�ðhÞ; ½49�
where Qgas-chem is a further summand in the balance ofQgas, which is implemented according to Logar et al.[2]
III. RESULTS AND DISCUSSION
This section present the simulation results, which arerelevant for the modeling and simulation of the EAF
off-gas. The results are compared to measured data froman industrial scale EAF with a tapping weight ofapproximately 140 t. The process simulation was per-formed with MATLAB R2015b on a PC with 3.4 GHz,16 GB RAM, and Windows 7 64 bit. The relativeintegration tolerance was set to 10�9. For the simula-tion, the input data for scrap and operational data forpower and mass flows into the EAF were used, while thehot heel was assumed constant with a mass of 30 t. The
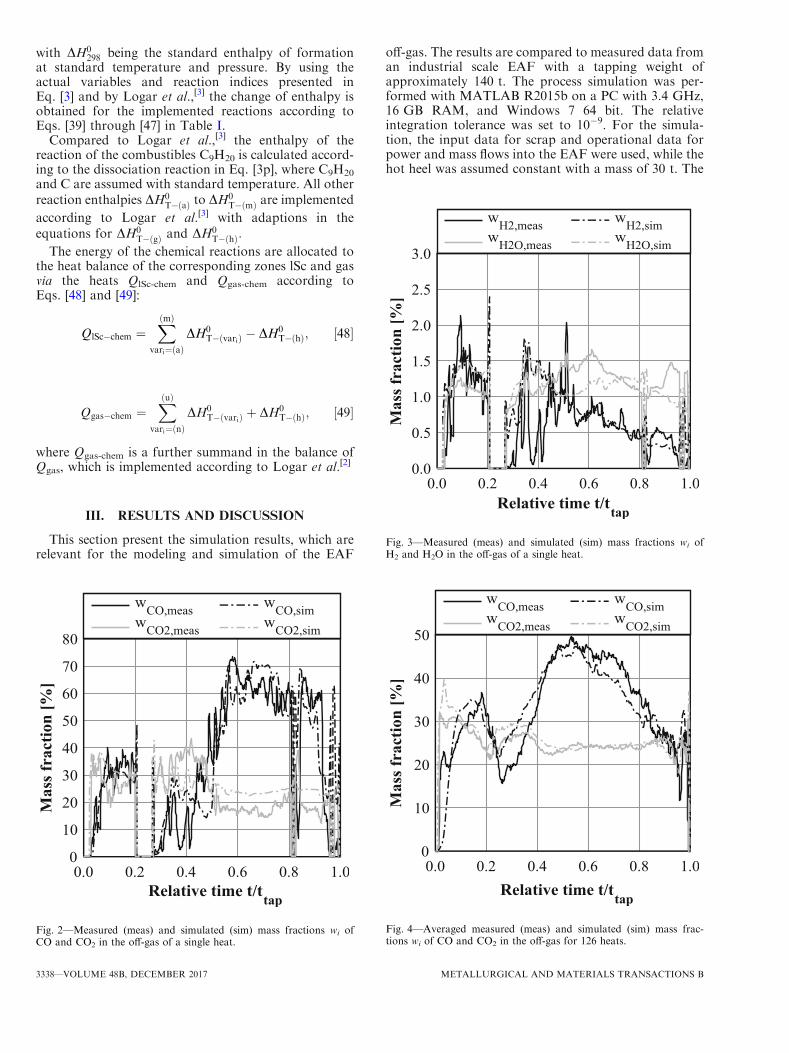
Fig. 2—Measured (meas) and simulated (sim) mass fractions wi ofCO and CO2 in the off-gas of a single heat.
Fig. 3—Measured (meas) and simulated (sim) mass fractions wi ofH2 and H2O in the off-gas of a single heat.
Fig. 4—Averaged measured (meas) and simulated (sim) mass frac-tions wi of CO and CO2 in the off-gas for 126 heats.
3338—VOLUME 48B, DECEMBER 2017 METALLURGICAL AND MATERIALS TRANSACTIONS B
operational data used have a resolution of 5 seconds andwere evaluated with an interpolation approach for eachintegration time step to determine the input mass flowsand powers. In total, 126 heats were simulated andevaluated in terms of energy and mass balance. Fur-thermore, the steel, slag, and gas compositions andtemperatures were compared.
In the following, the results from single heats arecompared as well as averaged results from all 126 heats.Thereby, transient behavior that cannot be reproduced
by the simulation is smoothed over and leads to a bettercomparability of the results.Figure 2 shows the measured (meas) and simulated
(sim) mass fractions of CO in black and CO2 in gray asparts of the gas phase for a single heat. The charging ofthe second scrap basket is obvious at 20 pct relativetime. The curves for CO are in the same range ofmagnitude with the biggest differences of 20 pct occur-ring at approximately 38 and 50 pct relative processtime. For CO2, the mass fractions are in the same range
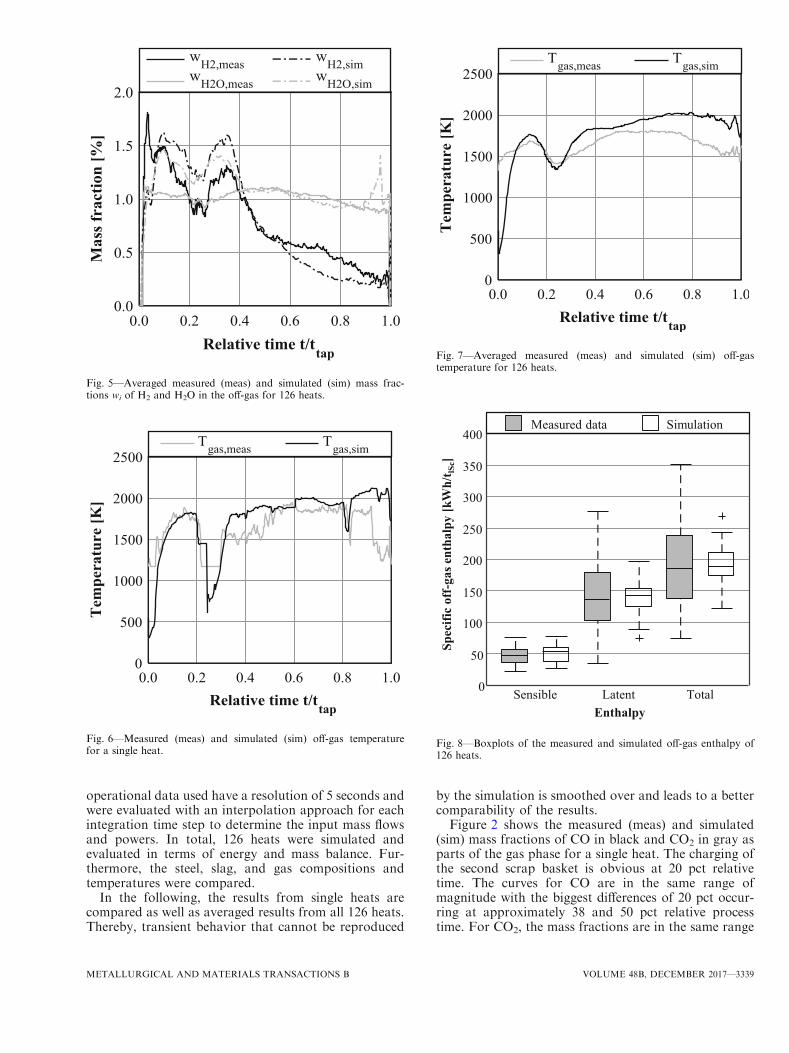
Fig. 5—Averaged measured (meas) and simulated (sim) mass frac-tions wi of H2 and H2O in the off-gas for 126 heats.
Fig. 6—Measured (meas) and simulated (sim) off-gas temperaturefor a single heat.
Fig. 7—Averaged measured (meas) and simulated (sim) off-gastemperature for 126 heats.
0
50
100
150
200
250
300
350
400
Sensible Latent Total
Spec
ific
off-
gas e
ntha
lpy
[kW
h/t lS
c]
Enthalpy
Measured data Simulation
Fig. 8—Boxplots of the measured and simulated off-gas enthalpy of126 heats.
METALLURGICAL AND MATERIALS TRANSACTIONS B VOLUME 48B, DECEMBER 2017—3339
of magnitude during the melting of the first scrapbasket. During the melting of the second scrap basketand the refining phase, the simulated mass fraction isabout 8 pct higher than the measured fraction. In thiscase, the post-combustion, carbon reactions in the EAF,and the equilibrium reactions need further adjustmentbut the results are already satisfactory. Further conclu-sions can be drawn by analyzing the mass fractions ofH2 and H2O.
Therefore, Figure 3 shows their mass fractions, asthese components were added to the gas phase simula-tion and are relevant for the equilibrium reactions.These components occur in small amounts compared to
CO and CO2, so that the scale of the y-axis has to beadjusted accordingly. The course of the measured andsimulated mass fractions are in the same range ofmagnitude with a bigger difference in H2 at 40 pctprocess time, which can be associated with non-station-ary behavior of the melting.For a further comparison of the results with less
influence of instationarities, the averaged mass fractionsof CO and CO2 for 126 heats are presented in Figure 4.It is obvious that the simulated fraction of CO isapproximately 10 pct higher than the measured fractionafter charging the second scrap basket. In contrast, thesimulated CO fraction is below the measured fractionduring the refining phase. The conversion of CO in theEAF through combustion and decarburization needs tobe shifted further to the refining. In case of CO2, thesimulated fractions are close to the measured values.The averaged mass fractions of H2 and H2O are
presented in Figure 5. For H2O, the simulation resultsare higher than the measured values at 10 and 30 pctprocess time. Here, the natural gas injection is at amaximum and more water vapor is created through CH4
combustion in the simulation than in the real process.Further adjustment of the CH4 reactions is necessary,but the results are already satisfactory.The chemical reactions in the gas phase have an
influence on the gas temperature, which is shown inFigure 6 for a single heat and averaged for all simulatedheats in Figure 7. While the simulated temperaturecurve for a single heat shows a satisfactory result, theaverage temperature shows bigger deviations of thesimulated off-gas temperature. Especially during themelting of the second scrap basket and the refiningphase, the simulated temperature is always higher thanthe measured temperature. To investigate the influenceof the temperature on the total energy balance of theEAF, the specific off-gas enthalpy of all 126 heats isgiven in Figure 8 as boxplots. The off-gas temperaturedifference is visible in the higher sensible enthalpyoutput for the simulation. Compared to the latententhalpy with medians at 140 kWh t�1, which is thechemical energy of CO, H2, and CH4, the sensible
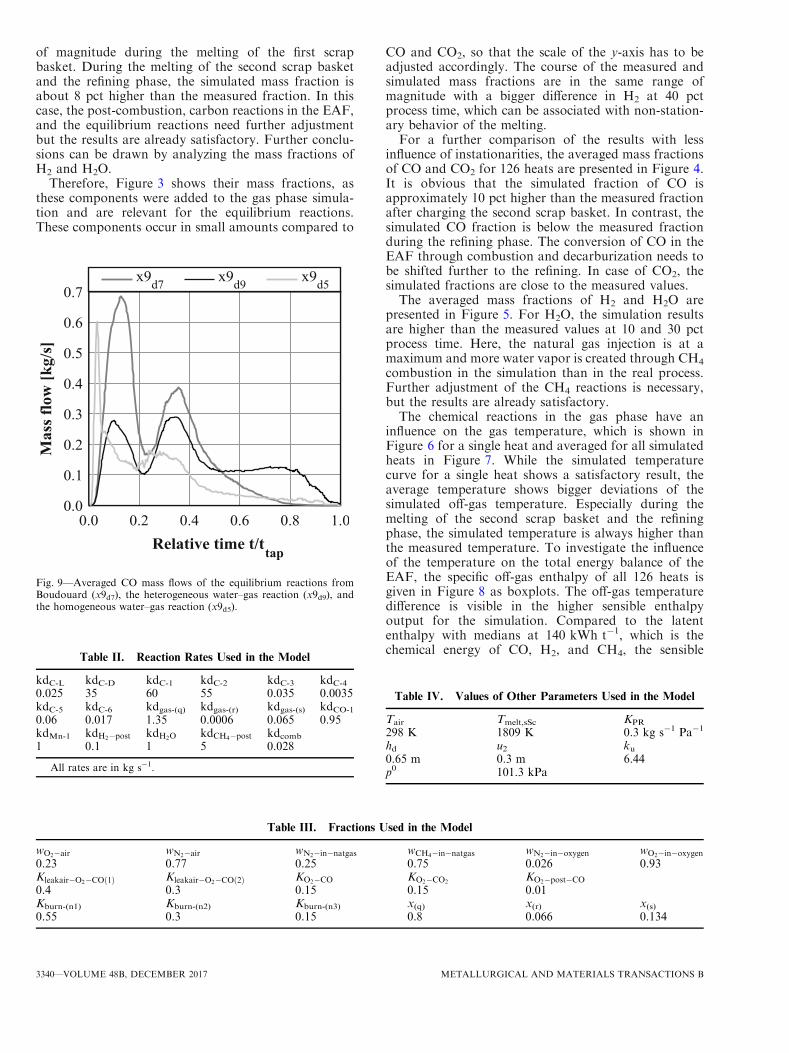
Fig. 9—Averaged CO mass flows of the equilibrium reactions fromBoudouard (x9d7), the heterogeneous water–gas reaction (x9d9), andthe homogeneous water–gas reaction (x9d5).
Table II. Reaction Rates Used in the Model
kdC-L kdC-D kdC-1 kdC-2 kdC-3 kdC-40.025 35 60 55 0.035 0.0035kdC-5 kdC-6 kdgas-(q) kdgas-(r) kdgas-(s) kdCO-1
0.06 0.017 1.35 0.0006 0.065 0.95kdMn-1 kdH2�post kdH2O kdCH4�post kdcomb
1 0.1 1 5 0.028
All rates are in kg s�1.
Table III. Fractions Used in the Model
wO2�air wN2�air wN2�in�natgas wCH4�in�natgas wN2�in�oxygen wO2�in�oxygen
0.23 0.77 0.25 0.75 0.026 0.93Kleakair�O2�COð1Þ Kleakair�O2�COð2Þ KO2�CO KO2�CO2
KO2�post�CO
0.4 0.3 0.15 0.15 0.01Kburn-(n1) Kburn-(n2) Kburn-(n3) x(q) x(r) x(s)0.55 0.3 0.15 0.8 0.066 0.134
Table IV. Values of Other Parameters Used in the Model
Tair Tmelt,sSc KPR
298 K 1809 K 0.3 kg s�1 Pa�1
hd u2 ku0.65 m 0.3 m 6.44p0 101.3 kPa
3340—VOLUME 48B, DECEMBER 2017 METALLURGICAL AND MATERIALS TRANSACTIONS B
enthalpy with medians at around 50 kWh t�1 is lower.The difference of the simulated off-gas temperature hasless influence on the off-gas energy output than adifference in the simulated off-gas composition com-pared to the real process.
Finally, the averaged mass flows of CO for the newlyimplemented chemical equilibrium reactions are shownin Figure 9. During the whole process, the equilibriumreactions lead to a production of CO. The amounts ofup to 0.7 kg second�1 demonstrate the relevance ofconsidering these reactions in the gas phase modeling.
It can be seen that the consideration of further gascomponents and equilibrium reactions in the gas phaselead to a better gas phase simulation in a dynamicprocess simulation model of an EAF. This is important,as the off-gas temperature and composition are contin-uously measurable process values and represent one ofthe biggest energy outputs of the EAF.
Finally, the duration of the simulation is importantfor the applicability of the dynamic process model. Thefurther enhancement of the model leads to a highercomplexity, while the ODE-solver accelerates the simu-lation. For a single heat, the simulation time is between65 and 85 seconds. Due to the ability of parallelcomputing, the 126 heats are simulated on four proces-sor cores in less than 1 hour. That means that the modelis applicable for online process optimization.
IV. CONCLUSION
In this paper, the enhancement of the gas phase of thedynamic EAF process model by Logar et al.[2,3] ispresented. The gas components H2, H2O, and CH4 wereincluded in the gas phase modeling. These componentswere integrated into the calculation of chemical reac-tions under consideration of the equilibrium reactions of
Boudouard and the water–gas reaction. To prevent theincrease of simulation time due to the higher complexity,the model was re-implemented in MATLAB to use themore efficient ODE-solver ode15s for stiff ODE-systems.The presented results of the enhanced EAF model
were compared to measured data from an industrialscale EAF. The off-gas mass fractions for single heats aswell as averaged data show a satisfactory similarity. Thesimulation of the gas phase temperature shows biggerdifferences, which have a negligible influence on thesimulated off-gas energy output. The implementedequilibrium reactions show their significance on theCO production in the EAF. Further optimization is stillnecessary. Especially the conversion of C throughcombustion and decarburization has to be improved.Therefore, further measurements and data are neces-sary, especially concerning the slag mass and mass of thehot heel. In the future, the model has to prove itsapplicability for different EAFs and thereby the extrap-olation capability for offline investigations.The simulation results were obtained in about 1
minute for each heat, so that the model is applicable foronline optimization. In addition, the parallel computingallows the simulation of hundreds of different settings,input materials, or operation strategies within a reason-able time. With that, the model is appropriate foroperator training and offline investigations on inputmaterials and modes of operation to reduce costs andenergy consumption and increase the energy andresource efficiency.
APPENDICES
Table II gives the reaction rates kd used in the model.In Table III, all necessary fractions (weight fractions w,fraction constants K for the reactions, and volume
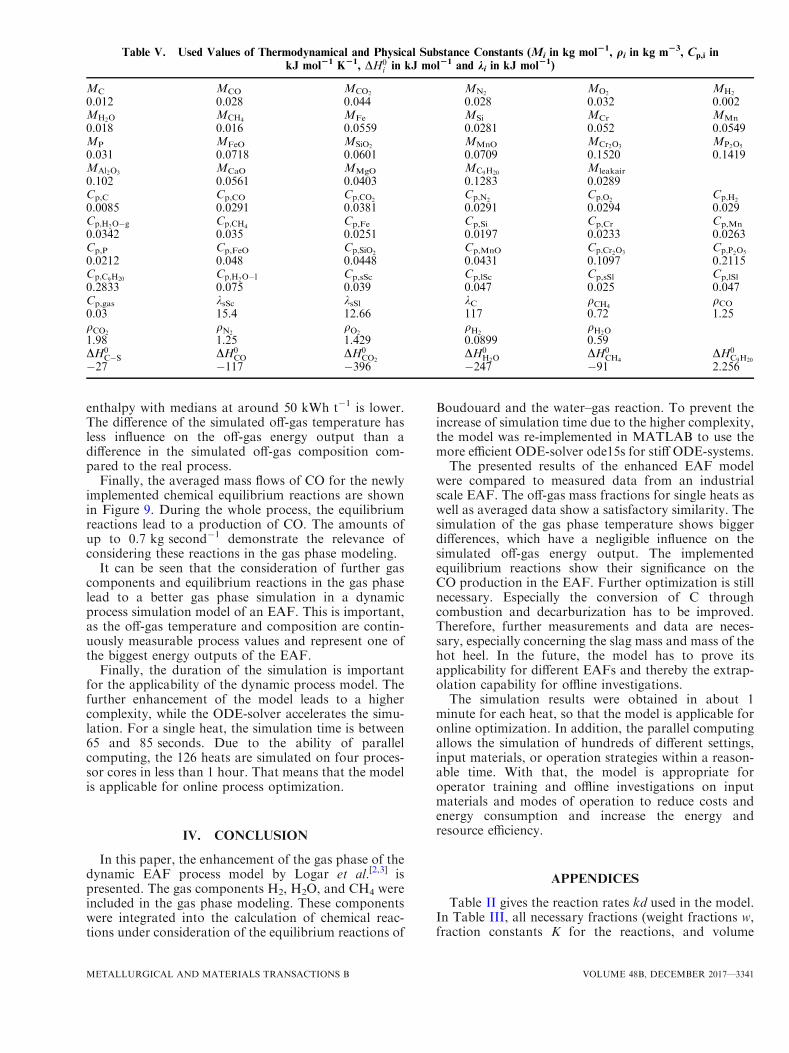
Table V. Used Values of Thermodynamical and Physical Substance Constants (Mi in kg mol21, qi in kg m23, Cp,i in
kJ mol21 K21, DH0i in kJ mol21 and ki in kJ mol21)
MC MCO MCO2MN2
MO2MH2
0.012 0.028 0.044 0.028 0.032 0.002MH2O MCH4
MFe MSi MCr MMn
0.018 0.016 0.0559 0.0281 0.052 0.0549MP MFeO MSiO2
MMnO MCr2O3MP2O5
0.031 0.0718 0.0601 0.0709 0.1520 0.1419MAl2O3
MCaO MMgO MC9H20Mleakair
0.102 0.0561 0.0403 0.1283 0.0289Cp,C Cp,CO Cp;CO2
Cp;N2Cp;O2
Cp;H2
0.0085 0.0291 0.0381 0.0291 0.0294 0.029Cp;H2O�g Cp;CH4
Cp,Fe Cp,Si Cp,Cr Cp,Mn
0.0342 0.035 0.0251 0.0197 0.0233 0.0263Cp,P Cp,FeO Cp;SiO2
Cp,MnO Cp;Cr2O3Cp;P2O5
0.0212 0.048 0.0448 0.0431 0.1097 0.2115Cp;C9H20
Cp;H2O�l Cp,sSc Cp,lSc Cp,sSl Cp,lSl
0.2833 0.075 0.039 0.047 0.025 0.047Cp,gas ksSc ksSl kC qCH4
qCO0.03 15.4 12.66 117 0.72 1.25qCO2
qN2qO2
qH2qH2O
1.98 1.25 1.429 0.0899 0.59DH0
C�S DH0CO DH0
CO2DH0
H2ODH0
CH4DH0
C9H20�27 �117 �396 �247 �91 2.256
METALLURGICAL AND MATERIALS TRANSACTIONS B VOLUME 48B, DECEMBER 2017—3341
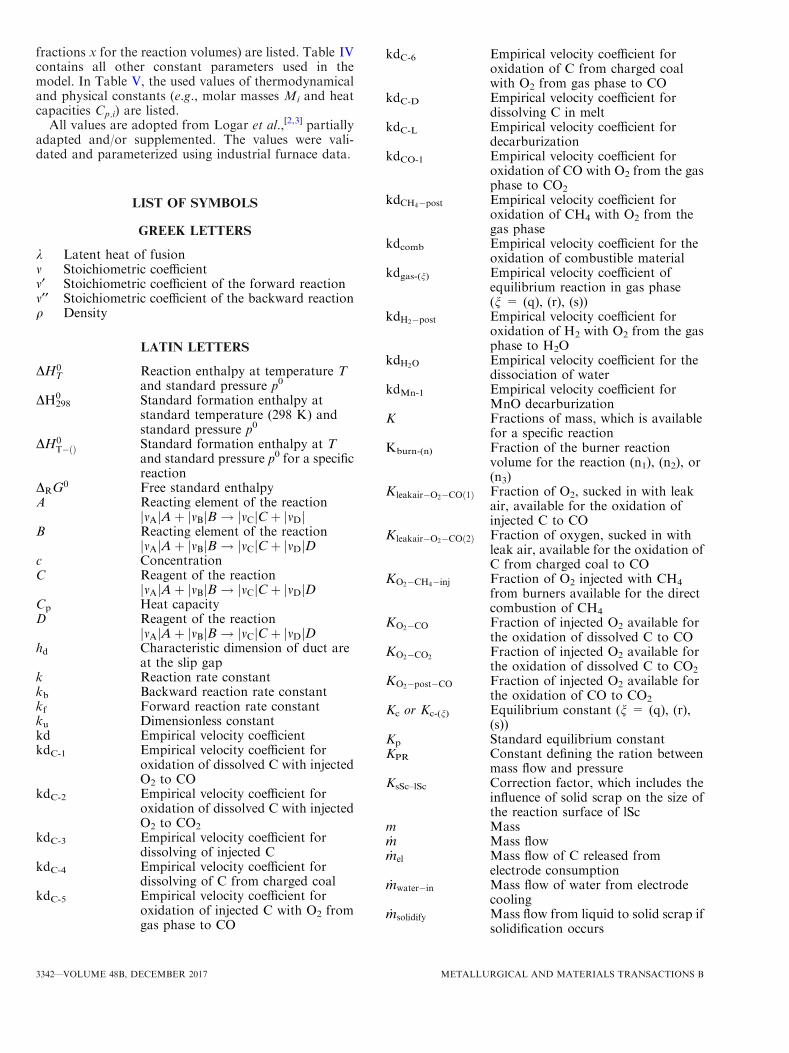
fractions x for the reaction volumes) are listed. Table IVcontains all other constant parameters used in themodel. In Table V, the used values of thermodynamicaland physical constants (e.g., molar masses Mi and heatcapacities Cp,i) are listed.
All values are adopted from Logar et al.,[2,3] partiallyadapted and/or supplemented. The values were vali-dated and parameterized using industrial furnace data.
LIST OF SYMBOLS
GREEK LETTERS
k Latent heat of fusionm Stoichiometric coefficientm¢ Stoichiometric coefficient of the forward reactionm¢¢ Stoichiometric coefficient of the backward reactionq Density
LATIN LETTERS
DH0T Reaction enthalpy at temperature T
and standard pressure p0
DH2980 Standard formation enthalpy at
standard temperature (298 K) andstandard pressure p0
DH0T�ðÞ Standard formation enthalpy at T
and standard pressure p0 for a specificreaction
DRG0 Free standard enthalpy
A Reacting element of the reactionjmAjAþ jmBjB ! jmCjC þ jmDj
B Reacting element of the reactionjmAjAþ jmBjB ! jmCjC þ jmDjD
c ConcentrationC Reagent of the reaction
jmAjAþ jmBjB ! jmCjC þ jmDjDCp Heat capacityD Reagent of the reaction
jmAjAþ jmBjB ! jmCjC þ jmDjDhd Characteristic dimension of duct are
at the slip gapk Reaction rate constantkb Backward reaction rate constantkf Forward reaction rate constantku Dimensionless constantkd Empirical velocity coefficientkdC-1 Empirical velocity coefficient for
oxidation of dissolved C with injectedO2 to CO
kdC-2 Empirical velocity coefficient foroxidation of dissolved C with injectedO2 to CO2
kdC-3 Empirical velocity coefficient fordissolving of injected C
kdC-4 Empirical velocity coefficient fordissolving of C from charged coal
kdC-5 Empirical velocity coefficient foroxidation of injected C with O2 fromgas phase to CO
kdC-6 Empirical velocity coefficient foroxidation of C from charged coalwith O2 from gas phase to CO
kdC-D Empirical velocity coefficient fordissolving C in melt
kdC-L Empirical velocity coefficient fordecarburization
kdCO-1 Empirical velocity coefficient foroxidation of CO with O2 from the gasphase to CO2
kdCH4�post Empirical velocity coefficient foroxidation of CH4 with O2 from thegas phase
kdcomb Empirical velocity coefficient for theoxidation of combustible material
kdgas-(n) Empirical velocity coefficient ofequilibrium reaction in gas phase(n = (q), (r), (s))
kdH2�post Empirical velocity coefficient foroxidation of H2 with O2 from the gasphase to H2O
kdH2O Empirical velocity coefficient for thedissociation of water
kdMn-1 Empirical velocity coefficient forMnO decarburization
K Fractions of mass, which is availablefor a specific reaction
Kburn-(n) Fraction of the burner reactionvolume for the reaction (n1), (n2), or(n3)
Kleakair�O2�COð1Þ Fraction of O2, sucked in with leakair, available for the oxidation ofinjected C to CO
Kleakair�O2�COð2Þ Fraction of oxygen, sucked in withleak air, available for the oxidation ofC from charged coal to CO
KO2�CH4�inj Fraction of O2 injected with CH4
from burners available for the directcombustion of CH4
KO2�CO Fraction of injected O2 available forthe oxidation of dissolved C to CO
KO2�CO2Fraction of injected O2 available forthe oxidation of dissolved C to CO2
KO2�post�CO Fraction of injected O2 available forthe oxidation of CO to CO2
Kc or Kc-(n) Equilibrium constant (n = (q), (r),(s))
Kp Standard equilibrium constantKPR Constant defining the ration between
mass flow and pressureKsSc–lSc Correction factor, which includes the
influence of solid scrap on the size ofthe reaction surface of lSc
m Mass_m Mass flow_mel Mass flow of C released from
electrode consumption_mwater�in Mass flow of water from electrode
cooling_msolidify Mass flow from liquid to solid scrap if
solidification occurs
3342—VOLUME 48B, DECEMBER 2017 METALLURGICAL AND MATERIALS TRANSACTIONS B
M Molar massp Pressurep0 Pressure at standard conditionspi Partial pressure of element ipr Relative pressure in EAFP PowerQlSc-chem Heat from chemical reactions in meltQgas-chem Heat from chemical reaction in gas
phase_Q Heat flowr Molar reaction rater(n) Molar reaction rate (n = (q), (r), (s))Rm Molar gas constantt Timettap Tap timeT Temperatureu1 Off-gas mass flowu2 Slip gap widthV VolumeV(n) Reaction volume of equilibrium
reaction (n = (q), (r), (s))w Weight fractionx(n) Fraction of reaction volume of
equilibrium reaction in the gas phasevolume
xi Mass flow of element iXi Molar fraction of element iXeq
i Equilibrium molar fraction ofelement i in a specific reaction
Z Actual mixing fraction of the suppliedgas volume flows
ZSt-(n) Stoichiometric mixing fraction of thereaction (n1), (n2), or (n3)
SUBSCRIPTS—GREEK LETTERS
n Equilibrium reaction (n = (q), (r), (s))
SUBSCRIPTS—LATIN LETTERS
air Ambient airaddition Added to a phase xxb BackwardC-inj With lances injected carbonC-D Carbon dissolved in meltC-L Carbon present in EAFC-S Solid carbonCH4-inj Injected methane from burnersCH4-in-natgas Methane in injected natural gas mass
flow in burnerscoal Charged coalf Forwardgas Gas phase in the EAFH2O-gas Gaseous wateri Element (i =1: C in EAF; i = 1coal:
C from charged coal; i =2: dissolvedC; i = 9: CO; i =10: CO2; i =11: N2;i =12: O2, etc.)
j Number of individual mass flow (xidj)i,meas Measured value of property of
element ii,sim Simulated value of property of
element ileakair Leak airlSc Liquid scrap phase in EAFlSl Liquid slag phase in EAFmelt,sSc Melting point of solid scrapN2-air Nitrogen in ambient airN2-in-natgas Nitrogen in injected natural gas mass
flow in burnersN2-in-oxygen Nitrogen in injected O2 mass flowO2-air Oxygen in ambient airO2-CH4-inj Oxygen injected with CH4 in burnersO2-gas Oxygen in gas phaseO2,lance With lances injected oxygenO2-in-oxygen Oxygen in injected O2 mass flowO2-post Oxygen injected for post-combustionsSc Solid scrap phase in EAFsSc,basket Solid scrap charged with basketxx Phase (sSc, lSc, sSl, lSl, gas, wall, el,
arc)
ABBREVIATIONS
BDF Backward differentiation formulaComb Combustible materialEAF Electric arc furnaceEl ElectrodelSc Liquid scraplSl Liquid slagmeas MeasuredNDF Numerical differentiation formulaODE Ordinary differential equationssim SimulatedsSc Solid scrapsSl Solid slagSt Stoichiometric
REFERENCES1. International Energy Agency (IEA), ed.: World Energy Outlook
2014, IEA Publications, Paris, 2014.2. V. Logar, D. Dovzan, and I. Skrjanc: ISIJ Int., 2012, vol. 52,
pp. 402–12.3. V. Logar, D. Dovzan, and I. Skrjanc: ISIJ Int., 2012, vol. 52,
pp. 413–23.4. V. Logar and I. Skrjanc: ISIJ Int., 2012, vol. 52, pp. 1225–32.5. A. Fathi, Y. Saboohi, I. Skrjanc, and V. Logar: Steel Res. Int.,
2017, DOI:10.1002/srin.201600083.6. A. Fathi, Y. Saboohi, I. Skrjanc, and V. Logar: ISIJ Int., 2015,
vol. 55, pp. 1353–60.7. F. Opitz and P. Treffinger:Metall. Mater. Trans. B, 2016, vol. 47B,
pp. 1489–1503.8. S.A. Matson and W.F. Ramirez: Proc. 55th Electr. Furn. Conf.,
Iron and Steel Society, Warrendale, PA, 1997, pp. 675–85.9. S.A. Matson, W.F. Ramirez, and P. Safe: Proc. 56th Electr. Furn.
Conf., 16th Process Technol. Conf., Iron and Steel Society, War-rendale, PA, 1998.
10. R.D.M. MacRosty and C.L.E. Swartz: Ind. Eng. Chem. Res., 2005,vol. 44, pp. 8067–83.
METALLURGICAL AND MATERIALS TRANSACTIONS B VOLUME 48B, DECEMBER 2017—3343
11. P. Nyssen, G. Monfort, J.L. Junque, M. Brimmeyer, P. Hubsch,and J.C. Baumert: Proc. 2nd Int. Conf. Model. Simul. Metall.Process. Steelmak. (SteelSim), The Austrian Society for Metal-lurgy and Materials (ASMET), Leoben, 2007, pp. 33–38.
12. T. Meier, V. Logar, T. Echterhof, I. Skrjanc, and H. Pfeifer: SteelRes. Int., 2015, vol. 87, pp. 581–88.
13. T. Meier: Modellierung und Simulation des Elektrolichtbogenofens.Dissertation, RWTH Aachen University, Aachen, 2016.
14. K. Kruger and H. Pfeifer: Praxishandbuch Thermoprozesstechnik,Band 2: Anlagen, Komponenten, Sicherheit, 2nd ed., Vulkan, Essen,2011, pp. 43–80.
15. R.J. Kee, M.E. Coltrin, and P. Glarborg: Chemically ReactingFlow: Theory and Practice, Wiley-VCH, Hoboken, NJ, 2003.
16. M. Selby: Medium Model, MathWorks MATLAB Central, 2012,https://de.mathworks.com/matlabcentral/fileexchange/39349-medium-model, Accessed 05 May 2016.
17. J.G. Bekker, I.K. Craig, and P.C. Pistorius: ISIJ Int., 1999,vol. 39, pp. 23–32.
18. T. Watanabe: ASEAN J. Chem. Eng., 2005, vol. 5,pp. 30–34.
19. N. Peters: Turbulent Combustion, Cambridge University Press,Cambridge, GB, 2000.
3344—VOLUME 48B, DECEMBER 2017 METALLURGICAL AND MATERIALS TRANSACTIONS B