Modeling and Simulation of Different Gas Flows Velocity ... · PDF fileModeling and Simulation...
14
International Journal of Computational Engineering Research||Vol, 03||Issue, 4|| www.ijceronline.com ||April||2013|| Page 28 Modeling and Simulation of Different Gas Flows Velocity and Pressure in Catalytic Converter with Porous 1 K.Mohan Laxmi, 2 V.Ranjith Kumar, 3 Y.V.Hanumantha Rao 1 M.Tech Student, Mechanical Engineering Department, KL University, Vijayawada. 2 Assistant Professor, Mechanical Engineering Department, KL University, Vijayawada. 3Professor, Head of The Department , Mechanical Engineering, KL University, Vijayawada. I. INTRODUCTION Porous material made with ceramic can be used into two way catalytic converter .The gas speed distribution in the converter is an important factor in the catalytic ability and the effect of catalytic materials. The paper studies on the variation of the gas flow pressure the converter by the computational fluid dynamics methods. There are many CFD commercial software such as PHOENICS, CFX, STAR-CD, FIDIP and FLUENT etc. FLUENT software has a very wide range of applications flexible characteristics of the grid, the strong capabilities of numerical solution comprehensive functionality. This article will study the fluid dynamics of the catalytic converters using the FLUENT software. Air pollution and global warming is a major issue nowadays. For this reason, emission limits are introduced around the world and continually being made stricter every year. The enforcement of this regulation has led to the compulsory utilization of catalytic converter as an emission treatment to the exhaust gas of vehicles. 1.1. History In 1973, General Motors faced new air pollution regulations and needed a way to make its cars conform to the stricter standards. Robert C. Stempel, who at the time was a special assistant to the GM president, was assigned to oversee development of a technology capable of addressing the problem. Under Stempel's guidance, GM built on existing research to produce the first catalytic converter for use in an automobile. Catalytic converters were first installed in vehicles made in 1975 in response to EPA regulations passed two years earlier tightening auto emissions and requiring a gradual decrease in the lead content of all gasoline.Since the introduction of stringent emission regulations in the US in the 1970s, car manufacturers have modified their exhaust systems to incorporate catalytic converters for the removal of NOx, CO and hydro carbons. All new cars registered throughout the European Union from 1 st January 1993 have to be fitted with catalytic converters. Platinum, palladium and rhodium are the main active components.A potential problem appears with the release of platinum group metals (PGMs) from the converters into the environment. There is ABSTRACT Stringent emission regulations around the world necessitate the use of high-efficiency catalytic converters in vehicle exhaust systems. Experimental studies are more expensive than computational studies. Also using computational techniques allows one to obtain all the required data for the Catalytic Converter, some of which could not be measured. In the present work, Geometric modeling ceramic monolith substrate with square shaped channel type of Catalytic converter and coated platinum and palladium using fluent software. In this software we are using crate inlet-outlet flanges and housing of the catalytic converter. After design of modeling us done different parameters in Fluent Pre-process like Analysis Type, Domain Type etc. This project studies the different porosity of porous medium how to affect to flow pressure and velocity field under the conditions of different inlet velocity and same ceramic diameter by CFD method. Geometric model of the catalytic converter has been establish and meshed by the pre-processing tool of FLUENT. The flow pressure simulation filled contours and curve of center line static pressure distribution of the ceramic porous material show that in the case of other conditions remain unchanged, the less the porosity of the ceramic porous material, the higher the inlet pressure and the more the pressure loss of the porous material. The more Porosity of ceramic is beneficial to exhaust catalytic converter. Keywords: Catalytic Converter, Ceramic material, Velocity, Pressure, FLUENT, Porous.
Transcript of Modeling and Simulation of Different Gas Flows Velocity ... · PDF fileModeling and Simulation...
International Journal of Computational Engineering Research||Vol, 03||Issue, 4||
www.ijceronline.com ||April||2013|| Page 28
Modeling and Simulation of Different Gas Flows Velocity and
Pressure in Catalytic Converter with Porous
1K.Mohan Laxmi,
2V.Ranjith Kumar,
3Y.V.Hanumantha Rao
1M.Tech Student, Mechanical Engineering Department, KL University, Vijayawada. 2Assistant Professor, Mechanical Engineering Department, KL University, Vijayawada.
3Professor, Head of The Department , Mechanical Engineering, KL University, Vijayawada.
I. INTRODUCTION Porous material made with ceramic can be used into two way catalytic converter .The gas speed
distribution in the converter is an important factor in the catalytic ability and the effect of catalytic materials.
The paper studies on the variation of the gas flow pressure the converter by the computational fluid dynamics
methods. There are many CFD commercial software such as PHOENICS, CFX, STAR-CD, FIDIP and
FLUENT etc. FLUENT software has a very wide range of applications flexible characteristics of the grid, the
strong capabilities of numerical solution comprehensive functionality. This article will study the fluid dynamics of the catalytic converters using the FLUENT software. Air pollution and global warming is a major issue
nowadays. For this reason, emission limits are introduced around the world and continually being made stricter
every year. The enforcement of this regulation has led to the compulsory utilization of catalytic converter as an
emission treatment to the exhaust gas of vehicles.
1.1. History
In 1973, General Motors faced new air pollution regulations and needed a way to make its cars
conform to the stricter standards. Robert C. Stempel, who at the time was a special assistant to the GM
president, was assigned to oversee development of a technology capable of addressing the problem. Under
Stempel's guidance, GM built on existing research to produce the first catalytic converter for use in an
automobile. Catalytic converters were first installed in vehicles made in 1975 in response to EPA regulations
passed two years earlier tightening auto emissions and requiring a gradual decrease in the lead content of all gasoline.Since the introduction of stringent emission regulations in the US in the 1970s, car manufacturers have
modified their exhaust systems to incorporate catalytic converters for the removal of NOx, CO and hydro
carbons.
All new cars registered throughout the European Union from 1st January 1993 have to be fitted with
catalytic converters. Platinum, palladium and rhodium are the main active components.A potential problem
appears with the release of platinum group metals (PGMs) from the converters into the environment. There is
ABSTRACT Stringent emission regulations around the world necessitate the use of high-efficiency
catalytic converters in vehicle exhaust systems. Experimental studies are more expensive than
computational studies. Also using computational techniques allows one to obtain all the required data
for the Catalytic Converter, some of which could not be measured. In the present work, Geometric
modeling ceramic monolith substrate with square shaped channel type of Catalytic converter and
coated platinum and palladium using fluent software. In this software we are using crate inlet-outlet
flanges and housing of the catalytic converter. After design of modeling us done different parameters in Fluent Pre-process like Analysis Type, Domain Type etc. This project studies the different
porosity of porous medium how to affect to flow pressure and velocity field under the conditions of
different inlet velocity and same ceramic diameter by CFD method. Geometric model of the catalytic
converter has been establish and meshed by the pre-processing tool of FLUENT. The flow pressure
simulation filled contours and curve of center line static pressure distribution of the ceramic porous
material show that in the case of other conditions remain unchanged, the less the porosity of the
ceramic porous material, the higher the inlet pressure and the more the pressure loss of the porous
material. The more Porosity of ceramic is beneficial to exhaust catalytic converter.
Keywords: Catalytic Converter, Ceramic material, Velocity, Pressure, FLUENT, Porous.

Modeling And Simulation Of Different…
www.ijceronline.com ||April||2013|| Page 29
now convincing evidence for the release of platinum group metals (PGMs) into the environment, possibly by
abrasion of the autocatalyst. As a result, PGMs are found to have increased in the environment. In recent study,
we found that PGMs have increased in road dust since 1984 and particularly 1991.
II. PROBLEM DESCRIPTION Catalytic converters are used on most vehicles on the road today. They reduce harmful emissions from
internal combustion engines (such as oxides of nitrogen, hydrocarbons, and carbon monoxide) that are the result
of incomplete combustion. Most new catalytic converters are the ceramic monolith substrate with square
channels type and are usually coated with platinum, rhodium, or palladium.
Figure: 2.1. Mesh geometry of Catalytic Converter
In this project Set up a porous zone for the substrate with appropriate resistances. Calculate a solution
for gas flow through the catalytic converter using the pressure- based solver. Plot pressure and velocity
distribution on specified planes of the geometry. Determine the pressure drop through the substrate and the
degree of non-uniformity of flow through cross sections of the geometry using X-Y plots and numerical reports
and also measure the Mass-Weighted Average of the Pressure .
III. PROBLEM FORMULATION AND MODELLING
The catalytic converter modeled here is shown in Figure. The nitrogen gas flows in through the inlet
with a different uniform velocities like 20m/s, 22.6 m/s,25m/s,27.5m/s,30m/s, passes through a ceramic monolith substrate with square shaped channels, and then exits through the outlet.
Figure: 3.Geometry of Catalytic Converter
While the flow in the inlet and outlet sections is turbulent, the flow through the substrate is laminar and
is characterized by inertial and viscous loss co-efficients in the flow (X) direction. The substrate is impermeable
in other directions, which is modeled using loss coefficients whose values are three orders of magnitude higher

Modeling And Simulation Of Different…
www.ijceronline.com ||April||2013|| Page 30
than in the X direction.
3.1. Input Parameters:
user mode: General Model
Analysis Type: Steady State
Domain Type: Multiple Domain
Fluid Type: Nitrogen Gas
Turbulence Model : K-Epsilon
Heat Transfer: Thermal Energy
Boundary Conditions: Inlet (Subsonic), outlet (Subsonic),Wall :No slip
Domain Interface: Fluid-Porous
3.2. Modelling:
Modeling of flows through a porous medium requires a modified formulation of the Navier-Stokes
equations, which reduces to their classical form and includes additional resistance terms induced by the porous
region. The incompressible Navier-Stokes equations in a given domain Ω and time interval (0,t) can be written
as
- 2u + p = f on x(0,t)
· u = 0 on x(0,t) where u = u(x,t) denotes the velocity vector, p = p(x,t) the pressure field, ρ the constant density, µ the
dynamic viscosity coefficient and f represents the external body forces acting on the fluid (i.e. gravity).
In the case of solids, small velocities can be considered and (u·∇)u term is neglected. Therefore, assuming an incompressible flow (constant density) in a certain domain Ω and considering the mass conservation equation,
also called continuity equation, the Navier-Stokes equation can be written as follows:
- µ∇2u + ∇p = f on x(0,t)
· u = 0 on x(0,t)
The general form of the Navier-Stokes equation is valid for the flow inside pores of the porous medium
but its solution cannot be generalized to describe the flow in porous region. Therefore, the general form of
Navier-Stokes equation must be modified to describe the flow through porous media. To this aim, Darcy’s law
is used to describe the linear relation between the velocity u and gradient of pressure p in the porous medium. It
defines the permeability resistance of the flow in a porous media:
∇p = - µDu in Ωpx(0,t)
Where Ωp is the porous domain, D the Darcy's law resistance matrix and u the velocity vector. In the case of considering an homogeneous porous media, D is a diagonal matrix with coefficients 1/α, where α is the
permeability coefficient.
The Reynolds number is defined as:
Where U and L a characteristic velocity and a characteristic length scale, respectively. In order to
characterize the inertial effects, it is possible to define the Reynolds number associated to the pores:
Where δ is the characteristic pore size. Whereas Darcy law is reliable for values of Rep< 1, otherwise it
is necessary to consider a more general model which accounts also for the inertial effects, such as:
∇p = - (µDu + ρCu|u|) in Ωpx(0,t)
Where C the inertial resistance matrix.
Considering a modified Navier-Stokes equation in the whole domain including the two source terms
associated to the resistance induced by the porous medium (linear Darcy and inertial loss term), the momentum
equations become:
- µ∇2u + ∇p - (µDu + ρCu|u|) = 0 in x(0,t)
In the case of considering an homogeneous porous media, D is a diagonal matrix with coefficients 1/α,where α
is the permeability coefficient and C is also a diagonal matrix. Therefore, a modified Darcy's resistance matrix should be used in Tdyn, as follows
- µ∇2u + ∇p = D*u in x(0,t)

Modeling And Simulation Of Different…
www.ijceronline.com ||April||2013|| Page 31
D* = D+ µρu|u|
where I is the identity matrix. It should be noted that in laminar flows through porous media, the
pressure p is proportional to velocity u and C can be considered zero (D*= D). Therefore, the Navier-Stokes
momentum equations can be rewritten as:
- µ∇2u + ∇p = - µDu in Ωx(0,t)
These momentum equations are resolved by Tdyn in the case of solids, where (u·∇)u term vanishes due to small
velocities. If (u·∇)u = 0 can't be neglected in the modelization (i.e. high velocities),then Tdyn should resolve the
following momentum equations in a fluid instead of in a solid:
ρ ( + (u · ∇)u) - µ∇2u + ∇p = - µDu in Ωx(0,t)
In order to add the Darcy's resistance matrix D*an appropriate function should be inserted in Tdyn. See
the figure below and "Function syntax" in the Help manual of Tdyn for more details about defining functions
3.3 Geometry and Boundary Conditions :
The following Conditions concerns the analysis of a gas flowing through a catalytic converter. The
main objective is to determine the pressure gradient and the velocity distribution through the porous media that
fills the catalytic element. This model is intended to exemplify the use of Tdyn capabilities to solve problems
involving flow through porous media.The boundary conditions are applied as shown in the figures below. First,
a Wall/Body condition with a Y-Plus wall boundary type is applied to the external surface of the catalytic
converter.
Figure: 3.3. External Surface of the Catalytic Converter
A Fix Velocity condition is further applied to the inlet surface of the model (in blue in the figure
below) so that the velocity vector is fixed there to the value like 20m/s,22.6m/s,25m/s,27.5m/s,30m/s. Finally, a
Pressure Field condition is used to fix the the dynamic pressure to zero at the outlet surface of the control
volume (in red in the figure below).
Figure: 3.3.1. Control Volumes of Catalytic Converter

Modeling And Simulation Of Different…
www.ijceronline.com ||April||2013|| Page 32
3.4. Materials:
Two different materials are used in order to simulate the gas flowing through the catalyst converter.
Fluid flow properties, density and viscosity, are the same in both materials and correspond to those of nitrogen
gas. The two materials only differ on the values of the Darcy's law matrix. While the first one has a null matrix,
the second one has assigned a Darcy matrix incorporating the resistance and inertial effects of the porous media.
Hence, the first material is applied to the inlet and outlet channel regions of the catalyst converter (in blue in the
figure below), while the second one is applied to the intermediate volume corresponding to the porous media (in yellow in the figure below).
Figure: 3.2.2.Materials of the catalytic Converter
The Darcy's law matrix used to model the porous media is taken to be diagonal but anisotropic. The
corresponding values of the viscous (D) and inertial (C) resistance terms are those in the table below Note that
the components of the Darcy's matrix are given with respect to the global axis system (X, Y, Z) Note that the
components of the Darcy's matrix are given with respect to the global axis system (X, Y, Z) so that the geometry
must be conveniently oriented.
IV. RESULTS AND DISCUSSIONS 4.1. Graphical Results:
4.1.1. Mass Flow Rate Graphs at different Velocities:
After running fluent software The nitrogen gas flows through the inlet with a uniform velocity at 20
m/s the values of mass flow rate changes at different iteration we can obsever in the Garaph.
Graph: Surface Monitor Plot of Mass Flow Rate at Velocity 20 m/s
After running fluent software The nitrogen gas flows through the inlet with a uniform velocity at 22.6 m/s the
values of mass flow rate changes at different iteration we can obsever in the Garaph.

Modeling And Simulation Of Different…
www.ijceronline.com ||April||2013|| Page 33
Graph: Surface Monitor Plot of Mass Flow Rate at Velocity 22.6 m/s
After running fluent software The nitrogen gas flows through the inlet with a uniform velocity at 25 m/s the
values of mass flow rate changes at different iteration we can obsever in the Garaph.
Graph: Surface Monitor Plot of Mass Flow Rate at Velocity 25 m/s
After running fluent software The nitrogen gas flows through the inlet with a uniform velocity at 27.5 m/s the
values of mass flow rate changes at different iteration we can obsever in the Garaph.
Graph: Surface Monitor Plot of Mass Flow Rate at Velocity 27.5 m/s
After running fluent software The nitrogen gas flows through the inlet with a uniform velocity at 30 m/s the
values of mass flow rate changes at different iteration we can obsever in the Garaph.
Graph: Surface Monitor Plot of Mass Flow Rate at Velocity 30 m/s
Modeling And Simulation Of Different…
www.ijceronline.com ||April||2013|| Page 34
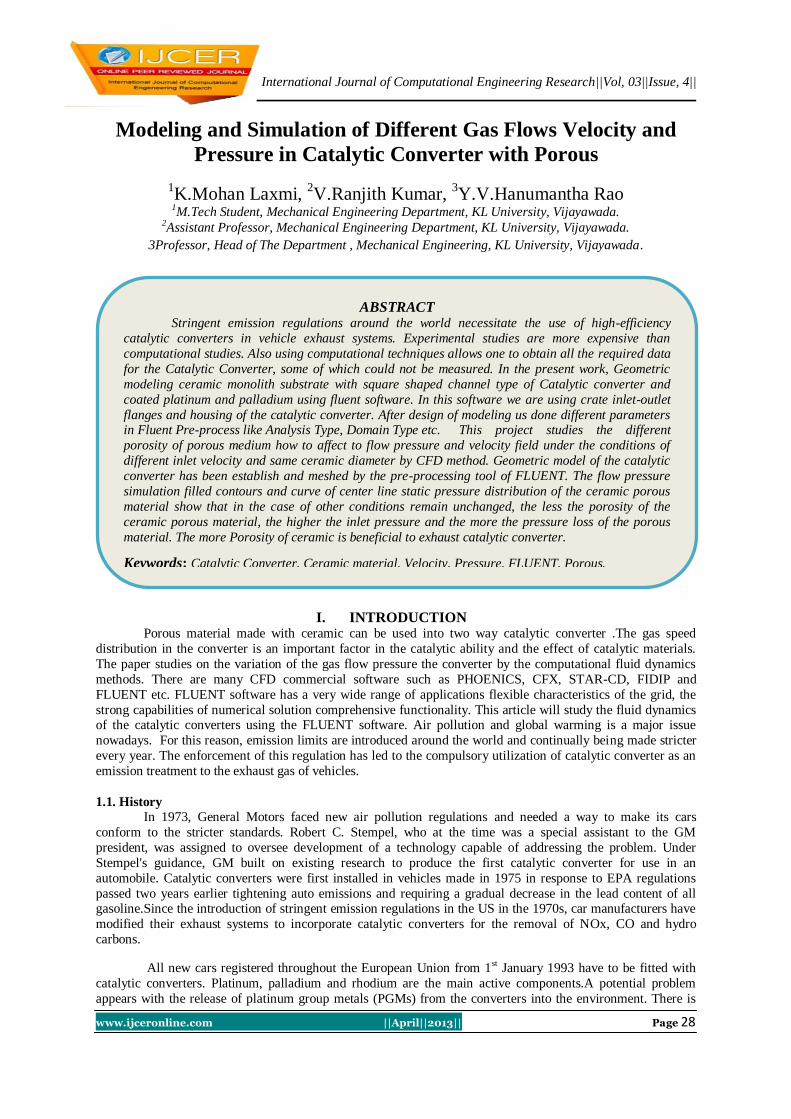
4.1.2.Static Pressure Graphs at Different Velocity Flows:
The Graph shown the Static Pressure vs Position of the flow in the porous medium. The porous-cl Line
Surface the pressure drop across the porous substrate with respect to position at velocity at 20 m/s. The pressure
drop Changes from 525 pa to 250 pa in the porous substrate
Figure:Pressure Droplet on the porous-cl Surface at velocity 20 m/s
The Graph shown the Static Pressure vs Position of the flow in the porous medium. The porous-cl Line
Surface the pressure drop across the porous substrate with respect to position at velocity at 22.6 m/s. The
pressure drop Changes from 650pascal to 300pa in the porous substrate.
Figure:Pressure Droplet on the porous-cl Surface at velocity 22.6 m/s
The Graph shown the Static Pressure vs Position of the flow in the porous medium. The porous-cl Line
Surface the pressure drop across the porous substrate with respect to position at velocity at 25 m/s. The pressure
drop Changes in the porous substrate from 800 Pa to 400pa.
Figure:Pressure Droplet on the porous-cl Surface at velocity 25 m/s
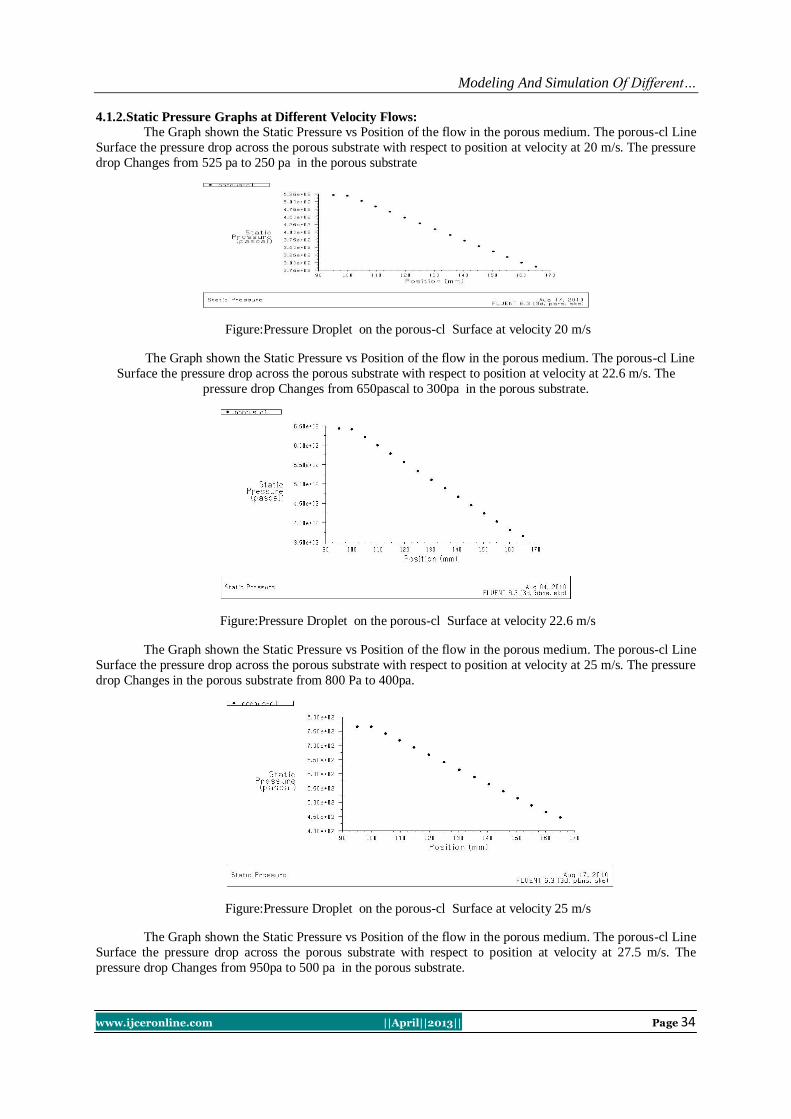
The Graph shown the Static Pressure vs Position of the flow in the porous medium. The porous-cl Line
Surface the pressure drop across the porous substrate with respect to position at velocity at 27.5 m/s. The
pressure drop Changes from 950pa to 500 pa in the porous substrate.
Modeling And Simulation Of Different…
www.ijceronline.com ||April||2013|| Page 35
Graph:Pressure Droplet on the porous-cl Surface at velocity 27.5 m/s
The Graph shown the Static Pressure vs Position of the flow in the porous medium. The porous-cl Line
Surface the pressure drop across the porous substrate with respect to position at velocity at 30 m/s. The pressure
drop Changes from 1100 pa to 600pa in the porous substrate
Figure: Pressure Droplet on the porous-cl Surface at velocity 30 m/s
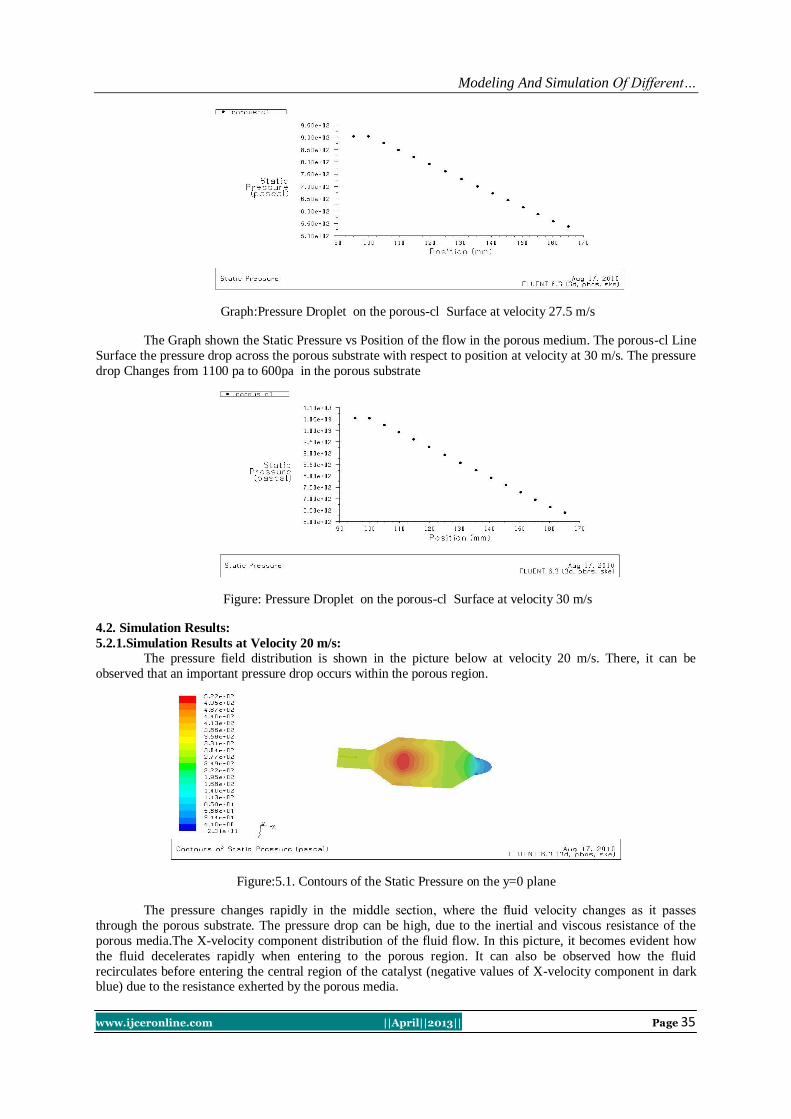
4.2. Simulation Results:
5.2.1.Simulation Results at Velocity 20 m/s:
The pressure field distribution is shown in the picture below at velocity 20 m/s. There, it can be
observed that an important pressure drop occurs within the porous region.
Figure:5.1. Contours of the Static Pressure on the y=0 plane
The pressure changes rapidly in the middle section, where the fluid velocity changes as it passes
through the porous substrate. The pressure drop can be high, due to the inertial and viscous resistance of the
porous media.The X-velocity component distribution of the fluid flow. In this picture, it becomes evident how
the fluid decelerates rapidly when entering to the porous region. It can also be observed how the fluid
recirculates before entering the central region of the catalyst (negative values of X-velocity component in dark blue) due to the resistance exherted by the porous media.

Modeling And Simulation Of Different…
www.ijceronline.com ||April||2013|| Page 36
Figure: Velocity Vectors on the y=0 Plane
The flow pattern shows that the flow enters the catalytic converter as a jet, with recirculation on either
side of the jet. As it passes through the porous substrate, it decelerates and straightens out, and exhibits a more
uniform velocity distribution. This allows the metal catalyst present in the substrate to be more effective.
Figure:5.3. Contours of the X Velocity on the x=95, x=130, and x=165 Surfaces
The velocity profile becomes more uniform as the fluid passes through the porous media. The velocity
is very high at the center (the area in red) just before the nitrogen enters the substrate and then decreases as it
passes through and exits the substrate. The area in green, which corresponds to a moderate velocity, increases in
extent.
5.2.1.Simulation Results at Velocity 22.6 m/s:
The pressure field distribution is shown in the picture below at velocity 22.6 m/s. There, it can be
observed that an important pressure drop occurs within the porous region.
Figure:5.1. Contours of the Static Pressure on the y=0 plane
The pressure changes rapidly in the middle section, where the fluid velocity changes as it passes through the
porous substrate. The pressure drop can be high, due to the inertial and viscous resistance of the porous media. The X-velocity component distribution of the fluid flow. In this picture, it becomes evident how the fluid
decelerates rapidly when entering to the porous region. It can also be observed how the fluid recirculates before
entering the central region of the catalyst (negative values of X-velocity component in dark blue) due to the
resistance exherted by the porous media

Modeling And Simulation Of Different…
www.ijceronline.com ||April||2013|| Page 37
Figure: Velocity Vectors on the y=0 Plane
The flow pattern shows that the flow enters the catalytic converter as a jet, with recirculation on either side of the jet. As it passes through the porous substrate, it decelerates and straightens out, and exhibits a more
uniform velocity distribution. This allows the metal catalyst present in the substrate to be more effective.
Figure:Contours of the X Velocity on the x=95, x=130, and x=165 Surfaces
The velocity profile becomes more uniform as the fluid passes through the porous media. The velocity
is very high at the center (the area in red) just before the nitrogen enters the substrate and then decreases as it
passes through and exits the substrate. The area in green, which corresponds to a moderate velocity, increases in
extent.
5.2.1.Simulation Results at Velocity 25 m/s:
The pressure field distribution is shown in the picture below at velocity 25 m/s. There, it can be
observed that an important pressure drop occurs within the porous region.
Figure: Contours of the Static Pressure on the y=0 plane

Modeling And Simulation Of Different…
www.ijceronline.com ||April||2013|| Page 38
The pressure changes rapidly in the middle section, where the fluid velocity changes as it passes
through the porous substrate. The pressure drop can be high, due to the inertial and viscous resistance of the
porous media.The X-velocity component distribution of the fluid flow. In this picture, it becomes evident how
the fluid decelerates rapidly when entering to the porous region. It can also be observed how the fluid
recirculates before entering the central region of the catalyst (negative values of X-velocity component in dark
blue) due to the resistance exherted by the porous media
Figure: Velocity Vectors on the y=0 Plane
The flow pattern shows that the flow enters the catalytic converter as a jet, with recirculation on either side of
the jet. As it passes through the porous substrate, it decelerates and straightens out, and exhibits a more uniform
velocity distribution. This allows the metal catalyst present in the substrate to be more effective.
Figure: Contours of the X Velocity on the x=95, x=130, and x=165 Surfaces
The velocity profile becomes more uniform as the fluid passes through the porous media. The velocity is very high at the center (the area in red) just before the nitrogen enters the substrate and then decreases as it
passes through and exits the substrate. The area in green, which corresponds to a moderate velocity, increases in
extent.
5.2.1.Simulation Results at Velocity 27.5 m/s:
The pressure field distribution is shown in the picture below at velocity 27.5 m/s. There, it can be
observed that an important pressure drop occurs within the porous region.

Modeling And Simulation Of Different…
www.ijceronline.com ||April||2013|| Page 39
Figure:Contours of the Static Pressure on the y=0 plane
The pressure changes rapidly in the middle section, where the fluid velocity changes as it passes
through the porous substrate. The pressure drop can be high, due to the inertial and viscous resistance of the porous media.The X-velocity component distribution of the fluid flow. In this picture, it becomes evident how
the fluid decelerates rapidly when entering to the porous region. It can also be observed how the fluid
recirculates before entering the central region of the catalyst (negative values of X-velocity component in dark
blue) due to the resistance exherted by the porous media
Figure: Velocity Vectors on the y=0 Plane
The flow pattern shows that the flow enters the catalytic converter as a jet, with recirculation on either
side of the jet. As it passes through the porous substrate, it decelerates and straightens out, and exhibits a more
uniform velocity distribution. This allows the metal catalyst present in the substrate to be more effective.
Figure:5.3. Contours of the X Velocity on the x=95, x=130, and x=165 Surfaces
The velocity profile becomes more uniform as the fluid passes through the porous media. The velocity
is very high at the center (the area in red) just before the nitrogen enters the substrate and then decreases as it
passes through and exits the substrate. The area in green, which corresponds to a moderate velocity, increases in extent.
5.2.1.Simulation Results at Velocity 30 m/s:
The pressure field distribution is shown in the picture below at velocity 30 m/s. There, it can be
observed that an important pressure drop occurs within the porous region.
Figure: Contours of the Static Pressure on the y=0 plane

Modeling And Simulation Of Different…
www.ijceronline.com ||April||2013|| Page 40
The pressure changes rapidly in the middle section, where the fluid velocity changes as it passes
through the porous substrate. The pressure drop can be high, due to the inertial and viscous resistance of the
porous media.The X-velocity component distribution of the fluid flow. In this picture, it becomes evident how
the fluid decelerates rapidly when entering to the porous region. It can also be observed how the fluid
recirculates before entering the central region of the catalyst (negative values of X-velocity component in dark
blue) due to the resistance exherted by the porous media
Figure: Velocity Vectors on the y=0 Plane
The flow pattern shows that the flow enters the catalytic converter as a jet, with recirculation on either
side of the jet. As it passes through the porous substrate, it decelerates and straightens out, and exhibits a more
uniform velocity distribution. This allows the metal catalyst present in the substrate to be more effective.
Figure:Contours of the X Velocity on the x=95, x=130, and x=165 Surfaces
The velocity profile becomes more uniform as the fluid passes through the porous media. The velocity
is very high at the center (the area in red) just before the nitrogen enters the substrate and then decreases as it
passes through and exits the substrate. The area in green, which corresponds to a moderate velocity, increases in
extent.
4.3. Numerical Results:
S.No Velocitys (m/s) Mass-Weighted Average for Static Pressure (pascal)
X=95 X=165 Net
1 20 451.81 296.27 373.65
2 22.6 555.06 376.41 465.29
3 25 660.68 459.52 559.65
4 27.5 778.68 553.27 665.975
5 30 907.28 656.75 782.015
Table: Mass-Weighted Average For Static Pressure for Different Velocities
Flow Velocities
20m/s 22.6m/s 25m/s 27.5m/s 30m/s
x=95 x=165 x=95 x=165 x=95 x=165 x=95 x=165 x=95 x=165
Mass-Weighted Average
4.4757
3.4783
5.1743
3.9932
5.8397
4.4830
6.5519
5.0072
7.2836
5.5460
Minimum of Facet
Values
0.3873
2.2579
0.4121
2.4476
0.4333
2.6060
0.4532
2.7578
0.4702
2.8463
Maximum of Facet Values
6.6052
5.2475
7.6576
6.1421
8.6566
6.9978
9.7184
7.9142
10.8005
8.8569

Modeling And Simulation Of Different…
www.ijceronline.com ||April||2013|| Page 41
Table:Numerical Results of Velocities in X-direction
S.No Velocitys
(m/s)
Standard Deviation Static Pressure
(pascal)
Flow Rate for Static Pressure
(pascal)(Kg/s)
X=95 X=165 X=95 X=165
1 20 32.5497 3.9365 12.7645 8.4686
2 22.6 40.9167 4.9620 17.7622 12.1649
3 25 49.3878 6.0080 23.4094 16.4273
4 27.5 58.9203 7.1900 30.3767 21.7551
5 30 69.2027 8.4804 38.6441 28.1697
Table: Standard Deviation and Flow Rates of Static Pressure for Different Velocities
V. CONCLUSION In this paper Set up a porous zone for the substrate with appropriate resistances. In this paper we
concluded the mass flow rate can be reduces at different iterations and also static pressure can be changes inlet
of the catalytic converter to outlet of the catalytic converter. We concluded the pressure drop across the porous
media and non-uniformity of the velocity distribution as the fluid goes through the porous media. Calculate a solution for gas flow through the catalytic converter using the pressure- based solver .Plot pressure and velocity
distribution on specified planes of the geometry. The model approach gives better agreement in pressure drop.
This present method also possesses lower computational cost based on the less computing time and Different
number of Velocity’s and Pressures are simulation. A ceramic monolith substrate with square shaped channels
model having the parametric studies of wall thicknesses, cell densities, hydraulic diameter, and specific surface
areas. A porous media having the different parametric studies of wall thicknesses, cell densities, hydraulic
diameter, and specific surface areas. The results also show that a Square -shaped zone gives a good mechanical
performance (lower pressure drop)
REFERENCES [1]. Shahrin Hisham Amirnordin, Suzairin Md Seri, Wan Saiful-Islam Wan Salim, Hamimah Abd Rahman, and Khalid Hasnan
“Pressure Drop Analysis of Square and Hexagonal Cells and its Effects on the Performance of Catalytic Converters”
International Journal of Environmental Science and Development, Vol. 2, No. 3, June 2011
[2]. Shahrin Hisham Amirnordin, Suzairin Md Seri, Wan Saiful-Islam Wan Salim, Hamimah Abd Rahman, and Khalid Hasnan
“Pressure Drop Prediction of Square-cell Honeycomb Monolith Structure” 2011 International Conference on Environment
Science and Engineering IPCBEE vol.8 (2011) © (2011) IACSIT Press, Singapore
[3]. CaiZhanjun, Kang Weimin, Chang Bowen, LiYabin “Study on characteristics of gas flow pressure in catalytic converter with
porous” Applied Mechanics and Materials Vol.235 (2012) PP:30-33
[4]. CaiZhanjun, Kang Weimin, Chang Bowen, LiYabin “Study on characteristics of gas flow Velocity in catalytic converter with
porous” Applied Mechanics and Materials Vol.229-231 (2012) PP:391-394
[5]. F.M. White, “Fluid Mechanics.” Singapore: Mc-Graw Hill, Inc. 295- 334. 2003.
[6]. M. Luoma, M. Harkonen, R. Lylykangas and J.Sohlo, “Optimisation of the Metallic Three-Way Catalyst Behaviour.” SAE
International. 971026. 1997.
[7]. E. Abu-Khiran, R. Douglas, and G. McCullough, ”Pressure loss characteristics in catalytic converters,” SAE International, 2003-
32- 0061, 2003.
[8]. Manual of ANSYS Fluent, 2005.
.