Modeling and Analysis on Pervaporation Separation of ... · Modeling and Analysis on Pervaporation...
110
Modeling and Analysis on Pervaporation Separation of Composite Zeolite Membranes by Stewart Mann A Thesis Presented in Partial Fulfillment of the Requirements for the Degree Master of Science Approved July 2014 by the Graduate Supervisory Committee: Jerry Lin, Chair Mary Lind David Nielsen ARIZONA STATE UNIVERSITY August 2014
Transcript of Modeling and Analysis on Pervaporation Separation of ... · Modeling and Analysis on Pervaporation...

Modeling and Analysis on Pervaporation Separation of
Composite Zeolite Membranes
by
Stewart Mann
A Thesis Presented in Partial Fulfillment
of the Requirements for the Degree
Master of Science
Approved July 2014 by the
Graduate Supervisory Committee:
Jerry Lin, Chair
Mary Lind
David Nielsen
ARIZONA STATE UNIVERSITY
August 2014
i
ABSTRACT
Pervaporation is a membrane separation technology that has had industrial
application and which is the subject of ongoing research. Two major factors are important
in judging the quality of a membrane: selectivity and permeation flux. Although many
types of materials can be used for the separation layer, zeolites will be the material
considered in this thesis. A simple mathematical model has been developed to
demonstrate the inter-relationships between relative permeation flux, reduced selectivity,
and the relative resistance to mass transfer of the support to the zeolite layer. The model
was applied to several membranes from our laboratory and to two examples from the
literature. The model offers a useful way of conceptualizing membrane performance and
facilitates the comparison of different membrane performances. The model predicts the
effect of different supports on zeolite supported membrane performance.
ii
ACKNOWLEDGMENTS
I would first like to thank my thesis advisor, Professor Jerry Lin, for all his help and
guidance. I am very grateful for the opportunity to be a member of Professor Lin’s
research group.
I would like to thank Professor Lind and Professor Nielsen for serving on my committee.
I would like to thank the faculty at ASU. The quality of teaching has been excellent in all
respects.
I would like to thank Xiaoli Ma for all his help and support.
A special thanks to my wife Candice, and my two sons Matthew and Gabriel.
I would also like to thank my current and former group members: Xueliang Dong,
Wangliang Mi, Alexandra Kasik, Nick Linneen, Amr Ibrahim, Joshua James, Yang Liu,
Hong Mang, Xiaojuan Hu, BoLu, Defei Liu, Huifang Zhang, Hu Xiaojuan, Tyler Norton

iii
TABLE OF CONTENTS
Page
LIST OF TABLES ................................................................................................................... vi
LIST OF FIGURES ............................................................................................................... vii
CHAPTER
1 INTRODUCTION ................. .................................................................................... 1
1.1 Membrane Separation Processes ......................................................... 1
1.1.1 General Background ...................................................................... 1
1.1.2 Pervaporation ................................................................................. 3
1.2 Zeolite Membranes .............................................................................. 6
1.2.1 Zeolites ........................................................................................... 6
1.2.2 Zeolite Membranes ........................................................................ 9
1.2.3 Separations by Zeolite Membranes ............................................. 11
1.3 Transport Model for Zeolite Membranes .......................................... 14
1.3.1 Support Resistance ....................................................................... 14
1.3.2 Mathematical Modeling of the Zeolite Layer ............................. 15
1.3.3 Mathematical Modeling of the Support Layer ............................ 20
1.4 Motivation and Structure ................................................................... 23
2 THE FLUX AND SELECTIVITY MODEL .......................................................... 25
2.1 Background for the Model ................................................................. 25
2.1.1 Introduction .................................................................................. 25
2.1.2 Resistance in Series...................................................................... 26
iv
CHAPTER Page
2.1.3 Resistance Ratio of Support to Zeolite .......................................... 30
2.1.4 Temperature Dependence of the Resistance Ratio ..................... 32
2.2 The Flux Model .................................................................................. 34
2.2.1 Relative Permeation Flux ............................................................ 34
2.2.2 Temperature Dependence of Relative Permeation Flux ............. 40
2.3 The Selectivity Model ........................................................................ 45
2.3.1 Reduced Selectivity ..................................................................... 45
2.3.2 Temperature Dependence of Reduced Selectivity ...................... 49
2.4 Comparison with the de Bruijn Model .............................................. 51
2.5 Conclussions ...................................................................................... 53
3 EXPERIMENTAL AND RESULTS ....................................................................... 55
3.1 Overview ............................................................................................ 55
3.2 Experimental ...................................................................................... 57
3.2.1 Membrane Synthesis .................................................................... 57
3.2.2 Experimental Method .................................................................. 58
3.3.3 Characterization ........................................................................... 58
3.3 Results ................................................................................................ 61
3.3.1 Experimental Results ................................................................... 61
3.3.2 Literature Examples ..................................................................... 72
3.4 Conclussions ...................................................................................... 76
4 SUMMARY AND RECOMMENDATIONS ......................................................... 78
v
CHAPTER Page
4.1 Summary ............................................................................................ 78
4.2 Recommendations .............................................................................. 81
REFERENCES....... ............................................................................................................... 82
APPENDIX
A THE FLUX MODEL .............................................................................................. 87
B THE SELECTIVITY MODEL .............................................................................. 93

vi
LIST OF TABLES
Table Page
1.1 Reported Ethanol/Water Pervaporation Performance of Silicalite-1 ................ 13
3.1 Results of Helium Permeance ............................................................................ 64
3.2 Pervaporation Characterization for Silicate-1 YSZ/SS ..................................... 65
3.3 Values for for Two Layer Supports .................................................... 66
3.4 Pervaporation Characterization Silicalite-1 YSZ/SS+SS .................................. 67
3.5 Pervaporation characterization silicalite-1 YSZ/SS+γ-alumina ....................... 68
3.6 Values for ............................................................................................ 68
3.7 Flux Model Parameters Silicalite-1 ................................................................... 69
3.8 Selectivity Model Parameters Silicalite-1 .......................................................... 70
3.9 Support Values, Literature ................................................................................. 73
3.10 Pervaporation Characterization, Literature ........................................................ 74
3.11 Values for , Literature ...................................................................................... 75
3.12 Flux Model Values, Literature ........................................................................... 75
3.13 Selectivity Model Values, Literature ................................................................. 75
vii
LIST OF FIGURES
Figure Page
1.1 Flow Through a Membrane in Pervaporation .............................................. 3
1.2 MFI Structure ............................................................................................... 7
1.3 Richard Maling Barrer ................................................................................... 8
1.4 Pressure Drop Across a Composite Membrane ......................................... 14
2.1 Pressures of a Permeating Species in Pervaporation ................................. 27
2.2 Temperature Dependence of for Ethanol ............................................... 34
2.3 as a Function of at Representative Values ..................................... 36
2.4 as a Function of , β Support = 0 .......................................................... 38
2.5 Temperature Dependence of Relative Permeation Flux ............................ 42
2.6 Temperature Dependence of Relative Permeation Flux, β = 0 ................. 44
2.7
as a Function of at Representative Ln Values .................................. 47
2.8 Temperature Dependence of Reduced Selectivity ..................................... 51
3.1 Flow Chart for Presentation Of Results ..................................................... 60

1
CHAPTER 1
INTRODUCTION
1.1 MEMBRANE SEPARATION PROCESSES
1.1.1 General Background
Membrane separations have become important in chemical engineering as this
type of separation can replace or supplement other separation modalities. Continuous
membrane processes for liquid separations provide an alternative to complex and energy
intensive separation processes such as selective adsorption, azeotropic distillation or
cryogenic distillation [1]. Selecting a separation modality, on an industrial scale, is
largely based on cost, including the amount of energy required, and feasibility. Various
criteria can be used to classify membranes used for separation. A list based on the type
of process includes: [2]
1. Microfilitration
2. Ultrafiltration
3. Electrodialysis
4. Reverse osmosis
5. Hemodialysis
6. Gas separation
7. Pervaporation
The underlying concept in membrane separations is that the membrane forms a
semipermeable barrier which favors the transport of one species in a mixture over others
through the membrane. The driving force for transport of a species is its chemical
potential gradient across the membrane. The driving force can also be expressed as the

2
pressure difference, high to low, from the feed side to the permeate side, of the
permeating species. The flow of the mixture, or its components, through the membrane
is called flux. The units of flux are
or
where the area in the denominator is the
surface area of the membrane usually normal to the direction of flow. Selectivity is one
way of describing the ability of a membrane to separate species in the feed mixture.
Selectivity is defined as the ratio of the permeance of the main permeating component to
the permeance of the other mixture component, and is dimensionless. Separation factor
is also commonly used in the pervaporation literature to describe the ability of a
membrane to separate the species in the feed. Separation factor is defined
as
⁄ . Moles, concentrations, or mole fractions can be used in place of
weights with the same result. The separation factor is affected by the properties of the
membrane, the vapor-liquid equilibrium diagram of the feed solution (including feed
composition), and the process operating conditions. Selectivity reflects the intrinsic
properties of the membrane. Using selectivity as the measure of the ability of the
membrane to separate the species also allows comparison to gas permeation studies. For
these reasons, it is the preferred way of reporting separation ability [2]. Industrial
applications of membrane separations often require both high flux and high selectivity.
High selectivity means high product purity and high energy efficiency. The flux and
selectivity are determined in most cases by a solution diffusion mechanism. The
materials from the feed are adsorbed, or dissolve, onto the membrane surface, and then
diffuse through the membrane pores to the permeate side. Another mechanism of

3
separation is molecular sieving where the mixture components are separated based on the
pore diameter of the membrane allowing the transport of one the feed species, but
excluding the other based on size. Membranes for separation can be broadly classified as
polymeric or inorganic based on composition. They are also classified based on pore size
as microporous (< 2nm pore diameter), mesoporous (2-100 nm pore diameter), and
macroporous (>100 nm pore diameter).
1.1.2 Pervaporation
The feed in pervaporation is a liquid, the permeate is a vapor maintained at low
partial pressure by means of a sweep gas or vacuum. Pervaporation is usually described
as a three step process: solution-diffusion-evaporation (on the permeate side) [3]. The
vapor permeate is then condensed to a liquid.
Figure 1.1
Flow through a membrane in pervaporation
Pervaporation for liquid separations provides three advantages over other liquid
separation modalities [1]:
4
1. Reduced energy demand because only a fraction of the feed needs to be
vaporized.
2. Continuous operation
3. Higher driving force because of the downstream vacuum (or sweep gas).
According to Baker, pervaporation originated in the 19th
century and the term was coined
by Kober in 1917. The process was first studied in systematic fashion in the 1950s by
American Oil. By the 1980s advances in membrane technology made it possible to
prepare economically viable pervaporation systems. [2]
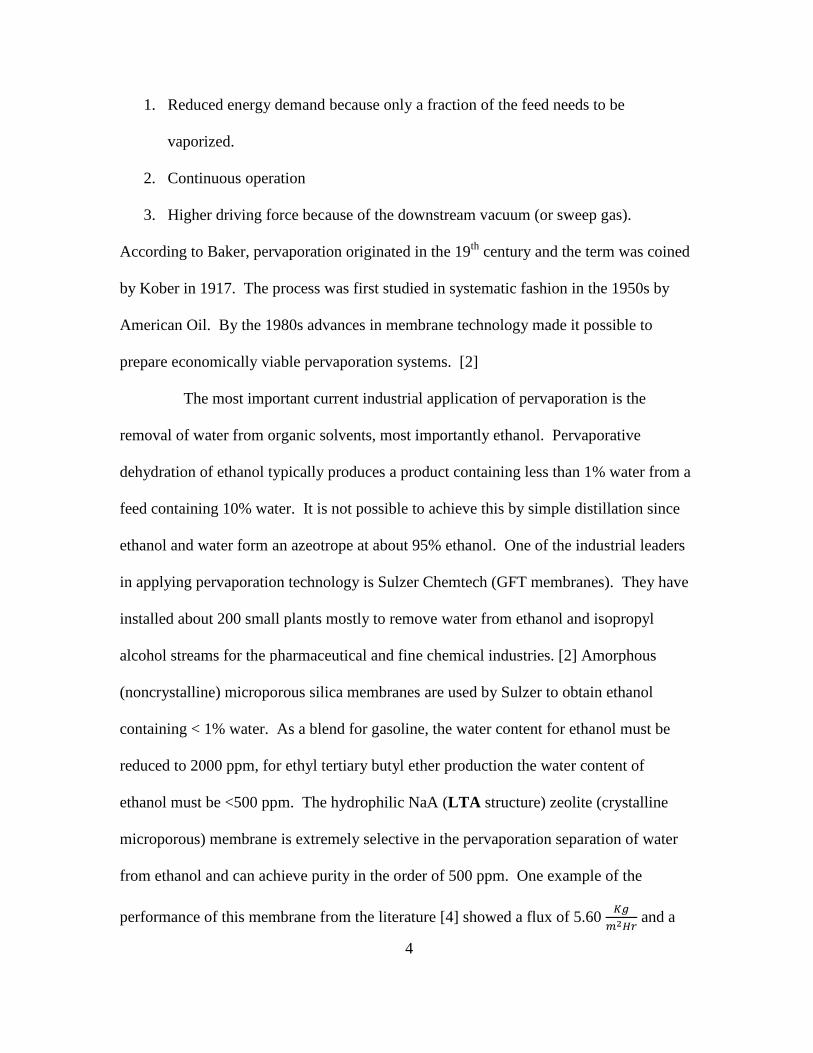
The most important current industrial application of pervaporation is the
removal of water from organic solvents, most importantly ethanol. Pervaporative
dehydration of ethanol typically produces a product containing less than 1% water from a
feed containing 10% water. It is not possible to achieve this by simple distillation since
ethanol and water form an azeotrope at about 95% ethanol. One of the industrial leaders
in applying pervaporation technology is Sulzer Chemtech (GFT membranes). They have
installed about 200 small plants mostly to remove water from ethanol and isopropyl
alcohol streams for the pharmaceutical and fine chemical industries. [2] Amorphous
(noncrystalline) microporous silica membranes are used by Sulzer to obtain ethanol
containing < 1% water. As a blend for gasoline, the water content for ethanol must be
reduced to 2000 ppm, for ethyl tertiary butyl ether production the water content of
ethanol must be <500 ppm. The hydrophilic NaA (LTA structure) zeolite (crystalline
microporous) membrane is extremely selective in the pervaporation separation of water
from ethanol and can achieve purity in the order of 500 ppm. One example of the
performance of this membrane from the literature [4] showed a flux of 5.60
and a
5
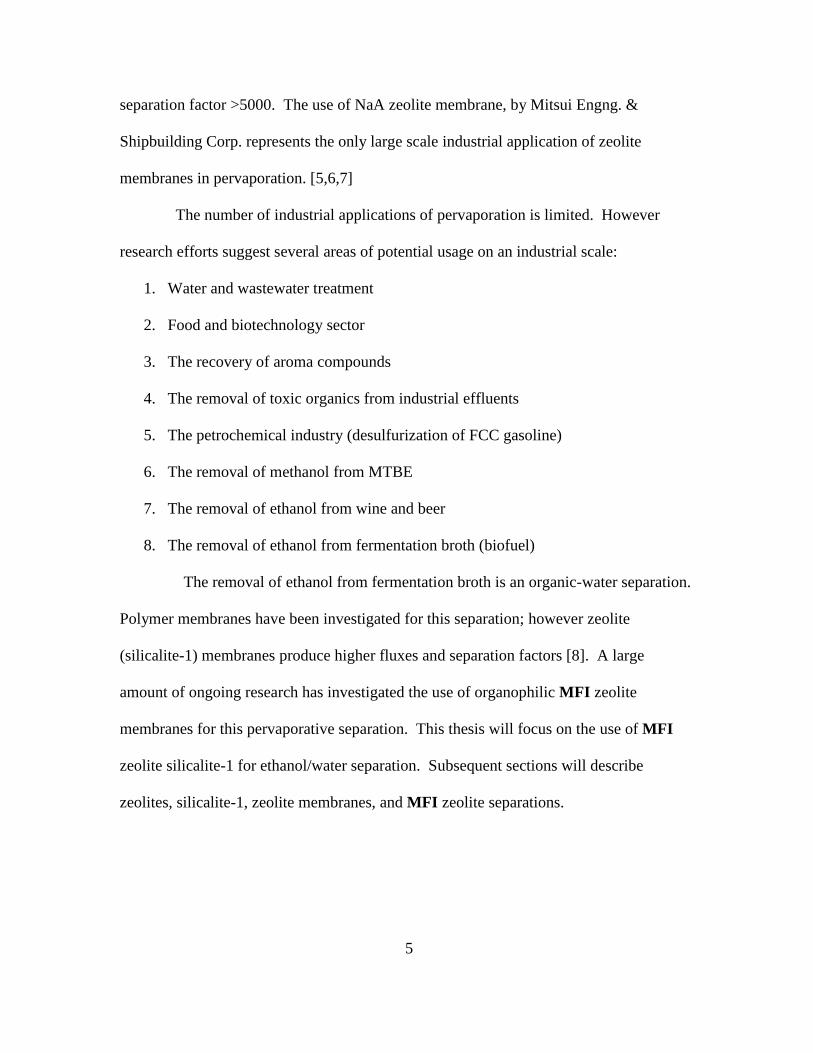
separation factor >5000. The use of NaA zeolite membrane, by Mitsui Engng. &
Shipbuilding Corp. represents the only large scale industrial application of zeolite
membranes in pervaporation. [5,6,7]
The number of industrial applications of pervaporation is limited. However
research efforts suggest several areas of potential usage on an industrial scale:
1. Water and wastewater treatment
2. Food and biotechnology sector
3. The recovery of aroma compounds
4. The removal of toxic organics from industrial effluents
5. The petrochemical industry (desulfurization of FCC gasoline)
6. The removal of methanol from MTBE
7. The removal of ethanol from wine and beer
8. The removal of ethanol from fermentation broth (biofuel)
The removal of ethanol from fermentation broth is an organic-water separation.
Polymer membranes have been investigated for this separation; however zeolite
(silicalite-1) membranes produce higher fluxes and separation factors [8]. A large
amount of ongoing research has investigated the use of organophilic MFI zeolite
membranes for this pervaporative separation. This thesis will focus on the use of MFI
zeolite silicalite-1 for ethanol/water separation. Subsequent sections will describe
zeolites, silicalite-1, zeolite membranes, and MFI zeolite separations.

6
1.2 ZEOLITE MEMBRANES
1.2.1 Zeolites
Zeolites are aluminosilicate framework crystalline structures which can be
represented by the formula: where n is the cation valence.
The basic structural unit in zeolites is a TO 4 regular tetrahedron formed of a
tetrahedrally ccoordinated atom (the “T” atom, often silicon) located at the center of four
oxygen atoms which form the vertices of the tetrahedron. The tetrahedra are corner
linked by oxygen bridges containing 8, 10, or 12 oxygen atoms to form periodic
frameworks, usually displaying channels (pores) in one or more dimensions. The number
of oxygen atoms in the bridge determines the pore size of the zeolite. Each framework
type is uniquely defined by the way the comprising tetrahedra are linked. There are
currently over 200 zeolite topologies recognized to exist as real materials by the Structure
Commission of the International Zeolite Association (IZA). Each of the known
framework types is assigned a boldface three letter code by the IZA that defines the
structure but not necessarily the type of material. In some cases, the code is derived from
the name of the first material found to exhibit the framework topology. Many types of
materials are represented within the 200+ framework types. About 20% of the
framework types have been synthesized as pure silicates. Silicon atoms are often
replaced by aluminum, germanium, phosphorous, or boron atoms, among others. When a
trivalent atom replaces silicon, other extra-framework cations are required to preserve
electroneutrality. One significant consequence of this type of substitution is that the
hydrophilicity of the zeolite changes, zeolites with high silicon content being relatively
7
hydrophobic (organophilic) [9]. Details of each zeolite structure can be found on the
official IZA website.
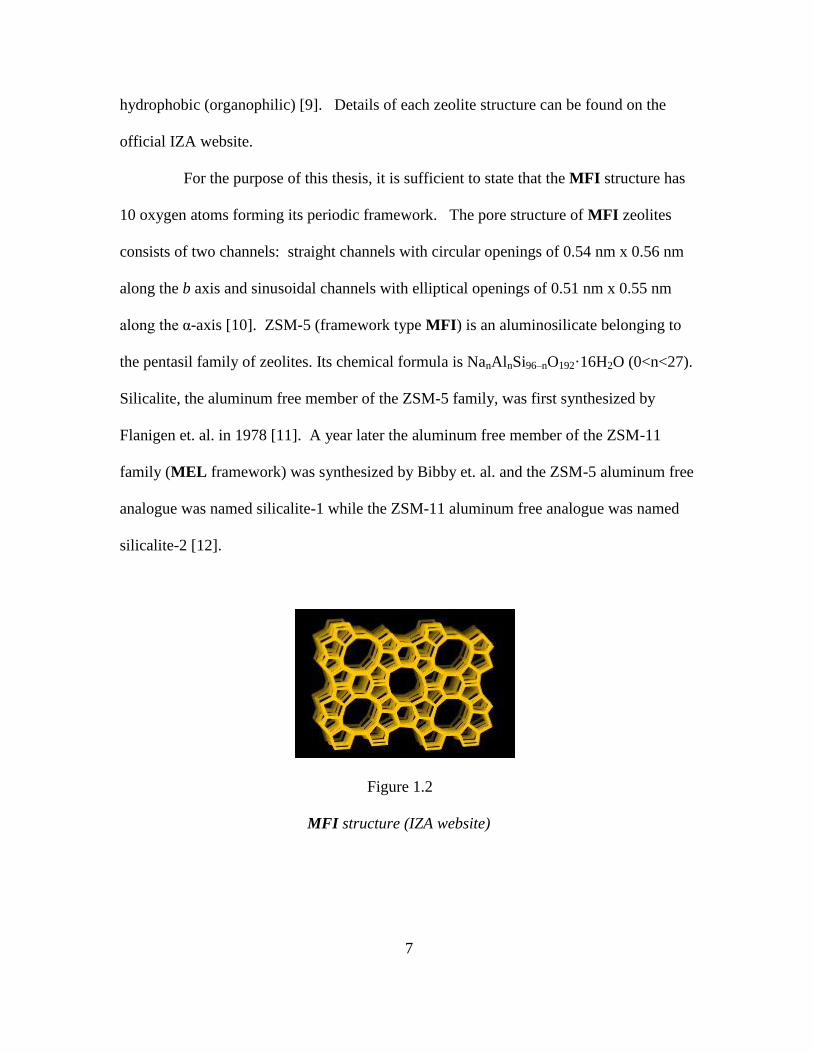
For the purpose of this thesis, it is sufficient to state that the MFI structure has
10 oxygen atoms forming its periodic framework. The pore structure of MFI zeolites
consists of two channels: straight channels with circular openings of 0.54 nm x 0.56 nm
along the b axis and sinusoidal channels with elliptical openings of 0.51 nm x 0.55 nm
along the α-axis [10]. ZSM-5 (framework type MFI) is an aluminosilicate belonging to
the pentasil family of zeolites. Its chemical formula is NanAlnSi96–nO192·16H2O (0<n<27).
Silicalite, the aluminum free member of the ZSM-5 family, was first synthesized by
Flanigen et. al. in 1978 [11]. A year later the aluminum free member of the ZSM-11
family (MEL framework) was synthesized by Bibby et. al. and the ZSM-5 aluminum free
analogue was named silicalite-1 while the ZSM-11 aluminum free analogue was named
silicalite-2 [12].
Figure 1.2
MFI structure (IZA website)
8
Cronstedt coined the term zeolite in 1756 after he observed that on heating a
natural zeolite mineral (aluminosilicate), the material appeared to bubble as water was
lost as steam from the zeolite (pores). Cronstedt had discovered a class of materials that
were not just porous, but that had pores and cavities of molecular dimensions. In 1857
Damour demonstrated that the water loss was reversible. In 1862 Deville synthesized the
first zeolite (Deville is also known for his preparation of aluminum and its display at the
1855 Paris Exposition). In 1905 zeolites were used commercially as water softeners. In
1948 Barrer synthesized ZK-5, a zeolite with no known natural counterpart, and for the
first time industrial use of zeolites did not depend on scarce and impure natural deposits.
The term “zeolite” was loosely used in the first part of the 20th
century to include
carbonaceous materials and amorphous aluminosilicates. In 1967 Barrer became one of
the cofounders of the International Zeolite Association.
Figure 1.3
Richard Maling Barrer

9
Through the 1950s, the main commercial use of zeolites was in adsorption and
separation applications. In the 1960s zeolites became widely used in laundry detergents
because of their ion exchange properties. In 1960, Weisz and Frilette at Socony Mobil
found unexpected catalytic activity in zeolites. After this, all the large petrochemical
companies took a greater interest in zeolites and catalytic applications were developed by
them. In 1967 the first high silica zeolite, zeolite beta was synthesized at Mobil by
Wadlinger, Kerr, and Rosinski. This zeolite had significant hydrophobicity and catalytic
activity, leading to research efforts to develop high silica zeolites. In 1980 Flanigan
described the evolution in synthetic zeolite materials from the initial “low silica” zeolites
such as A and X through “intermediate silica” zeolites such as Y,L, omega, and synthetic
mordenite, to “high silica” organophilic MFI zeolites such as ZSM-5 ( ⁄ and
silicalite-1 ( ⁄ , and described the resultant gradation in stability, and,
properties as adsorbents and catalysts. [13]
In 2001, the world market for synthetic zeolites at about 1.6 million tons, was
about half of natural zeolite production. Detergent use accounted for 82% of this
production, with catalysts at 8% and desiccants at 5% [13].
1.2.2 Zeolite Membranes
It follows that a small percentage of total zeolite production goes towards the
production of zeolite membranes for separation. However, it should not be surprising
that these remarkable materials are useful in membrane separation technology based on
the properties of these materials that have already been described. Additionally, the
catalytic properties of zeolites may be combined with their separation properties in the
form of membrane reactors [7]. Zeolite membranes are also being developed for

10
nanoscale applications such as catalytic microreactors, gas sensors, optical sensors, and
resonant sensors [14].
Zeolite membranes have several advantages over polymer membranes [15]:
1. Zeolite membranes do not swell, whereas polymeric membranes do.
2. Zeolites have uniform molecular sized pores that cause significant differences in
transport rates for some molecules, and allow molecular sieving in some cases.
3. Most zeolite structures are more chemically stable than polymeric membranes,
allowing separations of strong solvents or low pH mixtures.
4. Zeolites are stable at high temperatures.
In contrast, zeolite membranes in general cost significantly more to produce than polymer
membranes, and zeolite membranes are more brittle than polymers
The first attempts to use zeolites membranes for separation were in the 1970s.
These membranes were polymer-zeolite composites with poor chemical and thermal
stability. Suzuki reported the first supported zeolite membrane for separation in the
1980s. As of today, only a handful of the known frameworks have been able to be
synthesized into separation membranes.
Zeolite membranes are almost always prepared by liquid phase hydrothermal
synthesis. In this type of synthesis, a zeolite layer is grown on a porous support from a
gel by crystallization at 373-473 K. Important factors in synthesis include:
1. Support chemical composition, structure, and roughness
2. Support position when placed in the gel
3. Gel composition, pH, and temperature

11
The gel usually contains silicon which can be sodium silicate hydroxide, or a metallo-
organic compound such as tetraethyl-orthosilicate (TEOS), and, a source for tetrahedral
framework atoms other than silicon (e.g. Sodium aluminate hydroxide). A structural
directing agent (SDA) or template such as tetrapropyl ammonium hydroxide is required
to make MFI zeolites such as ZSM-5 and silicalite-1. The objective is to create a zeolite
layer with minimum intercrystalline space (nonzeolite pores) and minimum thickness
which is strongly bound to the support. One type of hydrothermal synthesis is in-situ
synthesis. In this type, the zeolite layer is grown directly on the support. Another type of
synthesis is referred to as secondary growth. In this type a seed layer of zeolite crystals is
first deposited on the support by hydrothermal treatment. The seed layer/support is then
dried and calcined, then hydrothermally treated a second time to allow zeolite crystal
nucleation on the seeds forming a defined layer. After the zeolite layer is formed on the
support it is calcined. The template is removed by calcining, opening the zeolite pores.
For industrial applications, zeolite membranes must provide high flux and selectivity.
Highly selective membranes are often thick so as to minimize intercrystalline defects,
while flux is inversely related to membrane thickness [14].
1.2.3 Separations by Zeolite Membranes
Ongoing research has demonstrated the ability of the MFI zeolite membranes
silicalite-1 and ZSM-5, to achieve the following gas separations [10]:
1. n-butane and isobutene
2. Hydrogen and butane
3. Carbon dioxide and nitrogen
4. p-xylene from its isomers

12
5. Hydrogen and carbon dioxide
These separations are accomplished by the molecular sieving effect. For example, p-
xylene can enter the zeolite pores readily, while the other xylene isomers cannot.
Silicalite-1 or ZSM-5 has been able to pervaporatively separate the following
organics from water [10]:
1. Methanol
2. Ethanol
3. 1-propyl alcohol
4. Isopropyl alcohol
5. Acetone
6. Acetic acid
7. P-Xylene from its isomers
One of the difficulties of p-xylene pervaporation separation by MFI zeolite membranes is
that the MFI framework is distorted by high p-xylene loading [1]. Framework distortion
is not seen in pervaporation separation of ethanol/water.
One of the potential industrial applications of the MFI zeolite membranes,
separating ethanol from water, is the production of ethanol from fermentation broth [7].
Continuous removal of ethanol from the fermentation broth is desirable because the
fermentation process stops at an ethanol concentration of about 15 wgt.% Typical
performance with real fermentation broths show fluxes in the order of 1
and
separation factor of 57. Improvement can be obtained by optimizing the support
structure, reducing membrane thickness, and increasing the Si/Al ratio of the MFI zeolite
membrane. The energy required to deliver a unit of ethanol as condensed permeate is the
13
sum of the energy required to evaporate and condense both the ethanol and the water.
Therefore higher selectivity (or separation factor) is desired to achieve high energy
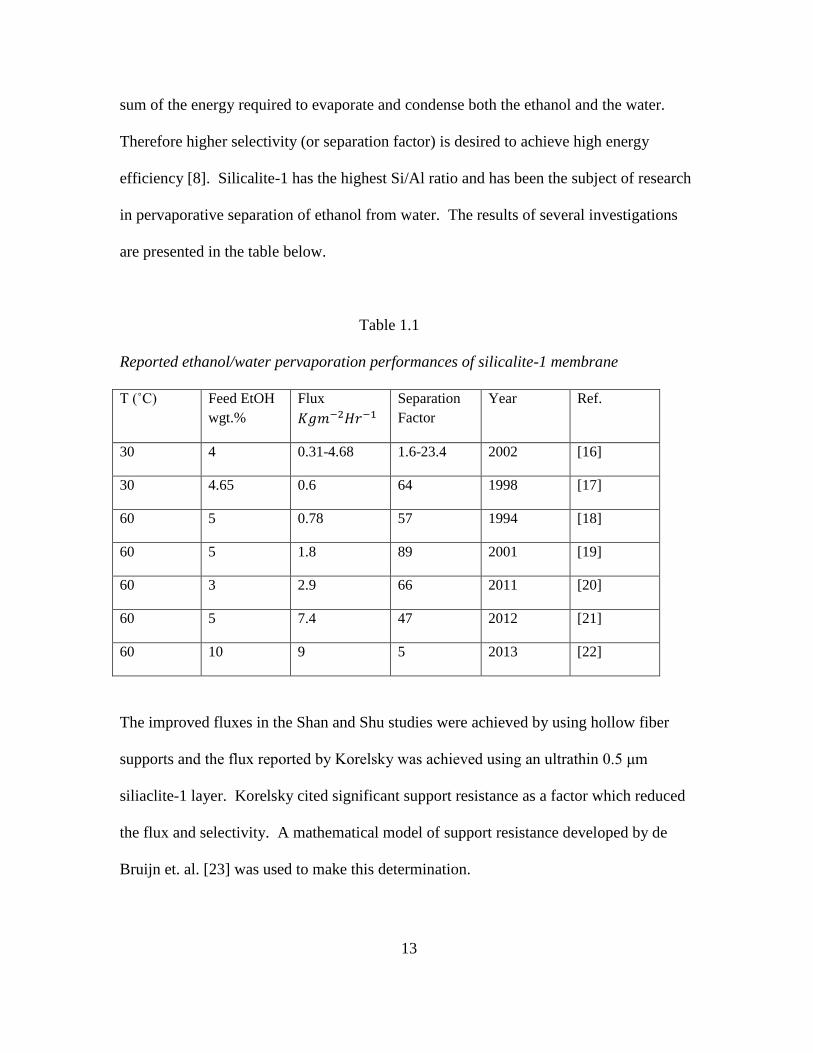
efficiency [8]. Silicalite-1 has the highest Si/Al ratio and has been the subject of research
in pervaporative separation of ethanol from water. The results of several investigations
are presented in the table below.
Table 1.1
Reported ethanol/water pervaporation performances of silicalite-1 membrane
T (˚C) Feed EtOH
wgt.%
Flux
Separation
Factor
Year Ref.
30 4 0.31-4.68 1.6-23.4 2002 [16]
30 4.65 0.6 64 1998 [17]
60 5 0.78 57 1994 [18]
60 5 1.8 89 2001 [19]
60 3 2.9 66 2011 [20]
60 5 7.4 47 2012 [21]
60 10 9 5 2013 [22]
The improved fluxes in the Shan and Shu studies were achieved by using hollow fiber
supports and the flux reported by Korelsky was achieved using an ultrathin 0.5 μm
siliaclite-1 layer. Korelsky cited significant support resistance as a factor which reduced
the flux and selectivity. A mathematical model of support resistance developed by de
Bruijn et. al. [23] was used to make this determination.

14
1.3. TRANSPORT MODEL FOR ZEOLITE MEMBRANES
1.3.1 Support Resistance
The meaning of support resistance has to be clarified. If a feed solution is run
through a support alone, fluxes may be 10 times higher than the fluxes through a
composite zeolite-support membrane. Clearly in this case, the zeolite layer is limiting in
terms of flux. From this perspective it would appear that support resistance is negligible
or unimportant. However, it is the resistance of the support when the zeolite layer is
applied that is important. For this purpose, the interfacial pressure, the pressure at the
zeolite-support interface, is the critical parameter.
Figure 1.4
Pressure drop across a composite membrane

15
In figure 1.4, represent high and low interfacial pressures Curve (a) represents
high support resistance, curve (b) low support resistance
It is possible to calculate the interfacial pressure for any zeolite-support
membrane given the feed composition, operating conditions (temperature and permeate
pressure), and the support permeance values (α and β). It would then be possible to put
the composite zeolite-support membranes into two groups: those with high interfacial
pressure and those with low interfacial pressure. If, for example, the interfacial pressures
were calculated for the studies of silicalite-1 ethanol/water pervaporative separation listed
above, high interfacial pressures would be found [23]. This information may be
sufficient. However, if it is desirable to obtain a more complete understanding of the
individual performances of the membranes or to compare the performances of these
membranes then two quantities would be important. One quantity would be how much
flux relative to the theoretical flux of the stand alone zeolite layer (ideal flux) is lost
because of support resistance. The second quantity would be how much selectivity is lost
because of support resistance relative to the selectivity of the zeolite layer.
1.3.2 Mathematical Modeling of Transport in the Zeolite Layer
Mathematical modeling will be useful to address these concerns. To gain an
understanding as to how, an overview of current mathematical modeling of the zeolite-
support composite membrane will be presented. Mathematical models have been
developed to understand and predict the flux and selectivity of the zeolite-support
composite membrane. These models consider flux and selectivity through the zeolite
layer and through the support separately.
16
A number of simulation techniques have been used and sometimes combined to
describe mixture transport through zeolite membranes. These include Monte-Carlo,
molecular dynamics, transition-state theory, Fick and Onsager formulations, and the
Maxwell-Stefan model. It is generally accepted that the generalized Maxwell-Stefan
formulation offers the most convenient and nearest quantitative prediction of
multicomponent diffusion through zeolite membranes. [24]
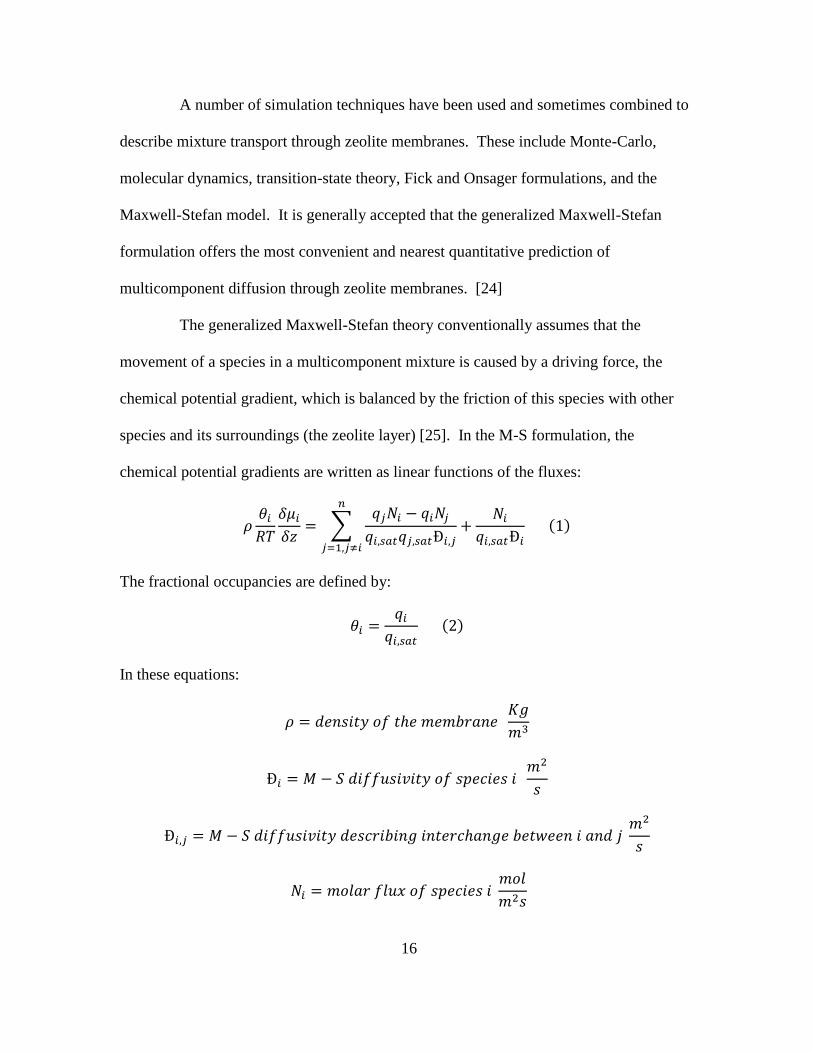
The generalized Maxwell-Stefan theory conventionally assumes that the
movement of a species in a multicomponent mixture is caused by a driving force, the
chemical potential gradient, which is balanced by the friction of this species with other
species and its surroundings (the zeolite layer) [25]. In the M-S formulation, the
chemical potential gradients are written as linear functions of the fluxes:
∑
(
The fractional occupancies are defined by:
(
In these equations:

17
As can be seen, there are two types of M-S diffusivities.
Diffusion in zeolites occurs by a molecular jump process. When the jump of
species i creates a vacancy filled by species i, this is described by , the diffusivities that
reflect the interactions between species i and the zeolite. These diffusivities are referred
to as jump or “corrected” diffusivities. When the vacancy is filled by species j, the
process is described by
Diffusion in zeolites is an activated process, which can be represented (for gas
transport) by:
(
(
) (
In this equation
However in applying the M-S model, the values for are measured and the values for
are calculated by a logarithmic interpolation formula:
(
where
(
and
18
(
Two types of experimental methods, microscopic and macroscopic have been
applied to measure diffusion ( ) in zeolites. [26, 27] Microscopic techniques include
pulsed field gradient NMR and quasi-elastic neutron scattering Macroscopic techniques
can be further divided into steady state and transient methods. Steady state methods
include the Wicke-Kallenbach permeation method and the single crystal membrane
technique. Transient techniques include chromatography, frequency response, zero-
length column, and membrane transient permeation techniques.
The chemical potential gradients in equation (1) may be expressed in terms of the
gradients of the occupancies by introduction of the matrix of thermodynamic factors [Γ]:
∑
(
Where
(
The individual component loadings can be assumed to follow the multicomponent
Langmuir isotherm:
∑
(
Other adsorption isotherms may also be used, as described by Ruthven [27]. In
brief they are:
19
1. At sufficiently low adsorbed phase concentrations on a homogenous surface, the
isotherm should approach linearity (Henry’s law). At higher loadings the
following isotherms (Type 1 in Brunauer’s classification) may be used:
2. The ideal Langmuir model
3. The dual-site Langmuir model (for energetically heterogeneous adsorbents)
4. The Unilan model.
5. The Toth model
6. The Simplified Statistical Model
7. The Gibbs Adsorption isotherm. This model represents an alternative approach to
the other models. In this model, the adsorbed phase is regarded as a fluid held
within the force field of the adsorbent, and is characterized by an equation of
state. The Gibbs adsorption isotherm is written as:
(
(
( spreading pressure
8. The Dubinin-Polanyi theory
9. The ideal adsorbed solution theory (based on integration of the Gibbs isotherm)
An important consideration is that for most real systems there is a significant
loading dependence on temperature. Adsorption is an exothermic process while
vaporization is endothermic. This results in a temperature gradient across the zeolite
membrane. Kuhn et al. [28] suggest that the M-S model should be modified to take the
temperature gradient into account. In the system they studied, water flux across a NaA
20
zeolite membrane, a temperature gradient of 1.3 K was found. The also noted significant
contribution of the support to mass transfer resistance.
The Maxwell-Stefan model can be very useful in predicting the fluxes of the
feed mixture components, and the selectivity of the zeolite. A significant limitation in
using this model is the difficulty in obtaining the input data (diffusivities and component
loadings). Additionally, to analyze the zeolite layer in conjunction with the support
requires coupling with a second model for flux through the support such as the dusty gas
model.
1.3.3 Mathematical Modeling of Transport in the Support Layer
Flux through the support is a combination of Knudsen and viscous flow.
Knudsen flow of a gas (i.e. permeate) occurs in a porous media such as a support when
the mean free path of the gas is greater than the pore diameter. In Knudsen flow the gas
molecules are more likely to hit the walls of the porous media than each other. The
diffusion of gas species i and j may be regarded as independent of each other. Viscous
flow of a gas occurs when the pore diameter is large, or in the absence of pores. In
viscous flow, the flow is inversely rather than directly proportional to the viscosity.
Knudsen flow predominates over viscous flow at low pressures since Knudsen flow is
directly proportional to the pressure at the zeolite/support interface while viscous flow is
directly proportional to the square of that pressure.
On a molecular level, viscosity is the product of the density, mean velocity, and
mean free path of the gas. The product of the mean velocity and mean free path is known
as the kinematic viscosity or “momentum diffusivity”. In Newton’s law of viscosity, the
product of the density and the momentum diffusivity, the viscosity, is the proportionality
21
factor between the shearing force per unit area and its resultant velocity gradient. In an
analogous way, the product of density and mass diffusivity is the proportionality factor
between flux and the mass fraction gradient. Although momentum diffusivity and mass
diffusivity have the same units (
), they differ in that shearing force per unit area is a
tensor while the flux through a membrane is a vector directed perpendicular to the
membrane surface [29]. The flux, mass transfer per area per second, of a permeating
species through the composite membrane is identical through all its layers (conservation
of mass).
Mathematical modeling of flux through the support has been done using the
dusty gas model or a “pseudo binary diffusion” model. A simpler model has been
proposed by de Bruijn [23]: This model uses the assumption of a single permeating
species and the following flux equations for the support:
(
√
(
(
(
Using this model requires the following input data:
1. Total flux through the composite zeolite-support membrane
2. Separation factor

22
3. Feed pressure of the permeating species
4. Permeate pressure of the permeating species
5. Pore diameter of the support
6. Thickness of the support
7. Viscosity of the permeating species
8. Temperature
9. Values for ε and τ (often estimates)
The molar flux of the permeating species is calculated using the total flux and the
separation factor. Once the molar flux of the permeating species is determined then the
equation:
(
has only one unknown, the zeolite-support interfacial pressure, which can then be readily
calculated. Once this pressure is known, de Bruijn used
(
as an index of support resistance.
The de Bruijn study included a large retrospective review of the pervaporation
literature. Pervaporation separations were broken down to two groups: dehydration of
organics, and organics separations. Dehydration separations utilized a hydrophilic zeolite
membrane while organic separations utilized an organophilic (hydrophobic) zeolite
membrane. Fluxes and separation factors were high for the dehydration of organics and
support resistance to mass transfer was found to be significant in that group. Fluxes and
separation factors were significantly lower in the organic separations. However support
23
resistance to mass transfer was found to be significant for several cases within the second
group, included ethanol separation from water using a silicalite-1 membrane. They also
determined that Knudsen flow dominated over viscous flow in the support, well over
90% in systems where the flux was < 5
, with pore diameters up to 5μ.
A significant limitation of the de Bruijn model is that it requires the input of
support properties ε, τ, and pore diameter that may be difficult to obtain. 14 of 18 of the
studies evaluated in the de Bruijn study were examined [19, 30-46]. Values for ε and τ
were not provided in any of the 14. De Bruijn had to use estimates. Similarly, pore
diameter of the support was usually not measured, the value provided by the industrial
supplier of the support was often used. Another limitation is that the “resistance to mass
transfer” does not provide how much flux was lost relative to the theoretical flux of the
stand- alone zeolite layer. Also, an analysis of the relation of “resistance to mass
transfer” to selectivity was not provided.
1.4 RESEARCH MOTIVATION AND STRUCTURE OF THE THESIS
Pervaporation, a membrane separation process, was described in the foregoing
pages. A description of zeolites, and zeolite membranes used for pervaporation was
provided. The use of the zeolite silicalite-1 in pervaporation was summarized. The
results of research efforts investigating silicalite-1 for ethanol/water separation by
pervaporation were shown in table 1.1. The fluxes and separation factors obtained were
significantly less than those achieved by the NaA zeolite membrane used industrially for
ethanol dehydration.
Mathematical models including the Maxwell-Stefan model and the de Bruijn et
al. model were described as ways to evaluate zeolite supported membrane performance.

24
For example, the de Bruijn model suggests that flux is limited by the support in the
pervaporation separation of ethanol from water using a supported silicalite-1 membrane.
The limitations of the Maxwell-Stefan model and the de Bruijn model were discussed.
These limitations, and the relatively poor performance of silicalite-1 for pervaporation
separation of ethanol from water provided the motivation for this thesis.
Objectives of research:
1. To develop a mathematical model of a supported zeolite membrane that provides
information about how much flux and selectivity is lost because of support
resistance.
2. The model should require input data that are easy to obtain.
3. Show the effectiveness of the model using input values obtained experimentally
and from the literature.
The remainder of this thesis will follow the structure:
1. Chapter 2 will present the model along with a graphical analysis
2. Chapter 3 will present the experiments done to evaluate the model and will apply
the model to data from the literature
3. Chapter 4 will present a summary and recommendations
4. Appendices will show the mathematical derivations of the models
25
CHAPTER 2
THE FLUX AND SELECTIVITY MODEL
2.1 BACKGROUND FOR THE MODEL
2.1.1 Introduction
Several types of models for zeolite supported membranes in pervaporation were
illustrated in the previous chapter. The Maxwell-Stefan model for transport through the
zeolite layer coupled with a suitable model, such as the dusty gas model, for transport
through the support was discussed. This type of model uses the assumptions of coupled
binary diffusion through the zeolite layer and coupled Knudsen and viscous flow in the
support to predict fluxes and selectivities. Models such as the Maxwell-Stefan model, are
complex, often requiring a significant amount of difficult to obtain input data. The de
Bruijn et al. model is different in that it is a model of support resistance. It assumes
Knudsen and viscous flow through the support, assumes a single permeating species, and
requires input of intrinsic support values of porosity and tortuosity. Although simpler to
use then the Maxwell-Stefan model, the de Bruijn model is more descriptive than
predictive. It uses the “ratio of mass transfer resistance” to define supports of zeolite
supported membranes with high (dehydrations) and low (organic separations) resistance
in pervaporation - the main conclusion of the de Bruijn study was that flux of the main
permeating species was limited by support resistance, mainly in the case of high flux
dehydration of organics, when using zeolite supported membranes in pervaporation.
The objective of this chapter is to establish simple predictive models for both
flux and selectivity for a zeolite supported membrane in pervaporation. The simplicity of
these models lay in part in the fact that the input data required are the results of Helium

26
permeance studies for the supports and the permeance values of both species for the
zeolite layer obtained from a single pervaporation. The model equations do not use
intrinsic support properties such as tortuosity or zeolite layer diffusivites and adsorptions.
The flux model, in its simplest form, and the selectivity model assume 100% Knudsen
flow through the support. The range of support pore sizes that are compatible with the
synthesis of a zeolite layer, in general, produce predominantly Knudsen flow. Both the
flux and selectivity models are based on the resistance in series model for zeolite
supported membranes. The effect of temperature on the model equations will also be
shown.
2.1.2 Resistance in Series
In an electrical series circuit, the total resistance is the sum of the individual
resistances. Three axioms make this true: Ohm’s law; the current is equal throughout the
circuit; and the total voltage is the sum of the voltage drops across the resistors. The
resistance in series model in membrane science analogously regards the layers of the
membrane as a “circuit” so that the sum of the resistances of the individual membrane
layers is equal to the total resistance of the membrane. The derivation below is given for
a zeolite supported membrane used for pervaporation.
Following the resistance in series model for the electrical series circuit, the
“current” in a membrane system is flux of a species, everywhere equal; and the “voltage”
is the pressure drop of the species across the membrane layers (driving force) where the
total pressure drop is the sum of the individual pressure drops. By Ohm’s law:
(
27
where
Defining the pressure drops of the membrane layers:
(
(
(
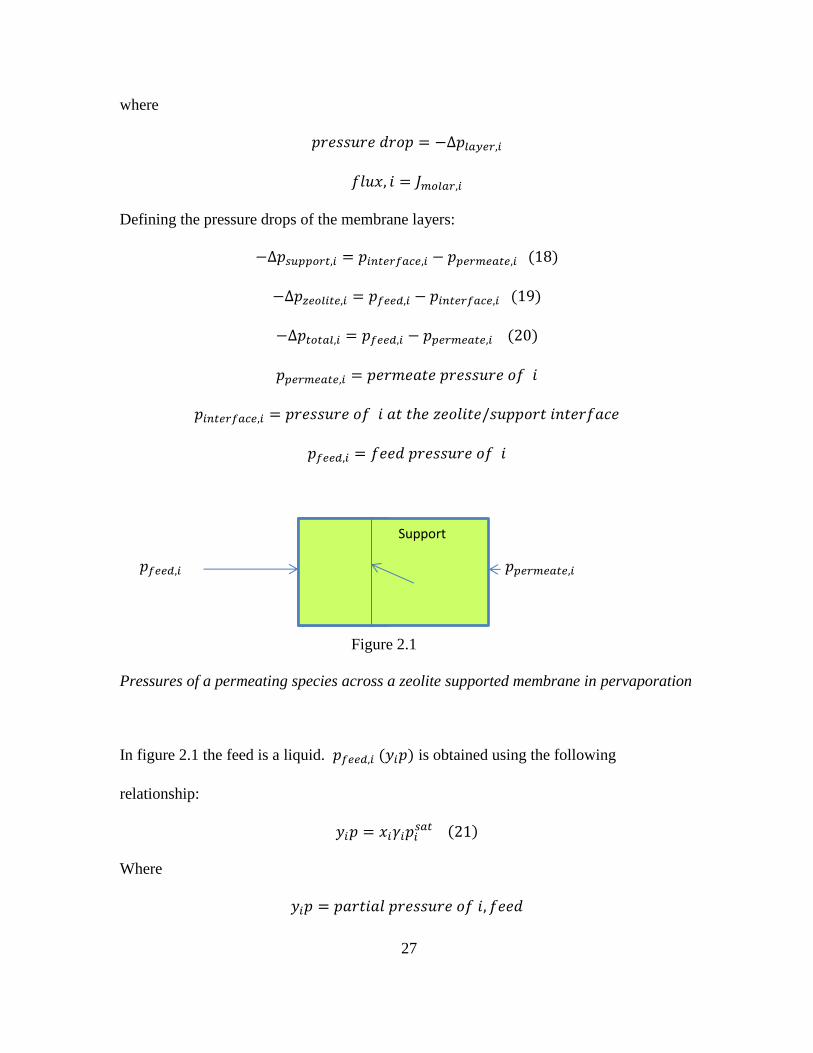
Figure 2.1
Pressures of a permeating species across a zeolite supported membrane in pervaporation
In figure 2.1 the feed is a liquid. ( is obtained using the following
relationship:
(
Where
zeolite
Support
zeolite

28
(
(
The value of is the pressure of species “i” at the zeolite/support
interface. It is a calculated value obtained from the support permeance of “i”and the
molar flux of “i”, as described below. The permeate pressure, can be
calculated if the permeate composition is known and if the total permeate pressure is
known. In pervaporation, the permeate side is set to a vacuum so that a reasonable
assumption is to set the permeate pressure to zero, as will be done here.
Consequently
(
(
(
It was stated in chapter 1 that pressure drop across a membrane layer is the
driving force to produce flux. It can be seen from equation (17) that to keep resistance
low, pressure drop should be small, and flux should be large. That is, the most desirable
case is for a small pressure drop to produce a large flux. It can also be seen from
equations (22) and (23) that the critical pressure parameter, influences both
the resistance of the support and the resistance of the zeolite layer. However, because the
feed pressure is usually much larger than the interfacial pressure or the permeate
pressure, the interfacial pressure influences support resistance more than zeolite

29
resistance. The underlying premise for the model to be developed here, and for zeolite
supported membrane pervaporation performance in general, is that support resistance
should be kept to a minimum for the main permeating species.
The resistance in series model states, for a species:
(
Substituting equations (22 , 23, and 24) into equation (25):
(
Then multiplying equation (24) by results in:
(
Equation (27) shows that the above definitions of resistance and pressure drop for a
zeolite supported membrane satisfy the three axioms of the resistance in series model.
Permeance for a species is defined as:
(
(
Therefore permeance is the reciprocal of resistance. Inserting this relationship into
equation (25) results in:
(
Or:
30
(
2.1.3 Resistance Ratio of Support to Zeolite
The model will construct dimensionless groups from the ratios of the
permeances of the membrane layers. Because of the reciprocal relationship between
resistance and permeance, these dimensionless groups are resistance ratios. For a single
pervaporation, the molar flux terms in the numerator and denominator of the resistance
ratios cancel producing mathematically equivalent ratios of the pressure drops required to
produce the flux. Given the condition of a single pervaporation, the resistance ratios and
the model equations can then be reformulated in terms of ratios of the pressure drops
required to produce the flux obtained from that single pervaporation. The purpose of that
reformulation is to provide a more intuitive understanding of the physical meaning of the
model equations, and to provide a basis for comparison to the de Bruijn et al. model.
The first dimensionless group is “resistance ratio of support to zeolite.” The
resistance ratio of support to zeolite is obtained starting with the following expression for
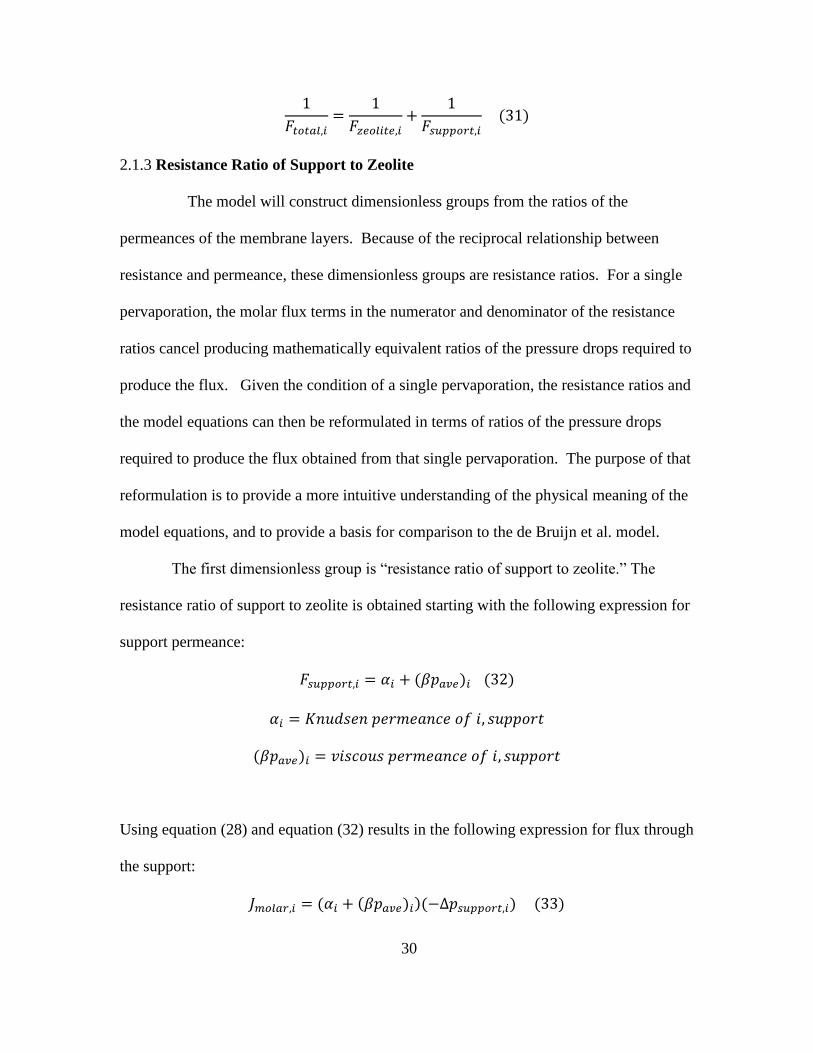
support permeance:
( (
(
Using equation (28) and equation (32) results in the following expression for flux through
the support:
( ( ( (
31
Comparison of equation (33) with equations (11, 13, and 15) shows that
( ) (
√
√
(
And
( ( (
The definition of the resistance ratio of support to zeolite is based on the assumption of
only Knudsen flow through the support. This assumption is valid under the conditions of
low pressure and small pore diameter. As already stated, this assumption is reasonable in
many zeolite supported membranes where fluxes < 5
are generated by pervaporation
[23]. If 100% Knudsen flow is assumed, equation (33) becomes:
( ) (
Then
(
The permeance of the zeolite layer is:
(
And the resistance ratio of support to zeolite, species “i” is defined as:
(
Or, using the reciprocal relationship between permeance and resistance,
(

32
When the molar flux terms in equations (38) and (39) are identical, equations (38) and
(39) can be substituted into equation (40):
(
Equation (42) is valid when the molar flux terms in equations (38) and (39) are identical,
and therefore can be dropped from the numerator and denominator of the RHS of
equation (40). When the model equations are used to predict the results of a second
prevaporation, equation (40) must be used, not equation (42). Both the numerator and
denominator of the RHS of equation (42) represent the pressure drops required to
produce the flux of a single pervaporation across the membrane layers. High pressure
drop as a driving force and low pressure drop per unit of flux (resistance) are both
desirable. The resistance ratio is assigned the following variable designation:
2.1.4 Temperature Dependence Of The Resistance Ratio Of Support To Zeolite (
The first step to obtain the temperature dependence of the resistance ratio of
support to zeolite is to modify equation (40) to show temperature dependency:
(
The temperature dependence of is evaluated (a simplifying assumption of a
single permeating species is made) [10]:
√
(
) (

33
(
Equation (44) can be compared with equation (39). Equation (38) obtains from
quantities that are extrinsic to the membrane. Equation (44) obtains from quantities
that are intrinsic to the membrane. Equation (44) allows an evaluation of temperature
dependency.
√ (
(
)) (
The temperature dependence of is evaluated:
√
√
(
Therefore:
√ (
Substituting equations (45) and (46) into equation (43) results in:
( (
)) (
If represents ethanol at 298 K, the following plot of equation (47) is obtained:

34
Figure 2.2
Temperature dependence of for ethanol
1202.8 K (estimate [47])
Figure 2.2 shows that the ratio
increases exponentially with the difference in the
reciprocals of temperature,
. Therefore increases with increasing temperature.
2.2 THE FLUX MODEL
2.2.1 Relative Permeation Flux
With equation (32) the molar flux of species “i” is obtained by multiplying the
support permeance by the pressure drop across the support.
250 300 350 400 450 5001
1.5
2
2.5
3
3.5
4
4.5
5
5.5
Temperature K (T2)
e
thanol T
2/
eth
anol T
=298

35
( ( ( (
Similarly, the molar flux of species “i” can be obtained by multiplying the zeolite
permeance by the pressure drop across the zeolite layer:
( (
Ideal flux for species “i” is defined as:
( (
The RHS of equation (33) can be equated to the RHS of equation (48). A solution for
is obtained and inserted into equation (48)
The following dimensionless groups are defined:
(
(
A rough estimate of the ratio of viscous flow to Knudsen flow in the support is provided
by (see appendix A).
By dividing equation (48), after substitution for by equation (49), and
substituting the dimensionless groups as defined above, the flux model equation is
obtained:
(
( } (
The flux model equation (54) has the ratio of real to ideal flux, relative permeation flux,
as a function of two other dimensionless groups, and .

36
Equation (52) is displayed graphically:
Figure 2.3
Relative permeation flux as a function of the resistance ratio of support to zeolte at
different representative values
Figure 2.3 shows the effects of the resistance of the support on the pervaporation relative
permeation flux through the zeolite membranes. The larger the resistance, the more
reduction in relative permeation flux. Starting from the flux of the membrane without
support (zero relative resistance), the increase in the resistance of the support has
dramatic effect in reduction in permeation flux. For example, when the resistance of the
support is about the same as that of zeolite, the permeation flux is reduced by about 50%.
0 1 2 3 4 5 6 7 8 9 100
0.1
0.2
0.3
0.4
0.5
0.6
0.7
0.8
0.9
1
Resistance ratio of support to zeolite, i
Rela
tive p
erm
eation f
lux,
i
Support pore size Parameter Γ
Γ=0.99
Γ=0.1
Γ=0.0001

37
Further increase in the support resistance has less effect on reduction in relative
permeation flux. The pore size of the support has some effect on permeation flux, but the
effects are minor to the relative resistance of the support (porosity and thickness).
As can be seen from Figure 2.3 if there is less than 10-20% viscous flow in the support
( , the value of will produce virtually identical curves of vs. .
It is therefore useful to obtain an alternate expression for under the common
circumstance of negligible viscous flow in the support (β=0). This is obtained in the
same way equation (52) is obtained, except that initially equation (37) is used in place of
equation (33). The result is:
(
Equation (53) can also be obtained from equation (52) by taking the limit , using
L’Hospital’s law.
Equation (53) is displayed graphically:

38
Figure 2.4
Relative permeation flux as a function of the resistance ratio of support to
zeolite
The curve in Figure 2.4 represents the lowest curve of all possible curves that could have
been presented in Figure 2.3
It is also possible to express in terms of ratios of pressure drops:
(
( (
(
β support = zero

39
Equation (38) and be substituted into equation (48), and the resultant equation substituted
into equation (49) to get:
(
(
or:
(
(
Equation (55) is valid when the molar flux terms in the numerator and denominator of
equation (54) are identical. Under that circumstance:
This definition is valid only under the stated conditions.
Equations (42) and (55) may be substituted into equation (53) to get:
(
(
Note that equations (55) and (56) are valid only when the molar flux terms in the
numerator and denominator of equations (40) and (54) are identical. Equation (56) can
easily be rearranged to produce equation (26) or equation (27) and therefore is a form of
the resistance in series equation. Since equation (53) is directly obtainable from equation
(56) it also is a form of the resistance in series equation.
In terms of the resistance in series model, equation (56) relates the ratio of
“currents” ( ), as the resistance ratio of zeolite to total, to the resistance ratio of support
to zeolite. Examination of equations (52), (53), and (56) show that the maximum value
40
of , 1, is approached as support resistance approaches zero. When support resistance
approaches zero, the flux of the total membrane approaches the ideal flux of the zeolite
layer; the resistance of the total membrane approaches the resistance of the zeolite layer.
Since there is always a support, there is always support resistance. The goal is to keep
support resistance for the main permeating species to a minimum.
2.2.2 Temperature Dependence of Relative Permeation Flux
To show the effect of temperature on flux, equation (52) is modified to show
temperature dependence:
(
( )} (
The temperature dependence of has been shown as:
( (
)) (
Equation (51) is modified to show temperature dependence:
(
(
Comparing equation (13) and equation (33) shows that:
(
It will be assumed that viscosity is constant over the range of temperatures considered.
This is necessary because there is no readily obtainable formula for the temperature
dependence of viscosity at the relevant temperatures and pressures. The viscosity is
obtained by analysis of empirical plots such as Fig. 1.3-1 from Transport Phenomena.
The pressures of the permeating species in the support during pervaporation are usually
41
well below 5 kPa, so that the “low density limit” in Fig. 1.3-1 would be used to obtain the
viscosity of a permeating species.
Therefore:
(
The temperature dependence of
The mole fraction and activity coefficient (as determined by the Van Laar equation) are
not temperature dependent. From the Antoine equation the temperature dependence of
is:
((
) (
))
(
The temperature dependence of is:
√ (
Therefore:
√ ((
) (
)) (
And:
√ ((
) (
)
( ( (
))
√ ((
) (
) (
(
))
( (
(
)) ) (
42
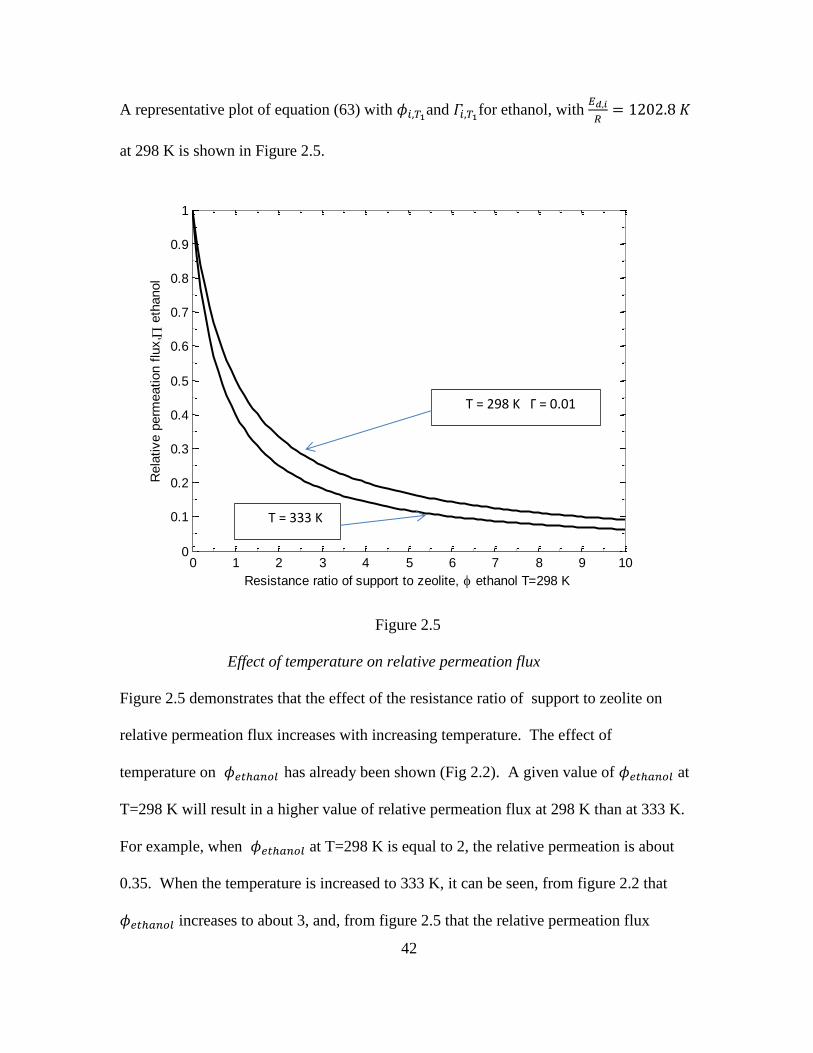
A representative plot of equation (63) with and for ethanol, with
at 298 K is shown in Figure 2.5.
Figure 2.5
Effect of temperature on relative permeation flux
Figure 2.5 demonstrates that the effect of the resistance ratio of support to zeolite on
relative permeation flux increases with increasing temperature. The effect of
temperature on has already been shown (Fig 2.2). A given value of at
T=298 K will result in a higher value of relative permeation flux at 298 K than at 333 K.
For example, when at T=298 K is equal to 2, the relative permeation is about
0.35. When the temperature is increased to 333 K, it can be seen, from figure 2.2 that
increases to about 3, and, from figure 2.5 that the relative permeation flux
0 1 2 3 4 5 6 7 8 9 100
0.1
0.2
0.3
0.4
0.5
0.6
0.7
0.8
0.9
1
Resistance ratio of support to zeolite, ethanol T=298 K
Rela
tive p
erm
eation f
lux,
eth
anol
T = 298 K Γ = 0.01
Γ
T = 333 K

43
decreases to about 0.25. Experimentally, flux increases with increasing temperature.
Thus, the increase in ideal flux with increasing temperature is greater than the increase in
real flux. This effect is more pronounced at lower values of the resistance ratio of
support to zeolite.
The temperature dependence of when β=0 is readily obtained: In this case
(
Then equation (47) is applied:
( (
)) (
So therefore:
( (
))
(
A representative plot of equation (64) with for ethanol at 298 K is shown in Figure
2.6:

44
Figure 2.6
Effect of temperature on relative permeation flux, β=0
Figure 2.6 demonstrates that the effect of the resistance ratio of support to zeolite on
relative permeation flux increases with increasing temperature. This effect is more
pronounced at lower values of the resistance ratio of support to zeolite. The curve at T =
298 K is identical to the curve in figure 2.4. Both flux equations (with and without
viscous flow in the support) show a similar temperature dependency.
0 1 2 3 4 5 6 7 8 9 100
0.1
0.2
0.3
0.4
0.5
0.6
0.7
0.8
0.9
1
Resistance ratio of support to zeolite, ethanol T=298 K
Rela
tive p
erm
eation f
lux,
eth
anol
T = 298 K
T = 333
K
45
2.3 THE SELECTIVITY MODEL
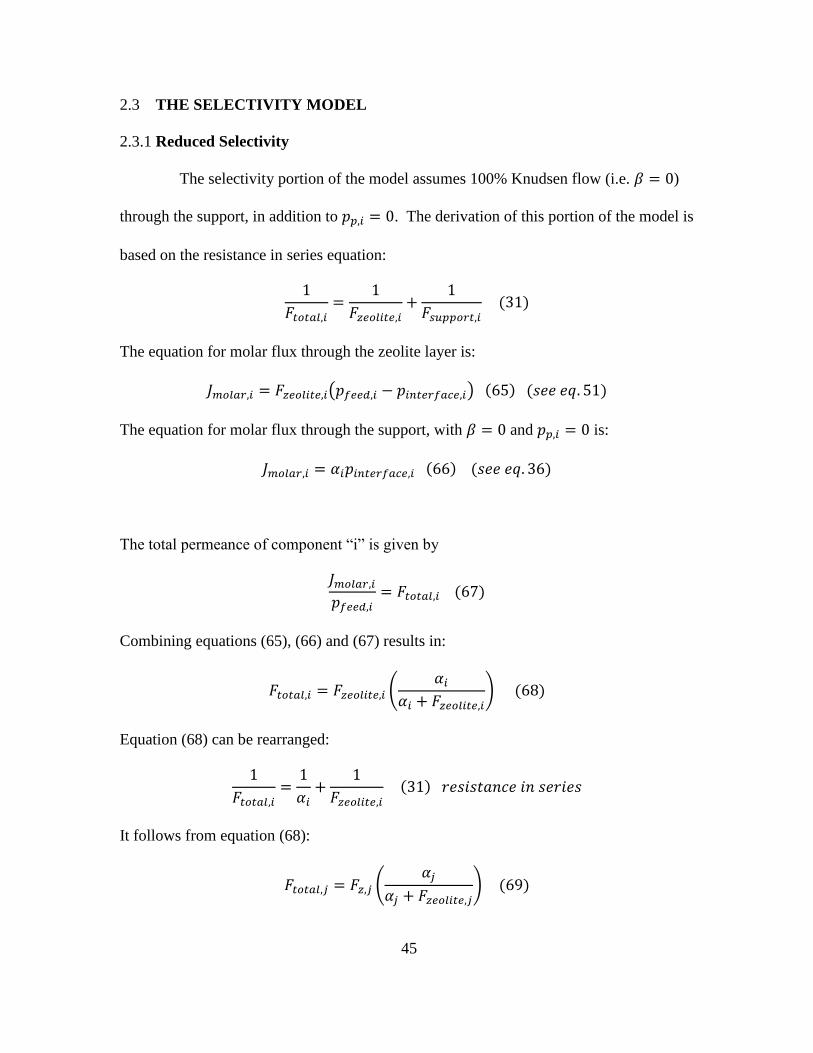
2.3.1 Reduced Selectivity
The selectivity portion of the model assumes 100% Knudsen flow (i.e. )
through the support, in addition to . The derivation of this portion of the model is
based on the resistance in series equation:
(
The equation for molar flux through the zeolite layer is:
( ) ( (
The equation for molar flux through the support, with and is:
( (
The total permeance of component “i” is given by
(
Combining equations (65), (66) and (67) results in:
(
) (
Equation (68) can be rearranged:
(
It follows from equation (68):
(
) (

46
The selectivity model uses the following dimensionless groups:
(
(
(
√
(
(
( (
Combining equations (68,69, and 70) and substituting equations (40, 71, 72, and 74)
results in the selectivity model equation (see Appendix A):
(
In the selectivity model equation,
, a dimensionless group, is a function of two
dimensionless groups: Ln and . Equation (75) is shown graphically in Figure 2.7:
47
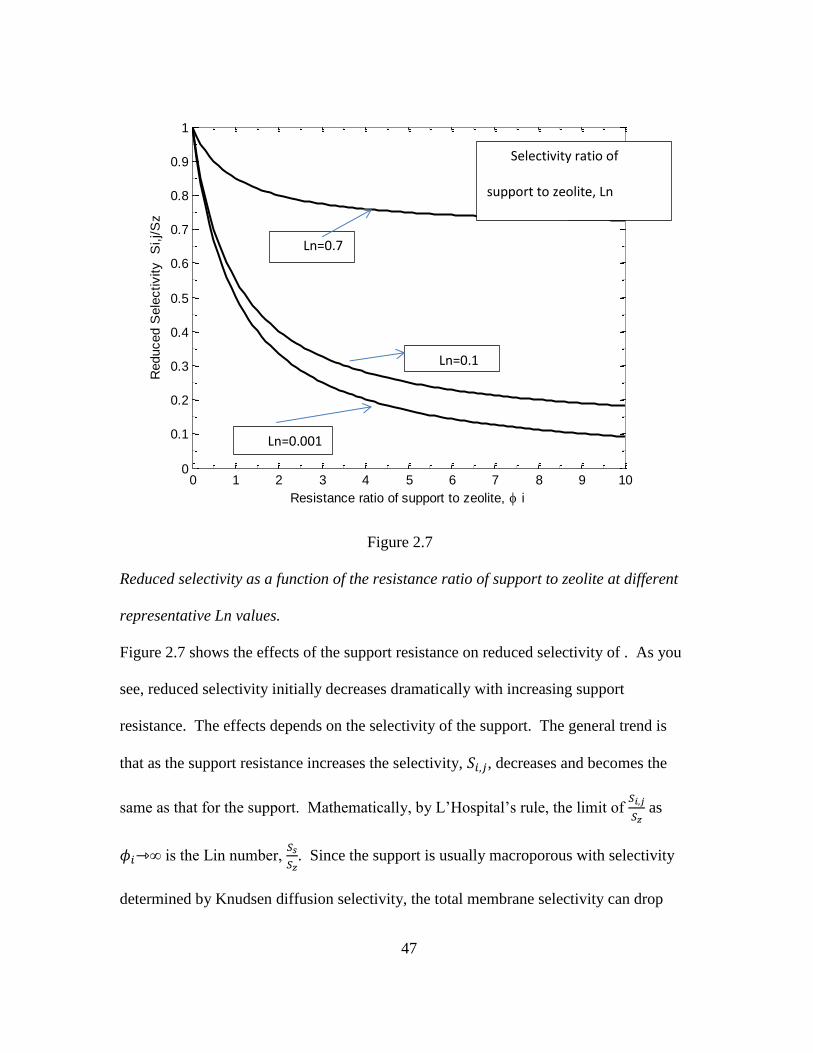
Figure 2.7
Reduced selectivity as a function of the resistance ratio of support to zeolite at different
representative Ln values.
Figure 2.7 shows the effects of the support resistance on reduced selectivity of . As you
see, reduced selectivity initially decreases dramatically with increasing support
resistance. The effects depends on the selectivity of the support. The general trend is
that as the support resistance increases the selectivity, , decreases and becomes the
same as that for the support. Mathematically, by L’Hospital’s rule, the limit of
as
∞ is the Lin number,
. Since the support is usually macroporous with selectivity
determined by Knudsen diffusion selectivity, the total membrane selectivity can drop
0 1 2 3 4 5 6 7 8 9 100
0.1
0.2
0.3
0.4
0.5
0.6
0.7
0.8
0.9
1
Resistance ratio of support to zeolite, i
Reduced S
ele
ctivity
Si,j/S
zSelectivity ratio of
support to zeolite, Ln
Ln=0.7
Ln=0.1
Ln=0.001
48
significantly and approaches to the Knudsen selectivity if the zeolite membrane is
prepared on the support with resistance several times that of the zeolite layer. The Lin
number has a significant effect on reduced selectivity.
It may be observed that:
(
So
(
(
Equation (75) can be expressed in terms of ratios of pressure drops with a similar method
used to obtain equations (42) and (56), the assumption that the molar flux terms in the
numerator and denominator of reduced selectivity, Lin number, and cancel. The
following results are obtained:
(
( (
( (
( (
( (
(
49
Equation (77) is equation (53) used twice; for species “i” and for species “j”, i.e. equation
(53) for species “i” divided by equation (53) for species “j”. Therefore equation (77),
like equation (75) is a form of the resistance in series equation.
The maximum value of reduced selectivity, 1, is approached when support
resistance approaches zero. As support resistance approaches zero, the selectivity of the
overall membrane approaches the selectivity of the zeolite layer. As previously stated,
the goal is to keep support resistance for the main permeating component, species “i”, as
close to zero as possible so that is as close to one as possible. On the other hand, the
goal for species “j” is to obtain large support resistance and a value of as small as
possible. is always less than since the ratio of real fluxes (i/j) is always less than
the ratio of ideal fluxes (i/j).
2.3.2 Temperature Dependence of Reduced Selectivity
The derivation starts with the following equations:
√ (
(
)) (
√ (
First
(
Therefore:
(
For :
50
(
Substituting equation (44) for both i and j into equation (83) results in:
( (
) (
) (
( (
)) (
For the Ln number:
(
Substituting equations (82) and (84) into equation (85) results in:
( (
)( )
(
Then combining equations (46) and (86) results in:
((
) (
)) (
Therefore:
(
(( ) (
)
( (
))
(
In the case of silicalite-1,
, [45] and
, (estimate,
[47])
This results in the following plot ( of equation (88):
51
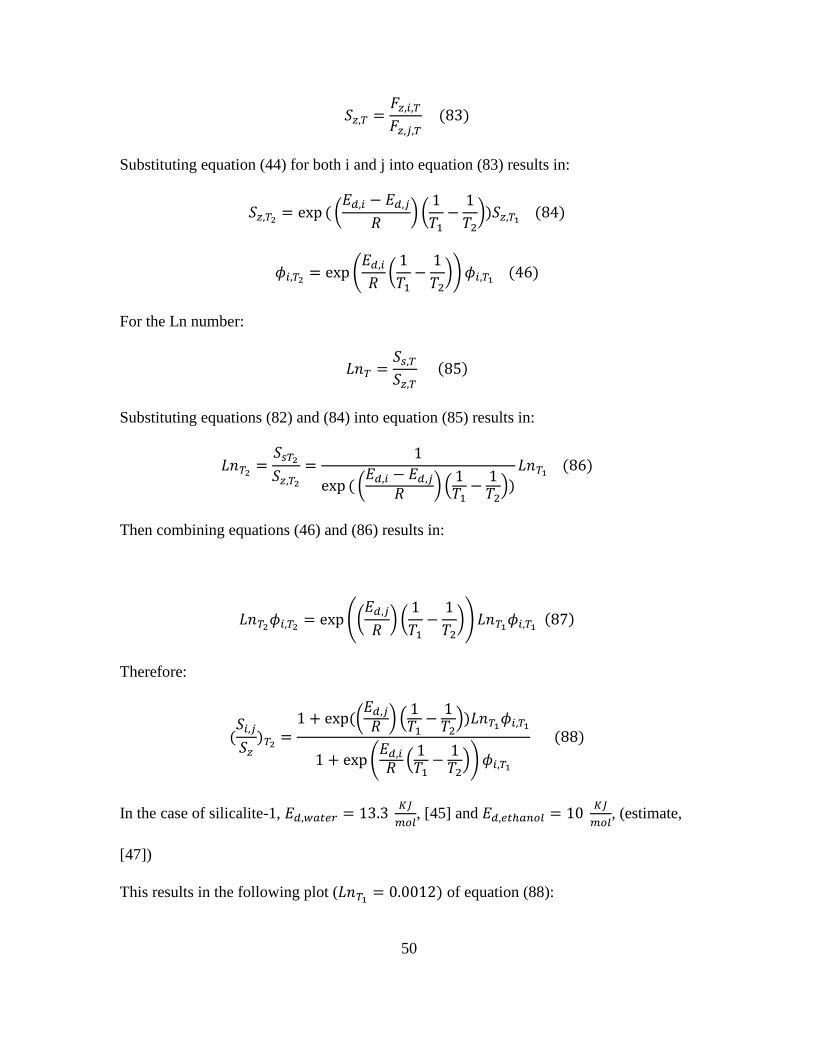
Figure 2.8
Effect of temperature on reduced selectivity with and for ethanol at 298 K
Figure 2.8 demonstrates that the effect of relative support resistance on reduced
selectivity is increased with increasing temperature. Flux is increased by increasing
temperature. The increase in the ratio of ideal fluxes (i/j) is greater than the increase in
the ratio of real fluxes (i/j). The effect is more significant at lower resistance ratios.
2.4 COMPARISON OF THE CURRENT MODEL TO THE DE BRUIJN MODEL
The de Bruijn model used a ratio of pressure drops to define mass transfer
resistance in the support (eq. 16). This ratio which, for purposes of comparison, may be
referred to as the resistance ratio of support to total membrane, is similar to and
provides similar information as the flux model:
0 1 2 3 4 5 6 7 8 9 100
0.1
0.2
0.3
0.4
0.5
0.6
0.7
0.8
0.9
1
Resistance ratio of support to zeolite, ethanol T=298 K
Reduced S
ele
ctivity
Si,j/S
z e
thanol/w
ate
r
T = 298 K
T = 333 K
52
(
(
(
(
(
Therefore:
( (
Since equation (27) applies, the model parameters can be derived from the
“ ” ratio. However, equation (89) is valid only when the
molar flux terms in the resistance ratios can be cancelled (as described for equation 55).
Thus the de Bruijn model is solely a flux model which can only be used to describe
completed pervaporation runs. It is not a selectivity model and it is not predictive as the
flux and selectivity models described in this thesis are, as shown in chapter 3.
The de Bruijn study separates the results of pervaporation studies into two
groups. In one group comprised mostly of dehydration separations, the flux is limited by
the support. In the other group, mostly organic separations from water, the flux is not
limited. The flux model, as described in this thesis, defines the reason for the flux
limitation in the first group. Dehydration separations by pervaporation generally have
higher zeolite layer permeances and thus higher resistance ratios of support to zeolite.
The effect on real flux and relative permeation flux is described quantitatively by the flux
model equation.

53
2.5 CONCLUSIONS
The resistance in series model was found to fit pervaporation in a zeolite
supported membrane. In a single compnonent pervaporation, flux is identical across the
membrane, and the total pressure drop is the sum of the individual pressure drops across
the membrane layers. Resistance was defined as the ratio of pressure drop to flux, and is
the reciprocal of permeance. The flux model introduced the dimensionless variable ,
relative permeation flux.
The flux model also introduced the dimensionless variable , to include
viscous flow through the support. However, it was demonstrated that up to 10-20%
viscous flow had a negligible effect on as a function of . The flux model was then
simplified to include only Knudsen flow in the support, identical to the selectivity model
in that respect. As will be shown in the next chapter, the presence of a significant amount
of viscous flow in the support will limit the applicability of the model equations.
The selectivity model introduced the dimensionless variable
, reduced
selectivity. As an aid to understanding the physical meaning of the flux and selectivity
models, and to facilitate comparison with the de Bruijn et al. model, both the flux and
selectivity models were recast in terms of resistance ratios as ratios of pressure drops,
although the recast equations can only be applied when the molar flux terms in the
original equations are identical (single pervaporation run). Additionally, , , and
were shown to be functions of temperature. increased with temperature. , and
were shown to decrease with increasing temperature when shown as functions of at .

54
The dimensionless variable was introduced as the resistance ratio of support
to zeolite; the definition was based on 100% Knudsen flow through the support. is the
independent variable for the flux and selectivity models. Equation (40) shows that can
be varied by changing or . The effects of varying and will be
discussed in the next chapter.
When pervaporation characterization of a feed mixture is carried out using a
zeolite supported membrane, the zeolite layer permeances of the feed components can be
calculated. If may then be desirable to learn what the fluxes and selectivities would be if
the same zeolite layer was coupled to different supports. In that case, the only additional
data needed would be the results of helium permeance studies of those additional
supports. The values of the zeolite layer permeances can then be coupled with the results
of the helium permeance values of those additional supports, and then the fluxes and
selectivities of the to be synthesized zeolite supported membranes can be predicted using
the model equations. This is the main point of this thesis, and will be further discussed in
the following chapters.

55
CHAPTER 3
EXPERIMENTAL AND RESULTS
3.1 OVERVIEW
The previous chapter introduced the flux and selectivity models. The
independent variable for both models is the resistance ratio of support to zeolite, species
“i”, . is a function of the zeolite permeance, and the Knudsen permeance
of the support, .
The effect of altering the permeance of the zeolite layer can be analyzed by
substituting equation (40) into equation (53) for the flux model and equation (75) for the
selectivity model. Zhou et al [48]., for example, increased the permeance (eq. 44) of the
zeolite layer by making the zeolite layer ultrathin. An increase in flux was observed but
we can see from equation (53) that relative permeation flux will decrease since the
increase in ideal flux will be greater than the increase in real flux. From equation (75), if
the permeance of the zeolite layer is increased while the selectivity of the zeolite layer
remains the same (the Lin number is unchanged), then reduced selectivity and real
selectivity will decrease. On the other hand if the increase in permeance of the zeolite
layer causes an unpredictible change in the selectivity of the zeolite layer, the effect on
reduced selectivity would also be difficult to predict.
There is also current research investigating ways to increase support permeance.
The general approach for increasing support permeance (decreasing support resistance) is
found from examination of equation (35). It has been confirmed experimentally that
increasing the porosity of the support will increase its permeance [53]. There is a limit,

56
depending on the support material, as to how much the porosity can be increased in terms
of structural stability. Increasing support pore diameter will also increase support
permeance. However, this approach is limited because too large a pore diameter will
result in intrusion of the zeolite into the support during synthesis [53]. Decreasing
support tortuosity in theory would lead to an increase in support permeance, but this
approach does not appear to be the subject of ongoing research. Decreasing the thickness
of the support will also lead to increased support. This approach has been used by Shan
et al. and others to increase the flux through a zeolite supported membrane. In the Shan
study, alumina hollow fibers were used to increase the flux of silicalite-1 supported
membranes for pervaporation separation of ethanol from water [20].
The effect of increasing support permeance on flux can be readily evaluated by
the current model through use of equations (41) and (53). Increased support permeance
will result in a smaller value of the resistance ratio of support to zeolite. This will result
in an increase in relative permeation flux. This effect is caused by an increase in real
flux; there is no change in ideal flux through the zeolite layer.
The effect of increasing support permeance on selectivity can be evaluated by the
current model through use of equations (41) and (75). In this case reduced selectivity is
increased by an increase in total selectivity; the selectivity of the zeolite layer is not
changed by a change in support permeance.
The objective of this chapter is to show the effect of different supports on the flux
and selectivity of a silicalite-1 supported membrane, experimentally, and by using the
flux and selectivity models. To accomplish this, the permeance of the original support

57
was decreased by adding an additional support layer, as described below. This approach
is novel since support permeance is decreased rather than increased.
The next section of this chapter will describe how zeolite membranes are made
and characterized in our laboratory. The strategy used to experimentally verify the flux
and selectivity model will be explained. A subsequent section will present the results of
the experiments done, and will also present results obtained from the literature. The
ability of the flux and selectivity model equations to predict the experimental results will
be analyzed. This will be followed by the conclusion.
3.2 EXPERIMENTAL
3.2.1 Membrane synthesis
Silicalite-1 suspension with a concentration of 2.0 wt% was coated onto a YSZ
coated porous stainless steel support by a dip-coating method to make the silicalite seed
layer. The dip-coating time was about 5 s. The coated support was dried in an oven at
40˚C with a relative humidity of 60% for 2 days, followed by calcination at 550˚C for 8
hr in air. The dip-coating and calcination of the silicalite seed layer was repeated three
times to ensure complete coverage of the support with silicalite seeds. The final silicalite
layer was applied by secondary growth from an alumina-free solution with composition
0.9 NaOH:0.9 TPABr:4 Si :1000 O:16 EtOH at 175˚C for 8 hr. The synthesized
silicalite-1 supported membrane was washed and dried, then calcined at 500˚C in air to
remove template [49].
58
3.2.2 Experimental Method
A pervaporation study with the as-synthesized silicalite-1 YSZ/SS supported
membrane was done using an ethanol/water feed, 5 wt% ethanol, at 298 K. Following
this, additional pervaporation studies were done at the same conditions by adding
additional support layers, stainless steel and γ-alumina, in separate experiments. The
additional support was added by physically juxtaposing it to the support side of the initial
silicalite-1 YSZ/SS supported membrane in the pervaporation cell. The silicalite-1 layer
was not physically or chemically altered by this process. The effect of adding the
additional support layer on membrane performance could then be analyzed.
3.3.3 Characterization
The silicalite-1 surface morphology and cross section were examined by a
Philips PEI XL-30 scanning electron microscope at accelerating voltage of 15 kV after
gold deposition. Its crystal structure was examined by powder X-ray diffraction with a
conventional Bruker D8 diffractometer at 20 kV, 5 mA with a scan speed of 2˚/min and a
step size of 0.02˚ in 2θ, using CuKα (λ=0.1543 nm) radiation [50]. The supports were
characterized by a steady state single gas (Helium) permeation system. The support was
mounted in a stainless steel membrane cell and sealed by silicone O-rings. The
permeation area of the support was 2.24 x . The feed was Helium without
diluent at a feed pressure of 270 kPa. The permeate side was connected to a bubble flow
meter at atmospheric pressure without sweeping gas so the support permeate side was
maintained at 101 kPa (1 atm). The flow rate of the feed effluent was controlled at 50
ml/min [51].
59
The separation performances of the initial silicalite-1 YSZ/SS supported
membrane, and of the sililcalite-1 YSZ/SS supported + additional support layer
membranes, were evaluated through pervaporation of 5 wt% ethanol in water at 298 K
using the system described by O’Brien-Abraham et al. The permeate side of the cell was
kept under vacuum at 20 Pa and the permeate was condensed into a liquid nitrogen cold
trap. The mass of the condensed permeate was used to calculate the overall flux through
the membrane according to J=W/(At), where W is the weight of the permeate (Kg), A is
the membrane area ( and t is the time (Hr) for the sample collection. The amount of
ethanol in the permeate was measured with a gas chromatograph (GC, Model 8610C, SRI
Instruments, Menlo Park, CA). The permeate was diluted with a known quantity of water
prior to measurement by the gas chromatograph. Permeance and selectivity of the
silicalite-1 YSZ/SS supported membrane, for the silicalite-1 layer and the total membrane
were calculated from the measured flux and separation factor following the methodology
recommended by Baker [2]. The total permeance was calculated using equation (67),
permeate pressure assumed to be zero. The feed pressure for a permeating species was
calculated using equation (21). The experimental results will be presented according to
the following flow chart:

60
Figure 3.1
Flow chart for presentation of results
Single
layer
support
Zeolite/sngl layer
support pervap data
(molar fluxes, feed
Zeolite
layer
permeances
support
layer helium
permeances
zeolite
composite support
pervap data (molar
fluxes, feed
Z/S’
Experimental Data 1
Z/S’
Model data 2

61
3.3 RESULTS
3.3.1 Experimental Results
Figure 3.2 shows the surface SEM image of the silicalite membrane
synthesized on the YSZ modified stainless steel support. As shown, the membrane is free
of any defects. In the XRD spectra of the membrane shown in Figure 3.3, the diffraction
peaks from silicalte membrane layer, YSZ layer and the SS support can be clearly
identified. The much stronger peaks for the siliclaite layer as compared to the peaks from
support suggests a thick silicalite layer.
Figure 3.2
Surface SEM image of silicalite-1 membrane

62
Figure 3.3
XRD of silicalite-1 membrane on YSZ/SS support
10 20 30 40 50 60
Silicalite
YSZ
SS
2

63
100000 120000 140000 160000 1800000.0
1.0x10⁻⁵
2.0x10⁻⁵
3.0x10⁻⁵
4.0x10⁻⁵
YSZ modified SS suport
Gamma-alumina support
He p
erm
ean
ce,
mo
l/Psm
2
Pave
, Pa
Pure SS support
Figure 3.4
He steady state test of various supports

64
As per the flow chart (Figure 3.1) the first table shows the results of the Helium
permeance studies for the supports. The values for α and β were converted from helium
to ethanol (equations 73 and 59).
Table 3.1
Results of helium permeance
Support type
YSZ/SS 1.99 x 5.83 x
SS 3.98 x 1.18 x
γ-alumina 5.81 x 1.19 x
Pervaporation was done using the silicalite-1 YSZ/SS supported membrane. The
results of this study are presented in tables 3.2.

65
Table 3.2
Pervaporation characterization for silicalite-1 YSZ/SS supported membrane
Parameter Units Value
Feed wt% ethanol 5
Temperature K 298
Flux 0.051
Separation Factor 21
Pa 753
Pa 3051
Pa 81
Pa 117
1.62 x
3.74 x
support 99.9
2.41 x
1.27 x
1.89
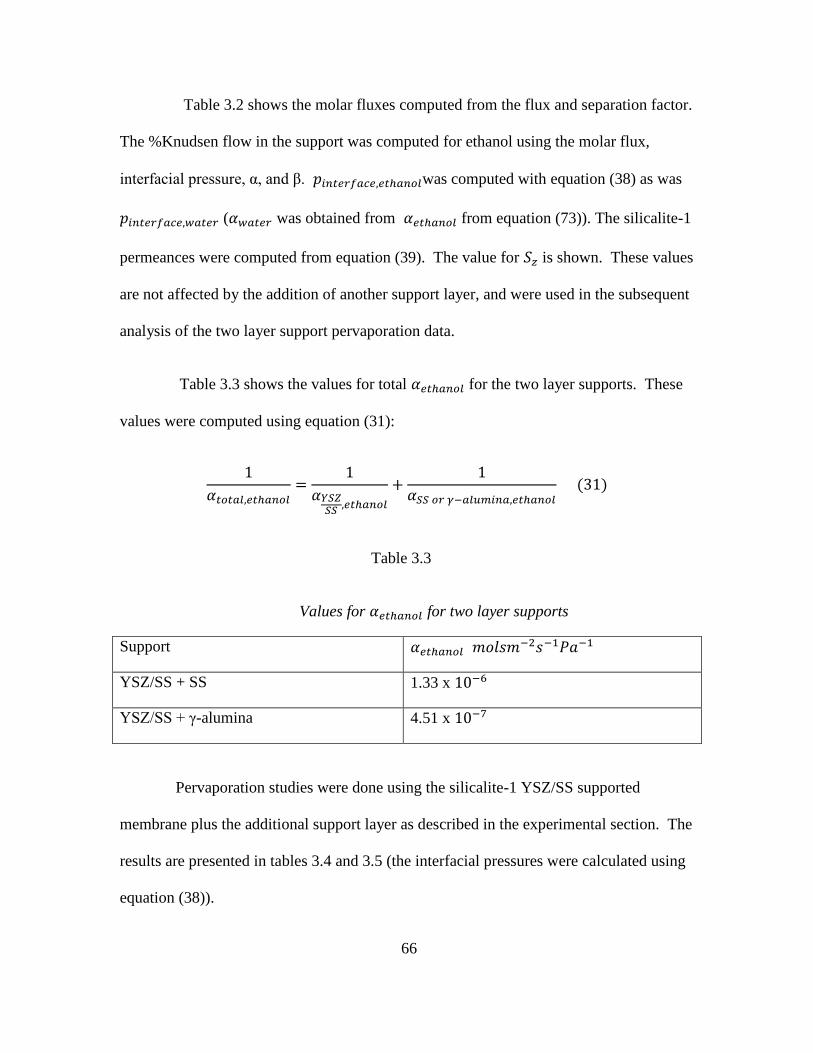
66
Table 3.2 shows the molar fluxes computed from the flux and separation factor.
The %Knudsen flow in the support was computed for ethanol using the molar flux,
interfacial pressure, α, and β. was computed with equation (38) as was
( was obtained from from equation (73)). The silicalite-1
permeances were computed from equation (39). The value for is shown. These values
are not affected by the addition of another support layer, and were used in the subsequent
analysis of the two layer support pervaporation data.
Table 3.3 shows the values for total for the two layer supports. These
values were computed using equation (31):
(
Table 3.3
Values for for two layer supports
Support
YSZ/SS + SS 1.33 x
YSZ/SS + γ-alumina 4.51 x
Pervaporation studies were done using the silicalite-1 YSZ/SS supported
membrane plus the additional support layer as described in the experimental section. The
results are presented in tables 3.4 and 3.5 (the interfacial pressures were calculated using
equation (38)).

67
Table 3.4
Pervaporation characterization silicalite-1 YSZ/SS+ stainless steel supported membrane
Parameter Units Value
Feed wt% EtOH 5
Temperature K 298
Flux 0.049
Separation Factor 20.5
Pa 753
Pa 3051
Pa 115
Pa 171

68
Table 3.5
Pervaporation characterization silicalite-1 YSZ/SS+ γ-alumina supported
membrane
Parameter Units Value
Feed wt% EtOH 5
Temperature K 298
Flux 0.028
Separation Factor 15
Pa 753
Pa 3051
Pa 165
Pa 335
The following tables show the values for the model parameters. Table 3.6 shows
the values for computed by equation (40).
Table 3.6
Values for
Support
YSZ/SS 2.41 x 1.99 x 0.121
YSZ/SS + SS 2.41 x 1.33 x 0.181
YSZ/SS + γ-
alumina 2.41 x 4.51 x 0.534

69
Table 3.7 shows the parameters for the flux model. The fourth column shows
the values for computed from equation (50). The value of was retained
from the silicalite-1 YSZ/SS supported membrane (single support layer) pervaporation
study since its value is derived from from that study. The fifth column
shows the values of computed from equation (53). Negligible viscous flow was
assumed in all cases based on the values of for the individual support layers.
The fourth column corresponds, for the two layer supports, to box 1 in the flow diagram
(Figure 3.1). The fifth column, for the two layer supports, corresponds to box 2 in the
flow diagram (Figure 3.1)
Table 3.7
Flux model parameters silicalite-1
Support
(
)
(experimental)
(eq.
53)
YSZ/SS 1.62 x 1.81 x 0.892 0.892
YSZ/SS+SS 1.54 x 1.81 x 0.851 0.850
YSZ/SS+γ-
alumina 7.46 x 1.81 x 0.412 0.652
Table 3.8 shows the parameters for the selectivity model.
was computed in
two ways. For the first way, was computed using the molar fluxes and feed pressures
according to equations (66 and 69 ). Then , was divided by the value of shown in
the table, and the values shown in column 4. This computation corresponds, for the two

70
layer supports, to box 1 in the flow diagram (Figure 3.1).
was also computed using
the values of Ln and , using equation ( 74), and the values shown in column 7.
This computation corresponds, for the two layer supports, to box 2 in the flow diagram
(Figure 3.1).
Table 3.8
Selectivity model parameters silicalite-1
Support (eqs.
66
and 69)
⁄
(experimental)
Ln ⁄
(eq.75)
YSZ/SS 1.75 1.89 0.926 0.121 0.331 0.926
YSZ/SS+SS 1.71 1.89 0.905 0.181 0.331 0.897
YSZ/SS+γ-
alumina
1.25 1.89 0.661 0.534 0.331 0.767
An examination of tables 3.7 and 3.8 shows that, for the silicalite-1 YSZ/SS
supported membrane (single layer support), the model values are identical to the
experimental values. In this case, following the derivation of the model equation,
equations (50) and (53) give the same value for . For selectivity, again following
the derivation of the model, equations (70) and (71) give the same value for
as
equation (75).
The situation clearly changes with the addition of another support layer. The
stainless steel support had higher permeance (less resistance) than the YSZ/SS support.
71
Adding the stainless steel support to the YSZ/SS support caused an increase in support
resistance, as would be expected, but the effect on the resistance ratio of the support to
zeolite, , was small. Consequently, the flux and separation factor with the
addition of the stainless steel support were almost the same as those obtained with the
silicalite-1 YSZ/SS supported membrane (single layer support). There was < 5%
difference in and
values, as obtained from experimental data and as obtained
from the model equations, for the silicalite-1 YSZ/SS+SS supported membrane and the
silicalite-1 YSZ/SS supported membrane.
The γ-alumina support had lower permeance (more resistance) than the YSZ/SS
support. Adding this support to the YSZ/SS support caused a larger increase in support
resistance than adding the stainless steel support layer. The effect on the resistance ratio
of support to zeolite was larger. Consequently the flux and separation factor were
significantly less than those obtained with the silicalite-1 YSZ/SS supported membrane
(single layer support). There was a much larger difference in the model values for
and
between those obtained for the silicalite-1 YSZ/SS supported membrane
(single layer support) and those obtained for the silicalite-1 YSZ/SS+ γ-alumina
supported membrane (two layer support). There were also significant differences
between and
obtained experimentally and and
obtained from the
model equations for the silicalite-1 YSZ/SS+ γ-alumina supported membrane (two layer
support).

72
The significance of these findings will be discussed below. At present it is
sufficient to notice that the model values for (column 5 in table 3.10) and
(column 7 in table 3.11) for the silicalite-1 YSZ/SS+additional supports were obtained
without the need for a second pervaporation study. was obtained from the
composite support data, and , , and Lin were retained from the original
silicalite-1 YSZ/SS supported membrane (single layer support) pervaporation study.
Thus the model equations give predictions of the results of the second pervaporation
study.
3.3.2 Literature examples
The next section will review two studies from the literature. One is a case from
the de Bruijn et al. study, and the second is a case from the Zhou study. The case from
the de Bruijn study is a silicalite-1 supported membrane separating ethanol from water.
Thus, it is the same pervaporation separation using the same zeolite as we are
investigating in our laboratory. In contrast, the case from the Zhou et al. study is a
zeolite-X supported membrane used for the pervaporation dehydration of ethanol. The
method of data presentation will follow that used for the presentation of experimental
results (Figure 3.1), although no additional support layers were added in these studies. It
is important to note that species “i” for the de Bruijn study is ethanol; for the Zhou study
it is water. The support in the de Bruijn study [23] was an α-alumina disc; the support in
the Zhou study [48] was a two layer alumina disc. The data for the supports is shown in
table 3.9.

73
Table 3.9
Support values, literature
Support
%Knudsen
α-alumina [21] 1.51 x 8.74 x 98
Alumina int layer
[46]
1.46 x 2.04 x 94
Alumina bot layer 1.02 x 9.12 x 35
Int+bottom 6.00 x - -
The value for for “Int+bottom” in table 3.9 is a composite value calculated
from the values of from the individual layers using equation (30), assuming 100%
Knudsen flow. The values for %Knudsen flow in table 3.9 and the values for the
interfacial pressures in table 3.10 were obtained using equations (11-14). Since the total
flux is known, and the values for the constants were given, equations (11, 13, and 15)
provide a solution for the interfacial pressure. Table 3.10 shows the results of the
pervaporation studies.

74
Table 3.10
Pervaporation characterization, literature
Parameter Units De Bruijn Zhou
zeolite Silicalite-1 X
support α-alumina Two layer alumina
Species “i” ethanol water
Feed wt% EtOH 5 90
Temperature K 333 338
Flux 1.8 3.37
Separation factor 89 296
Pa 19224 10982
Pa 4495 46813
Pa 202 6180
Pa 593 166
Next the values for were calculated using equation (40). The zeolite
permeances were obtained by using equation (39).

75
Table 3.11
Values for literature
Study
De Bruijn 2.30 x 1.51 x 0.152
Zhou 1.05 x 6.00 x 1.75
Finally, the model parameters were computed following the methodology as
explained for tables 3.7 and 3.8.
Table 3.12
Flux model values, literature
Study
(
)
(experimental)
(eq. 53)
De Bruijn 0.00895 0.0103 0.870 0.868
Zhou 0.0505 0.103 0.490 0.363
Table 3.13
Selectivity model values, literature
Study (eqs.
66
and 69)
⁄
(experimental)
Ln ⁄
(eq.75)
De Bruijn 7.84 8.94 0.877 0.152 0.0700 0.877
Zhou 402 827 0.486 1.75 0.00193 0.365
76
The use of the model to analyze the silicalite-1 α-alumina supported membrane
[23] for pervaporation separation of ethanol from water appears to be reliable. The
experimental values for and ⁄ were virtually identical to their model
counterparts, as they were for the silicalite-1 YSZ/SS supported membrane. There was a
< 1% difference in the values possibly due to a small amount of viscous flow in the
support. There were difficulties in using the model to analyze the data from the Zhou
study. The problems were:
1. The permeate pressure was not zero. Therefore, one of the underlying
assumptions of the model was not satisfied.
2. A two layer support with each layer being significantly different in pore size and
thickness was used.
3. There was a large amount of viscous flow in the support particularly in the bottom
layer.
Because of these problems, the model would have to be used with caution for a
membrane system such as used in the Zhou study.
3.4 CONCLUSIONS
When the flux and selectivity models were applied to the silicalite-1 YSZ/SS
supported membrane from our laboratory, and to the silicalite-1 α-alumina supported
membrane from the de Bruijn study, the model values were the same as the experimental
values. In both cases, the underlying assumptions of the model, negligible viscous flow
in the support and zero permeate pressure were met. In both cases, equation (56) can be

77
used to compute and equation (79) can be used to compute ⁄ using the pressure
terms supplied, and give identical results as equations (53) and (75).
As mentioned, the flux and selectivity models offer the ability to predict the
results of the resultant pervaporation obtained by adding the additional support layer from
the composite support data and the original permeances from the original (silicalite-1
YSZ/SS supported membrane) pervaporation run. In the case of the added stainless steel
support, the effect on was small, and the model was in good agreement with the
experimental values. In the case of the added γ-alumina support there was a larger effect
on . The model then overestimated the experimental relative permeation flux
(37%) and reduced selectivity (14%). In terms of the raw data, a separation factor of 16.5
and a total flux of 0.041 would have brought the experimental relative
permeation flux and reduced selectivity to within 5% of the model values.
78
CHAPTER 4
SUMMARY AND RECOMMENDATIONS
4.1 SUMMARY
Chapter 1 provided an overview of pervaporation, a membrane separation
process. A description of zeolites and zeolite membranes used in pervaporation was
given. The use of the silicalite-1, a zeolite membrane, in pervaporation was reviewed, as
was its specific use for ethanol/water separation. As delineated in chapter 1, if the flux
and selectivity of this separation can be improved, then it will be of use industrially for
the manufacture of ethanol with a bioreactor. Mathematical models of pervaporation were
described as a means to evaluate and improve zeolite supported membrane performance.
The limitations of previous models were discussed.
Chapter 2 introduced new models for flux and selectivity for zeolite supported
membranes in pervaporation. The model equations incorporate the dimensionless
variables, resistance ratio of support to zeolite, relative permeation flux, reduced
selectivity and Lin number. The resistance ratio of support to zeolite is the independent
variable for the flux and selectivity model equations. It is formed by the ratio of zeolite
to support permeances. The model equations were also formulated as ratios of pressure
drops across the membrane layers. This allowed for comparison to the de Bruijn model.
By this comparison the de Bruijn model was shown to be a descriptive model of flux,
whereas the new model also includes selectivity and is predictive. Equations showing the
temperature dependence of the flux and selectivity model equations were introduced.
Chapter 3 described experiments designed to show how the model equations
could predict the effects of different supports on flux and selectivity. In a novel

79
approach, support resistance was increased by adding an additional support layer. When
a stainless steel support was added, the model equations predicted results that were close
to those obtained experimentally. The agreement was not as close when an additional γ-
alumina support was added. It is difficult to assess the significance of these findings
since the data is limited. The model equations were also used to analyze two examples
from the literature. The application of them model equations to one of these examples
from the Zhou study was limited because of significant viscous flow in the bottom
support layer.
An overall summary of the utility of the model may now be provided. The flux
model relates two dimensionless parameters, relative permeation flux and the resistance
ratio of the support to zeolite. Relative permeation flux is the ratio of real flux to the
ideal flux of the stand- alone zeolite layer and has a maximum value of one. As
mentioned in chapter 1, the flux through a support is in general significantly higher than
the ideal flux of a stand-alone zeolite layer. The effect, due to resistance in series, of
adding a support layer to the zeolite layer is to diminish real flux and relative permeation
flux. The effect on real flux and relative permeation flux is determined by the resistance
ratio of the support to zeolite. As support resistance increases (permeance decreases),
real flux and relative permeation flux decrease in a way that is described by the flux
model. When a zeolite layer is synthesized onto a support, real flux and ideal flux are
determined by pervaporation of a feed mixture. The model assumes that a similar zeolite
layer can be synthesized onto other supports so that ideal flux remains the same. The
model then predicts the effect of the supports on real flux based on the results of helium
permeance studies of the supports. From a practical standpoint, there would be no need

80
to actually carry out the synthesis on the other supports and perform pervaporation
studies because the results of those pervaporation studies can be predicted by the model
in advance.
A similar conclusion can be reached with regard to selectivity. The selectivity
model relates three dimensionless parameters, reduced selectivity, Lin number, and the
resistance ratio of the support to zeolite. The model assumes that the Lin number, the
ratio of support selectivity to zeolite selectivity will be less than one. Reduced
selectivity, the ratio of real selectivity to the selectivity of the zeolite layer has a
maximum value of one. When a zeolite layer is synthesized onto a support, real
selectivity and the selectivity of the zeolite layer are determined by pervaporation of a
feed mixture. The model assumes that a similar zeolite layer can be synthesized onto
other supports so that the selectivity of the zeolite layer remains the same. Assuming
Knudsen flow in the supports, the selectivity of the supports also remains the same since
support selectivity is determined by the square root of the ratio of molecular weights of
the feed components. Therefore the Lin number remains the same. The model then
predicts the effect of the supports on real selectivity based on the results of helium
permeance studies of the supports. From a practical standpoint there would be no need to
actually carry out the synthesis of the zeolite layer onto the other supports and perform
pervaporation studies because the results of those pervaporation studies can be predicted
by the model in advance.
On the other hand, it may be argued that a simple intuitive grasp of the
resistance in series concept leads to the same conclusions. It can be predicted that
supports with higher permeances will, when synthesized into a zeolite supported
81
membrane, provide higher pervaporation fluxes then supports with lower permeances.
However this is a qualitative prediction while the prediction offered by the flux model is
quantitative. The selectivity model shows that supports with higher permeances will
result in zeolite supported membranes with higher selectivity. It would be more difficult
to reach the same conclusion based on an intuitive grasp of the resistance in series
concept.
In brief: Once the zeolite layer permeances of the components of a given feed
mixture are determined through pervaporation testing of a zeolite supported membrane,
and assuming that those zeolite permeances remain the same when the zeolite layer is
applied to other supports to create additional zeolite supported membranes, the flux and
selectivity of the additional zeolite supported membranes as would be determined by
pervaporation testing are predicted in advance of the synthesis of the additional zeolite
supported membranes by the model equations.
4.2 RECOMMENDATIONS
1. Conduct additional experiments using the same methodology described in chapter
3. More data will provide information about the predictive power of the model
equations.
2. Design and conduct experiments to evaluate the ability of the model to predict
temperature dependency.
82
REFERENCES
[1] J. Obrien-Abraham, Y.S. Lin, Effect of Isomorphous Metal Substitution in Zeolite
Framework on Pervaporation Xylene-Separation of MFI-Type Zeolite Membranes, Ind.
Eng. Chem. Res. 49 (2010) 809-816
[2] R.W. Baker, Membrane Technology and Applications 3rd
edition, John Wiley & Sons,
Ltd., New York, 2012
[3] X. Feng, R.Y.M. Huang, Liquid Separation by Membrane Pervaporation: A Review,
Ind. Eng. Chem. Res. 36 (1997) 1048-1066
[4] S. Wee, C. Tye, S. Bhatia, Membrane separation process-Pervaporation through
zeolite membrane, Sep. Purif. Technol. 63 (2008) 500-516
[5] D.A. Fedosov, A.V. Smirnov, E.E. Knyazeva, I.I. Ivanova, Zeolite Membranes:
Synthesis, Properties, and Applications, Petroleum Chemistry 51 (2011) 657-667
[6] J. Caro, M. Noack, P. Kolsch, R. Schafer, Zeolite Membranes-state of their
development and perspective, Microporous and Mesoporous Materials 38 (2000) 3-24
[7] J. Caro, M. Noack, Zeolite Membranes-Recent developments and progress,
Microporous and Mesoporous Materials 115 (2008) 215-233
[8] L.M. Vane, A review of pervaporation for product recovery from biomass
fermentation processes, Journal of Chemical Technology and Biotechnology 80 (2005)
603-629
[9] C. Dawson, Zeolites: Structural Properties and Benchmarks of Feasibility, PhD.
Thesis, ASU dept. of physics (2013)
[10] Y.S. Lin, I. Kumakiri, B.N. Nair, H. Alsyouri, Microporous Inorganic Membranes,
Separation and Purification Methods 31 (2002) 229-379
[11] E. M. Flanigen, J. M. Bennett, R. W. Grose, J. P. Cohen, R. L. Patton, R.
M. Kirchner & J. V. Smith, Silicalite, a new hydrophobic crystalline silica molecular
sieve, Nature 271 (1978) 512-516
[12] D.M. Bibby, N.B. Milestone, L.P. Aldridge, Silicalite-2, a silica analogue of the
aluminosilicate zeolite ZSM-11, Nature 280 (1979) 664-665

83
[13] A.F. Masters, T. Maschmeyer, Zeolites-From curiosity to cornerstone, Microporous
and Mesoporous Materials 142 (2011) 423-438
[14] M.P. Pina, R. Mallada, M. Arruebo, M. Uriztondo, N. Navascues, O. de la Iglesia, J.
Santamaria, Zeolite films and membranes. Emerging applications, Microporous and
Mesoporous Materials 114 (2011) 19-27
[15] T. Bowen, R. Noble, J. Falconer, Fundamentals and applications of pervaporation
through zeolite membranes, Journal of Membrane Science 245 (2004) 1-33
[16] H. Negishi, R. Mizuno, H. Yanagishita, D. Kitamoto, T. Ikegami, H. Matsuda,
Preparation of the silicalite membranes using a seeding technique under various
hydrothermal conditions, Desalination 144 (2002) 47-52
[17] M. Nomura, T. Yamaguchi, S. Nakao, Ethanol/water transport through silicalite
membranes, J. Membr. Sci. 144 (1998) 161-171
[18] T. Sano, H. Yanagishita, Y. Kiyozumi, F. Mizukami, K. Haraya, Separation of
ethanol/water mixture by silicalite membrane on pervaporation, J. Membr. Sci. 95
(1994) 221-228
[19] X. Lin, H. Kita, K. Okamoto, Silicalite Membrane Preparation, Characterization and
Separation Performance, Ind. Eng. Chem. Res. 40 (2001) 4069-4078
[20] L. Shan, J. Shau, Z. Wang, Y. Yan, Preparation of zeolite MFI membranes on
alumina hollow fibers with high flux for pervaporation, J. Membr. Sci. 378 (2011) 319-
329
[21] X. Shu, X. Wang, Q. Kong, X. Gu, N. Xu, High-Flux MFI Zeolite Membrane
Supported on YSZ Hollow Fiber for Separation of Ethanol/Water, Ind. Eng. Chem. Res.
51 (2012) 12073-12080
[22] D. Korelskiy, T. Lappajarvi, H. Zhou, M. Grahn, J. Tanskanen, H. Hedlund, High
flux MFI membranes for pervaporation, J. Membr. Sci. 427 (2013) 381-389
[23] F.T. de Bruijn, L. Sun, Z. Olujic, P.J. Jansens, F. Kapteijn, Influence of the support
layer on the flux limitation in pervaporation, J. Membr. Sci. 223 (2003) 141-156

84
[24] E.E. McLeary, J.C. Jansen, F. Kapteijn, Zeolite based films, membranes and
membrane reactors: Progress and prospects, , Microporous and Mesoporous Materials
90 (2006) 198-220
[25] B. Bettens, A. Verhoef, H. van Veen, C. Vancecasteele, Pervaporation of binary
water-alcohol and methanol-alcohol mixtures through microporous methylated silica
membranes: Maxwell-Stefan modeling, Computers and Chemical Engineering 34
(2010) 1775-1778
[26] M. Yu, Separation Mechanisms and Microstructure Characterization of Zeolite
Membranes, PhD. Thesis, University of Colorado Department of Chemical and
Biological Engineering (2007)
[27] D.M. Ruthven, Fundamentals of Adsorption Equilibrium and Kinetics in
Microporous Solids, Mol. Sieves 7 (2008) 1-43
[28] J. Kuhn, R. Stemmer, F. Kaptejin, S. Kjelstrup, J. Gross, A non-equilibrium
thermodynamics approach to model mass and heat transport for water pervaporation
through a zeolite membrane, J. Membr. Sci. 330 (2009) 388-398
[29] R.B. Bird, W.E. Stewart, E.N. Lightfoot, Transport Phenomena, 2nd
edition, John
Wiley & Sons, Inc. New York (2007)
[30] V.A. Tuan, S. Li, J.L. Falconer, R.D. Noble, Separating organics from water by
pervaporation with isomorphously-substituted MFI zeolite membranes, J. Membr. Sci.
196 (2002) 111–123
[31] R.W. van Gemert, F.P. Cuperus, Newly developed ceramic membranes for
dehydration and separation of organic mixtures by pervaporation, J. Membr. Sci. 105
(1995) 287–291
[32] W. Chen, C.R. Martin, Highly methanol-selective membranes for the pervaporation
separation of methyl t-butyl ether/methanol mixtures, J. Membr. Sci. 104 (1995) 101–
108
[33] B.N. Nair, K. Keizer, H. Suematsu, Y. Suma, N. Kaneko, S. Ono, T. Okubo, S.-I.
Nakao, Synthesis of gas and vapor molecular sieving silica membranes and analysis of
pore size and connectivity, Langmuir 16 (2000) 4558–4562
85
[34] M. Asaeda, J. Yang, Y. Sakou, Porous silica-zirconia (50%) membranes for
pervaporation of iso-propyl alcohol (IPA)/water mixtures, J. Chem. Eng. Japan 35 (4)
(2002) 365–371
[35] T. Sano, M. Hasegawa, Y. Kawakami, H. Yanagishita, Separation of
methanol/methyl-tert-butyl ether mixture by pervaporation using silicalite membrane, J.
Membr. Sci. 107 (1995) 192–196
[36] C.J. Gump, X. Lin, J.L. Falconer, R.D. Noble, Experimental configuration and
adsorption effects on the permeation of C4 isomers through ZSM-5 zeolite membranes, J.
Membr. Sci. 173 (2000) 35–52
[37] M.K. Koukou, N. Papayannakos, N.C. Markatos, M. Bracht, H.M. Van Veen, A.
Roskam, Performance of ceramic membranes at elevated pressure and temperature: effect
of non-ideal flow conditions in a pilot scale membrane separator, J. Membr. Sci. 155
(1999) 241–259
[38] H.M. van Veen, Y.C. van Delft, C.W.R. Engelen, P.P.A.C. Pex, Dewatering of
organics by pervaporation with silica membranes, Gas Sep. Purif. Technol. 22–23
(2001) 361–366
[39] C.M. Braunbarth, L.C. Boudreau, M. Tsapatsis, Synthesis of ETS-4/TiO2 composite
membranes and their pervaporation performance, J. Membr. Sci. 174 (2000) 31–42
[40] Y. Morigami, M. Kondo, J. Abe, H. Kita, K. Okamoto, The first large-scale
pervaporation plant using tubular-type module with zeolite NaA membrane, Sep. Purif.
Technol. 25 (2001) 251–260
[41] M. Kondo, M. Komori, H. Kita, K. Okamoto, Tubular-type pervaporation module
with zeolite NaA membrane, J. Membr. Sci. 133 (1997) 133–141
[42] K. Okamoto, H. Kita, K. Horii, K. Tanaka, Zeolite NaA membrane: preparation,
single-gas permeation, and pervaporation and vapor permeation of water/organic liquid
mixtures, Ind. Eng. Chem. Res. 40 (2001) 163–175
[43] A.W. Verkerk, P. van Male, M.A.G. Vorstman, J.T.F. Keurentjes, Description of
dehydration performance of amorphous silica pervaporation membranes, J. Membr. Sci.
193 (2001) 227–238

86
[44] M. Asaeda, J. Yang, Y. Sakou, Porous silica-zirconia (50%) membranes for
pervaporation of iso-propyl alcohol (IPA)/water mixtures, J. Chem. Eng. Japan 35 (4)
(2002) 365–371
[45] P. Kölsch, M. Sziládi, M. Noack, J. Caro, L. Kotsis, I. Kotsis, I. Sieber, Ceramic
membranes for water separation from organic solvents, Chem. Eng. Technol. 25 (2002)
357–362
[46] S. Li, V.A. Tuan, R.D. Noble, J.L. Falconer, Pervaporation of water/THF mixtures
using zeolite membranes, Ind. Eng. Chem. Res. 40 (2001) 4577–4585
[47] J.Z. Yang, Y. Chen, A.M. Zhu, Q.L. Liu, J.Y. Wu, Analyzing diffusion behaviors of
methanol/water through MFI membranes by molecular simulation, J. Membr. Sci 318
(2008) 327-333
[48] H. Zhou, D. Korelskiy, T. Leppajarvi, M. Grahn, J. Tanskanen, J. Hedlund, Ultrathin
zeolite X membranes for pervaporation dehydration of ethanol, J. Membr. Sci 399-400
(2012) 106-111
[49] H. Wang, Y.S. Lin, Synthesis and modification of ZSM-5/silicalite bilayer
membrane with improved hydrogen separation performance, J. Membr. Sci. 396 (2012)
128-137
[50] D. Liu, X. Ma, H. Xi, Y.S. Lin, Gas transport properties and propylene/propane
separation characteristics of ZIF-8 membranes, J. Membr. Sci. 451 (2014) 85-93
[51] Z. Zhau, X. Ma, Z. Li, Y.S. Lin, Synthesis, characterization and gas transport
properties of MOF-5 membranes, J. Membr. Sci. 382 (2011) 82-90
[52] A. Yadav, M.L. Lind, X. Ma, Y.S. Lin, Nanocomposite Silicalite-
1/Polydimethylsiloxane Membranes for Pervaporation of Ethanol from Dilute Aqueous
Solutions, Ind. Eng. Chem. Res. 52 (2013) 5207-5212
[53] Z.B. Wang, Q.Q. Ge, J. Shau, Y.S. Yan, High performance zeolite LTA
pervaporation membranes on ceramic hollow fibers by dipcoating-wiping seed
deposition, J. Am. Chem. Soc. 131 (2009) 6910-6911

87
APPENDIX A
THE FLUX MODEL

88
The first portion of the model is for flux, assuming single species permeation
through the membrane.
First, considering the zeolite layer:
( ) (
And then the support layer:
( (
Equation (2) can be rearranged:
(
( )
((
( ) (
Equations (1) and (3) are equations for flux through the zeolite layer and support,
respectively. Since these fluxes are equal:
( )
( )
((
( ) (
Equation (4) is then solved for (positive root):
( ) (
(
+ /β (5)
This first expression (equation 5) for differs from that obtained by
solving

89
( ) (
for . Both expressions are useful.)
Then substitute this first expression (eq. 5) for into the equation (1)
and utilize:
(
This leads to:
= (-( ) (
(
+ )/ β (8)
=
( ) (
Dividing equation (8) by equation (9) results in:
[β
- (-
( ) (
(
+ ) /β(
(
Or;
[
] (-( ) (
(
+ ) /β(
)
(11)
A simplifying assumption is to let the permeate pressure, , equal zero.
This assumption is based on the use of a vacuum on the permeate side.
When ;
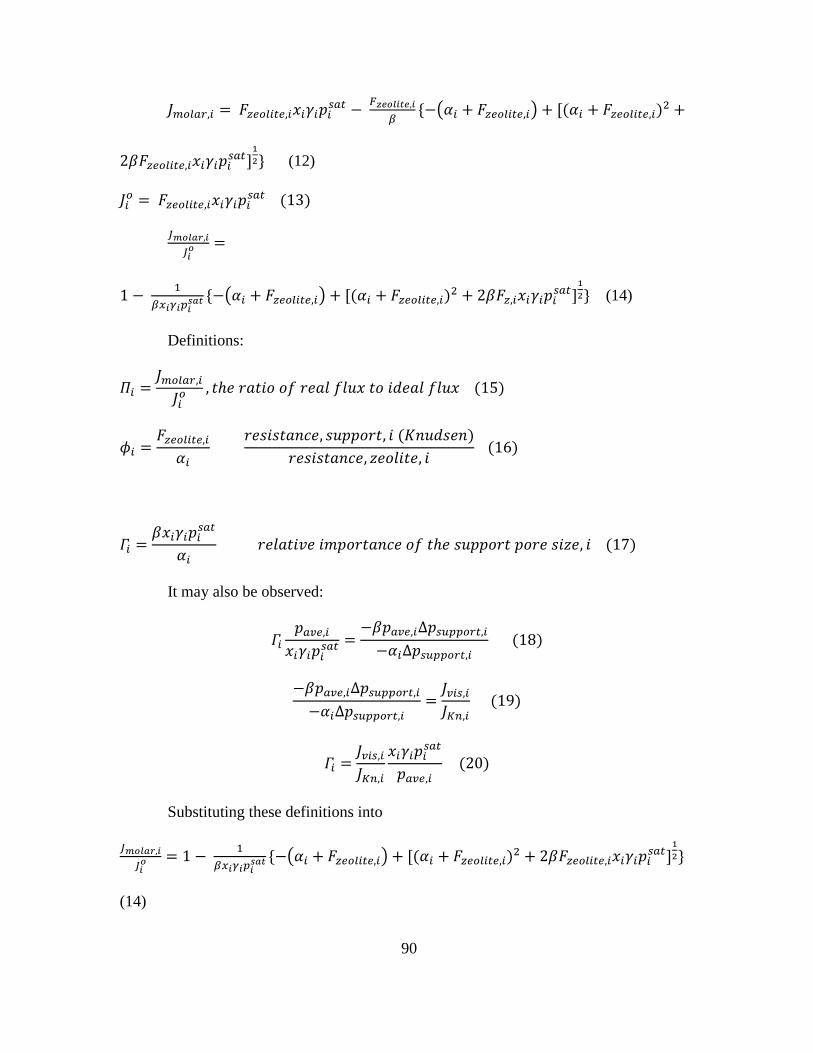
90
( ) (
(12)
(
( ) (
(14)
Definitions:
(
(
(
(
It may also be observed:
(
(
(
Substituting these definitions into
( ) (
(14)

91
gives the equation for the flux model:
(
( (21)
Influence of temperature on flux:
(
( (
(
(
From the section on temperature dependence of (Chapter 2):
( (
)) (
Analysis of the temperature dependence of :
The temperature dependence of
(
It will be assumed that viscosity is constant over the range of temperatures
considered. This is necessary because there is no readily obtainable formula for the
temperature dependence of viscosity at the relevant temperatures and pressures. The
viscosity is obtained by analysis of empirical plots [27].
Therefore:
(
The temperature dependence of
92
The mole fraction and activity coefficient (as determined by the Van Laar
equation) are not temperature dependent. From the Antoine equation the temperature
dependence of is:
((
) (
))
(
The temperature dependence of from the section on the temperature
dependence of selectivity:
√ (
Therefore:
√ ((
) (
)) (
And:
√ ((
) (
)
( ( (
))
√ ((
) (
) (
(
))
( (
(
)) ) (
93
APPENDIX B
THE SELECTIVITY MODEL

94
The selectivity model assumes 100% Knudsen flow (i.e. ) through the support, in
addition to . The derivation of this portion of the model is as follows:
First write the equations for flux through the zeolite layer and flux through the support:
( ) (
(
Equate the equations for and solve for :
(
It may also be observed:
(
Inserting
(
into equation (1) :
(
) (
Under the conditions of this model:
(
Rearranging equation (4) results in:
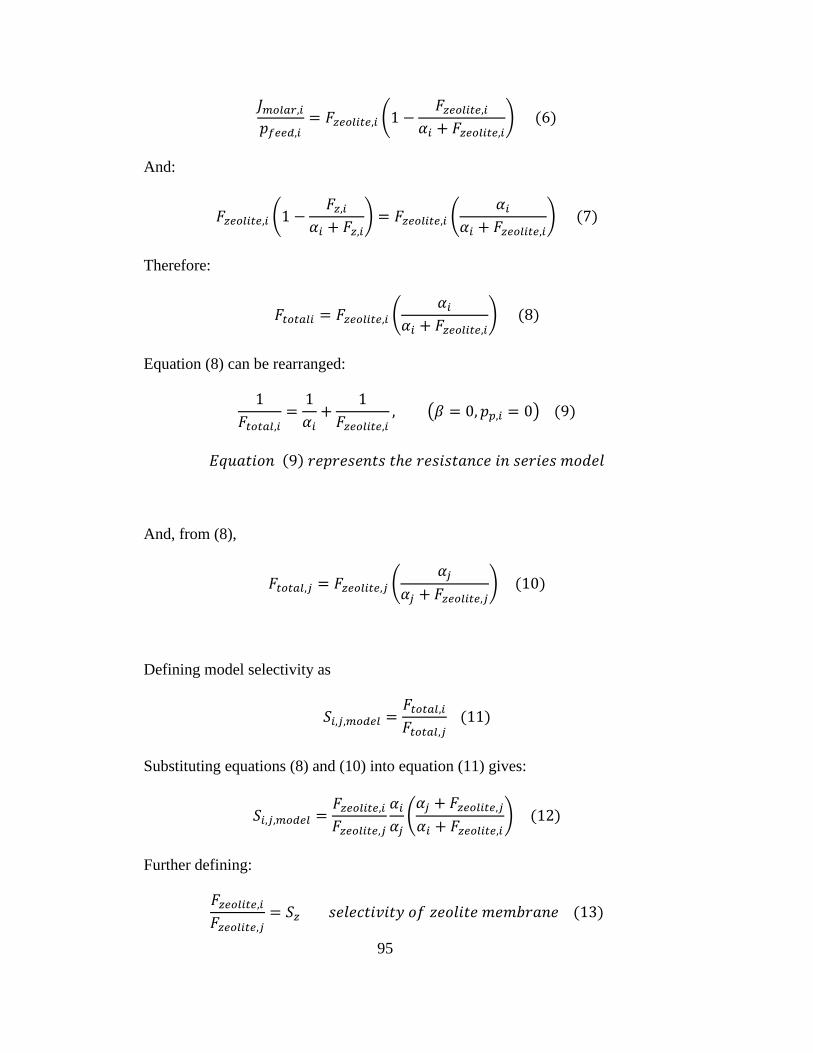
95
(
) (
And:
(
) (
) (
Therefore:
(
) (
Equation (8) can be rearranged:
( ) (
(
And, from (8),
(
) (
Defining model selectivity as
(
Substituting equations (8) and (10) into equation (11) gives:
(
) (
Further defining:
(
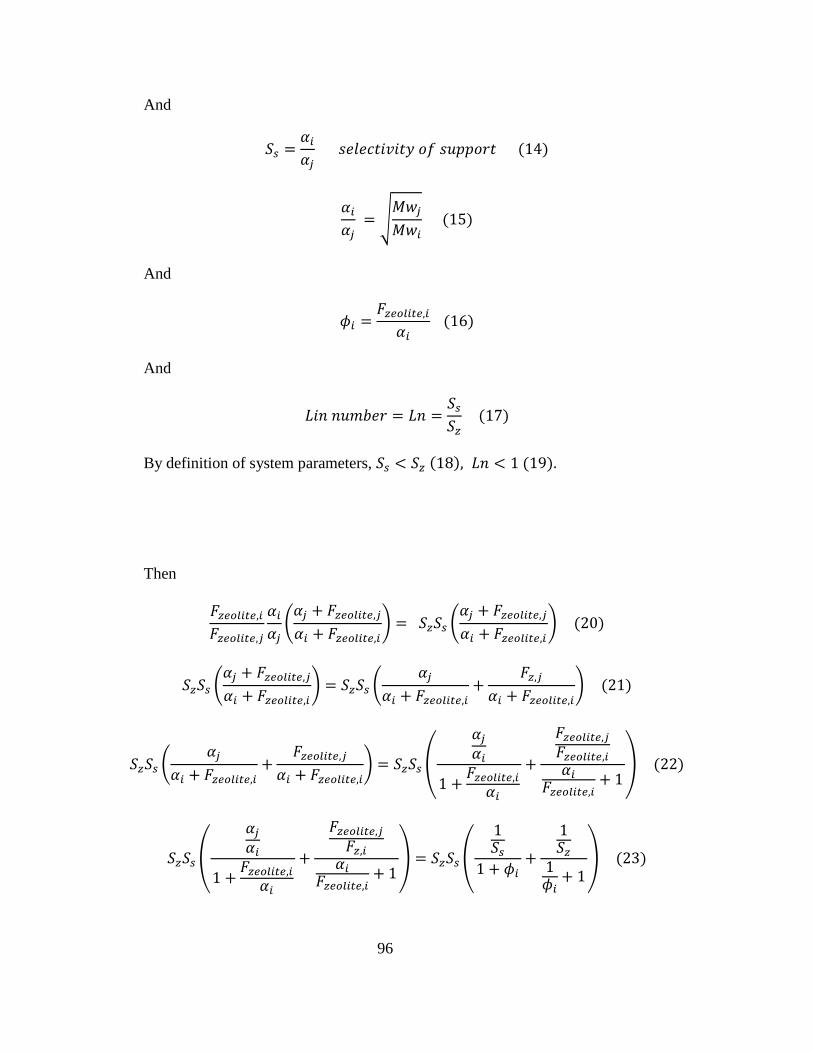
96
And
(
√
(
And
(
And
(
By definition of system parameters, ( (
Then
(
) (
) (
(
) (
) (
(
) (
) (
(
) (
) (

97
(
) (
) (
(
) (
(
(
) (
(
(
) (
(
) (
(
(
)
(
(
The following proof clarifies the relationship between as defined here and as
defined by Baker et al.:
Baker at al. define selectivity when :
(
(
(
(
Therefore:
( ( .( (
The following proof clarifies this relationship:

98
(
(
(
(
)
(
(
(
(
(
(
When the molar flux terms in equations (38) and (39) are identical:
(
(
√
(
(
(
( )
(
√
(
( )
(
(

99
(
)
√
(
( )
√
( ) √
(
Looking at the numerator of the RHS of equation (45):
( ) √
√
(
It can be observed:
√
(
Equation (47) results from:
√
(
And
(
Therefore:
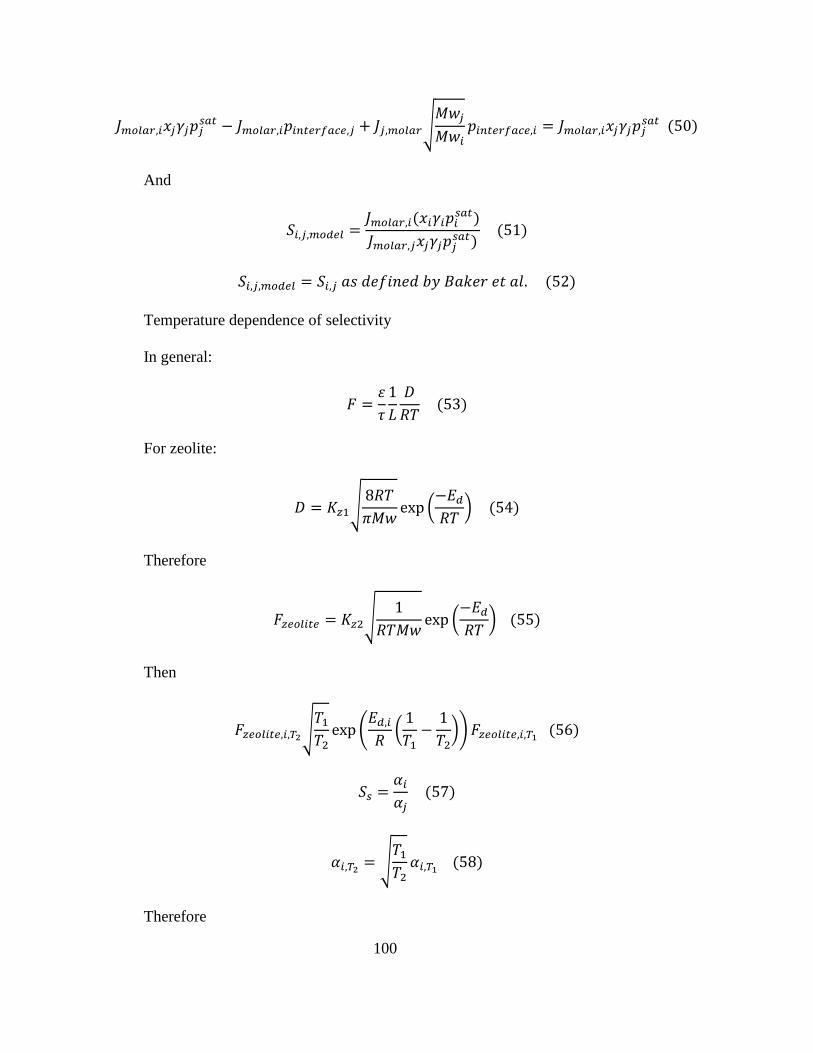
100
√
(
And
(
(
(
Temperature dependence of selectivity
In general:
(
For zeolite:
√
(
) (
Therefore
√
(
) (
Then
√ (
(
)) (
(
√ (
Therefore

101
(
Also:
(
( (
) (
) (
(
(
(
( (
) ( )
(
( (
) ( )
(
And
(
( (
)) (
Therefore
((
) (
)) (
And:
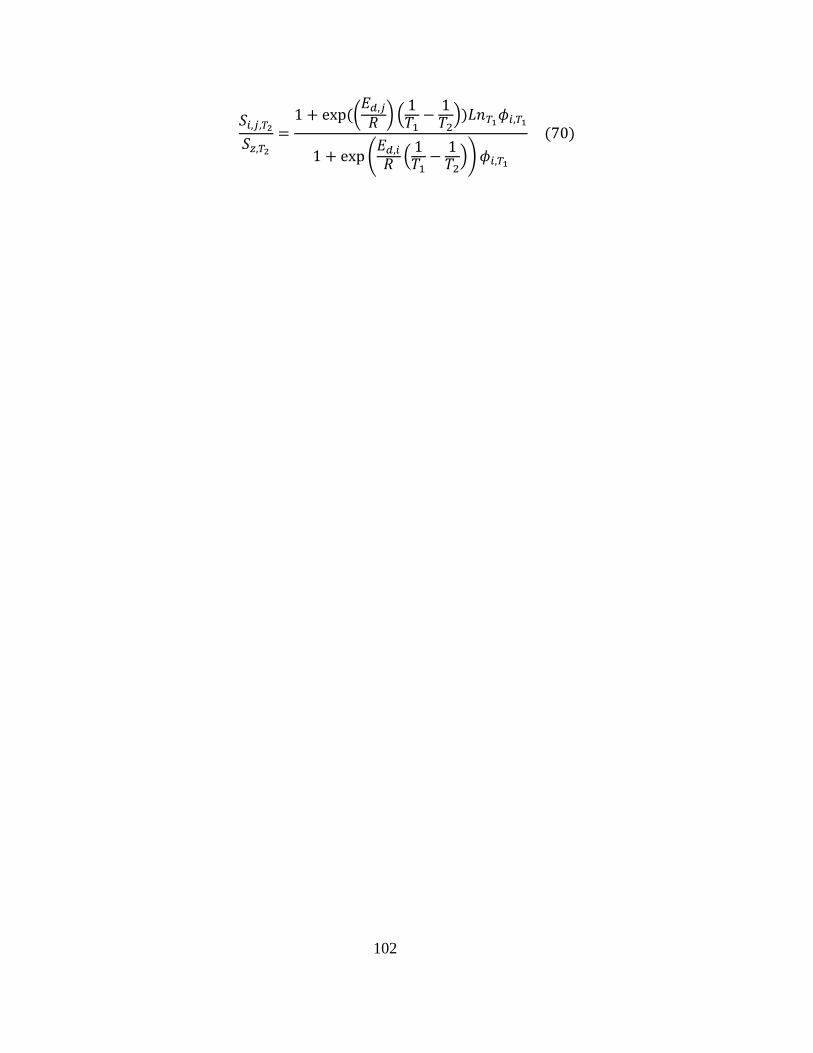
102
((
) (
)
( (
))
(