Modeling and Analysis of 3MW Solar Photovoltaic Plant ...
14
Research Article Modeling and Analysis of 3MW Solar Photovoltaic Plant Using PVSyst at Islamia University of Bahawalpur, Pakistan Faizan Ul Hassan Faiz, 1 Rabia Shakoor , 1 Abdur Raheem, 1 Farhana Umer, 1 Nadia Rasheed, 2 and Muhammad Farhan 3 1 Department of Electrical Engineering, The Islamia University of Bahawalpur, Pakistan 2 Department of Computer System Engineering, The Islamia University of Bahawalpur, Pakistan 3 Department of Electrical Engineering and Technology, Government College University Faisalabad, Pakistan Correspondence should be addressed to Rabia Shakoor; [email protected] Received 26 October 2020; Revised 23 March 2021; Accepted 13 May 2021; Published 29 May 2021 Academic Editor: Ahmad Umar Copyright © 2021 Faizan Ul Hassan Faiz et al. This is an open access article distributed under the Creative Commons Attribution License, which permits unrestricted use, distribution, and reproduction in any medium, provided the original work is properly cited. Conventional means of electrical energy generation are costly, create environmental pollution, and demand a high level of maintenance and also going to end one day. This has made it crucial to exploit the untapped prospective of the environmentally friendly renewable energy resources. To address this problem, present research proposed an efficient, everlasting, and environment-friendly grid-connected PV system at The Islamia University of Bahawalpur, Pakistan (latitude: 29 ° 22′ 34″ N, longitude: 71 ° 44′ 57 E). Bahawalpur is one of those sites where the potential of solar energy is immense. The global daily horizontal solar irradiance at the site is 1745.85 kWh/m 2 , having average solar irradiation of 5.9 kWh/m 2 per day, and the ambient average temperature is about 25.7 ° C. In this research, the performance ratio and different power losses just like soiling, PV module losses, inverter, and losses due to temperature are taken into account and calculated by using PVSyst. The coal saving per day is 15369.3 kg which is equal to planting 147600 teak trees over a lifetime. The cost of the energy produced is 0.11 US $/kWh whereas in Pakistan the conventional energy tariff is 0.18 $/kWh. From the simulation results, the value of PR comes out 83.8%, and the CUF value is 16% with a total energy generation of 4908 MWh/year. The performance analysis of this grid- connected system would help in the designing, analysis, operation, and maintenance of the new grid-connected systems for different locations. 1. Introduction The circumstances of the energy zone in Pakistan are very miserable. The primary cause for this situation of the electric- ity shortage is that we had completely depended on conven- tional energy means in the previous 2 decades. The only way to sort out energy issues at this moment is to move towards renewable energy sources. In this regard, solar energy is one of the best renewable energy sources abundantly available for countries like Pakistan. The installation of solar PV (SPV) is an environmentally friendly project. Solar energy is free and present in sufficient amounts in almost every part of the world. Moreover, the maintenance cost of solar PV is very low as compared with other conventional sources [1]. Different types of the PV modules and system schemes were discussed that would help in planning the different renewable energy systems schemes in [2]. Techno- economic feasibility study was conducted which helps in ana- lyzing the performance of the most economical renewable energy system in Pakistan after the detail comparison of the different hybrid energy systems [3]. A detailed economic optimization for off-grid renewable energy systems was assessed for small loads [4]. Pakistan, a developing country, is facing a load shedding problem due to the lack of generation of electricity through Hindawi International Journal of Photoenergy Volume 2021, Article ID 6673448, 14 pages https://doi.org/10.1155/2021/6673448
Transcript of Modeling and Analysis of 3MW Solar Photovoltaic Plant ...

Research ArticleModeling and Analysis of 3MW Solar Photovoltaic Plant UsingPVSyst at Islamia University of Bahawalpur, Pakistan
Faizan Ul Hassan Faiz,1 Rabia Shakoor ,1 Abdur Raheem,1 Farhana Umer,1
Nadia Rasheed,2 and Muhammad Farhan 3
1Department of Electrical Engineering, The Islamia University of Bahawalpur, Pakistan2Department of Computer System Engineering, The Islamia University of Bahawalpur, Pakistan3Department of Electrical Engineering and Technology, Government College University Faisalabad, Pakistan
Correspondence should be addressed to Rabia Shakoor; [email protected]
Received 26 October 2020; Revised 23 March 2021; Accepted 13 May 2021; Published 29 May 2021
Academic Editor: Ahmad Umar
Copyright © 2021 Faizan Ul Hassan Faiz et al. This is an open access article distributed under the Creative Commons AttributionLicense, which permits unrestricted use, distribution, and reproduction in any medium, provided the original work isproperly cited.
Conventional means of electrical energy generation are costly, create environmental pollution, and demand a high level ofmaintenance and also going to end one day. This has made it crucial to exploit the untapped prospective of the environmentallyfriendly renewable energy resources. To address this problem, present research proposed an efficient, everlasting, andenvironment-friendly grid-connected PV system at The Islamia University of Bahawalpur, Pakistan (latitude: 29° 22′ 34″ N,longitude: 71° 44′ 57 E). Bahawalpur is one of those sites where the potential of solar energy is immense. The global dailyhorizontal solar irradiance at the site is 1745.85 kWh/m2, having average solar irradiation of 5.9 kWh/m2 per day, and theambient average temperature is about 25.7°C. In this research, the performance ratio and different power losses just like soiling,PV module losses, inverter, and losses due to temperature are taken into account and calculated by using PVSyst. The coalsaving per day is 15369.3 kg which is equal to planting 147600 teak trees over a lifetime. The cost of the energy produced is 0.11US $/kWh whereas in Pakistan the conventional energy tariff is 0.18 $/kWh. From the simulation results, the value of PR comesout 83.8%, and the CUF value is 16% with a total energy generation of 4908MWh/year. The performance analysis of this grid-connected system would help in the designing, analysis, operation, and maintenance of the new grid-connected systems fordifferent locations.
1. Introduction
The circumstances of the energy zone in Pakistan are verymiserable. The primary cause for this situation of the electric-ity shortage is that we had completely depended on conven-tional energy means in the previous 2 decades. The only wayto sort out energy issues at this moment is to move towardsrenewable energy sources. In this regard, solar energy is oneof the best renewable energy sources abundantly availablefor countries like Pakistan.
The installation of solar PV (SPV) is an environmentallyfriendly project. Solar energy is free and present in sufficientamounts in almost every part of the world. Moreover, the
maintenance cost of solar PV is very low as compared withother conventional sources [1].
Different types of the PV modules and system schemeswere discussed that would help in planning the differentrenewable energy systems schemes in [2]. Techno-economic feasibility study was conducted which helps in ana-lyzing the performance of the most economical renewableenergy system in Pakistan after the detail comparison of thedifferent hybrid energy systems [3]. A detailed economicoptimization for off-grid renewable energy systems wasassessed for small loads [4].
Pakistan, a developing country, is facing a load sheddingproblem due to the lack of generation of electricity through
HindawiInternational Journal of PhotoenergyVolume 2021, Article ID 6673448, 14 pageshttps://doi.org/10.1155/2021/6673448
the country. The government has initiated the project to con-vert all the educational institutes of the country to renewablesources. This research provides the benchmark for thesetypes of initiatives in the country.
This paper presents the simulation-based results of thespecific area of Pakistan with real-time data of location. Themain aim is to replace the conventional energy coming fromWAPDA and producing renewable solar PV energy for TheIslamia University of Bahawalpur, Pakistan, for meeting itsload requirements. The technical sketch of the solar PV sys-tem for IUB is simulated by using the PVSyst software andanalyzed each element for designing the plant. Furthermore,the evolution of the current economic condition and envi-ronmental conditions in the real solar plant is ought to becompared and conducted. The comparison of the results ofthe proposed PV system with the conventional system ofWAPDA is also conducted.
The rest of the paper is arranged as follows: Section 2gives the site survey for PV plant installation. The modelingof renewable energy system using PVSyst will be presentedin Section 3. Section 4 comprises of proposed system results,and comparative study will also be discussed in this section.At the end, the conclusion and future recommendations willbe highlighted.
2. Site Survey
Islamia University of Bahawalpur (IUB) is located in the cityof Bahawalpur in the south side of the province of Punjab,Pakistan. The longitude and the latitude of The Islamia Uni-versity of Bahawalpur are 29° 22′ 34″ and 71° 44′ 57 ″,respectively. It is 8 kilometers away from the Bahawalpurcity, and the total area allotted for The Islamia Universityof Bahawalpur (IUB) is around 1280 acres. The Islamia Uni-versity of Bahawalpur (IUB) consists the one hundred andtwenty (123) departments and offering different programswhich are 125 in numbers.
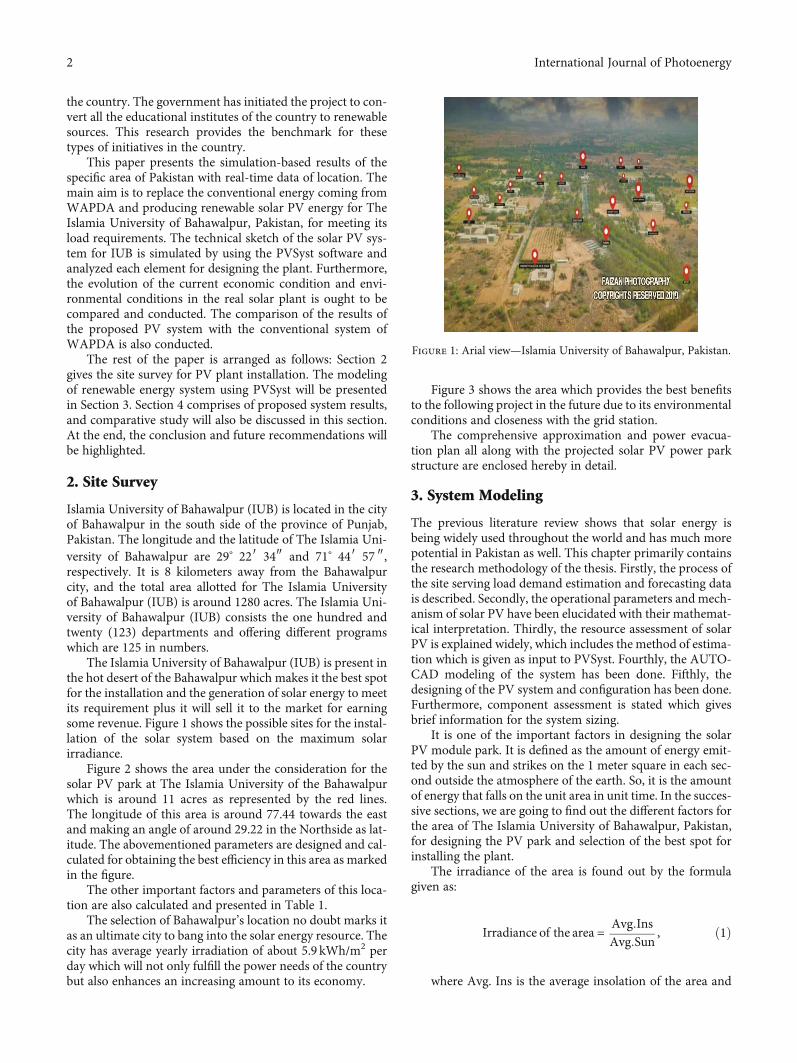
The Islamia University of Bahawalpur (IUB) is present inthe hot desert of the Bahawalpur which makes it the best spotfor the installation and the generation of solar energy to meetits requirement plus it will sell it to the market for earningsome revenue. Figure 1 shows the possible sites for the instal-lation of the solar system based on the maximum solarirradiance.
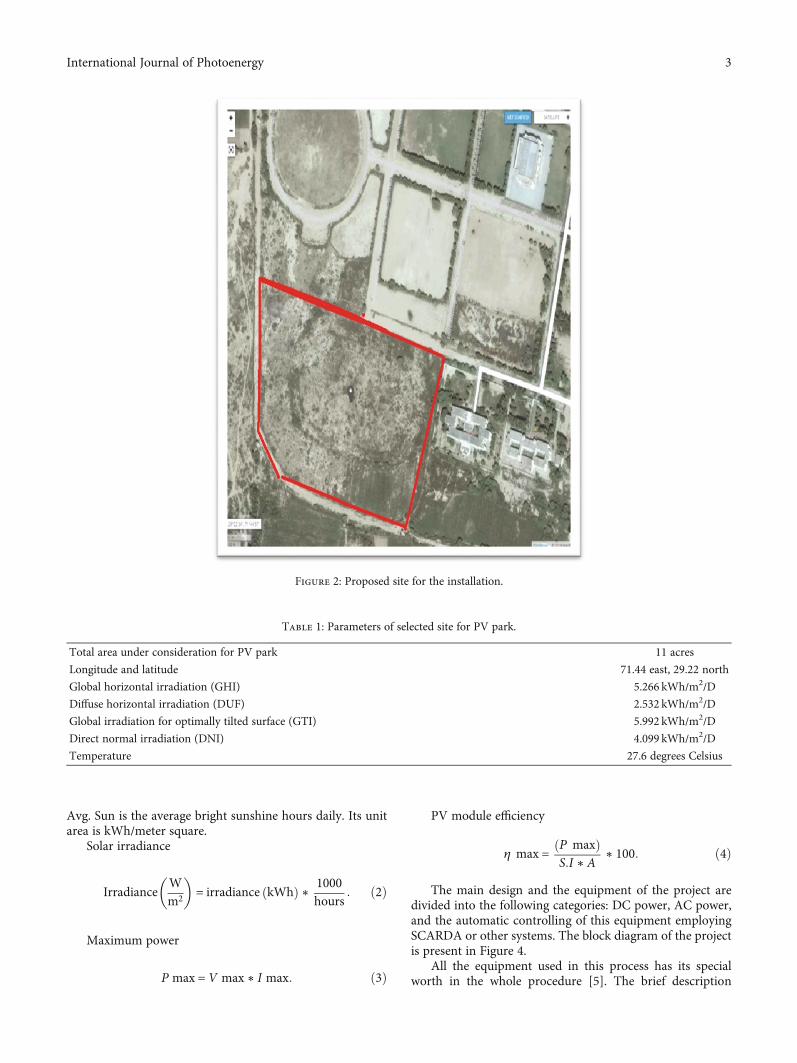
Figure 2 shows the area under the consideration for thesolar PV park at The Islamia University of the Bahawalpurwhich is around 11 acres as represented by the red lines.The longitude of this area is around 77.44 towards the eastand making an angle of around 29.22 in the Northside as lat-itude. The abovementioned parameters are designed and cal-culated for obtaining the best efficiency in this area as markedin the figure.
The other important factors and parameters of this loca-tion are also calculated and presented in Table 1.
The selection of Bahawalpur’s location no doubt marks itas an ultimate city to bang into the solar energy resource. Thecity has average yearly irradiation of about 5.9 kWh/m2 perday which will not only fulfill the power needs of the countrybut also enhances an increasing amount to its economy.
Figure 3 shows the area which provides the best benefitsto the following project in the future due to its environmentalconditions and closeness with the grid station.
The comprehensive approximation and power evacua-tion plan all along with the projected solar PV power parkstructure are enclosed hereby in detail.
3. System Modeling
The previous literature review shows that solar energy isbeing widely used throughout the world and has much morepotential in Pakistan as well. This chapter primarily containsthe research methodology of the thesis. Firstly, the process ofthe site serving load demand estimation and forecasting datais described. Secondly, the operational parameters and mech-anism of solar PV have been elucidated with their mathemat-ical interpretation. Thirdly, the resource assessment of solarPV is explained widely, which includes the method of estima-tion which is given as input to PVSyst. Fourthly, the AUTO-CAD modeling of the system has been done. Fifthly, thedesigning of the PV system and configuration has been done.Furthermore, component assessment is stated which givesbrief information for the system sizing.
It is one of the important factors in designing the solarPV module park. It is defined as the amount of energy emit-ted by the sun and strikes on the 1 meter square in each sec-ond outside the atmosphere of the earth. So, it is the amountof energy that falls on the unit area in unit time. In the succes-sive sections, we are going to find out the different factors forthe area of The Islamia University of Bahawalpur, Pakistan,for designing the PV park and selection of the best spot forinstalling the plant.
The irradiance of the area is found out by the formulagiven as:
Irradiance of the area = Avg:InsAvg:Sun
, ð1Þ
where Avg. Ins is the average insolation of the area and
Figure 1: Arial view—Islamia University of Bahawalpur, Pakistan.
2 International Journal of Photoenergy
Avg. Sun is the average bright sunshine hours daily. Its unitarea is kWh/meter square.
Solar irradiance
IrradianceWm2
� �= irradiance kWhð Þ ∗ 1000
hours: ð2Þ
Maximum power
P max =V max ∗ I max: ð3Þ
PV module efficiency
η max =P maxð ÞS:I ∗ A
∗ 100: ð4Þ
The main design and the equipment of the project aredivided into the following categories: DC power, AC power,and the automatic controlling of this equipment employingSCARDA or other systems. The block diagram of the projectis present in Figure 4.
All the equipment used in this process has its specialworth in the whole procedure [5]. The brief description
Figure 2: Proposed site for the installation.
Table 1: Parameters of selected site for PV park.
Total area under consideration for PV park 11 acres
Longitude and latitude 71.44 east, 29.22 north
Global horizontal irradiation (GHI) 5.266 kWh/m2/D
Diffuse horizontal irradiation (DUF) 2.532 kWh/m2/D
Global irradiation for optimally tilted surface (GTI) 5.992 kWh/m2/D
Direct normal irradiation (DNI) 4.099 kWh/m2/D
Temperature 27.6 degrees Celsius
3International Journal of Photoenergy
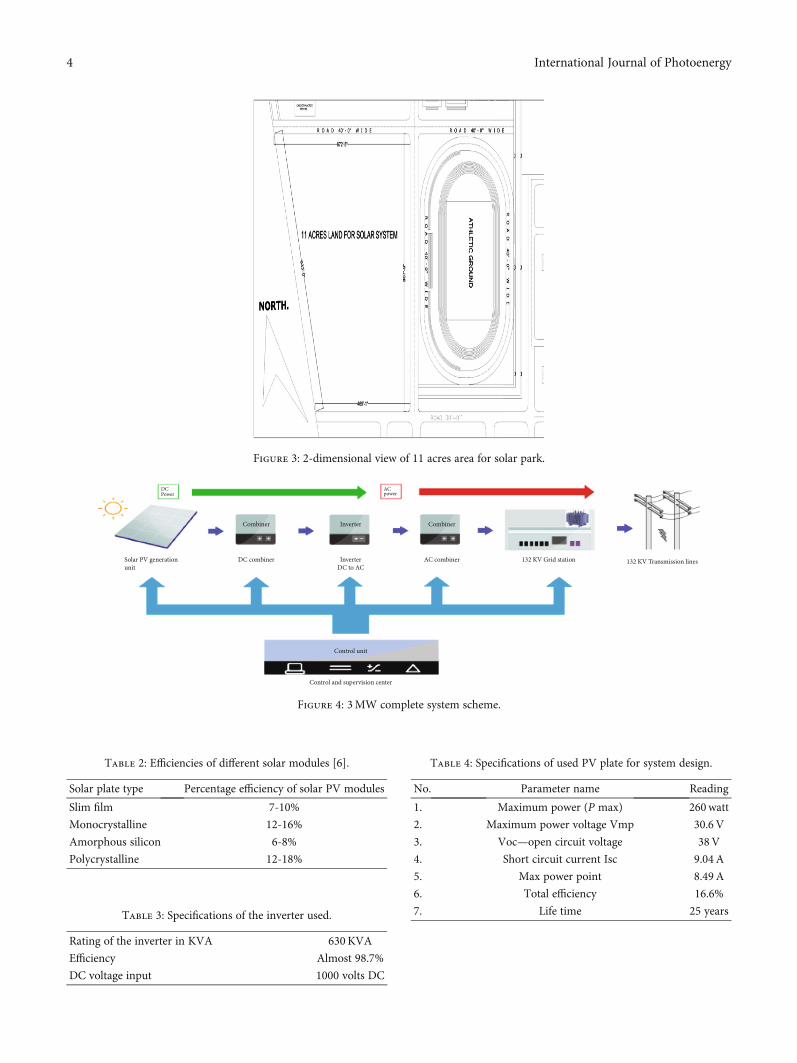
Figure 3: 2-dimensional view of 11 acres area for solar park.
DC combiner AC combiner 132 KV Grid station 132 KV Transmission linesInverterDC to AC
Combiner CombinerInverter
Control unit
Control and supervision center
Solar PV generationunit
Figure 4: 3MW complete system scheme.
Table 2: Efficiencies of different solar modules [6].
Solar plate type Percentage efficiency of solar PV modules
Slim film 7-10%
Monocrystalline 12-16%
Amorphous silicon 6-8%
Polycrystalline 12-18%
Table 3: Specifications of the inverter used.
Rating of the inverter in KVA 630KVA
Efficiency Almost 98.7%
DC voltage input 1000 volts DC
Table 4: Specifications of used PV plate for system design.
No. Parameter name Reading
1. Maximum power (P max) 260watt
2. Maximum power voltage Vmp 30.6V
3. Voc—open circuit voltage 38V
4. Short circuit current Isc 9.04 A
5. Max power point 8.49 A
6. Total efficiency 16.6%
7. Life time 25 years
4 International Journal of Photoenergy

of the equipment is present in the successive part of thearticle.
3.1. DC Power System. The system which processes the gener-ation of direct current and deals with it comes under the cat-egory of the DC power systems. PV module is one of thesignificant parts of the generation system in a solar power
plant. It is the device used to change solar energy intoelectrical energy. Many types of solar photovoltaic mod-ules are available in the open market for the solar energysystem. Table 2 shows the efficiencies of different solarmodules type:
(i) Polycrystalline
Long-term average of daily/yearly sum, period 1999–2016Daily sum: <
<
3.6
1314
4.0
1461
4.4
1607
4.8
1753
5.2
1899
5.6
2045
6.0
2191
6.4
2337kWh/m2
0 100 km>
>Yearly sum:
Figure 5: Global horizontal irradiation—SOLARGIS [9].
5International Journal of Photoenergy

(ii) Mono-crystalline
(iii) Thin-film
(iv) Amorphous silicon
Polycrystalline-Si has been preferred for the projectbecause of its efficiency and compatibility with environmen-tal conditions [7].
Another major piece of equipment is the DC combinerbox whose job is to combine the direct current from thewhole photovoltaic cells. After that, the inverter is used toconvert the main solar DC power into AC power.
3.2. AC Power System. It processes all the components whichdeal with the alternating current. The major parts of the ACpower systems are discussed here. Ac combiner box com-bines the alternating current from the inverter. If the inverterthat has been chosen earlier contains the functionality of theinbuilt AC combiner, then this separate combiner is avoided.The performance of the solar power system highly dependson the environment. For example, as the irradiance increases,it will definitely increase the output power, but here, onething is more important than if the panel temperature willstart to increase, it will reduce the efficiency of the system[1]. The clouds or the highly humid days create a hindrancein the energy generation as the wavelengths of the spectrumleave diffused radiations and start to absorb in the atmo-sphere. In short, it will low energy wavelengths that will reachthe earth which is not sufficient to fulfill the energy band gapsof the PV module.
3.3. Controlling System. The things which are used for con-trolling and monitoring the whole systems consist of theSCARDA and PLC systems additionally with the weather sta-tion and the PV power plant constituents. The controllingsystem will enable us to get the required information anytimewith the help of an LCD plus it will display the fault in thepanels by hot-spots and enable us to repair it within time [8].
3.4. Inverter. TC 630KH TBEA Xi’an Electric inverters areused in this project for suppressing the harmonics whichwas formed in the system after the DC to AC conversion. Atotal of 5 inverters of 630KW are used for the modules.Inverter specifications are shown in Table 3.
3.5. Solar PV Modules. There are many options for the PVplates which we can use, but we are going to select the PVplate with a 260W rating. By using the mathematical for-mula, we can calculate the no. of PV modules required todesign the 3MW solar PV grid-connected system.
No:of PV panel needed = TotalMWNeededRating of the Single PVUnit
:
ð5Þ
Total no. of plates should be installed for 3MW= 12200PV plates (rating 260W). The PV plates which have chosenfor this project are manufactured by JA Solar China [5].
The name of the model is JAP6 (BK)-60-260/3BB. Otherspecifications of the PV plate are given in Table 4:
3.6. The Number of Combiner Box Calculation. The combinerbox possesses the main part which is a protection breaker orthe fuse for every sequence and may have the surge protector,so these boxes are also the backbone of the system.
Total Number of Combiner Box = Total No:of Inverters:ð6Þ
In our case, we have chosen a total of 5 inverters, so com-biner boxes will be 5.
3.7. Solar GIS Maps. Solar resource maps are obtained fromthe SOLARGIS shown in Figure 5 which shows immensesolar potential at the site of the Bahawalpur.
Table 5: Energy consumed in kWh for 2018 and 2019.
Sr#
MonthkWh in the year
2018kWh in the year
2019
1 January 297,040 404,620
2 February 357,840 265,360
3 March 250,240 333,260
4 April 342,000 449,300
5 May 448,660 610,400
6 June 672,660 482,900
7 July 768,880 502,960
8 August 534,500 420,280
9 September 43,360 395,520
10 October 395,580 399,580
11 November 287,160 277,040
12 December 311,860 287,680
13 Total (kWh) 4,709,780 4,828,900
14Average per
year392,482 402,408
0
Janu
ary
Mar
ch
May July
Sept
embe
r
Nov
embe
r
200,000
400,000
600,000
800,000
Peak load
Monthly consumption
Figure 6: IUB peak load and monthly consumption.
6 International Journal of Photoenergy

Table 5 shows the unit consumption of The Islamia Uni-versity of Bahawalpur which helps in predicating the loaddemand variation for the years to come as indicated byMEPCO (Multan Electric Power Company) bill.
Figure 6 shows the peak load and monthly consumptionof the system.
3.8. Simulation Using PVSyst Software. The PVSyst softwareis one of the most commonly used software for the designingand estimation of the performance parameters of the solarPV power plant. With the wide options and built-in features,this software provides almost nearer results as comparedwith the theoretical results. This software enables you toimport the data of the different Mateo as well as personneldata which is the best thing about it. This software enablesyou to assess the main performance of the PV Planet in thefollowing circumstances: stand-alone, grid-connected, andpumping system.
The performance and the effectiveness of the total systemof the PV plant are assessed by providing the stipulation ofthe desired design. The values obtained will be nearer to thecomparison if we get from SCADA or SOLARGIS, etc.
Hence, the system is designed according to the desired spec-ifications [10]. The parameters of the system are displayed inFigure 7.
Furthermore, this software calculates the system outputand different important parameters by using the hourly sim-ulation data. In this work, the PVSyst software is adopted toestimate the annual power yields of the 3MW PV solar plantdesigned for The Islamia University of Bahawalpur with grid-connected scheme.
The simulation parameters of the grid-connected systemare displayed in Figure 8.
4. Results and Discussion
The results based on the yearly global irradiance and Mateoare presented in Table 6 which are needed for the simulationof the project. Mateo values are important because they willhelp in deciding the potential of renewable energy at thedesired site.
For solar energy, as we know that solar irritation and theambient temperature play an important role in the genera-tion of PV energy.
Figure 7: 3MW complete system modeling on PVSyst.
7International Journal of Photoenergy
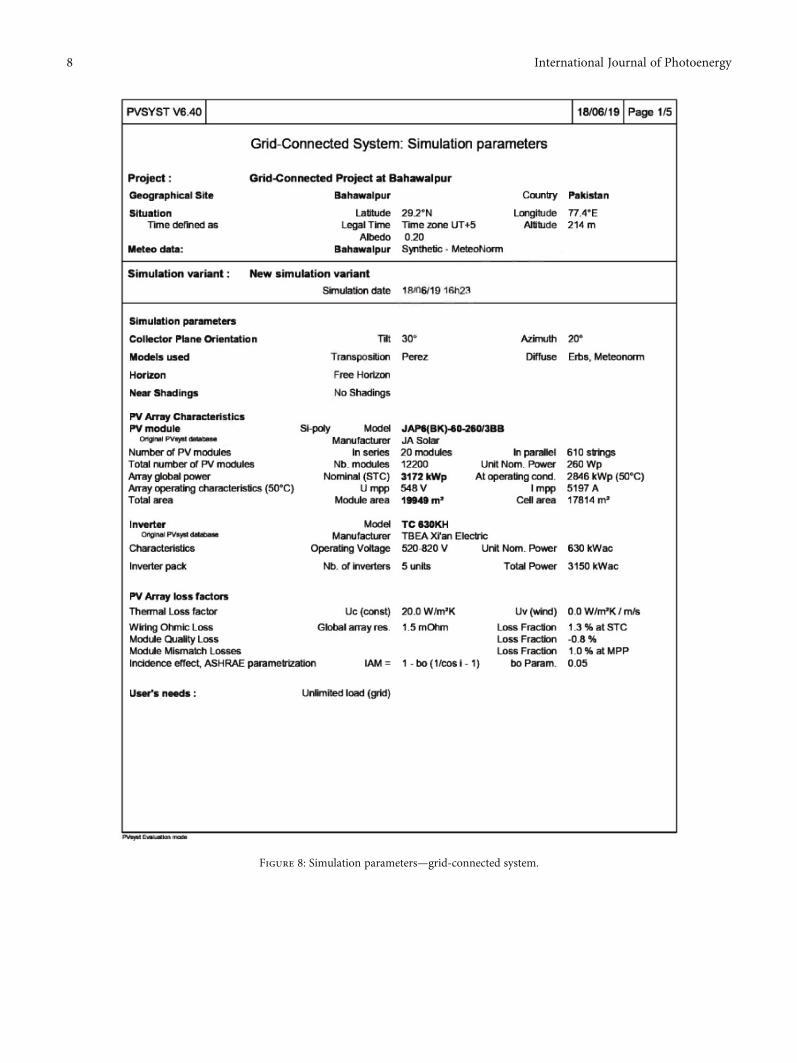
Figure 8: Simulation parameters—grid-connected system.
8 International Journal of Photoenergy

Figure 9 shows the solar paths for a whole year at theselected spot for the installation of the solar plant.
The main results of the design system are shown inFigure 10, and the daily output of the 3MW system is shownin Figure 11.
The performance ratio PR is 83.5%.The total produced energy is 4908MWh/year.
Total Specific Production =Total Energy obtainedArray Nominal Power
� �, ð7Þ
Specific Production =4908528 kWh
3173000 kWp/year=
1546:96 kWh3173000 kWp/year
:
ð8Þ
The maximum energy which is generated is 458294 kWhwhich is obtained in March, and the minimum energy gener-ated is 339333 kWh in December. The other important
results are yearly global horizontal irradiation, energies,power output, and system efficiency.
The highest power production achieved was more than19000 kilowatt hour per day in March at the module tem-perature of 21.49°C and plant efficiency of around 83.8%.The total energy output attained from the solar photovol-taic array is 4990MWh. The total efficiency of the systemis 13.27% which is quite good. The total global incidentenergy GHI which falls on the collector area plane yearlyis 1854.3 kWh/m2. Figure 12 shows the normalized pro-duction per installed kWp. Table 7 shows the main resultsof the system obtained from the PVSyst.
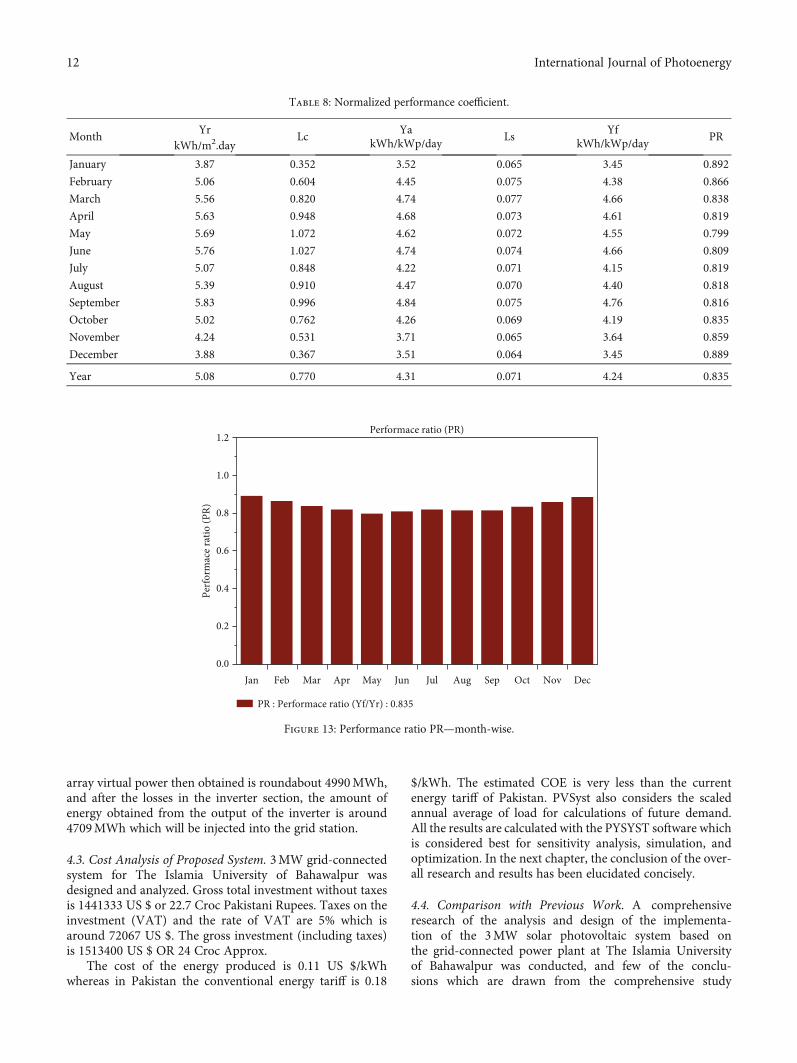
4.1. Performance Ratio. The average yearly PR is 83.5% forthe PV plants at The Islamia University of Bahawalpurwith a maximum PR of 89.2% in January, and the mini-mum PR is 79% in May. Table 8 shows the normalizedperformance efficiency of the plant. Figure 13 shows theperformance ratio PR—month-wise. The PR obtained
Table 6: Monthly Mateo values of IUB Bahawalpur, Pakistan.
MonthsGlob horkWh/m2
T AmbC
Glob InckWh/m2
Diff horkWh/m2
DifSInckWh/m2
Alb InckWh/m2
January 89.2 11.37 120.0 44.6 51.09 1.195
February 110.9 15.72 141.6 44.7 51.13 1.486
March 153.3 21.49 172.3 64.8 69.06 2.047
April 167.0 26.71 169.0 87.2 86.18 2.230
May 189.5 32.34 176.4 97.9 92.49 2.537
June 190.2 32.14 172.9 99.4 92.48 2.540
July 170.7 30.90 157.1 102.9 95.83 2.270
August 171.7 30.32 166.9 98.2 94.85 2.286
September 163.4 28.13 175.0 75.4 77.49 2.189
October 130.1 24.67 155.7 64.6 70.71 1.743
November 97.1 17.89 127.2 47.8 53.69 1.301
December 86.1 13.28 120.3 40.9 48.13 1.154
Year 1719.2 23.79 1854.3 868.4 883.14 22.978
90
75
60
45
30
15
00 30 60 90 120
6 h
7 h
8 h
9 h
10 h
11 h
12 h
13 h
15 h
16 h
17 h
18 h
–120 –90 –60
Sun
heig
ht [[
°]]
Azimuth [[°]]
Solar paths at Bahawalpur, (Lat. 29.2°N, long. 77.4°E, alt. 214 m) - Solar time
–30
1: 22 June
1: 22 December
2: 22 May - 23 July3: 20 Apr - 23 Aug4: 20 Mar - 23 Sep5: 21 Feb - 23 Oct6: 19 Jan - 22 Nov
12
3
4
5
67
Figure 9: Solar paths at IUB, Bahawalpur, Pakistan, Lat 29.2 N, Long 77.4 E, alt. 214m.
9International Journal of Photoenergy

1.2
1.0
0.8
0.6
0.4
0.2
0.0Jan Feb Mar
Perfo
rmac
e rat
io (P
R)
Apr May Jun Jul
Performace ratio (PR)
Aug Sep Oct Nov Dec
PR : Performace ration (Yf/Yr) : 0.835
7
6
5
4
3
2
1
0Jan Feb Mar
Nor
mal
ized
ener
gy [k
wh/
k w
h/da
y]
Apr May Jun Jul
Normalized production (per installed kWp): Nominal power 3172 kWp
Aug Sep Oct Nov Dec
Lc : Collection loss (PV-array losses)Ls : System loss (inverter,...)Yf : Produced useful energy (inverter output)
0.77 kWh/kWp/dayLs : kWh/kWp/dayYf : kWh/kWp/day
Figure 10: Grid-connected simulation results.
20000
18000
16000
14000
12000
10000
8000
6000
4000
2000
0Jan Feb
k w
h/da
y
Mar Apr May Jun Jul
Daily system output energy
Aug Sep Oct Nov Dec
Energy injected into grid
Figure 11: Daily system output energy.
10 International Journal of Photoenergy

from the PVSyst is almost the same calculated with themathematical formulas.
Performance Ratio =Total Energy recorded kWhð Þ
Energy obtained, ð9Þ
Energy obtained = Total Active area of panel m2� �∗ Solar Irradiance at Place kWh/m2� �∗ TotalModule efficiency:
ð10Þ
4.2. Loss Diagram. The most important factor whichshould be taken into account while designing is power sys-tem losses. It plays an important role in the calculation ofthe power generation output. The GHI is 1719 kWh/m2,and the efficient irradiation which falls in the day timeon the collector plane is almost 1800 kWh/m2. So, basi-cally, total system loss in the energy is 0.70-1% [11].Figure 14 shows the loss diagram over the whole year.
When the solar energy falls on the solar panel, it will con-vert into electrical energy, and after the transfer, the arrayostensible or the main nominal energy is around5510MWh, and the efficiency of the solar photovoltaic sys-tem array at that moment is 15.90%, so we can say that the
7
6
5
4
3
2
1
0Jan Feb Mar
Nor
mal
ized
ener
gy [k
wh/
k w
h/da
y]
Apr May Jun Jul
Normalized production (per installed kWp): Nominal power 3172 kWp
Aug Sep Oct Nov Dec
Lc : Collection loss (PV-array losses)Ls : System loss (inverter,...)Yf : Produced useful energy (inverter output)
0.77 kWh/kWp/dayLs : kWh/kWp/dayYf : kWh/kWp/day
Figure 12: Normalized production per installed kWp.
Table 7: Balance and main results of the system.
MonthsGlob incidentkWh/m2
Array energykWh
Grid energykWh
Eff ArrR%
Eff SysR%
January 120.0 345926 339575 14.45 14.19
February 141.6 395408 388716 14.00 13.77
March 172.3 465913 458294 13.55 13.33
April 169.0 445751 438839 13.22 13.02
May 176.4 454150 447116 12.90 12.70
June 172.9 450636 443615 13.07 12.86
July 157.1 414872 407915 13.24 13.02
August 166.9 440013 433113 13.21 13.01
September 175.0 460285 453142 13.19 12.98
October 155.7 418933 412185 13.49 13.27
November 127.2 352877 346686 13.91 13.67
December 120.3 345600 339333 14.40 14.14
Year 1854.3 4990366 4908528 13.49 13.27
11International Journal of Photoenergy
array virtual power then obtained is roundabout 4990MWh,and after the losses in the inverter section, the amount ofenergy obtained from the output of the inverter is around4709MWh which will be injected into the grid station.
4.3. Cost Analysis of Proposed System. 3MW grid-connectedsystem for The Islamia University of Bahawalpur wasdesigned and analyzed. Gross total investment without taxesis 1441333 US $ or 22.7 Croc Pakistani Rupees. Taxes on theinvestment (VAT) and the rate of VAT are 5% which isaround 72067 US $. The gross investment (including taxes)is 1513400 US $ OR 24 Croc Approx.
The cost of the energy produced is 0.11 US $/kWhwhereas in Pakistan the conventional energy tariff is 0.18
$/kWh. The estimated COE is very less than the currentenergy tariff of Pakistan. PVSyst also considers the scaledannual average of load for calculations of future demand.All the results are calculated with the PYSYST software whichis considered best for sensitivity analysis, simulation, andoptimization. In the next chapter, the conclusion of the over-all research and results has been elucidated concisely.
4.4. Comparison with Previous Work. A comprehensiveresearch of the analysis and design of the implementa-tion of the 3MW solar photovoltaic system based onthe grid-connected power plant at The Islamia Universityof Bahawalpur was conducted, and few of the conclu-sions which are drawn from the comprehensive study
1.2
1.0
0.8
0.6
0.4
0.2
0.0Jan Feb Mar
Perfo
rmac
e rat
io (P
R)
Apr May Jun Jul
Performace ratio (PR)
Aug Sep Oct Nov Dec
PR : Performace ratio (Yf/Yr) : 0.835
Figure 13: Performance ratio PR—month-wise.
Table 8: Normalized performance coefficient.
MonthYr
kWh/m2.dayLc
YakWh/kWp/day
LsYf
kWh/kWp/dayPR
January 3.87 0.352 3.52 0.065 3.45 0.892
February 5.06 0.604 4.45 0.075 4.38 0.866
March 5.56 0.820 4.74 0.077 4.66 0.838
April 5.63 0.948 4.68 0.073 4.61 0.819
May 5.69 1.072 4.62 0.072 4.55 0.799
June 5.76 1.027 4.74 0.074 4.66 0.809
July 5.07 0.848 4.22 0.071 4.15 0.819
August 5.39 0.910 4.47 0.070 4.40 0.818
September 5.83 0.996 4.84 0.075 4.76 0.816
October 5.02 0.762 4.26 0.069 4.19 0.835
November 4.24 0.531 3.71 0.065 3.64 0.859
December 3.88 0.367 3.51 0.064 3.45 0.889
Year 5.08 0.770 4.31 0.071 4.24 0.835
12 International Journal of Photoenergy

of the location and the working of the system are asfollows:
(i) First Finding. The maximum energy which is pro-duced or generated from this system is458294 kWh which is taken out in March, and the
minimum energy generated is 339333 kWh in thelast month of December
(ii) The total energy output taken out from the solarphotovoltaic system array is 4990MWh. The totalefficiency of the system is 13.27%
Horizontal global irradiationGlobal incident in coll. plane+7.9%
+0.8%
–2.9%
–0.4%
–11.2%
–1.0%–0.9%
–1.6%0.0%0.0%0.0%0.0%0.0%
IAM factor on global
Effective irradiance on collectors
PV conversion
Array nominal energy (at STC effic.)PV loss due to irradiance level
PV loss due to temperature
Module quality loss
Module array mismatch lossOhmic wiring lossArray virtual energy at MPP
Inverter loss during operation (efficiency)Inverter loss over nominal inv. powerInverter loss due to power thresholdInverter loss over nominal inv. voltageInverter loss due to voltage thresholdNight consumptionAvailable energy at inverter output
Energy injected into grid
4909 MWh
4909 MWh
4990 MWh
5710 MWh
1719 kWh/m2
1800 kWh/m2 19949 m2 coll.
Efficiency at STC = 15.90%
⁎
Figure 14: Loss diagram over the whole year.
Table 9: Comparison of proposed system with QASP.
Plant names Performance ratio Cost of energy unit Conversion losses in inverter
Proposed plant at IUB 83.5% 0.11 $/kWh 0.8%
Quaid-E-Azam Solar Park 79% 0.13 $/kWh 2%
13International Journal of Photoenergy

(iii) The average yearly PR is 83.5% for the PV plants atThe Islamia University of Bahawalpur with a maxi-mum PR of 89.2% in January, and the minimumPR is 79% in May
From the simulation results, the value of PR comes out83.8%. It is also concluded that it is equal to 15369.3 kg ofthe coal saving per day by installing 3MW solar plant whichis equal to planting 147600 teak trees over the lifetime. Theimplication of this paper will help people to install their effi-cient solar park.
The proposed solar system and Quaid-E-Azam SolarPark (QASP) are compared. The performance ratio, cost ofenergy, and conversion losses in comparison with QASPare given in Table 9.
It was found that the proposed system outperforms incomparison with Quaid-E-Azam Solar Park (QASP). Theperformance ratio of proposed system calculated was 83.5%while QASP has PR of 79%. Moreover, cost of energy was cal-culated as 0.11 $/kWh which is less than the already installedQASP.
5. Conclusion
This present research summarizes the 3MW solar powerplant at The Islamia University of Bahawalpur with in-depth reports about the annual production, power losses inthe plant, and future impact regarding the shortage of energycrises. Few of the conclusions which are drawn from thecomprehensive research of the location and the system areas follows:
(i) The maximum energy generated from the system is458294 kWh which is taken out in March, and theminimum energy generated is 339333 kWh in thelast month of December
(ii) The total energy output taken out from the photo-voltaic system array is 4990MWh. The total effi-ciency of the system is 13.27%
(iii) The average yearly PR is 83.5% for the PV plantswith maximum PR of 89.2% in January, and theminimum PR is 79% in May
From the simulation results, the value of PR comes out83.8%. It is also concluded that it is equal to 15369.3 kg ofthe coal saving per day by installing 3MW solar plant whichis equal to planting 147600 teak trees over the lifetime. Theimplication of this research will help people to install theirefficient solar park.
6. Future Recommendations
This research endows with the imminent to spot the location,compatibility of the project for installing or designing thesolar plant anywhere in the world. It will also help in analyz-ing the performance of the solar plants. The information pre-sented in this research is quite useful in finding out theoperational and environmental benefits of the solar photo-
voltaic projects based on the net energy yield. The theoreticaldata and the operating experience of the solar photovoltaicplant can be applied for greater scale projects in the future.This type of project would help the country in meeting theshortage of energy and would play its part in reducing thecost of energy. Effect of environmental condition-sandstorms on PV modules in Bahawalpur are needed to beaddressed in future to cater the practical issues of the system.
Data Availability
Data is made available in supplementary files.
Conflicts of Interest
The authors declare that they have no conflicts of interest.
References
[1] M. Kamran, “Current status and future success of renewableenergy in Pakistan,” Renewable and Sustainable EnergyReviews, vol. 82, pp. 609–617, 2018.
[2] A. Detrick and L. Mitchell, “Performance evaluation standardsfor photovoltaic modules and systems,” in Conference Recordof the Thirty-first IEEE Photovoltaic Specialists Conference,Lake Buena Vista, FL, USA, 2005.
[3] M. A. Nawaz, A. Raheem, R. Shakoor, and Z. Anwar, “Feasibil-ity and optimization of standalone PV/biogas hybrid distrib-uted renewable system for rural electrification: a case studyof a Cholistan community,”Mehran University Research Jour-nal of Engineering and Technology, vol. 38, no. 2, pp. 453–462,2019.
[4] Y. B. Hassan, A. Raheem, and R. Shakoor, “Pecuniary Optimi-zation of Biomass/Wind Hybrid Renewable System,” in Pro-ceedings of 1st International e-Conference on Energies, pp. 1–10, 2014.
[5] The Renewable Energy Hub UK, How Do Solar Panels Gener-ate Electricity? – The Renewable Energy Hub, RenewableEnergy Hub UK, 2019.
[6] M. Aarre Maehlum, Which Solar Panel Type Is Best? Mono-,Polycrystalline or Thin Film?, Energy informative, 2015.
[7] D. A. Katsaprakakis and D. G. Christakis, “The exploitation ofelectricity production projects from Renewable EnergySources for the social and economic development of remotecommunities. The case of Greece: an example to avoid,”Renewable and Sustainable Energy Reviews, vol. 54, pp. 341–349, 2016.
[8] H. Lei, Z. Zhi-Shan, and L. Xin-Rong, “Sap flow ofArtemisiaordosicaand the influence of environmental factors in a reve-getated desert area: Tengger Desert, China,” Hydrological Pro-cesses, vol. 24, no. 10, pp. 1248–1253, 2010.
[9] https://solargis.com/maps-and-gis-data/overview. (Last Vis-ited: 14 th April, 2020).
[10] R. Shyam Meena, S. Agariya, D. K. Palwaliya, N. Gupta, A. S.Parira, and S. K. Gupta, Solar Parks to Ramp up Solar Projectsin the Country, Issues, and Challenges: Contribution towardsClimate Change, Int. Conf. Expo, 2017.
[11] N. K. Sharma and R. Mishra, “Optimal Design of HybridRenewable Energy System for a Sustainable Energy Develop-ment of a Village in Rajasthan,” International Journal of Sci-ence and Research (IJSR), vol. 5, no. 4, pp. 952–954, 2016.
14 International Journal of Photoenergy