Modeling and Analysis Framework for Informed Decision ... · Modeling and Analysis Framework for...
13
Modeling and Analysis Framework for Risk-Informed Decision Making for FAA NextGen Mark R. Blackburn, Ph.D. Art Pyster, Ph.D. Teresa Zigh, Ph.D. Richard Turner, Ph.D. Stevens Institute of Technology [email protected] [email protected] [email protected] [email protected] Robin DillonMerrill, Ph.D. Georgetown University [email protected] Copyright © 2013 by Mark R. Blackburn. Published and used by INCOSE with permission. Abstract. This paper discusses an analysis and modeling framework that is being developed to support risk-informed decision-making for the Federal Aviation Administration Next Generation Air Transportation System (NextGen). Discussions with over 60 success critical stakeholders identified challenges for those responsible for planning, developing, and deploying NextGen capabilities, for example: all component dependencies are not being systematically identified, all interface dependencies are not being formally tracked, and tradeoff impacts are difficult to assess, especially in the face of changes. Peoples’ internal knowledge is much greater than what is captured externally or formally. Additionally, this knowledge and the causal relationships to program factors is not formalized in a way to support this complex decision-making process. The paper describes a Bayesian network-based analysis and modeling framework with usage scenarios for calculating cost, schedule and benefit risks to support collaborative decision-making throughout the phases of the FAA’s acquisition lifecycle process. Section 1: Introduction The Next Generation Air Transportation System (NextGen) is the Federal Aviation Administration (FAA)’s vision of the National Airspace System (NAS) for the next 15 years. This wide-ranging Systems of Systems (SoS) initiative will transform the NAS by using 21st century technologies, such as satellite navigation and automation, to ensure it meets future safety, security, capacity, efficiency, and environmental needs. The resulting system will be dynamic, scalable, networked, and fully digital. The genesis of this transformation is the FAA’s NAS Enterprise Architecture (EA). The NAS EA defines the NextGen goals in a set of Operational Improvements, generically referred to as capabilities. The decision-making processes to plan, develop, and deploy NextGen capabilities are extremely challenging. The diverse set of stakeholders make the NextGen planning process a “wicked problem.” Wicked problems, by Rittel’s definition, are bewilderingly complex and have far-reaching implications for large numbers of very different stakeholder groups, each with competing interests (Rittel 1972). This paper discusses a task sponsored by the FAA to develop a model and analysis framework to help decision makers better understand the complex set of causal relationships for developing and deploying capabilities in the NextGen SoS in order to support risk-informed decision making. Discussions were held with more than 60 success-critical stakeholders from the senior levels of the FAA, NASA, Industry, and the
Transcript of Modeling and Analysis Framework for Informed Decision ... · Modeling and Analysis Framework for...
Modeling and Analysis Framework for Risk-Informed Decision Making for FAA NextGen
Mark R. Blackburn, Ph.D. Art Pyster, Ph.D. Teresa Zigh, Ph.D.
Richard Turner, Ph.D. Stevens Institute of Technology [email protected] [email protected] [email protected]
Robin Dillon-‐Merrill, Ph.D. Georgetown University [email protected]
Copyright © 2013 by Mark R. Blackburn. Published and used by INCOSE with permission.
Abstract. This paper discusses an analysis and modeling framework that is being developed to support risk-informed decision-making for the Federal Aviation Administration Next Generation Air Transportation System (NextGen). Discussions with over 60 success critical stakeholders identified challenges for those responsible for planning, developing, and deploying NextGen capabilities, for example: all component dependencies are not being systematically identified, all interface dependencies are not being formally tracked, and tradeoff impacts are difficult to assess, especially in the face of changes. Peoples’ internal knowledge is much greater than what is captured externally or formally. Additionally, this knowledge and the causal relationships to program factors is not formalized in a way to support this complex decision-making process. The paper describes a Bayesian network-based analysis and modeling framework with usage scenarios for calculating cost, schedule and benefit risks to support collaborative decision-making throughout the phases of the FAA’s acquisition lifecycle process.
Section 1: Introduction The Next Generation Air Transportation System (NextGen) is the Federal Aviation Administration (FAA)’s vision of the National Airspace System (NAS) for the next 15 years. This wide-ranging Systems of Systems (SoS) initiative will transform the NAS by using 21st century technologies, such as satellite navigation and automation, to ensure it meets future safety, security, capacity, efficiency, and environmental needs. The resulting system will be dynamic, scalable, networked, and fully digital. The genesis of this transformation is the FAA’s NAS Enterprise Architecture (EA). The NAS EA defines the NextGen goals in a set of Operational Improvements, generically referred to as capabilities. The decision-making processes to plan, develop, and deploy NextGen capabilities are extremely challenging. The diverse set of stakeholders make the NextGen planning process a “wicked problem.” Wicked problems, by Rittel’s definition, are bewilderingly complex and have far-reaching implications for large numbers of very different stakeholder groups, each with competing interests (Rittel 1972). This paper discusses a task sponsored by the FAA to develop a model and analysis framework to help decision makers better understand the complex set of causal relationships for developing and deploying capabilities in the NextGen SoS in order to support risk-informed decision making. Discussions were held with more than 60 success-critical stakeholders from the senior levels of the FAA, NASA, Industry, and the
Joint Planning and Development Office (JPDO). There are many challenges, such as all component dependencies are not systematically being identified, all interface dependencies are not being formally tracked (e.g., using databases), and tradeoff impacts are difficult to assess, especially in the face of changes. In addition, what people know matters significantly, because their internal knowledge is much greater than what is captured externally or formally. However, this knowledge and the causal relationships to the various program factors are not formalized in a way to support this complex decision-making process. The research team formulated a conceptual model and the success criteria for the analysis and modeling framework. This paper describes scenarios that have been socialized and vetted with many of the stakeholders as to how the models can be used to calculate risk. This is an important step, because these stakeholders will use the modeling framework in collaborative risk-informed decision-making. In addition, in nearly every meeting where we shared this concept, the attendees have suggested that we share it with others too. This initial buy-in is good as collaboration in SoS decision-making and in “wicked problems” is essential.
Organization of Paper: Using Modified Heilmeier's Catechism The key purpose of the research and aspects described in the paper are presented using a modified set of questions proposed by George Heilmeier (Wikipedia 2012). What are we trying to do? We are trying to build a modeling and analysis framework that combines quantitative historical data with qualitative subjective judgment about SoS program factors to improve the predictability of the cost, schedule and expected benefit and associated risk. Details are provided in Section 3. How is it done today, and what are the limits of current practice? The current process relies on significant human judgment, with tools such as spreadsheets that are ill defined to factor complex SoS interactions into the estimates of cost, schedule, benefit and the associated risks, especially in the face of continuous change. While these approaches may have worked on a single or small system, the asynchronous nature of SoS integration and deployment requires new approaches to deal with situations such as complex SoS interdependencies and coordinated collaboration between stakeholders of aircraft, airport infrastructures, air navigation service providers, and NextGen development contractors. Details of the SoS challenges are described in Section 2. What's new in your approach and why do you think it will be successful? The approach is based on a set of Bayesian Network (BN) models that include the quantitative historical cost, schedule and benefit data, with qualitative expert subjective judgment about program factors. The BN captures the causal relationship of the program factors that calculate risk-based probabilities that can be shared with stakeholders to support a collaborative decision-making process. This approach has been applied in the past to predicting schedules on a three-stage design, integration, and manufacturing process, however that project was not on the scale of NextGen. The multi-stage BN model was able to reduce the variance of schedule estimates by more than 50 percent by leveraging peoples’ internal knowledge of program factors. Section 3 discusses details about the success criteria, which is to reduce the variance of cost and schedule predictions. Who cares? Every stakeholder from the Secretary of Transportation, the airlines, customers, and especially the FAA care about meeting cost, schedule and benefit goals.

If you're successful, what difference will it make? NextGen capabilities will rollout on schedule, which is critical, because missing schedule almost always has a direct negative impact on cost. In addition, missing schedule negatively impacts benefits, because a benefit is not totally realized until all functions associated with the capability have been deployed. Details are provided in Section 2.
Section 2: The Problem for NextGen and The Stakeholders The genesis of this transformation is the FAA’s NAS Enterprise Architecture (EA). The NAS EA defines the NextGen goals in a set of Capabilities. The challenge is to rollout capabilities over time, considering many cross-cutting factors across the domains and locations as reflected by Figure 1 (Stroup 2012).
1. The y-axis reflects the domains that include: • At the top are the Aircraft that must be equipped with the appropriate technologies
to enable NextGen capabilities • At the bottom are the Airports that also must be equipped with new technologies
and capabilities to support NextGen capabilities • The middle two layers include the airspace and air traffic control
2. The x-axis reflects that the capabilities must be rolled out across these domain to various location (e.g., airports, or regional areas such as the Atlantic or Pacific ocean)
3. The z-axis is time, which the FAA has partition into: (Alpha: 2010-2015) (Bravo: 2015-2018), and (Far-term though 2025)
Figure 1. Integrated Framework for NextGen Operations
As shown in Figure 2, there are seven Solution Sets that address and deliver capacity, efficiency, safety and security benefits for air transportation operations. These capabilities cut across many transformational programs that are leveraging new technologies. As reflected in Figure 2, any one capability may require integration and deployment of capabilities across the Integrated Framework of NextGen Operations that include aircrafts, airports, and airspace and air traffic control services. Many examples are provided in the NextGen Implementation Plan (FAA 2012), which refers to the “Capabilities” as Operational Improvements.
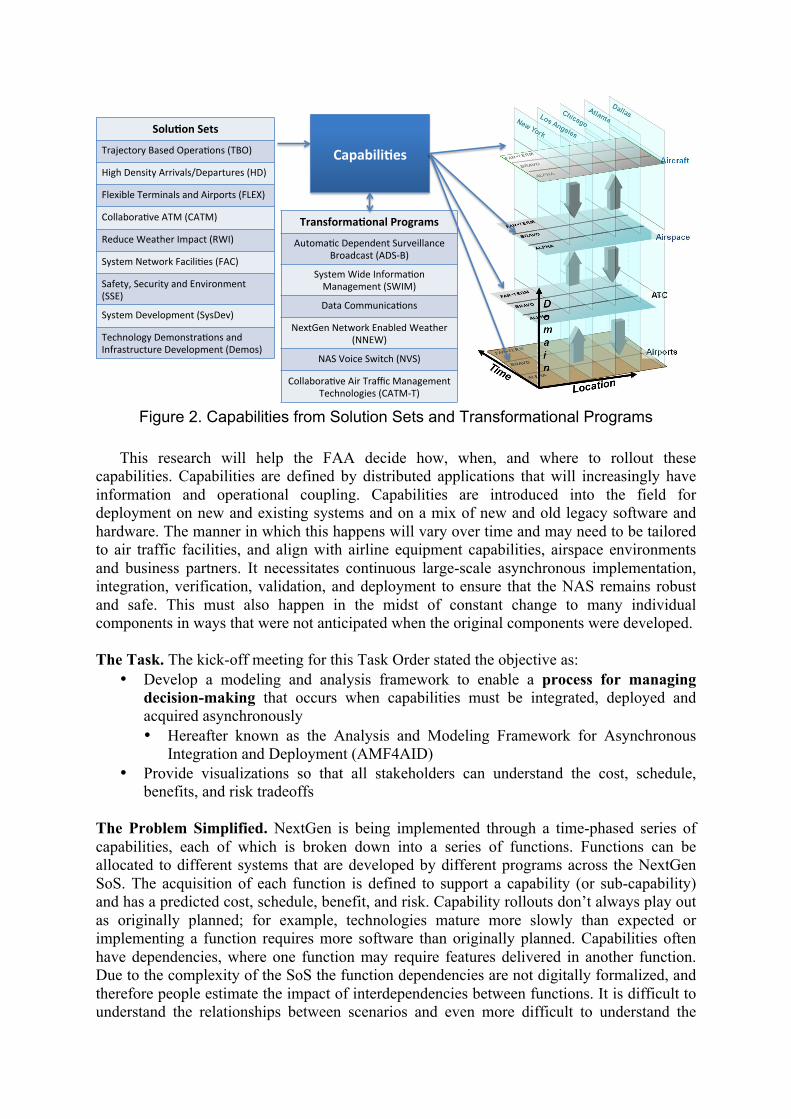
Figure 2. Capabilities from Solution Sets and Transformational Programs
This research will help the FAA decide how, when, and where to rollout these capabilities. Capabilities are defined by distributed applications that will increasingly have information and operational coupling. Capabilities are introduced into the field for deployment on new and existing systems and on a mix of new and old legacy software and hardware. The manner in which this happens will vary over time and may need to be tailored to air traffic facilities, and align with airline equipment capabilities, airspace environments and business partners. It necessitates continuous large-scale asynchronous implementation, integration, verification, validation, and deployment to ensure that the NAS remains robust and safe. This must also happen in the midst of constant change to many individual components in ways that were not anticipated when the original components were developed. The Task. The kick-off meeting for this Task Order stated the objective as:
• Develop a modeling and analysis framework to enable a process for managing decision-making that occurs when capabilities must be integrated, deployed and acquired asynchronously • Hereafter known as the Analysis and Modeling Framework for Asynchronous
Integration and Deployment (AMF4AID) • Provide visualizations so that all stakeholders can understand the cost, schedule,
benefits, and risk tradeoffs The Problem Simplified. NextGen is being implemented through a time-phased series of capabilities, each of which is broken down into a series of functions. Functions can be allocated to different systems that are developed by different programs across the NextGen SoS. The acquisition of each function is defined to support a capability (or sub-capability) and has a predicted cost, schedule, benefit, and risk. Capability rollouts don’t always play out as originally planned; for example, technologies mature more slowly than expected or implementing a function requires more software than originally planned. Capabilities often have dependencies, where one function may require features delivered in another function. Due to the complexity of the SoS the function dependencies are not digitally formalized, and therefore people estimate the impact of interdependencies between functions. It is difficult to understand the relationships between scenarios and even more difficult to understand the
Solu%on'Sets'
Trajectory*Based*Opera0ons*(TBO)**
High*Density*Arrivals/Departures*(HD)**
Flexible*Terminals*and*Airports*(FLEX)**
Collabora0ve*ATM*(CATM)**
Reduce*Weather*Impact*(RWI)**
System*Network*Facili0es*(FAC)**
Safety,*Security*and*Environment*
(SSE)**
System*Development*(SysDev)**
Technology*Demonstra0ons*and*
Infrastructure*Development*(Demos)**
Capabili%es'
Transforma%onal'Programs'
Automa0c*Dependent*Surveillance*
Broadcast*(ADSPB)**
System*Wide*Informa0on*
Management*(SWIM)*
Data*Communica0ons*
NextGen*Network*Enabled*Weather*
(NNEW)*
NAS*Voice*Switch*(NVS)*
Collabora0ve*Air*Traffic*Management*
Technologies*(CATMPT)*
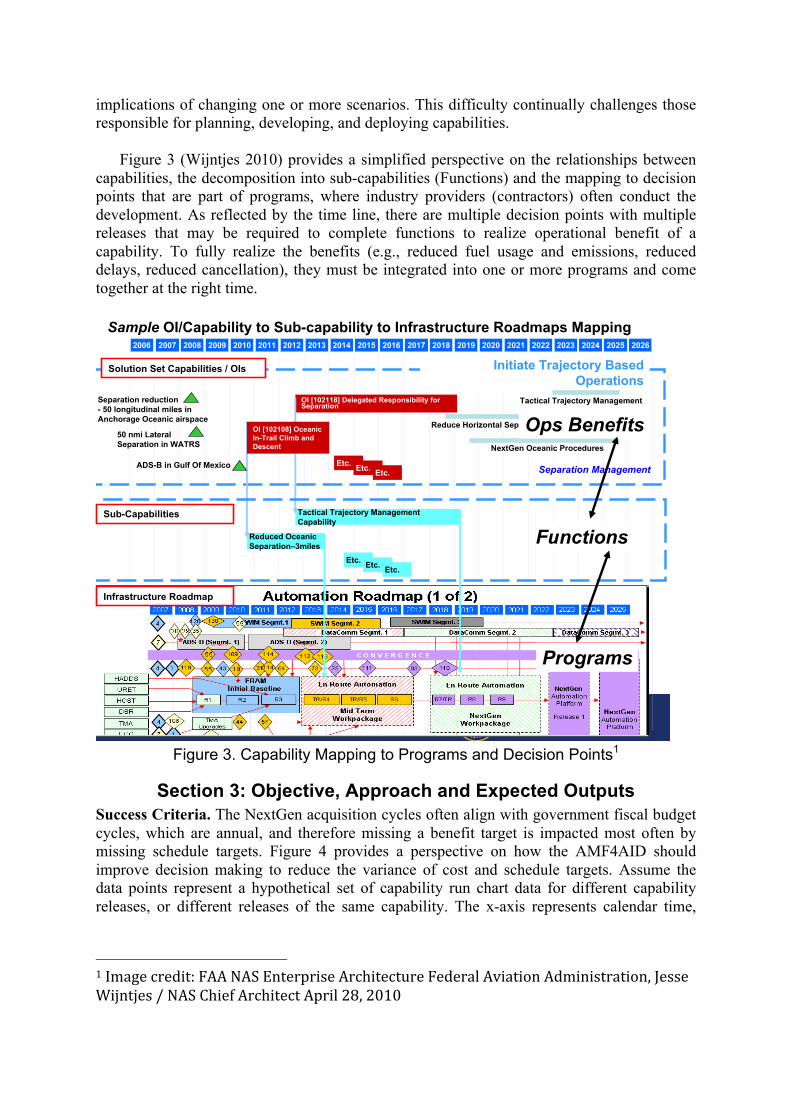
implications of changing one or more scenarios. This difficulty continually challenges those responsible for planning, developing, and deploying capabilities. Figure 3 (Wijntjes 2010) provides a simplified perspective on the relationships between capabilities, the decomposition into sub-capabilities (Functions) and the mapping to decision points that are part of programs, where industry providers (contractors) often conduct the development. As reflected by the time line, there are multiple decision points with multiple releases that may be required to complete functions to realize operational benefit of a capability. To fully realize the benefits (e.g., reduced fuel usage and emissions, reduced delays, reduced cancellation), they must be integrated into one or more programs and come together at the right time.
Figure 3. Capability Mapping to Programs and Decision Points1
Section 3: Objective, Approach and Expected Outputs Success Criteria. The NextGen acquisition cycles often align with government fiscal budget cycles, which are annual, and therefore missing a benefit target is impacted most often by missing schedule targets. Figure 4 provides a perspective on how the AMF4AID should improve decision making to reduce the variance of cost and schedule targets. Assume the data points represent a hypothetical set of capability run chart data for different capability releases, or different releases of the same capability. The x-axis represents calendar time,
1 Image credit: FAA NAS Enterprise Architecture Federal Aviation Administration, Jesse Wijntjes / NAS Chief Architect April 28, 2010
FAA NAS Enterprise Architecture Briefing 28Federal AviationAdministrationJanuary 2010
2008 2009 2010 2011 2013 2014 20152012 2016 2017 2018 2019 2020 2021 2022 2023 2024 2025 20262006 2007
OI [102118] Delegated Responsibility for Separation
Initiate Trajectory Based Operations
Tactical Trajectory Management Capability
Reduced Oceanic Separation–3miles
Sample OI/Capability to Sub-capability to Infrastructure Roadmaps Mapping
Etc.
Infrastructure Roadmap
Solution Set Capabilities / OIs
Etc. Etc.
Etc. Etc. Etc.
OI [102108] Oceanic In-Trail Climb and Descent
Tactical Trajectory Management
Reduce Horizontal Separation Standards - 3 Miles
NextGen Oceanic Procedures
Separation Management
Separation reduction - 50 longitudinal miles in Anchorage Oceanic airspace
ADS-B in Gulf Of Mexico
50 nmi Lateral Separation in WATRS
Sub-Capabilities
Ops Benefits
Functions
Programs

which increases to the right, and the y-axis can represent either cost or duration of time to produce a release. Consider the following scenarios:
1. As the project evolves, actual data becomes available. A hypothetical set of capability run chart data (dark red dashed line) indicates that there is significant variance between different data points. This pattern is common and illustrates the conceptual difficulty in estimating cost/schedule for developing, integrating, testing and deploying capabilities.
2. One aspect of the proposed modeling approach is based on a pattern that has been used in the past to reduce the variance by 50 percent. This is reflected by the black line and shaded blue area and can be achieved when the estimation process uses qualitative subjective factors (i.e., expert judgment) about program factors in given contexts to complement quantitative historical run chart data.
3. The key goal is to use quantitative historical data and qualitative factors to improve early decisions that can reflect the causal relationships of complex program factors to reduce the variance and align the capability planning and development that can result in actual costs and schedules that more closely match the desired target (green line, and shaded green region).
Figure 4. Conceptual Problem: Complexity-Based Decision-making Impacts on
Cost/Schedule In every meeting with the stakeholders, they agreed that if the AMF4AID could reduce the variance of predicted cost and schedules, as reflected in Figure 4, that would represent the success criteria for the model.
Framework Overview The framework must represent the causal relationships between cost, schedule and benefit data with technical and non-technical program factors required to rollout a capability. In general, it may take from seven to eleven years to move a capability from a research prototype to initial deployment. These stages are managed through specific decision points in the Ideas-to-In Service (I2I) process, which is now being refined by NextGen to complement the FAA Acquisition Management System. Therefore, the AMF4AID must support decision-making that aligns with these decision points in the I2I. Finally, it must provide some type of representation to visualize risks for cost, schedule and benefits. Risk Representations. The Bayesian network tooling for the framework provides probabilistic representation of cost, schedule and benefit risks to support improved decision
Reduce variance
Data points represent Duration (schedule time) or Cost to produce a capability
Goal: Improve early decisions
Calendar Time
Dur
atio
n (s
ched
ule
time)
or C
ost
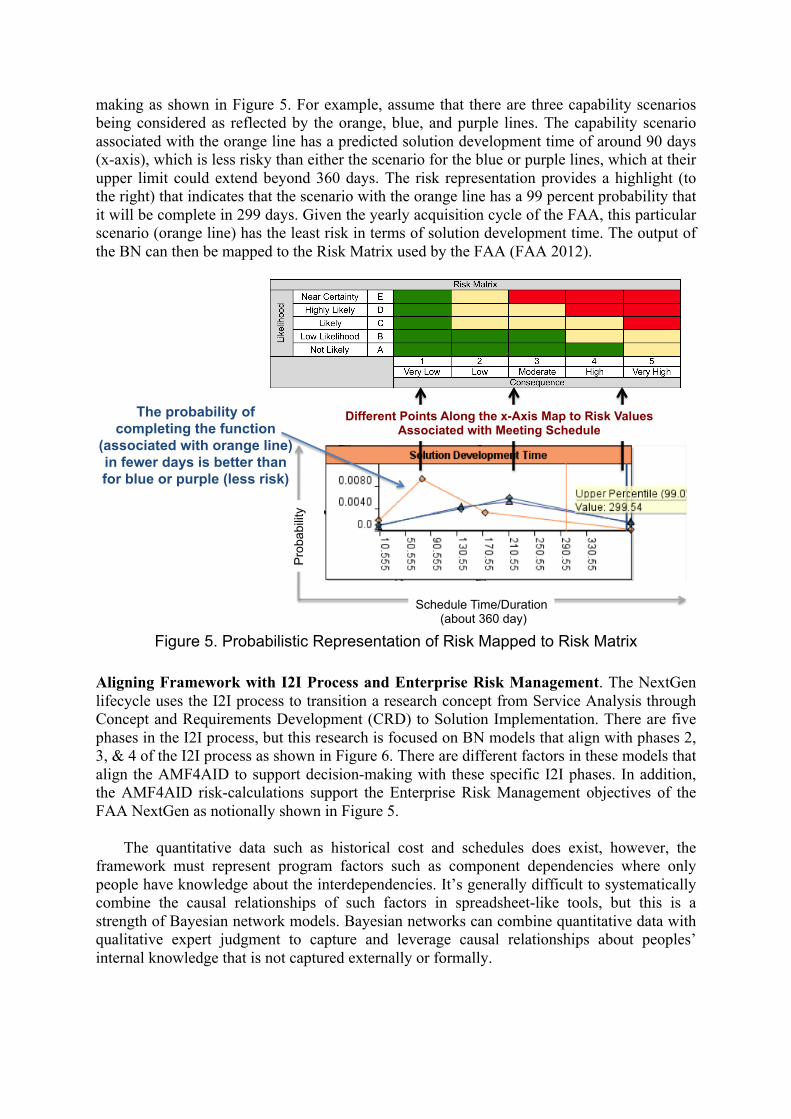
making as shown in Figure 5. For example, assume that there are three capability scenarios being considered as reflected by the orange, blue, and purple lines. The capability scenario associated with the orange line has a predicted solution development time of around 90 days (x-axis), which is less risky than either the scenario for the blue or purple lines, which at their upper limit could extend beyond 360 days. The risk representation provides a highlight (to the right) that indicates that the scenario with the orange line has a 99 percent probability that it will be complete in 299 days. Given the yearly acquisition cycle of the FAA, this particular scenario (orange line) has the least risk in terms of solution development time. The output of the BN can then be mapped to the Risk Matrix used by the FAA (FAA 2012).
Figure 5. Probabilistic Representation of Risk Mapped to Risk Matrix
Aligning Framework with I2I Process and Enterprise Risk Management. The NextGen lifecycle uses the I2I process to transition a research concept from Service Analysis through Concept and Requirements Development (CRD) to Solution Implementation. There are five phases in the I2I process, but this research is focused on BN models that align with phases 2, 3, & 4 of the I2I process as shown in Figure 6. There are different factors in these models that align the AMF4AID to support decision-making with these specific I2I phases. In addition, the AMF4AID risk-calculations support the Enterprise Risk Management objectives of the FAA NextGen as notionally shown in Figure 5. The quantitative data such as historical cost and schedules does exist, however, the framework must represent program factors such as component dependencies where only people have knowledge about the interdependencies. It’s generally difficult to systematically combine the causal relationships of such factors in spreadsheet-like tools, but this is a strength of Bayesian network models. Bayesian networks can combine quantitative data with qualitative expert judgment to capture and leverage causal relationships about peoples’ internal knowledge that is not captured externally or formally.
Schedule Time/Duration (about 360 day)
Pro
babi
lity
Different Points Along the x-Axis Map to Risk Values Associated with Meeting Schedule
The probability of completing the function
(associated with orange line) in fewer days is better than for blue or purple (less risk)
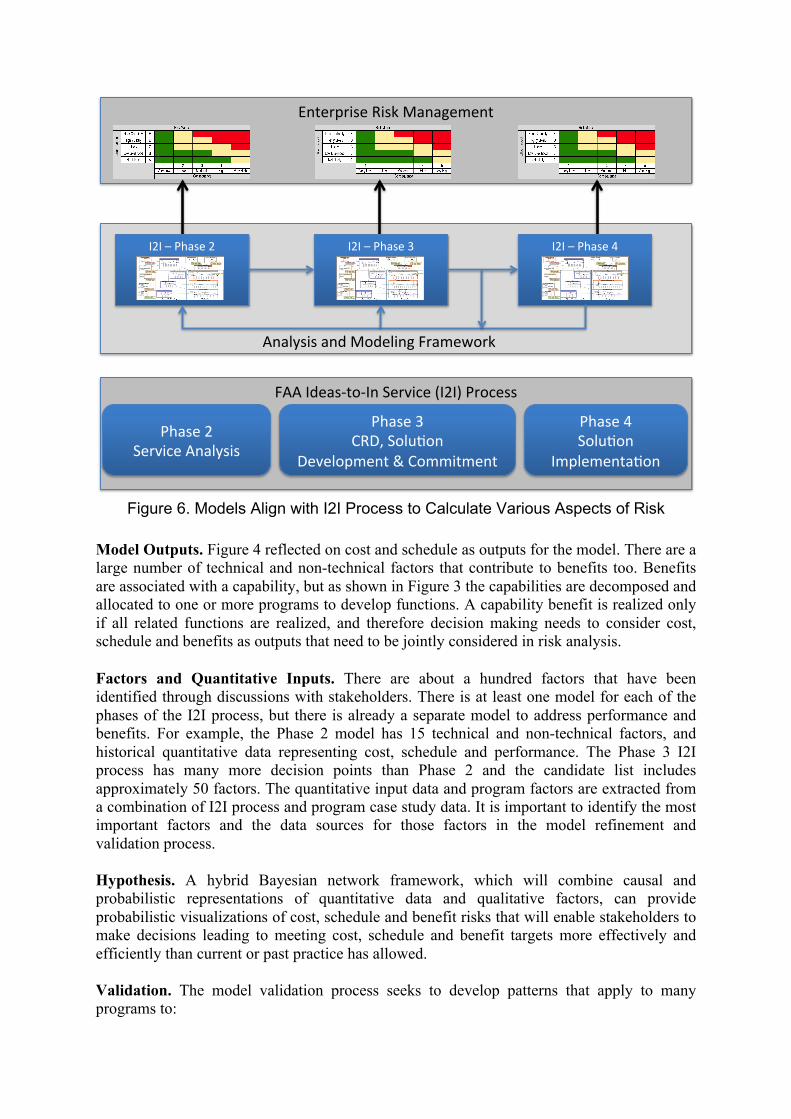
Figure 6. Models Align with I2I Process to Calculate Various Aspects of Risk
Model Outputs. Figure 4 reflected on cost and schedule as outputs for the model. There are a large number of technical and non-technical factors that contribute to benefits too. Benefits are associated with a capability, but as shown in Figure 3 the capabilities are decomposed and allocated to one or more programs to develop functions. A capability benefit is realized only if all related functions are realized, and therefore decision making needs to consider cost, schedule and benefits as outputs that need to be jointly considered in risk analysis. Factors and Quantitative Inputs. There are about a hundred factors that have been identified through discussions with stakeholders. There is at least one model for each of the phases of the I2I process, but there is already a separate model to address performance and benefits. For example, the Phase 2 model has 15 technical and non-technical factors, and historical quantitative data representing cost, schedule and performance. The Phase 3 I2I process has many more decision points than Phase 2 and the candidate list includes approximately 50 factors. The quantitative input data and program factors are extracted from a combination of I2I process and program case study data. It is important to identify the most important factors and the data sources for those factors in the model refinement and validation process. Hypothesis. A hybrid Bayesian network framework, which will combine causal and probabilistic representations of quantitative data and qualitative factors, can provide probabilistic visualizations of cost, schedule and benefit risks that will enable stakeholders to make decisions leading to meeting cost, schedule and benefit targets more effectively and efficiently than current or past practice has allowed. Validation. The model validation process seeks to develop patterns that apply to many programs to:
FAA#Ideas)to)In#Service#(I2I)#Process#
Phase#2#Service#Analysis#
Phase#3#CRD,#Solu?on#
Development#&#Commitment#
Phase#4#Solu?on#
Implementa?on#
Enterprise#Risk#Management#
Analysis#and#Modeling#Framework# ##
I2I#–#Phase#2# I2I#–#Phase#3# I2I#–#Phase#4#
• Use historic cost, schedule and benefits data as quantitative inputs • Use surrogate data supplemented with probabilistic belief factors if the data is not
sufficiently complete, correct, or must be protected • Use modeling and simulation outputs as inputs to provide measures of benefit
value • Identify qualitative factors related to I2I, EA, and policy
• Perform sensitivity analysis to identify the most critical qualitative inputs, where appropriate
• Transform data as required for optimal representation • Compare historic estimates with model predictions • Compare historic actual data with model predictions
Model Usage Scenario Conceptual Example. Bayesian Networks (Pearl 1985) also referred to as Bayesian Belief Networks, describe relationships between causes and effects. BNs are represented as a directed graph modeling conditional dependencies using probabilities. The nodes represent variables. The arcs represent causal relationships between variables. Internal to each node is a conditional probability table. Figure 7 provides a simplified example of a conceptual BN model. The subjective factors are the yellow nodes around the left and top border. The quantitative inputs, outlined by a blue rectangle, represent inputs that are associated with historical time (Historical Time Factor), historical cost (Historical Cost Factor), and performance (Performance Factor). Performance is one type of benefit, and FAA modeling and simulation tools sometimes are used to calculate inputs such as expected performance. In this example, qualitative inputs factors can take on values such as low, medium, and high. There some intermediate nodes, such as Complexity Factor that compute conditional probabilities related to combinations of subjective factors. This research involves determining the conditional probabilities for every node of each model (i.e., defining conditional probabilities associated with the values of low, medium, and high), so that given historical quantitative inputs relative to historical qualitative input factors, the model predicts the corresponding historic outputs; this would represent a validated model that can then be used to support future predictions.

Figure 7. Simplified Conceptual Bayesian Network Model
Consider the following conceptual scenario. There are three programs competing for funding in an acquisition cycle (yearly). There are three program managers, Karen, John and Sally (hypothetical).
1. For each of the qualitative factors, Karen, John, and Sally assign subjective values to the factors. • The capability interdependencies (Interdependence) for Karen’s program is Low,
John’s is Medium, and Sally’s is High. This means for example that Karen’s program is not very dependent on the completion of other systems or components in order to complete the integration and deployment of the program, which might be developed by another program, and therefore the risk is lower for this program than for John’s and Sally’s program.
• The Collaboration Factor for Karen and John’s program is Low, and High for Sally’s program. This factor reflects that Sally must coordinate with other programs in order for the functionality of her program to be realized, and therefore this increases the risk for completing the integration and deployment of Sally’s program. Collaboration in a SoS is a critical factor, as a slip in schedule by one program can have adverse impacts on other programs.
• The Engineering Expertise and Engineering Availability factors can represents both the Expertise and Availability of the contractors that will develop a particular program. Availability can reflect both the resource availability and capacity (e.g., the contractor is already developing a large software project this year, which might mean their availability for more development is Low).
2. The qualitative factors are combined with quantitative historical factors to give a probabilistic representation of cost, schedule and performance risk. For example:
Quan%ta%ve)Inputs) Outputs)
Factors

• Based on historical schedule data (in days), assuming a normal (or Gaussian) distribution (which may not apply), the mean number of days to complete Karen’s program is about 125 days, with a near 99% belief that it will be completed in 299 days (highlighted vertical Orange Line), while the mean is about 200 days for John’s and Karen’s programs, but to achieve 99% confidence it could take as long as 400 days. Given a yearly acquisition cycle, the lower risk program, based on schedule, is Karen’s program.
• Based on historical cost data (using hypothetical $K dollars), the mean cost to complete the program is: Karen ($118K), John ($178K), and Sally ($206K).
• Based on projected performance (no particular units assumed in this example, because performance value could be exponential), the Key Performance Areas (KPA) for Sally’s program is Very High, John’s is High and Karen’s is Low. There are other possible measures with causal relationships to performance, such as budget (Budget Impacts) required to complete the program, and the resulting relative performance for John’s program is 71, Sally’s is about 100, and Karen’s is about 150 (i.e., benefit to the DoD mission).
3. Based on this analysis, there are several possible conclusions, but a likely choice is: • Karen’s program delivers the most performance benefit relative to the schedule
risk, with only slightly higher cost than John’s program 4. If the PMs or other stakeholders do not agree to the representation of the cost,
schedule, and performance risk tradeoffs, then the stakeholders have the ability to look at modifying program decisions associated with the factors. A “what if” sensitivity analysis could be performed while the stakeholders are together.
Calculating Risk. A key change to the risk management process involves asking program stakeholder information about the program factors and then use the model to calculate the different risk outputs; this is in contrast to the more traditional process to ask program stakeholders to assign a risk value to a program measure such as schedule, normally as: red, yellow, or green. It common for programs to report a status of green until a program schedule is missed, and then the program risk status goes immediately to red. The approach for risk management using the AMF4AID is to ask program personnel to report on the state of factors and then calculate the risk values that map to the Risk Matrix.
Section 4: Conclusions NextGen is a complex SoS and rolling out capabilities is challenging due to many factors such as SoS interdependencies and a diverse set of stakeholders with potentially competing interests. This paper describes a modeling and analysis framework to enable a process for managing collaborative risk-informed decision-making. This framework helps stakeholders understand cost, schedule, benefits, and risk tradeoffs. The unique characteristics of the approach is that it aligns with the multi-stage Ideas-to-In Service process that is focused on a collaborative process to support decision-making on capabilities that must be rolled out asynchronously. It promotes a unique approach to risk management that involves asking program stakeholders about program factors that can be used to calculate cost, schedule and benefit risks. The framework provides a visualization of risk probabilities that allow stakeholders to discuss the risks in terms of program factors. If stakeholders are dissatisfied with the potential risks, they can consider improving system engineering practices associated with program factors that most negatively impact risk. The approach will improve the accuracy of schedule and cost predictions (and reduce the variance) by using a set of Bayesian network models that combine quantitative with qualitative expert judgment to

capture and leverage causal relationships about peoples’ internal knowledge that is not captured externally or formally.
References FAA. 2012, NextGen Implementation Plan,
http://www.faa.gov/nextgen/implementation/plan, Washington, DC (US): Federal Aviation Administration.
_____. 2012, Portfolio Risk Management Standard Operating Procedure, Washington, DC (US): Federal Aviation Administration.
Pearl, J. (1985). "Bayesian Networks: A Model of Self-‐Activated Memory for Evidential Reasoning" (UCLA Technical Report CSD-‐850017). Proceedings of the 7th Conference of the Cognitive Science Society, University of California, Irvine, CA. pp. 329–334. Retrieved 2009-‐05-‐01.
Rittel, H. W. 1972. On the Planning Crises: Systems Analysis of the "First and Second Generations". Bedrifts Okonomen, 8, 390-‐396.
Stroup, R. L., Kepchar, K. J. 2012, Enterprise Integration: A Framework for Connecting the Dots, INCOSE.
Wikipedia. 2012. http://en.wikipedia.org/wiki/George_H._Heilmeier Wijntjes, J. 2010. Federal Aviation Administration, NAS Enterprise Architecture,
Washington, DC (US): Federal Aviation Administration.
Biography Dr. Mark Blackburn is an Associate Professor from Stevens Institute of Technology. Dr. Blackburn research focuses on methods, models, visualization and automated tools for reasoning about complex systems of systems. He is the Principal Investigator on the FAA NextGen researching the use of Bayesian Network models for risk-based decision-making. He has received research funding from the National Science Foundation. He holds a Ph.D. from George Mason University in Information Technology, M.S. in Mathematics (emphasis in C.S.) from Florida Atlantic University, and a B.S. in Mathematics (C.S. option) Arizona State University. Dr. Art Pyster is a Distinguished Research Professor and Deputy Executive Director of the Systems Engineering Research Center at Stevens Institute of Technology. He is also an INCOSE fellow, member of their Board of Directors, and INCOSE Director for Academic Matters. Previously, Dr. Pyster served in a number of executive positions, including Deputy CIO for the Federal Aviation Administration. Dr. Robin Dillon-Merrill is an Associate Professor in the McDonough School of Business at Georgetown University. Professor Dillon-Merrill seeks to understand and explain how and why people make the decisions that they do under conditions of uncertainty and risk. She has received research funding from the National Science Foundation, NASA, the Department of Defense, and the Department of Homeland Security through USC’s National Center for Risk and Economic Analysis for Terrorism Events, and served on several National Academies Committees. She has a Ph.D. from Stanford University in Industrial Engineering and Engineering Management and a B.S. and M.S. from the University of Virginia in Systems Engineering. Dr. Dillon-Merrill has 25 peer-reviewed journal articles on risk analysis and decision-making.
Dr. Teresa Zigh holds a Ph.D. in Computational Linguistics, a M. Management Science in Operations Research, and a B. Engineering in Chemical Engineering, all from Stevens Institute of Technology. She is currently a Research Associate and Lecturer at Stevens, joining Stevens in 2009 as a full-time faculty member. Her research interests include neural networks, genetic algorithms, and the application of Bayesian networks to multi-stage risk assessment decision management systems. She is a researcher on the FAA NextGen investigating the use of Bayesian networks and genetic algorithms for evaluation of programmer behavior during code development and modification. Dr. Richard Turner has over thirty years of experience in systems, software and acquisition engineering. Currently a Distinguished Service Professor at the Stevens Institute of Technology in Hoboken, New Jersey, he is co-author of three books: Balancing Agility and Discipline: A Guide for the Perplexed, co-written with Barry Boehm, CMMI Distilled, and CMMI Survival Guide: Just Enough Process Improvement. Dr. Turner is also a Fellow of the Lean Systems Society.
Acknowledgment We wish to acknowledge the great support of the FAA sponsors and stakeholders, including stakeholders from NASA, JPDO and other industry partners that have been very helpful and open about the challenges of this complex problem. We also want to thank Dr. Bill Kaliardos from the FAA who provided excellent comments that helped us improve this paper especially for people not familiar with the FAA.