Model of the Wet Limestone Flue Gas Desulfurization Process for Cost Optimization
9
PROCESS DESIGN AND CONTROL Model of the Wet Limestone Flue Gas Desulfurization Process for Cost Optimization Jerzy Warych and Marek Szymanowski* Faculty of Chemical and Process Engineering, Warsaw University of Technology, Waryn ˜ skiego 1, 00-645 Warsaw, Poland A detailed process model of the wet limestone flue gas desulfurization system has been presented. This model can be used to calculate indispensable parameters for estimating costs and next to minimize capital and operating costs. The process model describes most important stage of SO 2 removal running in an absorber and a holding tank. It includes absorption of sulfur dioxide, oxidation of SO 3 - , dissolution of limestone, and crystallization of gypsum. An assumption of thermodynamic equilibrium in the solution has been used. SO 2 removal and limestone dissolution calculation has been based on stagnant-film theory. The model has been used for predicting the SO 2 removal efficiency in the spray scrubber for process parameters, e.g., L/G, droplet diameter, stoichiometric ratio Ca/S, height of the absorption section, gas velocity, concentration in liquid- phase ions of Mg 2+ and Cl - , and liquid pH. This model could be used to describe a multilevel spray system, too. The results of this model are in agreement with data from flue gas desulfurization installation at the Belchato ´w Power Plant (Poland). Introduction The dominating flue gas desulfurization (FGD) tech- nology is based on absorption of SO 2 in a limestone slurry. The efficiency of SO 2 removal is higher than 90% for different working conditions, but FGD capital cost is very high and investment cost reaches 20-30% of the investment cost of the whole power plant. Operating costs are high, too. Optimum process parameters calcu- lation can decrease the cost of desulfurization. The process model is necessary to solve the optimization task. The limestone FGD technology is a complex system and consists of many apparatuses. Before the scrubber, dust is precipitated in a dust collector. The next gases are directed to the scrubber where slurry is sprayed and SO 2 is removed. Outlet gas, saturated with moisture, is reheated. The slurry is collected in the holding tank. In the tank take place the following: oxidation of SO 3 2- , limestone dissolution, and crystallization of gypsum. Limestone slurry is prepared in a reagent feed system (with ball mill). Slurry from the holding tank is directed to the dewatering gypsum slurry system. Two kinds of dewatering systems are often used: hydrocyclones for the first step of dewatering and centrifugal separator or thickener and belt filter. After dewatering, gypsum contains 10% of moisture. It is hard to describe such a complicated system, because a few processes run simultaneously in a holding tank and an absorber. Models of SO 2 absorption in water droplets were presented by Roberts and Friedlander, 1 Chang and Rochelle, 2 Chang et al., 3 and Hsu et al. 4 In limestone desulfurization technology, SO 2 is absorbed into a slurry containing particles of sorbent, sulfites, and sulfates. Uchida and Ariga 5 used a two-reaction zone model. A liquid film near the gas-liquid interface was divided into three regions, and the assumption that all reactions in the liquid are instantaneous was used. Pasiuk-Bronikowska and Rudzinski 6 described absorp- tion of SO 2 into slurries of Ca(OH) 2 and CaSO 3 by a stagnant-film theory. Calculation of the ions concentra- tion on the interface surface and in liquid makes it possible to estimate the enhancement factor. Lancia et al. 7 studied the rate of SO 2 absorption into a slurry of limestone and Gerard et al. 8 that into a slurry of CaSO 3 . Limestone dissolution, oxidation of sulfite, and gyp- sum crystallization are very important processes. A number of investigators have studied these processes for different working conditions, but a complex approach is necessary for optimization. There are a few complex models presented in the literature. A FGDPRISM simulating model can be used as a design tool. 9 SO 2 absorption was described by the stagnant-film theory, and the assumption of thermodynamic equilibrium in the solution was used. Calibrating it was necessary in order to estimate the mass-transfer coefficient. The stagnant-film theory was used in the model of Eden and Luckas 10 that describes absorption of SO 2 , HCl, HF, and CO 2 . Eden et al. 11 presented a simple correlation to the calculation efficiency of desulfurization. The correlation is a function of the L/G rate, the gas velocity inside the absorber, the pH of the solution, the concentration of SO 2 in the gas, and the concentration of chlorine and magnesia in liquid. Penetration models to describe SO 2 absorption are used too. 12 Chang and Rochelle 13 studied the impact of organic acid on SO 2 absorption using the surface renewal theory. Stergrasek et al. 14 carried out experiments with a spray absorber and estimated the liquid-side mass-transfer coefficient for the Higbie * Corresponding author. Tel.: +48-22-6236564. Fax: +48- 22-251410. E-mail: [email protected]. 2597 Ind. Eng. Chem. Res. 2001, 40, 2597-2605 10.1021/ie0005708 CCC: $20.00 © 2001 American Chemical Society Published on Web 05/19/2001
Transcript of Model of the Wet Limestone Flue Gas Desulfurization Process for Cost Optimization

PROCESS DESIGN AND CONTROL
Model of the Wet Limestone Flue Gas Desulfurization Process forCost Optimization
Jerzy Warych and Marek Szymanowski*
Faculty of Chemical and Process Engineering, Warsaw University of Technology, Warynskiego 1,00-645 Warsaw, Poland
A detailed process model of the wet limestone flue gas desulfurization system has been presented.This model can be used to calculate indispensable parameters for estimating costs and next tominimize capital and operating costs. The process model describes most important stage of SO2removal running in an absorber and a holding tank. It includes absorption of sulfur dioxide,oxidation of SO3
-, dissolution of limestone, and crystallization of gypsum. An assumption ofthermodynamic equilibrium in the solution has been used. SO2 removal and limestone dissolutioncalculation has been based on stagnant-film theory. The model has been used for predicting theSO2 removal efficiency in the spray scrubber for process parameters, e.g., L/G, droplet diameter,stoichiometric ratio Ca/S, height of the absorption section, gas velocity, concentration in liquid-phase ions of Mg2+ and Cl-, and liquid pH. This model could be used to describe a multilevelspray system, too. The results of this model are in agreement with data from flue gasdesulfurization installation at the Bełchatow Power Plant (Poland).
Introduction
The dominating flue gas desulfurization (FGD) tech-nology is based on absorption of SO2 in a limestoneslurry. The efficiency of SO2 removal is higher than 90%for different working conditions, but FGD capital costis very high and investment cost reaches 20-30% of theinvestment cost of the whole power plant. Operatingcosts are high, too. Optimum process parameters calcu-lation can decrease the cost of desulfurization. Theprocess model is necessary to solve the optimizationtask.
The limestone FGD technology is a complex systemand consists of many apparatuses. Before the scrubber,dust is precipitated in a dust collector. The next gasesare directed to the scrubber where slurry is sprayed andSO2 is removed. Outlet gas, saturated with moisture,is reheated. The slurry is collected in the holding tank.In the tank take place the following: oxidation of SO3
2-,limestone dissolution, and crystallization of gypsum.Limestone slurry is prepared in a reagent feed system(with ball mill). Slurry from the holding tank is directedto the dewatering gypsum slurry system. Two kinds ofdewatering systems are often used: hydrocyclones forthe first step of dewatering and centrifugal separatoror thickener and belt filter. After dewatering, gypsumcontains 10% of moisture.
It is hard to describe such a complicated system,because a few processes run simultaneously in a holdingtank and an absorber. Models of SO2 absorption in waterdroplets were presented by Roberts and Friedlander,1Chang and Rochelle,2 Chang et al.,3 and Hsu et al.4 Inlimestone desulfurization technology, SO2 is absorbed
into a slurry containing particles of sorbent, sulfites, andsulfates. Uchida and Ariga5 used a two-reaction zonemodel. A liquid film near the gas-liquid interface wasdivided into three regions, and the assumption that allreactions in the liquid are instantaneous was used.Pasiuk-Bronikowska and Rudzinski6 described absorp-tion of SO2 into slurries of Ca(OH)2 and CaSO3 by astagnant-film theory. Calculation of the ions concentra-tion on the interface surface and in liquid makes itpossible to estimate the enhancement factor. Lancia etal.7 studied the rate of SO2 absorption into a slurry oflimestone and Gerard et al.8 that into a slurry of CaSO3.
Limestone dissolution, oxidation of sulfite, and gyp-sum crystallization are very important processes. Anumber of investigators have studied these processesfor different working conditions, but a complex approachis necessary for optimization. There are a few complexmodels presented in the literature. A FGDPRISMsimulating model can be used as a design tool.9 SO2absorption was described by the stagnant-film theory,and the assumption of thermodynamic equilibrium inthe solution was used. Calibrating it was necessary inorder to estimate the mass-transfer coefficient. Thestagnant-film theory was used in the model of Eden andLuckas10 that describes absorption of SO2, HCl, HF, andCO2. Eden et al.11 presented a simple correlation to thecalculation efficiency of desulfurization. The correlationis a function of the L/G rate, the gas velocity inside theabsorber, the pH of the solution, the concentration ofSO2 in the gas, and the concentration of chlorine andmagnesia in liquid. Penetration models to describe SO2absorption are used too.12 Chang and Rochelle13 studiedthe impact of organic acid on SO2 absorption using thesurface renewal theory. Stergrasek et al.14 carried outexperiments with a spray absorber and estimated theliquid-side mass-transfer coefficient for the Higbie
* Corresponding author. Tel.: +48-22-6236564. Fax: +48-22-251410. E-mail: [email protected].
2597Ind. Eng. Chem. Res. 2001, 40, 2597-2605
10.1021/ie0005708 CCC: $20.00 © 2001 American Chemical SocietyPublished on Web 05/19/2001

model. Kiil et al.15 describe processes which run in theabsorber and in the holding tank using a balanceequation for every important components. Experimentswere carried out in a packet absorber.
The aim of this work is to develop a complex modelof the wet limestone FGD process. The model has beenused to predict the SO2 removal efficiency in the sprayscrubber and to calculate values of parameters neces-sary to estimate overall costs, e.g., L/G, droplet diam-eter, stoichiometric ratio Ca/S, height of the absorptionsection, gas velocity, concentration in the liquid phaseof Cl- and Ca2+, solution pH, and capacity of the holdingtank.
Process Model of the FGD Systems
The absorber and the holding tank are the mostimportant apparatuses where reactions take place. Themodel describes processes which take place in bothapparatuses. In the holding tank take place the follow-ing: oxidation of sulfite, limestone dissolution, andgypsum crystallization. In an absorber, first of all thefollowing takes place: absorption of SO2 and HCl.
Holding Tank. (i) Limestone Dissolution. Lime-stone dissolution takes place according to the dissolutionreaction on the surface of CaCO3 and diffusion transportof reaction products. The dissolution is influenced bydifferent species. Dissolved metals (zinc, magnesium,manganese, and copper) and their salts can decreasethe rate of dissolution. Van Tonder and Schutte16 haveshown that the presence of these ions is insignificantwhen their concentration is not higher than 80-100 mg/dm3. Metals precipitate with gypsum, and the ionconcentration is not very high. For conditions in aholding tank, the presence of sulfite can change the rateof limestone dissolution.17 When oxidation of sulfitetakes place in a holding tank, the influence of sulfitepresence on the dissolution can be disregarded. Dis-solved CO2 can hydrolyze and change the rate ofdissolution, but it is insignificant when buffering speciesare present.
The flux of limestone dissolution is calculated by thefilm theory. The dominating stage is diffusive transportof ions, and a thermodynamic equilibrium is achievedon the particle surface. The mass balance described bythe differential equation around the particle is
where k indicates different components.The equation includes a balance of the following
components: sulfite (SO2, HSO3-, and SO3
2), sulfate(HSO4
- and SO42-), carbonate (HCO3
- and CO32-),
magnesium, chlorine, and calcium ions. An additionalequation is necessary for a balance of the net charge.Brogren and Karlsson18 have shown that the effect ofthe potential gradient can be neglected when the pH ofthe slurry is above 3. Therefore, the flux balance is asfollows:
On the surface of the limestone particle, there is nonet flux of sulfite, sulfate, magnesia, chlorine, and other
cations and anions, and the flux of charge is equal zero;therefore
The following equations express the condition ofsurface equilibrium with CaCO3, and the flux of calciummust be equal to the flux of total carbonate:
The limestone particle size distribution is a veryimportant parameter to calculate the rate of limestonedissolution. The particle size changes during dissolutionin the holding tank. The flux of Ca2+ could change withthe shrinking particle diameter. The change in flux hasbeen modeled using a correction factor R:19
In this work the limestone dissolution in the holdingtank has been described according to the Borgren andKarlsson model.19 The holding tank and the scrubberhave been regarded as a continuous stirred-tank reactorand used as a model in the process description; also theresidence time distribution function of the slurry in thereactor has been used. The degree of limestone conver-sion f can be expressed as the ratio between thelimestone leaving the holding tank Ms and that beingadded to the tank Ms
o. The degree of limestone conver-sion can be calculated as a function of average residencetime, τ, and the particle size distribution:
The limestone for FGD is prepared in a ball mill. Theparticle size distribution after grinding in the ball millcan be described with the Rosin-Rammler function.
An analysis of a few the limestone particle sizedistributions showed that the function of Rosin-Rammler could be successfully used. During the analy-sis it has been observed that parameter n stays almost
1
r2(∑k
∂(r2Jk)
∂r2 ) ) 0 (1)
1
r2(∑k
zk
∂(r2Jk)
∂r2 ) ) 0 (2)
JSO2+ JHSO3
- + JSO32- ) 0 (3)
JHSO4- + JSO4
2- ) 0 (4)
JMg2+ ) 0 (5)
JCl- ) 0 (6)
Jan ) 0 (7)
Jcat ) 0 (6a)
∑k
zkJk ) 0 (8)
Ks ) [Ca2+][CO32-] (9)
JHCO3- + JCO3
2- ) JCa2+ (10)
JCads ) JCa
dins( ds
dsin)R
(11)
f ) 1 -Ms
Msin
) 1 -
∑i)1
n [(F(ds,iin ) - F(ds,i-1
in ))∫0
∞(ds,i
ds,iin)3 1
τe-t/τ] dt (12)
F(di) ) 1 - exp[-(di/L*)n] (13)
2598 Ind. Eng. Chem. Res., Vol. 40, No. 12, 2001

constant for the same limestone and different grindingtimes. Frances et al.20 observed the same effects forgrinding of Al(OH)3. When parameter n is known, onlyone parameter L* is necessary to describe the particlesize distribution. It is very useful to determine theoptimum particle size and time of grinding, because onlyone parameter L* describes the particle size distributionof different grinding times.
Brogren and Karlsson19 have shown that flux ofcalcium JCa does not change with the particle diameter(R ) 0, eq 11). Calculations of the limestone dissolutionfor different values of correction factor R confirm thisconclusion. The constant value of the film thickness δsfor this assumption was found, δs ) 3.5 µm. Changingparticle size of CaCO3 during dissolution when the fluxof Ca2+ does not depend on the particle diameter isdescribed by the equation
The limestone conversion is equal to
where
(ii) Sulfite Oxidation. Changes of the sulfite andoxygen concentrations influence the oxidation rate. Afew authors found that the reaction is zero-order or first-order with respect to the oxygen concentration. Sulfiteprecipitation takes place, and the rate of oxidation islimited by sulfite dissolution. When forced oxidationtakes place, the concentration of sulfite in the slurry islow and sulfite precipitation is limited. The presence ofa metal catalyst influences the oxidation. The biggestsource of metal ions (copper, cobalt, iron, and manga-nese) in the slurry is limestone dissolution. The copper,iron, and cobalt quickly precipitate with gypsum, andthe influence of these ions can be neglected.15 Theconcentration of Mn2+ is sufficiently high to influencethe rate of oxidation. In the presence of a catalyst, it isvery difficult to establish an order of reaction. Variousauthors assume different values of the order of theoxidation reaction.21-23 To calculate the rate of sulfiteoxidation, an assumption has been made that the orderof the oxidation reaction is 1/2 order with respect to themanganese ion concentration, 3/2 order with respect tothe sulfite concentration, and zero order with respectto the oxygen concentration:24
To calculate operating costs, it is necessary to deter-mine the flux of oxidation air to a holding tank. Theflux of oxygen absorption (eq 17) has to be equal to 1/2of the flux of the SO2 absorption. In the slow reaction
regime
kla is calculated according to the Akita-Yoshidaequation:25
(iii) Gypsum Crystallization. The rate of gypsumcrystallization is a function of the relative super-saturation Rs:
It is very difficult to determine the rate crystallizationconstant, and the results given by various authors donot comply. There are no models that describe thegypsum crystal size distribution, and the results oflaboratory-scale research works cannot be used todescribe crystallization in full-scale installations. Manydifferent elements influence the gypsum crystallizationand crystal size distribution: temperature, presence ofother substances, mixing strength, etc. The size of thegypsum crystals must be large enough to work properlyin separate systems so that gypsum could be used as abuilding material. There should be enough residencetime in a holding tank to keep the relative super-saturation below 1.4, because for this condition crystal-lization takes place on the gypsum surface rather thanon the apparatus surface. These conditions are obtainedwhen the average residence time in a holding tankequals 10-15 h. In the study, the gypsum crystallizationhas not been modeled, but a condition of an averageresidence time of slurry in the holding tank of no lessthan 12 h has been used.
Scrubber. Absorption of SO2 in a limestone slurryruns as follows: transport of SO2 to the liquid surface,dissolution of SO2, generation of the ions H+, HSO3
-,and SO3
2-, transport of the ions inside the liquid,dissolution of CaCO3, oxidation of sulfite, reaction ofCa2+ with SO4
2-, and gypsum crystallization.Most of the reactions that run during sulfur dioxide
absorption are instantaneous and they attain thermo-dynamic equilibrium. Still, dissolution and crystalliza-tion processes require more time to attain equilibrium.
An assumption of thermodynamic equilibrium in thesolution has been used. Equilibrium calculation includesthe following ions: OH-, HSO4
-, SO42-, HSO3
-, SO32-,
HCO3-, CO3
2-, Cl-, Mg2+, Ca2+, H+, and dissolved gasesSO2 and CO2.
Basic assumptions of absorption SO2 in slurry drop-lets are the following:
(i) Resistance of mass transport is in the gas andliquid phases.
(ii) The drop shape is spherical.(iii) There are the same conditions in every point
inside a drop, which make an ideal mixing state.(iv) The absorber has been divided into two parts
(Figure 1): the first region is the height of the absorberfrom the top edge of the inlet gases duct to the spray
∂ds
∂t) -
2MCa
FsJCa
ds wds
dsin
) 1 -2MCa
FsJCa
ds tds
in(14)
f ) 1 - ∑i)1
n {[F(ds,iin ) - F(ds,i-1
in )][6( B
ds,iin
τ)3[exp(-ds,i
in
Bτ) -
1] + 1 + 6( B
ds,iin
τ)2
- 3B
ds,iin
τ]} (15)
B )Fs
2MCaJCads
; JNads )
DCa
δs([Ca2+]s - [Ca2+]l)
-d[SIV]
dt) kox[S
IV]1.5[Mn2+]0.5 (16)
RO2) k1aApp,htHox[O2]* (17)
k1a ) εg3db
DO2,1
db ( ν1
DO2,1)1/2(gdb3
ν12 )1/4(gdb
2F1
σ )3/8
(18)
εg ) 1
2 + (0.35Uox
)(F1σ72 )1/3
(19)
Rgp ) agpVhtkgp(Rs - 1) (20)
Ind. Eng. Chem. Res., Vol. 40, No. 12, 2001 2599
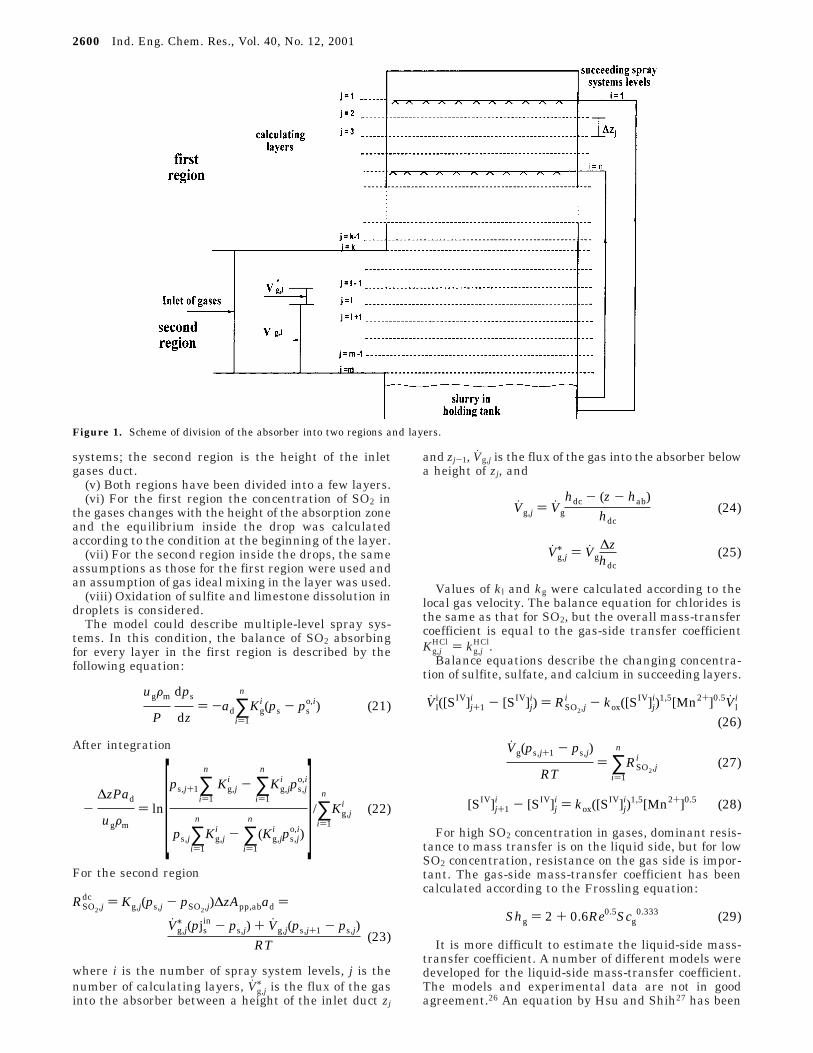
systems; the second region is the height of the inletgases duct.
(v) Both regions have been divided into a few layers.(vi) For the first region the concentration of SO2 in
the gases changes with the height of the absorption zoneand the equilibrium inside the drop was calculatedaccording to the condition at the beginning of the layer.
(vii) For the second region inside the drops, the sameassumptions as those for the first region were used andan assumption of gas ideal mixing in the layer was used.
(viii) Oxidation of sulfite and limestone dissolution indroplets is considered.
The model could describe multiple-level spray sys-tems. In this condition, the balance of SO2 absorbingfor every layer in the first region is described by thefollowing equation:
After integration
For the second region
where i is the number of spray system levels, j is thenumber of calculating layers, Vg,j
/ is the flux of the gasinto the absorber between a height of the inlet duct zj
and zj-1, Vg,j is the flux of the gas into the absorber belowa height of zj, and
Values of kl and kg were calculated according to thelocal gas velocity. The balance equation for chlorides isthe same as that for SO2, but the overall mass-transfercoefficient is equal to the gas-side transfer coefficientKg,j
HCl ) kg,jHCl.
Balance equations describe the changing concentra-tion of sulfite, sulfate, and calcium in succeeding layers.
For high SO2 concentration in gases, dominant resis-tance to mass transfer is on the liquid side, but for lowSO2 concentration, resistance on the gas side is impor-tant. The gas-side mass-transfer coefficient has beencalculated according to the Frossling equation:
It is more difficult to estimate the liquid-side mass-transfer coefficient. A number of different models weredeveloped for the liquid-side mass-transfer coefficient.The models and experimental data are not in goodagreement.26 An equation by Hsu and Shih27 has been
Figure 1. Scheme of division of the absorber into two regions and layers.
ugFm
P
dps
dz) -ad∑
i)1
n
Kgi (ps - ps
o,i) (21)
-∆zPad
ugFm
) ln[ps,j+1∑i)1
n
Kg,ji - ∑
i)1
n
Kg,ji ps,j
o,i
ps,j∑i)1
n
Kg,ji - ∑
i)1
n
(Kg,ji ps,j
o,i) ]/∑i)1
n
Kg,ji (22)
RSO2,jdc ) Kg,j(ps,j - pSO2,j)∆zApp,abad )
Vg,j/ (pjs
in - ps,j) + Vg,j(ps,j+1 - ps,j)RT
(23)
Vg,j ) Vg
hdc - (z - hab)hdc
(24)
Vg,j/ ) Vg
∆zhdc
(25)
Vli([SIV]j+1
i - [SIV]ji) ) RSO2,j
i - kox([SIV]j
i)1,5[Mn2+]0.5Vli
(26)
Vg(ps,j+1 - ps,j)
RT) ∑
i)1
n
RSO2,ji (27)
[SIV]j+1i - [SIV]j
i ) kox([SIV]j
i)1,5[Mn2+]0.5 (28)
Shg ) 2 + 0.6Re0.5Scg0.333 (29)
2600 Ind. Eng. Chem. Res., Vol. 40, No. 12, 2001

used in order to calculate kl:
The overall mass-transfer coefficient is
where âj is the mass-transfer enhancement factor, whichhas been calculated for equilibrium inside the drops andat the interface at the beginning of the jth layer.
The ion concentration inside the drops was calculatedaccording to equations of thermodynamic balance in-cluding constants of reactions and electroneutralitycondition. Calculation of the equilibrium ion concentra-tion at the interface was based on the stagnant-filmtheory, and diffusion coefficients were modified toapproximate the surface-renewal theory. To solve theproblem, the following boundary condition was ac-cepted: no net flux of calcium, magnesium, and sulfate,flux of charge equal to zero, SO2 transport to theinterface equal to sulfite transport inside the liquid, andflux of HCl to the interface equal to chloride transportinside the drop. The concentration of the carbonate isclose to equilibrium with the CO2 concentration in thegas.
Equilibrium constants were calculated by correlationof Brewer28 and activity coefficients by the equation ofDavies.29 Henry’s constants were modified by data ofWeisenberger and Schumpe.30
Analysis of Model Calculation Results
Figure 2 shows modeled values of efficiency desul-furization versus FGD plant data. The wet limestonewith force oxidation and a gypsum byproduct FGD plantwas installed in the Bełchatow Power Plant on fourunits (360 MW capacity each). Equipment absorbers(one absorber was installed on one power unit) includea spray system with four recirculation pumps (deliveryof 9500 m3/h each).
Comparison was made for different operation condi-tions: gas flux, 1 × 10⁶-3 × 10⁶ Nm3/h; SO2 concentra-tion in the inlet gases, 1000-4000 mg/Nm3; pH solution,5.2-5.6. For the remaining parameters, constant valueswere chosen: chloride concentrations, 0.1 kmol/m3;sulfite concentration in a holding tank, 0.2 mol/m3;
limestone in the slurry, 3.0 kg/m3; average drop diam-eter, 2900 µm.
The average difference between data from the FGDplant and modeled results equals 1-3% of the desul-furization efficiency, with a standard deviation equalto 2.45% and a 95% confidence interval equal to 4.7%.For extreme conditions (high or little SO2 concentrationin the inlet gases), differences equal 5%. For the outletof the SO2 concentration, 200-250 ppm maximumdifferences are no higher than 80 ppm. The reason forhigher differences for few data could be subject to theassumed constant value of magnesia, and the chlorideconcentration in solution, and the limestone concentra-tion in the slurry. Magnesia, chloride, and limestoneconcentrations influence the desulfurization efficiency,but these parameters were measured only once per weekand an average constant value was chosen for everydata point. For more detailed data (limestone, magnesia,and chloride concentrations), the value of a statisticalparameter of the model error will be superior and thestandard deviation and confidence interval values willbe lower.
Average drop diameter sprays in absorbers for FGDsystems are equal to 1500-2000 µm. The drop diameterequal to 2900 µm was chosen in every calculation. Abigger drop diameter results from coalescence in theabsorber and a risk of the worst work of a nozzle thatwas used a long time (the worst distribution of the dropdiameter). When the drops collide with a pipe of thespray system, the diameters are changed, too. The dropdiameter is the calibrating parameter and collects allmistakes of the model. Nevertheless, only one calibrat-ing parameter can adjust the modeled result to datafrom FGD plants.
Influence of Process Parameters on theDesulfurization Efficency
The use of the model desulfurization efficiency fordifferent process parameter values was compared. Thisanalysis was made for following parameters: pH solu-tion, chloride concentration in solution, drop diameter,height of the absorption section, L/G rate, inlet SO2concentration, and velocity of the gas in the absorber.The Ca/S rate was not included. The model describes a
k1 ) 0.88xfoD1; fo ) x 8σ3πm
(30)
1Kg,j
i) 1
kg+
HSO2
k1âji
(31)
Jan ) 0 (32)
Jcat ) 0 (33)
JMg2+ ) 0 (34)
JCa2+ ) 0 (35)
JHSO4- + JSO4
2- ) 0 (36)
∑k
zkJk ) 0 (37)
JSO2+ JHSO3
- + JSO32- ) ks(ps - ps
/) (38)
Jg,HCl ) J1,Cl- (39)
Figure 2. Modeled values of desulfurization efficiency versusFGD systems (installed at the Bełchatow Power Plant) data.31
Ind. Eng. Chem. Res., Vol. 40, No. 12, 2001 2601

reaction running in a holding tank. Conditions in aholding tank determine equilibrium in the inlet solutionto the absorber, and the Ca/S rate determines theconcentration of limestone in the slurry. The influenceof limestone dissolution on the desulfurization efficiencywas analyzed in the next paragraph.
The process parameters and range that were chosenfor this analysis are included in Table 1. The SO2removal efficiency was calculated for succeeding bound-ary values and average values of the remaining param-eters. The strongest influence in given ranges wasobserved for the L/G ratio, height of the absorptionsection, and drop diameter and the lowest for the slurrypH, chloride concentration, and linear gas velocity. Thisanalysis describes only a general dependence betweenefficiency and parameters because changes in the ef-ficiency depend on a chosen range of parameters.Calculation of suitable parameter values makes itpossible to optimize operation of a desulfurization plant.One of the most important parameters is the dropdiameter. The drop diameter has to be correlated withthe gas velocity in an absorber. These parameters areimportant for the rate of mass transfer in an absorber.The drop diameter and the gas velocity determine thetime of phase contact, surface mass transport, andvalues of the mass-transfer coefficient on gas-phase sideand liquid-phase side (for circulating drops). The valueof the mass-transfer coefficient increases with thegrowth of the gas velocity, but the velocity has to belimited according to drop entrainment. The best advan-tage is to design an absorber with a maximum gasvelocity, limited by drop entrainment. A growth of thegas velocity to this value increases the desulfurizationefficiency and reduces the dimension of the absorber,and the rise in cost connected with the increase ofresistance of gas flow is not high.
There are numerous relationships between processparameters, and calculations of optimum values haveto be treated on a broad basis.
Impact of Different Processes on the SO2Removal Efficiency
An impact of a few processes on the absorption of SO2,for the range of parameters shown in Table 1, has beenmade. This analysis includes the absorption of HCl,
oxidation of sulfite and limestone dissolution in theabsorption zone, and simplification of the model.
Sulfite Oxidation. Usually, the degree of the sulfiteoxidation within the tower is only in the range of 20-30% of absorbed SO2. Oxidation of sulfite reduces theSO3
- ion concentration and this is positive to theabsorption, but it increases the pH too and this isnegative. Results of the calculation have shown thatoxidation changes the desulfurization efficiency by nomore than 0.2%.
Limestone Dissolution. When the concentration oflimestone in a slurry equals 5000-10 000 g/m3, thelimestone dissolution is an advantage to the rate of SO2absorption. The limestone particle size distribution isvery important for this process because it determinesthe value of the mass-transfer surface. CaCO3 dissolu-tion has strong influences on the SO2 absorption on thebottom part of the absorber, where slurry pH is low andthe rate of dissolution is high. In this part of theabsorber, dissolution of CaCO3 increases the slurry pHand the rate of SO2 absorption. When the pH of theslurry in a holding tank is higher, the influence ofdissolution on the desulfurization efficiency is lower. Ina FGD plant with gypsum byproduct, the concentrationof limestone is no higher than 1500-2000 g/m3 and theimpact of dissolution is low. Dissolution of limestone indrops increases SO2 removal efficiency by 0.5-1%(maximum 2.5%; see Table 2).
Absorption of HCl. If the concentration of HCl influe gases amounts to 20 mg/Nm3, absorption of HCldoes not influence the rate of SO2 removal. For higherHCl concentration, the influence of this process ishigher. If the concentration of HCl equals 200 mg/Nm3,the rate of SO2 absorption decreases by 1-5% (Table2). Absorption of HCl indirectly influences the desul-furization efficiency too. The average residential timein a holding tank equals dozen or so, and chlorides arecumulated in the slurry. A high concentration of chloridechanges the equilibrium in the slurry and reduces thepH of the slurry and the desulfurization efficiency. It isnecessary to use the rate of HCl absorption to calculatethe chloride balance and flux of wastewater.
Simplification of the Model. Two simplificationsof the scrubber calculation with multilevel spray sys-tems have been analyzed: (i) the assumption that dropsfrom different levels of spray systems are mixed up was
Table 1. Relations between the Desulfurization Efficiency and Process Parameters31
parameter unitsrange of
param valuemin and max
efficiency value [%]changing the efficiencyfor a given range [%]
slurry pH 5.2-5.8 86.4-93.5 7.6drop diameter µm 2000-3000 74.5-99.3 25.0height of the absorption section m 6-18 66.5-99.7 33.4magnesium concentration kmol/m3 0.03-0.13 66.4-95.0 30.1chloride concentration kmol/m3 0.1-0.3 83.6-93.4 10.5inlet SO2 concentration ppm 1500-5000 73.4-97.0 24.3gas velocity m/s 2-4 90.0-98.9 8.9L/G ratio dm3/m3 8-15 68.3-97.7 30.1
Table 2. Impact of the Process on the Desulfurization Efficiency31
processaverage difference
[%]max difference
[%]
limestone dissolution; concentration of CaCO3 1000 g/m3 +0.15-1.0 +2.5concentration of CaCO3 5000 g/m3 +1.5-3.0 +7.3oxidation of sulfite below 0.1absorption of HCl; concentration of HCl in inlet gases 20 mg/Nm3 -0.2 -0.5200 mg/Nm3 -1.0-2.0 -4.8simplification of the model: mixing of drops for different spray levels +0.2-0.4 +0.6average height of the absorption section +0.5-1 +1.9
2602 Ind. Eng. Chem. Res., Vol. 40, No. 12, 2001

used, and the equilibrium in all drops is the same. (ii)Multilevel spray systems were replaced by one spraysystem, and average height of the absorption sectionwas used; the average height was determined from alllevels of a spray system.
Both simplifications do not influence the rate of SO2absorption. The desulfurization efficiency increased by0.6% when the first simplification was used. For thesecond simplification, a maximum change of the des-ulfurization efficiency equals 2%, but if the drop diam-eter was increased by 1%, the difference equaled 0.1-0.6%. The model does not describe coalescence of thedrops. The rate of this process grows with an increaseof the L/G ratio and so the influence of simplificationson model results will be stronger. An average height ofthe absorption section is useful in the optimizationcalculation. The application of this parameter reducesthe number of variable parameters, and only oneparameter, i.e., the average height of the absorptionsection, could be used instead of the absorption sectionheight and the number of spray system levels.
Distribution of Process Parameters with theHeight of the Absorption Section
Several calculations of process parameter distribu-tions with the height of the absorption section have beenmade. Calculation was made for the following values ofparameters: pH, 5.5; drop diameter, 2900 µm; chlorideand sulfite concentration in the slurry, 0.1 kmol/m3 and0.2 mol/m3; inlet SO2 concentration, 1000 ppm; inlet HClconcentration, 200 mg/Nm3; limestone concentration inthe slurry, 1.0 kg/m3; and countercurrent flux.
Mass-transfer resistance on the gas side is high onthe top of an absorber where the partial pressure of SO2is low. The resistance on the gas side decreases on thebottom of the absorption section to the value of 20%.The enhancement factor â profile is shown in Figure 3.Values of â are high on the top of an absorber andquickly decrease together with the height of the absorp-tion section. The concentration of sulfite and the pH ofthe slurry influence the value of the enhancement factor.In Figure 3, profile of the sulfite concentration is shown.Figure 4 shows distribution of the SO2 absorption fluxand the pH of the slurry as a function of the absorptionheight. Flux of the sulfur dioxide absorption attains amaximum value on the height of the absorption sectionequal to 6-7 m. The reason for the flux distribution isa rise of the mass transport driving force in the gasphase and a decrease of the force in the liquid phase.The pH decreases very quickly in the top part of anabsorber, while in the bottom part the drop is consider-ably slower and pH stays about constant. The gas-side
mass-transfer resistance and partial pressure of SO2 isshown in Figure 5. The shape of the parameter profileschanged for different inlet conditions, and the presenteddistribution of parameter values can be taken as anexample.
ConclusionsThe process model describes in detail the processes
running in absorption systems. The results of this modelagree with data from the installed FGD plant, and onlyone model calibrating parameter (drop diameter) is goodenough. The analyses showed that all processes, whichran in an absorber and a holding tank, influenced therate of SO2 absorption. The process model could be usedto calculate the desulfurization efficiency and the rateof HCl absorption for different values of process param-eters. The cost model of the FGD system along with theprocess model was used in order to determine optimumvalues of decision variables for different conditions ofthe running FGD system.
List of SymbolsApp ) area of the cross section, m2
a ) specific surface area, m2/m3
D ) diffusivity, m2/sd ) diameter, mF(ds,i) ) cumulative mass fraction of the product, the size
of which is smaller than dif ) degree of limestone conversionfo ) frequency of drop oscillation,1/sg ) acceleration of gravity, m2/sH ) Henry’s constant, kPa‚m3/kmolHox ) height of liquid aeration, mhdc ) height of the inlet duct to the absorber, mJ ) absorption rate, kmol/s‚m2
Kg ) mass-transfer coefficient, kmol/(m2‚s‚kPa)Ks ) thermodynamic equilibrium constant, kmol2/m6
kg ) gas-side mass-transfer coefficient, kmol/(m2‚s‚kPa)
Figure 3. Enhancement factor â and concentration of sulfiteinside the drops profiles.
Figure 4. Flux of SO2 absorption and pH slurry profiles.
Figure 5. Gas-phase-side resistance to mass transfer and partialpressure of SO2 profiles.
Ind. Eng. Chem. Res., Vol. 40, No. 12, 2001 2603

kgp ) rate constant of gypsum crystallization, kmol/(m2‚s)kl ) liquid-side mass-transfer coefficient, m/skox ) rate constant of sulfite oxidation, m3/(kmol‚s)L* ) characteristic diameter, eq 13, mMi ) molar weight of component i, kg/kmolMs ) amount of limestone leaving a reaction tank, kg/sMs
in ) amount of limestone added to a reaction tank, kg/sm ) drop mass, kgn ) distribution modulusP ) overall pressure, kPaps ) partial pressure of SO2, kPaR ) constant, kJ/kg‚KRO2 ) flux of O2, kmol/sRe ) Reynolds numberRgp ) rate of gypsum crystallization, kmol/m3‚sRs ) relative saturationRSO2 ) flux of SO2, kmol/sr ) distance from the center of the limestone particle, mSc ) Schmidt numberSh ) Sherwood numberSIV ) sulfitest ) time, sUox ) superficial gas-phase velocity in a holding tank, m/sug ) gas velocity in the absorber, m/suk ) drop velocity in the relation apparatus, m/sVg,j ) flux of the gas into the absorber below a height of zj,
m3/sVg,j
/ ) flux of the gas into the absorber between a height ofinlet duct zj and zj-1, m3/s
V1 ) liquid flux, m3/hz ) charge or height of the actual calculation, m[k] ) concentration of component k, kmol/m3
Greek Letters
R ) correction factor, eq 11â ) enhancement factor∆z ) height of a layer, mδs ) film thickness, mεg ) gas holdupµ ) dynamic viscosity, Pa‚sν ) kinematic viscosity, m2/sFi ) density of component i, kg/m3
Fm ) molar density, kmol/m3
σ ) surface of tension, N/mτ ) average slurry residence time, s
Subscripts
ab ) absorberan ) anionsb ) bubblescat ) cationsd ) dropsdc ) inlet duck of gas to absorberg ) gas phasegp ) gypsumht ) holding tankj ) jth layerk ) component kl ) liquid phaseox ) oxidation of sulfites ) particle of limestone
Superscripts
i ) ith spray level or the ith fraction of limestonein ) corresponding to the limestone feed° ) inside the liquid phase/ ) equilibrium on the gas-liquid interface
Literature Cited
(1) Roberts, D. L.; Friedlander, S. K. Sulfur Dioxide TransportThrough Aqueous Solutions. AIChE J. 1980, 26, 593.
(2) Chang, C. S.; Rochelle, G. T. SO2 Absorption into AqueousSolutions. AIChE J. 1981, 27, 292.
(3) Chang, C. Y.; Liu, I. H.; Chang, I. C.; Chou, Y. C.; Liu, S.C.; Shih, S. M.; Hwang, D. C. Film model for sulfur dioxideabsorption onto quiescent water with interfacial resistance. Chemo-sphere 1994, 28, 1217.
(4) Hsu, Ch.; Shih, S.; Chang, Ch. Simulation of SO2 Absorptionby Falling Water Drops. Can. J. Chem. Eng. 1994, 72, 256.
(5) Uchida, S.; Ariga, O. Absorption of Sulfur Dioxide intoLimestone Slurry in a Stirred Tank. Can. J. Chem. Eng. 1985,63, 778.
(6) Pasiuk-Bronikowska, W.; Rudzinski, K. J. Absorption of SO2into aqueous systems. Chem. Eng. Sci. 1991, 46, 2281.
(7) Lancia, A.; Musmarra, D.; Pepe, F. Modeling of SO2 Absorp-tion into Limestone Suspensions. Ind. Eng. Chem. Res. 1997, 36,197.
(8) Gerard, P.; Segantini, G.; Vanderschuren, J. Modeling ofdilute sulfur dioxide absorption into calcium sulfite slurries. Chem.Eng. Sci. 1996, 51, 3349.
(9) Noblett, J. G.; Hebets, M. J.; Moser, R. E. EPRI’S FGDProcess Model (FGDPRISM). EPA/EPRI Symposium on Flue GasDesulphurisation, New Orleans, LA, 1990; 7B-127.
(10) Eden, D.; Luckas, M. A Heat and Mass Transfer Modelfor the Simulation of the Wet Limestone Flue Gas ScrubbingProcess. Chem. Eng. Technol. 1998, 21, 56.
(11) Eden, D.; Heiting, B.; Luckas, M. Berechung und Opim-ierung von SO2-Rauchgaswaschern. VGB Kraftwerkstech. 1997,77, 505.
(12) Brogren, Ch.; Karlsson, H. T. Modeling the absorption ofSO2 in a spray scrubber using the penetration theory. Chem. Eng.Sci. 1997, 52, 3085.
(13) Chang, Ch.; Rochelle, G. T. Limestone Dissolution Effectof Organic Acid Additives on SO2 Absorption into CaO/CaCO3Slurries. AIChE Symp. Ser. 1981, 77 (202), 78.
(14) Stergrasek, A.; Kocjancic, R.; Grebec, M. ExperimentalDetermination and Modeling of the Absorption of SO2 into a SingleDrop Based on pH Measurement. Chem. Eng. Sci. 1996, 51, 5081.
(15) Kiil, S.; Michael, L.; Michelsen, M. L.; Dam-Johansen, K.Experimental Investigation and Modeling of a Wet Gas Desulfu-rization Pilot Plant. Ind. Eng. Chem. Res. 1998, 37, 2792.
(16) Van Tonder, G. J.; Schutte, C. F. The Effect of MetalCations on the Kinetics of Limestone Neutralization of AcidWaters. Environ. Technol. 1997, 18, 1019.
(17) Gage, C. L.; Rochelle, G. T. Limestone Dissolution in FlueGas Scrubbing: Effect of Sulfite. J. Air Waste Manage. Assoc. 1992,42, 926.
(18) Brogren, Ch.; Karlsson, H. T. The impact of the electricalpotential gradient on limestone dissolution under wet flue gasdesulfurization conditions. Chem. Eng. Sci. 1997, 52, 3101.
(19) Brogren, Ch.; Karlsson, H. T. A Model for Prediction ofLimestone Dissolution in Wet Flue Gas Desulfurization Applica-tions. Ind. Eng. Chem. Res. 1997, 36, 3889.
(20) Frances, C.; Laguerie, C.; Mazzarotta, B.; Veccia, T. Onthe analysis of fine grinding in batch ball mill. Chem. Eng. J. 1996,63, 141.
(21) Linek, V.; Vacek, V. Chemical Engineering Use of Cata-lyzed Sulfite Oxidation Kinetics for the Determination of MassTransfer Characteristics of Gas-Liquid Contractors. Chem. Eng.Sci. 1981, 36, 1747.
(22) Hjuler, K.; Dam-Johansen, K. Wet Oxidation of Residualfrom Spray Absorption of Sulphur Dioxide. Chem. Eng. Sci. 1994,49, 4515.
(23) Lancia, A.; Musmarra, D.; Pepe, F.; Prisciandaro, M. Modelof oxygen absorption into calcium sulfite solutions. Chem. Eng. J.1997, 66, 123.
(24) Pasiuk-Bronikowska, W.; Ziajka, J. Kinetic of Aqueous SO2Oxidation at Different Rate Controling Steps. Chem. Eng. Sci.1989, 44, 915.
(25) Shah, Y. T.; Kelkar, B. G.; Godbole, S. P.; Deckwer, W. D.Design Parameters Estimations for Bubble Column Reactor.AIChE J. 1982, 28, 353.
(26) Altwicker, E. R.; Lindhjem, C. E. Absorption of Gases IntoDrops. AIChE J. 1988, 34, 329.
2604 Ind. Eng. Chem. Res., Vol. 40, No. 12, 2001

(27) Hsu, Ch.; Shih, S. Semiempirical Equation for Liquid-Phase Mass-Transfer Coefficient for Drops. AIChE J. 1993, 39,1090.
(28) Brewer, L. Thermodynamic Values for DesulfurizationProcesses; ACS Symposium Series 188; American Chemical Soci-ety: Washington, DC, 1982; p 1.
(29) Davies, C. W. Ion Association; Butterworths: London,1962.
(30) Weisenberger, S.; Schumpe, A. Estimation of Gas Solubili-
ties in Salt Solutions at Temperatures from 273 to 363 K. AIChEJ. 1996, 42, 298.
(31) Szymanowski, M. Optymalizacja kosztowa odsiarczaniaspalin metodı mokrı wapiennı. Ph.D. Dissertation, Warsaw Uni-versity of Technology, Warsaw, 1999.
Received for review June 13, 2000Accepted November 17, 2000
IE0005708
Ind. Eng. Chem. Res., Vol. 40, No. 12, 2001 2605