Model of stand-alone photovoltaic modulejournal.esrgroups.org/jes/iceedt/icraesCD/ICRAES... ·...
5
Model of stand-alone photovoltaic module Soltana Guesmi Moez Ghariani Moez Ayadi Rafik Neji Laboratory of Electronic Systems & Sustainable Energy (ESSE), University of Sfax, National Engineering School of Sfax 3038 Sfax, Tunisia [email protected] Laboratory of Electronic Systems & Sustainable Energy (ESSE), Intelligent Transport Systems & Mobility Technology Group, University of Sfax, National School of Electronics and Telecommunications. B.P 1163, 3018 Sfax, Tunisia. [email protected] Laboratory of Electronic Systems & Sustainable Energy (ESSE), Intelligent Transport Systems & Mobility Technology Group, University of Sfax, National School of Electronics and Telecommunications. B.P 1163, 3018 Sfax, Tunisia. [email protected] Laboratory of Electronics and Information Technology (LETI) Electric Vehicule and Power Electronics Group (VEEEP) University of Sfax, National Engineering School of Sfax 3038 Sfax, Tunisia [email protected] Abstract-- The energy from a stand-alone photovoltaic (PV) generation system is based on energy conversion in photovoltaic cells. It is defined as a semiconductor device which converts sunlight into electricity. In this paper, we demonstrate how to create a complete implementation of a photovoltaic module using mathematical equations in order to study their I-V and P-V characteristics. Also, introducing the manufacturer’s datasheets after sizing step. The chosen model consists of current source in parallel to the diode and the resistor connected in series represents the resistance of the contacts. Another one in parallel called shunt resistor, representing the leakage currents. The detailed model shows properly the impact of the weather condition, the irradiance and the temperature, on the production of maximum power- output to our electric vehicle. Index Terms-- Irradiance, Maximum Power, Temperature, Photovoltaic cell, P–V and I–V characteristic. 1. INTRODUCTION Ecological studies have shown that increasing energy consumption due to thermal vehicles is accompanied by an enormous increase in the emission of toxic gases into the atmosphere, which causes air and water pollution. For this purpose, electric vehicle development are rapidly involved and having an economic system [1]-[2]. The growing interest in renewable energy resources sector encourage scientists to increase the benefits of electric vehicle when storing energy in electric batteries through photovoltaic panels. Solar energy is an inexhaustible energy as it comes from the sun and respects nature and environment. It is the most reliable energy because there is no risk of rupture [2]. Moreover, the photovoltaic module refers to the number of cells connected in series and formed by semiconductor material with two interfaces: the positively doped P and the other negatively doped N. It’s the PN junction [3]. Photovoltaic cells convert light into electricity and it have different available technologies including monocrystalline, polycrystalline and thin-film which can be all used to produce the Photovoltaic panel. On the other hand, to obtain higher power output, you must choose the monocrystalline technology with many cells connected in series to increase the open circuit voltage of PV panel. In addition, the maximum energy produced by photovoltaic module depends on many parameters (irradiation, temperature, series resistance ...). This latter has large fluctuations then it is very difficult to make an exactly calculation of power production. Therefore, on the market, there are many software to estimate this production by giving us all parameters of any type of panel and in any domain after choosing the constraint (roof area available, electricity consumption or budget) [4]. There are a number of studies about the optimization and sizing of PV system equipped with the electrical grid utilize the conventional type of panel because there are no constraint of surface [5], Also H. Belmili highlights the criterion (quality / price) than the power generated or the surface of his standalone photovoltaic installation for lighting and pumping [6]. On the other hand, in our work, we are interested in the panels that will be installed on the roof of vehicles. Therefore, the choice of module type must check the constraint of the surface limitation by guaranteeing the maximum power generated. Sizing software has allowed us to select the desired cell type, battery type and the proper converter. For that we are chosen the best panel “SPR-455J-WHT-D “of SunPower Manufacturer with 455W. In this paper, after the dimensioning phase of the system and the providing of all electric characteristic of the appropriate panel, we propose a simple model of our panel using the step-by-step modeling procedure to present the simulation results in the next step. 2. MODELING OF PHOTOVOLTAIC PANEL A. Specification A solar cell of “SPR-455J-WHT-D “is basically a PN junction fabricated in a monocrystalline of semiconductor which has the faculty of transforming the irradiation solar to electricity. As appears in Fig. 1, the equivalent circuit of a PV cell
Transcript of Model of stand-alone photovoltaic modulejournal.esrgroups.org/jes/iceedt/icraesCD/ICRAES... ·...

Model of stand-alone photovoltaic module
Soltana Guesmi Moez Ghariani Moez Ayadi Rafik Neji
Laboratory of Electronic
Systems & Sustainable
Energy (ESSE),
University of Sfax,
National Engineering School
of Sfax
3038 Sfax, Tunisia
Laboratory of Electronic
Systems & Sustainable Energy
(ESSE),
Intelligent Transport Systems
& Mobility Technology
Group,
University of Sfax, National
School of Electronics and
Telecommunications.
B.P 1163, 3018 Sfax, Tunisia.
Laboratory of Electronic
Systems & Sustainable Energy
(ESSE),
Intelligent Transport Systems
& Mobility Technology
Group,
University of Sfax, National
School of Electronics and
Telecommunications.
B.P 1163, 3018 Sfax, Tunisia.
Laboratory of Electronics and
Information Technology
(LETI)
Electric Vehicule and Power
Electronics Group (VEEEP)
University of Sfax,
National Engineering School
of Sfax
3038 Sfax, Tunisia
Abstract-- The energy from a stand-alone photovoltaic (PV)
generation system is based on energy conversion in
photovoltaic cells. It is defined as a semiconductor device
which converts sunlight into electricity. In this paper, we
demonstrate how to create a complete implementation of a
photovoltaic module using mathematical equations in order to
study their I-V and P-V characteristics. Also, introducing the
manufacturer’s datasheets after sizing step. The chosen model
consists of current source in parallel to the diode and the
resistor connected in series represents the resistance of the
contacts. Another one in parallel called shunt resistor,
representing the leakage currents. The detailed model shows
properly the impact of the weather condition, the irradiance
and the temperature, on the production of maximum power-
output to our electric vehicle.
Index Terms-- Irradiance, Maximum Power, Temperature,
Photovoltaic cell, P–V and I–V characteristic.
1. INTRODUCTION
Ecological studies have shown that increasing energy
consumption due to thermal vehicles is accompanied by an
enormous increase in the emission of toxic gases into the
atmosphere, which causes air and water pollution. For this
purpose, electric vehicle development are rapidly involved
and having an economic system [1]-[2]. The growing
interest in renewable energy resources sector encourage
scientists to increase the benefits of electric vehicle when
storing energy in electric batteries through photovoltaic
panels. Solar energy is an inexhaustible energy as it comes
from the sun and respects nature and environment. It is the
most reliable energy because there is no risk of rupture [2].
Moreover, the photovoltaic module refers to the number of
cells connected in series and formed by semiconductor
material with two interfaces: the positively doped P and the
other negatively doped N. It’s the PN junction [3].
Photovoltaic cells convert light into electricity and it have
different available technologies including monocrystalline,
polycrystalline and thin-film which can be all used to
produce the Photovoltaic panel. On the other hand, to
obtain higher power output, you must choose the
monocrystalline technology with many cells connected in
series to increase the open circuit voltage of PV panel.
In addition, the maximum energy produced by
photovoltaic module depends on many parameters
(irradiation, temperature, series resistance ...). This latter
has large fluctuations then it is very difficult to make an
exactly calculation of power production. Therefore, on the
market, there are many software to estimate this production
by giving us all parameters of any type of panel and in any
domain after choosing the constraint (roof area available,
electricity consumption or budget) [4]. There are a number
of studies about the optimization and sizing of PV system
equipped with the electrical grid utilize the conventional
type of panel because there are no constraint of surface [5],
Also H. Belmili highlights the criterion (quality / price)
than the power generated or the surface of his standalone
photovoltaic installation for lighting and pumping [6]. On
the other hand, in our work, we are interested in the panels
that will be installed on the roof of vehicles. Therefore, the
choice of module type must check the constraint of the
surface limitation by guaranteeing the maximum power
generated. Sizing software has allowed us to select the
desired cell type, battery type and the proper converter. For
that we are chosen the best panel “SPR-455J-WHT-D “of
SunPower Manufacturer with 455W.
In this paper, after the dimensioning phase of the system
and the providing of all electric characteristic of the
appropriate panel, we propose a simple model of our panel
using the step-by-step modeling procedure to present the
simulation results in the next step.
2. MODELING OF PHOTOVOLTAIC PANEL
A. Specification
A solar cell of “SPR-455J-WHT-D “is basically a PN
junction fabricated in a monocrystalline of semiconductor
which has the faculty of transforming the irradiation solar
to electricity.
As appears in Fig. 1, the equivalent circuit of a PV cell

is composed of current source, which models the
photocurrent, associated in parallel with diode represents
the PN junction, to determine the voltage source. The two
preceding components represent the equivalent circuit of
an ideal photovoltaic cell, which is developed in several
papers [6]-[7], and regardless the dissipation phenomena at
the cellular level caused by the increase of temperature. In
this paper, to solve this problem and having an effective
model with exactly values of power, we added two
resistances Rs and Rp, representing the losses of the cell, to
obtain the complete equivalent circuit of photovoltaic cell
and with more performance and persuasion at any time. V
d
Iph Id
V
D
I
-
+
Fig. 1. Ideal single diode Model
Vd
Iph Id
D
I
Rs
Rp
+
-
Ip
Vd
Fig. 2. Equivalent circuit of a photovoltaic cell
I
V
(Ns/Np)Rp
(Ns/Np)Rs
NpIph
Np
Ns
Fig. 3. Equivalent circuit of PV module
The output power of photovoltaic module depends on
the irradiance of sunlight and the temperature. The
simulation of the proposed model of PV panel or module
consists of validating the relationship between voltage-
current and voltage-power, in addition to give the operating
range of optimal power [8].The equivalent circuit of PV
module is shown in Fig.3.
The table below recapitulates the value of all PV
parameters of “SPR-455J-WHT-D “.They represent all the
input parameters of our model.
TABLE I
Electric characteristic of SPR-455J-WHT-D of SunPower
Manufacturer
Symbol Parameters Value
Pnom Peak Power at STC
(manufacturer)
455Wc
Technology Si-mono
Sm Total surface of the module 2.16m²
Nb Cells number 128
Tref Reference Temperature 298K
G reference Irradiance 1000
W/m²
Vco the voltage at open circuit 90.5V
Isc the current at short circuit 6.32 A
T_coef Temperature Coefficient at Isc 3.5 mA/°C
Rp Parallel resistance 4591ohm
Rs Series Resistane 0.58 ohm
According to Kirchhoff’s current law applied to Fig. 3. :
The output current I [A], of PV module is expressed by:
𝐼 = 𝑁𝑝(𝐼𝑝ℎ − 𝐼𝑑 − 𝐼𝑝)
(1)
Where Np is the number of PV cells connected in parallel
(=1), Iph is the photocurrent [A], Ip is the photocurrent [A]
and Id is the diode current [A] measured as:
𝐼𝑑 = 𝐼𝑂(𝑒𝑞𝑉𝑑
𝐴𝑁𝑠𝐾𝑇 − 1) (2)
Here, I0 is the reverse bias saturation current (or scale
current), Vd is the voltage across the diode, k is the
Boltzmann constant, T is the absolute temperature of the
PN junction, q is the magnitude of charge of an electron and
Ns is the number of PV cells connected in series [9].

A is the diode ideality factor or the quality factor or
sometimes emission coefficient. It depends on the
fabrication process and semiconductor material as shown
in table below.
TABLE II
Ideality factor (A) [10]
Technology A
Si-mono 1.2
Si-poly 1.3
a-Si-H 1.8
a-Si-H tandem 3.3
a-Si-H triple 5
cdTe 1.5
CTs 1.5
AsGa 1.3
The reverse saturation current I0 depends on the cell
temperature (T) and defined by:
𝐼𝑜 = 𝐼0_𝑟𝑒𝑓 (𝑇
𝑇𝑟𝑒𝑓)3 exp(
𝑞𝐸𝐺
𝐴𝑘
1
𝑇𝑟𝑒𝑓−
1
𝑇 )
(3)
By using [6]:
𝐼0_𝑟𝑒𝑓 = 𝐼𝑠𝑐𝑟𝑒𝑓 (𝑒𝑞𝑉𝑑
𝐴𝑁𝑠𝐾𝑇 − 1)
(4)
𝐼𝑝 =𝑉𝑑
𝑁𝑝𝑅𝑝=
𝑉+𝑅𝑠𝐼
𝑁𝑝𝑅𝑝
(5)
The photocurrent illustrated in [11]
𝐼𝑝ℎ = (𝐼𝑝ℎ ,𝑟𝑒𝑓 + 𝐾𝑖∆𝑇)𝐺
𝐺𝑟𝑒𝑓
(6)
Here, Ki is the coefficient temperature of short circuit
current (A/K), G is the input irradiance of model (W/m²),
Gref is the irradiance at Standard Test Condition STC
(G=1000W/m² and T=25°C), ∆T= T-Tref, Tref is the nominal
temperature at STC= 298 K, Iph,ref = Isc,ref is the nominal
photocurrent.
B. I-V and P-V characteristics of our panel
To study the environmental conditions effect
(temperature and solar irradiance) in the maximum power
generation, we have interested to model our module with
using all mathematics equations which is illustrated above.
The two curves, Fig. 4 and Fig. 5, show the simulated and
measured characteristic of I-V and P-V in the standard test
condition (T=25°C and G=1000 W/m²) in order to establish
the efficiency of our model.
In the simulation graph of P-V characteristic, we have
the maximum power point Pmpp equal to 450W and voltage
at maximum power Vmpp equal to 75.64 V, on the other
hand, Pmpp up to 455.5 W and Vmpp up to 75.8 V in the
measured graph.
The convergence between the two power values
indicates that the error margin between simulated and
measured graph is very weak. So we can rely to our model
for giving us the real behavior.
Fig. 4. I-V characteristic of PV module.
Fig. 5. P-V characteristic of PV module.
3. SIMULATIONS
The simulations of solar Panel is based on mathematical
equations given in the section above with the input
parameters shown in the TABLE I.
Our proposed model is presented in Fig.6. The inputs are
both, the weather data irradiance and the temperature, while
the outputs represent the variation of the PV electrical
quantity as a function of current, voltage and power.
All the variables of the mathematical equations are as
follows:
k = 1.3805*10-23 J/K;
q = 1.6*10-19C;
A = 1.2;
Ki = 0.0035 A/°C;
Isc_ref = 6.32 A;
0 10 20 30 40 50 60 70 80 90 1000
1
2
3
4
5
6
7
X: 75.94
Y: 5.923
Voltage(V)
Cu
rre
nt(
A)
X: 75.5
Y: 6.01Simulated Graph
measured Graph
Vmpp
Impp
0 10 20 30 40 50 60 70 80 90 1000
50
100
150
200
250
300
350
400
450
500
X: 75.64
Y: 450
Voltage(V)
Po
we
r(W
)
X: 75.8
Y: 455.4
Simuated Graph
maesured Graph
Pmpp
Vmpp

Ns = 128,
Eg (Material band gap energy) = 1.12 eV.
- Module photon-current Iph is given by Eq. (6) and
modeled as Fig.7 with detailed information
- Module reverse saturation current I0-ref is given by Eq. (4)
and modeled as Fig. 8.
- Module saturation current I0 is given by Eq. (3) and
modeled as Fig.9.
- Module PV output current I is given by Eq. (1) and
modeled as Fig.10.
Fig. 6. The complete model of our PV module
Fig. 7. Simulink Bloc of detailed Iph simulation
Fig. 8. Simulink Bloc of detailed I0-ref simulation
Fig. 9. Simulink Bloc of detailed I0 simulation
Fig. 10. Simulink Bloc of detailed I simulation
4. RESULTS AND DISCUSSION
All simulations are completed and performed by using
the commercial software MATLAB® (Simulink) which
validate the previously described model.
In the first step, we represent the results of photovoltaic
module with the following series and parallel resistance: Rs
= 0.17 Ω and Rp = 250 Ω. After validating our model with
best running, we are going to show the influence of
irradiation and temperature in the response of the outputs.
A. Irradiance effect
In the following two curves (Fig.11 and Fig.12), our
Simulink model is running for various values of sun
intensity levels as 1000 W/m², 800 W/m², 650 W/m² 450
W/m², and 200W/m². When the irradiance increases, the
current intensity increases too and with an increase in
sunlight voltage, the production of electric power of the
photovoltaic module increases also.
Fig. 11. I-V characteristic by varying irradiance.
And the same for the P-V characteristic in the following
figure.
0 10 20 30 40 50 60 70 80 90 1000
1
2
3
4
5
6
7
Voltage(V)
Cu
rre
nt(
A)
G=1000 W/m²
G=800 W/m²
G=600 W/m²
G=400 W/m²
G=200 W/m²
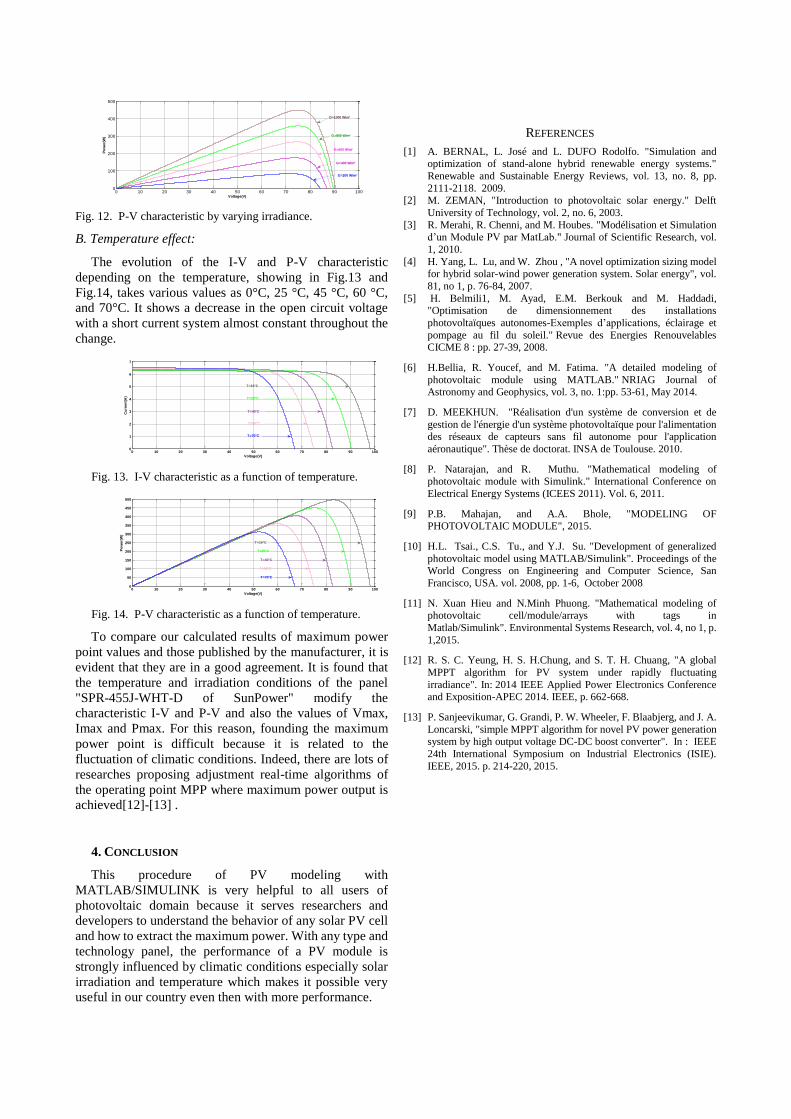
Fig. 12. P-V characteristic by varying irradiance.
B. Temperature effect:
The evolution of the I-V and P-V characteristic
depending on the temperature, showing in Fig.13 and
Fig.14, takes various values as 0°C, 25 °C, 45 °C, 60 °C,
and 70°C. It shows a decrease in the open circuit voltage
with a short current system almost constant throughout the
change.
Fig. 13. I-V characteristic as a function of temperature.
Fig. 14. P-V characteristic as a function of temperature.
To compare our calculated results of maximum power
point values and those published by the manufacturer, it is
evident that they are in a good agreement. It is found that
the temperature and irradiation conditions of the panel
"SPR-455J-WHT-D of SunPower" modify the
characteristic I-V and P-V and also the values of Vmax,
Imax and Pmax. For this reason, founding the maximum
power point is difficult because it is related to the
fluctuation of climatic conditions. Indeed, there are lots of
researches proposing adjustment real-time algorithms of
the operating point MPP where maximum power output is
achieved[12]-[13] .
4. CONCLUSION
This procedure of PV modeling with
MATLAB/SIMULINK is very helpful to all users of
photovoltaic domain because it serves researchers and
developers to understand the behavior of any solar PV cell
and how to extract the maximum power. With any type and
technology panel, the performance of a PV module is
strongly influenced by climatic conditions especially solar
irradiation and temperature which makes it possible very
useful in our country even then with more performance.
REFERENCES
[1] A. BERNAL, L. José and L. DUFO Rodolfo. "Simulation and optimization of stand-alone hybrid renewable energy systems."
Renewable and Sustainable Energy Reviews, vol. 13, no. 8, pp.
2111-2118. 2009. [2] M. ZEMAN, "Introduction to photovoltaic solar energy." Delft
University of Technology, vol. 2, no. 6, 2003.
[3] R. Merahi, R. Chenni, and M. Houbes. "Modélisation et Simulation d’un Module PV par MatLab." Journal of Scientific Research, vol.
1, 2010.
[4] H. Yang, L. Lu, and W. Zhou , "A novel optimization sizing model for hybrid solar-wind power generation system. Solar energy", vol.
81, no 1, p. 76-84, 2007.
[5] H. Belmili1, M. Ayad, E.M. Berkouk and M. Haddadi, "Optimisation de dimensionnement des installations
photovoltaïques autonomes-Exemples d’applications, éclairage et
pompage au fil du soleil." Revue des Energies Renouvelables CICME 8 : pp. 27-39, 2008.
[6] H.Bellia, R. Youcef, and M. Fatima. "A detailed modeling of
photovoltaic module using MATLAB." NRIAG Journal of Astronomy and Geophysics, vol. 3, no. 1:pp. 53-61, May 2014.
[7] D. MEEKHUN. "Réalisation d'un système de conversion et de
gestion de l'énergie d'un système photovoltaïque pour l'alimentation des réseaux de capteurs sans fil autonome pour l'application
aéronautique". Thèse de doctorat. INSA de Toulouse. 2010.
[8] P. Natarajan, and R. Muthu. "Mathematical modeling of photovoltaic module with Simulink." International Conference on
Electrical Energy Systems (ICEES 2011). Vol. 6, 2011.
[9] P.B. Mahajan, and A.A. Bhole, "MODELING OF PHOTOVOLTAIC MODULE", 2015.
[10] H.L. Tsai., C.S. Tu., and Y.J. Su. "Development of generalized
photovoltaic model using MATLAB/Simulink". Proceedings of the World Congress on Engineering and Computer Science, San
Francisco, USA. vol. 2008, pp. 1-6, October 2008
[11] N. Xuan Hieu and N.Minh Phuong. "Mathematical modeling of photovoltaic cell/module/arrays with tags in
Matlab/Simulink". Environmental Systems Research, vol. 4, no 1, p.
1,2015.
[12] R. S. C. Yeung, H. S. H.Chung, and S. T. H. Chuang, "A global
MPPT algorithm for PV system under rapidly fluctuating
irradiance". In: 2014 IEEE Applied Power Electronics Conference and Exposition-APEC 2014. IEEE, p. 662-668.
[13] P. Sanjeevikumar, G. Grandi, P. W. Wheeler, F. Blaabjerg, and J. A.
Loncarski, "simple MPPT algorithm for novel PV power generation
system by high output voltage DC-DC boost converter". In : IEEE
24th International Symposium on Industrial Electronics (ISIE).
IEEE, 2015. p. 214-220, 2015.
0 10 20 30 40 50 60 70 80 90 1000
100
200
300
400
500
Voltage(V)
Po
we
r(W
) G=800 W/m²
G=1000 W/m²
G=600 W/m²
G=400 W/m²
G=200 W/m²
0 10 20 30 40 50 60 70 80 90 1000
1
2
3
4
5
6
7
Voltage(V)
Cu
rre
nt(
A)
T=70°C
T=55°C
T=40°C
T=25°C
T=10°C
0 10 20 30 40 50 60 70 80 90 1000
50
100
150
200
250
300
350
400
450
500
Voltage(V)
Po
we
r(W
)
T=10°C
T=25°C
T=40°C
T=55°C
T=70°C