Model development to enhance the solvent extraction of ...
9
RESEARCH ARTICLE Model development to enhance the solvent extraction of rice bran oil Fajriyati Mas’ud 1,* , Fajar 1 , Herman Bangngalino 1 , Sri Indriati 1 , Abigael Todingbua 1 , Suhardi 2 and Muhammad Sayuti 3 1 Department of Chemical Engineering, Politeknik Negeri Ujung Pandang, Makassar, South Sulawesi, 90245, Indonesia 2 Department of Agricultural Engineering, Hasanuddin University, Makassar, South Sulawesi, 90245, Indonesia 3 Department of Animal Husbandry, Agricultural Faculty, Gorontalo State University, Gorontalo, 96128, Indonesia Received 4 November 2018 – Accepted 4 March 2019 Abstract – Rice bran oil (RBO) extraction with ethanol using maceration method accompanied by stirring has been optimized using response surface methodology (RSM) based on central composite design (CCD). Experiments were conducted to investigate the influence of extraction time, ethanol concentration, and ethanol volume on the oil yield, g-oryzanol, and vitamin E of RBO as the response. The experiment consisted of twenty units including six replicates of the center points. The data were analyzed using Design- Expert 10 software to develop and evaluate models and to plot the response curve as 3D surfaces. The result showed that the maximum of the oil yield, g-oryzanol, and vitamin E of RBO was achieved under the optimum conditions of x 1 = 5.30 h, x 2 = 89.21% and x 3 = 686.66 mL (50 g rice bran), respectively. Maximum of the response under these conditions was 14.47%, 783.65 mg.L 1 , and 127.01 mg.L 1 , respectively. This study has resulted in the development of a model for RBO extraction using ethanol as solvent, it is feasible to be applied to the RBO industry with an efficient process, as well as an implementation of the “green” solvent concept. Keywords: maceration / edible oil / ethanol / green solvent / response surface methodology Résumé – Développement d’un modèle pour améliorer l’extraction solvant de l’huile de son de riz. L ’extraction de l’huile de son de riz (rice bran oil, RBO) à l’éthanol par la méthode de la macération accompagnée d’une agitation a été optimisée à l’aide de la méthode RSM (response surface methodology) basée sur un plan d’expérience de type composite centré (central composite design, CCD). Des expériences ont été menées pour étudier l’influence du temps d’extraction, de la concentration en éthanol et du volume d’éthanol sur le rendement en huile, en g-oryzanol et en vitamine E de l’huile de son de riz. L ’expérience consistait en vingt essais comprenant six réplicats des points centraux. Les données ont été analysées en utilisant le logiciel Design-Expert 10 pour développer et évaluer les modèles et pour tracer la courbe de réponse sous forme de surfaces 3D. Le résultat a montré que le maximum de rendement en huile, g-oryzanol et vitamine E de l’huile de son de riz a été atteint dans les conditions optimales de x 1 = 5,30 h d’extraction, x 2 = 89,21 % d’éthanol et x 3 = 686,66 mL de solvant (50 g de son de riz). La réponse maximale dans ces conditions était de 14,47 % d’huile, 783,65 mg.L 1 d’g-oryzanol et 127,01 mg.L 1 de vitamine E. Cette étude a abouti à la mise au point d’un modèle d’extraction d’huile de son de riz utilisant l’éthanol comme solvant ; le process pourrait être appliquée à l’industrie de l’huile de son de riz de manière efficace et en répondant au concept de solvant « vert ». Mots clés : macération / huile alimentaire / éthanol / solvant vert / méthodologie de surface de réponse *Correspondence: [email protected] OCL 2019, 26, 16 © F. Mas’ud et al., Published by EDP Sciences, 2019 https://doi.org/10.1051/ocl/2019009 Oilseeds & fats Crops and Lipids OCL Available online at: www.ocl-journal.org This is an Open Access article distributed under the terms of the Creative Commons Attribution License (http://creativecommons.org/licenses/by/4.0), which permits unrestricted use, distribution, and reproduction in any medium, provided the original work is properly cited.
Transcript of Model development to enhance the solvent extraction of ...

OCL 2019, 26, 16© F. Mas’ud et al., Published by EDP Sciences, 2019https://doi.org/10.1051/ocl/2019009
Oilseeds & fats Crops and LipidsOCL
RESEARCH ARTICLE
Available online at:www.ocl-journal.org
Model development to enhance the solvent extraction of rice branoil
Fajriyati Mas’ud1,*, Fajar1, Herman Bangngalino1, Sri Indriati1, Abigael Todingbua1, Suhardi2
and Muhammad Sayuti3
1 Department of Chemical Engineering, Politeknik Negeri Ujung Pandang, Makassar, South Sulawesi, 90245, Indonesia2 Department of Agricultural Engineering, Hasanuddin University, Makassar, South Sulawesi, 90245, Indonesia3 Department of Animal Husbandry, Agricultural Faculty, Gorontalo State University, Gorontalo, 96128, Indonesia
Received 4 November 2018 – Accepted 4 March 2019
*Correspon
This is anOp
Abstract – Rice bran oil (RBO) extraction with ethanol using maceration method accompanied by stirringhas been optimized using response surface methodology (RSM) based on central composite design (CCD).Experiments were conducted to investigate the influence of extraction time, ethanol concentration, andethanol volume on the oil yield, g-oryzanol, and vitamin E of RBO as the response. The experimentconsisted of twenty units including six replicates of the center points. The data were analyzed using Design-Expert 10 software to develop and evaluate models and to plot the response curve as 3D surfaces. The resultshowed that the maximum of the oil yield, g-oryzanol, and vitamin E of RBO was achieved under theoptimum conditions of x1 = 5.30 h, x2 = 89.21% and x3 = 686.66mL (50 g rice bran), respectively. Maximumof the response under these conditions was 14.47%, 783.65mg.L�1, and 127.01mg.L�1, respectively. Thisstudy has resulted in the development of a model for RBO extraction using ethanol as solvent, it is feasible tobe applied to the RBO industry with an efficient process, as well as an implementation of the “green” solventconcept.
Keywords: maceration / edible oil / ethanol / green solvent / response surface methodology
Résumé – Développement d’un modèle pour améliorer l’extraction solvant de l’huile de son de riz.L’extraction de l’huile de son de riz (rice bran oil, RBO) à l’éthanol par la méthode de la macérationaccompagnée d’une agitation a été optimisée à l’aide de la méthode RSM (response surface methodology)basée sur un plan d’expérience de type composite centré (central composite design, CCD). Des expériencesont été menées pour étudier l’influence du temps d’extraction, de la concentration en éthanol et du volumed’éthanol sur le rendement en huile, en g-oryzanol et en vitamine E de l’huile de son de riz. L’expérienceconsistait en vingt essais comprenant six réplicats des points centraux. Les données ont été analysées enutilisant le logiciel Design-Expert 10 pour développer et évaluer les modèles et pour tracer la courbe deréponse sous forme de surfaces 3D. Le résultat a montré que le maximum de rendement en huile, g-oryzanolet vitamine E de l’huile de son de riz a été atteint dans les conditions optimales de x1 = 5,30 h d’extraction,x2 = 89,21% d’éthanol et x3 = 686,66mL de solvant (50 g de son de riz). La réponse maximale dans cesconditions était de 14,47% d’huile, 783,65mg.L�1 d’g-oryzanol et 127,01mg.L�1 de vitamine E. Cetteétude a abouti à la mise au point d’un modèle d’extraction d’huile de son de riz utilisant l’éthanol commesolvant ; le process pourrait être appliquée à l’industrie de l’huile de son de riz de manière efficace et enrépondant au concept de solvant « vert ».
Mots clés : macération / huile alimentaire / éthanol / solvant vert / méthodologie de surface de réponse
dence: [email protected]
en Access article distributed under the terms of the Creative CommonsAttribution License (http://creativecommons.org/licenses/by/4.0), which permitsunrestricted use, distribution, and reproduction in any medium, provided the original work is properly cited.
F. Mas’ud et al.: OCL 2019, 26, 16
1 Introduction
RBO is edible oil extracted from rice bran which is a by-product of rice mills. RBO is superior among the other edibleoils because it contains unique antioxidants and nutraceuticalcomplexes present in its composition (Oliveira et al., 2012).In the unsaponifiable fraction of RBO contains g-oryzanoland tocols. These compounds have been reported in thescientific literature as powerful antioxidant agents that areeffective for preventing degenerative diseases (Lerma-Garcíaet al., 2009). Seema (2015) suggests that bran antioxidants aremainly g-oryzanol and vitamin E, as well as unsaturated fatscapable of lowering cholesterol. g-oryzanol component ofRBO was first presumed to be a single component, but later itwas determined to be a fraction containing ferulate (4-hydroxy-3-methoxy cinnamic acid) esters of triterpenealcohols and plant sterols (Rogers et al., 1993). Cycloartenylferulate, 24-methylenecycloartanyl ferulate, and campesterylferulate are the three major components of g-oryzanol (Xuet al., 2001).
On the other hand, the most important contribution ofvegetable oils is their tocopherol content, which is generallycollectively referred to as “vitamin E”. Vegetable oils containhigh concentrations of vitamin E (Bauernfeind and Desai,1977) and can provide the most daily requirement of vitamin E(Desai et al., 1980). High vitamin E levels in rice bran oils arereported to have antihypocholesterolemic, anticancer, andneuroprotective properties. Tocols are capable of reducinglipid peroxidation and lipid risk factors, in this case increasingLDL cholesterol and platelet aggregation, exhibiting anti-inflammatory properties, demonstrating anti-carcinogenic andcardiovascular protection effects (Tiwari and Cummins, 2009).
Some scientific reports on the benefits of RBO for healthhave led this study to evaluate the optimization of theextraction process of RBO. The direct solvent extractionmethod, which does not require specific extraction instrumen-tation, has been most commonly used (Chen and Bergman,2005), and ethanol has gained attention as a potential solventfor vegetable oils (Rodrigues and Oliveira, 2010). Study onsesame oil revealed that the polar solvent such as ethanol was agood solvent compared to non-polar solvents. According toPéres et al. (2006), these results could be explained by theinteraction between the unsaturated fatty acids with a polarsolvent, compared with non-polar solvents. In fact, the oilsextracted with ethanol presented the typical composition ofRBO (Firestone, 1999). Ethanol has attractive advantages touse as a solvent, including low toxicity, good operationalsecurity, as well as being obtained from a bio-renewable source(Bessa et al., 2017). The choice of ethanol as a solvent isdeemed necessary to implement the concepts and principles ofgreen extraction.
According to Chemat et al. (2012), green extraction is anew concept to protect both the environment and consumersand in the enhanced competition of industries to be moreecologic, economic, and innovative. Within the greenextraction approach, the concept of the green extract is anextract obtained in such a way to have the lowest possibleimpact on the environment. Because of environmentalconcerns, a suitable solvent which gives less impact to theenvironment is more preferred nowadays. Further, according
Page 2
to Tekin et al. (2018), ethanol has been widely applied as aviable solvent due to their ease of recovery and low cost in anapplication and is classified as an environmentally friendlygreen solvent. Although alcohols such as ethanol, methanoland isopropyl alcohol have similar solvent properties, ethanolhas become the foremost among others because of its non-toxicnature. Li et al. (2016) stated that the green solvents haveseveral benefits such as biodegradability, low toxicity, non-flammability, and renewability making them potential candi-dates in separation science.
Many studies have proven the technical feasibility ofemploying ethanol in the process of extraction oils (Saxenaet al., 2011). On oil extraction from sunflower collets, ethanolgave a higher yield of extracted material, the content of oilphase was similar to that obtained when n-hexane is used.When ethanol was used, about 70% less crystallizable waxesand about 38% more tocopherols and phospholipids wereextracted, this shows the feasibility of using ethanol as analternative solvent to hexane in extracting oil (Baümler et al.,2016), including RBO (Oliveira et al., 2012; Rodrigues andOliveira, 2010). Previously, Imsanguan et al. (2008) havereported that ethanol was a better solvent for g-oryzanolextraction compared to hexane. It can be explained by therelatively high polarity of the g-oryzanol molecule (consistingof triterpene alcohols and phytosterols esterified with ferulicacid), where the polarity of the solvent may significantly affectthe extractability of g-oryzanol (Xu and Godber, 2001).
Based on the results of the existing study on the RBO, andthat the optimization of the extraction process is very muchrelated to production costs, as well as considering the needs ofthe RBO extraction industry for the pharmaceutical and foodindustries related to the optimization of the extraction process,then this research was conducted. To the best of the author’sknowledge, this is the first study, RBO extraction uses ethanoland monitors the extraction time, ethanol concentration, andvolume of ethanol on oil yield, g-oryzanol, and vitamin E ofRBO in the maceration method accompanied by stirring, andapplies RSM to optimize the RBO extraction process,standardize, and analyze the resulting model.
2 Materials and methods
Ciliwung rice, local rice of Indonesia, as samples wereobtained from milling rice grain in a local grinding millMakassar Indonesia during March to April in 2017. Ethanol(wt.%) purchased from a local chemical shop, g-oryzanolstandard from Sigma-Aldrich Co and a-tocopherol standardfrom Sigma, St. Louis, USA. Ethyl acetate, methanol, andchloroform from Merck, Germany.
2.1 Preparation of rice bran and extraction oil
Freshly milled bran samples were directly collected fromthe milling system in polyethylene bags, the rice bran wasscreened through a 60-mesh sieve to have a uniform particlesize and stabilized at autoclave (Hiclave HV-85 Hirayama) at100 °C for 15min for inactivating endogenous lipase. Forextraction oil, each experimental unit weighed 50 g of rice branin the Erlenmeyer 1000mL, RBO was extracted usingmaceration method with stirring under the 30 °C of room
of 9

Table 1. Five levels of independent variables of central compositedesign.
Independentvariables
Star low Low Centre High Star high
(�1.68) (�1) (0) (þ1) (þ1.68)
Extraction time (h) 3.32 4 5 6 6.68Ethanol concentration(wt.%)
69.18 76 86 96 100
Ethanol volume(mL)
431.82 500 600 700 768.18
F. Mas’ud et al.: OCL 2019, 26, 16
temperature, and pulp was separated by centrifugation(refrigerated AX-521 centrifuge) at a speed of 3500 rpm for20min. The liquid part was accommodated in the evaporatorflask. Then, the solvent was removed in a Buchi R-215 rotaryevaporator equipped V-700 vacuum Pomp speed of 60 rpm, theheating temperature was of 35 °C, and the evaporationtemperature was of 21 °C. RBO was packaged in a dark glassbottle and stored in a freezer before analysis. The percentage ofoil yield was calculated as follows (Sani, 2014):
Oil yield ð%Þ¼Weight of oil extracted ðgÞWeight of sample ðgÞ � 100: ð1Þ
2.2 Analysis of g-oryzanol and vitamin E
Preparation of g-oryzanol standard: 0.05 g of the pureg-oryzanol was dissolved in ethyl acetate in a 100mL flask,and diluted to respectively 100, 200, 300, 400, and 500 ppm ata 50mL flask, homogenized by vortex, inserted in the vial GC-MS (gas chromatography-mass spectrometry). Preparation ofvitamin E standard: 0.05 g of the pure vitamin E was dissolvedin methanol-chloroform (1:1) in a 100mL flasks, and diluted torespectively 100, 200, 300, 400, and 500mg.L�1 at a 50mLflask, homogenized by vortex, inserted in the vial GC-MS.Preparation of sample of RBO for g-oryzanol analysis: 0.012 gRBO dissolved in 2mL ethyl acetate, homogenized by vortexand inserted into the vial bottle GC-MS. Preparation of sampleof RBO for vitamin E analysis: 0.012 g RBO dissolved in 2mLmethanol-chloroform (1:1), homogenized by vortex andinserted into the vial bottle GC-MS.
Quantification of g-oryzanol and vitamin E of RBO:g-oryzanol and vitamin E of RBO were performed on a GC-MS QP2010 by Shimadzu equipped with a split/splitlessinjector. Separations were achieved using a Rxi SH-5Sil MScapillary column (30m, 0.25mm ID, 0.25mm film thickness).Heliumwas used as the carrier gas at flow rates of 14.0mL/minand a split ratio of 1:10. The oven temperature wasprogrammed at 110 °C for a hold of 2min and increased to200 °C at a rate of 10 °C/min and hold at the final temperaturefor 9min. LabSolution software was used to control theoperation of GC-MS. MS spectra were obtained at range widthm/z 40–450, interface temperature 280 °C, and ion sourcetemperature 200 °C. g-oryzanol and vitamin E of RBO peakswere identified by comparing their retention time andequivalent chain length with respect to the standards.
Page 3
2.3 Experimental design for optimization andstatistical analysis
RSM was employed to optimize the parameters of time,ethanol concentration, and ethanol volume for oil yield,g-oryzanol, and vitamin E maximum of RBO on extractionprocess by maceration method accompanied by stirring. RSMprovides the optimal conditions of a process, using multivari-ate statistical techniques to obtain responses from the observedprocess variables. RSM consists of mathematical andstatistical techniques based on polynomial equations that bestsuit experimental data to describe the behavior of data sets withthe aim of obtaining statistical predictive values (Rafi et al.,2015). It is a rapid analytical approach and more economical(Banga and Tripathi, 2009). Nowadays, the procedures basedon the statistical evaluation using RSM are widely used todetermine the interaction between the factors that influencereactions for optimization.
The CCD is one of the most effective RSM designs, whichare widely used in the study and optimization of the linear,quadratic, and interaction effects of variables on observedresponses (Soundararajan et al., 2016). The CCD is still thesymmetrical second order experimental design most utilizedfor the development of analytical procedures (Bezerra et al.,2008). Three independent variables examined in this studywere time (h) (x1), ethanol concentration (%) (x2), and ethanolvolume (mL) (x3), while the oil yield, g-oryzanol, and vitaminE concentration were considered as response variables. Thevalue of independent variables was determined based on theresults of the preliminary study. The middle values for theindependent variables were 5 h, 86%, and 600mL, respective-ly. The lower and upper limits for each treatment were 4 and 6 hfor time, 76 and 96% for ethanol concentrations, 500 and700mL for ethanol volume (Tab. 1). The CCD consists of 14experimental points and 6 replications of the center point.Replication of the center point was aims to evaluate the pureerror variance as the experimental error and to control theadequacy of the model. To estimate the coefficients of theresponse function and predict the system’s responses, analysisof the experimental results of CCD was realized usingempirical second-order polynomial equations as follows:(Amiri et al., 2018; Keshtegar et al., 2018).
Y ¼ b0 þXk
i¼1
biX i þXk
i¼1
biiX2i þ
Xk�1
i¼1
Xk
j¼1
bijX iX j þ :::e; ð2Þ
where, Y is a response, b0 denotes the constant coefficient; Xi
and Xj the independent factors, bi, bii, and bij the regressioncoefficients for the linear, quadratic, and interaction effects,respectively; k the number of variables; and e stands for thestatistical error occurring to response Y (Awad et al., 2017).
Statistic software Design-Expert 10 was used to design,analyze, and optimize experimental models. Analysis of variance(ANOVA) was used to validate the statistical significance of theparameters that influence the responses, and the quality of thepredictedmodel (Chan et al., 2017;Mohammed et al., 2018). Thecoefficient of determination (R2) shows the total predictiveperformanceof themodel, it represented thevalidity andfit qualityof the model’s quadratic polynomials. R2 values are close to 1,indicating a reasonable adjustment of the model to experimental
of 9
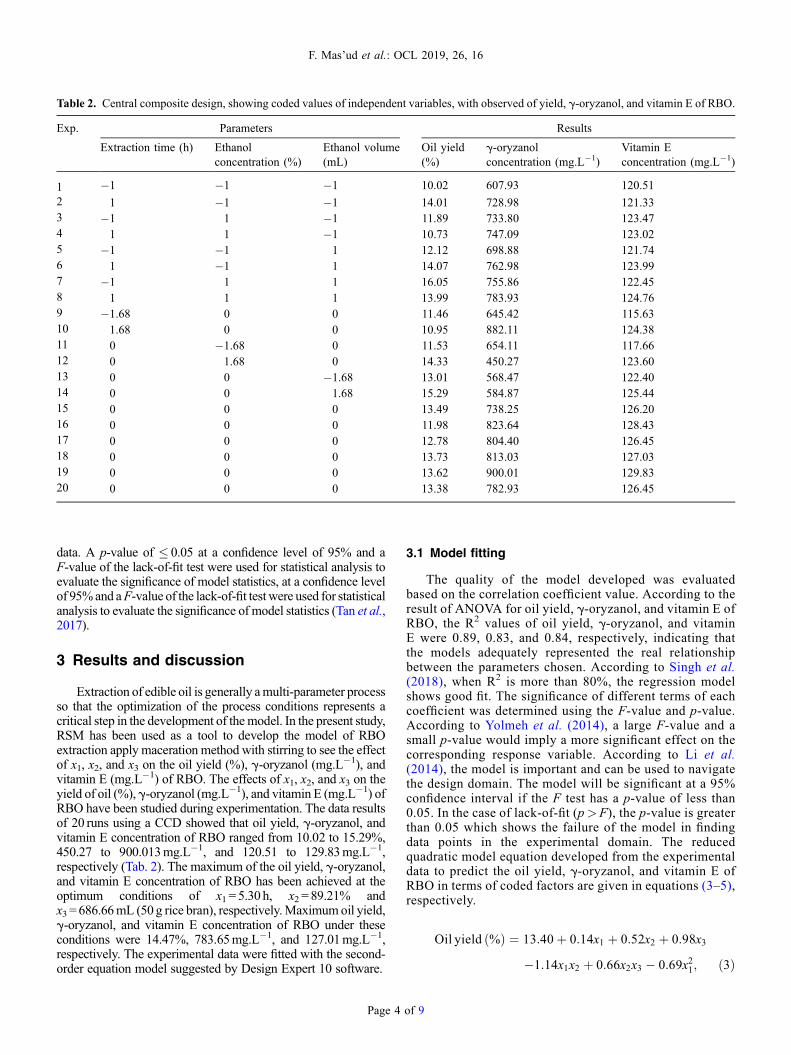
Table 2. Central composite design, showing coded values of independent variables, with observed of yield, g-oryzanol, and vitamin E of RBO.
Exp. Parameters Results
Extraction time (h) Ethanolconcentration (%)
Ethanol volume(mL)
Oil yield(%)
g-oryzanolconcentration (mg.L�1)
Vitamin Econcentration (mg.L�1)
1 �1 �1 �1 10.02 607.93 120.512 1 �1 �1 14.01 728.98 121.333 �1 1 �1 11.89 733.80 123.474 1 1 �1 10.73 747.09 123.025 �1 �1 1 12.12 698.88 121.746 1 �1 1 14.07 762.98 123.997 �1 1 1 16.05 755.86 122.458 1 1 1 13.99 783.93 124.769 �1.68 0 0 11.46 645.42 115.6310 1.68 0 0 10.95 882.11 124.3811 0 �1.68 0 11.53 654.11 117.6612 0 1.68 0 14.33 450.27 123.6013 0 0 �1.68 13.01 568.47 122.4014 0 0 1.68 15.29 584.87 125.4415 0 0 0 13.49 738.25 126.2016 0 0 0 11.98 823.64 128.4317 0 0 0 12.78 804.40 126.4518 0 0 0 13.73 813.03 127.0319 0 0 0 13.62 900.01 129.8320 0 0 0 13.38 782.93 126.45
F. Mas’ud et al.: OCL 2019, 26, 16
data. A p-value of � 0.05 at a confidence level of 95% and aF-value of the lack-of-fit test were used for statistical analysis toevaluate the significance of model statistics, at a confidence levelof 95%and aF-value of the lack-of-fit testwere used for statisticalanalysis to evaluate the significance of model statistics (Tan et al.,2017).
3 Results and discussion
Extraction of edible oil is generally amulti-parameter processso that the optimization of the process conditions represents acritical step in the development of themodel. In the present study,RSM has been used as a tool to develop the model of RBOextraction apply maceration method with stirring to see the effectof x1, x2, and x3 on the oil yield (%), g-oryzanol (mg.L�1), andvitamin E (mg.L�1) of RBO. The effects of x1, x2, and x3 on theyield of oil (%), g-oryzanol (mg.L�1), and vitamin E (mg.L�1) ofRBO have been studied during experimentation. The data resultsof 20 runs using a CCD showed that oil yield, g-oryzanol, andvitamin E concentration of RBO ranged from 10.02 to 15.29%,450.27 to 900.013mg.L�1, and 120.51 to 129.83mg.L�1,respectively (Tab. 2). The maximum of the oil yield, g-oryzanol,and vitamin E concentration of RBO has been achieved at theoptimum conditions of x1 = 5.30 h, x2 = 89.21% andx3 = 686.66mL (50g rice bran), respectively.Maximumoil yield,g-oryzanol, and vitamin E concentration of RBO under theseconditions were 14.47%, 783.65mg.L�1, and 127.01mg.L�1,respectively. The experimental data were fitted with the second-order equation model suggested by Design Expert 10 software.
Page 4
3.1 Model fitting
The quality of the model developed was evaluatedbased on the correlation coefficient value. According to theresult of ANOVA for oil yield, g-oryzanol, and vitamin E ofRBO, the R2 values of oil yield, g-oryzanol, and vitaminE were 0.89, 0.83, and 0.84, respectively, indicating thatthe models adequately represented the real relationshipbetween the parameters chosen. According to Singh et al.(2018), when R2 is more than 80%, the regression modelshows good fit. The significance of different terms of eachcoefficient was determined using the F-value and p-value.According to Yolmeh et al. (2014), a large F-value and asmall p-value would imply a more significant effect on thecorresponding response variable. According to Li et al.(2014), the model is important and can be used to navigatethe design domain. The model will be significant at a 95%confidence interval if the F test has a p-value of less than0.05. In the case of lack-of-fit (p>F), the p-value is greaterthan 0.05 which shows the failure of the model in findingdata points in the experimental domain. The reducedquadratic model equation developed from the experimentaldata to predict the oil yield, g-oryzanol, and vitamin E ofRBO in terms of coded factors are given in equations (3–5),respectively.
Oil yield ð%Þ ¼ 13:40þ 0:14x1 þ 0:52x2 þ 0:98x3
�1:14x1x2 þ 0:66x2x3 � 0:69x21; ð3Þ
of 9

F. Mas’ud et al.: OCL 2019, 26, 16
g�oryzanol ðmg:L�1Þ ¼ 811:98þ 45:73x1 � 8:85x2þ 15:48x3 � 69:22x22 � 60:57x23; ð4Þ
vitamin E ðmg:L�1Þ ¼ 126:60þ 1:44x1 þ 1:18x2� 2:2x21 � 1:99x22; ð5Þ
where: x1 = time; x2 = ethanol concentration; x3 = ethanolvolume.
3.2 interpretation result of ANOVA3.2.1 Extraction yield of RBO
The result of ANOVA for response surface reducedquadratic model of the oil yield showed that the model F-valueof 9.99 implies the model is significant. Values of Prob>F of0.0003 (less than 0.05) indicate model terms are significant.Values of Prob>F less than 0.05 indicate variable terms aresignificant, in this case, the linear term of ethanol concentration(x2), the linear term of ethanol volume (x3), the quadratic termsof extraction time (x1
2), the interaction between extraction timeand ethanol concentration (x1x2), and the interaction betweenethanol concentration and ethanol volume (x2x3) are significantvariables terms. On the contrary, values Prob>F greater than0.1000 indicate the variable terms are not significant, in thiscase, the linear term of extraction time (x1), the quadratic termsof ethanol concentration (x2
2), the quadratic terms of ethanolvolume (x3
2), and interaction between extraction time andethanol volume (x1x3) did not give any significant contributionon oil yield.
The lack-of-fit F-value of 1.69 implies the lack-of-fit is notsignificant relative to the pure error. Non-significant lack-of-fitis good, which indicates that the model is suitable to describethe effect of variables for the oil yield and that the developedmodel was adequate for predicting the response. According toBas and Boyaci, (2007), the model will be consideredappropriate if the lack-of-fit value model is not significantlydifferent at the level of specific a. Further, according toBezerra et al. (2008), a model will be well fitted to theexperimental data if it presents a significant regression and anon-significant lack-of-fit. These values would give arelatively good fit to the mathematic model in terms of codedfactors are given in equation (3).
In this study obtained a yield of RBO was 14.47% inagreement with the previous study. Anwar et al. (2005) hasreported that the rice bran contained 15–20% oil, and 10–26% according to Pourali et al. (2009). The simplest methodof solvent extraction is the single contact batch operation,where the solid to be leached and the solvent is mixed andthe extract solution and raffinate solid phases are separated(Bessa et al., 2017). Considering the time effect, it greatlyaffects the yield, especially on the value of the mass transfer.The longer the contact time between the solvent with thesolute during the extraction process, the more the number ofelements extracted chemical content. The more time is givenfor contact of the sample with the solvent, the higher theextraction yield percentage (Elkhaleefa and Shigidi, 2015).The effect of solvent concentration on the yield was alsoexplained by Chen et al. (2016), that the extraction yield was
Page 5
increased with the increase of ethanol concentration in theextraction solvent.
The effect of volume of solvent is consistent with masstransfer principles. The driving force during mass transfer is theconcentration gradient between the solid and the bulk of theliquid, which is greater when a higher solvent to solid ratio isused.Distribution of solvent to solidswill greatly affect oil yield,the ratio solidswith a solventwill affect theoil yield.The amountof solvent affects the wide contact between solids and solvents.Themore solvent, the greater the contact area, so the distributionof the solvent will be even greater. Equitable distribution ofsolvent to solids increases the oil yields, the amount of solventwill reduce the saturation level of the solvent so that the desiredcomponent will be extracted perfectly. In general, the yieldincreased with increasing volume of the solvent used. The morethe volume of solvent used, the greater the ability of a solvent toextract oil contained in the material. The increasing volume ofsolvent also leads to increasing contact time, which occursbetween materials with a solvent.
In the extraction process, an optimum point will bereached. Mas’ud et al. (2017) conducted a study of the effectsof extraction time, temperature, and volume of solvent inmango seed kernel oil extraction above room temperature, theyreported that the variables had a significant effect on oil yield.Effect of the combination of reactions between variable timeand temperature at high-level experimental process willobviously result in a decrease in oil yield. Similar phenomenahave also been reported by Oniya et al. (2017) and Pichai andKrit (2015). A decrease in oil yield at high temperatures andlong periods of time in oil extraction is thought to be a result ofdegradations of some oil components such as phenoliccompounds degradations as reported by Chew et al. (2011).They conducted a study of the effects of ethanol concentration,extraction time, and extraction temperature on the recovery ofphenolic compounds and antioxidant capacity, they werereported that the extraction time of 120min was achieved themaximum concentration of phenolic compounds, and after thispoint, total phenolic content and thick tannin content weredecreased. According to Chirinos et al. (2007), oxidation ofphenolic compounds due to excessive oxygen exposure canoccur if the extraction time is longer.
3.2.2 g-Oryzanol concentration of RBO
TheModel F-value of 4.62 implies the model is significant.Values of Prob>F of 0.0106 (less than 0.05) indicate modelterms are significant. Variables that have a significant effect ong-oryzanol concentration were the quadratic terms of ethanolconcentration (x2
2) and the quadratic terms of ethanol volume(x3
2). Values greater than 0.1000 indicate the model terms arenot significant so that the linear term of extraction time (x1),ethanol concentration (x2), and ethanol volume (x3), thequadratic term of extraction time (x1
2), the interaction betweentime and ethanol concentration (x1x2), the interaction betweentime and ethanol volume (x1x3), and the interaction betweenethanol concentration and ethanol volume (x2x3) did not giveany significant contribution on g-oryzanol concentration. Thereduced quadratic model equation in terms of coded factorswas developed from the experimental data to predict theg-oryzanol of RBO produced from ANOVA as given inequation (4). The coefficient values of variables x1, x2, and x3
of 9

Fig. 1. Response surface plot of oil yield RBO at a fixed extractiontime of 5 h.
F. Mas’ud et al.: OCL 2019, 26, 16
still appear in the model because the Design Expert 10 softwarework system used was hierarchical, so that if the quadraticeffect is significant then the linear effect will also appear in themodel even though the linear effect is not significant based onthe ANOVA results. The lack-of-fit F-value of 2.90 implies thelack-of-fit is not significant relative to the pure error. Thisindicates that the model is suitable to describe the effect of aparameter observed on g-oryzanol and that the developedmodel is adequate for predicting the response.
In this study obtained a g-oryzanol of 783.65mg.L�1.According to Arab et al. (2011), RBO contains about 0.9–2.9%of g-oryzanol, 1.5 to 2.9% according to Krishna et al. (2001),119.75–281.95mg.g�1 oil according to Sukanya et al. (2017),3.33 g.100g�1 according to Al-Okbi et al. (2014), even up to3000mg.kg�1 according to Shin et al. (1997). g-oryzanolextracted with 3:2 chloroform: methanol mixture yielding23.7–43.0mg.g�1 in the crude RBO (Azrina et al., 2008).According to Iqbal et al. (2005), the exact composition ofg-oryzanol depends on the rice cultivars. Furthermore,according to Butsat and Siriamornpun, (2010), that the contentof g-oryzanol in rice affected by the variety and growingconditions, as the antioxidant component will responddifferently to environmental changes.
The effect of different solvent concentrations can producedifferent yields have been also explained by Cacace andMazza(2003), that the change in concentration in the solvent willmodify the physical properties of the solvent such as density,dynamic viscosity, and dielectric constant. The solubility of thecompound will also be modified by changes in solventconcentration, and this can affect yield. According to Japon-Lujan et al. (2006), 80% aqueous ethanol (v/v) was theoptimum solvent for extraction of the targeted phenolics fromolive leaf and it can be used as a replacement of toxic solvents(methanol, diethyl ether, chloroform) to obtain bioactivephenols for human use. Further, according to Malik andBradford (2008), extraction with 80% methanol (v/v) wasreported as the most effective method for olive leavespolyphenols. Related to the amount of solvent, the ratio ofsolvents to solids used by researchers for extraction variesgreatly from 4 to 100, but the ratio between 10 and 50 is mostlyreported in the literature (Kiritsakis et al., 2010).
Page 6
3.2.3 Vitamin E concentration of RBO
The result of ANOVA for response surface reducedquadratic model of vitamin E showed that the model F-value of10.86 implies the model is significant. Values of Prob>F of0.0002 (less than 0.05) indicate model terms are significant. Inthis case, the linear terms of extraction time (x1), the linearterms of ethanol concentration (x2), the quadratic term ofextraction time (x1
2), and the quadratic term of ethanolconcentration (x2
2). Values greater than 0.1000 indicate themodel terms are not significant, so that the linear term ofethanol volume (x3), the quadratic term of ethanol volume(x3
2), the interaction between extraction time and ethanolconcentration (x1x2), the interaction between extraction timeand ethanol volume (x1x3), and the interaction between ethanolconcentration and ethanol volume (x2x3) did not give anysignificant contribution on vitamin E concentration. The lack-of-fit F-value of 2.26 implies the lack-of-fit is not significantrelative to the pure error, this indicates that the model issuitable to describe the effect of variable observed for thevitamin E and that the developed model is adequate forpredicting the response.
In this study obtained a vitamin E of 127.01mg.L�1.According to Xu et al. (2007), RBO contains 0.37–1.84mg.g�1 oil, 170–218mg.g�1 according to Schramm et al. (2007)and 665mg.g�1 according to Al-Okbi et al. (2014). Short-chain alcohols, especially ethanol and isopropanol, have beenproposed as alternative extraction solvents due to their greatersafety. Alcohols tend to extract more non-glyceride materialsthan n-hexane, due to their greater polarity. Typically, alcohol-extracted oils contain more phosphatides and unsaponifiablecompounds (Lusas et al., 1991). Further, Hu et al. (1996)reported that the average amount of vitamin E of RBO withisopropanol extraction was greater than that with hexaneextraction and related to the amount of solvent, an increase inisopropanol-to-bran ratio (w/w) from 2:1 to 3:1 extracted 9.4%more crude RBO that contained 10% more vitamin E whichexplains that the amount of solvent affects the extraction ofvitamin E. They also reported that the extraction time did nothave a significant effect on the amount of RBO or vitamin Eextracted.
3.3 Interpretation of response surface and contourplots
Based on the fitted model, the response surface and contourplots were generated by the model for extraction of oil yield,g-oryzanol, and vitamin E of RBO as a response. In order togain a better understanding of this study, related to the effect ofobserved variables on the response, then the predicted modelsare presented as the 3D plot (Figs. 1–3, respectively).Response surface plot is a representation of the surface plotin 3-D space as the plot determining optimum operatingconditions reaching maximum from the best-fitted model.These plots are obtained depicting two variables withinexperimental range and keeping the third variable at a constantlevel. According to Bezerra et al. (2008), a two-dimensionalrepresentation of a three-dimensional plot can be explained. Ifthere are three or more variables, the plot visualization ispossible only if one or more variables are set to a constantvalue.
of 9

Fig. 3. Response surface plot of vitamin E RBO at a fixed ethanolvolume of 600mL.
Fig. 2. Response surface plot of g-oryzanol RBO at a fixed ethanolvolume of 600mL.
F. Mas’ud et al.: OCL 2019, 26, 16
Figure 1 shows a 3D plot corresponding to the effect of x2and x3 on oil yield at the fixed of x1 (5 h). The effect of x3 isstronger than the effect of x2 on increasing the oil yield. It isevident in the coefficient variable of x2 and x3, wherecoefficient variable of x3> x2, and it is evident in thecoefficient estimate of the ANOVA, where the coefficientvariable in term of actual factor of x3 (0.98) is higher thanx2 (0.52), while the effect of x1 is not significant inincreasing the yield of the RBO, the estimated coefficient ofx1 is 0.14.
The plot that discloses the effects of x1 and x2 onincreasing g-oryzanol of RBO at a fixed of x3 (600mL) isshown in Figure 2. It can be seen that the g-oryzanol had amaximum point. The combination of variables observed is aneffect on increasing the g-oryzanol of RBO. At x3 constant(600mL), the influence of x2 is stronger than the effect of x1on increased of the g-oryzanol. It is evident in the 3D plot thatthe curve at x2 is more convex than the curve at x1, meaningthat a small change in x2 has greatly affected the acquisition ofg-oryzanol.
The 3D plot corresponding to explain the effect of x1 and x2on the vitamin E at a fixed of x3 (600mL) is shown in Figure 3.It is showed that the vitamin E had a maximum point. x1 and x2were effects on increasing the vitamin E. At x3 constant(600mL), the effect of x1 is very strong compared to the effectof x2 on the acquisition of vitamin E. It can also be proved fromthe coefficients of x1 and x2 in equation (5), where the value ofcoefficient x1> x2.
3.4 Interpretation of the optimum conditions
Based on the optimization solution generated from theDesign Expert 10 software that the optimum of x1, x2, and x3 toobtain the maximum of oil yield, g-oryzanol, and vitamin E ofRBO can be achieved at x1 of 5.30 h, x2 of 89.21%, and x3 of686.66mL. It can be explained that an increase x1 of 4 h to5.30 h and x2 of 76% to 89.21% (at fixed x3 of 600mL) causean increase in the oil yield, g-oryzanol, and vitamin E of RBO.
Page 7
The addition of x1 of 5.30 h up to 6 h and addition x2 of 89.21%up to 98% did not cause an increase in oil yield, g-oryzanol,and vitamin E of RBO.
The same explanation at fixed x1 of 5 h, an increase of x2 of76% to 89.21%, and x3 of 500mL to 686.66mL cause anincrease in the oil yield, g-oryzanol, and vitamin E of RBO.Further, increasing x2 of 89.21% up to 96%, and addition x3 of686.66mL up to 700mL did not cause an increase in the oilyield, g-oryzanol, and vitamin E of RBO. The samephenomenon at fixed x2 of 86%, an addition of x1 of 4 h to5.30 h, and x3 of 500mL up to 686.66mL cause an increase inthe oil yield, g-oryzanol, and vitamin E of RBO. The additionof x1 of 5.30 h up to 6 h and addition x2 of 89.21% up to 98%did not cause an increase in the oil yield, g-oryzanol, andvitamin E of RBO.
3.5 Verification model
An optimization model of RBO extraction by macerationmethod with stirring has been developed. The laboratory scalefor verification of the model has been carried out by conductingtriplicate experiments using the recommended value ofvariables from the software. The result showed that theaverage oil yield, g-oryzanol, and vitamin E were13.91%±0.44, 775.36 ± 31.38, and 126.71 ± 0.61mg.L�1,respectively. The RBO produced in the verification processshowed that the average value of the oil yield, g-oryzanol, andvitamin E was close to the predicted values (14.47%,783.65mg.L�1, and 127.01mg.L�1, respectively). This indi-cates that the model developed is quite valid in theirpredictions.
4 Conclusions
RBO extraction use ethanol by maceration methodaccompanied by stirring is very promising to be applied inthe industry, as an effort to implement the concept of greensolvents that are safe for consumers and the environment. The
of 9

F. Mas’ud et al.: OCL 2019, 26, 16
effect of extraction time, ethanol concentration, and ethanolvolume on the oil yield, g-oryzanol, and vitamin E of RBO hasbeen evaluated. Ethanol can be used to extract RBO withoutinvolving heating and proven to be able to provide satisfactoryresults. The optimization of the extraction process has beendeveloped and verified at the laboratory scale with sufficientresults. Predictive values produced by a model that approachesthe actual value have proven that the model developed is quitevalid and feasible to be applied in the RBO extraction process.
Acknowledgments. The authors would like to thank the HigherEducation Ministry of Indonesia (DIKTI) and Department ofChemical Engineering, Politeknik Negeri Ujung Pandang,Makassar, Indonesia.
Conflicts of interest. The authors declare that they have noconflicts of interest in relation to this article.
References
Al-Okbi SY, Ammar NM, Mohamed DA, et al. 2014. Egyptian ricebran oil: Chemical analysis of the main phytochemicals. Riv ItalSostanze Gr 91: 47–58.
Amiri H, Nabizadeh R, Martinez SS, et al. 2018. Response surfacemethodology modeling to improve degradation of Chlorpyrifos inagriculture runoff using TiO2 solar photocatalytic in a racewaypond reactor. Ecotoxicol Environ Saf 147: 919–925. DOI:10.1016/j.ecoenv.2017.09.062.
Anwar F, Tabreez A, Zahid M. 2005. Methodical characterization ofrice (Oryza sativa) bran oil from Pakistan. Grasas Aceites 56Fasc. 2: 125–134.
Arab F, Alemzadeh I, Maghsoudi V. 2011. Determination ofantioxidant component and activity of rice bran extract. ScientiaIranica 18(6): 1402–1406. DOI: 10.1016/j.scient.2011.09.014.
AwadOI,MamatR,AliOM,etal. 2017.Response surfacemethodology(RSM) based multi-objective optimization of fusel oil-gasolineblends at different water content in SI engine. Energy ConversManag 150: 222–241. DOI: 10.1016/j.enconman.2017.07.047.
Azrina A, Maznah I, Azizah AH. 2008. Extraction and determinationof oryzanol in rice bran of mixed herbarium UKMB; AZ 6807:MR 185, AZ 6808: MR 211, A Z6809: MR 29. ASEAN Food J 15(1): 89–96.
Banga J, Tripathi CKM. 2009. Response surface methodology foroptimization of medium components in submerged culture ofAspergillus flavus for enhanced heparinase production. Lett ApplMicrobiol 49: 204–209. DOI: 10.1111/j.1472-765X.2009.02640.x.
Bas D, Boyaci IH. 2007. Modelling and optimization I: Usability ofresponse surface methodology. J Food Eng 78: 836–845. DOI:10.1016/j.jfoodeng.2005.11.024.
Bauernfeind JC, Desai ID. 1977. The tocopherol content of food andinfluencing factors. Crit Rev Food Sci Nutr 8: 337–382. DOI:10.1080/10408397709527226.
Baümler ER, Carrín ME, Carelli AA. 2016. Extraction of sunfloweroil using ethanol as solvent. J Food Eng 178: 190–197. DOI:10.1016/j.jfoodeng.2016.01.020.
Bessa LCBA, Ferreira MC, Rodrigues CEC, Batista EAC, MeirellesAJA. 2017. Simulation and process design of continuouscountercurrent ethanolic extraction of rice bran oil. J FoodEng DOI: 10.1016/j.jfoodeng.2017.01.019.
Bezerra MA, Santelli RE, Oliveira EP, Villar LS, Escaleira LA. 2008.Response surface methodology (RSM) as a tool for optimizationin analytical chemistry. Talanta 76(5): 965–977. DOI: 10.1016/j.talanta.2008.05.019.
Page 8
Butsat S, Siriamornpun S. 2010. Antioxidant capacities and phenoliccompounds of the husk, bran and endosperm of Thai rice. FoodChem 119: 606–613. DOI: 10.1016/j.foodchem.2009.07.001.
Cacace JE, Mazza G. 2003. Optimization of extraction ofanthocyanins from black currants with aqueous ethanol. J FoodSci 68(1): 240–248.
Chan YH, Yusup S, Quitain AT, Uemura Y, Loh SK. 2017.Fractionation of pyrolysis oil via supercritical carbon dioxideextraction: Optimization study using response surface methodol-ogy (RSM). Biomass Bioenergy 107: 155–163. DOI: 10.1016/j.biombioe.2017.10.005.
Chemat F, Vian MA, Cravotto G. 2012. Green extraction of naturalproducts: Concept and principles. Int J Mol Sci 13: 8615–8627.DOI: 10.3390/ijms13078615.
ChenMH,BergmanCJ. 2005.A rapidprocedure for analyzing rice brantocopherol, tocotrienol and gamma oryzanol contents. J FoodCompos Anal 18: 139–151. DOI: 10.1016/j.jfca.2003.09.004.
Chen Qi, Fung Ka Y, Lau Yeuk T, Ng Ka M, Lau David TW. 2016.Relationship between maceration and extraction yield in theproduction of Chinese herbal medicine. Food Bioprod Process.DOI: 10.1016/j.fbp.2016.02.005.
ChewKK, Ng SY, ThooYY, KhooMZ,WanAidaWM,HoCW. 2011.Effect of ethanol concentration, extraction time and extractiontemperatureon the recoveryofphenoliccompoundsandantioxidantcapacity of Centella asiatica extracts. Int Food Res J 18: 571–578.
Chirinos R, Rogez H, Campos D, Pedreschi R, Larondelle Y. 2007.Optimization of extraction conditions of antioxidant phenoliccompounds from mashua (Tropaeolum tuberosum Ruíz andPavón) tubers. Sep Purif Technol 55(2): 217–225.
Desai ID, Swann MA, Garcia Tavares ML, Dutra de Oliveira BS,Duarte FAM, Dutra de Oliveira JE. 1980. Vitamin E status ofagricultural migrant workers in Southern Brazil. Amer J Clin Nutr33: 2669–2673. DOI: 10.1093/ajcn/33.12.2669.
Elkhaleefa A, Shigidi I. 2015. Optimization of sesame oil extractionprocess conditions. Adv Chem Eng Sci 5: 305–310. DOI: 10.4236/aces.2015.53031.
Firestone D. (Ed.). 1999. Physical and chemical characteristics of oils,fats, and waxes. Washington, DC: AOCS Press, pp. 86–87.
Hu W, Wells JH, Tai-Sun S, Godber JS. 1996. Comparison ofisopropanol and hexane for extraction of vitamin E and oryzanoisfrom stabilized rice bran. JAOCS 73(12): 1653–1656. DOI:10.1007/BF02517967.
Iqbal S, Bhanger MI, Anwar F. 2005. Antioxidant properties andcomponents of some commercially available varieties of rice branin Pakistan. Food Chem 93: 265–272. DOI: 10.1016/j.foodchem.2004.09.024.
Imsanguan P, Roaysubtawee A, Borirak R, Pongamphai S, Douglas S,Douglas PL. 2008. Extraction of a-tocopherol and g-oryzanolfrom rice bran. Food Sci Technol 41: 1417–1424.
Japon-Lujan R, Luque-Rodriguez JM, DeCastro MDL. 2006.Multivariate optimisation of the microwave-assisted extractionof oleuropein and related biophenols from olive leaves. AnalBioanal Chem 385(4): 753–759.
Keshtegar B, Mert C, Kisi O. 2018. Comparison of four heuristicregression techniques in solar radiation modeling: Krigingmethod vs. RSM, MARS and M5 model tree. Renew SustainEnergy Rev 81: 330–341. DOI: 10.1016/j.rser.2017.07.054.
Kiritsakis K, Kontominas MG, Kontogiorgis C, Hadjipavlou-LitinaD,Moustakas A, Kiritsakis A. 2010. Composition and antioxidantactivity of olive leaf extracts from greek olive cultivars. J Am OilChem Soc 87(4): 369–376.
Krishna AGG, Khatoon S, Shielaa PM, Sarmandala CV, Indirab TN,Mishrac A. 2001. Effect of refining of crude rice bran oil on theretention of oryzanol in the refined oil. JAOCS 78(2): 127–131.
of 9

F. Mas’ud et al.: OCL 2019, 26, 16
Lerma-García MJ, Herrero-Martínez JM, Simó-Alfonso EF, Men-donça CRB, Ramis-Ramos G. 2009. Composition, industrialprocessing and applications of rice bran g-oryzanol. Food Chem115(2): 389–404. DOI: 10.1016/j.foodchem.2009.01.063.
Li L, Li X, Yan C, et al. 2014. Optimization of methyl orange removalfrom aqueous solution by response surface methodology usingspent tea leaves as an adsorbent. Front Environ Sci Eng 8: 496–502. DOI: 10.1007/s11783-013-0578-0.
Li Z, Smith KH, Stevens GW. 2016. The use of environmentallysustainable bio-derived solvents in solvent extraction applica-tions –A review, Chin J Chem Eng 24: 215–220. DOI: 10.1016/j.cjche.2015.07.021.
Lusas EW, Watkins LR, Koseoglu SS. 1991. Isopropyl alcohol to betested as solvent. Inform 2: 970–976.
Malik NSA, Bradford JM. 2008. Recovery and stability of oleuropeinand other phenolic compounds during extraction and processing ofolive (Olea europaea L.) leaves. J Food Agric Environ 6(2): 8–13.
Mas’ud F, Mahendradatta M, Amran L, Zainal Z. 2017. Optimizationof mango seed kernel oil extraction using response surfacemethodology. Oilseeds Fats Crops Lipids. Available from www.ocl-journal.org. DOI: 10.1051/ocl/2017041.
Mohammed BS, Khed VC, Nuruddin MF. 2018. Rubbercrete mixtureoptimization using response surface methodology. J Clean Prod171: 1605–1621. DOI: 10.1016/j.jclepro.2017.10.102.
Oliveira R, Oliveira V, Aracava KK, Rodrigues CEdC. 2012. Effectsof the extraction conditions on the yield and composition of ricebran oil extracted with ethanol –A response surface approach.Food Bioprod Process 90(C1): 22–31. DOI: 10.1016/j.fbp.2011.01.004.
Oniya OO, Oyelade JO, Ogunkunle O, Idowu DO. 2017.Optimization of solvent extraction of oil from sandbox kernels(Hura Crepitans L.) by a response surface method. Energy PolicyRes 4(1): 36–43, DOI: 10.1080/23815639.2017.1324332.
Pichai E, Krit S. 2015. Optimization of solid-to-solvent ratio and timefor oil extraction process from spent coffee grounds usingresponse surface methodology. ARPN J Eng App Sci 10(16):7049–7052.
Péres VF, Maria JS, Melecchi IS, et al. 2006. Comparison of soxhlet,ultrasound-assisted and pressurized liquid extraction of terpenes,fatty acids and Vitamin E from Piper gaudichaudianum Kunth. JChromatogr A 1105(1-2 SPEC. ISS.): 115–118. DOI: 10.1016/j.chroma.2005.07.113.
Pourali O, Feridoun SA, Hiroyuki Y. 2009. Simultaneous rice bran oilstabilization and extraction using sub-critical water medium. J ofFood Eng 95: 510–516. DOI: 10.1016/j.jfoodeng.2009.06.014.
Rafi NM, Halim NRA, Amin AM, Sarbon NM. 2015. Responsesurface optimization of enzymatic hydrolysis conditions of leadtree (Leucaena leucocephala) seed hydrolyzate. Int Food Res J 22(3): 1015–1023.
Rodrigues CEC, Oliveira R. 2010. Response surface methodologyapplied to the analysis of rice bran oil extraction process withethanol. Int J Food Sci Technol 45(4): 813–820. DOI: 10.1111/j.1365-2621.2010.02202.x.
Rogers EJ, Rice SM, Nicolosi RJ, Carpenter DR, McClelland CA,Romanczyk LJ Jr. 1993. Identification and quantitation of g-oryzanol components and simultaneous assessment of tocols in ricebran oil. JAOCS 70(3): 301–307.
Page 9
Sani I. 2014. Soxhlet extraction and physicochemical characterizationof Mangifera indica L. Seed kernel oil. Res Rev: J Food DairyTech 2(1): 20–24.
Saxena DK, Sharma SK, Sambi SS. 2011. Comparative extraction ofcottonseed oil by n-hexane and ethanol. ARPN J Eng App Sci 6(1):84–89.
SchrammRC, AliciaM, Na H,Marybeth L. 2007. Fractionation of therice bran layer and quantification of vitamin E, oryzanol, protein,and rice bran saccharide. J Biol Eng 1(1): 9. DOI: 10.1186/1754-1611-1-9.
Seema P. 2015. Cereal bran fortified-functional foods for obesity anddiabetes management: Triumphs, hurdles and possibilities. JFunct Foods 14: 255–269.
Shin T, Godber JS, Martin DE, Wells JH. 1997. Hydrolitic stabilityand changes in E vitamers and oryzanol of extruded rice branduring storage. J Food Sci 62: 704–708.
Singh V, Belova L, Singh B, Sharma YC. 2018. Biodiesel productionusing a novel heterogeneous catalyst, magnesium zirconate(Mg2Zr5O12): Process optimization through response surfacemethodology (RSM). Energy Convers Manag 174: 198–207.DOI: 10.1016/j.enconman.2018.08.029.
Soundararajan R, Ramesh A, Mohanraj N, Parthasarathi N. 2016. Aninvestigation of material removal rate and surface roughness ofsqueeze casted A413 alloy on WEDM by multi responseoptimization using RSM. J Alloys Compd 685: 533–545. DOI:10.1016/j.jallcom.2016.05.292.
Sukanya M, Aikkarach K, Khongsak S, Riantong S. 2017.Physicochemical and antioxidant properties of rice bran oilsproduced from colored rice using different extraction methods. JOleo Sci 66(6): 565–572. DOI: 10.5650/jos.ess17014.
Tan YH, Abdullah MO, Hipolito CN, Syuhada N, Zauzi A. 2017.Application of RSM and Taguchi methods for optimizing thetransesterification of waste cooking oil catalyzed by solid ostrichand chicken-eggshell derived CaO. Renewable Energy 114: 437–447. DOI: 10.1016/j.renene.2017.07.024.
Tekin K, Hao N, Karagoz S, Ragauskas AJ. 2018. Ethanol: Apromising green solvent for the deconstruction of lignocellulose.ChemSusChem. DOI: 10.1002/cssc.201801291.
Tiwari U, Cummins E. 2009. Nutritional importance and effect ofprocessing on tocols in cereals. Trends Food Sci Technol 20: 511–520. DOI: 10.1016/j.tifs.2009.06.001.
Xu Z, Godber JS. 2001. Comparison of supercritical fluid and solventextraction methods in extracting gamma-oryzanol from rice bran.J Am Oil Chem Soc 77: 1127–1131. DOI: 10.1007/s11746-000-0087-4.
Xu Z, Hua N, Godber JS. 2001. Antioxidant activity of tocopherols,tocotrienols, and gamma oryzanol components from rice branagainst cholesterol oxidation accelerated by 2, 2’-Azobis (2-methylpropionamidine) dihydrochloride. J Agr Food Chem 49:2077–2081. DOI: 10.1021/jf0012852.
Xu YX, Hanna MA, Josiah SJ. 2007. Hybrid hazelnut oil character-istics and its potential oleochemical application. Ind Crops Prod26(1): 69–76. DOI: 10.1016/j.indcrop.2007.01.009.
Yolmeh M, Habibi Najafi MB, Farhoosh R. 2014. Optimisation ofultrasound-assisted extraction of natural pigment from annattoseeds by response surface methodology (RSM). J Food Chem155: 319–324. DOI: 10.1016/j.foodchem.2014.01.059.
Cite this article as: Mas’ud F, Fajar, Bangngalino H, Indriati S, Todingbua A, Suhardi, Sayuti M. 2019. Model development to enhance thesolvent extraction of rice bran oil. OCL 26: 16.
of 9