Model Construction of Material Distribution System Based ...
35
Model Construction of Material Distribution System Based on Digital Twin Yunrui Wang ( [email protected] ) Xi'an University of Science and Technology Ziqiang Jiang Xi'an University of Science and Technology Wu Yue Xi'an University of Science and Technology Research Article Keywords: Digital twin, full cycle material distribution, LSTM prediction, route optimization Posted Date: November 1st, 2021 DOI: https://doi.org/10.21203/rs.3.rs-1018310/v1 License: This work is licensed under a Creative Commons Attribution 4.0 International License. Read Full License
Transcript of Model Construction of Material Distribution System Based ...

Model Construction of Material Distribution SystemBased on Digital TwinYunrui Wang ( [email protected] )
Xi'an University of Science and TechnologyZiqiang Jiang
Xi'an University of Science and TechnologyWu Yue
Xi'an University of Science and Technology
Research Article
Keywords: Digital twin, full cycle material distribution, LSTM prediction, route optimization
Posted Date: November 1st, 2021
DOI: https://doi.org/10.21203/rs.3.rs-1018310/v1
License: This work is licensed under a Creative Commons Attribution 4.0 International License. Read Full License

Model construction of material distribution system based on
digital twin
Yunrui Wang1. Ziqiang Jiang
1. Wu Yue
1
Corresponding author: Yunrui Wang E-mail: [email protected]
1School of Mechanical Engineering, Xi'an University of Science and Technology,
Xi'an, China,710054
Received: Accepted:
Abstract
Aiming at the problems of poor periodicity of workshop material distribution,
difficult prediction of station material demand time node and redundant distribution
route, this paper proposes a model construction method of material distribution
system based on digital twin. Build a material distribution control mode based on
digital twin, and establish a full cycle material distribution mechanism on this basis to
comprehensively optimize the distribution cycle from the material preparation stage,
dynamic replenishment stage and data transmission stage of adjacent distribution
cycles. Build the digital twin model of material distribution system, establish the
material demand time node prediction operation mechanism based on LSTM,
accurately predict the station material demand time node, establish the material
distribution route optimization model with the lowest total cost, and optimize the
AGV route. Finally, it is applied to the asynchronous card line workshop of A
enterprise to verify the effectiveness of this method.
Key words: Digital twin, full cycle material distribution, LSTM prediction, route
optimization
0 Introduction
Material distribution in manufacturing industry refers to the supply and
distribution of raw materials and parts by upstream suppliers to manufacturing
enterprises, the distribution of raw materials at each station in the enterprise's
production workshop, and the sales and distribution of products to customers by the
company [1]. When the material distribution system (Material Distribution System,

MDS) guides the actual material distribution in the workshop, the external of the
workshop will be affected by the urgent order insertion of customers, and the internal
of the workshop will be affected by personnel, equipment, materials, environment and
other factors, such as equipment failure, personnel transfer, route blockage, etc.,
disturbing the material demand time node of the station. As a result, there is no
orderly connection between distribution cycles, resulting in line material
accumulation or shortage.
In order to solve the problem that it is difficult to determine the station material
demand time node, Zhang Lianchao et al. proposed a material demand time prediction
method based on grey theory to effectively reduce the error caused by worker
differences [2]. Sheng Xia et al. proposed a method for predicting the completion time
of rocket assembly based on trestle automatic encoder. This method can effectively
improve the prediction accuracy by using the supervised learning process and
parameter optimization process[3]. Niek tax et al. established a consistent model for
predicting process monitoring tasks based on LSTM neural network, which proved
that LSTM neural network has higher accuracy in time series prediction[4]. Xue Yan
et al. Used LSTM deep neural network to model and predict Shanghai financial
transaction data. Compared with BP neural network and traditional RNN neural
network, it is proved that LSTM deep neural network can effectively predict stock
market time series[5].
For the research of material distribution route, Chai, H et al. designed a
two-stage multi-objective optimization algorithm for the whole container logistics
distribution path planning of dangerous goods. This method can obtain the Pareto
optimal iteration faster for the small-scale path problem[6]. Tang, s designed an
improved hybrid algorithm based on Hopfield neural network and SA algorithm to
improve the optimization and robustness of the algorithm. Sun[7]. YX et al. proposed
a new adaptive genetic algorithm, which improves the local search ability through
adaptive mutation, and can better solve the transportation path problem in
distribution[8]. Jiang Zengqiang et al. designed a material distribution strategy based
on dynamic cycle based on the distribution cost expectation model in uncertain

environment, and established an optimization model aiming at the minimum
distribution cost and maximum load factor, with an overall optimization range of
40%[9]. Huang et al. emphasized the real-time data-driven logistics optimization
method, and established a mathematical model with fuzzy time window based on the
real-time manufacturing data collected by the Internet of things[10].
Reviewing the above-mentioned literature, certain research progress has been
made in the prediction of the time node of the material demand at the station and the
optimization of the material distribution path. However, the existing research does not
have a clear phase division for the material distribution cycle, and the established
prediction models are mostly static predictions, which cannot be dynamically
predicted with the workshop production, which has certain limitations. When
distributing materials, it only focuses on the distribution tasks in a single distribution
cycle, ignoring the relevant production data generated in the completed distribution
cycle, resulting in data waste and partial distortion of the distribution model, and it is
impossible to realize the closed-loop control of workshop dynamic
distribution.Therefore, new methods are urgently needed to establish a full-cycle
material distribution mechanism, clarify the distribution tasks of each stage in the
material distribution cycle, realize dynamic prediction and control during the
replenishment process, and effective storage and transmission of workshop production
data.
The emergence of digital twin technology provides an effective way to solve this
problem. Digital twin is not a separate technology, it is a cross-fusion of multiple
enabling technologies. It maps the data information in the physical entity to the
operating environment of the twin model, and then analyzes, optimizes and revises the
twin model, and then returns the data to the physical entity, thereby achieving a
two-way relationship synchronous optimization between the physical entity and the
twin model in terms of function and performance. Tao Fei put forward the
construction criteria of digital twin model, established a set of digital twin model
construction theoretical system, and provided theoretical support for the application
and implementation of digital twin technology. Aiming at the coupling problems such

as unreasonable production line layout and inaccurate logistics distribution[11], Guo
het al. proposed a flexible cell manufacturing method based on digital twin,
continuously simulated and optimized the twin model, and improved the line balance
rate and per capita production capacity[12]. Wu et al. combined digital twin
technology with planning and scheduling to implement control over uncertain
factors[13]. To sum up, the introduction of digital twin technology can solve the
problems of material demand time node disturbance, material route redundancy, and
production data loss caused by the uncertainty of the workshop, and comprehensively
optimize the material distribution cycle due to the characteristics of virtual and real
integration and mutual driving.
Firstly, the paper integrates the digital twin technology with the material
distribution system to form a closed-loop control mode of the material distribution
system. On this basis, the full cycle material distribution mechanism is established,
including the material preparation stage before production, the real-time dynamic
replenishment stage in production and the data transmission stage of adjacent
distribution cycles. In order to ensure the smooth operation of the control mode of the
material distribution system and the orderly connection of each distribution cycle in
the replenishment stage, build the digital twin model of the material distribution
system, establish the material demand time node prediction model and material
distribution route optimization model based on LSTM, and formulate the material
distribution scheme with the lowest total distribution cost in line with the actual
production of the workshop.
1. Integration of digital twin and material distribution system
1.1 Establish control mode of material distribution system
In order to ensure that the material distribution scheme accurately guides the
actual material distribution process, the multi-scale material distribution system
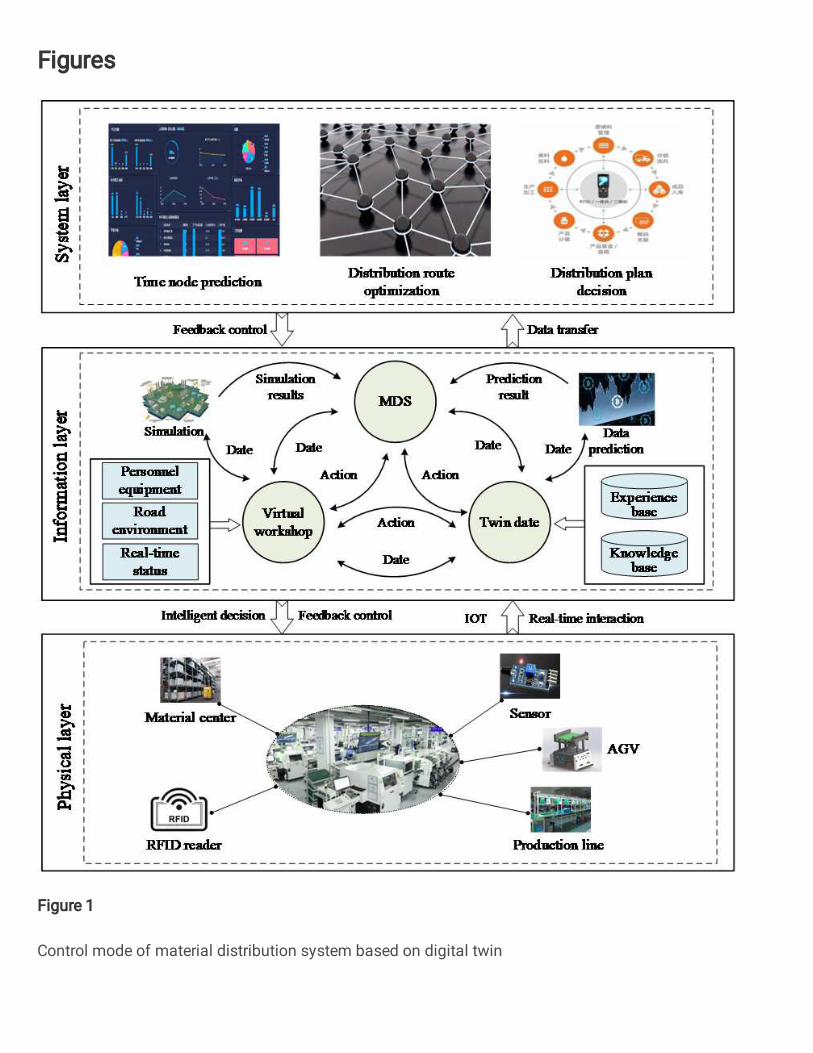
control mode shown in Figure 1 is established.

The whole control mode is divided into three layers. The first is the real-time
data acquisition of the physical layer. The sensor network composed of multiple
sensors can real-time collect the production data generated by the material center,
personnel, production line, AGV, RFID reader, etc. and the road environment data of
the workshop, and transmit it to the information layer through the data interface.The
second is the data-driven cycle of the information layer. The collected real-time data
and workshop historical data are stored in the experience base of twin data, and the
status and pose of production equipment are stored in the knowledge base. According
to the collected real-time data, the geometric model, behavior model and rule model
in the virtual workshop are updated to realize the real-time synchronous update and
optimization of the virtual workshop and the physical layer. MDS determines the
material demand node according to the simulation results and prediction results,
formulates the material distribution scheme, feeds it back to the virtual workshop, and
promotes the update of twin data. Thus, a data-driven cycle of virtual workshop, twin
data and MDS is formed.The last is the encapsulation of system layer functions. It is
mainly reflected in the accurate prediction of station material demand time node, the
optimization of material distribution route and the real-time decision-making of
distribution scheme.
In order to further divide the distribution tasks in the distribution cycle, optimize
the distribution cycle and improve the distribution efficiency, a full cycle material
distribution mechanism is established. The whole cycle material distribution mode is
divided into three stages: material preparation before production, dynamic
replenishment during production and data transfer in adjacent distribution cycles. The
specific description is as follows:
(1)Material preparation stage before production.
The material preparation stage before production is also called the material
laying stage. The first batch of materials required by the production station are
delivered to the site according to the production plan[14]. The detailed process is
shown in Figure 2.
After the daily production plan is released to the production management module
of MES, MES invokes the relevant BOM to calculate the daily production plan
according to the production data such as personnel, equipment and daily work hours
in the current workshop. WMS formulates the material distribution plan according to
the results of MES calculation, and prepares the first batch of materials meeting the
station requirements, which are distributed to each station by AGV trolley. The
real-time data generated by personnel, equipment, AGV and the first batch of
materials in the material preparation stage will be collected as twin data and stored in
the twin data platform.
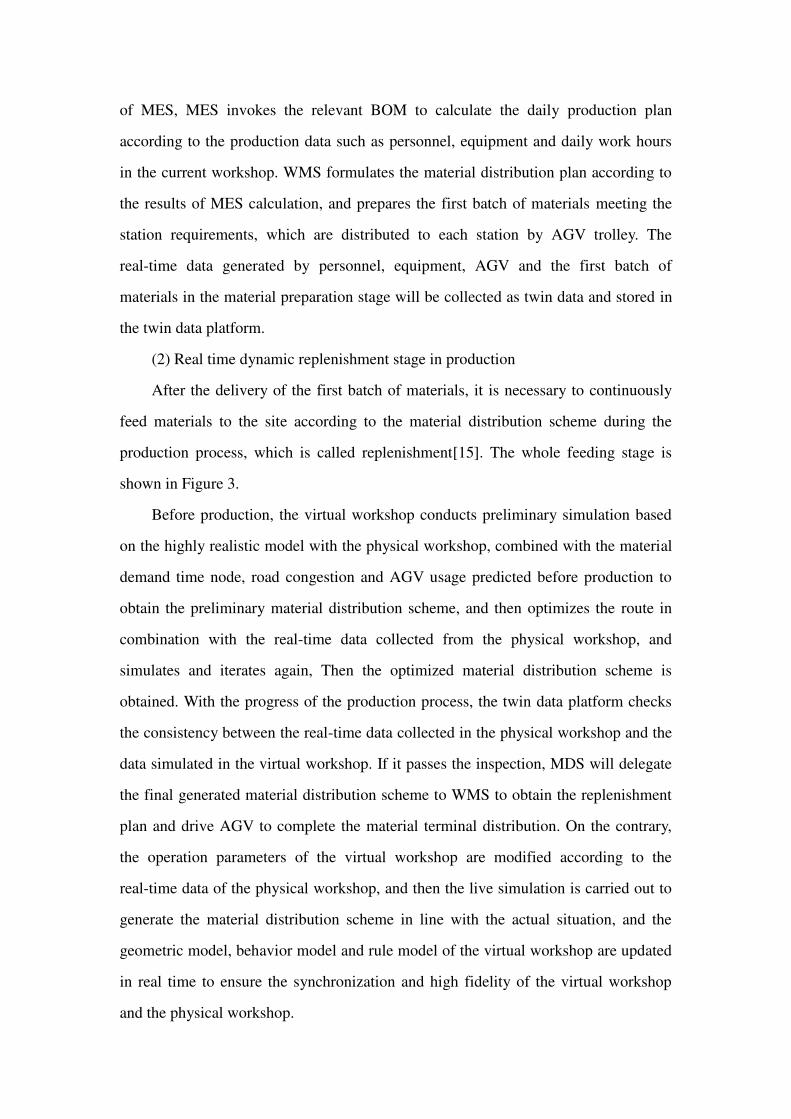
(2) Real time dynamic replenishment stage in production
After the delivery of the first batch of materials, it is necessary to continuously
feed materials to the site according to the material distribution scheme during the
production process, which is called replenishment[15]. The whole feeding stage is
shown in Figure 3.
Before production, the virtual workshop conducts preliminary simulation based
on the highly realistic model with the physical workshop, combined with the material
demand time node, road congestion and AGV usage predicted before production to
obtain the preliminary material distribution scheme, and then optimizes the route in
combination with the real-time data collected from the physical workshop, and
simulates and iterates again, Then the optimized material distribution scheme is
obtained. With the progress of the production process, the twin data platform checks
the consistency between the real-time data collected in the physical workshop and the
data simulated in the virtual workshop. If it passes the inspection, MDS will delegate
the final generated material distribution scheme to WMS to obtain the replenishment
plan and drive AGV to complete the material terminal distribution. On the contrary,
the operation parameters of the virtual workshop are modified according to the
real-time data of the physical workshop, and then the live simulation is carried out to
generate the material distribution scheme in line with the actual situation, and the
geometric model, behavior model and rule model of the virtual workshop are updated
in real time to ensure the synchronization and high fidelity of the virtual workshop
and the physical workshop.

(3) Data transmission of adjacent distribution cycles
When an AGV completes the replenishment task of the Nth distribution cycle
and returns to WMS, the distribution task of the current distribution cycle has been
completed, but the life cycle of a series of twin data generated in the distribution
activities of this distribution cycle does not end here. Instead, it is collected by sensors
all over the workshop in real time and passed to the twin data platform through the
data interface. After filtering and noise reduction processing, the useful data is passed
to the N+1th distribution cycle to complete the data transfer. For example, the absence
and leave of personnel in the Nth cycle, whether the health status of AGV is enough
to support it to complete the next distribution, whether there are equipment faults,
maintenance, shutdown and accumulation in the production line, the quantity of
materials remaining at each station and the degree of road congestion, etc., all the
above data can be used as the operation parameters of the N+1th cycle. The data
transfer process is shown in Figure 4.
The twin data can be used as the carrier in the adjacent distribution cycles to
realize the closed-loop transmission of material distribution data, solve the data
consistency problem between the virtual workshop and the physical workshop, realize
the virtual real interaction, generate the material distribution scheme in line with the
actual production, and guide the actual material distribution work.
1.2 Building a digital twin model of the material distribution system
The smooth operation of the control mode of the material distribution system
needs the support of the digital twin model of the material distribution system. The
whole twin model is built around the physical workshop. The twin model is mainly
composed of five modules: physical workshop, virtual workshop, twin data platform,
data prediction and MDS. The twin data platform module mainly includes the
real-time data of the physical workshop, the operation data of the virtual workshop
and the data consistency test. The data prediction module mainly refers to the
prediction of the station demand time node. The specific composition of the digital
twin model of the material distribution system is shown in Figure 5.

1.2.1 Physics workshop
The physical workshop is the sum of all physical entities, including personnel,
production lines, materials, AGV, road environment, etc[16]. The physical workshop
is the main carrier of all production activities and the cornerstone of the operation of
the digital twin model of the entire material distribution system. The workshop is
mainly divided into three levels, namely the unit level, the system level and the
complex system level.Unit layer refers to the smallest unit that can complete
production functions, including production station, AGV, etc; The system layer refers
to the level that can complete production tasks composed of various equipment. It is
the addition of production factors such as material warehouse, line side warehouse,
road environment and production line on the basis of the unit layer; The complex
system layer refers to the comprehensive control of the whole material distribution
process, the collection and recording of all aspects of material flow and information
flow, and the real-time interaction and feedback with the virtual space to ensure the
continuous and effective operation of production.
1.2.2 Virtual workshop
Virtual workshop is a digital workshop that uses three-dimensional simulation
modeling software (such as AutoCAD, SketchUp, 3ds max, Solidworks, etc.) to
describe the physical workshop in multi-dimensional detail on the computer[17]. It
can interact and feed back with the physical workshop in real time. It is an important
part of the complete operation of the whole twin model. Virtual workshop is the
digital image of the physical Workshop on the computer. It is also composed of unit
layer, system layer and complex system layer. The unit layer of the workshop mainly
loads the distribution tool model, including AGV trolley model, etc; After loading the
basic unit layer model, add relevant distribution constraints (such as the shortest total
distribution time, the shortest travel distance of AGV trolley, the smallest distribution
cost, etc.) to form a material distribution model to form a complete workshop system
layer; On this basis, coordinate and manage the information flow collected from the
physical workshop and the material flow of the storage system to form a complex
system layer.
1.2.3 Twin Data Platform
Twin data platform is a comprehensive management platform that stores the
physical data of the physical workshop, the digital information of the virtual
workshop and the derived data generated in the process of their interaction[18]. It can
not only collect and transfer the data, but also check the data consistency internally, so
as to support the material distribution system to make correct decisions. The physical
data of the physical workshop mainly includes the number of stations, geometric
parameters (such as shape, size, position, etc.) and status of production equipment. It
can be collected through the sensor network composed of sensors all over the physical
workshop, and then transmitted to the twin data platform through the data interface.
The digital information of the virtual workshop mainly includes the loaded equipment
model, material distribution model, etc., as well as the data generated by the
simulation, verification, evaluation and other activities based on the loaded model,
and a series of data generated by the interaction and mapping between the two
workshops at all levels. Through the integration of multi-level, multi-temporal and
spatial correlation data and historical information, an information physical big data
platform is formed to break the information islands in the physical workshop and
virtual workshop, and use the twin data as the link to drive the continuous and
efficient operation of virtual workshop simulation activities, so as to connect the
whole material distribution system and realize the sharing, interworking and
closed-loop flow of workshop information.
1.2.4 Data prediction
The data prediction module can directly call the relevant data of the twin data
platform, and then predict the uncertain factors of the workshop in combination with
the corresponding prediction model, such as equipment availability prediction,
production plan change prediction, station material demand time node prediction, etc.
The prediction of station material demand time node refers to the prediction from the
perspective of workers' processing history data, workers' proficiency and workers'
fatigue. Its purpose is to predict the accurate material demand time node and provide
the basis for the formulation of material distribution scheme.
1.2.5 MDS
The core function of MDS is to formulate a real-time material distribution
scheme in line with the actual production of the workshop according to the accurate
data provided by the twin data platform. In the material preparation stage before the
start of material distribution activities, a series of preparation activities need to be
carried out, such as material counting, BOM decomposition, distribution tool
preparation, etc. With the continuous progress of the production process and the
continuous interaction between the virtual and real workshops, the data analysis and
noise reduction processing are carried out for the prediction results of the material
demand time node, and then the material distribution path optimization model is
loaded to generate the material distribution scheme and complete the dynamic
replenishment stage. The real-time data generated in the distribution cycle is stored in
the twin data platform to facilitate the next distribution cycle.
2. Material demand time node forecast based on LSTM
The dynamic replenishment stage in the whole cycle material distribution is
inseparable from the accurate prediction of the material demand time node, and the
key factor determining the material demand time node is the material consumption
time of the station. The material consumption time of the station is affected by the
operation proficiency, fatigue and station characteristics of workers. Therefore, the
accurate prediction of the material consumption time of the station is the basis for the
prediction of the material demand time node. The prediction of material consumption
time belongs to a time series problem. Here, a material demand time node prediction
method based on LSTM (long short term memory) is proposed, and its operation
mechanism is shown in Figure 6.
After the production starts, the stations participating in the production are the
stations that need to be predicted. The historical material consumption time, worker
proficiency, fatigue and other data of the required predicted stations are obtained from
the twin data platform. On this basis, the modeling rules and constraints are called
from the knowledge base to establish the LSTM prediction model for each station.
After initialization, optimization and training, the model loads relevant data to predict

material consumption time, demand time node and demand time window, eliminates
abnormal values, generates prediction value sequence and transmits it to MDS. MDS
calls AGV usage, road environment and other data from the experience base of twin
data platform to formulate material distribution scheme to guide actual material
distribution, and the obtained distribution information is fed back to the experience
base of twin data platform for real-time update. If the AGV terminal distribution is
inconsistent with the station material demand time window when MDS guides the
actual material distribution, feed back the actual material demand time window to the
dynamic prediction module, adjust the LSTM prediction model and update the
knowledge base in real time.
2.1 Establish an LSTM neural network model
The long-term and short-term memory network (LSTM) is a variant of the
recurrent neural network (RNN). Therefore, the two have certain similarities in
structure, both of which contain the external circulation structure, while the LSTM
also has the internal circulation structure of memory cells[19]. The hidden layer of
LSTM includes forgetting gate, input gate, output gate and cell state, which can
ensure that the signal will not explode or disappear after multiple cycles, so that the
information can be transmitted completely. Its network structure is shown in Figure 7.
Where ct-1 and ct are the cell state of the previous time and the cell state of the current
time respectively, yt-1 and yt are the output of the previous time and the output of the
current time respectively, and xt is the input of the current time, σ is the sigmoid
activation function, tanh is the tanh activation function, ft, it and ot are the number of
sequences between [0,1] generated by the sigmoid activation function, and c*t is the
new cell state generated by the tanh activation function.
2.2 Material demand time node forecast
In the established LSTM neural network model, the worker's historical material
consumption time, daily working hours, fatigue and other related parameters can be
input to establish the worker's independent prediction model. The output result of the
model is the time when workers consume a single material, and the material demand
time node is the time point when workers consume materials to the safety stock limit.

The time period from this time point to the complete consumption of materials is the
station material demand time window, as shown in Figure 8.
AGV needs to respond as quickly as possible to all stations that issue material
requirements within the material demand time window [ai,bi], so it is necessary to
optimize the material distribution route of AGV to ensure that all stations that issue
material requirements can be met within the demand time window under the condition
of the lowest total distribution cost, so as to improve the efficiency of material
distribution.
3. Establish the optimization model of material distribution route with the lowest
total cost
The essence of the material distribution routing problem is the vehicle routing
problem with soft time window (VRPTW). The arrival of distribution vehicles earlier
than the time window will lead to material accumulation, and the arrival later than the
time window will lead to production line interruption. In order to ensure that there is
no biological material accumulation and interruption in the workshop production line,
the distribution vehicles should arrive within the specified time window.
3.1 Establish a soft time window
The soft time window means that the delivery vehicle is allowed to arrive within
a certain period of time before or after the station demand time window. When the
delivery vehicle arrives outside the specified time window, a corresponding penalty
fee will be incurred[20]. The penalty fee changes with time. The function can be set as
follows:
)(
)(
)(
)(
ii
e
il
iii
ii
e
ie
btbT
bta
ataT
tH
0
(1)
Function Description: H(t) is the time penalty function, ti represents the time
when the logistics vehicle arrives at the specified station i, ai represents the earliest
arrival time of the station i time window, bi represents the latest arrival time of the
station i time window, Te is the penalty when the distribution vehicle arrives at the

station ahead of the specified time window, and Tl is the penalty when the distribution
vehicle arrives behind the specified time window, ae
i and be
i are negatively and
positively correlated with time, respectively. When the logistics vehicle arrives within
the specified time window, the penalty number is 0. When the logistics vehicle arrives
earlier than the specified time window, the penalty number is Te *ae
i ,when the logistics
vehicle arrives later than the specified time window, the penalty number is Tl *be
i .
3.2 Establishment of multi-target VRPTW model
Set the relevant parameters of the established multi-objective VRPTW model:
the production workshop has 1 distribution center and N vehicles for distribution
activities. The maximum capacity of each vehicle is the same as M, and K stations
need to be distributed. Station 0 represents the distribution center, the demand of
station i is qi, and the starting and ending point of each distribution vehicle can only
be the distribution center, each station must be distributed and can only be distributed
by one vehicle. The demand time window of station i is [ai,bi]. The specific model is
as follows:
N
n
K
i
iinini ,btmax,tamaxminA1 1
00 (2)
ijn
K
i
K
j
N
n
ijxdminB
0 0 1
(3)
, Nn xx
K
j
nj
K
j
jn 1 1
0
1
0
(4)
NnMxq ijn
K
i
K
j
j ,1 0 0
(5)
, NnK x
K
0i
K
0j
ijn 1
(6)
Ky
N
n
K
i
ni 1 1
(7)
kyN
n
ni ......21i 11
,,
(8)

0
0
,btmaxb
,tamaxa
ii
e
i
ii
e
i
(9)
0
1ijnx (10)
0
1niy (11)
In the formula:
N ——Total number of distribution vehicles;
M ——Maximum capacity of distribution vehicles;
T ——A positive integer with a large value;
qj ——Demand of station j;
dij——Distance from station i to station j;
ai——The earliest time when the delivery vehicle arrives at station i;
bi——The latest arrival time of delivery vehicle at station i;
aei ——Time to arrive at station i in advance;
bei ——Time lag to station i;
tij——Travel time from station i to station j;
tin——The time when the delivery vehicle n arrives at station i;
yni——Identification function of whether station i is distributed by vehicle n;
x0jn——Distribution vehicle n from distribution center to station j;
xj0n——The distribution vehicle n returns to the distribution center from station j;
xijn——When the value of xijn is 1, it means that the distribution vehicle n travels
to station j after distribution station i, and the value of xijn in other cases is 0.
Formula (2) indicates that the difference between the delivery vehicle and the
time window is the smallest when it arrives at the corresponding station; Formula (3)
indicates that the total distance traveled by the distribution vehicle when performing
the distribution task is the shortest; Formula (4) indicates that all distribution vehicles
start from the distribution center and return to the distribution center after performing
the distribution task; Formula (5) indicates that the materials loaded by all distribution

vehicles cannot exceed the maximum capacity; Formula (6) indicates that the number
of distribution stations does not exceed the total number of stations; Formula (7)
indicates that each station should be distributed; Formula (8) indicates that each
station can only be distributed by one vehicle; Formula (9) indicates that the delivery
vehicle arrives earlier than the specified time window or later than the specified time
window, and can only be one of them.
3.3 Processing of multi-target VRPTW model
The two objectives in the VRPTW model can be expressed by the unified
dimension of cost, so the linear addition in the unified objective method is used to
transform the multi-objective function. The process of applying linear addition to
transform multi-objective VRPTW model is as follows:
Step 1: Analyze specific problems and get the multi-objective function to be
optimized. The multi-objective functions to be transformed in VRPTW model are
formulas (2) and (3):
Step 2: Analyze multi-objective functions, find out their commonalities, and give
certain coefficients to convert them into dimensional unified functions. In this
VRPTW model, through the analysis of the current situation of logistics distribution,
it can be seen that all the costs generated in distribution activities can be included by
the total distribution cost. For the objective function A, the penalty coefficient e is
given when the vehicle arrives at the station in advance, and the penalty coefficient l
is given when the vehicle lags behind; For the objective function B, it can be
transformed into the vehicle driving cost function in combination with the cost fn
required by the vehicle driving unit distance. In addition, the fixed cost C of vehicle
start-up should be added. The transformed multi-objective function is as follows:
N
n
K
i
iinini
/,btmaxl,tamaxeminA
1 1
00 (12)
ijn
K
i
K
j
N
n
ijn
/xdfminB
0 0 1
(13)
p*hC (14)
In the formula:
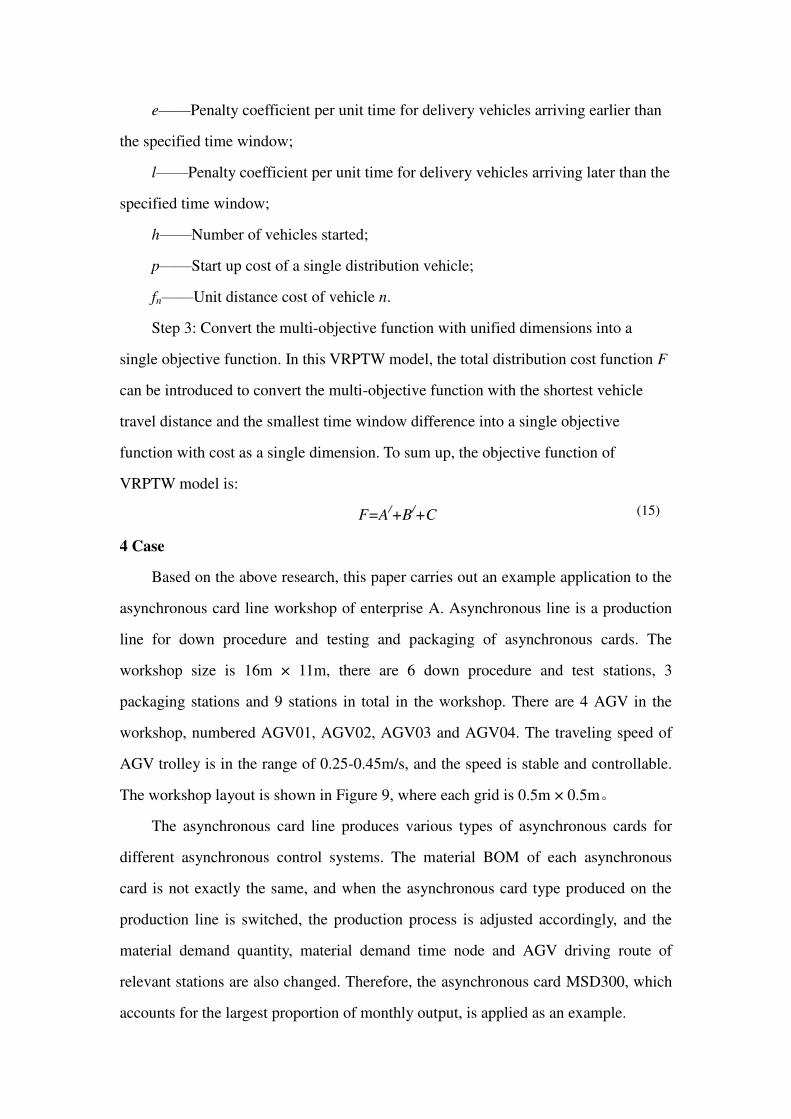
e——Penalty coefficient per unit time for delivery vehicles arriving earlier than
the specified time window;
l——Penalty coefficient per unit time for delivery vehicles arriving later than the
specified time window;
h——Number of vehicles started;
p——Start up cost of a single distribution vehicle;
fn——Unit distance cost of vehicle n.
Step 3: Convert the multi-objective function with unified dimensions into a
single objective function. In this VRPTW model, the total distribution cost function F
can be introduced to convert the multi-objective function with the shortest vehicle
travel distance and the smallest time window difference into a single objective
function with cost as a single dimension. To sum up, the objective function of
VRPTW model is:
F=A/+B
/+C (15)
4 Case
Based on the above research, this paper carries out an example application to the
asynchronous card line workshop of enterprise A. Asynchronous line is a production
line for down procedure and testing and packaging of asynchronous cards. The
workshop size is 16m × 11m, there are 6 down procedure and test stations, 3
packaging stations and 9 stations in total in the workshop. There are 4 AGV in the
workshop, numbered AGV01, AGV02, AGV03 and AGV04. The traveling speed of
AGV trolley is in the range of 0.25-0.45m/s, and the speed is stable and controllable.
The workshop layout is shown in Figure 9, where each grid is 0.5m × 0.5m。
The asynchronous card line produces various types of asynchronous cards for
different asynchronous control systems. The material BOM of each asynchronous
card is not exactly the same, and when the asynchronous card type produced on the
production line is switched, the production process is adjusted accordingly, and the
material demand quantity, material demand time node and AGV driving route of
relevant stations are also changed. Therefore, the asynchronous card MSD300, which
accounts for the largest proportion of monthly output, is applied as an example.

4.1 Asynchronous card line workshop material distribution operation
mechanism based on digital twins
Establish a material distribution operation mechanism based on digital twin for
asynchronous card line workshop, as shown in Figure 10.
The operation mechanism of material distribution in asynchronous card line
workshop based on digital twin can realize the real-time control of material
distribution process. The real-time data collected from the asynchronous line
workshop through the sensor network is stored in the experience base of the twin data
platform. The LSTM dynamic prediction module calls the LSTM prediction model in
the knowledge base for prediction, and the obtained results are transmitted upward to
the virtual space and downward to the twin data platform. The virtual workshop forms
a preliminary material distribution scheme through two-way interaction with the twin
data platform, and continuously simulates and optimizes the optimized material
distribution scheme, which is used as the basis to clearly divide the tasks of each stage
of the whole cycle material distribution. If the data consistency check is passed, the
asynchronous line workshop will guide the actual distribution according to the
material distribution scheme generated in the virtual workshop. If it fails, it will return
to the twin data platform to modify the relevant parameters of the virtual workshop
according to the real-time data of the asynchronous line workshop for live simulation.
4.2 LSTM-based material demand time node prediction
Take the down procedure and test station 1 as an example, retrieve the historical
data of station 1, and establish the LSTM material demand time node prediction
model for prediction. In the model, the sequence length is set as 50, the ratio of
training set to test set is 9:1, the actual operation time of station 1 is shown in Table 1,
and the prediction results are shown in Table 2.
The LSTM based material demand time node prediction method is compared
with the ordinary moving average method and Holt linear trend method. The
prediction results are shown in Figure 11 and the error comparison is shown in Figure
12 The general moving average method means that the historical data of station 1 are
translated and averaged item by item to predict; Holt linear trend method refers to

adding trend prediction equation on the basis of station 1 historical data.
As can be seen from Fig. 11 and Fig. 12, the prediction method based on LSTM
proposed in this paper is closer to the actual operation time than the ordinary moving
average method and Holt linear trend method in the prediction time scale, with higher
prediction accuracy and time series ductility, and the prediction average error rate is
4.01%, which can provide more accurate data prediction support for material
distribution and ensure the normal production of the workshop.
4.2 Establish a material distribution route optimization model
4.2.1 Establish material demand time window
Establish LSTM forecasting models for 9 stations of asynchronous card line to
forecast material demand time window. According to the relationship between the
material consumption time and the demand time window, the material demand time
window of each station is calculated and sorted as shown in Table 3:
According to the predicted station demand time window, station 2 sends the
material distribution demand first, the time point of station 2 sending the material
demand is 31min, and the latest delivery time is 53min. Within this demand time
window, stations 1, 3, 4, 5, 6, 7, 8 and 9 send the material distribution request at the
same time. In this distribution cycle, the 9 stations that send material requests are
reordered by 1-10, and the distribution center is represented by station 0. The location
coordinates, distribution quantity, demand time window, loading and unloading time
of the 9 stations are known, as shown in Table 4:
4.2.2 Determination and solution of VRPTW model parameters of asynchronous
card line
According to the actual situation of asynchronous line, the parameters in
VRPTW model are set reasonably. The specific settings are shown in Table 5:
After the model is established, relevant software is used to solve it. The obtained
AGV distribution route is shown in Figure 13. In the figure, the geometric center of
each station is taken as the AGV distribution end point, so the obtained distribution
route is the approximate route of AGV.

Sort out the results and AGV distribution route to obtain the complete route and
total cost of this material distribution, as shown in Table 6, in which the unit of each
cost is yuan.
Compare the material distribution schemes before and after optimization, and the
results are shown in Table 7.
For asynchronous card line workshop, the average prediction error rate of LSTM
prediction model is about 4.01%. Based on the analysis of material distribution route,
the results show that compared with before optimization, the number of vehicle starts
is reduced by 40%, the vehicle full load rate is increased by 36.68%, the total
distribution cost is reduced by 24.45%, and all stations are distributed.
5 Conclusion
This paper studies the application of digital twin technology in the process of
material distribution, and constructs the control mode of material distribution system
based on digital twin and the digital twin model of material distribution system. On
this basis, a three-stage full cycle material distribution mechanism based on material
preparation stage, dynamic replenishment stage and adjacent distribution cycle data
transmission is proposed to comprehensively optimize the material distribution cycle.
In the material preparation stage, MES and WMS are connected to realize the
distribution of the first batch of materials at the station; In the dynamic replenishment
stage, the material demand time node prediction operation mechanism based on
LSTM and the material distribution route optimization model with the lowest total
cost are established to realize the accurate prediction of station material demand time
node and the optimization of AGV distribution route; In the data transmission stage,
based on the twin data platform, the production data generated in the distribution
cycle are collected in real time, processed and stored effectively, and transmitted to
the next distribution cycle. Based on the real-time data, the continuous process of
material distribution is promoted. Through the example of asynchronous card line
workshop, the effectiveness of the proposed method is verified, which provides a
practical basis for realizing the material distribution system based on digital twin.
However, the full cycle material distribution mechanism based on digital twin
technology needs to be further subdivided. In the future, further research will be made
on the dynamic replenishment stage in order to improve the distribution mechanism
and promote the implementation and application of digital twin technology.
Declarations:
Ethical Approval
All authors declare that this article does not have any academic ethics issues and
strictly follows the journal submission rules
Consent to Participate
All authors agree to participate in the research work of this paper and publish it in the
International Journal of Advanced Manufacturing Technology
Consent to Publish
All authors agree to publish this article in the International Journal of Advanced
Manufacturing Technology
Funding information
This work was supported by the [General program of National Natural Science
Foundation of China] under Grant [number 52074210].
Conflict of interest
The author(s) declare no potential conflicts of interest with respect to the research,
authorship and/or publication of this article.
Acknowledgements
The authors wish to acknowledge support from Staff of Industrial Engineering Project
Team, School of Mechanical Engineering, Xi'an University of Science and
Technology
Authors’ contributions
All authors contributed equally to the generation and analysis of experimental data,
and the development of the manuscript.
Reference
[1] Zheng, Y, Qiu, S, Shen, F, & He, C. (2020). RFID-based material delivery method
for mixed-model automobile assembly. Computers & Industrial Engineering, 139,

106023.https://doi.org/10.1016/j.cie.2019.106023.
[2] Zhang Lianchao, Liu Weiran, Cheng Jiangfeng, Tao Fei, Meng Shaohua &
Chen Changyu. (2020). Just in time material distribution method in digital twin
workshop of satellite assembly. Computer integrated manufacturing system (11),
2897-2914. doi: 10.13196/j.cims.2020.11.001.
[3] Sheng Xia, Zhao Xinming, Zhang Peng, Zhang Jie, Cheng Hui, Liu Siqi &
Zhang Chunyu. (2019). Prediction of completion time of rocket assembly based on
trestle automatic encoder. Computer integrated manufacturing system (11),
2720-2730. doi: 10.13196/j.cims.2019.11.003.
[4] Tax, N, Verenich, I, La Rosa, M, & Dumas, M. (2017, June). Predictive business
process monitoring with LSTM neural networks. In International Conference on
Advanced Information Systems Engineering (pp. 477-492). Springer, Cham.
https://doi.org/10.1007/978-3-319-59536-8_30.
[5] Yan, X, Weihan, W, & Chang, M. (2021). Research on financial assets transaction
prediction model based on LSTM neural network. Neural Computing and
Applications, 33(1), 257-270.https://doi.org/10.1007/s00521-020-04992-7.
[6] Chai, H, He, R., Ma, C., Dai, C., & Zhou, K. (2017). Path planning and vehicle
scheduling optimization for logistic distribution of hazardous materials in full
container load. Discrete Dynamics in Nature and Society, 2017.
https://doi.org/10.1155/2017/9685125.
[7] Tang, S, Zhao, H, Wang, Z, Zhu, Y, Hou, D, & Wang, H. (2021). Analysis of the
material distribution system of wise information technology of 120 under deep
learning. The Journal of Supercomputing, 1-15.
https://doi.org/10.1007/s11227-021-03646-2.
[8]Sun, Y, Geng, N, Gong, S, & Yang, Y. (2020). Research on improved genetic
algorithm in path optimization of aviation logistics distribution center. Journal of
Intelligent & Fuzzy Systems, 38(1), 29-37.https://doi.org/10.3233/JIFS-179377.
[9]Jiang Zengqiang, Jin Yang, Liang Junyi & E Mingcheng. (2017). Dynamic
material distribution strategy of mixed model assembly workshop under uncertain
environment. Computer integrated manufacturing system (10), 2108-2118. doi:
10.13196/j.cims.2017.10.004.
[10]Huang, S, Guo, Y, Zha, S, & Wang, Y. (2019). An internet-of-things-based
production logistics optimisation method for discrete manufacturing. International
Journal of Computer Integrated Manufacturing, 32(1), 13-26.
https://doi.org/10.1080/0951192X.2018.1550671.
[11] Tao Fei, Zhang He, Qi Qinglin, Xu Jun, sun Zheng, Hu Tianliang, Liu Xiaojun,
Liu Tingyu, Guan Juntao, Chen Changyu, Meng fanwei, Zhang Chenyuan, Li Zhiyuan,
Wei Yongli, Zhu Minghao, Xiao bin(2021). Theory and application of digital twin
model construction. Computer integrated manufacturing system (01), 1-15. doi:
10.13196/j.cims.2021.01.001.
[12]Guo, H, Chen, M, Mohamed, K, Qu, T, Wang, S, & Li, J. (2021). A digital
twin-based flexible cellular manufacturing for optimization of air conditioner
line. Journal of Manufacturing Systems, 58, 65-78.
https://doi.org/10.1016/j.jmsy.2020.07.012.
[13]Wang YR, Wu ZL (2020) Model construction of planning and scheduling system
based on digital twin. The International Journal of Advanced Manufacturing
Technology (7-8):2189-2203. https://doi:10.1007/s00170-020-05779-9.
[14]Rahman, H. F, & Nielsen, I. (2019). Scheduling automated transport vehicles for
material distribution systems. Applied Soft Computing, 82, 105552.
https://doi.org/10.1016/j.asoc.2019.105552.
[15]Li, L, Chen, Y, Lai, D, Li, B, & Wei, X. (2020). Material distribution method in
discrete manufacturing systems and a case study from engine builders. Proceedings of
the Institution of Mechanical Engineers, Part B: Journal of Engineering Manufacture,
234(14), 1720-1728.https://doi.org/10.1177/0954405420933093.
[16]Jones, D, Snider, C, Nassehi, A, Yon, J, & Hicks, B. (2020). Characterising the
Digital Twin: A systematic literature review. CIRP Journal of Manufacturing Science
and Technology, 29, 36-52.https://doi.org/10.1016/j.cirpj.2020.02.002.
[17]Liu, M, Fang, S, Dong, H, & Xu, C. (2021). Review of digital twin about
concepts, technologies, and industrial applications. Journal of Manufacturing Systems,
58, 346-361.https://doi.org/10.1016/j.jmsy.2020.06.017

[18]Qi, Q, Tao, F, Hu, T., Anwer, N., Liu, A., Wei, Y., ... & Nee, A. Y. C. (2019).
Enabling technologies and tools for digital twin. Journal of Manufacturing Systems.
[19]Sherstinsky, A. (2020). Fundamentals of recurrent neural network (RNN) and
long short-term memory (LSTM) network. Physica D: Nonlinear Phenomena, 404,
132306.https://doi.org/10.1016/j.physd.2019.132306.
[20]Oyola J. The capacitated vehicle routing problem with soft time windows and
stochastic travel times[J]. Revista Facultad de Ingeniería, 2019, 28(50): 19-33.
https://doi.org/10.19053/01211129.v28.n50.2019.8782
Figures
Figure 1
Control mode of material distribution system based on digital twin

Figure 2
Material preparation stage

Figure 3
Dynamic feeding stage
Figure 4

Data transfer between adjacent distribution cycles
Figure 5
Digital twin model of material distribution system

Figure 6
Dynamic forecasting operation mechanism of material demand time node
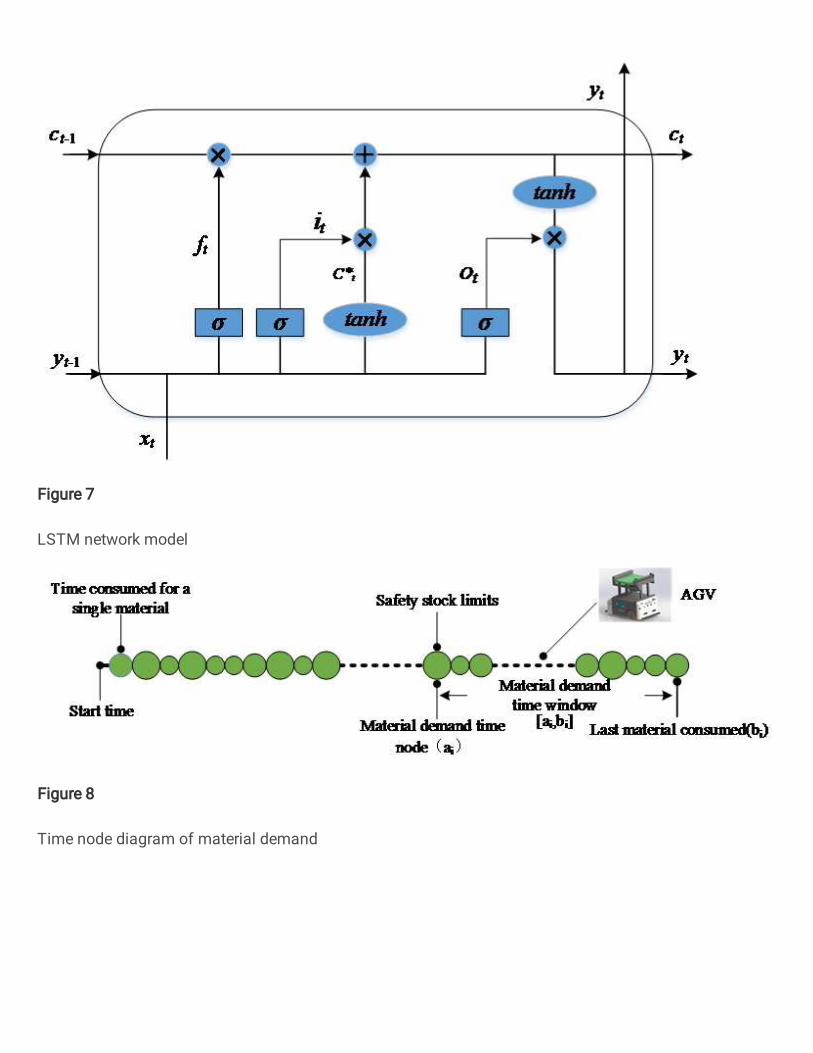
Figure 7
LSTM network model
Figure 8
Time node diagram of material demand

Figure 9
Workshop layout
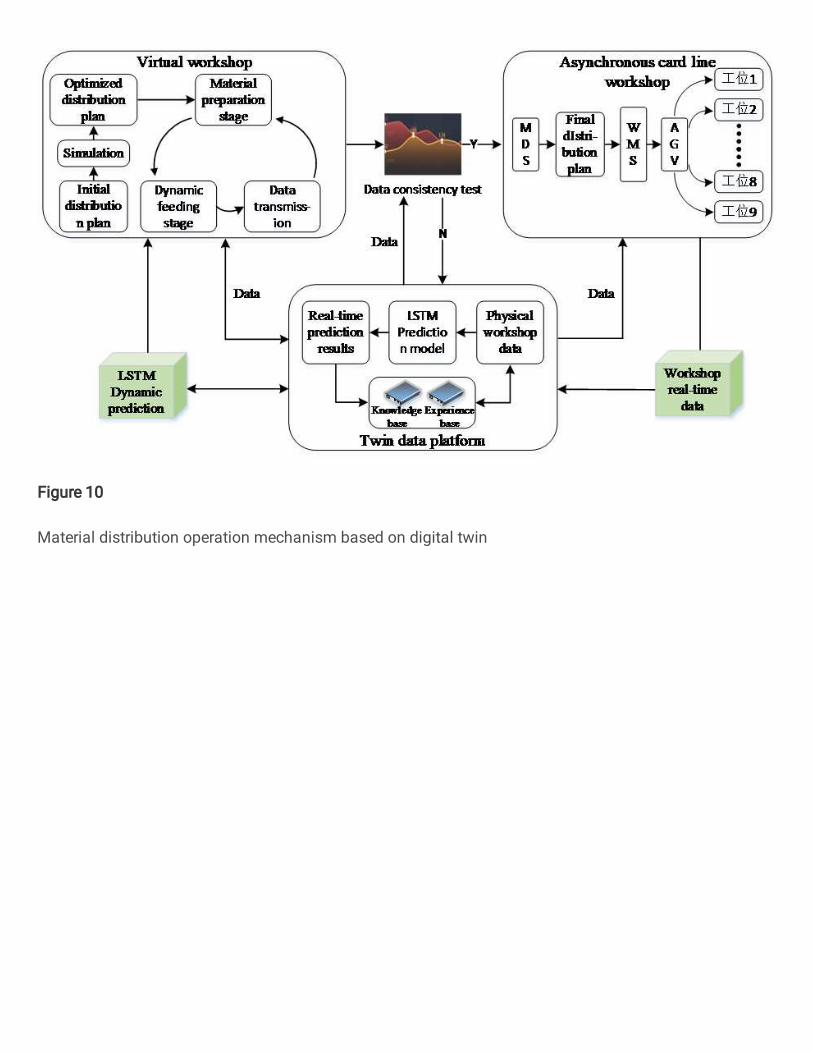
Figure 10
Material distribution operation mechanism based on digital twin

Figure 11
comparison of prediction time

Figure 12
comparison of prediction error rate

Figure 13
AGV distribution route