Model-Based Sensor Location Selection for Helicopter ... SENSOR LOCATION SELECTION FOR HELICOPTER...
16
NASA Technical Memorandum 107219 Army Research Laboratory Technical Report ARL-TR-1099 Model-Based Sensor Location Selection for Helicopter Gearbox Monitoring Vinay B. Jammu, Keming Wang, and Kourosh Danai University of Massachusetts Amherst, Massachusetts David G. Lewicki Vehicle Propulsion Directorate U.S. Army Research Laboratory Lewis Research Center Cleveland, Ohio Prepared for An Integrated Monitoring, Diagnostics, and Failure Prevention Technology Showcase sponsored by the Society for Machinery Failure Prevention Technology Mobile, Alabama, April 22-26, 1996 National Aeronautics and Space Administration U.S. ARMY RESEARCH LABORATORY https://ntrs.nasa.gov/search.jsp?R=19960026755 2018-07-17T08:18:18+00:00Z
Transcript of Model-Based Sensor Location Selection for Helicopter ... SENSOR LOCATION SELECTION FOR HELICOPTER...

NASATechnical Memorandum 107219
Army Research Laboratory
Technical Report ARL-TR-1099
Model-Based Sensor Location Selection
for Helicopter Gearbox Monitoring
Vinay B. Jammu, Keming Wang, and Kourosh Danai
University of MassachusettsAmherst, Massachusetts
David G. Lewicki
Vehicle Propulsion Directorate
U.S. Army Research LaboratoryLewis Research Center
Cleveland, Ohio
Prepared for
An Integrated Monitoring, Diagnostics, and FailurePrevention Technology Showcase
sponsored by the Society for Machinery Failure Prevention Technology
Mobile, Alabama, April 22-26, 1996
National Aeronauticsand
Space Administration
U.S. ARMY
RESEARCH LABORATORY
https://ntrs.nasa.gov/search.jsp?R=19960026755 2018-07-17T08:18:18+00:00Z

MODEL-BASED SENSOR LOCATION SELECTION FOR HELICOPTERGEARBOX MONITORING
Vinay B. Jammu, Graduate Research Assistant
Keming Wang, Visiting Scholar
Kourosh Danai, Associate Professor
Department of Mechanical Engineering
University of Massachusetts
Amherst, Massachusettsand
David G. Lewicki
Vehicle Propulsion Directorate
U.S. Army Research LaboratoryNASA Lewis Research Center
Cleveland, Ohio
ABSTRACT
A new methodology is introduced to quantify the significance of accelerometer locations for
fault diagnosis of helicopter gearboxes. The basis for this methodology is an influence model
which represents the effect of various component faults on accelerometer readings. Based on this
model, a set of selection indices are defined to characterize the diagnosability of each component,
the coverage of each accelerometer, and the relative redundancy between the accelerometers. The
effectiveness of these indices is evaluated experimentally by measurement-fault data obtained from
an OH-58A main rotor gearbox. These data are used to obtain a ranking of individual accelerome-
ters according to their significance in diagnosis. Comparison between the experimentally obtained
rankings and those obtained from the selection indices indicates that the proposed methodology
offers a systematic means for accelerometer location selection.
1 INTRODUCTION
Present helicopter gearboxes are significant contributors to both flight safety incidents and main-
tenance costs. For example, for large/medium civil transport helicopters in the period 1956-86,
gearboxes were the principal cause of 22% of the accidents which often resulted in loss of life and
the aircraft [1]. Rapid and reliable fault diagnosis of helicopter gearboxes is therefore necessary
to prevent major breakdowns due to progression of undetected faults, and to enhance personnel
safety by preventing catastrophic failures.

Faultdiagnosisof helicopter gearboxes, like most rotating machinery, is based upon vibration
monitoring. Therefore, an important issue in helicopter gearbox diagnostics is determination ofthe number of accelerometers to be used for monitoring and their location on the gearbox housing.
Accelerometers are generally located by experts based on their proximity to gearbox components,
orientation, and ease of mounting on the housing. However, the fundamental problem with this
approach is that experts often demand too many sensors to be monitored on-line by the on-
board computer. Another motivation for reduction of the number of accelerometers is the cost
associated with the extra mountings, cabling, signal conditioning equipment, etc. As such, experts
are often faced with the dilemma as which sensor(s) to eliminate without seriously undermining
diagnosability of the gearbox. This calls for a methodology for quantifying the significance of
various accelerometer locations in diagnosis.
Ideally, the significance of each accelerometer could be determined empirically by comparing
diagnostic results with and without the accelerometer. This, however, would require a com-
prehensive set of measurement data associated with all component faults in the gearbox, which
is generally not available. As a compromise to empirical assessment of accelerometer values, amodel-based methodology for accelerometer location selection is proposed in this paper that is
independent of measurement-fault data. The basis for this methodology is an influence model
between component faults and accelerometer readings obtained from a lumped mass model of
the gearbox. The proposed sensor selection methodology uses the following criteria to evaluate
the significance of individual locations: (1) the diagnosability of the system; i.e., the ability to
diagnose faults in each component, (2) accelerometer coverage; i.e., the number of components
an accelerometer can monitor, and (3) the level of redundancy between accelerometers in their
coverage of various components. The above three criteria are quantified by three indices: diagnos-
ability, coverage, and redundancy, which are computed using the influence model of the gearbox.
Individual or groups of accelerometers are then ranked according to their impact on the value ofthese indices when accelerometers are discarded. The accelerometers whose exclusion provides
the greatest loss in the value of indices are assigned the highest rank to indicate their significance
in diagnosis.The validity of the proposed sensor location selection indices is evaluated experimentally. For
this, measurement-fault data obtained from an OH-58A main rotor transmission are used to rank
the accelerometers for their effect on diagnosability of components. A comparison between these
experimentally obtained rankings and those from the selection indices indicate that the indices
offer a viable means of evaluating the significance of accelerometers.
2 INFLUENCE MODEL
The proposed methodology requires an influence model to represent the effect of various compo-
nent faults on accelerometer readings. Ideally, these influences should be defined so as to represent
the strength of vibration caused by a component fault monitored by each accelerometer. However,
the strength of vibration depends on the attenuation property of the transfer path between the
component and the accelerometer, which, in turn, is a function of parameters such as the moment
of inertia, stiffness, and damping of the components in the path [2,3]. As such, computation
of the vibration transfer would require consideration of all the vibration travel paths associated
with each component-accelerometer pair and knowledge of the parameters associated with each
path [4]. Such a detailed knowledge of the gearbox is practically infeasible [5]. For example,
2

the gearmeshstiffnessis obtained by considering the gear tooth as a non-uniform cantilever
beam [6,7], as a function of the cross-section of the tooth at the point of loading as well as load
variation due to changes in direction of load application [6,4,8], friction between the meshing
teeth [9], contact ratio [10], the type of gears (spur, helical, etc.) [6,7,8], and gear errors such
as profile, transmission and manufacturing errors [3,8]. Similarly, the stiffness of bearings is a
time-varying, non-linear function of bearing displacement and the number of rolling elements in
the load zone, as well as the bearing type (roller, ball, etc.), azdal preload, clearance, and race
waviness [11,12,13].
In view of the difficulties associated with computing the strength of vibration, as an alternative,
an approximate influence model is obtained to represent the average strength of vibration across
all frequencies [5]. To compute this average vibration, several simplifications are considered: (1)
a lumped mass model of the gearbox is considered; (2) in the absence of accurate values for
stiffness coefficients, only the average static values for the stiffness coefficients are used [6,11,14];
(3) damping ratios of bearings and shafts are neglected [6]; (4) the damping ratio of gears,
estimated between 0.03 and 0.17 [15], is set at 0.1 for all gears; (5) the cross-coupling terms in
the stiffness matrix are neglected; (6) only the shortest vibration travel path between component-
accelerometer pairs is considered; and (7) vibration transfer through the housing is neglected.
Using the above simplifications, the vibration caused by a faulty component can be simulated by
considering an excitation source at the component, which consists of unit amplitude sine waves
of all frequencies within the bandwidth. In this research, the average vibration transferred from
each component to an accelerometer is characterized by the root mean square (RMS) value of
vibration across all frequencies [5].
The simplifications used to facilitate estimation of the RMS values result in only approximate
RMS values. Such approximate RMS values would, in turn, result in approximate influence values
which may seriously affect the accuracy of diagnosis. In order to cope with the approximate nature
of influences, fuzzy variables [16] are used where the influences are not treated as values but as
variables with a range. The influence values are, therefore, transformed into the fuzzy variables:
nil: (0, 0.1), low: (0.1, 0.4), medium: (0.4, 0.6), high: (0.6, 0.9) and definite: (0.9, 1), so as to
define the fuzzy influences in the influence model [5].
3 SELECTION INDICES
In the proposed sensor selection methodology, three indices are considered to represent the ef-
fectiveness of accelerometers in monitoring various gearbox components. These indices, which
are computed based on the influence model, are the diagnosability index, coverage index, and
redundancy index. As discussed earlier, influences represent the average vibration registered by
accelerometers due to component faults. Therefore, they can be used to characterize the effec-
tiveness of each accelerometer by measuring the number of components it covers, the amount
of energy it receives from these components, and its relative redundancy with respect to otheraccelerometers.
The diagnosability index represents the amount of influence each component has on all the
accelerometers. As such, the diagnosability index is defined as the sum of the influences for that
component, as
uij + lijD_ 2 (1)J
3
whereuij and lij represent the upper and lower limits of the fuzzy influence between component
i and accelerometer j, and the summation is carried out over all accelerometers j. One possible
utility of the diagnosability index is that it ensures a minimum level of diagnosability for each
component given the combination of accelerometers selected.
The coverage index is the measure of reach of each accelerometer. It represents the total
influence between an accelerometer and all the components within the system. The coverageindex for each accelerometer is defined as:
cj = uij +2 (a)i
where uij and lij represent the upper and lower limits of the fuzzy influences between the ac-
celerometer j and gearbox component i, and the summation is carried over all components i. One
possible use of the coverage index is to ensure that each accelerometer has a minimum level of
coverage.
The redundancy index measures the effectiveness of accelerometers by measuring their overlap
with other accelerometers. In terms of fuzzy influences, an accelerometer is redundant if the
components it covers are already covered with higher influence values by other accelerometers.
The redundancy index is measured for each accelerometer as:
Rj = _ [Iij - MAX(Iit, for every l ¢ j)] (3)i
where Iij = (uij + lij)/2 represents the average value of each influence, and the summation is
carried over all components i. As defined, a larger value of Rj indicates a smaller overlap betweenaccelerometer j and others.
4 EXPERIMENTAL
The effectiveness of the sensor selection indices was evaluated using experimental measurement-
fault data from an OH-58A main rotor gearbox. The configuration of this gearbox is shown in
Fig. 1, and the location and orientation of the eight accelerometers used for vibration measurement
are shown in Fig. 2. Vibration data were collected at the NASA Lewis Research Center as part
of a joint NASA/Navy/Army Advanced Lubricants Program [17]. The vibration signals were
recorded from eight piezoelectric accelerometers (frequency range of up to 10 Kttz) using an
FM tape recorder. Two magnetic chip detectors were also used to detect the debris caused by
component failures. Accelerated fatigue tests were performed where the gearbox was run under aconstant load and was disassembled and inspected periodically, or when one of the chip detectors
indicated a failure. A total of five tests were performed, where each test was run between nine
and fifteen days ranging from four to eight hours a day. A total of eleven failures occurred during
these tests. They consisted of three cases of planet bearing pitting fatigue, three cases of sun gear
pitting fatigue, two cases of top housing cover cracking, and one case each of spiral bevel pinion
pitting fatigue, mast bearing micropitting, and planet gear pitting fatigue. In order to identify
the effect of faults on the vibration data, the vibration signals obtained from the five tests were
digitized and processed by a commercially available diagnostic analyzer. For analysis purposes,
only one data record per day was used to represent gearbox vibration for each test [18].

Beadng(PB) Subsystem #2 Bearing(MBB)_eo,,_oo-L-o- __--.... !_ Spiral Bevel
Ranet \1: - . Gear(SBG)
Gear(PG) __ _k._ / Sairal Bevel
Rinn ..... _o,_< _ __ //t:_nion(SBP)
#3 _
O
1
iGear Roller _ .,t
Beadng(GRB) Duple_ Subsystem #1Bearing(DB) Mast Roller Pinion Roller
Beadng(MRB) Bearing (PRB)
Figure 1: Configuration of the OH-58A main rotor gearbox, with the components clas-sifted into subsystems for diagnosis.
5 EVALUATION
The first step in the evaluation process was determination of the influence model. For the OH-
58A gearbox five primary vibration travel paths were identified: (1) Duplex Bearing-Spiral Bevel
mesh-Triplex Bearing, (2) Duplex Bearing-Sun-Planet mesh-Ring Gear (3) Mast Roller Bearing-
Main Shaft-Mast Ball Bearing (4) Ring Gear-Planet Bearing-Mast Ball Bearing, and (5) Duplex
Bearing-Sun Planet mesh-Mast Ball Bearing. The first travel path was in connection to accelerom-
eters 4, 5, and 6, where as all the other paths were connected to accelerometers 1, 2, 3, 6, 7, and 8.The RMS values of vibration were then computed using the lumped mass model of these paths,
and used as the basis for defining the fuzzy influence model. It should be noted that due to fuzzi-
fication of influences, components which are adjacent to each other are likely to have the same
fuzzy influences and hence, become indistinguishable for ranking purposes. To cope with this
problem, the OH-58A gearbox was divided into three subsystems (see Fig. 1): Subsystem 1 (the
input subsystem), Subsystem 2 (the output subsystem), and Subsystem 3 (the planetary subsys-
tem), and the influences between the subsystems and accelerometers were obtained by averaging
the influences of components within each subsystem (Table 1).
Using the influence model in Table 1, the three sensor selection indices were computed for the
complete suite of 8 accelerometers. Next, in order to evaluate the effect of individual accelerom-eters on the value of these indices, the row associated with each accelerometer in Table 1 was
removed and the three indices were recomputed for the resulting suites of 7 accelerometers. The
estimated loss, Ls, in the quality of diagnosis with various suites of 7 accelerometers was defined
as:3 8 8
Ls = _(Dis- Di,)+ Y_(Cjs- Cj,)+ _-'_(njs- Rjs) (4)i=l j=l j=l
where Dis denotes the diagnosability index of Subsystem i with suite s, Cjs represents the coverage
index of accelerometer j with suite s, and Rjs denotes the redundancy index of accelerometer j

I Vertical
Longitudinal
#1,2, 3 attached to block on right trunnion mount#4, 6, 7, 8 studded to housing through steel insets#5 attached to block on input housing
Figure 2: Location of the accelerometers on the test stand.
with suite s. This loss value was then used to classify accelerometers into one of four categories,
to signify their value in diagnosis. The accelerometer whose exclusion resulted in the highest loss
was classified into the first category, while the accelerometer with the least loss was placed in
category 4. The above strategy was also used to classify groups of accelerometers, by computing
the loss values associated with suites of 6, 5, 4, 3, 2, and 1 accelerometer(s).
Experimental evaluation of the rankings from the three indices was obtained via a model-
based diagnostic system [5]. The overview of this model-based diagnostic system is presented
in Fig. 3. The inputs to this system are the vibration features obtained by processing the raw
vibration signal from the OH-58A accelerometers. These vibration features are first input into an
unsupervised fault detection network to identify the presence of faults in the gearbox. Once the
presence of a fault is prompted by the fault detection network, fault diagnosis is performed by
the Structure-Based Connectionist Network (SBCN) whose weights comprise the fuzzy influences.
The inputs to SBCN are abnormal features, which are separately identified by an unsupervised
pattern classifier, referred to as the Single Category-Based Classifier (SCBC) [19]. The SCBC is
designed to identify the degree of abnormality in individual features by comparing them against
their normal-mode values. To perform diagnosis, these abnormality-scaled features are propagated
through the weights of SBCN to yield as outputs fault possibility values pi between 0 and 1 for
individual gearbox subsystems.
The SBCN was used to quantify the significance of individual accelerometer locations in di-
6

Accelerometer
1
2
3
4
5
6
7
8
Subsystems
Input [ Output
- M
- M
- M
tt
H
M M
- M
Transmission
H
H
H
L
M
H
H
M H
Table 1: Influences of the three subsystem on the eight accelerometers. The influences
shown are: '-' Nil, M Medium, H High.
RawVibratio-_"
Fault ]
Detection I
l.._q_._i,l Abn°rmality ___ Structure-Based I._... FaultySignal Scaling Connectionist I C°mp°nentsProcessing (SCBC) Network
Figure 3: Overview of fault detection and diagnosis in the proposed model-based di-
agnostic system for helicopter gearboxes.
agnosis of the OH-58A gearbox. For quantification purposes, a performance index P was defined
to represent the accuracy of the diagnostic results obtained from SBCN. This performance index
had the form
Pi = _ Pi (5),faults
where pl represents the fault possibility value of the ith subsystem and the summation was carriedout over all the available faults that had occurred during the OH-58A experiments. In SBCN,
to study the significance of each accelerometer on the diagnostic results, P was recomputed for
various accelerometer suites. The experimental loss function, L,, was then defined to representthe differential in the P value for each of the suites relative to its value for the complete set of 8
accelerometers as:
rv,8___,]2L.=L L Pis J (6)
where Pi_ represents the performance index of the ith subsystem obtained for suite s, and Pis
denotes the performance index of this Subsystem with the complete suite of 8 accelerometers.
The summation is carried over the 3 subsystems to obtain the total loss. The L_ obtained forsuites of the same size were then normalized to have values between 0 and 1 and used for ranking
purposes. As with the selection indices, the excluded accelerometer that caused the greatest loss
7
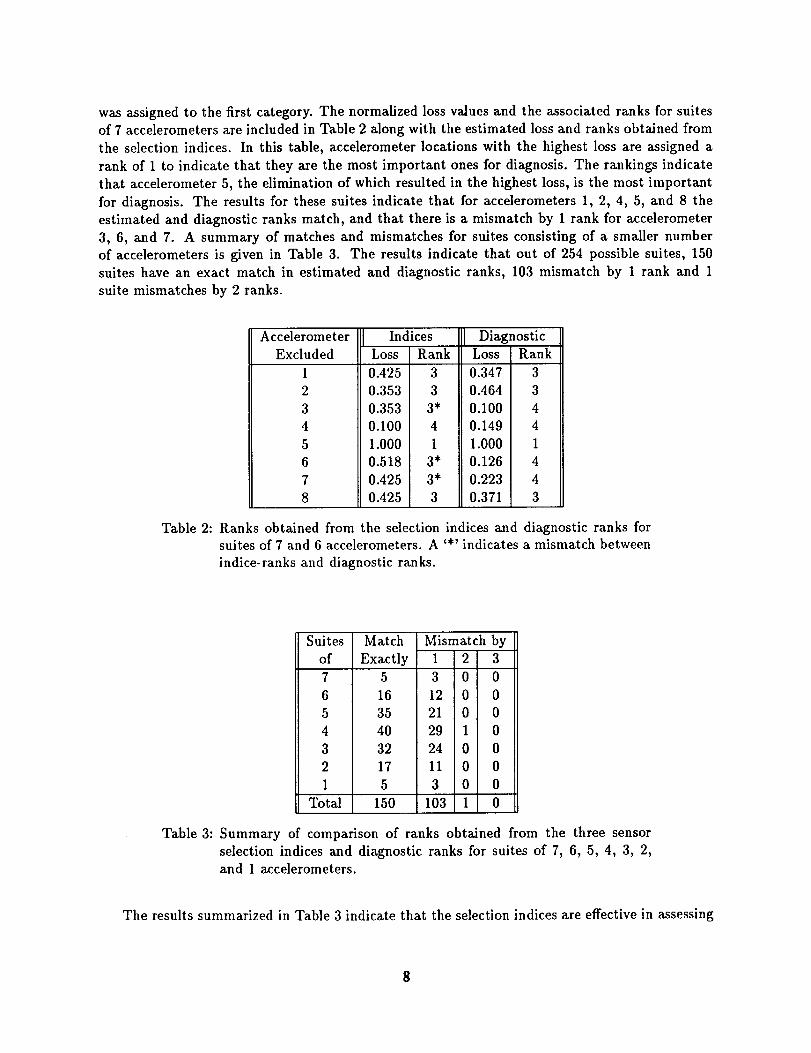
wasassignedto the first category. The normalized loss values and the associated ranks for suites
of 7 accelerometers are included in Table 2 along with the estimated loss and ranks obtained from
the selection indices. In this table, accelerometer locations with the highest loss are assigned a
rank of 1 to indicate that they are the most important ones for diagnosis. The rankings indicate
that accelerometer 5, the elimination of which resulted in the highest loss, is the most important
for diagnosis. The results for these suites indicate that for accelerometers 1, 2, 4, 5, and 8 the
estimated and diagnostic ranks match, and that there is a mismatch by 1 rank for accelerometer
3, 6, and 7. A summary of matches and mismatches for suites consisting of a smaller number
of accelerometers is given in Table 3. The results indicate that out of 254 possible suites, 150
suites have an exact match in estimated and diagnostic ranks, 103 mismatch by 1 rank and 1
suite mismatches by 2 ranks.
Accelerometer Indices i] DiagnosticExcluded Loss Rank r Loss Rank
1 0.425 3 0.347 3
2 0.353 3 0.464 3
3 0.353 3* 0.100 4
4 0.100 4 0.149 4
5 1.000 1 1.000 1
6 0.518 3* 0.126 4
7 0.425 3* 0.223 4
8 0.425 3 0.371 3
Table 2: Ranks obtained from the selectionsuites of 7 and 6 accelerometers. A
indice-ranks and diagnostic ranks.
indices and diagnostic ranks for'*' indicates a mismatch between
Suites Match Mismatch by
of Exactly 1 2 3
7 5 3 0 0
6 16 12 0 0
5 35 21 0 0
4 4O 29 1 0
3 32 24 0 0
2 17 11 0 0
1 5 3 0 0
Total 150 103 1 0
Table 3: Summary of comparison of ranks obtained from the three sensor
selection indices and diagnostic ranks for suites of 7, 6, 5, 4, 3, 2,and 1 accelerometers.
The results summarized in Table 3 indicate that the selection indices are effective in assessing
the valueof individual (suites of) accelerometers. Using the influence model as the common point
between the selection indices and SBCN de-emphasizes the effect of modeling errors. The influence
model alone, however, does not ensure a perfect match between the two rankings because the
diagnostic rankings from SBCN also depend on the experimental data as well as the performance
of SBCN's other components (detection network and SCBC). The experimental data, although
one of the most complete sets available in the industry, are still not as comprehensive as required
for a complete evaluation of the method. The main limitation is the absence of faults that could
signify the value of some accelerometers which otherwise may have been assigned a lower rank.
For example, there is only a single fault in Subsystem 2 (mast bearing micropitting), therefore,
accelerometers that are important in isolating other faults within this Subsystem may appear as
unnecessary. Although the rankings obtained from the selection indices agree well with those
obtained from the diagnostic results, they can be improved further to enhance their effectiveness.
One possibility is the redundancy index which may be refined further so as to include spatial
redundancy of accelerometer locations as well.
6 CONCLUSION
A methodology is introduced for evaluating the significance of accelerometer locations in diagno-
sis of faulty gearbox components. This methodology, which is based on the influences between
components and accelerometers, uses three indices for evaluation of accelerometers. The diagnos-
ability index represents the coverage each gearbox component receives from all the accelerome-
ters, the coverage index denotes the reach of individual accelerometers, and the redundancy index
characterizes the overlap between the accelerometers. These indices were evaluated together in
estimating the diagnostic quality of various accelerometer location suites for an OIt-58A gearbox.
The results indicate that the rankings provided by the indices agree well with the actual rankings
obtained from a diagnostic system.
REFERENCES
[1] D. G. Astridge, "Helicopter transmission - Design for safety and reliability," Proc. of Inst. of
Mech. Engrs., pp. 123-138, vol. 203, 1989.
[2] R. H. Lyon, "Structural diagnostics using vibration transfer functions," Sound and Vibra-
tions, pp. 28-31, Jan. 1995.
[3] J. D. Smith, Gears and their Vibrations. Newyork, NY: Marcel Dekker, The Macmillan Press
Ltd., 1983.
[4] F. K. Choy and W. Qian, "Global dynamic modeling of a transmission system," NASA CR-
191117, Army Research Laboratory ARL-CR-11, Lewis Research Center, Cleveland, Ohio,
April 1993.
[5] V. B. Jammu, K. Danai, and D. G. Lewicki, "Fuzzy connectionist network for fault diagnosis
of helicopter gearboxes," in Proc. of International Mechanical Engineering Congress and
Ezposition, San Francisco, CA, Nov. 1995.

[6] H-H. Lin, R. L. Huston, and J. J. Coy, "On dynamic loads in parallel shaft transmission:
Part I - Modelling and Analysis," Journal of Mechanisms, Transmission, and Automation in
Design, pp. 221-229, vol. 110, June 1988.
[7] L. S. Boyd and J. Pike, "Epicyclic gear dynamics," AIAA Journal, pp. 603-609, vol. 27, no.5 1989.
[8]
[9]
[10]
[11]
[12]
[13]
W. D. Mark, "Use of the generalized transmission error in equations of motion of gear
systems," J. of Mechanisms, Transmission, and Automation in Design, pp. 283-291, vol.109, June 1987.
B. Rebbechi, F. B. Oswald, and D. P. Townsend, "Dynamic measurements of gear tooth
friction and load," NASA, TM-103281, AVSCOM TR-90-C-0023, Lewis Research Center,
Cleveland, Ohio, Oct. 1991.
R. W. Cornell and W. W. Westervelt, "Dynamic tooth loads and stressing for high contact
ratio spur gears," J. of Mechanical Design, pp. 69-76, vol. 100 1978.
M. F. While, "Rolling element bearing vibration transfer characteristics: effect of stiffness,"
J. of Applied Mechanics, pp. 677-684, vol. 46, 1979.
T. A. Harris, Rolling Bearing Analysis. Newyork, NY: John Wiley and Sons, Inc., 1966.
T. L. H. Walford and B. J. Stone, "The sources of damping in rolling element bearings under
oscillating conditions," Proc. of Inst. of Mech. Engrs., pp. 225-232, vol. 197c, Dec. 1983.
[14] W. A. Tuplin, "Dynamic loads on gear teeth," Machine Design, pp. 203-211, vol. 25, Oct.1953.
[15]
[16]
[17]
[18]
[19]
R. Kasuba and J. W. Evans, "An extended model for determining dynamic loads in spur
gearing," Journal of Mechanical Design, pp. 398-409, vol. 103, April 1981.
L. A. Zadeh, "The concept of a linguistic variable and its application to approximate
reasoning-l," Information Sciences, pp. 199-249, vol. 8 1975.
D. G. Lewicki, H. J. Decker, and J. T. Shimski, "Full-scale transmission testing to evaluate
advanced lubricants," NASA TM-105668, AVSCOM TR-91-C-035, 1992.
H. Chin, K. Danai and D. G. Lewicki, "Pattern classifier for fault diagnosis of helicopter
gearboxes," J. of IFAC Control Eng. Practice, vol. 1, no. 5, pp. 771-778, 1993.
V. B. Jammu and K. Danai, "Unsupervised pattern classifier for fault detection of helicopter
power train," in Proc. of Noise and Vibration, (Venice, Italy), pp. 797-810, April 1995.
l0


FormApprovedREPORT DOCUMENTATION PAGE OMBNo.0704-0188
Public rq)orting burdenfor this coflDctlenof Intocrnmlenis estimated to avernge 1 hourper response._cludini_ the time for reviewing Insmctlone. searchinge_k.lng da_ sources,gatheringand rnldntalnlngthe data needed, and completingand reviewingIhe collectionof information. 8etKI commenWregardingthkzburden estimate or any other aspect of thiscolbctkm of Infomnation,includingsuggestionskx' reducJngthis burden, to Weshlnglon Heedquatterl Services, Dlmotomtofo¢ Infotmotk)nOperallonsand Repofls, 1215 JeffersonDavis Highway, Suhe 1204. AdOreR, VA 22202-4302. and to the Offk_ of Management and 8udg_ P_:_work ReductionPr(Ypd (0704-0188), Weshlnglen. DC 20503.
1. AGENCY USE ONLY (Leave blank) 2. REPORT DATE 3. REPORT TYPE AND DATES COVERED
May 1996 Technical Memorandum
4. TITLE AND SUBTITLE 5. FUNDING NUMBERS
Model-Based Sensor Location Selection for Helicopter Gearbox Monitoring
e. AUTHOR(S)
Vinay B. Jammu, Keming Wang, Kourosh Danai, and David G. Lcwicki
7. PERFORMING ORGANIZATION NAME(S) AND ADDRESSES)
NASA Lewis P.csearch Crater
Cleveland,Ohio 44135-3191
and
Vehicle Propubion Directorate
U.S. Army Research Laboratory
Cleveland,Ohio 44135-3191
9. SPONSORINGAiiONITORING AGENCY NAME(S) AND ADDRESS(ES)
National Aeronautics and Space Administration
Washington, D.C. 20546-0001
and
U.S. Army Research Laboratory
Adelphi, Maryland 20783-I 145
WU-505-62-36
1L162211A47A
8. PERFORMING ORGANIZATION
REPORT NUMBER
E-10'251
10. SPONSORING/MONITORINGAGENCY REPORT NUMBER
NASA TM-107219
ARL-TR-1099
11. SUPPLEMENTARY NOTES
Prepared for An Integrated Monitoring, Diagnostics, and Failure Prevention Technology Showcase sponson_ by the Society for Machinery
Failure Prevention Technology, Mobile, Alabama, April 22-26, 1996. Vinay B. Jammu, Kcming Wang, and Kourosh Danai, University of
Massachusetts, Delmtn_nt of Mechanical Engineering, Amherst, Massachusetts 01003; David G. Lewield, Vehicle Propulsion Directorate, U.S.
Army Research Laboratory, NASA Lewis Resea_h Center. Responsible person, David G. Lewicki, organization code 2730, (216) 433-3970.
12L DISTRIBUTION/AVAILABILITY STATEMENT
Unclassified - Unlimited
Subject Category 37
This publication is available from the NASA Center for AeroSpace Information, (301) 621-0390.
12b. DISTRIBUTION CODE
13. ABSTRACT (Maximum 2OO words)
A new methodology is introduced to quantify the significance of accelerometer locations for fault diagnosis of helicopter
gearboxes. The basis for this methodology is an influence model which represents the effect of various component faults
on accelerometer readings. Based on this model, a set of selection indices are defined to characterize the diagnosability of
each component, the coverage of each accelerometer, and the relative redundancy between the accelerometers. The
effectiveness of these indices is evaluated experimentally by measurement-fault data obtained from an OH-58A main
rotor gearbox. These data are used to obtain a ranking of individual aceelerometers according to their significance in
diagnosis. Comparison between the experimentally obtained rankings and those obtained from the selection indices
indicates that the proposed methodology offers a systematic means for accelerometer location selection.
14. SUBJECT TERMS
Gears; Transmissions (machine elements); Bearings; Fault delection
17. SECURITY CLASSIFICATION
OF REPORT
Unclassified
NSN 7540-01-280-5500
18. SECURITY CLASSIFICATION
OF THIS PAGE
Unclassified
19. SECURITY CLASSIFICATION
OF ABSTRACT
Unclassified
15. NUMBER OF PAGES
]216. PRICE CODE
A03
20. uMrrATION OF ABSTRACT
Standard Form 298 (Rev 2-89)
Prescdbed by ANSI Sial. Z39-18296-102

_ _o<° _"
_ _8_.
_=_.:_ _._
.-L "I I_.0
z _0 _
"n
r,-
3


![Kevin Lynagh - Keming Labs · ;;src/clj/my_stuff.clj (ns my-stuff) (defn thing [x] ) (defn another [x y] ) ClojureNamespaces](https://static.fdocuments.us/doc/165x107/6057fe3776be12246c4d585a/kevin-lynagh-keming-labs-srccljmystuffclj-ns-my-stuff-defn-thing-x.jpg)