Modal Properties of a High Rise Building Under Construction · Modal Properties of a High Rise...
10
Modal Properties of a High Rise Building Under Construction Tomás R. Nuñez 1 , Rubén L. Boroschek 2 1 Msc. Earthquake Engineering, University of Chile, Chile. [email protected] 2 Associate Professor, Dept. of Civil Engineering University of Chile, Chile. [email protected] Blanco Encalada 2002, Santiago. Chile. 1 Nomenclature { } 1 k x + : State vector on 1 k + . { } k x : State vector on k . [ ] A : Discrete System Matrix. [ ] C : Output Matrix. { } k w : Process noise vector. { } k v : Measurement noise vector. i : i-th mode. i λ : Eigen value from continuous system matrix. i μ : Eigen value from discrete system matrix. t Δ : Sample time. i ω : Angular frequency. i ξ : Damping ratio. [ ] φ : Modal shape. [ ] Ψ : Eigen vector from discrete system matrix. 2 Abstract This article presents the results of the continuous vibration monitoring and modal parameter identification of a 55 story shear-wall concrete building under construction. The building has a near elliptical floor shape with 61x34 meters maximum plan dimensions and 196 meters in height. Metal hysteretic energy dissipating devices have been incorporated into the building to reduce the vibration due to earthquake excitations. The continuous monitoring network is composed by 3 accelerometers on the 20 th story and had the objective of identifying the variations of modal parameters induced by the construction process. Ambient and earthquake records have been obtained during monitoring period. The dynamic characteristics of the building were identified using parametric and non-parametric techniques such as the Spectrogram and the Stochastic Subspace Identification (SSI) methods. The procedures obtain the variations of modal parameters with a resolution of ten minutes. The recorded motions were used to validate 15 different Finite Element Models (FEM), created according to the construction progress of the building. The mathematical model frequencies were correlated with the results of the identification procedures; maximum differences between 2% and 14% were obtained. The difficulties of monitoring vibration and modal identification during construction process are indicated and causes of main differences between design and real structure are commented.
Transcript of Modal Properties of a High Rise Building Under Construction · Modal Properties of a High Rise...

Modal Properties of a High Rise Building Under Construction
Tomás R. Nuñez1, Rubén L. Boroschek2 1Msc. Earthquake Engineering, University of Chile, Chile.
[email protected] 2Associate Professor, Dept. of Civil Engineering University of Chile, Chile.
[email protected] Blanco Encalada 2002, Santiago. Chile.
1 Nomenclature
{ }1kx + : State vector on 1k + .
{ }kx : State vector on k .
[ ]A : Discrete System Matrix.
[ ]C : Output Matrix.
{ }kw : Process noise vector.
{ }kv : Measurement noise vector.
i : i-th mode.
iλ : Eigen value from continuous system matrix.
iμ : Eigen value from discrete system matrix.
tΔ : Sample time.
iω : Angular frequency.
iξ : Damping ratio.
[ ]φ : Modal shape.
[ ]Ψ : Eigen vector from discrete system matrix.
2 Abstract
This article presents the results of the continuous vibration monitoring and modal parameter identification of a 55 story shear-wall concrete building under construction. The building has a near elliptical floor shape with 61x34 meters maximum plan dimensions and 196 meters in height. Metal hysteretic energy dissipating devices have been incorporated into the building to reduce the vibration due to earthquake excitations. The continuous monitoring network is composed by 3 accelerometers on the 20th story and had the objective of identifying the variations of modal parameters induced by the construction process. Ambient and earthquake records have been obtained during monitoring period. The dynamic characteristics of the building were identified using parametric and non-parametric techniques such as the Spectrogram and the Stochastic Subspace Identification (SSI) methods. The procedures obtain the variations of modal parameters with a resolution of ten minutes. The recorded motions were used to validate 15 different Finite Element Models (FEM), created according to the construction progress of the building. The mathematical model frequencies were correlated with the results of the identification procedures; maximum differences between 2% and 14% were obtained. The difficulties of monitoring vibration and modal identification during construction process are indicated and causes of main differences between design and real structure are commented.

3 Introduction
Many studies to determine modal properties have been performed over the past decades, with most of applications focus on structural health monitoring [5, 7, 9], calibrated mathematical models [3, 16], diagnosis [1,2, 12], damage detection [11, 13], variations on dynamic properties [4, 10], among others. The objective of the continuous identification during the construction process was to track part of the dynamic properties variations, to detect anomalies and to compare the identified values with different Finite Adaptative Element Models (FAEM).
Two types of monitoring procedures were implemented: a) along the building height, when the construction process was located on floors 11, 17, 22, 28 and 55 and b) continuously under-construction for a period of 5 months. This article presents the results of the continuous monitoring only, [10].
The Titanium La Portada building, developed by ASL Sencorp and Structural Engineering from Alfonso Larrain Vial. ALV & Associated, is the tallest building in Chile, and it is currently in its latest stage of construction. The building has 55 stories, 7 underground levels and 126,000 m2. Structurally, the building consists of a reinforced concrete walls core surrounded by frames and columns located in the perimeter, as shown in Figure 1.
The construction process consists in the concreting of the core and perimeter columns and beams, after which the prefabricated slabs are supported by this system. In order to control earthquake vibration several steel dampers are included along the height of the structure. During the study, the dampers were lock so they don’t participate in the energy dissipation of the system.
Figure 1. General views.
4 Modal Parameters from ambient vibration.
Continuous ambient vibration records were obtained during a 5 month period from the three uniaxial accelerometers located in the 20th floor, as shown in Figure 2. Due to this instrument arrangement only frequency and damping, and partial mode shapes could be obtained. Channels were sampled at 100 [Hz]. Data was recorded continuously, and modal properties were obtained every 10 minutes.
The permanent variation of the dynamic properties due to constructive process was monitored and compared at different stages of construction using finite element adaptive models, according to the progress of the building construction shown in Figure 3.

(a) General view. (b) Detail 20th level instrumentation.
Figure 2. Accelerometer location during construction.
Figure 3. Construction sequence. Date (yy-mm-dd).
5 System Identification Technique
The Stochastic Subspace Identification Technique developed by Van Overschee and De Moor [14, 15] is used to estimate modal frequency, damping and shapes. This technique uses the stochastic state space model, described by equation (1.1) to identified modal parameters from output only response signals.
{ } [ ] { } { }{ } [ ] { } { }
1k k k
k k k
x A x w
y C x v+ = ⋅ +
= ⋅ + (1.1)
Eq. (1.1) constitutes the basis for time-domain modal identification through ambient vibration measurements. There are several techniques and algorithms to obtain modal parameters from stochastic subspace model [14], equation (1.2). The mathematical background for many of such methods is similar, differing only in implementation aspects. The algorithms identify the state–space matrices ( [ ]A , [ ]C ) based on the measurements by using robust numerical techniques, such as QR factorization, singular value decomposition (SVD), and least squares [15].
Once the mathematical description of the structure is found, modal parameters such as frequency, iω , damping
ratio, iξ , and operational mode shapes, [ ]φ are determined as:
( ) ( ) [ ] [ ] [ ]*ln i i
i i i i i ii
realC
tμ λ
λ ω λ λ λ ξ φλ
= = = ⋅ = = ⋅ ΨΔ
(1.2)
To validate results the Short Time Fourier Transform, Spectrogram, was also used, [6].

6 Results of continuous monitoring
Several difficulties are present when ambient vibration monitoring is done during construction. They are related with high transient vibration due to impact, continuous variations of mass and stiffness, operation of small and large machinery like cranes and others. All this activities affects the system identification processes producing non stationary signals. Figure 4 shows vibrations during concrete pumping and Figure 5 a comparison between workday and holyday.
One important observation from time series is the difference between acceleration amplitude at workdays compared to holyday. While the workdays the acceleration amplitude was in the order of 10-3[g] the holydays showed two order less, 10-5[g], Figure 5.
This construction process did not affect the identification of predominant frequencies. Nevertheless, they did affect considerably the damping values, producing a larger scatter of values for each consecutive 10 minute window. For better estimates an average of six consecutive values was used.
Figure 4. Acceleration amplitude. Concrete pumping impacts.
(a) Work day (b) Holiday
Figure 5. Acceleration amplitude comparison between (a) holyday and (b) work day. The difference is up to one order magnitude.
From continuous monitoring, 13 natural frequencies and their associated damping ratios were estimated. The last 4 modes were identified during the last months of monitoring.
6.1 Frequency Figure 6 present the variation of frequency for all identified modes during the five month continuous monitoring. The results show a continuous reduction in frequency and a daily variation, this last effect is the one that produces the apparent thick line in the Figure 6. The variations in frequency are mainly caused by two characteristic and repetitive patterns: 1) construction progress (mass and stiffness) and 2) daily ambient and usage variations.
To separate both tendencies a power spectral density analysis was performed to identify weekly and daily frequency variations. The results obtained from the power spectral peaks show predominant variations of 23.9 hours and 7.4 days in average. A band-pass filter was applied around these patterns, separating the observe frequency variations. The result of the filtering for the 7.4 day pattern is shown in Figure 7 (a) and the nearly 24 hour pattern in Figure 7 (b).
The most important frequency variation is associated to the addition of mass after construction of a new story. According to the construction program, the average global progress of the structure corresponds to 3.75 stories per month. These nearly weakly patterns are the consecuence of the concreting of the wall-core and perimeter

frame, and the second due to the slabs placement. This last procedure provides greater amount of mass and therefore the changes in frequency are more drastic.
Figure 6. Frequency Variation during monitoring period.
The weekly pattern generated variations of frequency in a range between 1.5% and 5.5% respect to the frequency at the beginning of each week, Figure 7 (a). This behavior was observed for the first eight building vibration modes.
Their maximum values due to daily frequency variations (deviation from daily mean value) are in the order of 1.6%, Figure 7 (b). These variations were directly related to environmental day-night cycles and the presence of workers, machinery and materials in the building.
(a) Frequency Variation due to weekly pattern. (b) Frequency Variation due to daily pattern. Figure 7. Filtered Frequency variation.
A similar pattern is possible to appreciate using the spectrogram method, Figure 8. An important result is associated to observe the diary cycles, producing high energy amplitude during working period (day) and low energy at night or weekends (vertical lines on spectrogram, Figure 8).

(a) Channel 1. N/S Orientation (a) Channel 2. E/W Orientation.
Figure 8. Spectrogram.
6.2 Damping Damping ratio estimations show high scatter between consecutive 10 minute windows. Average values were obtained for six consecutive non overlapping windows. Result of the average, smooth, data are presented in Figure 9 and Figure 10 for the first four modes. The damping values showed a increasing magnitude with increasing structural height for the first predominant frequency and a decreasing magnitude with increasing structural height for the higher modes, nevertheless daily variation are large overall variation during the five month period is small.
Damping ratio is one of the most difficult to determine, since it was observed that is highly dependent on the amplitude of the excitation. For that reason, the filtering procedure applied to characterize the frequency variation was performed to damping ratio, identifying a damping variation pattern spanning around 18.4 days, period required to build about 3 stories, Figure 11.
From the analysis of the records it was established that the damping ratio, under ambient vibration and construction process, varies in a range between 0.5% and 1.5% [10], Figure 11.
Figure 9. Damping Ratio variation during monitoring period. Modes 1 and 2. Average values obtained for six consecutive non overlapping windows.
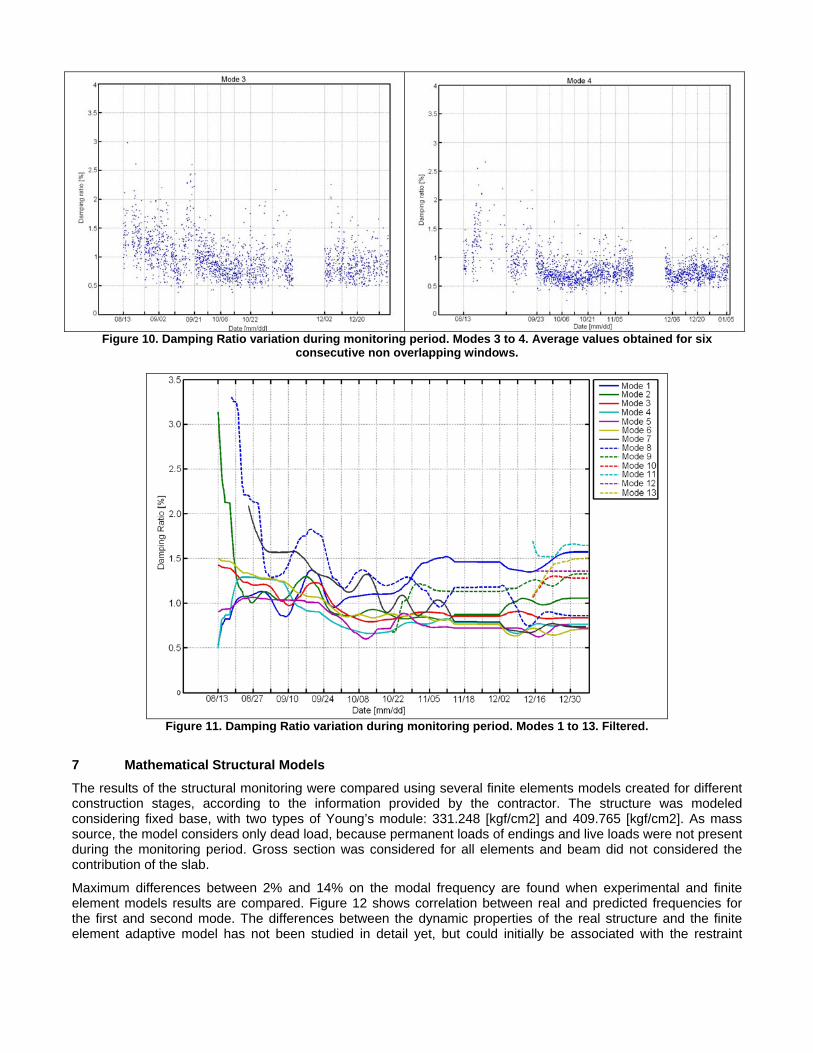
Figure 10. Damping Ratio variation during monitoring period. Modes 3 to 4. Average values obtained for six
consecutive non overlapping windows.
Figure 11. Damping Ratio variation during monitoring period. Modes 1 to 13. Filtered.
7 Mathematical Structural Models
The results of the structural monitoring were compared using several finite elements models created for different construction stages, according to the information provided by the contractor. The structure was modeled considering fixed base, with two types of Young’s module: 331.248 [kgf/cm2] and 409.765 [kgf/cm2]. As mass source, the model considers only dead load, because permanent loads of endings and live loads were not present during the monitoring period. Gross section was considered for all elements and beam did not considered the contribution of the slab.
Maximum differences between 2% and 14% on the modal frequency are found when experimental and finite element models results are compared. Figure 12 shows correlation between real and predicted frequencies for the first and second mode. The differences between the dynamic properties of the real structure and the finite element adaptive model has not been studied in detail yet, but could initially be associated with the restraint
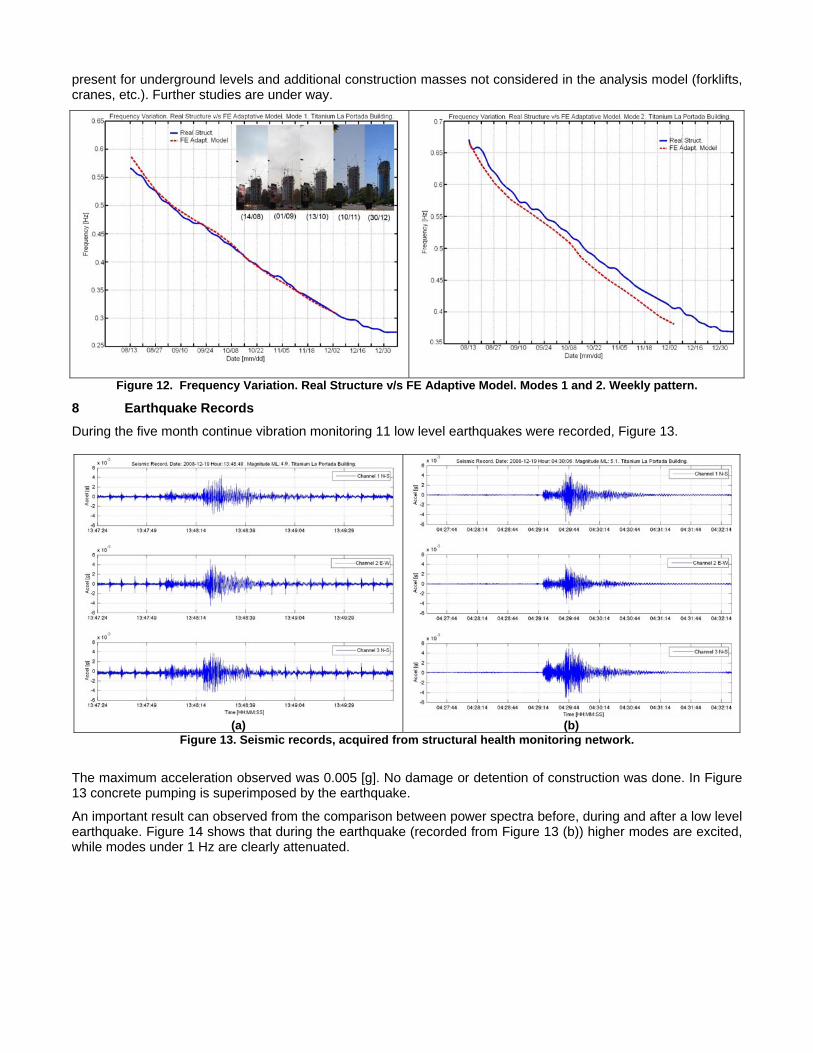
present for underground levels and additional construction masses not considered in the analysis model (forklifts, cranes, etc.). Further studies are under way.
Figure 12. Frequency Variation. Real Structure v/s FE Adaptive Model. Modes 1 and 2. Weekly pattern.
8 Earthquake Records
During the five month continue vibration monitoring 11 low level earthquakes were recorded, Figure 13.
(a)
(b)
Figure 13. Seismic records, acquired from structural health monitoring network.
The maximum acceleration observed was 0.005 [g]. No damage or detention of construction was done. In Figure 13 concrete pumping is superimposed by the earthquake.
An important result can observed from the comparison between power spectra before, during and after a low level earthquake. Figure 14 shows that during the earthquake (recorded from Figure 13 (b)) higher modes are excited, while modes under 1 Hz are clearly attenuated.

(a) PSD before the low level earthquake
(b) PSD during the low level earthquake
(c) PSD after the low level earthquake
Figure 14. Power Spectral Density before, during and after a low level earthquake.
9 Conclusions
Through continuous monitoring of a high rise building under construction, 13 frequencies and damping ratios were identified. For natural frequencies, weekly and daily variation patterns were determined. Weekly variations of frequency, caused by the construction of additional floors, were found to be in the range between 1.5% and 5.5%, while daily variations, caused by environmental day-night cycles and working routine, reached values of up to 1.6%. The analysis established that the damping ratio for the monitoring period, under ambient vibration and construction process, is in a range between 0.5% and 1.5%. The damping ratio exhibited a strong dependence on the amplitude of vibration.

10 Acknowledgements
The Civil Engineering Department of the University of Chile and the Chilean Council for Research and Technology, CONICYT Fondecyt Project # 1070319 supported this research paper.
ASL Sencorp and Alfonso Larrain Vial. ALV & Associated, Structural Engineers for the valuable information about the building and structural considerations.
11 References
[1] Boroschek R, Castillo A. “Using the nonparametric frequency method and SSI for identifying modal properties of buildings”. IX Seismology and Earthquake Eng. Chilean Congress. Concepcion, Chile. 2005 [2] Brincker R, Zhang L and Andersen P. “Modal Identification of output-only system using frequency domain decomposition”. Institute of Physics Publishing. Smart Materials and Structures. 10 441-445. 2001. [3] Brownjohn J. “Ambient vibration studies for system identification of tall buildings”. Earthquake Engineering and Structural Dynamics, 2003; 32: 71-95. 2002. [4] Carreno R. “Variation of dynamic properties of Chilean Chamber of Construction Building: seismic case”. Civil Engineering Thesis. University of Chile. Chile. 2009 [5] Clinton J, Bradford S, Heaton T, and Favela J. “The Observed Wander of the Natural Frequencies in a Structure”. Bulletin of the Seismological Society of America, Vol. 96, No. 1, pp. 237–257. 2006. [6] Hernandez F. “Analysis of Methods for Identification Dynamic Properties Variation”. MSc. Earthquake Engineering Thesis. University of Chile. Chile. 2009. [7] Johnson E, Lam H, Katafygiotis L and Beck J. “Phase I IASC-ASCE structural health monitoring benchmark problem using simulated data”. Journal of Eng. Mechanics, vol. 130, N° 1, January 2004, pp. 3-15. 2004. [8] Meirovitch L. “Analytical Methods in Vibrations”. Macmillan Publishing CO., Inc. 1967. [9] Ni Y, Chia Y, Liao W and Ko J. “Technology Innovation in developing the structural health monitoring system for Guangzhou New TV Tower”. Structural Control and Health Monitoring. N° 16: pp. 73-98. 2009 [10] Nunez T. “Variation due to changes in mass and stiffness of dynamic properties of a structure in construction process”. MSc. Earthquake Engineering Thesis. University of Chile. Chile. 2009 [11] Peeters B. and De Roeck G. “System Identification and Damage Detection in Civil Engineering”. PhD. Thesis. Katholieke Universiteit Leuven, Faculteit Toegepaste Wetenschappen. Belgium. 1998. [12] Ren W. and Zong Z. “Output-only modal parameter identification of civil engineering structures”. Structural Engineering and Mechanics, Vol. 17, No 3-4. 2003. [13] Turek M. “A Method for Implementation of Damage Detection Algorithms for Civil Structural Health Monitoring Systems”. PhD Thesis. The Faculty of Graduate Studies (Civil Engineering). University of British Columbia. 2007. [14] Van Overschee P. and De Moor B. ‘’Subspace algorithms for the stochastic identification problem”. Automatica, Vol. 29, no. 3, pp. 649-660. 1993. [15] Van Overschee P. and De Moor B. “Subspace Identification for Linear Systems: Theory-Implementation-Applications”. Kluwer Academic Publishers, Dordrecht, The Netherlands. 1996. [16] Ventura C, Schuster N. “Structural dynamic properties of a reinforced concrete high-rise building during construction”. Canadian Journal of Civil Engineering. Vol. 23, N° 4, pp. 950-972. 1996.