a design guide for footfall induced vibration of structures.pdf

Inter�noise 2014 Page 1 of 10
Modal floor parameters and their correlation with footfall vibration
Dominik DUSCHLBAUER1; Aaron MILLER
2;
1,2SLR Consulting Australia Pty Ltd, Australia
ABSTRACT
Excessive floor vibration in buildings can make occupants uneasy and many prediction methods of
varying degree of sophistication have been developed over the years to assist engineers in the
prediction of footfall vibration. This paper presents a statistical analysis of footfall vibration
measurements on a series of relatively stiff floors which exhibit impulse response behaviour. The
correlation of dynamic floor properties (such as dynamic and static stiffness, fundamental frequencies,
damping and functional combinations) with measured footfall vibration is discussed. The discussion
considers correlation with time�domain measurement data and one�third octave data. More than thirty
result sets are presented and subjected to statistical analyses.
Keywords: Footfall Vibration, I�INCE Classification of Subjects Number: 42
1. INTRODUCTION
The response of structures to footfall vibration is of considerable interest and a large body of
research has been devoted to this topic over the decades.
Key input parameters of footfall prediction models depend on the type of approach and usually
include the modal mass of the floor, the static stiffness, the walker mass and stepping frequency and/or
the fundamental floor frequency. Particularly the fundamental floor frequency plays a pivotal role as
the separation of floor frequency and stepping frequency (and its harmonics) determines the
appropriate forcing and response model. This distinction is also often referred to as low frequency and
high frequency floors (according to Pavic et al. (14) this term was first coined by Wyatt and Dier in
1989 (18)) or resonant response floors and impulse response floors (Willford et al. (16)). There is no
clearly defined frequency cut�off frequency. Willford et al. (16) report a range of 5 Hz (1) to 19.2 Hz
(9) but state that ‘it is the current authors’ experience that the practical significance of resonance above
the fourth harmonic is very small’. Pavic et al. (14) report cut�off frequencies of 7 Hz (18), 8 Hz (13)
and 9 Hz (12). Ellis (6) suggests that damping may actually be the critical factor following observed
resonant build up on stiff but very lightly damped floors (having a fundamental floor frequency
greater than 8 Hz).
In this paper a large body of measured footfall data is presented. More than 70 result sets were
reviewed and condensed to a total of 31 sets that are presented and discussed in this paper. For the
purpose of footfall vibration the chosen floors can be accurately approximated as Single Degree of
Freedom (SDOF) systems. The chosen data can be classified as stiff floors as the maximum footfall
response coincides with the frequency of the dominant floor mode. .
Actual test data is used as input into different prediction models to determine the accuracy and
applicability of the models. In addition, the dependence of modal parameters on footfall vibration is
also discussed in terms of the square of Pearson’s product�moment correlation coefficient, referred to
as the coefficient of determination.
2. DATA SETS
All measurements were conducted on suspended floors in office buildings with concrete columns.
The floors were either reinforced concrete or composite floors. At the time of testing all floors were
bare ie no fit�out, furniture, floor treatments (eg carpet) or partitioning walls were installed.

Page 2 of 10 Inter�noise 2014
Page 2 of 10 Inter�noise 2014
2.1 Footfall Vibration
Footfall vibration was measured in the centre of each test bay with an accelerometer. The sampling
frequency was 256 Hz and continuous, unweighted acceleration time traces were recorded.
A walker would start from close to the centre of the adjacent bay, walk through the centre of the test
floor passing by the accelerometer, continue to walk towards the centre of the next bay, turn around
and return to the start point in a similar fashion. Only the maximum measured vibration descriptors of
both walk�throughs are used. Results are presented for two walkers; Walker Red (represented by red
diamonds in all Figures) with a mass of 75 kg and Walker Blue (represented by blue circles in all
Figures) with a mass of 115 kg.
Naturally, there is a large range of stepping frequencies spanning from as low as 60 beats per
minute (bpm) or 1 Hz to perhaps 150 bpm (2.5 Hz). In this publication all results are presented for a
nominal stepping frequency of 120 (bpm) or 2 Hz. While footfall results were available for a number
of discrete stepping frequencies, results for only one stepping frequency are presented as the focal
point of this paper is the influence of modal parameters.
All results are presented for a nominal stepping frequency of 120 beats per minute (bpm) or 2 Hz.
The actual stepping frequencies were acquired from the measurements through inspection of the
narrowband spectra, and ranged from 2.01 Hz to 2.12 Hz. The mean of the actual stepping frequencies
was calculated as 2.05 Hz which is very close to the targeted stepping frequency.
Throughout this paper, all quoted frequencies have been determined from spectra with 0.2 Hz
resolution and subsequently interpolation procedures were applied (Gasior (8)).
2.2 Dynamic Floor Properties
The footfall measurements were collected on 27 different floors3. The dynamic floor properties of
each floor were determined through impact tests. A floor was impacted with a rubber tipped hammer at
midbay (the geometric centre of the bay) and the acceleration response at midbay was recorded using
an accelerometer. Results were averaged over (typically) five impacts. Five second time windows were
used giving a frequency resolution of 0.2 Hz.
All floors exhibit a dominant, vertical structural mode. Typical floor characteristics of a floor that
has been included in this study is Floor 1 presented in Miller et al. (11). The frequency of the dominant
mode is referred to as the fundamental floor frequency. Each floor is characterized in terms of the
vertical drivepoint mobility at midbay. In addition for each floor the underlying modal mass, damping
and dynamic stiffness were estimated by curve�fitting a single degree of freedom system (de Silva (5)).
The static stiffness was estimated by extrapolating the receptance spectrum towards zero Hertz (Amick
et al.(2)).
All impact test data exhibited excellent coherence at the fundamental and the estimates on modal
mass, damping and dynamic stiffness are therefore judged as accurate. The estimates on the static
stiffness required extrapolation at low frequencies where the coherence was poor due to 1/f noise and
therefore some uncertainty is associated with these estimates.
2.3 Data Correlation
The square of Pearson’s product�moment correlation coefficient is used to gauge the strength of a
relationship between two sets of variables (Kreyszig (10)). This value is referred to as the coefficient
of determination (Taylor (15)). This coefficient indicates how well the data sets can be approximated
with a linear relationship. A perfect correlation exists when the coefficient of determination is one. A
coefficient of determination of close to zero indicates that there is a weak linear relationship between
the two variables.
The coefficient of determination quantifies the percentage of the variation of the dependent
variable that can be attributed to the variations in the independent variable. While this coefficient
provides a means of directly comparing the influence of modal parameters on the maximum footfall
vibration levels in terms of a percentage, it does not imply that the independent variable is the cause of
the change.
3 Two data sets (Walker Blue and Red) were available on four floors.

Inter�noise 2014 Page 3 of 10
Inter�noise 2014 Page 3 of 10
3. RESULTS
3.1 Velocity Metrics and Dominant Frequencies
Three velocity descriptors are used: the maximum instantaneous velocity or peak particle velocity
(PPV) of the recorded walk�by, the peak hold, root�mean�square 1/3 octave band velocity and a
running 1s root�mean�square (RMS) overall velocity. The left graph in Figure 1 shows the measured
1/3 octave velocities and the measured PPVs versus the measured 1s RMS velocities. An almost linear
dependence can be observed which is reflected in high coefficients of determination of 0.96 and 0.97
for PPV to 1s RMS and 1/3 octave velocities to 1s RMS, respectively. The measured PPVs range from
0.35 mm/s to 2.5 mm/s. The PPVs are approximately 1.75 times the 1s RMS velocities and the 1/3
octave velocities are generally very close to the 1s RMS velocities due to the tonal floor vibration
characteristics.
On the right graph in Figure 1 the fundamental floor frequencies are plotted versus the dominant
floor response frequency (all frequency estimates were interpolated from 0.2 Hz spectra). The
coefficient of determination between these two variables is 0.996. The floor fundamentals range
from 5.7 Hz to 11.1 Hz with approximately half of the floors having a fundamental frequency in the
8±0.5 Hz bandwidth.
Figure 1 – Velocity descriptors (left) and frequencies (right)
3.2 Modal Parameters
The six graphs in Figure 2 demonstrate the dependence of selected modal properties on PPVs.
While this data is showing scatter, some trends can be clearly identified. Coefficients of determination
of the discussed modal properties and footfall vibration are presented in Table 1. PPVs generally
provide the best data correlation while correlation with the 1/3 octave velocity data is always poorest.
Fundamental floor frequencies versus PPVs are plotted in the graph on the top left. Floor vibration
generally decreases with increasing floor fundamental. The dependence is strong for the floors with
fundamental frequencies greater than 8.5 Hz. However, a large PPV range is observed over the small
frequency range of 8±0.5 Hz.
The floors’ mobilities at their fundamental frequencies versus measured PPVs are shown in the
graph on the top right, Figure 2. The mobilities range from 0.009 mm/s per N to 0.09 mm/s per N and
increase with increasing PPV.
PPVs decrease with increasing modal mass (center left graph, Figure 2). The modeshapes of the
investigated floors have modal masses of 4 t to 42 t associated with their fundamental mode.
Damping (center right graph, Figure 2) generally ranges from 1% to 3% which is comparatively
high for bare concrete floors as Willford et al. (17) specify a 1% to 2% critical damping for bare
reinforced concrete floors. No influence of damping on the PPVs is apparent. Linear regression
actually indicates that floor vibration increases with damping which is counter�intuitive. Of all plotted
parameters, damping and PPVs exhibit the lowest coefficient of determination (Table 2).
The two graphs in the bottom row of Figure 2 show the dependence of the static stiffness (left) and
the dynamic stiffness (right) on the floors’ PPVs. For each floor the dynamic stiffness is on average 2.5
times greater than the static stiffness.

Page 4 of 10 Inter�noise 2014
Page 4 of 10 Inter�noise 2014
Figure 2 – Modal Floor Properties
In addition to the modal parameters, Table 1 also presents the coefficients of determination of some
selected functional combinations which are commonly used for predicting footfall vibration.
Correlation can be increased and there may be potential for a more rigorous statistical analysis of the
used data sets.
The dynamic stiffness exhibits the best correlation. Surprisingly the mobility (which can be viewed
as a combination of dynamic stiffness, damping and modal mass) shows comparatively poor
correlation. The static stiffness correlates very well justifying approaches utilizing the static stiffness.
From a design perspective, the static stiffness is often the only parameter that can be provided with
some degree of accuracy.
The authors note that correlation with scaled velocities (ie Walker Blue vibration reduced by 53% �
75 kg/115 kg) always yields poorer correlation than using the actual measured velocities. Some
prediction approaches for stiff floors have the walker mass factored in (eg resonant response methods
Willford et al. (17) and Allen et al. (12)) and the data set presented in this paper does not support this.

Inter�noise 2014 Page 5 of 10
Inter�noise 2014 Page 5 of 10
Table 1 – Coefficients of Determination
Parameter Functional Representation PPV 1s RMS 1/3 Octave
Modal Mass m, Eq. (1) m1 0.58 0.56 0.46
Floor Fundamental fn nf
1 0.67 0.58 0.49
Static Stiffness, k0 0
1k
0.64 0.58 0.43
Dynamic Stiffness, kdyn dynk
1 0.70 0.65 0.53
Mobility at Fundamental, M M 0.58 0.59 0.49
Damping, ζ ς1 0.14 0.12 0.10
Scaled Floor Fundamental
(part of Equations 1, 2, 3) 30.1
1
nf 0.67 0.59 0.49
Scaled Floor Fundamental
(part of Equations 1, 2) 30.1
43.1
n
step
f
f 0.69 0.61 0.51
Equations 1, 2, 3 30.1fm
1
n× 0.68 0.64 0.52
Equations 5, 6 0n kf
1
× 0.69 0.60 0.46
4. PREDICTION METHODS
4.1 Methods based on modal mass
For a SDOF floor it is found that the amplitude of the velocity of the floor is proportional to the
effective impulse and inversely proportional to modal mass. This is shown in Eq. (1), where I is the
impulse and m is the modal mass.
mIPPV ≈ (1)
Eq. (1) can be used for continuous systems where the system is approximated as a series of SDOFs
and a summation over all contributing modes (up to twice the fundamental) is required. If the floor is
similar to a single degree of freedom, there’s no summation and results can simply be expressed at the
fundamental frequency, depending on modal mass only.
Within this framework, different ways of implementing the effective impulse have been reported.
Willford et al. (17) use Eq. (2) where the impulse is dependent on the stepping frequency of the walker
and the fundamental floor frequency. The coefficient of 54 in Eq. (2) is based on the upper quartile of
the database used in Willford (17), and is intended to be used for design purposes. Hicks et al. (9)
provide impulse estimates independent on the stepping frequency (Eq. (3)). Both formulas do not
account for the mass of the walker. For a nominal stepping frequency of 2 Hz, Eq. (3) gives 30%
greater effective impulses than Eq. (2).

Page 6 of 10 Inter�noise 2014
Page 6 of 10 Inter�noise 2014
30.1
43.1
54n
step
f
fI ×= (2)
30.1
1190
nfI ×= (3)
The left graph in Figure 3 shows the predicted PPVs (using Eqs. (1, 3) and the actual modal mass,
stepping frequencies and fundamental floor frequencies) versus the measured PPVs. With the Hicks et
al. (9) impulse footfall vibration is generally under�predicted for the considered data set. The Willford
et al. (17) method under�predicts footfall vibration even more so since the associated effective impulse
is 30% smaller. Initially, contributions from higher order modes with lower modal mass were believed
to be a possible cause of this under�prediction. However, inspection of narrowband FFTs of the floor
response did not support this. The discrepancy may also arise from the fact that effective impulses may
have partially been derived based on nominal mass (eg approximated as the mass of one quarter of the
bay) rather than actual modal mass.
Figure 3 – Predicted PPV versus measured PPV (left) and back�calculated impulse versus floor fundamental
(right)
Eq. (1) has been used to calculate the actual impulse force by multiplication of the measured PPVs
and measured modal mass. The right graph of Figure 3 shows the impulse force back�calculated from
the data versus fundamental floor frequency. The same graph also shows the theoretical impulse forces
as per Eq. (2) and Eq. (3) (black squares and triangles, respectively). The average back�calculated
impulse is 17.2 Ns compared to 10.4 Ns for Eq. (2) and 13.1 Ns for Eq. (3).
A point of note is the cluster of high impulses calculated where the fundamental floor frequency is
approximately 8 Hz. As the stepping frequency is nominally 2 Hz, an intuitive conclusion is that the
high impulses are actually a resonant response to the fourth harmonic of the stepping frequency.
The left graph in Figure 4 illustrates a ratio of an integer multiple of the stepping frequency (with
the integer chosen so the stepping frequency is multiplied to correspond with the floor fundamental as
close as possible) divided by the floor fundamental, which is plotted against the measured impulse. If
the floors were undergoing a harmonic response, one would expect that when an integer multiple of the
stepping frequency approaches the floor fundamental, that the measured impulse would increase
dramatically. Figure 4 contradicts this assumption. Additionally, if the floors were undergoing a
harmonic response, one would also expect that at frequencies distant from integer multiples of the
stepping frequency the response would be comparatively low. Examining the results on the right in
Figure 3 at 7 Hz and 9 Hz (both of which are distant from integer multiples of the stepping frequency)
also contradicts this assumption.
In addition, it is found that this cluster does not have particularly low damping values (right graph,
Figure 4). Ellis (6) suggests that this resonant buildup can occur at stiff floors which are lightly
damped (less than 1%).

Inter�noise 2014 Page 7 of 10
Inter�noise 2014 Page 7 of 10
Figure 4 –Ratio of i
th�harmonic over floor fundamental closest to unit (left) and impulse versus
damping (right).
4.2 Methods based on static stiffness
Brownjohn et al. (4) present a simple formula (Eq. 5) which calculates one�third octave band
velocity based on the static floor stiffness, k0, and the fundamental frequency, fn. The constant Cw
equals 70,000. The predictions do not depend on walker mass or stepping frequency and are very
simple to use.
0n
wRMS
kf
Cv
×= (5)
Eq. (6) is based on Murray et al. (12) and used the static stiffness of the floor, the fundamental
frequency and the dependence of maximum force on the stepping frequency from Galbraith et al. (7).
The maximum RMS floor velocity is expressed as
0n
2
0m1
kf
fFπ75.1v
××××= −
RMS (6)
In Eq. (6), f0 is the inverse of the footfall rise�time and Fm is the maximum force. Murray et al.
(12) states that equations pertain ‘to the instantaneous maximum or “peak” vibration’ and a 175.1 −
peak�RMS scaling factor (refer to Section 3.1) was introduced by the authors to match the crest factor
of the data set. While f0 depends on stepping frequency only, Fm depends on the stepping frequency and
the walker mass. For a nominal stepping frequency of 2 Hz, f0 equals 7 (upper and lower bound range
from perhaps 3 to 15) and Fm equals 81.99.1 ××W , where W is the walker mass in kilograms.
The left graph in Figure 5 compares the Brownjohn et al. (Eq. 5) predictions with the measured 1s
RMS levels. The right graph in Figure 5 compares the (modified) AISC chapter 6 (Eq. 6) predictions
with the measured 1s RMS levels.
The Brownjohn et al. method generally shows comparatively good agreement and over�predicts
floor vibration on average by 1.3. The over�predictions generally increase with increasing absolute
vibration levels and the maximum over�prediction of this method is 3. The maximum under�prediction
is 0.5.
The AISC chapter 6 method is found to over�predict vibration, particularly for Walker Blue. On
average, this method over�predicted measured vibration levels by 3.2. The maximum over�prediction
is greater than 8 and similarly to the Brownjohn et al. method, over�predictions increase with
increasing absolute vibration level. The conservatism of this method may be due to the dependence of
the walker mass which actually may not be an influence factor on stiff floors (ie as assumed by the
impulse approach methods (previous section) and the Brownjohn et al. approach).
Page 8 of 10 Inter�noise 2014
Page 8 of 10 Inter�noise 2014
Figure 5 – Predictions versus measured – Left: Brownjohn et al., Right: AISC chapter 6.
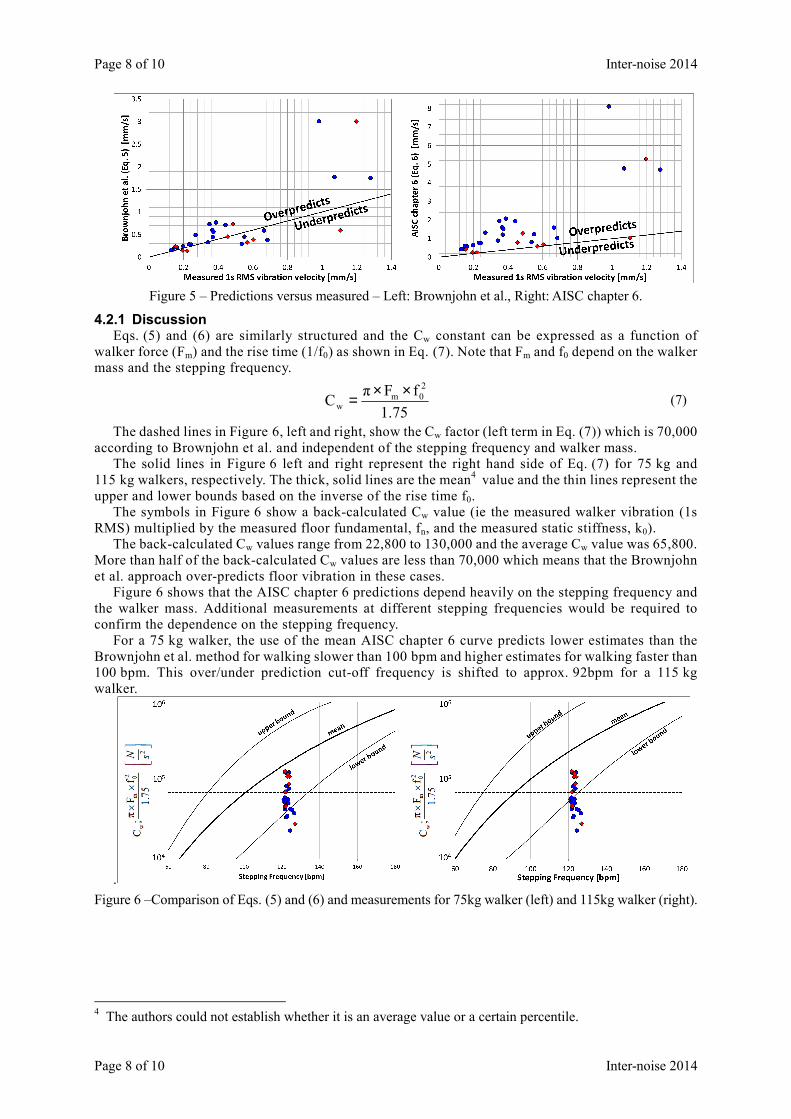
4.2.1 Discussion Eqs. (5) and (6) are similarly structured and the Cw constant can be expressed as a function of
walker force (Fm) and the rise time (1/f0) as shown in Eq. (7). Note that Fm and f0 depend on the walker
mass and the stepping frequency.
75.1
fFπC
2
0mw
××= (7)
The dashed lines in Figure 6, left and right, show the Cw factor (left term in Eq. (7)) which is 70,000
according to Brownjohn et al. and independent of the stepping frequency and walker mass.
The solid lines in Figure 6 left and right represent the right hand side of Eq. (7) for 75 kg and
115 kg walkers, respectively. The thick, solid lines are the mean4 value and the thin lines represent the
upper and lower bounds based on the inverse of the rise time f0.
The symbols in Figure 6 show a back�calculated Cw value (ie the measured walker vibration (1s
RMS) multiplied by the measured floor fundamental, fn, and the measured static stiffness, k0).
The back�calculated Cw values range from 22,800 to 130,000 and the average Cw value was 65,800.
More than half of the back�calculated Cw values are less than 70,000 which means that the Brownjohn
et al. approach over�predicts floor vibration in these cases.
Figure 6 shows that the AISC chapter 6 predictions depend heavily on the stepping frequency and
the walker mass. Additional measurements at different stepping frequencies would be required to
confirm the dependence on the stepping frequency.
For a 75 kg walker, the use of the mean AISC chapter 6 curve predicts lower estimates than the
Brownjohn et al. method for walking slower than 100 bpm and higher estimates for walking faster than
100 bpm. This over/under prediction cut�off frequency is shifted to approx. 92bpm for a 115 kg
walker.
.
Figure 6 –Comparison of Eqs. (5) and (6) and measurements for 75kg walker (left) and 115kg walker (right).
4 The authors could not establish whether it is an average value or a certain percentile.
Inter�noise 2014 Page 9 of 10
Inter�noise 2014 Page 9 of 10
5. CONCLUSIONS
A set of 31 footfall vibration measurements on floors of known dynamic properties were discussed.
All floors had dominant, fundamental modes which were excited by the walkers and which dominated
the floor vibration spectra.
It was found that the modal parameter that correlated best with footfall vibration was dynamic
stiffness. However, no commonly used methods that use dynamic stiffness are known to the authors
and from a design perspective this parameter may be difficult to predict reliably.
A combination of fundamental floor frequency and static stiffness was found to correlate well with
footfall vibration. Conversely to dynamic stiffness, the static stiffness and fundamental frequency can
usually be determined (reasonably) accurately during the design phase.
The employed static stiffness based methods were found to over�predict footfall vibration levels at
the investigated discrete stepping frequency of 2 Hz. The static stiffness based methods were found to
match better when the predicted footfall vibration was low. The higher the predicted footfall vibration,
the greater the over�prediction.
Impulse based approaches dependent on modal mass and scaled floor fundamental were found to
generally under�predict footfall vibration. The accuracy of the used approaches may prove more
reliable at different stepping frequencies and more work is required to ascertain this finding.
For the considered floors, damping was found to correlate very poorly with the measured footfall
vibration. While this is not surprising for the PPVs, a better dependence was anticipated for the 1 s
RMS velocities. However, this is not supported by the coefficient of determination which is lower for
1 s RMS than for PPVs.
Finally, the authors wish to point out that all results presented are for only two walkers and one
discrete stepping frequency. A greater representative sample (comprising various walker styles,
stepping frequencies and walker masses) is clearly required to further substantiate the conclusions.
REFERENCES
1. Allen D E, Murray T M. Design criterion for vibrations due to walking. AISC Engineering Journal. Vol.
40; Part 4; 1993. p. 117�129.
2. Amick H, Gendreau M, Bayat A. Dynamic characteristics of structures extracted from in�situ testing.
SPIE Conference on Opto�mechanical Engineering and Vibration Control; 1999.
3. British Standards Institution. Appendix C Vibration Serviceability Requirements for Foot and Cycle
Track Bridges. BSI, London, BS 5400, Part 2. 1978.
4. Brownjohn J, Pavic A. Vibration control of ultra�sensitive facilities. Structures & Buildings 159; 2006.
5. de Silva C W. Vibration and shock handbook. CRC Press; 2005.
6. Ellis B R. On the response of long�span floors to walking loads generated by individuals and crowds.
The Structural Engineer; 78; No. 10; 2000. p 17–25.
7. Galbraith F W, Barton M V. Ground Loading from Footsteps, Journal of the Acoustical Society of
America; 48; 1970. p. 1277�1292.
8. Gasior M, Gonzalez J L. Improving FFT frequency measurement resolution by parabolic and gaussian
spectrum interpolation. 11th Beam Instrumentation Workshop; 2004.
9. Hicks S J, Devine P J. Design guide on the vibration of floors in hospitals. Steel Construction
Institute; Silwood Park; Ascot; Berkshire; 2004.
10. Kreyszig E. Advanced Engineering Mathematics. John Wiley & Sons 10th Edition; 2011. p.
1105�1108.
11. Miller A, Duschlbauer D. Footfall vibration and the dynamic response of different structures – A case
study comparing predicted and measured results. Proceedings of Acoustics 2013; Victor Harbor; 2013.
12. Murray T M, Allen D E, Ungar E E. Floor Vibrations due to Human Activity. AISC Steel Design Guide
Series 11; 1997.
13. Ohlsson S V. Ten years of floor vibration research � A review of aspects and some results. In:
Proceedings of the Symposium/Workshop on Serviceability of Buildings (Movements, Deformations,
Vibrations). Vol. 1. 1988. p 419�434.
14. Pavic A, Reynolds P, Prichard S, Lovell M. Evaluation of mathematical models for predicting
walking�induced vibrations of high�frequency floors. Int. J. Str. Stab. Dyn. 03, 107; 2003.
15. Taylor R. Interpreation of the correlation coefficient: A basic review. Journal of diagnostic medical
sonography; Vol. 6; 1; 1990. p. 35�39

Page 10 of 10 Inter�noise 2014
Page 10 of 10 Inter�noise 2014
16. Willford M, Young P, Field C. Predicting footfall�induced vibration: Part I. Structures & Buildings
I 60; Issue SB2; 2007. p 65�72.
17. Willford M R, Young P. A design guide for footfall induced vibration of structures. The Concrete
Centre; 2006.
18. Wyatt T A, Dier A F. Floor serviceability under dynamic loading. Proceedings of the International
Symposium “Building in Steel � The Way Ahead”; (pp. 20.1�20.22). ECCS Publication No. 57; 1989. p
20.1�20.22.