Mobility MATTERS! Connecting People to Life Who Rides the Bus? How Understanding Transit Demographic...
39
Mobility MATTERS! Connecting People to Life Who Rides the Bus? How Understanding Transit Demographic Can Improve Service May 7, 2015
-
Upload
gladys-sparks -
Category
Documents
-
view
219 -
download
2
Transcript of Mobility MATTERS! Connecting People to Life Who Rides the Bus? How Understanding Transit Demographic...

Mobility MATTERS! Connecting People to Life
Who Rides the Bus? How Understanding Transit Demographic Can Improve Service
May 7, 2015
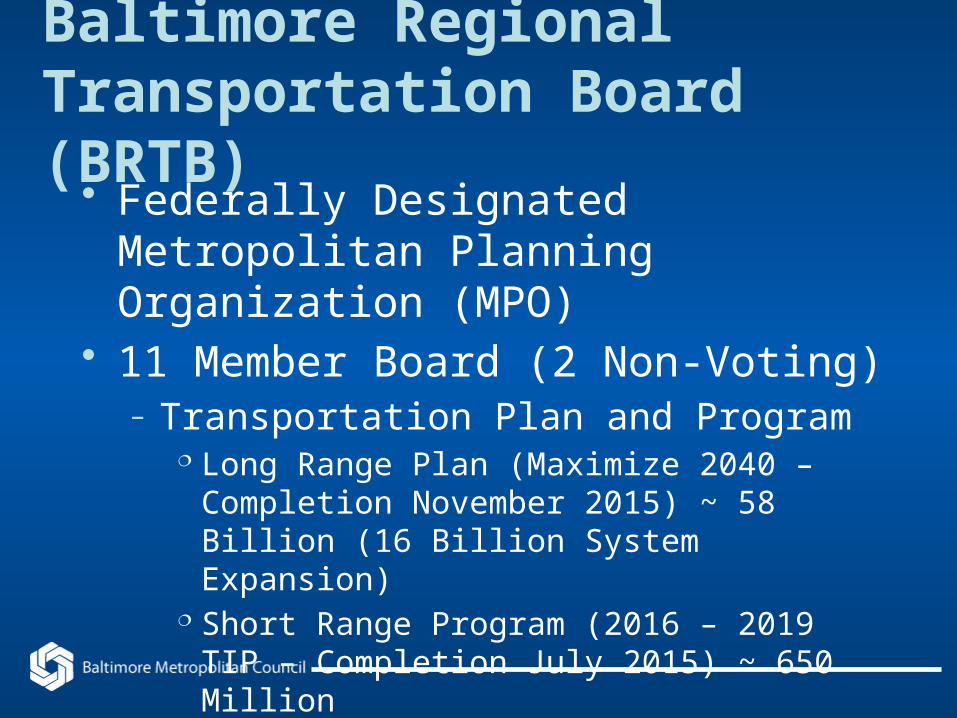
Baltimore Regional Transportation Board (BRTB)• Federally Designated Metropolitan
Planning Organization (MPO)• 11 Member Board (2 Non-Voting)
– Transportation Plan and Program Long Range Plan (Maximize 2040 – Completion
November 2015) ~ 58 Billion (16 Billion System Expansion)
Short Range Program (2016 – 2019 TIP – Completion July 2015) ~ 650 Million

MPO Area and Model Region
• MPO Area– 2.6 Mil. Pop.– 1.5 Mil. Emp.
• Portion of MWCOG– 2.3 Mil. Pop.– 1.7 Mil. Emp.
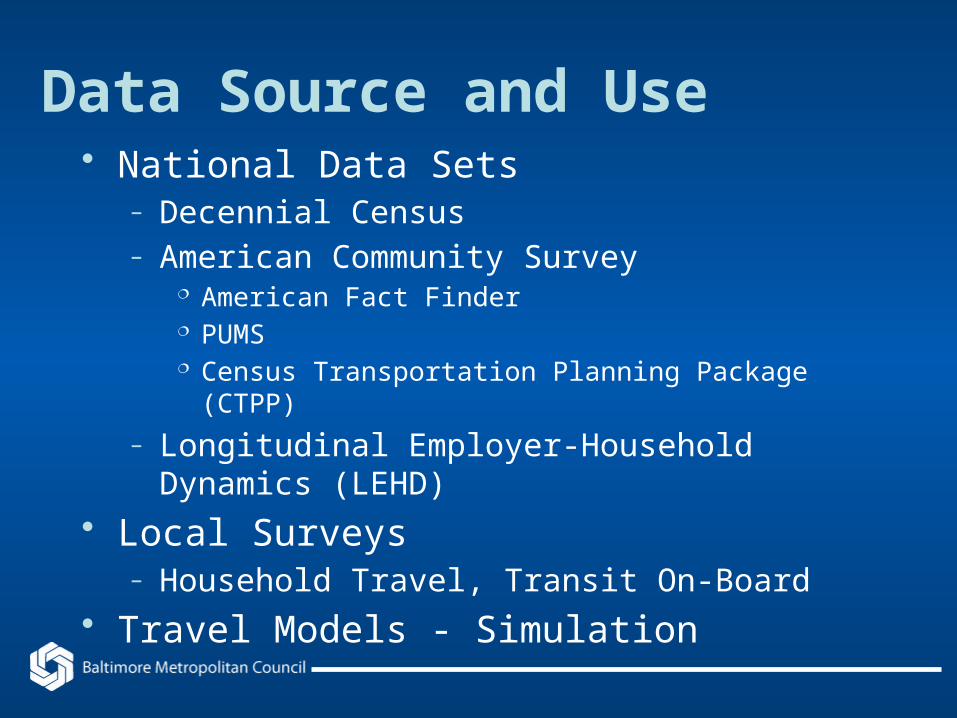
Data Source and Use• National Data Sets
– Decennial Census– American Community Survey
American Fact Finder PUMS Census Transportation Planning Package (CTPP)
– Longitudinal Employer-Household Dynamics (LEHD)
• Local Surveys– Household Travel, Transit On-Board
• Travel Models - Simulation

Decennial Census Data
• Every 10 Years• Complete Count, Data Available at
Small Geographies– Population items include sex, age, race,
Hispanic or Latino origin, household relationship, household type, household size, family type, family size, and group quarters.
– Housing items include occupancy status, vacancy status, and tenure
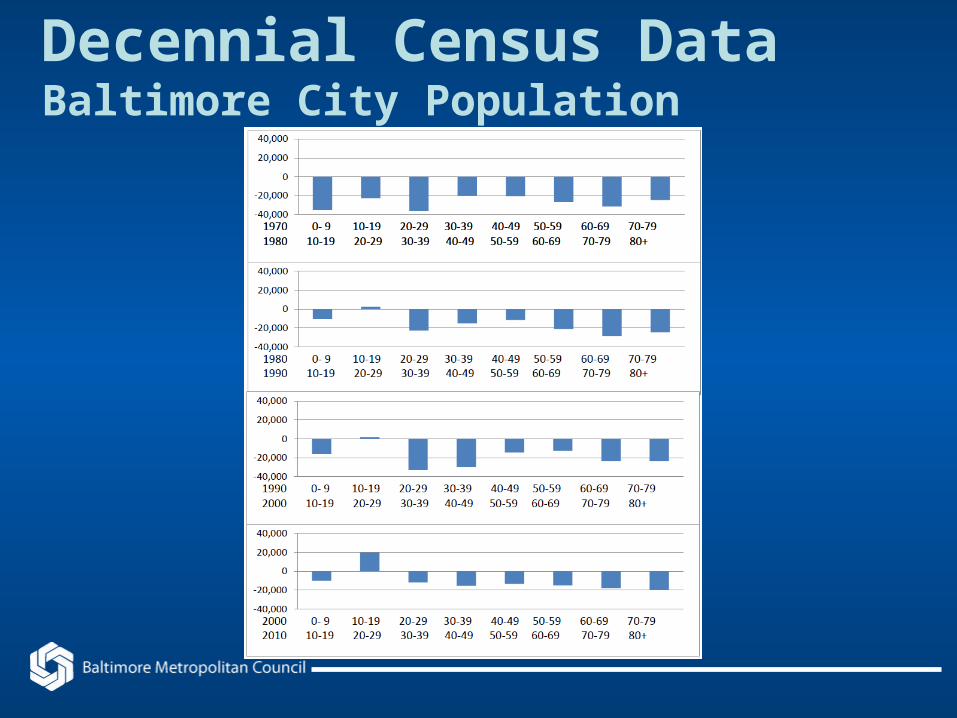
Decennial Census DataBaltimore City Population

Decennial Census DataHoward County

LEP Hispanic or Latino Heritage
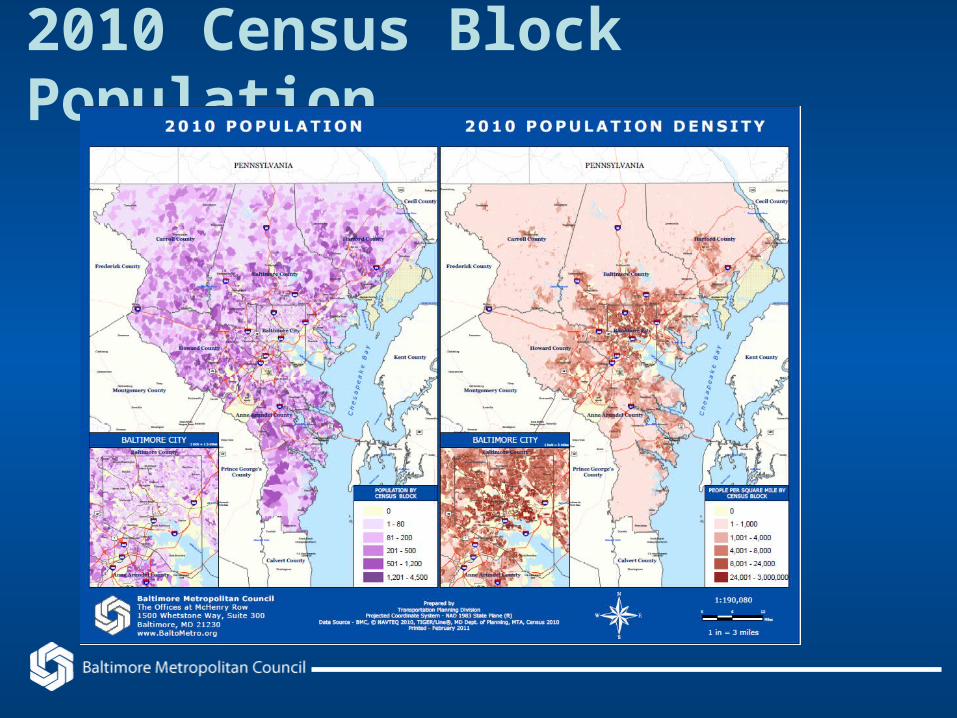
2010 Census Block Population

American Community Survey
• Annual Survey ~ 1 in 38 U.S. Households per Year Receives Invitation to Participate
• Data Products– 1 Year ~ Areas with 65,000 Population– 3 Year ~ Areas with 20,000 Population– 5 Year ~ All Areas

American Fact Finder• Existing Tabulations and Cross Tabs
– Topics – People and Housing– Geographies – States, Counties, Census
Geography– Program – Decennial, 1, 3, and 5 Year ACS
• Advantage – Retrieve Data for Small Geographies
• Disadvantage – Aggregate Data for Predetermined Tabulations and Cross Tabs

Columbia CDP, Maryland

Public Use Microdata Sample• A Set of Un-tabulated Records About
Individual People or Housing Units – Users Can Create Custom Tables
• 1, 3, and 5 Year Data Set – Multiyear Combinations of 1-Year PUMS with appropriate adjustment to Weights and Inflation Adjustment Factors
• Public Use Microdata Area (PUMAs) – Geographic Area with 100,000 Population
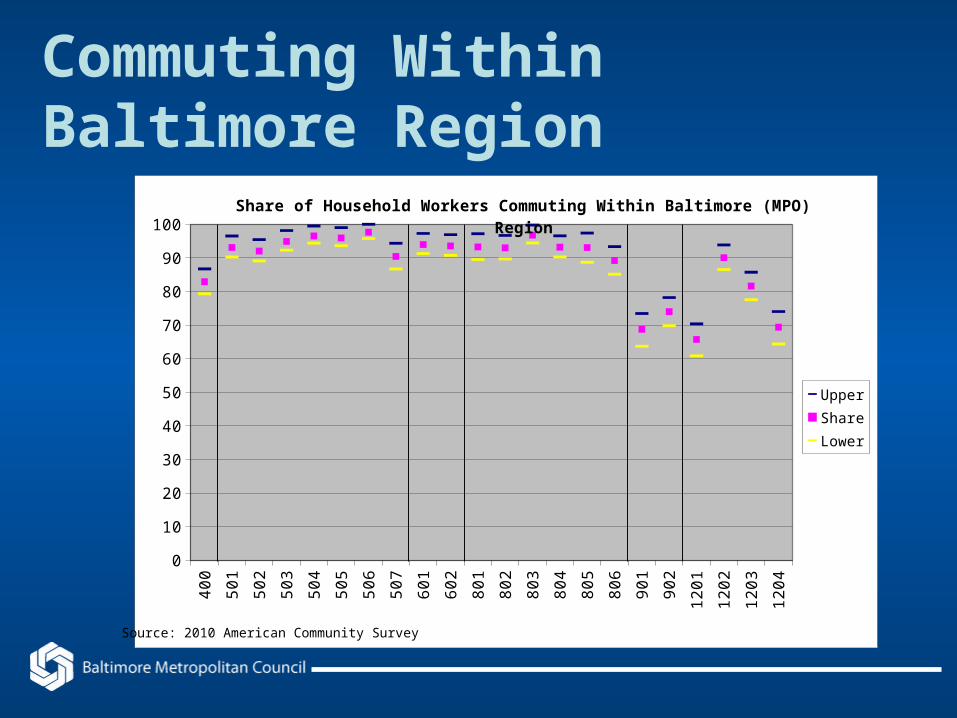
Commuting Within Baltimore Region
40
0
50
1
50
2
50
3
50
4
50
5
50
6
50
7
60
1
60
2
80
1
80
2
80
3
80
4
80
5
80
6
90
1
90
2
12
01
12
02
12
03
12
04
0
10
20
30
40
50
60
70
80
90
100Share of Household Workers Commuting Within Baltimore (MPO) Region
Upper
Share
Lower
Source: 2010 American Community Survey
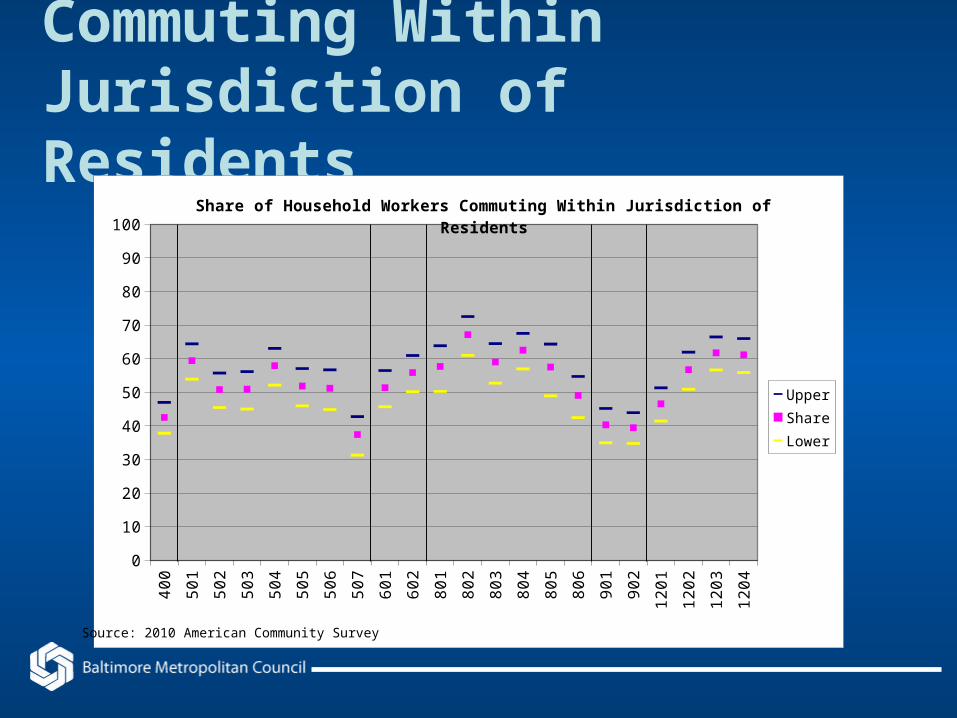
Commuting Within Jurisdiction of Residents
40
0
50
1
50
2
50
3
50
4
50
5
50
6
50
7
60
1
60
2
80
1
80
2
80
3
80
4
80
5
80
6
90
1
90
2
12
01
12
02
12
03
12
04
0
10
20
30
40
50
60
70
80
90
100Share of Household Workers Commuting Within Jurisdiction of Residents
Upper
Share
Lower
Source: 2010 American Community Survey

Carroll County
0
5,000
10,000
15,000
20,000
25,000
30,000
35,000
40,000
45,000
50,000
Carroll County PUMA 401Primary Work Location
Average
Upper
Lower
source : 2010 American Committee Survey

Baltimore County
0
5,000
10,000
15,000
20,000
25,000
30,000
35,000
40,000
45,000
50,000
Baltimore County PUMA 507Primary Work Location
Average
Upper
Lower
source : 2010 American Committee Survey

Central/East Baltimore City (PUMA 804)

Baltimore City Residents Place of Birth
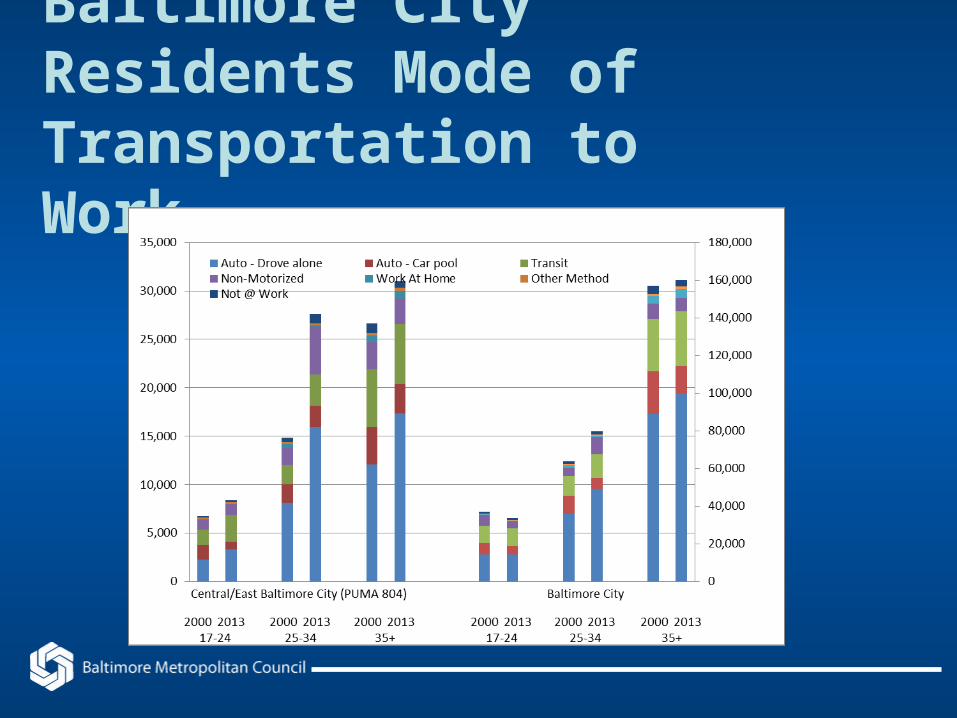
Baltimore City Residents Mode of Transportation to Work
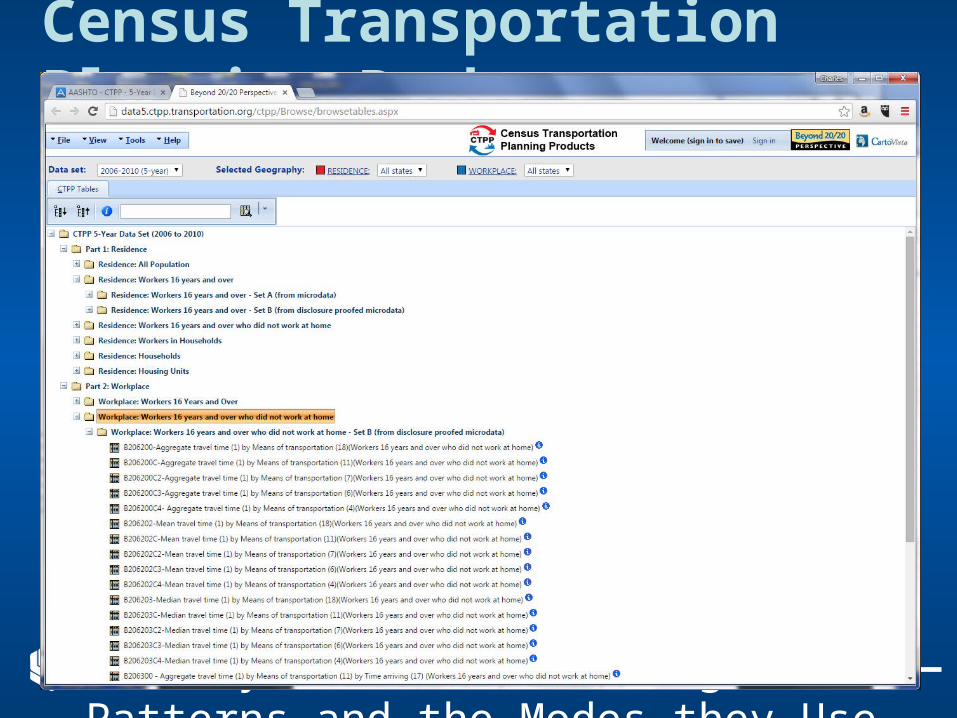
Census Transportation Planning Package (CTPP)• AASHTO Partnered with all of the States
on Pooled Fund Projects to Support the Development of Special Census Products and Data Tabulations for Transportation
• Proves Understanding of Characteristics about Where People Live and Work, their Journey to Work Commuting Patterns and the Modes they Use for Getting to Work
• Transportation Analysis Zones (TAZ)

Carroll, Freedom Area Residents Travel Mode to Work

Workers Travel Time to Work by Transit
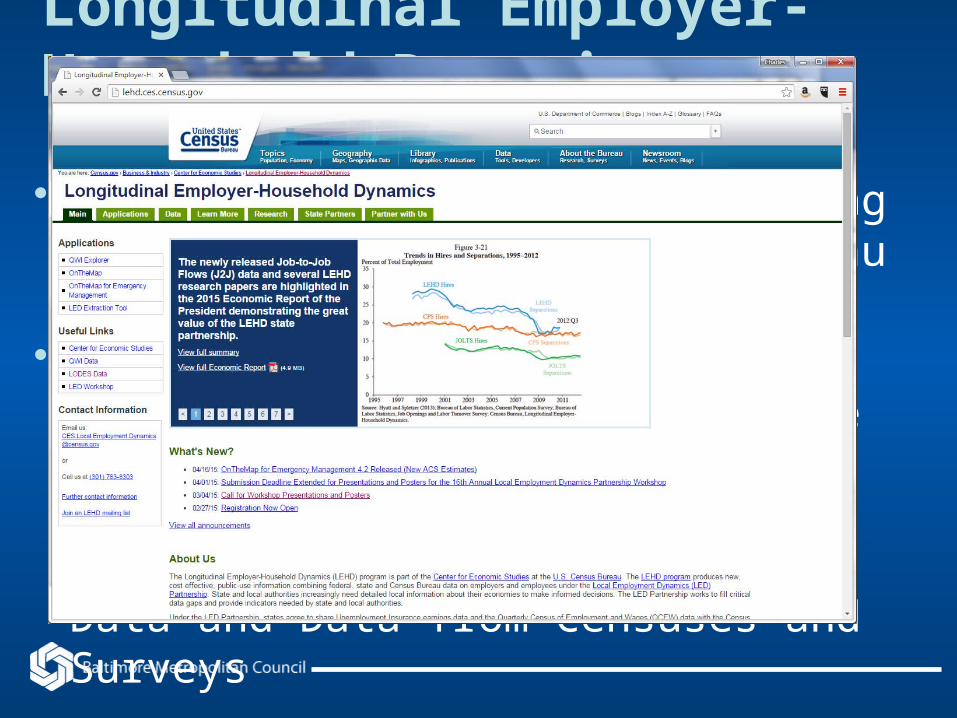
Longitudinal Employer-Household Dynamics (LEHD)• Public-Use Information Combining Federal,
State and Census Bureau Data on Employers and Employees
• States Share Unemployment Insurance Earnings Data and the Quarterly Census of Employment and Wages (QCEW) Data Combined with Additional Administrative Data and Data from Censuses and Surveys

Cherry Hill Residents Work Location 2011 LEHD

Cherry Hill – Workers Distance and Direction

Cherry LEHD Worker Flows
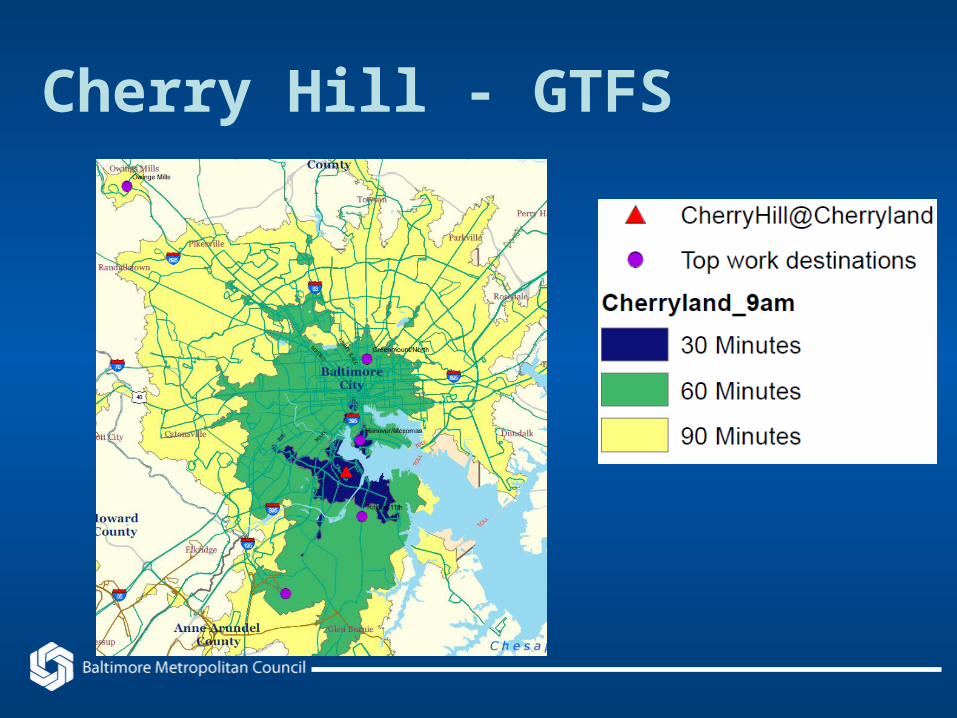
Cherry Hill - GTFS
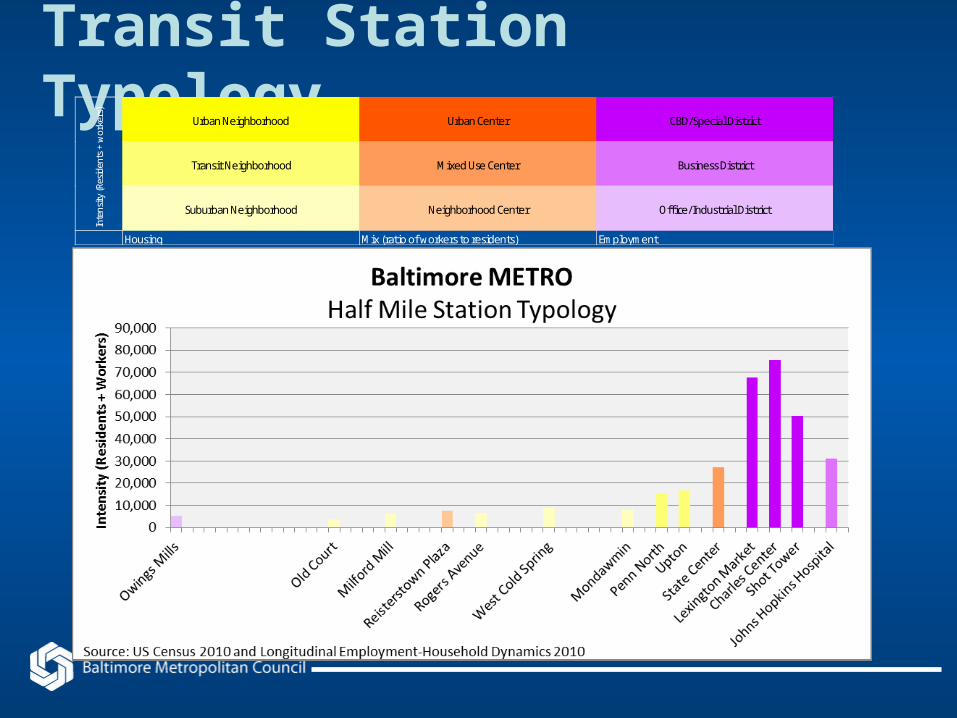
Transit Station TypologyUrban Neighborhood Urban Center CBD/Special District
Transit Neighborhood Mixed Use Center Business District
Suburban Neighborhood Neighborhood Center Offi ce/Industrial District
Housing Mix (ratio of workers to residents) Employment
Inte
nsity
(Res
iden
ts +
wor
kers
)

Transit Station Typology
Urban Neighborhood Urban Center CBD/Special District
Transit Neighborhood Mixed Use Center Business District
Suburban Neighborhood Neighborhood Center Offi ce/Industrial District
Housing Mix (ratio of workers to residents) Employment
Inte
nsity
(Res
iden
ts +
wor
kers
)

Baltimore Region 2040 Typology

Transit Propensity Index

Local Survey Data 2001 Household Travel Survey

2007 On-Board Transit Survey – Household Income

2007 On-Board Transit Survey – Access Mode
BUS RAL CRL All0%
10%
20%
30%
40%
50%
60%
70%
80%
90%
100%
No AnswerOtherDriveCarpoolTaxiBicycleDrop OffWalk
Mode
Sh
are
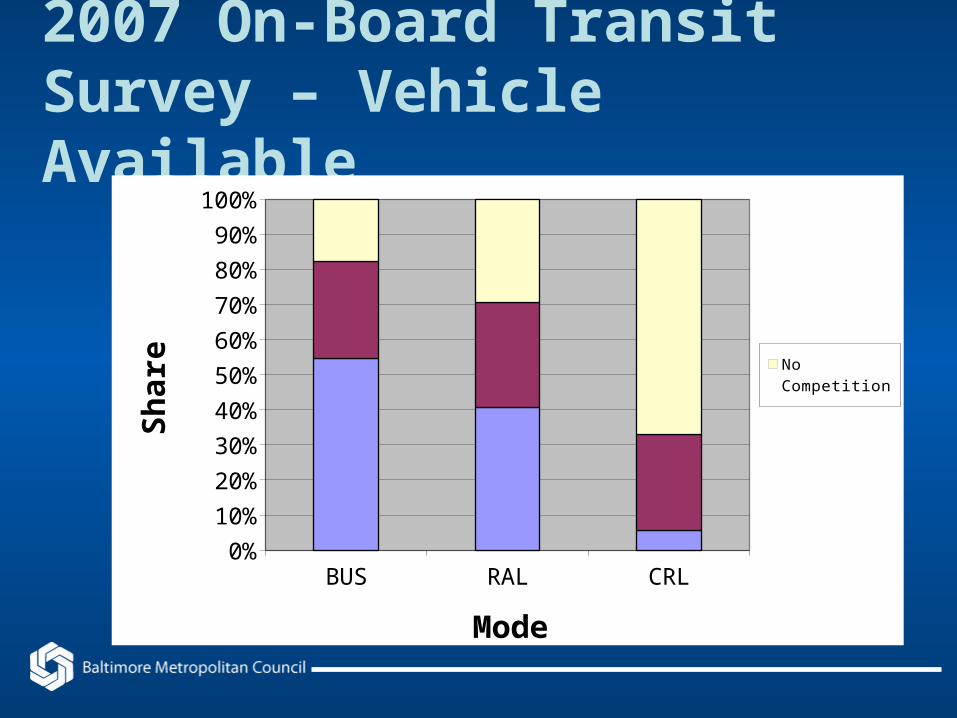
2007 On-Board Transit Survey – Vehicle Available
BUS RAL CRL0%
10%
20%
30%
40%
50%
60%
70%
80%
90%
100%
No CompetitionCompetitionNo Vehicle
Mode
Sh
are

2007 On-Board Transit Survey – Employer Fare Payment
BUS RAL CRL0%
10%
20%
30%
40%
50%
60%
70%
80%
90%
100%
No AnswerEmp FullEmp PartEmp NoneNot Employed
Mode
Sh
are

Travel Model Simulations – Home-Based Work Mode Share

For More Information
Charles Baber
Phone: 410-572-0500 extension 1056
www.baltometro.org