Mobility Management: Empirical Evidence of Fiscal Benefits from Multiple States
8
Mobility Management: Empirical Evidence of Fiscal Benefits from Multiple States Aaron Mack & Kari Ruse Grant Number: 46-0308-1046-100
-
Upload
nebraska-transit -
Category
Government & Nonprofit
-
view
10 -
download
0
Transcript of Mobility Management: Empirical Evidence of Fiscal Benefits from Multiple States

Mobility Management: Empirical Evidence of Fiscal Benefits from Multiple States
Aaron Mack & Kari Ruse
Grant Number: 46-0308-1046-100

1
Mobility Management: Empirical Evidence of Fiscal Benefits from Multiple States
Mobility management can be defined as a strategic approach to transportation service coordination that improves efficiencies and increases transportation options to meet the needs of the public. What follows are examples of the benefits derived from successfully implemented mobility management projects.
When the Heartland Express, a demand-response transit provider in rural Hubbard County, Minnesota, decided to expand its fleet by purchasing a second service vehicle, it suddenly faced a new challenge: what to do about dispatching? Under the previous one-bus system, the driver doubled as dispatcher, handling incoming calls and scheduling client pickups via cellphone. With the addition of a second vehicle, dispatching became more complicated: one driver operated the first bus, answered incoming calls, and dispatched the second bus by calling the other driver on his or her cellphone. According to a (2013) annual report by the Minnesota Council on Transportation Access (MCOTA), this complication reduced both the safety and efficiency of operations for the Heartland Express.
The solution? In 2011, Hubbard County contracted with Paul Bunyan Transit, in neighboring Beltrami County, to provide dispatching services for the Heartland Express. According to MCOTA, this partnership not only alleviated the agency’s dispatching concerns, but also saved Hubbard County around $22,300 per year in terms of what it would have cost to hire a dedicated dispatcher.
The case of Hubbard County is a simple but illustrative example of the cost savings and system improvements that many transit agencies have witnessed through implementing coordinated mobility management strategies. Similar success stories abound within the literature:
For example, in their seminal report for the Transit Cooperative Research Program (TCRP), “Economic Benefits of Coordinating Human Service Transportation and Transit Services,” Burkhardt et al. (2003) describe 28 in-depth case studies in which transit agencies, states, and/or communities witnessed significant annual cost savings or economic benefits as a result of coordinated mobility management programs. Based on their analysis, the authors conclude that the benefits of transportation service coordination frequently include, but are not limited to:
• Annual cost savings• Additional funding and more funding resources• Increased efficiency in reduced costs per vehicle hour or vehicle mile• Increased productivity in more passengers per month or trips per vehicle hour• Expanded service• Enhanced community mobility and economic wellbeing• Enhanced service quality, better-trained drivers
Burkhardt et al.’s case study results are summarized in the following table. As can be seen, the fiscal benefits realized by a variety of agencies across a variety of coordinated mobility management strategies are substantial, ranging from approximately $15,000 to over $20 million annually.

2
Table 16
Estimated Economic Benefits of Coordination for Human Service Agencies and Transit Providers by Strategy and SiteNew Revenue Sources Cost-saving Measures Rideshare Expansion Benefit
System/Program Locality StateAdditional Funding
Contracts with
Schools
HS agencies provide
ADA
Shift paratransit
rider to FR
HS agencies
coordinate
Rideshare/coordinate dispatching
Expand transit
servicesDade County, Florida Miami FL $2,292,000 $2,292,000King county Metro Medicaid Pass Program Seattle WA $300,000 $300,000Lane Transit District Eugene OR $67,775 $67,775Philadelphia, Pennsylvania Philadelphia PA $2,089,000 $2,089,000State of Connecticut Hartford CT $1,802,000 $1,802,000State of Rhode Island Providence RI $2,100,000 $2,100,000Tri-Met’s Medical Transportation Program Portland OR $1,404,503 $1,404,503Dodger Area Rapid Transit System Fort Dodge IA $20,000 $20,000Mason County Transportation Authority Shelton WA $99,377 $99,377People for People (Mabton School Program) Yakima WA $15,210 $15,210ACCESS Pittsburgh PA $26,136,066 $26,136,066Dakota Area Resources and Tr. Service Dakota County MN $395,000 $395,000Ride Connection Portland OR $1,972,951 $1,972,951STAR Paratransit Arlington VA $640,000 $640,000CTS/JAUNT Charlottesville VA $921,600 $921,600Phoenix Travel Training Phoenix AZ $107,600 $107,600Sacramento RT Contract w/ Paratransit Sacramento CA $1,046,000 $1,046,000Kentucky Coordinated HS Tr. System Lexington KY $22,467,379 $22,467,379Martin County Transit Williamston NC $178, 447 $178, 447R.Y.D.E. Kearney NE $400,358 $400,358King County MEtro/HSHS Demo Seattle WA $100,970 $100,970People for People Yakima WA $13,044 $13,044People for People Moses Lake WA $265, 000 $265, 000Delta Area Rural Tr. System (DARTS) Clarksdale MS $4,700,000 $4,700,000Enabling Transportation (ET) Mesa AZ $306,342 $306,342Mountain Empire Transit Big Stone Gap VA $844,000 $844,000SMART Detroit Region MI $2,700,000 $2,700,000TRIP Riverside CA $1,526,150 $1,526,150
Combined economic benefits of coordination strategies studies at these sites $74,950,772
Source: Burkhardt et al. (2003)
For illustrative purposes, a few of the above case studies are summarized in bullet point form here:
• By switching approximately 1% of its eligible demand-response ADA paratransit riders to less-costly fixed-route service, Florida’s Miami-Dade Transit saved the State Medicaid program over $9 million annually.
• Dakota Area Resources and Transportation for Seniors (DARTS) in Dakota County, Minnesota combines ADA trips with those provided for seniors, eliminating the need for the regional ADA paratransit provider (Metro Mobility) to extend service to Dakota County. DARTS provides ADA paratransit trips and trips for seniors for approximately $230,000 a year less than Metro Mobility could; cost savings from reduced capital needs, centralized dispatching, and centralized maintenance total $150,000 or more.
• The Dodger Area Rapid Transit System (DART) in Fort Dodge, Iowa operates the small urban transit system in Fort Dodge, the regional transit service in six counties, and the school bus service. Being able to spread staff costs over multiple contracts reduces staff needs by three-fourths of a full-time staff member, saving approximately $20,000 per year.
3
• STAR Paratransit in Arlington, VA, contracts with local taxi companies, which are less expensive than the MetroAccess Paratransit service. Estimated benefits resulting from lower costs per trip total approximately $450,000. Switching seniors to the senior loop route instead of using paratransit saves approximately $190,000.
Note that the above examples represent only a selection of possible cost-saving mobility management strategies. What works for one agency may not be the best solution for another, and agencies should tailor their own efforts based upon the specific needs and resources present within their area. As noted by Burkhardt et al. (2004), cost savings are frequently the result of improved system efficiency, the elimination of redundancy, and the maximizing of existing capital, physical, and personnel resources (e.g., funding, vehicles, and drivers). In their report, “Toolkit for Rural Community Coordinated Transportation Services,” Burkhardt et al. (2004) note,
“By addressing inefficiencies in the current use of transportation resources, coordination can lower the costs of providing services. Most communities apply these cost savings to increase the numbers of trips served, thus increasing overall service effectiveness. The combination of increased efficiency and increased effectiveness can create great improvements in unit costs, such as costs per trip, per mile, or per hour.”
Supporting this claim, the following data, adapted from a (1999) report by the United States General Accounting Office, demonstrate dramatic reductions in passenger trip costs and vehicle hour costs that occurred across five states that implemented mobility management programs based on the coordination of existing transportation services. These data were obtained from a 1992 study by the Community Transportation Association of America:
Table 1: Comparison of the Cost and Efficiency of Transportation Services Before and After Coordination/Consolidation at Five Sites
Howard County, MD
Grand Rapids/Kent County, MI
Washington County, PA
Greenville County, SC
Pitt County, NC
Measure Before After Before After Before After Before After Before AfterAverage cost per passenger trip $7.92 $4.06 $6.11 $5.70 $28.46 $6.25 $6.31 $2.01 $7.13 $3.59
Average cost per vehicle hour 12.83 6.80 26.27 18.94 22.24 13.28 21.36 12.15 10.66 12.06
Average trips per month 2,236 4,713 12,180 54,762 2,800 6,300 12,558 15,850 3,880 5,126
Average passenger per vehicle hour 2.1 3.4 4.3 12.8 2.9 9.1 2.4 6.04 1.5 3.36
Number of vehicles 12 12 132 132 N/A N/A 65 12 41 15
Legend: N/A = no applicableSource: An Analysis of Human Services Transportation: America’s Other Transit Network, CGA Consulting Services, Inc., for Community Transportation Association of American (Feb. 1992)Source: U.S. GAO (1999)
4
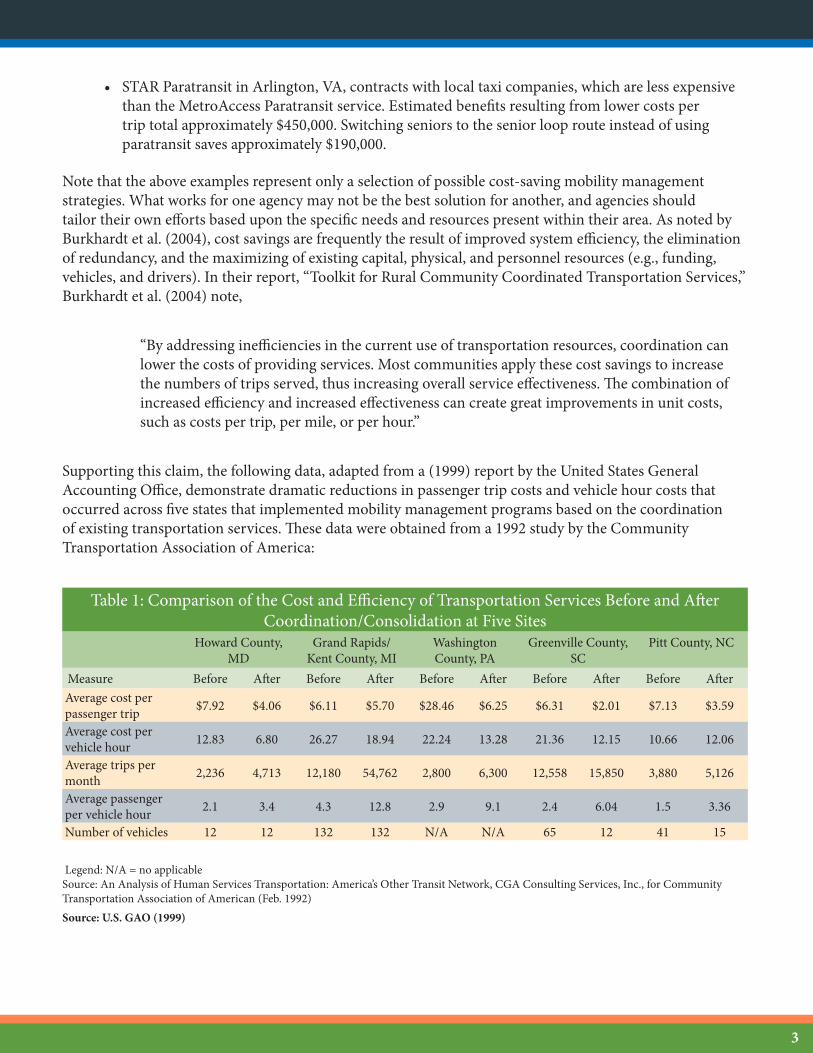
As the table shows, post-coordination costs were significantly lower than pre-coordination costs. Similar results were achieved by Reach Your Destination Easily (RYDE) in rural Nebraska, which, according to Burkhardt et al. (2003), saved approximately $400,000 annually as a result of coordinated mobility management (see table below):
Table 12Estimated Annual Benefits of R.Y.D.E.’s Coordinated OperationsPer Trip Cost Current Number of Trips Total CostPre-coordination $9.24 @ 78,220 $722,753Post-coordination: $4.16 @ 78,220 $325,395Total Savings $400,358
Source: Burkhardt et al. (2003)
Two successful mobility management pilot projects have already been launched in the State of Nebraska:
In Scottsbluff County, the rural transportation provider is now transporting developmentally challenged adults from group homes to job sites. These individuals were previously transported by a human services agency that has received Federal funds for vehicles. As a result of mobility management, the public transportation provider has increased its ridership, and the human service agency has reduced its expenses for staff and fuel.
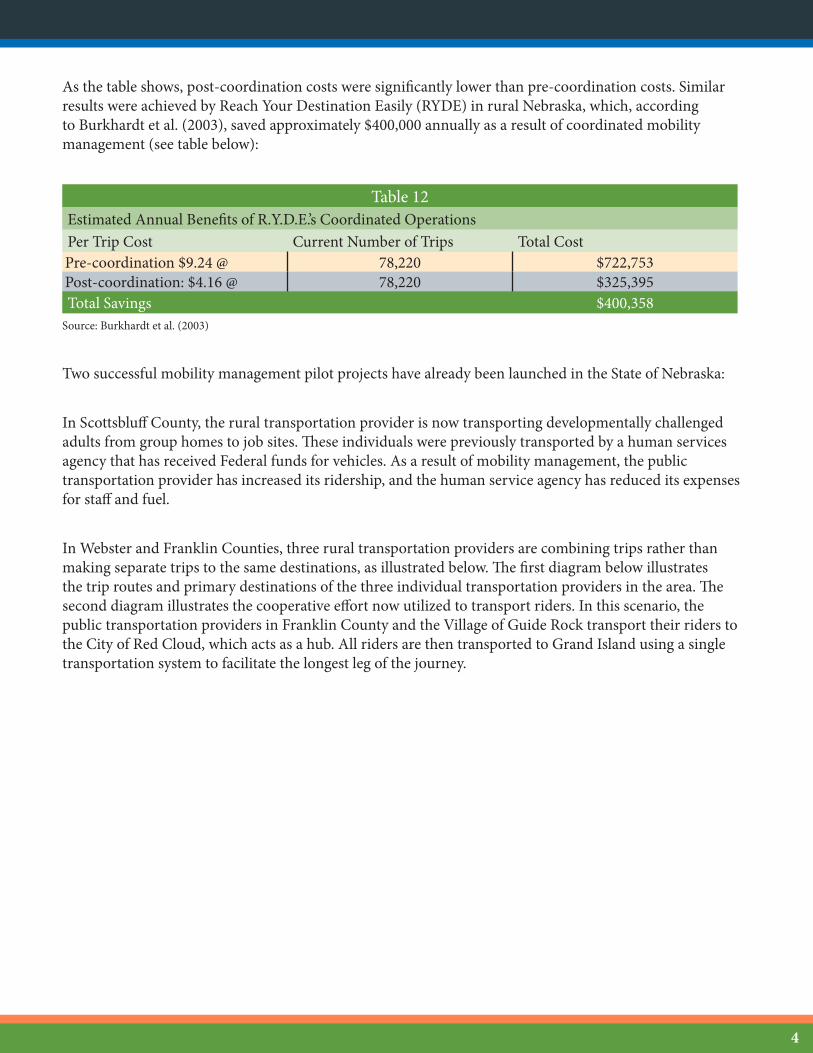
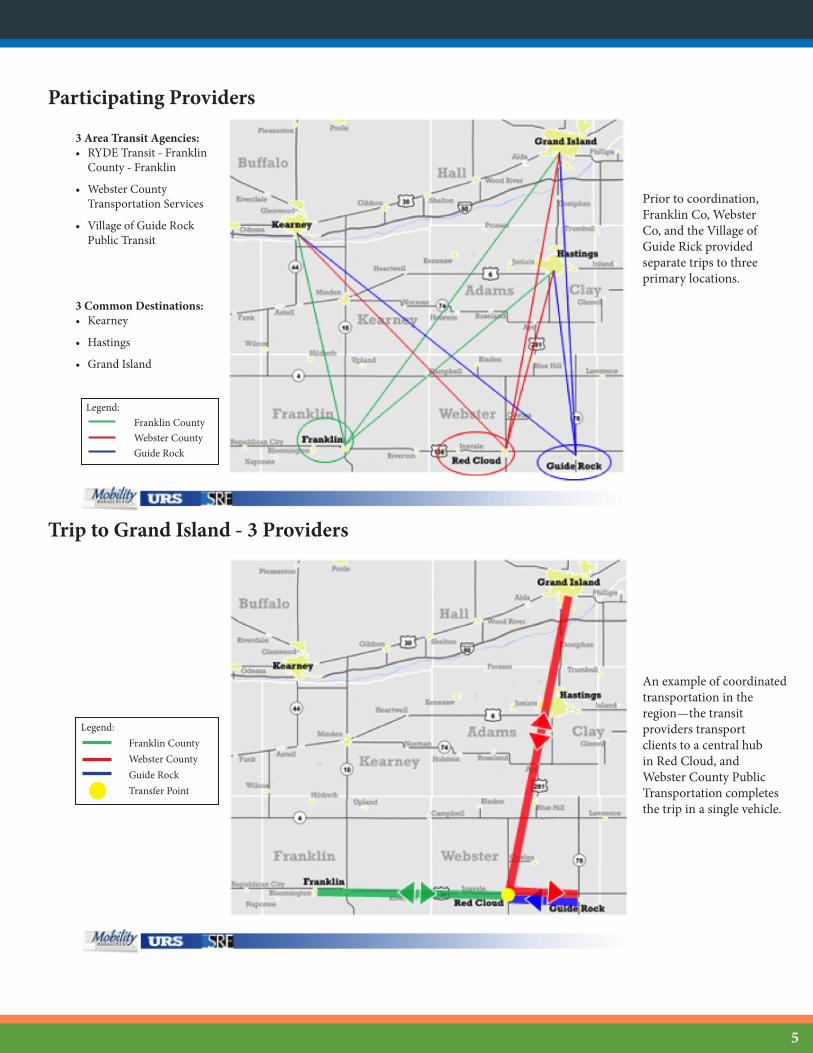
In Webster and Franklin Counties, three rural transportation providers are combining trips rather than making separate trips to the same destinations, as illustrated below. The first diagram below illustrates the trip routes and primary destinations of the three individual transportation providers in the area. The second diagram illustrates the cooperative effort now utilized to transport riders. In this scenario, the public transportation providers in Franklin County and the Village of Guide Rock transport their riders to the City of Red Cloud, which acts as a hub. All riders are then transported to Grand Island using a single transportation system to facilitate the longest leg of the journey.
5
3 Area Transit Agencies:• RYDE Transit - Franklin
County - Franklin
• Webster County Transportation Services
• Village of Guide Rock Public Transit
3 Common Destinations:• Kearney
• Hastings
• Grand Island
Participating Providers
Legend: Franklin County Webster County Guide Rock
Trip to Grand Island - 3 Providers
Legend: Franklin County Webster County Guide Rock Transfer Point
Prior to coordination, Franklin Co, Webster Co, and the Village of Guide Rick provided separate trips to three primary locations.
An example of coordinated transportation in the region—the transit providers transport clients to a central hub in Red Cloud, and Webster County Public Transportation completes the trip in a single vehicle.

6
The initial success of these pilot projects, as well as the data supplied by the preceding case studies, support the conclusion that strategic mobility management programs often lead to significant cost savings and economic benefits for transportation programs at the state, local, and/or agency level. The success of these programs is rational: if public transit is a balancing act between consumer needs and available resources, mobility management seeks to identify ways to accomplish more by coordinating existing resources—as exemplified by the case of Hubbard County’s Heartland Express. Based on this body of evidence, mobility management is a promising strategy for transit providers in the State of Nebraska.
Refer to the following list of references for links to additional information on mobility management programs in several states. Additional information on rural mobility management programs can also be found by visiting http://nationalcenterformobilitymanagement.org/by-topic-rural-transportation/.
7
Works Cited:
Burkhardt, J. E., D. Koffman, and G. Murray (2003). “Economic benefits of coordinating human service transportation and transit services.” TCRP Report 91. Transportation Research Board of the National Academies, Washington, D.C. http://onlinepubs.trb.org/onlinepubs/tcrp/tcrp_rpt_91.pdf. Accessed July 10, 2014.
Burkhardt, J.E., C.A. Nelson, G. Murray, and D. Koffman (2004). “Toolkit for rural community coordinated transportation services.” TCRP Report 101. Transportation Research Board of the National Academies, Washington, D.C. http://onlinepubs.trb.org/onlinepubs/tcrp/tcrp_rpt_101.pdf. Accessed July 10, 1014.
Minnesota Council on Transportation Access (2013). “2013 Annual Report.” http://www.dot.state.mn.us/govrel/reports/2013/mcotareport.pdf. Accessed July 13, 2014.
United States General Accounting Office (1999). “Report to Congressional Committees.” Retrieved from http://www.gao.gov/archive/2000/rc00001.pdf. Accessed July 15, 2014.
Works Referenced:
Burkhardt, J. E. and J. McLary (n.d.). “The business case for mobility management.” http://www.apta.com/resources/hottopics/mobility/Documents/Business-Case-for-Mobility-Management.pdf. Accessed July 1, 2014.