
Mobile technology Usage by Humanitarian Programs: A Metadata Analysis
50
MOBILE TECHNOLOGY USAGE BY HUMANITARIAN PROGRAMS: A METADATA ANALYSIS Rashmi Dayalu O P E N D A T A S C I E N C E C O N F E R E N C E_ BOSTON 2015 @opendatasci
-
Upload
odsc -
Category
Technology
-
view
181 -
download
1
Transcript of Mobile technology Usage by Humanitarian Programs: A Metadata Analysis

MOBILE TECHNOLOGY USAGE BY HUMANITARIAN
PROGRAMS: A METADATA ANALYSIS
Rashmi Dayalu
O P E ND A T AS C I E N C EC O N F E R E N C E_
BOSTON 2015
@opendatasci

2
Mobile technology usage by humanitarian programs: a metadata analysis
Open Data Science ConferenceMay 31, 2015
Rashmi DayaluData ScientistDimagi, Inc.

3#ODSC
We are called to work “where our greatest passion meets the world's greatest need.”- Frederick Buechner

4#ODSC
Background
5
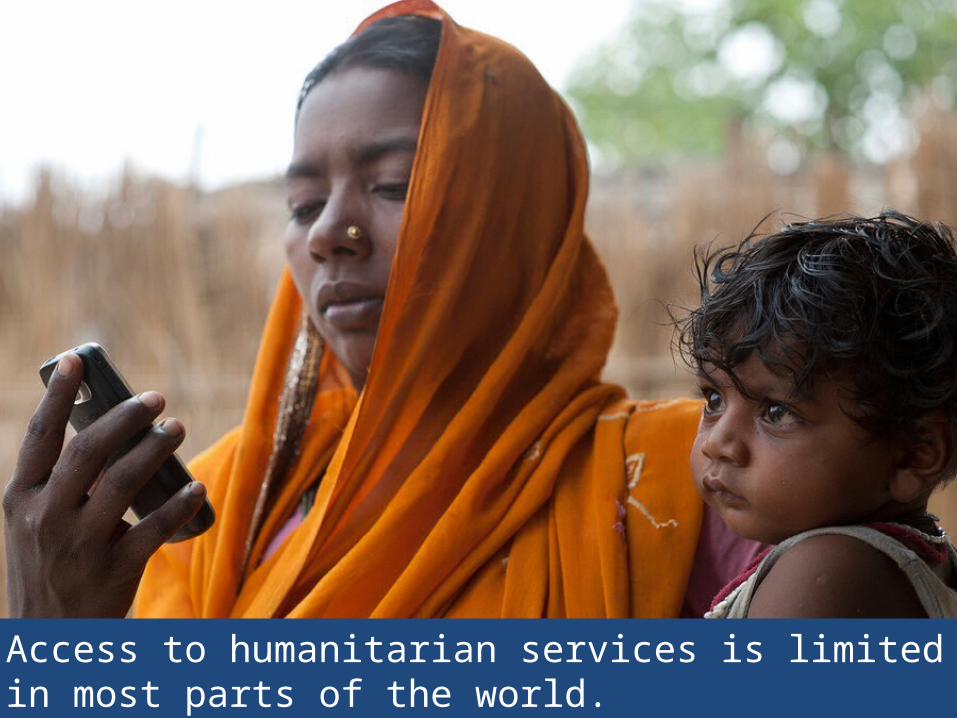
Access to humanitarian services is limited in most parts of the world.

6#ODSC

7
Frontline Workers (FLWs) are often the primary link between underserved communities and humanitarian services.

8#ODSC
“How can I keep track of my pregnant clients’ medical information, visit schedules and due dates?” – Seema

9#ODSC
“How can I show videos of the best agricultural practices to the farmers in my community?” – Yann

10
Meeting the world’s greatest needs: “We deliver open and innovative technology to help underserved communities around the world.”

11#ODSC
Dimagi’s core product

12#ODSC
Open source mobile technology platform Does not require software developers to configure or deploy
mobile applications Can be used on feature phones, androids, tablets, on the web
or over SMS
Image: http://www.ictedge.org/projects/zeprs
X

13#ODSC
Data collection Client Counseling
Case management and workflow supportTraining reinforcement and supervision
The result? Stronger healthcare workers and stronger communities…

14#ODSC
There are CommCare users in over 40 countries
4001 – 5000
3001 – 4000
2001 – 3000
1001 – 2000
1 - 1000

15#ODSC
CommCare is used across multiple sectors and subsectors

16#ODSC
• CommCare’s cloud server hosts data from hundreds of humanitarian programs.
• We are using CommCare metadata to ask a variety of questions that can aid programs and FLWs in their goals.
http://noble1solutions.com/wp-content/uploads/2014/06/what-is-big-data.jpg

17#ODSC
BREADTH
DEPTH
Program A Program B …. Program “X”
FLW 1
FLW 2
FLW 3
…
FLW “N”
How do programs and FLWs perform across the board?Is
my p
rog
ram
perf
orm
ing
well?
A
re m
y F
LWs
perf
orm
ing
well?

18
Measuring FLW and program performance using CommCare
metadata

19#ODSC
Form creation is the most basic unit of CommCare usage

20#ODSC
CommCare form metadata
FLW ID CASE ID
Form start/end dateForm start/end time

21#ODSC
Dimagi’s data platform

22#ODSC
Cumulative # form submissions and # new cases registered with Commcare:all programs, 2010 - 2014
23#ODSC
1. How quickly do FLWs develop proficiency with CommCare?
Analysis by: Jeremy Wacksman

24#ODSC
We looked at 634 workers who used CommCare for at least one year and were active for at least 10 months of their first year.
Q1
Q2
Quarterly range
Median change
Q1 – Q2 + 22.9%
Q2 – Q3 + 1.9%
Q3 – Q4 + 0.0%
Q3Q4

25#ODSC
2. Are FLW activity levels stable from month to month?

26#ODSC
Intra-user consistency:
• After the 6 month adoption period, do FLWs maintain stable levels of CommCare activity?
• We calculated the Pearson correlation coefficient for all pairs of consecutive calendar months for individual FLW activity levels

27#ODSC
Intra-user consistency for % active days and # forms (663 FLWs)
r = 0.68
r = 0.70

28#ODSC
Programs can use the hypothesis of intra-user consistency to monitor unexpected changes in FLW activity levels: e.g. (1) Are FLWs less active during certain seasons or months of the year?
N = 5,303 monthly observations (from health programs in India)

29#ODSC
(2) Do FLWs show decreased activity levels prior to attrition in CommCare activity (inactivity >= 90 days)?
N = 252 FLWs with at least one CommCare attrition event

30#ODSC
3. Do FLW activity levels follow a bell curve?
Analysis by: Mengji Chen

31#ODSC
1. Boyle, E., Aguinis, H. “The Best & the Rest: Revisiting the Norm of Normality and Individual Performance”, Personnel Psychology, 2012, 65, 79-119. 2. Image from: http://www.marin.edu/~npsomas/Lectures/Ch_1/Section_03.htm
Normal distributions are the most commonly held assumption in performance metrics1. Is this assumption valid for CommCare FLWs?

32#ODSC
Distribution of % active days/month for 12 programs with the most active months

33#ODSC
Boyle, 2012. Personnel Psychology
Programs have larger number of FLWs that are either underperforming or hyper-performing.
Workloads, performance ranking, training and compensation cannot assume the norm of normality.

34#ODSC
4. Do FLWs use CommCare in real-time while interacting with their clients?

35#ODSC
There is no way to confirm real-time data collection by FLWs using metadata, but we can flag visit data that was unlikely to have been entered in real-time:
1. Batch entry – visits entered consecutively in quick succession (e.g. with < 10 minutes between visits)
2. Visit duration (e.g. < 1 minute)3. Visit time of day (e.g. visits started at night, between 6pm
– 6am)

36#ODSC
Batch visits (%) by program
Proportion of batch visits from 30 maternal and child health programs worldwide

37#ODSC
Programs with unexpectedly large daily visit volumes revealed that:
(1) Patient data was often uploaded automatically via CommCareHQ - CommCare’s web interface (e.g. maternal registrations)

38#ODSC
(2) Manual batch entry might actually be part of regular work flow for FLWs in clinical settings (e.g. immunizations, child anthropometrics, etc.)We looked at batch entry rates for 9 programs that had at least one “travel visit” component built into their apps.

39#ODSC
In conjunction with batch entry, visit duration and visit time of day can be used to flag visit data that was unlikely collected in real-time.
Visit duration (Mood’s Median Test): Batch visits for programs A, B and C combined were ~half the duration of non-batch visits (median duration of batch visits = 3.8 minutes, median duration of non-batch visits = 7.7 minutes, Z = 5.35, p < 0.001).
Visit time of day (Chi-square Test):Batch were more likely to have been recorded in the night(% night non-batch visits = 16.5% and % night batch visits = 20.8%, 2 = 178.99, df = 1, p <0.001).

40#ODSC
5. How long do programs use CommCare for?
Analysis by: Patrick Keating

41#ODSC
Sustainable use of CommCare is evidence for CommCare’s value. Of 306 programs, how many were still active in Q4 2014?
Distribution of # programs by # active months and activity status in Q4 2014

42#ODSC
176 (57.5%) programs stopped using CommCare for at least 3 months. Of those, 43% restarted their CommCare usage, though restart rates are dependent on the age of the program.

43#ODSC
Programs with more active FLWs were more likely to be active through 2014
This could mean that programs with smaller numbers of users have limited resources and sometimes cannot continue their activities - regardless of how effective CommCare is.

44#ODSC
6. Which programs are improving over time?
Algorithm developed by:Dag HolmboeDimagi’s Data Science AdvisorFounder of Klurig Analyticshttp://www.kluriganalytics.com

45#ODSC
Detecting improvement can help us concretely identify the programmatic factors that led to the improvement.

46#ODSC
Preliminary validation: Program #60
Performance feedback to FLWs in the middle of the year could have contributed to the continued improvement (beyond first 6 months).

47#ODSC
Some future investigations:
1. Do 20% of FLWs submit 80% of the data?
2. Do programs that use supervisory tools have the most active FLWS?
3. Is CommCare activity correlated with socio-economic indicators (GNP, literacy rates, corruption index, etc.)?
4. How do CommCare crashes affect user behavior?

48#ODSC
Thank you!
For questions or research opportunities, please contact:
Rashmi [email protected]

49#ODSC
Activity metric by FLW per calendar month
Definition
1. # forms Total number of electronic forms submitted
2. # visits Total number of visits made to all cases
3. # cases Total number of unique cases visited (either registered or followed up)
4. # cases registered Total number of unique cases registered
5. # cases followed-up
Total number of unique cases followed-up
6. % of active days Percentage of days in the month during which the CHW submitted data
7. Total duration of CommCare use (min)
Cumulative time using CommCare, i.e. sum of all visit durations
CommCare activity metrics - Aggregated by calendar month per FLW

50#ODSC
Calculating breakpoints:• Rolling window of mean FLW activity levels over the program
lifetime• If window mean is at least 3 SD’s higher then the previous
window, it is a candidate breakpoint• t-test of means between the windows confirms the statistical
significance of the breakpoint


