Mobile Speed Connectivity tests in UK
9
In 2015 the Mobile Network Test in the UK is conducted the second time. Did Three, O2 or Vodafone manage to improve their performance enough to overtake last ye- ars clear winner EE? Edinburgh Glasgow Liverpool Manchester Leeds Nongham Derby Leicester Coventry London Bristol Birmingham Hull Pontefract Wetherby Carlisle Penrith Morpeth Heysham Kendal Dumfries Livingston Hamilton Berwick-upon-Tweed Bedworth Cannock Stafford Knutsford Kirkby in Ashfield Bletchley Dunstable Maidenhead Newbury Chippenham THE MOBILE NETWORK TEST IN THE UNITED KINGDOM Edinburgh Glasgow Liverpool Manchester Leeds Nongham Derby Leicester Coventry London Bristol Birmingham Hull Pontefract Wetherby Carlisle Penrith Morpeth Heysham Kendal Dumfries Livingston Hamilton Berwick-upon-Tweed Bedworth Cannock Stafford Knutsford Kirkby in Ashfield Bletchley Dunstable Maidenhead Newbury Chippenham 1
Transcript of Mobile Speed Connectivity tests in UK
In 2015 the Mobile Network Test in the UK is conducted the second time. Did Three, O2 or Vodafone manage to improve their performance enough to overtake last ye-ars clear winner EE?
EdinburghGlasgow
Liverpool
Manchester
Leeds
No�nghamDerby
Leicester
Coventry
LondonBristol
Birmingham
HullPontefract
Wetherby
Carlisle
Penrith
Morpeth
Heysham
Kendal
Dumfries
LivingstonHamilton
Berwick-upon-Tweed
Bedworth
Cannock
Stafford
Knutsford
Kirkby in Ashfield
Bletchley
Dunstable
Maidenhead
Newbury
Chippenham
The Mobile NeTwork TesT iN The UNiTed kiNgdoM
EdinburghGlasgow
Liverpool
Manchester
Leeds
No�nghamDerby
Leicester
Coventry
LondonBristol
Birmingham
HullPontefract
Wetherby
Carlisle
Penrith
Morpeth
Heysham
Kendal
Dumfries
LivingstonHamilton
Berwick-upon-Tweed
Bedworth
Cannock
Stafford
Knutsford
Kirkby in Ashfield
Bletchley
Dunstable
Maidenhead
Newbury
Chippenham
1
TelephonyCustomers expect nothing
but a great experience in mobile telephony. But LTE
introduces high hurdles for perfect voice services.
Which provider brings sta-bility and speech quality to
the highest level?
LTE is a great technology for handling large amounts of data with high speed. This is because it was designed to handle the fast growing amount of data present since the introduction of smartphones. But it was not designed to handle voice calls. As a workaround a technique called circuit switched fall back (CSFB) changes the connection to UMTS or GSM whenever a call is made. This additional hand-over takes time and reduces reliability, so providers must step up efforts to keep the quality up to the level of the pre-LTE-era. Voice over LTE is the new alternative to CSFB. This technique allows the smartphone to place and receive voice calls without leaving the LTE network. But since LTE networks are all-IP networks and therefore not designed to handle real-time services like voice communication, VoLTE introduces new challenges to maintaining a good quality of service.
All operators in the United Kingdom are experi-menting with VoLTE, but Three is the first and only one to have launched it. As only a very small num-ber of smartphones are able to use VoLTE, this ser-vice was not part of this years benchmark.
Voice in Big Cities Nonetheless Three managed to show the best result in big cities. With 97.2 % call success ratio the youngest operator in the united kingdom obtained the best result. Vodafone ranked second at 96.7 % while Telefonica and EE had severe problems with one out of 20 calls. A call setup time between 5.3 (Three) and 7.3 seconds (EE) is typical for 4G-Net-works and slightly higher than those measured in pre-LTE times. The speech quality is measured on the MOS scale, which goes from 1 (bad) to 5 (excel-lent). All operators accomplished MOS ratings bet-ween 3.3 and 3.6, with Three again being best. This makes Three the best operator for voice perfor-mance in big cities, with Vodafone in a close second place.
Voice in small cities and on connecting roadsIt is easier to provide a stable network for speech in big cities with their high demand on network capa-bilities and a correspondingly dense network of ba-se stations. Three only lost 2 % of reliability in small cities and on connecting roads and increased its advantage over the competition. EE with a 92.6 % call success ratio and Vodafone with 92 % followed at a distance while Telefonica lost more than one out of ten calls in rural areas. Telefonica‘s problem can also be seen at the speech quality. With a MOS value of 2.8 it is only slightly better than „merely understandable“. Call setup time stayed almost the same for all providers except of Three, who mana-ged to reduce the time between dialing and an es-tablished call by another half a second.
hen it comes to mobile network testing P3 communications is pro-
bably the world leader. Being active in Germany, the USA, Australia, Austria, Switzerland, Spain, UK and many other countries, the mobile communication ex-perts from Aachen have accumulated a lot of knowledge. No wonder connect, the biggest Euro-pean magazine on telecommunication has chosen P3 communications as its partner for the mobile network bench-mark in Germany, Austria and Switzer-land since 2002. The awareness of the
public regarding the quality of mobile networks has driven operators to impro-ve their networks considerably to stay competitive.
Focus on United Kingdom But how does the United Kingdom com-pare to other countries? In 2014 the mo-bile network test showed EE as the clear winner followed by Three with the best voice performance. O2 and Vodafone followed almost head-to-head. The test also displayed much better performance in metropolitan areas than in smaller ci-
ties and on connecting roads. That fact and the population of 8.6 million people are good reasons to look at the results of the largest city London separately. The results can be found on page 7.
Compared to the leading operators in Europe and all over the world all UK net-works revealed room for improvement. This headroom gives every operator the opportunity to make a big step forward and overtake formerly better competi-tors. It will be interesting to see which operator used the last year most effec-tively for its improvements.
W
A blade computer array in the car is used to steer twel-ve Samsung-Smartphones for the measurements.
OperatOr ee three VOdafOne telefOnica telephOnY (Big cities;driVetest)Call Success Ratio (%) 94.9 97.2 96.7 95.5Call Setup Time (s) 7.3 5.3 6.3 6.5Speech Quality (MOS-LQO) 3.5 3.6 3.4 3.3telephOnY (small cities and cOnnecting rOads;driVetest)Call Success Ratio (%) 92.6 95.2 92.0 87.2Call Setup Time (s) 7.1 4.8 6.5 6.9Speech Quality (MOS-LQO) 3.4 3.6 3.0 2.8
EdinburghGlasgow
Liverpool
Manchester
Leeds
No�nghamDerby
Leicester
Coventry
LondonBristol
Birmingham
HullPontefract
Wetherby
Carlisle
Penrith
Morpeth
Heysham
Kendal
Dumfries
LivingstonHamilton
Berwick-upon-Tweed
Bedworth
Cannock
Stafford
Knutsford
Kirkby in Ashfield
Bletchley
Dunstable
Maidenhead
Newbury
Chippenham
2
Vodafone UK is part of the Voda-fone Group which is also head-quartered in the United Kingdom. The Vodafone Group owns and operates networks in 21 coun-tries. Vodafone UK launched the first cellular network in 1985. The rollout of the first 3G network in the UK started in 2001. Now the company runs 2G at 900 and 1800 Mhz, 3G at 900 and 2100
MHz and LTE at 800 MHz and 2.6 GHz. During the last year Vodafo-ne claims to have spent 1 billion pound on the networks. 200 Mil-lion have been spent in London alone to get the LTE population coverage above 99 %. VoLTE is currently on a trial with no re-lease date yet. But the money is not only spent on LTE where Vo-dafone has licensed the largest
bandwidth of all UK operators but also on extending 3G coverage in the formerly GSM-Band 900 MHz. This improves indoor recep-tion for voice calls and older handsets without LTE and ext-ends the reach of base stations.
Population coverage across all mobile network classes is 98 % and 18 Million customers have access to this network.
With approximately 30 million customers EE is the biggest ope-rator in the UK. The company‘s 4G network of EE was officially launched on 30 October 2012 and the operator has acquired 10 Million customers with a 4G plan since then. The population co-verage is 93 % according to the operator. EE has started the roll-out in a comparatively dense net-
work at 1800 MHz in 11 big ci-ties. This was followed with ano-ther layer at 2600 MHz at loca-tions with high traffic. EE is the first in the UK to provide carrier aggregation (CA) to make the most out of modern smartpho-nes. The deployment of 800 MHz LTE has recently started in rural areas to take advantage of the broader
coverage of these lower frequen-cies. For the cities EE believes that 1800 MHz in a dense grid is perfect even for indoor use. EE‘s whole LTE network is VoLTE ready and a few hundred people are already using it in an expansive trial. But VoLTE will only be re-leased to the public when the overall quality is as good as or better than HD voice over 3G.
Telefonica with its brand O2 claims to be the second largest mobile network operator in the UK with approximately 25 million customers.
Telefonica has deployed 2G networks at 900 and 1800 Mhz, 3G networks at 900 and 2100 MHz. Currently the LTE roll-out is in progress. Until now the 4G networks serve 78 % of the out-
door population, which translates to 66 % indoor population co-verage at 800 MHz. To extend its LTE bandwidth Telefonica has started to refarm part of its GSM 1800 spectrum to LTE and to carrier aggregate both frequenci-es. 98 % population coverage at the end of 2017 was promised by Telefonica as part of the licen-sing obligations. VoLTE trials are
currently in preparation and is predicted to start in December 2015 with the launch planned for the first half of 2016.Telefonica is currently progressing with a big initiative to modernize its net-work. According to the operator as a part of this more than 3 billi-on pounds will be invested in 2G, 3G and 4G services during the next five years.
Three started its service Net-work on 2003 in the UK and five other countries. So it is a compa-ratively young operator starting in the upcoming age of mobile data with the aim to leave legacy be-hind. Consequently Three was a 3G-only network supplemented by 2G via national roaming. Nowadays 2G is only sparingly used for voice support.
Three started its 4G rollout at the end of 2013 at 1800 MHz, which needs a denser network of base stations due to the high fre-quency. Now the 800 MHz rollout has started and population co-verage of LTE is 50 % right now and is predicted to reach 65 % by the end of this year. This is a good foundation for the recently started VoLTE (Voice over LTE)
service, which at this time is used where no other voice ser-vice is available. With about 8.8 Million customers Three is the smallest mobile network operator but claims to carry 42 % of the traffic in the UK. The modern net-work together with a no limit poli-cy (excluding tethering) brings the average traffic to 4.65 GB per customer.
3
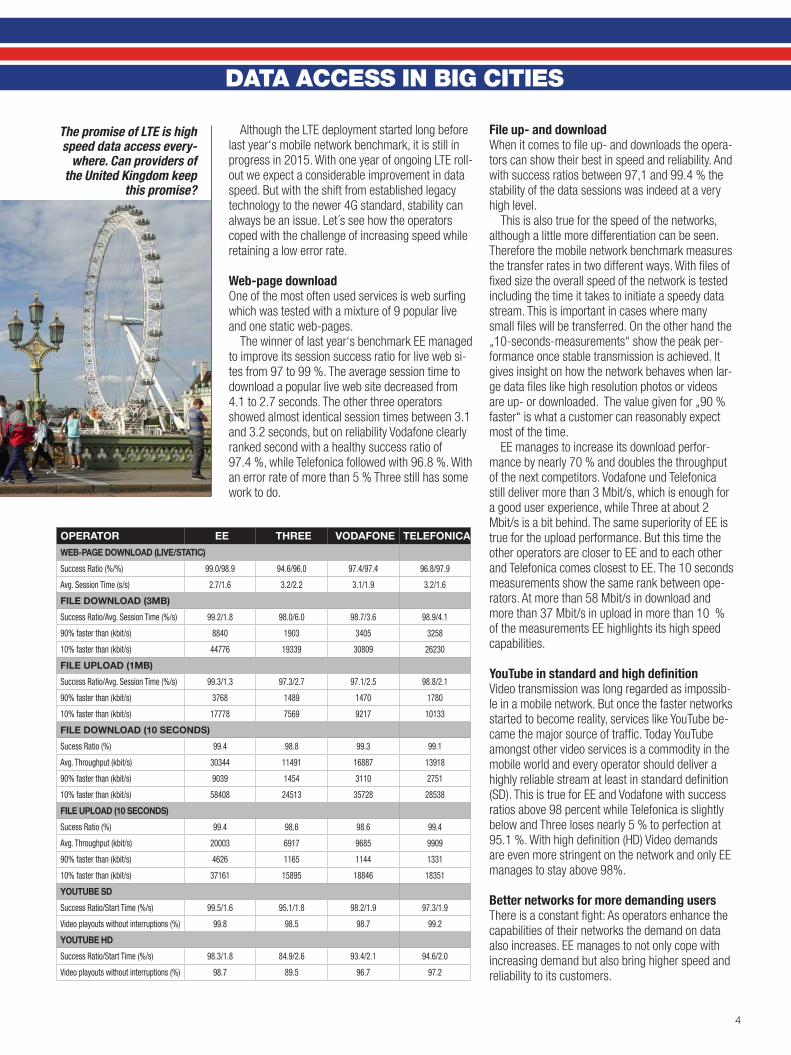
The promise of LTE is high speed data access every-
where. Can providers of the United Kingdom keep
this promise?
Although the LTE deployment started long before last year‘s mobile network benchmark, it is still in progress in 2015. With one year of ongoing LTE roll-out we expect a considerable improvement in data speed. But with the shift from established legacy technology to the newer 4G standard, stability can always be an issue. Let´s see how the operators coped with the challenge of increasing speed while retaining a low error rate.
Web-page download One of the most often used services is web surfing which was tested with a mixture of 9 popular live and one static web-pages.
The winner of last year‘s benchmark EE managed to improve its session success ratio for live web si-tes from 97 to 99 %. The average session time to download a popular live web site decreased from 4.1 to 2.7 seconds. The other three operators showed almost identical session times between 3.1 and 3.2 seconds, but on reliability Vodafone clearly ranked second with a healthy success ratio of 97.4 %, while Telefonica followed with 96.8 %. With an error rate of more than 5 % Three still has some work to do.
File up- and downloadWhen it comes to file up- and downloads the opera-tors can show their best in speed and reliability. And with success ratios between 97,1 and 99.4 % the stability of the data sessions was indeed at a very high level.
This is also true for the speed of the networks, although a little more differentiation can be seen. Therefore the mobile network benchmark measures the transfer rates in two different ways. With files of fixed size the overall speed of the network is tested including the time it takes to initiate a speedy data stream. This is important in cases where many small files will be transferred. On the other hand the „10-seconds-measurements“ show the peak per-formance once stable transmission is achieved. It gives insight on how the network behaves when lar-ge data files like high resolution photos or videos are up- or downloaded. The value given for „90 % faster“ is what a customer can reasonably expect most of the time.
EE manages to increase its download perfor-mance by nearly 70 % and doubles the throughput of the next competitors. Vodafone und Telefonica still deliver more than 3 Mbit/s, which is enough for a good user experience, while Three at about 2 Mbit/s is a bit behind. The same superiority of EE is true for the upload performance. But this time the other operators are closer to EE and to each other and Telefonica comes closest to EE. The 10 seconds measurements show the same rank between ope-rators. At more than 58 Mbit/s in download and more than 37 Mbit/s in upload in more than 10 % of the measurements EE highlights its high speed capabilities.
YouTube in standard and high definitionVideo transmission was long regarded as impossib-le in a mobile network. But once the faster networks started to become reality, services like YouTube be-came the major source of traffic. Today YouTube amongst other video services is a commodity in the mobile world and every operator should deliver a highly reliable stream at least in standard definition (SD). This is true for EE and Vodafone with success ratios above 98 percent while Telefonica is slightly below and Three loses nearly 5 % to perfection at 95.1 %. With high definition (HD) Video demands are even more stringent on the network and only EE manages to stay above 98%.
Better networks for more demanding usersThere is a constant fight: As operators enhance the capabilities of their networks the demand on data also increases. EE manages to not only cope with increasing demand but also bring higher speed and reliability to its customers.
OperatOr ee three VOdafOne telefOnica
WeB-page dOWnlOad (liVe/static)
Success Ratio (%/%) 99.0/98.9 94.6/96.0 97.4/97.4 96.8/97.9
Avg. Session Time (s/s) 2.7/1.6 3.2/2.2 3.1/1.9 3.2/1.6
file dOWnlOad (3mB)
Success Ratio/Avg. Session Time (%/s) 99.2/1.8 98.0/6.0 98.7/3.6 98.9/4.1
90% faster than (kbit/s) 8840 1903 3405 3258
10% faster than (kbit/s) 44776 19339 30809 26230
file UplOad (1mB)
Success Ratio/Avg. Session Time (%/s) 99.3/1.3 97.3/2.7 97.1/2.5 98.8/2.1
90% faster than (kbit/s) 3768 1489 1470 1780
10% faster than (kbit/s) 17778 7569 9217 10133
file dOWnlOad (10 secOnds)
Sucess Ratio (%) 99.4 98.8 99.3 99.1
Avg. Throughput (kbit/s) 30344 11491 16887 13918
90% faster than (kbit/s) 9039 1454 3110 2751
10% faster than (kbit/s) 58408 24513 35728 28538
file UplOad (10 secOnds)
Sucess Ratio (%) 99.4 98.6 98.6 99.4
Avg. Throughput (kbit/s) 20003 6917 9685 9909
90% faster than (kbit/s) 4626 1165 1144 1331
10% faster than (kbit/s) 37161 15895 18846 18351
YOUtUBe sd
Success Ratio/Start Time (%/s) 99.5/1.6 95.1/1.8 98.2/1.9 97.3/1.9
Video playouts without interruptions (%) 99.8 98.5 98.7 99.2
YOUtUBe hd
Success Ratio/Start Time (%/s) 98.3/1.8 84.9/2.6 93.4/2.1 94.6/2.0
Video playouts without interruptions (%) 98.7 89.5 96.7 97.2
DaTa access in big ciTies
4
DaTa access in small ciTies
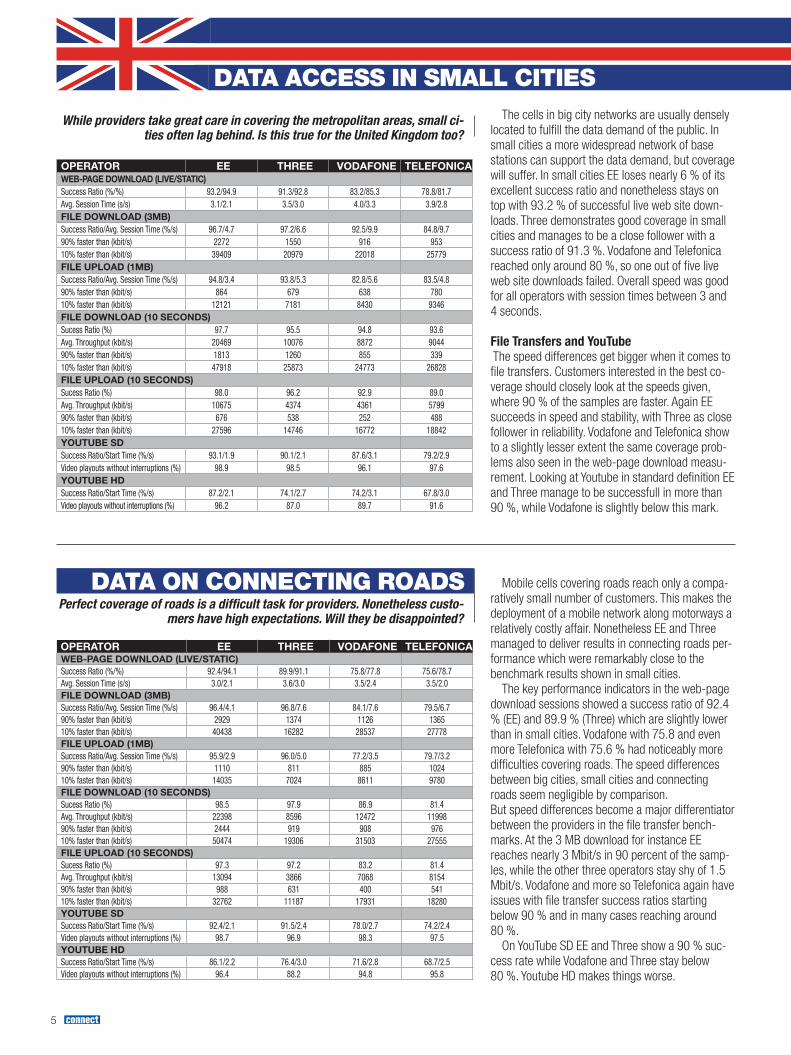
While providers take great care in covering the metropolitan areas, small ci-ties often lag behind. Is this true for the United Kingdom too?
Perfect coverage of roads is a difficult task for providers. Nonetheless custo-mers have high expectations. Will they be disappointed?
The cells in big city networks are usually densely located to fulfill the data demand of the public. In small cities a more widespread network of base stations can support the data demand, but coverage will suffer. In small cities EE loses nearly 6 % of its excellent success ratio and nonetheless stays on top with 93.2 % of successful live web site down-loads. Three demonstrates good coverage in small cities and manages to be a close follower with a success ratio of 91.3 %. Vodafone and Telefonica reached only around 80 %, so one out of five live web site downloads failed. Overall speed was good for all operators with session times between 3 and 4 seconds.
File Transfers and YouTube The speed differences get bigger when it comes to file transfers. Customers interested in the best co-verage should closely look at the speeds given, where 90 % of the samples are faster. Again EE succeeds in speed and stability, with Three as close follower in reliability. Vodafone and Telefonica show to a slightly lesser extent the same coverage prob-lems also seen in the web-page download measu-rement. Looking at Youtube in standard definition EE and Three manage to be successfull in more than 90 %, while Vodafone is slightly below this mark.
Mobile cells covering roads reach only a compa-ratively small number of customers. This makes the deployment of a mobile network along motorways a relatively costly affair. Nonetheless EE and Three managed to deliver results in connecting roads per-formance which were remarkably close to the benchmark results shown in small cities.
The key performance indicators in the web-page download sessions showed a success ratio of 92.4 % (EE) and 89.9 % (Three) which are slightly lower than in small cities. Vodafone with 75.8 and even more Telefonica with 75.6 % had noticeably more difficulties covering roads. The speed differences between big cities, small cities and connecting roads seem negligible by comparison. But speed differences become a major differentiator between the providers in the file transfer bench-marks. At the 3 MB download for instance EE reaches nearly 3 Mbit/s in 90 percent of the samp-les, while the other three operators stay shy of 1.5 Mbit/s. Vodafone and more so Telefonica again have issues with file transfer success ratios starting below 90 % and in many cases reaching around 80 %.
On YouTube SD EE and Three show a 90 % suc-cess rate while Vodafone and Three stay below 80 %. Youtube HD makes things worse.
OperatOr ee three VOdafOne telefOnica WeB-page dOWnlOad (liVe/static)Success Ratio (%/%) 93.2/94.9 91.3/92.8 83.2/85.3 78.8/81.7Avg. Session Time (s/s) 3.1/2.1 3.5/3.0 4.0/3.3 3.9/2.8file dOWnlOad (3mB)Success Ratio/Avg. Session Time (%/s) 96.7/4.7 97.2/6.6 92.5/9.9 84.8/9.790% faster than (kbit/s) 2272 1550 916 95310% faster than (kbit/s) 39409 20979 22018 25779file UplOad (1mB)Success Ratio/Avg. Session Time (%/s) 94.8/3.4 93.8/5.3 82.8/5.6 83.5/4.890% faster than (kbit/s) 864 679 638 78010% faster than (kbit/s) 12121 7181 8430 9346file dOWnlOad (10 secOnds)Sucess Ratio (%) 97.7 95.5 94.8 93.6Avg. Throughput (kbit/s) 20469 10076 8872 904490% faster than (kbit/s) 1813 1260 855 33910% faster than (kbit/s) 47918 25873 24773 26828file UplOad (10 secOnds)Sucess Ratio (%) 98.0 96.2 92.9 89.0Avg. Throughput (kbit/s) 10675 4374 4361 579990% faster than (kbit/s) 676 538 252 48810% faster than (kbit/s) 27596 14746 16772 18842YOUtUBe sdSuccess Ratio/Start Time (%/s) 93.1/1.9 90.1/2.1 87.6/3.1 79.2/2.9Video playouts without interruptions (%) 98.9 98.5 96.1 97.6YOUtUBe hdSuccess Ratio/Start Time (%/s) 87.2/2.1 74.1/2.7 74.2/3.1 67.8/3.0Video playouts without interruptions (%) 96.2 87.0 89.7 91.6
OperatOr ee three VOdafOne telefOnica WeB-page dOWnlOad (liVe/static)Success Ratio (%/%) 92.4/94.1 89.9/91.1 75.8/77.8 75.6/78.7Avg. Session Time (s/s) 3.0/2.1 3.6/3.0 3.5/2.4 3.5/2.0file dOWnlOad (3mB)Success Ratio/Avg. Session Time (%/s) 96.4/4.1 96.8/7.6 84.1/7.6 79.5/6.790% faster than (kbit/s) 2929 1374 1126 136510% faster than (kbit/s) 40438 16282 28537 27778file UplOad (1mB)Success Ratio/Avg. Session Time (%/s) 95.9/2.9 96.0/5.0 77.2/3.5 79.7/3.290% faster than (kbit/s) 1110 811 885 102410% faster than (kbit/s) 14035 7024 8611 9780file dOWnlOad (10 secOnds)Sucess Ratio (%) 98.5 97.9 86.9 81.4Avg. Throughput (kbit/s) 22398 8596 12472 1199890% faster than (kbit/s) 2444 919 908 97610% faster than (kbit/s) 50474 19306 31503 27555file UplOad (10 secOnds)Sucess Ratio (%) 97.3 97.2 83.2 81.4Avg. Throughput (kbit/s) 13094 3866 7068 815490% faster than (kbit/s) 988 631 400 54110% faster than (kbit/s) 32762 11187 17931 18280YOUtUBe sdSuccess Ratio/Start Time (%/s) 92.4/2.1 91.5/2.4 78.0/2.7 74.2/2.4Video playouts without interruptions (%) 98.7 96.9 98.3 97.5YOUtUBe hdSuccess Ratio/Start Time (%/s) 86.1/2.2 76.4/3.0 71.6/2.8 68.7/2.5Video playouts without interruptions (%) 96.4 88.2 94.8 95.8
DaTa on connecTing RoaDs
5
OperatOr ee three VOdafOne telefOnica telephOnY (Big cities Walktest)Call Success Ratio (%) 94.3 97.8 97.1 97.1Call Setup Time (s) 7.1 5.0 6.2 6.5Speech Quality (MOS-LQO) 3.5 3.7 3.5 3.4data (Big cities Walktest)WeB-page dOWnlOad (liVe/static)Success Ratio (%/%) 96.4/97.3 95.9/96.4 97.5/98.4 96.0/97.3Avg. Session Time (s/s) 2.8/1.6 3.2/2.1 3.2/2.0 3.4/1.7file dOWnlOad (3mB)Success Ratio/Avg. Session Time (%/s) 98.2/1.8 97.8/6.2 99.1/4.0 98.5/5.390% faster than (kbit/s) 8359 1694 3055 229610% faster than (kbit/s) 40956 15789 27088 24316file UplOad (1mB)Success Ratio/Avg. Session Time (%/s) 97.3/1.6 95.4/2.9 94.9/2.6 97.8/2.790% faster than (kbit/s) 3026 1260 1341 135710% faster than (kbit/s) 14011 7512 8989 9668file dOWnlOad (10 secOnds)Sucess Ratio (%) 98.7 98.7 99.4 98.8Avg. Throughput (kbit/s) 29493 9687 14337 1126090% faster than (kbit/s) 7668 1698 3001 205510% faster than (kbit/s) 54581 19834 29715 24456file UplOad (10 secOnds)Sucess Ratio (%) 97.9 97.9 98.0 98.8Avg. Throughput (kbit/s) 17007 6545 9427 888090% faster than (kbit/s) 3358 1204 920 130410% faster than (kbit/s) 33488 13542 17753 16944YOUtUBe sdSuccess Ratio/Start Time (%/s) 96.9/1.7 96.6/1.8 99.3/1.8 96.4/1.9Video playouts without interruptions (%) 99.7 98.5 99.7 99.2YOUtUBe hdSuccess Ratio/Start Time (%/s) 95.3/1.9 85.1/2.3 93.1/2.2 91.9/2.1Video playouts without interruptions (%) 98.3 90.7 92.3 95.6
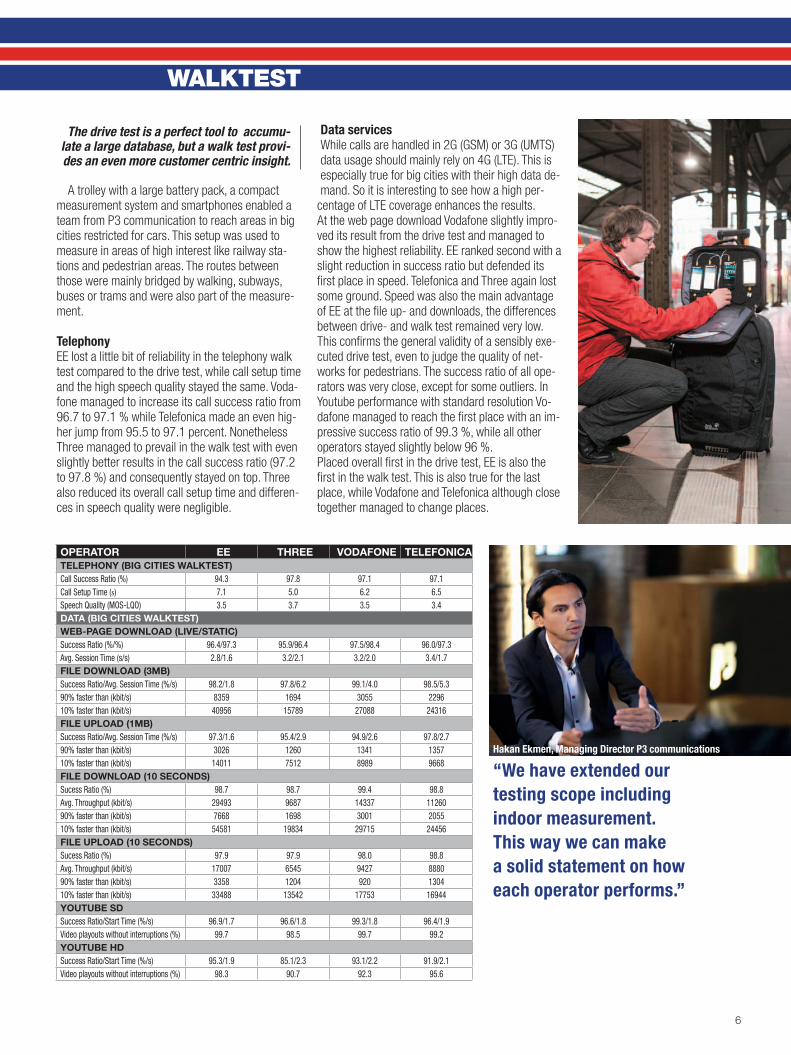
A trolley with a large battery pack, a compact measurement system and smartphones enabled a team from P3 communication to reach areas in big cities restricted for cars. This setup was used to measure in areas of high interest like railway sta-tions and pedestrian areas. The routes between those were mainly bridged by walking, subways, buses or trams and were also part of the measure-ment.
Telephony EE lost a little bit of reliability in the telephony walk test compared to the drive test, while call setup time and the high speech quality stayed the same. Voda-fone managed to increase its call success ratio from 96.7 to 97.1 % while Telefonica made an even hig-her jump from 95.5 to 97.1 percent. Nonetheless Three managed to prevail in the walk test with even slightly better results in the call success ratio (97.2 to 97.8 %) and consequently stayed on top. Three also reduced its overall call setup time and differen-ces in speech quality were negligible.
Data servicesWhile calls are handled in 2G (GSM) or 3G (UMTS) data usage should mainly rely on 4G (LTE). This is especially true for big cities with their high data de-mand. So it is interesting to see how a high per-
centage of LTE coverage enhances the results.At the web page download Vodafone slightly impro-ved its result from the drive test and managed to show the highest reliability. EE ranked second with a slight reduction in success ratio but defended its first place in speed. Telefonica and Three again lost some ground. Speed was also the main advantage of EE at the file up- and downloads, the differences between drive- and walk test remained very low. This confirms the general validity of a sensibly exe-cuted drive test, even to judge the quality of net-works for pedestrians. The success ratio of all ope-rators was very close, except for some outliers. In Youtube performance with standard resolution Vo-dafone managed to reach the first place with an im-pressive success ratio of 99.3 %, while all other operators stayed slightly below 96 %.Placed overall first in the drive test, EE is also the first in the walk test. This is also true for the last place, while Vodafone and Telefonica although close together managed to change places.
walkTesT
Hakan Ekmen, Managing Director P3 communications
“We have extended our testing scope including indoor measurement. This way we can make a solid statement on how each operator performs.”
The drive test is a perfect tool to accumu-late a large database, but a walk test provi-des an even more customer centric insight.
6
The promise of LTE is high speed data access everywhere. Can the providers in the United Kingdom
keep this promise?
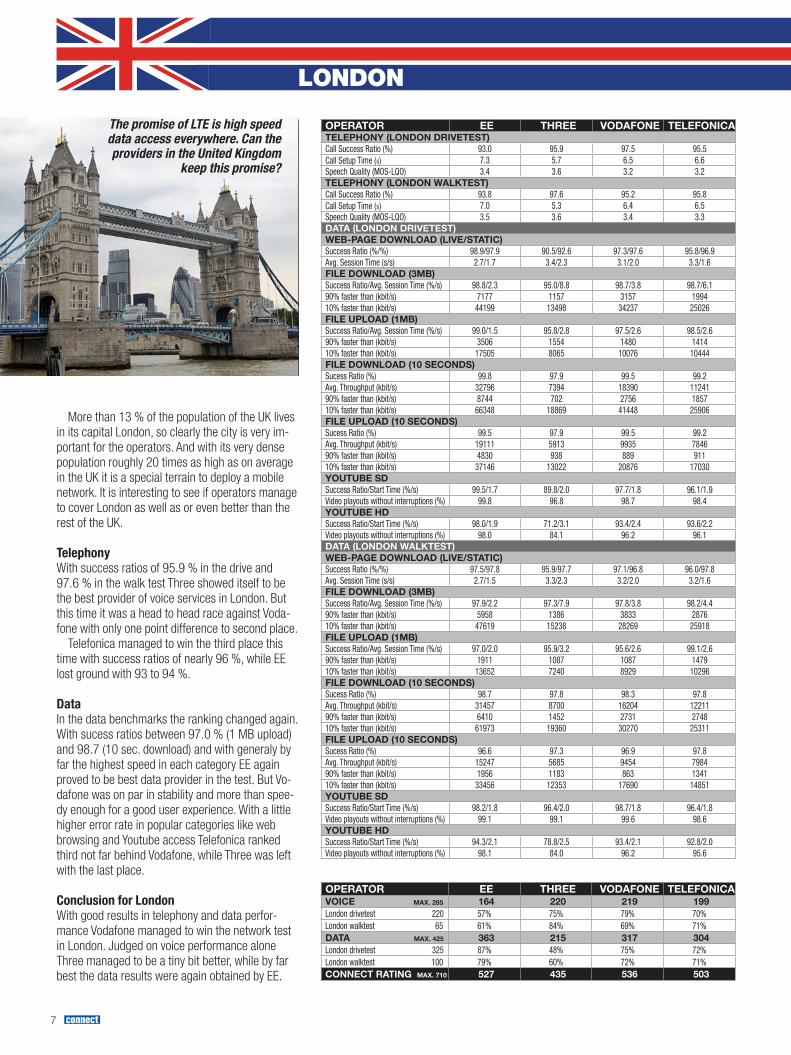
More than 13 % of the population of the UK lives in its capital London, so clearly the city is very im-portant for the operators. And with its very dense population roughly 20 times as high as on average in the UK it is a special terrain to deploy a mobile network. It is interesting to see if operators manage to cover London as well as or even better than the rest of the UK.
Telephony With success ratios of 95.9 % in the drive and 97.6 % in the walk test Three showed itself to be the best provider of voice services in London. But this time it was a head to head race against Voda-fone with only one point difference to second place.
Telefonica managed to win the third place this time with success ratios of nearly 96 %, while EE lost ground with 93 to 94 %.
DataIn the data benchmarks the ranking changed again. With sucess ratios between 97.0 % (1 MB upload) and 98.7 (10 sec. download) and with generaly by far the highest speed in each category EE again proved to be best data provider in the test. But Vo-dafone was on par in stability and more than spee-dy enough for a good user experience. With a little higher error rate in popular categories like web browsing and Youtube access Telefonica ranked third not far behind Vodafone, while Three was left with the last place.
Conclusion for London With good results in telephony and data perfor-mance Vodafone managed to win the network test in London. Judged on voice performance alone Three managed to be a tiny bit better, while by far best the data results were again obtained by EE.
DaTa access in big ciTieslonDon
OperatOr ee three VOdafOne telefOnica telephOnY (lOndOn driVetest)Call Success Ratio (%) 93.0 95.9 97.5 95.5Call Setup Time (s) 7.3 5.7 6.5 6.6Speech Quality (MOS-LQO) 3.4 3.6 3.2 3.2telephOnY (lOndOn Walktest)Call Success Ratio (%) 93.8 97.6 95.2 95.8Call Setup Time (s) 7.0 5.3 6.4 6.5Speech Quality (MOS-LQO) 3.5 3.6 3.4 3.3data (lOndOn driVetest) WeB-page dOWnlOad (liVe/static)Success Ratio (%/%) 98.9/97.9 90.5/92.6 97.3/97.6 95.8/96.9Avg. Session Time (s/s) 2.7/1.7 3.4/2.3 3.1/2.0 3.3/1.6file dOWnlOad (3mB)Success Ratio/Avg. Session Time (%/s) 98.8/2.3 95.0/8.8 98.7/3.8 98.7/6.190% faster than (kbit/s) 7177 1157 3157 199410% faster than (kbit/s) 44199 13498 34237 25026file UplOad (1mB)Success Ratio/Avg. Session Time (%/s) 99.0/1.5 95.8/2.8 97.5/2.6 98.5/2.690% faster than (kbit/s) 3506 1554 1480 141410% faster than (kbit/s) 17505 8065 10076 10444file dOWnlOad (10 secOnds)Sucess Ratio (%) 99.8 97.9 99.5 99.2Avg. Throughput (kbit/s) 32796 7394 18390 1124190% faster than (kbit/s) 8744 702 2756 185710% faster than (kbit/s) 66348 18869 41448 25906file UplOad (10 secOnds)Sucess Ratio (%) 99.5 97.9 99.5 99.2Avg. Throughput (kbit/s) 19111 5913 9935 784690% faster than (kbit/s) 4830 938 889 91110% faster than (kbit/s) 37146 13022 20876 17030YOUtUBe sdSuccess Ratio/Start Time (%/s) 99.5/1.7 89.8/2.0 97.7/1.8 96.1/1.9Video playouts without interruptions (%) 99.8 96.8 98.7 98.4YOUtUBe hdSuccess Ratio/Start Time (%/s) 98.0/1.9 71.2/3.1 93.4/2.4 93.6/2.2Video playouts without interruptions (%) 98.0 84.1 96.2 96.1data (lOndOn Walktest)WeB-page dOWnlOad (liVe/static)Success Ratio (%/%) 97.5/97.8 95.9/97.7 97.1/96.8 96.0/97.8Avg. Session Time (s/s) 2.7/1.5 3.3/2.3 3.2/2.0 3.2/1.6file dOWnlOad (3mB)Success Ratio/Avg. Session Time (%/s) 97.9/2.2 97.3/7.9 97.8/3.8 98.2/4.490% faster than (kbit/s) 5958 1386 3833 287610% faster than (kbit/s) 47619 15238 28269 25918file UplOad (1mB)Success Ratio/Avg. Session Time (%/s) 97.0/2.0 95.9/3.2 95.6/2.6 99.1/2.690% faster than (kbit/s) 1911 1087 1087 147910% faster than (kbit/s) 13652 7240 8929 10296file dOWnlOad (10 secOnds)Sucess Ratio (%) 98.7 97.8 98.3 97.8Avg. Throughput (kbit/s) 31457 8700 16204 1221190% faster than (kbit/s) 6410 1452 2731 274810% faster than (kbit/s) 61973 19360 30270 25311file UplOad (10 secOnds)Sucess Ratio (%) 96.6 97.3 96.9 97.8Avg. Throughput (kbit/s) 15247 5685 9454 798490% faster than (kbit/s) 1956 1183 863 134110% faster than (kbit/s) 33456 12353 17690 14851YOUtUBe sdSuccess Ratio/Start Time (%/s) 98.2/1.8 96.4/2.0 98.7/1.8 96.4/1.8Video playouts without interruptions (%) 99.1 99.1 99.6 98.6YOUtUBe hdSuccess Ratio/Start Time (%/s) 94.3/2.1 78.8/2.5 93.4/2.1 92.8/2.0Video playouts without interruptions (%) 98.1 84.0 96.2 95.6
OperatOr ee three VOdafOne telefOnica VOice max. 285 164 220 219 199London drivetest 220 57% 75% 79% 70%London walktest 65 61% 84% 69% 71%data max. 425 363 215 317 304London drivetest 325 87% 48% 75% 72%London walktest 100 79% 60% 72% 71%cOnnect rating max. 710 527 435 536 503
7
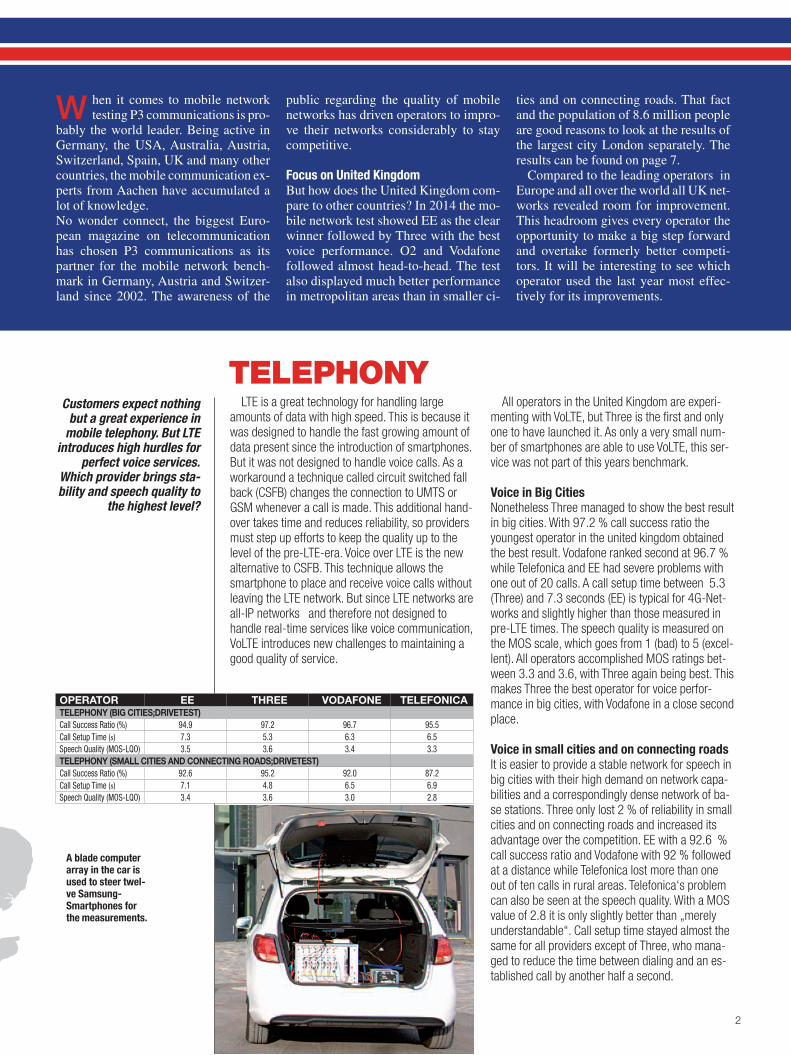
As in Germany, Austria and Switzerland P3 communica-tions, connect’s partner for executing network bench-marks, sent out two measurement cars to perform the tests. The cars were equipped with 8 Samsung Galaxy S5 and 4 Note 4 smartphones each. Eight of them where Cat4 devices and used for the voice test, the other four belon-ged in the Cat6 category and were used for data measure-ments. As far as possible the smartphone’s firmware matched the network operator’s genuine ones. In cases where no ope-rator specific firmware was available the most recent Samsung firmware was used.
Smartphone-TelephonyData and voice services were executed with separate smartphones. Telephony was tested mobile-to-mobile from one car to the other. In order to ensure realistic te-sting conditions background data traffic was generated on the smartphones during a voice call. The audio quality of the transmitted speech samples was evaluated using the HD-voice capable and ITU standar-dized so-called POLQA wideband algorithm.All network operators offer 4G capable subscriptions for everybody interested in a high performance data network. To take the high share of LTE into account speech samples were acquired partly in 4G preferred to 3G preferred mode and partly in 4G preferred to 4G preferred mode. As a con-sequence, the phones in most cases needed to switch (“fall back”) to 2G or 3G because they camped on the LTE service when a phone call was initiated. This procedure is known as circuit-switched fall back (CSFB).
Smartphone-DataThe testing of data services was done with four separate Samsung smartphones in the cars. As a first measurement task several popular live web pages were browsed using the built-in smartphone browser. The web pages had been selected previously according to the Alexa ranking. In ad-dition, the artificial (static) “Kepler” test web page as spe-cified by ETSI (European Telecommunications Standards Institute) for such testing purposes was used.In order to test the data service performance, files of 3MB and 1MB for download and upload respectively were transferred from or to a test server located in the Internet.In addition, the peak data performance was tested in up- and downlink direction by assessing the amount of data that could be transferred within a 10 seconds time period. While 10 seconds peak throughput test focuses on net-work capability the YouTube tests add a more end user centric view to the test curriculum. Here, videos with stan-dard definition (SD, 360p, 2.7MB, 30s) and high definition (HD, 720p, 11.9MB, 30s) were played using the YouTube player on the smartphones.
Route and SamplesThe route is shown on page 1 of this report. In the big and small cities indicated the cars had to follow pre-defined
routes to measure a choice. Altogether more than 90,000 speech samples were logged per operator, about half of them in 4G preferred to 4G preferred mode, while the other half 4G preferred to 3G preferred. For the data benchmark about 50,000 samples were obtained per ope-rator. About 60 % of the samples were obtained in big ci-ties while the remaining 40 % were collected in small ci-ties and on connecting routes.
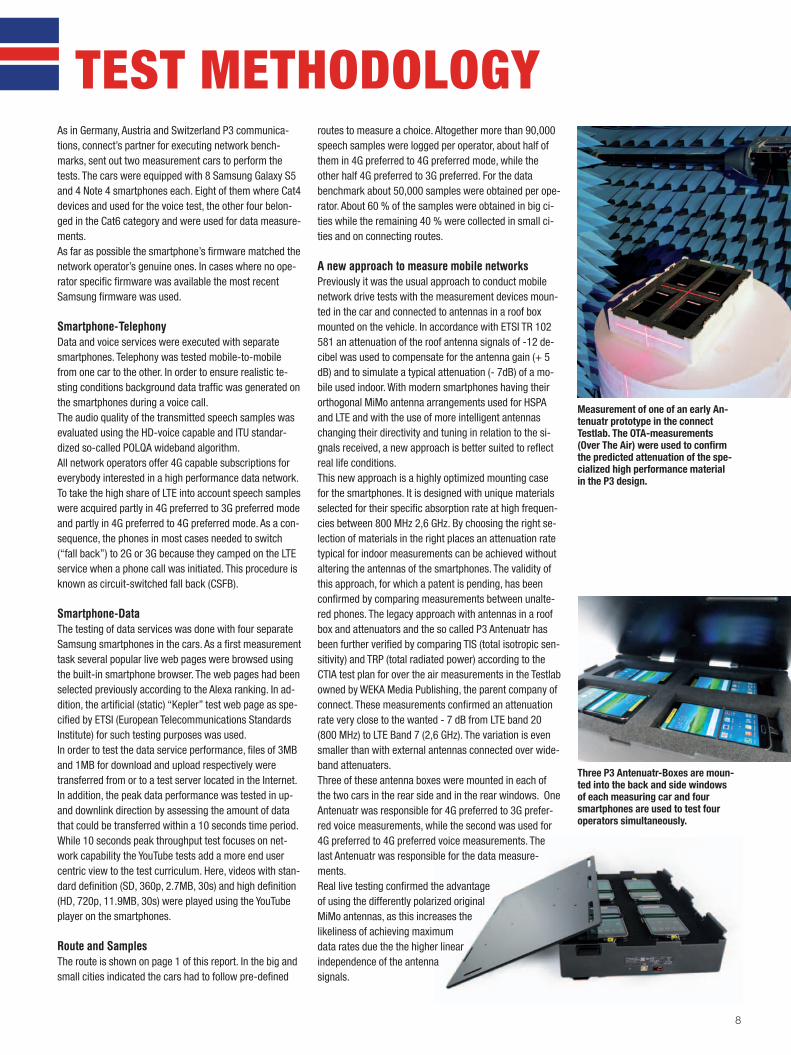
A new approach to measure mobile networksPreviously it was the usual approach to conduct mobile network drive tests with the measurement devices moun-ted in the car and connected to antennas in a roof box mounted on the vehicle. In accordance with ETSI TR 102 581 an attenuation of the roof antenna signals of -12 de-cibel was used to compensate for the antenna gain (+ 5 dB) and to simulate a typical attenuation (- 7dB) of a mo-bile used indoor. With modern smartphones having their orthogonal MiMo antenna arrangements used for HSPA and LTE and with the use of more intelligent antennas changing their directivity and tuning in relation to the si-gnals received, a new approach is better suited to reflect real life conditions.This new approach is a highly optimized mounting case for the smartphones. It is designed with unique materials selected for their specific absorption rate at high frequen-cies between 800 MHz 2,6 GHz. By choosing the right se-lection of materials in the right places an attenuation rate typical for indoor measurements can be achieved without altering the antennas of the smartphones. The validity of this approach, for which a patent is pending, has been confirmed by comparing measurements between unalte-red phones. The legacy approach with antennas in a roof box and attenuators and the so called P3 Antenuatr has been further verified by comparing TIS (total isotropic sen-sitivity) and TRP (total radiated power) according to the CTIA test plan for over the air measurements in the Testlab owned by WEKA Media Publishing, the parent company of connect. These measurements confirmed an attenuation rate very close to the wanted - 7 dB from LTE band 20 (800 MHz) to LTE Band 7 (2,6 GHz). The variation is even smaller than with external antennas connected over wide-band attenuaters.Three of these antenna boxes were mounted in each of the two cars in the rear side and in the rear windows. One Antenuatr was responsible for 4G preferred to 3G prefer-red voice measurements, while the second was used for 4G preferred to 4G preferred voice measurements. The last Antenuatr was responsible for the data measure-ments. Real live testing confirmed the advantage of using the differently polarized original MiMo antennas, as this increases the likeliness of achieving maximum data rates due the the higher linear independence of the antenna signals.
Measurement of one of an early An-tenuatr prototype in the connect Testlab. The OTA-measurements (Over The Air) were used to confirm the predicted attenuation of the spe-cialized high performance material in the P3 design.
Three P3 Antenuatr-Boxes are moun-ted into the back and side windows of each measuring car and four smartphones are used to test four operators simultaneously.
TesT MeThodology
8
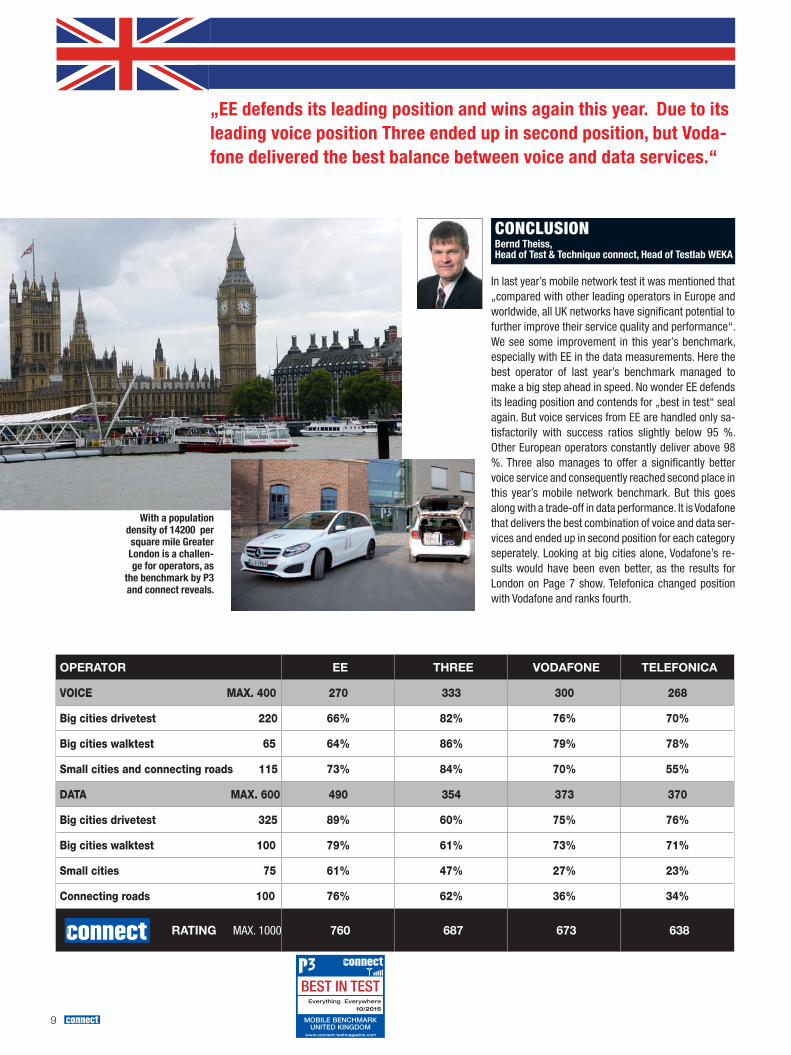
In last year’s mobile network test it was mentioned that „compared with other leading operators in Europe and worldwide, all UK networks have significant potential to further improve their service quality and performance“. We see some improvement in this year’s benchmark, especially with EE in the data measurements. Here the best operator of last year’s benchmark managed to make a big step ahead in speed. No wonder EE defends its leading position and contends for „best in test“ seal again. But voice services from EE are handled only sa-tisfactorily with success ratios slightly below 95 %. Other European operators constantly deliver above 98 %. Three also manages to offer a significantly better voice service and consequently reached second place in this year’s mobile network benchmark. But this goes along with a trade-off in data performance. It is Vodafone that delivers the best combination of voice and data ser-vices and ended up in second position for each category seperately. Looking at big cities alone, Vodafone’s re-sults would have been even better, as the results for London on Page 7 show. Telefonica changed position with Vodafone and ranks fourth.
CoNClUsioNBernd Theiss,Head of Test & Technique connect, Head of Testlab WEKA
With a population density of 14200 per square mile Greater London is a challen-ge for operators, as
the benchmark by P3 and connect reveals.
OperatOr ee three VOdafOne telefOnica
Voice max. 400 270 333 300 268
Big cities drivetest 220 66% 82% 76% 70%
Big cities walktest 65 64% 86% 79% 78%
Small cities and connecting roads 115 73% 84% 70% 55%
Data max. 600 490 354 373 370
Big cities drivetest 325 89% 60% 75% 76%
Big cities walktest 100 79% 61% 73% 71%
Small cities 75 61% 47% 27% 23%
connecting roads 100 76% 62% 36% 34%
rating MAx. 1000 760 687 673 638
„EE defends its leading position and wins again this year. Due to its leading voice position Three ended up in second position, but Voda-fone delivered the best balance between voice and data services.“
www.connect-testmagazine.com
best in testEverything Everywhere
10/2015
MObIlE bENchMarK UNITED KINgDOM
9