MOBILE PACKET MONITOR Josue Martins (front end) Chisha Malama (back end) Supervised by Dr WD Tucker...
18
MOBILE PACKET MONITOR Josue Martins (front end) Chisha Malama (back end) Supervised by Dr WD Tucker & Mr Michael Norman
-
Upload
albert-price -
Category
Documents
-
view
216 -
download
1
Transcript of MOBILE PACKET MONITOR Josue Martins (front end) Chisha Malama (back end) Supervised by Dr WD Tucker...
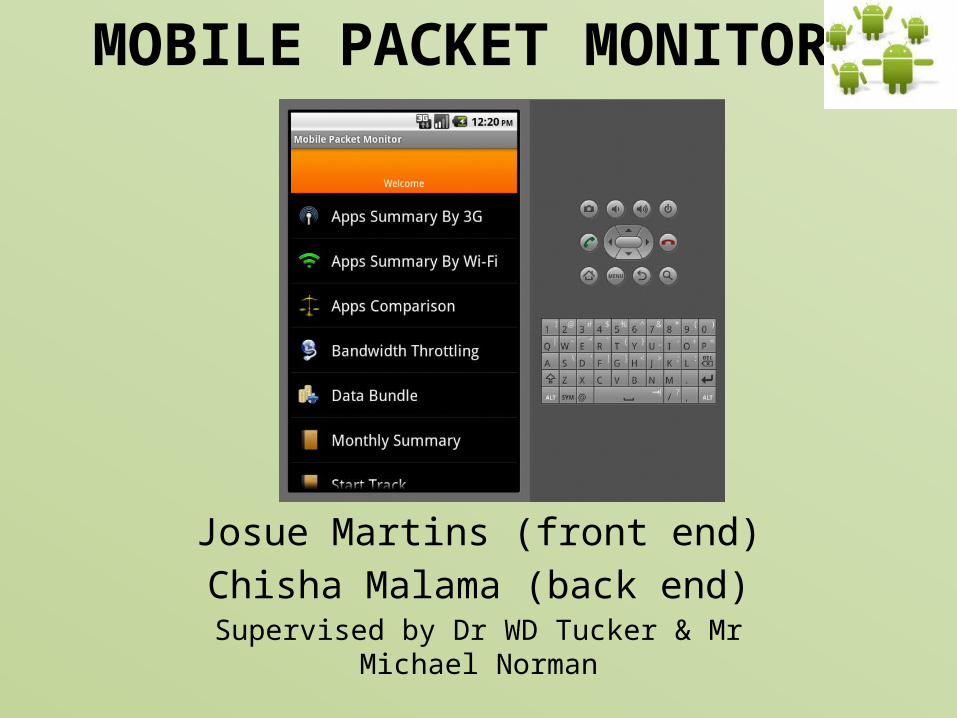
MOBILE PACKET MONITOR
Josue Martins (front end)Chisha Malama (back end)
Supervised by Dr WD Tucker & Mr Michael Norman
Overview
• Introduction • High level design recap• Testing plan and objectives met • Evaluation • References

IntroductionWhat is Mobile Packet Monitor? • Monitors data usage• Shows the cost of types of data usage• Works on all versions of Android since 2.2 Froyo• Runs in the background• Stores data usage cumulatively
Why is it important?• Provides awareness of data usage and cost• Helps users make better financial decisions on Internet data usage.
Mobile users Solution:
Mobile Packet Monitor Expensive mobile phone bills

High Level Design recap
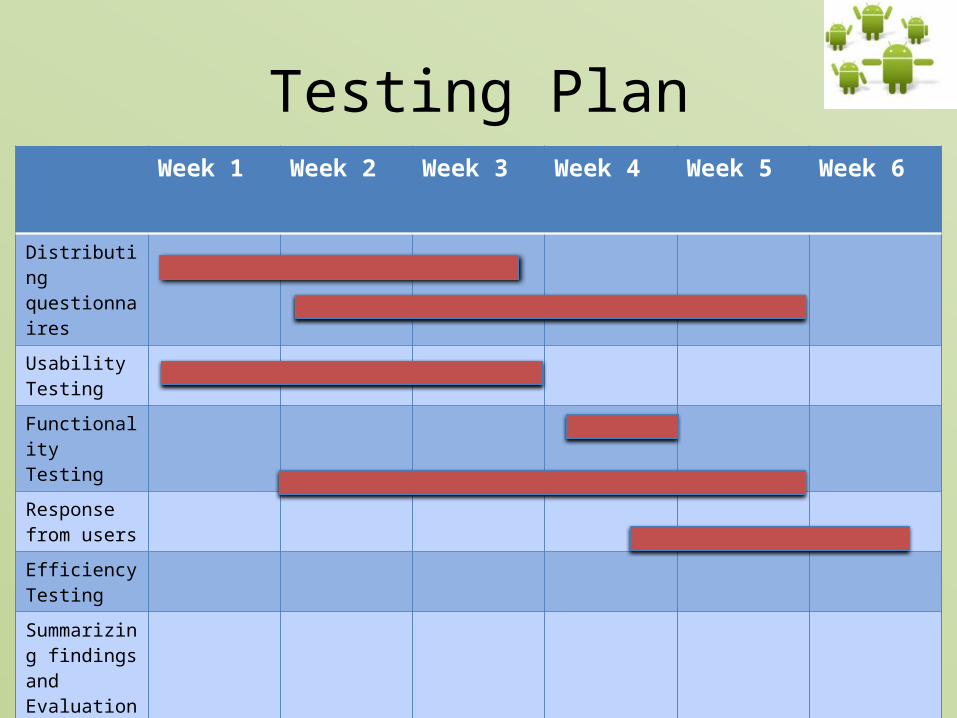
Testing PlanWeek 1 Week 2 Week 3 Week 4 Week 5 Week 6
Distributing questionnaires
Usability Testing
Functionality Testing
Response from users
Efficiency Testing
Summarizing findings and Evaluation

Usability Back End
• Accomplished– Track bytes– Check when network interface changes
automatically– Add cost according to data rate.

Usability Front End
Accomplished
• Present contents to the user interface.
• Provide effective user experience.
• Display accurate information
• Providing a recognizable steps

Tools used for Efficiency TestingFront end tools used
• OS Monitor 2.0.5• Android Memory application usage viewer
Back end tools used• Wi-Fi/3g• WhatsApp• Opera Mini• Windows Pc• MobileGo• Wi-Fi File Transfer• Onavo Count• Usb Tunnel• Eclipse IDE• Web Browser

OS Monitor 2.0.5 View• CPU Highest Load 51%• CPU lowest Load 6%• 27 MB highest memory
usage• Current 19 MB memory
usage• 7 MB lowest memory usage• 320 MB total phone
memory

Efficiency testingBattery
CPU
Memory
Highest usage
2518.43
Lowest usage
5
15
25
Operating system and resources usage
Perc
enta
ge
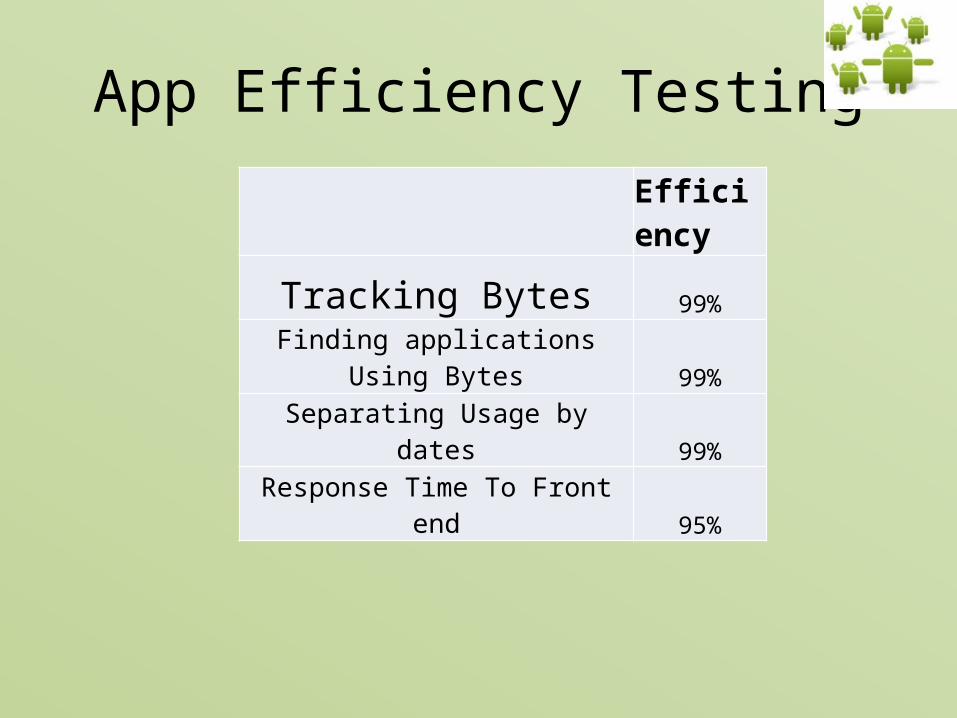
App Efficiency Testing
Efficiency
Tracking Bytes 99%
Finding applications Using Bytes 99%
Separating Usage by dates 99%
Response Time To Front end 95%
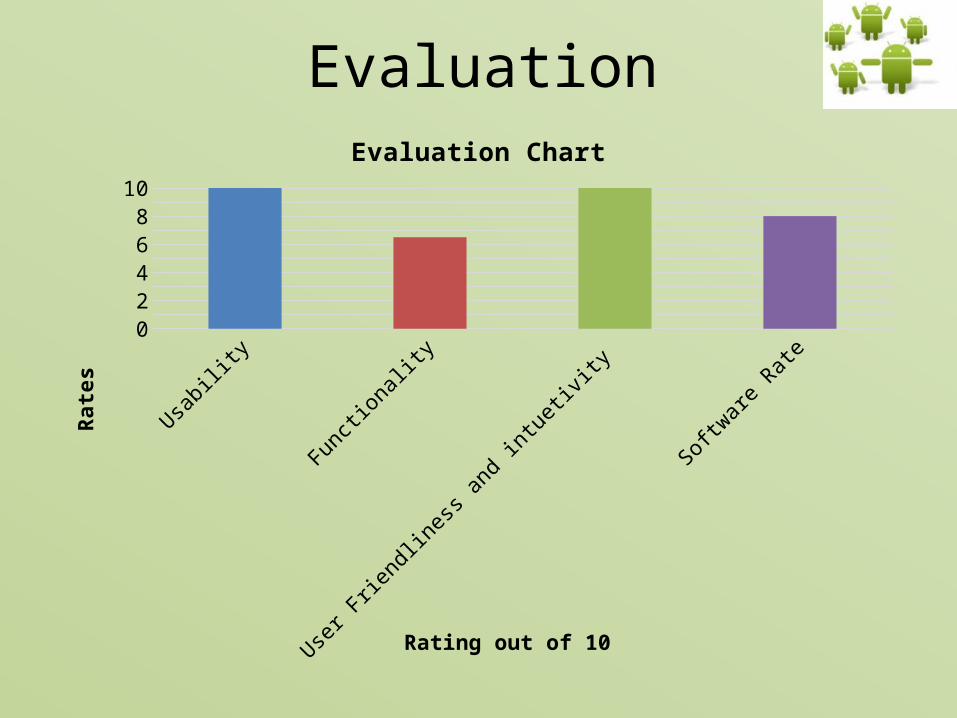
Evaluation
Usability Functionality User Friendliness and intuetivity
Software Rate
Rate 1 10 NaN NaN NaN
Rate 2 NaN 6.5 NaN NaN
Rate 3 NaN NaN 10 NaN
Rate 4 NaN NaN NaN 8
0.51.52.53.54.55.56.57.58.59.5
Evaluation Chart
Rating out of 10
Rate
s

User Feedback • Bandwidth throttling. It allows Android users to use applications on their
devices without using 3G. This is particularly effective since many free applications on the Android market come with sponsored ads, which use data. This is a handy restricting tool.
• Summary by 3G, it's interesting to know how much money is being spent.
• App comparison. In ourview, the most efficient way to make non-computer-savvy people realize how much an app is downloading is by comparison with other apps.

Demo
• Send file via Watsapp• Download a file via Opera mini• Apps Comparison.• Monthly Summary and Graph
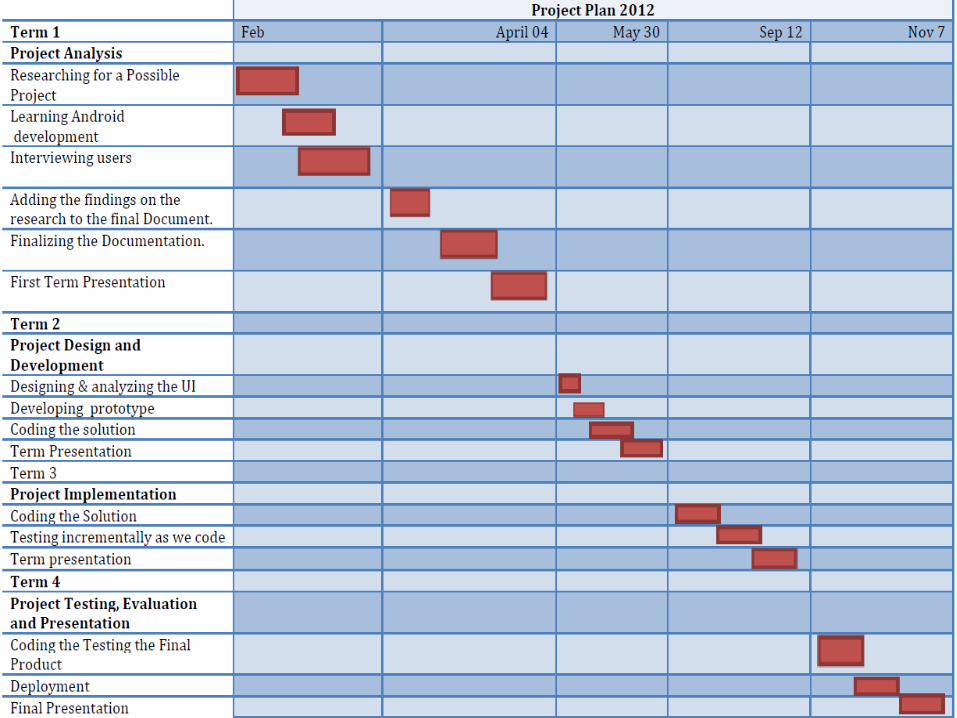

Term 4Week 1 Week 2 Week 3 Week 4 Week 5 Week 6
Review user requirements
Debug errors
Documentation
Research different data
rate
Efficiency Testing
Improve data retrieval speed
Finalize Project
Final Presentation
ReferencesMobile Application Development http://www.webmapsolutions.com/mobile-arcgis-paper-gps-data-collection
Chen, Jason (12 May 2008). "The Top 50 Applications". Android Developers Blog. Retrieved 2009-09-04. Leslie, Ben (13 November 2007). "Native C application for Android". Benno's blog. Retrieved 2009-09-04.
http://source.android.com/source/building-devices.html "Complications looming for Android developers". androidandme.com. 2009-11-06. Retrieved 2010-01-15.
Mobile Application Development http://www.webmapsolutions.com/mobile-arcgis-paper-gps-data-collection
Clint Smith, Daniel Collins. "3G Wireless Networks", page 136. 2000.
Demo first,then questions.