MOBA Network Initiating Coverage - s3-eu-west-1.amazonaws.com
38
Important information: All information regarding limitation of liability and potential conflicts of interest can be found at the end of the report Redeye, Mäster Samuelsgatan 42, 10tr, Box 7141, 103 87 Stockholm. Tel. +46 8-545 013 30, E-post: [email protected] Update Equity Research 1 June 2020 KEY STATS Ticker MOBA Market First North Stockholm Share Price (SEK) 140 Market Cap (MSEK) 240 Net Cash 20E (MSEK) 23 Free Float 20 % Avg. daily volume (‘000) 1 BEAR BASE BULL 85 170 300 KEY FINANCIALS (SEK) 18/19 19/20E 20/21E 21/22E 22/23E Net sales 23 32 43 57 69 EBITDA 12 15 21 28 34 EBIT 11 14 19 25 31 EPS (adj.) 5.6 5.3 7.8 10.6 12.7 EV/Sales 6.6 6.5 4.6 3.2 2.4 EV/EBITDA 12.8 13.7 9.4 6.4 4.9 EV/EBIT 13.9 15.4 10.6 7.2 5.4 P/E 20.7 26.2 17.9 13.2 11.0 ANALYSTS Jonas Amnesten [email protected] Tomas Otterbeck [email protected] 3 4 4 75 85 95 105 115 125 135 145 12-dec 11-mar OMXS 30 M.O.B.A. Network MOBAlizing Network Effects Redeye initiates coverage of M.O.B.A. Network, an attractive play on rapid growth in gaming and Esports that is benefiting both from a nearer-term lockdown boost and longer- term megatrends. The company keeps activity high on its proprietary platform by connecting its communities to strong gaming IPs, while user content and network effects create strong traffic on its websites. Further M&A could help take the share to new heights. Proof of concept M.O.B.A. was founded in 2018 to harness the attractive niche of gaming-related communities, which attract millions of visitors each month. Its sites date as far back as 2009, though. These were created by League of Legends (LoL)-focused subsidiary CriticalClick, which was acquired in September 2018. Since then the company has improved operations and added game IPs to increase revenues. The result is clear, with FY 2018/19 and H1’19/20 growth of over 50%, and 40%, respectively. Corona boost With its gaming/Esport community focus, M.O.B.A. is capitalizing on increased interest in gaming, as well as gamers’ rising purchasing power. The Coronavirus Crisis has boosted user activity in the communities, while Q3’s greater focus on direct sales has turned programmatic deals into to direct deals. April’s 47% Y/Y growth despite the Crisis shows the benefits of the strong Network and brands. Diversifying beyond LoL Although LoL is one of the most popular games in the world, M.O.B.A. is diversifying its substantial exposure as about 95% of all traffic in its network relates to LoL sites. Similarly, its largest community - Mobafire.com - generates some 80% of traffic. The company is adding new websites, such as Runeterrafire.com, that focus on different games and could benefit from the large network of gamers visiting the communities. Attractive position The quality of M.O.B.A.’s communities and its exposure to the gaming/Esports industry are valuable assets. The improvement possibilities of the existing business are also substantial. However, high expectations demand that it continues growing rapidly in the coming years. M&As are not included in our base case estimates, or valuation, but are the likeliest catalyst for the share and could provide confirmation of the company’s strategy creating shareholder value. We regard the stock’s current trading level as, somewhat, unjust and point to potential upside of about 20% to our base case valuation of SEK 170. M.O.B.A. Network Sector: Betting/Entertainment REDEYE RATING FAIR VALUE RANGE Financials People Business
Transcript of MOBA Network Initiating Coverage - s3-eu-west-1.amazonaws.com

Important information: All information regarding limitation of liability and potential conflicts of interest can be found at the end of the report Redeye, Mäster Samuelsgatan 42, 10tr, Box 7141, 103 87 Stockholm. Tel. +46 8-545 013 30, E-post: [email protected]
Update
Equity Research 1 June 2020
KEY STATS
Ticker MOBA Market First North Stockholm
Share Price (SEK) 140 Market Cap (MSEK) 240 Net Cash 20E (MSEK) 23 Free Float 20 %
Avg. daily volume (‘000) 1
BEAR BASE BULL 85
170
300
KEY FINANCIALS (SEK)
18/19 19/20E 20/21E 21/22E 22/23E Net sales 23 32 43 57 69 EBITDA 12 15 21 28 34 EBIT 11 14 19 25 31 EPS (adj.)
17/18 18/19 19/20E 20/21E 21/22E 22/23E EPS (adj.) 5.6 5.3 7.8 10.6 12.7 EV/Sales 6.6 6.5 4.6 3.2 2.4 EV/EBITDA 12.8 13.7 9.4 6.4 4.9 EV/EBIT 13.9 15.4 10.6 7.2 5.4 P/E 20.7 26.2 17.9 13.2 11.0
ANALYSTS
Jonas Amnesten [email protected] Tomas Otterbeck [email protected]
34 4
75
85
95
105
115
125
135
145
12-dec 11-mar
OMXS 30
M.O.B.A. Network
MOBAlizing Network Effects Redeye initiates coverage of M.O.B.A. Network, an attractive play on rapid growth in
gaming and Esports that is benefiting both from a nearer-term lockdown boost and longer-
term megatrends. The company keeps activity high on its proprietary platform by
connecting its communities to strong gaming IPs, while user content and network effects
create strong traffic on its websites. Further M&A could help take the share to new heights.
Proof of concept
M.O.B.A. was founded in 2018 to harness the attractive niche of gaming-related
communities, which attract millions of visitors each month. Its sites date as far back as
2009, though. These were created by League of Legends (LoL)-focused subsidiary
CriticalClick, which was acquired in September 2018. Since then the company has
improved operations and added game IPs to increase revenues. The result is clear, with FY
2018/19 and H1’19/20 growth of over 50%, and 40%, respectively.
Corona boost
With its gaming/Esport community focus, M.O.B.A. is capitalizing on increased interest in
gaming, as well as gamers’ rising purchasing power. The Coronavirus Crisis has boosted
user activity in the communities, while Q3’s greater focus on direct sales has turned
programmatic deals into to direct deals. April’s 47% Y/Y growth despite the Crisis shows
the benefits of the strong Network and brands.
Diversifying beyond LoL
Although LoL is one of the most popular games in the world, M.O.B.A. is diversifying its
substantial exposure as about 95% of all traffic in its network relates to LoL sites. Similarly,
its largest community - Mobafire.com - generates some 80% of traffic. The company is
adding new websites, such as Runeterrafire.com, that focus on different games and could
benefit from the large network of gamers visiting the communities.
Attractive position
The quality of M.O.B.A.’s communities and its exposure to the gaming/Esports industry are
valuable assets. The improvement possibilities of the existing business are also
substantial. However, high expectations demand that it continues growing rapidly in the
coming years. M&As are not included in our base case estimates, or valuation, but are the
likeliest catalyst for the share and could provide confirmation of the company’s strategy
creating shareholder value. We regard the stock’s current trading level as, somewhat,
unjust and point to potential upside of about 20% to our base case valuation of SEK 170.
M.O.B.A. Network Sector: Betting/Entertainment
REDEYE RATING
FAIR VALUE RANGE
Financials
People
Business

REDEYE Equity Research M.O.B.A. Network 1 June 2020
2
Investment Thesis Communities
M.O.B.A.’s communities benefit from substantial user content, as well as network effects.
User content is cheap, as it requires limited rescores from the company, and has a strong
positive effect from an SEO (Search Engine Optimization) perspective too. The community
also creates network effects as the number of users and volume of relevant content grows.
This will become even more attractive as it increases in size, creating considerable moats if it
becomes one of the leading communities in its niche.
A fast-growing company in a fast-growing sector
M.O.B.A. focuses on communities in the sustainable gaming sector - particularly brands that
are suitable for Esport. The gaming sector is set to grow rapidly in the coming years, and
Esports will grow even faster. Several megatrends drive this growth:
• Increased demand for free time entertainment
• Games come of age with increased spending power, as well as a larger part of the
population considering themselves gamers
• Increased internet penetration in emerging markets
M.O.B.A. has also proven that it can grow both visitor traffic and revenues substantially faster
than the underlying market.
Strong gaming IPs
M.O.B.A. owns communities that focus on some of the most influential gaming IPs in the
world, with the largest community, Mobafire.com, focusing on the League of Legends (LoL)
game. LoL is ranked No.1 in the world - both as the most popular core PC game and as the
most watched game on Twitch, according to Newzoo.com. We expect strong IPs like LoL to
benefit from an extended lifetime, which should ensure long-lasting activity in the
communities.
Adding communities and economies of scale
The group can grow by adding new communities, either through in-house launches on its
proprietary platform or acquisitions. It develops and launches new in-house communities in
conjunction with releases of new games. To get them off to strong starts, M.O.B.A. cross-
promotes these launches to its existing communities in the same genre. New websites are
increasing diversification, with the newly launched site Runeterrafire.com seeing rapid
growth.
Furthermore, the company is working to improve its existing websites. This has led to traffic
growth of several hundred percent at Counterstats.net, Smitefire.com, and Leaguespy.gg. We
also believe that there is considerable room to improve the average revenue per user as well.
M.O.B.A.’s clear M&A focus in the gaming community niche is evident in its successful
acquisition of CriticalClick in 2018. Today many communities in the sector operate at a
“hobby” level that offers substantial potential for synergies and optimization if
commercialized under M.O.B.A.’s umbrella. Accordingly, we see good scope for the company
to make value-adding acquisitions through new game titles, rich media, and mobile. This is,
however, not included in our base case estimates or base case valuation.

dsfdsf REDEYE Equity Research M.O.B.A. Network 1 June 2020
3
Catalysts Acquisitions
M.O.B.A. has a clear M&A strategy, though it has only acquired CriticalClick so far. If this
starts to deliver results, we believe investors will value this highly and bid up the share
significantly. Both through its Board (Fredrik Burvall, Jonas Bertilsson, and Maria Andersson
Grimaldi) and CEO, it benefits from extensive experience in adding value via M&A.
Potential target
M.O.B.A. could be a potential acquisition target for companies seeking to access attractive
traffic volumes from the rapidly growing gaming community. Especially for gaming or US
based companies where several M&A has been concluded to a high valuation.
Corona boosted traffic volumes
With the Coronavirus Crisis having put much of the world into isolation, gaming activity, and
traffic on game-related websites have increased. M.O.B.A.’s communities should particularly
benefit, given their focus on social games. Increased activity could potentially boost revenues
in the coming quarters and even create a longer-lasting uptick. If traffic volumes are
maintained at a higher level than before the Crisis and continues to show sequential growth,
this will confirm a strong underlying shift due to product improvements.
Expansion of the services
The new business area M.O.B.A. Services is developing new services. First out is direct sales,
partnership, and sponsorship, which potentially could multiple M.O.B.A.´s revenues.
Quarterly reports
Quarterly reports showing underlying user activity growth being converted to revenues would
be positive for the case. So too would the platform’s scalability increase profit margins.
Counter-Thesis – Bear Points Short history
M.O.B.A. has notable ambition and has delivered on its commitments so far. Moreover, the
acquired CriticalClick has a 10-year track record of successfully creating and managing
communities. However, as M.O.B.A. has only made one acquisition in two years, and
CriticalClick has only operated under M.O.B.A.’s umbrella since September 2018, the existing
set-up and M&A strategy still needs to prove itself further.
Community and game dependency
M.O.B.A. has significant dependence on a single community and a single game. The
company’s largest community in terms of visitor traffic - and probably in terms of revenues
too - is Mobafire.com, which generates some 80% of total traffic. Dependence on the game
‘League of Legends’ is even greater as websites that focus on this title generate about 95% of
the company´s traffic. However, these dependences are declining with the rapid growth of the
company’s other websites, and we regard League of Legends as a brand with a long lifetime.
Dependent on ads
We expect user activity in the communities to be relatively recession-resistant. However, the
majority of M.O.B.A.’s revenues depend on pricing in the ads market, which is sensitive to
economic downturns. The company is mitigating some of this risk by increasing direct sales.

dsfdsf REDEYE Equity Research M.O.B.A. Network 1 June 2020
4
Table of Content
Company description ............................................................................................................................... 5
Business Model ......................................................................................................................................... 6
The Product ............................................................................................................................................ 6
Revenue Model ...................................................................................................................................... 7
Expansion opportunities ...................................................................................................................... 8
Market ....................................................................................................................................................... 10
The Gaming market ............................................................................................................................ 11
The Digital Advertising market .......................................................................................................... 13
Communities ............................................................................................................................................ 14
Management, board and ownership .................................................................................................... 20
Management team .............................................................................................................................. 20
Board of directors ................................................................................................................................ 21
Ownership structure............................................................................................................................ 22
Financials .................................................................................................................................................. 23
Financial projections ........................................................................................................................... 25
Valuation ................................................................................................................................................... 28
DCF Valuation....................................................................................................................................... 29
Relative Valuation ................................................................................................................................ 30
Summary Redeye Rating ....................................................................................................................... 34
Rating changes in the report ............................................................................................................. 34
Redeye Rating and Background Definitions ....................................................................................... 36
Redeye Equity Research team .............................................................................................................. 37
Management ........................................................................................................................................ 37
Technology Team ................................................................................................................................ 37
Life Science Team ............................................................................................................................... 37
Disclaimer ................................................................................................................................................. 38

dsfdsf REDEYE Equity Research M.O.B.A. Network 1 June 2020
5
Company description M.O.B.A. Network (M.O.B.A.) was founded in January 2018 to find suitable acquisition
candidates active within the gaming (computer game) sector, an area that M.O.B.A.’s
management and Board of Directors have previous experiences regarding business
development and expansion. M.O.B.A. is since December 2019 listed on Nasdaq First North
Growth Market and has 16 employees working from Sweden, the US, Canada, Serbia as well
as Romania.
• Business idea: Being the home of some of the world´s most popular and high-quality
gaming/Esport communities.
• Vision: Be the world´s best and largest gaming/Esport community
• Mission: Offer platform and tools to enable gamers to share strategies, bringing
games closer to each other around the globe
In September 2018, the Canadian company CriticalClick Inc. was acquired with established
brands, a solid knowledge base, and profitability with good margins. M.O.B.A. assessed good
opportunities to add its own experiences from the expansion of similar businesses with the
aim of developing CriticalClick through growth, efficiency, and other rationalization gains.
CriticalClick
Since 2009, CriticalClick has developed online-based meeting places, so-called communities,
for users of popular network-based computer games such as League of Legends, DOTA 2,
SMITE, and more. The business currently operates ten communities, some of which can be
regarded as the largest in the world. During some months, the meeting places generate more
than 50 million site visits.
The revenue is generated by internet-based advertising on the websites that constitute the
meeting places. Members of communities are usually well-informed and buoyant consumers
that can be difficult to reach through conventional marketing, and therefore constitute
attractive target groups for a wide range of advertisers.
History
• 2009: The founders of CriticalClick establish mobafire.com – an idea of creating a
community for the game League of Legends.
• 2010: The Company CriticalClick is created after that Mobafire shows good revenue,
and the founders plan for new communities.
• 2011-2016: CrititcalClick launches new communities; Dotafire, Smitefire, and
Heroesfire. The Company pays dividends of SEK 4.3m to the founders for the
financial year 2016.
• 2017: CriticalClick enters into collaboration with Venatus Media that is responsible
for the Company's advertising sales. This is the Company’s first major commercial
agreement and will soon result in further revenue increases. The Company is also
launching two new projects targeting League of Legends, Counterstats.net, and
Leaguespy.net. The Company pays dividends of SEK 4.1m to the founders.
• 2018: M.O.B.A. Network AB was founded in January, intending to be the parent
company of potential operating companies. M.O.B.A. Network acquires CriticalClick
in September. The Company launches its latest project, artifactfire.com. Before the
acquisition, the Company pays dividends of SEK 6.4 million to the founders.
• 2019: M.O.B.A. Network AB conducts an unrestricted share issuance before the
listing of the Company’s share, where after the number of shareholders amounts to
approximately 500.
dsfdsf REDEYE Equity Research M.O.B.A. Network 1 June 2020
6
Business Model M.O.B.A.´s overall business model is to create and manage gaming communities and
websites that bring value to the end-user so that it will continue to visit the websites. In turn,
M.O.B.A. can capitalize on these visitor volumes.
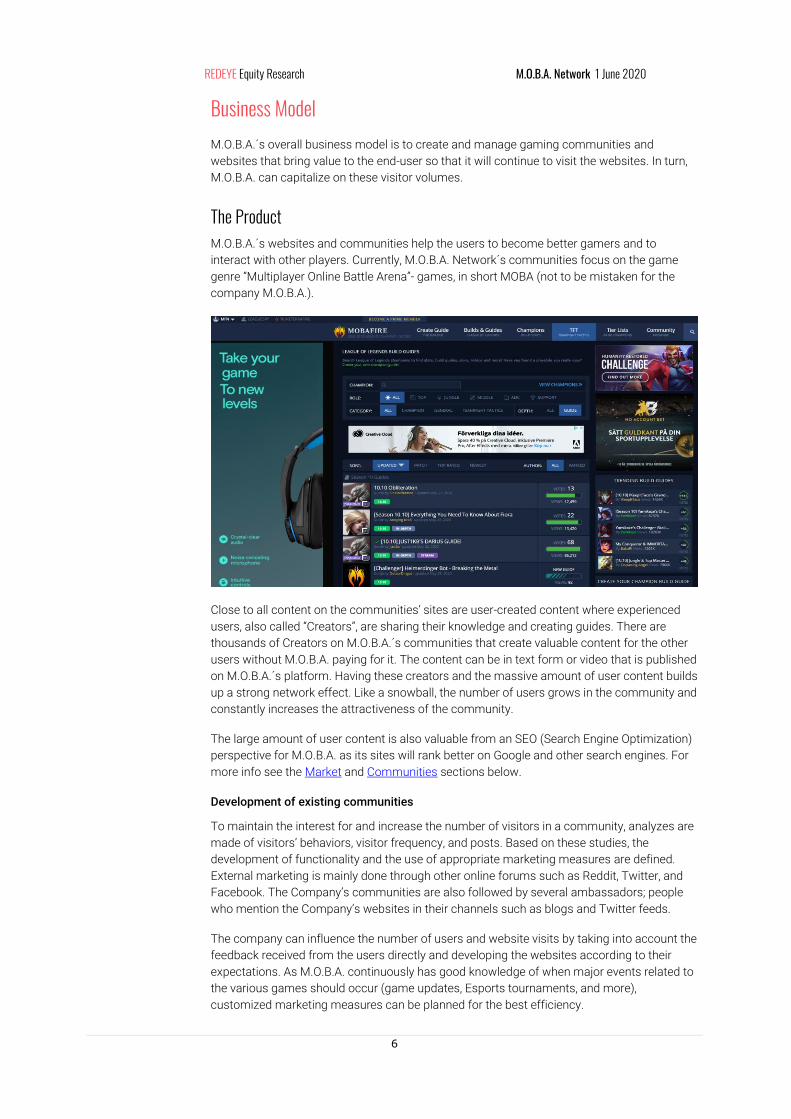
The Product M.O.B.A.´s websites and communities help the users to become better gamers and to
interact with other players. Currently, M.O.B.A. Network´s communities focus on the game
genre “Multiplayer Online Battle Arena”- games, in short MOBA (not to be mistaken for the
company M.O.B.A.).
Close to all content on the communities’ sites are user-created content where experienced
users, also called “Creators”, are sharing their knowledge and creating guides. There are
thousands of Creators on M.O.B.A.´s communities that create valuable content for the other
users without M.O.B.A. paying for it. The content can be in text form or video that is published
on M.O.B.A.´s platform. Having these creators and the massive amount of user content builds
up a strong network effect. Like a snowball, the number of users grows in the community and
constantly increases the attractiveness of the community.
The large amount of user content is also valuable from an SEO (Search Engine Optimization)
perspective for M.O.B.A. as its sites will rank better on Google and other search engines. For
more info see the Market and Communities sections below.
Development of existing communities
To maintain the interest for and increase the number of visitors in a community, analyzes are
made of visitors’ behaviors, visitor frequency, and posts. Based on these studies, the
development of functionality and the use of appropriate marketing measures are defined.
External marketing is mainly done through other online forums such as Reddit, Twitter, and
Facebook. The Company’s communities are also followed by several ambassadors; people
who mention the Company’s websites in their channels such as blogs and Twitter feeds.
The company can influence the number of users and website visits by taking into account the
feedback received from the users directly and developing the websites according to their
expectations. As M.O.B.A. continuously has good knowledge of when major events related to
the various games should occur (game updates, Esports tournaments, and more),
customized marketing measures can be planned for the best efficiency.
dsfdsf REDEYE Equity Research M.O.B.A. Network 1 June 2020
7
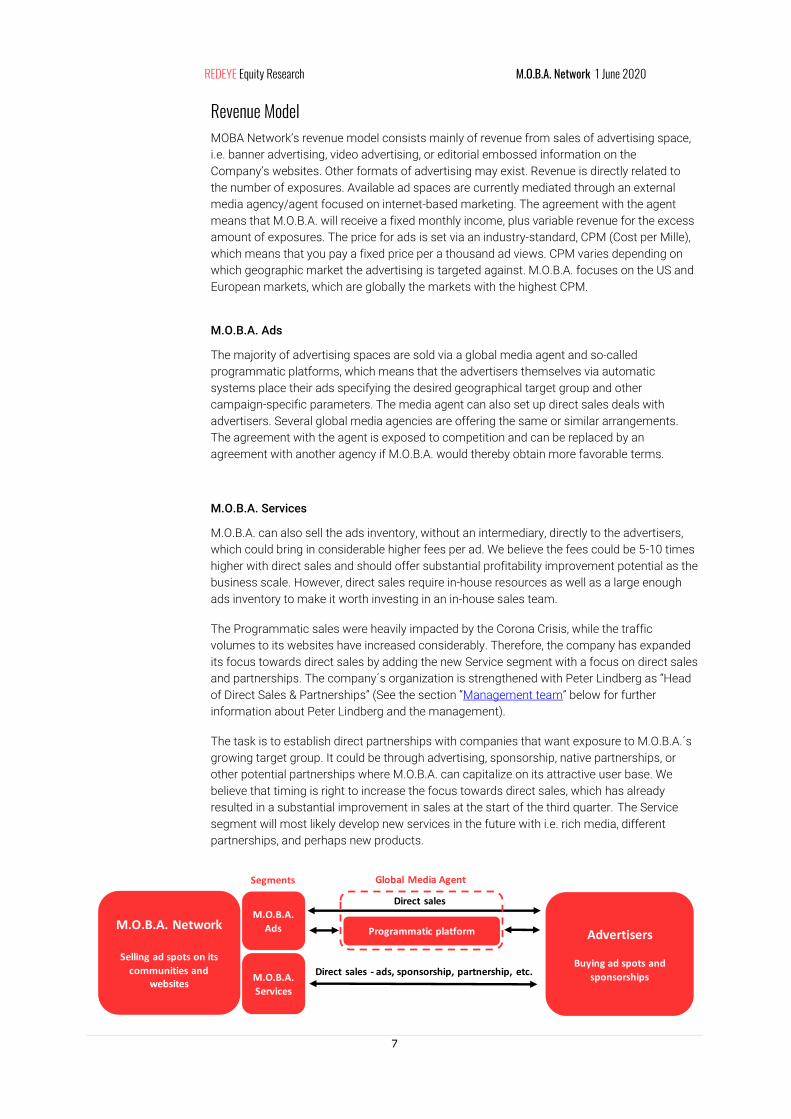
M.O.B.A. Network
Selling ad spots on its
communities and websites
Programmatic platform Advertisers
Buying ad spots and
sponsorships
Direct sales
M.O.B.A.
Ads
M.O.B.A.
Services
Direct sales - ads, sponsorship, partnership, etc.
Global Media AgentSegments
Revenue Model MOBA Network’s revenue model consists mainly of revenue from sales of advertising space,
i.e. banner advertising, video advertising, or editorial embossed information on the
Company’s websites. Other formats of advertising may exist. Revenue is directly related to
the number of exposures. Available ad spaces are currently mediated through an external
media agency/agent focused on internet-based marketing. The agreement with the agent
means that M.O.B.A. will receive a fixed monthly income, plus variable revenue for the excess
amount of exposures. The price for ads is set via an industry-standard, CPM (Cost per Mille),
which means that you pay a fixed price per a thousand ad views. CPM varies depending on
which geographic market the advertising is targeted against. M.O.B.A. focuses on the US and
European markets, which are globally the markets with the highest CPM.
M.O.B.A. Ads
The majority of advertising spaces are sold via a global media agent and so-called
programmatic platforms, which means that the advertisers themselves via automatic
systems place their ads specifying the desired geographical target group and other
campaign-specific parameters. The media agent can also set up direct sales deals with
advertisers. Several global media agencies are offering the same or similar arrangements.
The agreement with the agent is exposed to competition and can be replaced by an
agreement with another agency if M.O.B.A. would thereby obtain more favorable terms.
M.O.B.A. Services
M.O.B.A. can also sell the ads inventory, without an intermediary, directly to the advertisers,
which could bring in considerable higher fees per ad. We believe the fees could be 5-10 times
higher with direct sales and should offer substantial profitability improvement potential as the
business scale. However, direct sales require in-house resources as well as a large enough
ads inventory to make it worth investing in an in-house sales team.
The Programmatic sales were heavily impacted by the Corona Crisis, while the traffic
volumes to its websites have increased considerably. Therefore, the company has expanded
its focus towards direct sales by adding the new Service segment with a focus on direct sales
and partnerships. The company´s organization is strengthened with Peter Lindberg as “Head
of Direct Sales & Partnerships” (See the section “Management team” below for further
information about Peter Lindberg and the management).
The task is to establish direct partnerships with companies that want exposure to M.O.B.A.´s
growing target group. It could be through advertising, sponsorship, native partnerships, or
other potential partnerships where M.O.B.A. can capitalize on its attractive user base. We
believe that timing is right to increase the focus towards direct sales, which has already
resulted in a substantial improvement in sales at the start of the third quarter. The Service
segment will most likely develop new services in the future with i.e. rich media, different
partnerships, and perhaps new products.

dsfdsf REDEYE Equity Research M.O.B.A. Network 1 June 2020
8
Expansion opportunities The communities that have been built up over ten years are today based on the same
scalable platform, meaning that the basic format can easily be reused and adapted to build
new meeting places around several successful game titles. The Board of directors at
M.O.B.A. sees clear expansion opportunities through introductions to new communities and
the acquisition of suitable websites.
Launch of new communities
New communities are based on the company’s existing platform, where the content is
adapted to the current game. After that, the company’s Community Managers must maintain
proper responsiveness to users' wishes and other trends in the gaming market. New
communities can be marketed through existing communities, as users often have an interest
in news, as well as through search engines and established player reviews through social
media or other channels.
M.O.B.A.´s decision to launch a new community is preceded by a number of assessments;
whether the company possesses sufficient insight into the current underlying game, whether
the current game is sufficiently versatile and complex to motivate practitioners and followers
to engage in a community by discussing strategies and functions, commenting on contests
and events, and whether the game currently has or can be expected to reach a sufficient
number of practitioners to justify the effort. With the success of the Mobafire.com
community for the League of Legends, we see an exciting opportunity for more communities
focused on games released by Riot Games.
Focus on popular games
As a result of M.O.B.A.´s selective strategy on suitable communities, the company is focusing
much on popular game titles, as illustrated in the table below. We expect strong game titles
like the League of Legend to have a very long lifetime, which ensures long-lasting activity on
the communities.
Most Watched Games on Twitch* Most Popular Core PC Games*
Game Hours (m) No. Game
League of Legends 123.2 1 League of Legends
Call of Duty: Modern Warfare 96.3 2 Tom Clancy's Rainbow Six: Siege
Counter-Strike: Global Offensive 66.5 3 Counter-Strike: Global Offensive
Fortnite 65.9 4 Call of Duty: Modern Warfare
Grand Theft Auto V 55.9 5 Minecraft
Dota 2 41.7 6 PLAYERUNKNOWN'S BATTLEGROUNDS
Animal Crossing: New Horizons 30.6 7 Apex Legends
Escape From Tarkov 27.2 8 Overwatch
Hearthstone 23.8 9 Hearthstone
Minecraft 22.8 10 Grand Theft Auto V
Source: Newzoo
* March 2020

dsfdsf REDEYE Equity Research M.O.B.A. Network 1 June 2020
9
M&A Strategy
M.O.B.A. has stated a clear M&A strategy where it looks for additional acquisitions like the
one of CriticalClick, where operations are not commercialized or optimized. In general, we
believe it would be more “hobby” driven communities or websites with a focus on
gaming/Esports related games. With the considerable current exposure towards the League
of Legends game, we expect any acquisition to have low exposure towards that game, to
lower the dependency risk. We also believe that M.O.B.A. can realize substantial synergies
both on the revenues (cross prompting, improved ad deals) and on the costs (optimized
operations).
Acquisitions are not all about acquiring assets and domain. M.O.B.A. want through
acquisitions add people with the right skills and experience to the group. In return, M.O.B.A.
can help the acquired company to scale and let the entrepreneurs focus on the product. A
win-win for both parties and the right formula for making value-adding acquisitions, we
believe. M.O.B.A. also benefits from having extensive experience in adding value via M&A,
both through its Board (Fredrik Burvall, Jonas Bertilsson, and Maria Andersson Grimaldi) and
CEO (Björn Mannerqvist).
The company’s current financial position is strong with SEK 32m in cash, and we believe that
the company can take on an acquisition in the size of SEK 50m without taking in external
capital or paying with stocks. However, given that the company has a clear acquisition
strategy, we expect some dilution in the share if the right deal emerges as well as earn-outs.
The company also have a credit (with low interest) with a large Nordic bank which also could
offer financing on a case by case basis.

dsfdsf REDEYE Equity Research M.O.B.A. Network 1 June 2020
10
Human Development Index, world average
Source: http://hdr.undp.org
0.54
0.56
0.58
0.60
0.62
0.64
0.66
0.68
0.70
0.72
19
90
19
91
19
92
19
93
19
94
19
95
19
96
19
97
19
98
19
99
20
00
20
01
20
02
20
03
20
04
20
05
20
06
20
07
20
08
20
09
20
10
20
11
20
12
20
13
20
14
20
15
HD
I
% Gamers per age population in the USA
Source: Newzoo, populationpyramid.net & Redeye Research
100 50 0 50 100
51-65
36-50
21-35
10-20
% that play games % that dont play games
96% 4%
78% 22%
71% 29%
37% 63%
Market M.O.B.A.´s communities are focus on the gaming and the Esport industries, which are driven
by several megatrends. Some of these trends are globally improved living standards,
demographic shifts, and digitalization. We expect to see an underlying annual growth for
M.O.B.A. Network´s market segment in the range of 10-20% in the coming years.
The company does not report geographical demographics, but based on the traffic data, we
estimate that the US is the largest market with more than 15% of the visitor traffic. The US
market is followed by Germany and Brazil, both around 5%.
Improved living standards
Global living standards are improving steadily, here visualized by the rising average World
Human Development Index. For the gaming industry, this leads to the following:
• More free time and increased demand for entertainment
• More money to spend on entertainment globally
Demographic shift – Games come of age
Demographic shift increases the average age of gamers. Popularity for games grew large
during the 80s and 90s; these are now in their mid-thirties with a lifetime peak of spending
power. We believe that the adult population that today sees games as a normal part of their
leisure time will also do so when they come close to retirement. The “gaming” generation also
passes on their interest to their children, which will lead to more even more adults playing
games in the future. In the US there are today about 160 million people in the ages 10-65 that
play games at least one time per month. Demographic shifts will lead to an increasing share
of people closer to retirement playing games, creating a massive opportunity and a growing
target group.

dsfdsf REDEYE Equity Research M.O.B.A. Network 1 June 2020
11
Digitalization
The increased internet usage, as well as increased internet capacity, continued to drive the
digitalization of the world, with more and more services going online.
The rise of digital distribution has led to easier access to games and lower costs for selling
games, which leads to an increased share of profits for game developers. The Improved
profits lead to greater reinvestment opportunities and thus improving the gaming experience
and drive innovation.
The digitalization is also greatly impacting the advertisements industry, with rapid growth for
the digital advertisement segment. The growth is expected to continue in the years to come,
see the section “The Digital Advertising market” for further details.
The Gaming market The result of the mentioned megatrends is a robust and consistent growth for the gaming
market, with an expected annual growth of 10% for the period 2018-2022, as illustrated in the
graph below.
Global internet user penetration 2014-2021
Source: Statista
0%
10%
20%
30%
40%
50%
60%
2014 2015 2016 2017 2018 2019 2020 2021
Global Gaming Market in USD bn
Source: Newzoo
0
50
100
150
200
250
2018 2019 2020E 2021E 2022E
US
D b
n
Console Tablet Smartphone PC Browser PC
$ 139bn$ 152bn
$ 165bn$ 178bn
$ 196bn
10% CAGR 2018-2022
dsfdsf REDEYE Equity Research M.O.B.A. Network 1 June 2020
12
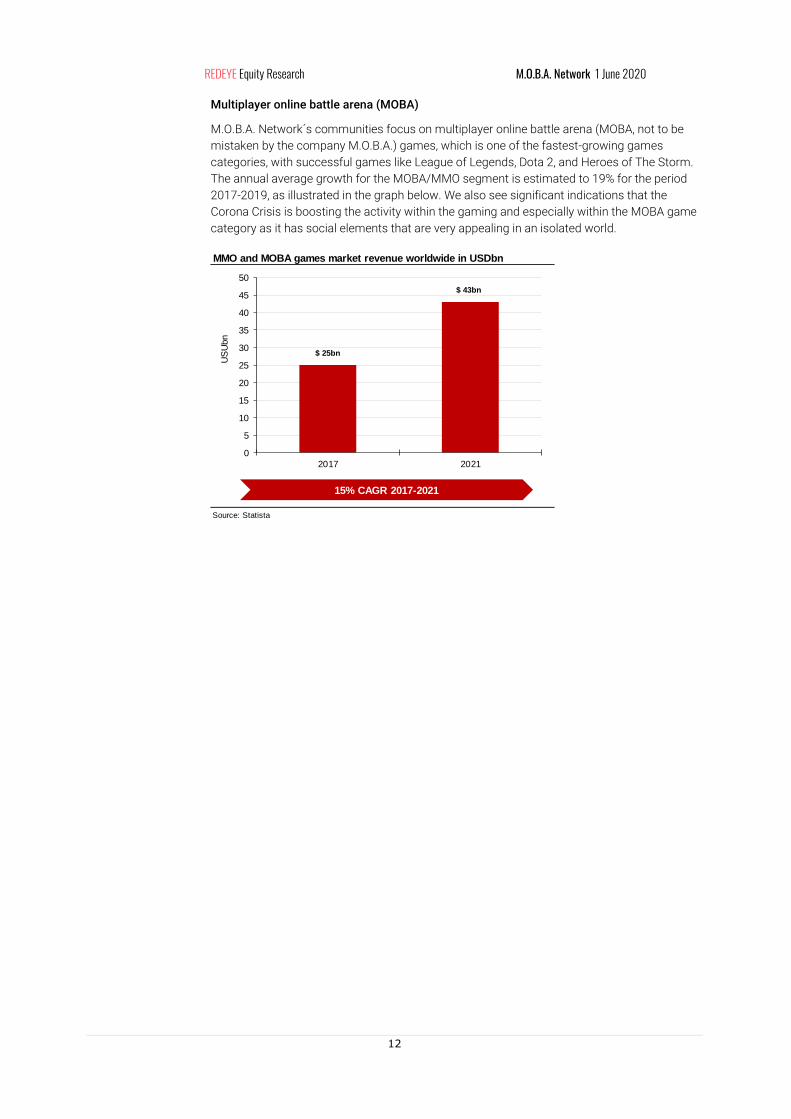
Multiplayer online battle arena (MOBA)
M.O.B.A. Network´s communities focus on multiplayer online battle arena (MOBA, not to be
mistaken by the company M.O.B.A.) games, which is one of the fastest-growing games
categories, with successful games like League of Legends, Dota 2, and Heroes of The Storm.
The annual average growth for the MOBA/MMO segment is estimated to 19% for the period
2017-2019, as illustrated in the graph below. We also see significant indications that the
Corona Crisis is boosting the activity within the gaming and especially within the MOBA game
category as it has social elements that are very appealing in an isolated world.
MMO and MOBA games market revenue worldwide in USDbn
Source: Statista
0
5
10
15
20
25
30
35
40
45
50
2017 2021
US
Ubn
$ 25bn
$ 43bn
15% CAGR 2017-2021

dsfdsf REDEYE Equity Research M.O.B.A. Network 1 June 2020
13
Highest prize pools per eSport titles 2019 eSport global revenue (mUSD)
Source: esportearnings Source: statista
223
9585
74
33
0
50
100
150
200
250
Annual
prize p
ool (m
US
D)
130 194325
493655
865
1096
14881650
1790
0
200
400
600
800
1000
1200
1400
1600
1800
2000
Reve
nue (
mU
SD
)
CAGR 2018-2022: 20%
Esport
Electronic Sport (Esport) was born in 1972 when the earliest known video game competition
took place at Stanford University in the US for the game Spacewar. After that, Esports entered
arcade halls until games started to be played online. Since then, several players such as
Nintendo, Playstation, and Xbox have launched new hardware platforms. Today, Esports
engages over 335 million people worldwide and has developed into a billion-dollar industry
with sponsored teams, tournaments, and leagues that are broadcasted and fill arenas.
The M.O.B.A. Network´s communities focus much on the Esport vertical as both Dota 2 (1st),
and League of Legends (4th) are popular Esports games with massive prize pools as a result,
as illustrated in the left-hand graph below. The Esport market is growing rapidly with an
expected average annual growth of 20% for the period 2018-2022, as illustrated in the right-
hand graph below. This development is also converted to increased activities for
communities. According to Newzoo, the Esport communities consist of 160 million
individuals and is growing 15% annually.
The Digital Advertising market M.O.B.A.´s revenues derived from sales of advertising space on the company’s websites. The
revenues are, in the long-term, directly related to how many views are achieved of advertisers
advertising messages. In recent years, network-based marketing and advertising have
increased significantly. The digital advertising market is growing with an expected average
annual growth of 11% for the period 2017-22, as illustrated in the graph below.
Digital Advertising Market in USDbn
Source: Statista
0
50
100
150
200
250
300
350
400
450
500
2017 2018 2019 2020 2021 2022
US
Ubn
Banner Advertising Classifieds Video Advertising
Social Media Advertising Search Advertising
$ 252bn
$ 293bn
$ 336bn
$ 374bn$ 407bn
$ 433bn
11% CAGR 2017-2022

dsfdsf REDEYE Equity Research M.O.B.A. Network 1 June 2020
14
Communities Gamers and Esports supporters highly tend to establish contacts, visit forums, and contribute
to channels of information and exchange experiences. Such meeting places or networks are
referred to as communities.
M.O.B.A´s communities are based on the same concept, and a new community can,
therefore, be created on the company’s existing technology platform. Thus, the scalability of
the business is good and requires only minor investments such as graphic customization,
server space, and to some extent, targeted marketing. Furthermore, the communities offer
substantial amounts of user content as well as network effects. User content is both cheap,
as it requires limited rescores from the company, and attractive from an SEO perspective.
The community also creates network effects as the community grows in the number of users
and the amount of relevant content. The community´s attractiveness will become more
significant as it increases in size, creating considerable moats if it becomes one of the
leading communities within its game niche.
Mobafire.com – launched 2009
Mobafire is the Company’s largest individual community and is aimed for players of the
computer game League of Legends, developed by Riot and released in 2009 when Mobafire
also was launched. Over the years, League of Legends has grown to become the biggest
game within the MOBA genre, and Mobafire has evolved with the game into a very well-
known brand and popular community. In 2016, the game developer Riot announced that the
game at the time had over 100 million active players per month.
Dotafire.com – launched 2011
Dotafire is a community for players of DOTA 2, one of the most famous MOBA games
developed by Valve. DOTA 2 is one of the biggest titles in the world. The competition “The
International” held in Aug 2019 had the largest prize pool in the history of Esports, USD 34m.
Smitefire.com – launched 2012
Smitfire is a community for players of Smite, a MOBA game that figures around mythological
creatures. Smite was released in 2014 by the developer Forge Games and is available on all
major gaming platforms such as PC, Mac, Playstation, and Xbox. Unofficial figures states
that Smite has over 15 million players worldwide.
Heroesfire.com – launched 2014
Heroesfire is a community for players of Heroes of the Storm, a MOBA game where
characters meet from the developer Blizzards previous games Warcraft, Starcraft and Diablo.
Vaingloryfire.com – launched 2014
Vaingloryfire is a community for players of Vainglory, a MOBA game for the mobile platforms
iOS and Android, developed by Super Evil Megacorp. The game was launched in 2014.
Owfire.com – launched 2016
Owfire is a community for players of Overwatch, a so-called first-person shooter game in
team form. Overwatch was developed by Blizzard and was released in 2016. The game is big
within Esports through among others through the Overwatch League, which has a prize pool
of over USD 3.5m.
Leaguespy.gg & Counterstats.net – launched 2017
Leaguespy and Counterstats are websites that aggregate data from the game League of
Legends (via API) and show statistics about the different characters in the game to provide
the visitor an insight into how to best equip themselves to meet the character when playing.

dsfdsf REDEYE Equity Research M.O.B.A. Network 1 June 2020
15
Artifactfire.com – launched 2018
Artifactfire is a community for players of the newly released game Artifact, a strategy card
game based on DOTA 2. Artifact was launched at the end of November in 2018 by the
developer Valve. In connection with the launch of the game, Artifactfire received a large traffic
flow and registered members who use the website’s function to build so-called card decks
and to receive constructive criticism from the members of a community.
Runeterrafire.com – launched 2020
Runeterrafire is a website that allows the users to create so-called “card-decks” based on the
game cards from the game Legends of Runeterra. In addition, beginners are offered
information about each card and character in the game.

dsfdsf REDEYE Equity Research M.O.B.A. Network 1 June 2020
16
DomainGame
focus
Traffic
(million)*
Traffic
Growth** (%)
Main markets
(% of Traffic)
Avg. Visit
Duration
Bounce
Rate
mobafire.com League of
Legends30.82 35%
US (15%), Brazil
(5%) & Germany
(4%)
00:03:53 34%
counterstats.net League of
Legends4.83 403%
US (14%),
Germany (7%) &
Poland (5%)
00:01:22 72%
smitefire.com Smite 1.58 100%US (36%), UK (7%)
& Canada (6%)00:04:57 42%
leaguespy.gg League of
Legends0.40 100%
US (12%), Brazil
(11%) & France
(5%)
00:02:02 58%
dotafire.com DOTA 2 0.36 62%
US (15%),
Philippines (12%)
& Germany (7%)
00:02:17 53%
runeterrafire.com
Legends
of
Runeterra
0.24 n.m.
US (16%), Brazil
(7%) & France
(5%)
00:02:27 39%
heroesfire.com Heroes of
the Storm0.22 47%
US (19%),
Germany (8%) &
Brazil (7%)
00:04:25 45%
vaingloryfire.com Vainglory 0.02 -67%
US (18%), Turkey
(8%) & Russia
(8%)
00:02:53 54%
Total 38.5 53%
Source: Redeye Research, Similarweb.com
*Monthly traffic based on traffic data estimates from Similarweb.com
**Last six months
M.O.B.A. Network: Top domains
Traffic data
We show visitor traffic KPIs for M.O.B.A.´s website domains below. These are based on
estimates from Similarweb.com1. Overall traffic to the sites is growing rapidly – up 53% in the
last six months. This is a considerably faster growth rate than that of either peer
communities (which we comment further on below) or the underlying market. This suggests
that M.O.B.A.’s efforts to improve the sites are paying off.
The data also reveals M.O.B.A.’s significant dependence on Mobafire.com. This community
generates about 80% of the company´s visitor traffic. This probably corresponds closely to
revenue streams, making M.O.B.A.´s revenues highly sensitive to Mobafire.com’s
performance. The same goes for its dependence on the ‘League of Legends’ (LoL) game
since as much as 95% of traffic is generated from LoL-focused sites.
Furthermore, we note that none of the sites/communities released after Mobafire.com has
yet grown to a size that impacts the group’s overall traffic substantially. It may be that
CriticalClick put its greatest efforts into the successful Mobafire.com site, but in our view, it
also shows the challenge of making new sites succeed. However, M.O.B.A’s increased efforts
to improve its other brands are beginning to pay off as these sites are now seeing excess
growth.
1 M.O.B.A. confirms that Similarweb.com´s estimates give a correct picture of the domains’ relative performance. However, the actual traffic numbers are about 25% higher. M.O.B.A. reports 50m visits in April, for example, compared to Similarweb.com’s 38.5m.
dsfdsf REDEYE Equity Research M.O.B.A. Network 1 June 2020
17
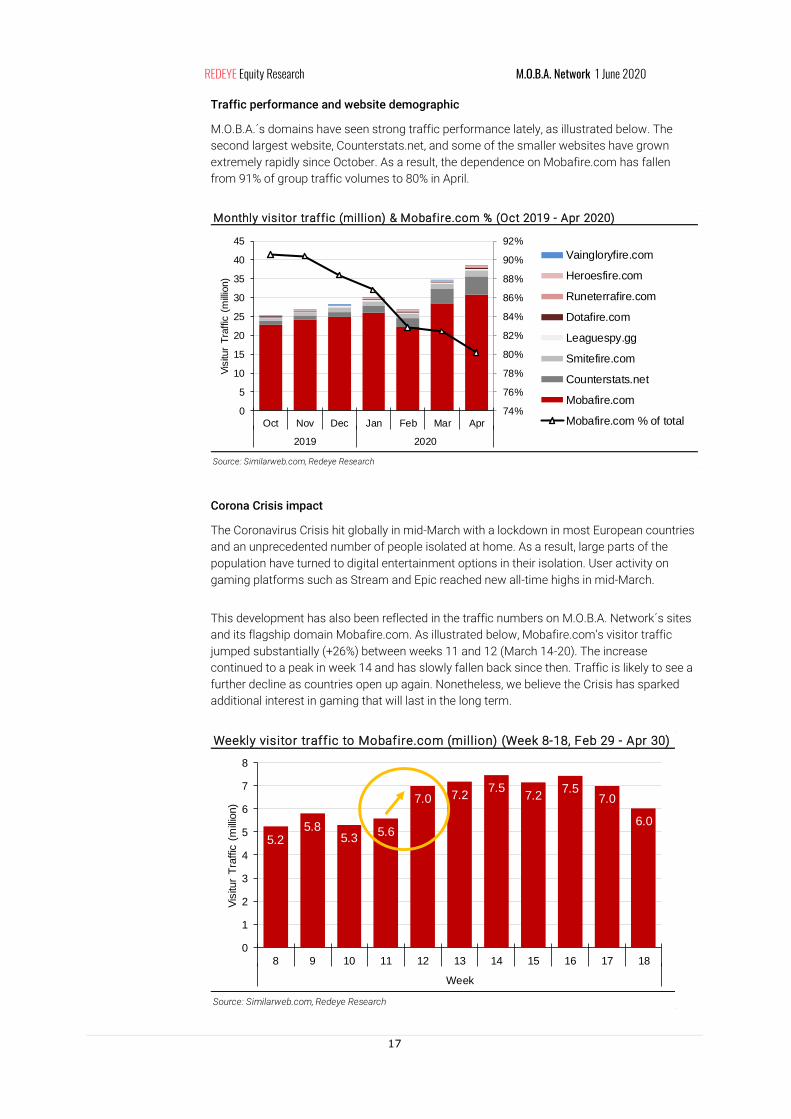
Traffic performance and website demographic
M.O.B.A.´s domains have seen strong traffic performance lately, as illustrated below. The
second largest website, Counterstats.net, and some of the smaller websites have grown
extremely rapidly since October. As a result, the dependence on Mobafire.com has fallen
from 91% of group traffic volumes to 80% in April.
Corona Crisis impact
The Coronavirus Crisis hit globally in mid-March with a lockdown in most European countries
and an unprecedented number of people isolated at home. As a result, large parts of the
population have turned to digital entertainment options in their isolation. User activity on
gaming platforms such as Stream and Epic reached new all-time highs in mid-March.
This development has also been reflected in the traffic numbers on M.O.B.A. Network´s sites
and its flagship domain Mobafire.com. As illustrated below, Mobafire.com’s visitor traffic
jumped substantially (+26%) between weeks 11 and 12 (March 14-20). The increase
continued to a peak in week 14 and has slowly fallen back since then. Traffic is likely to see a
further decline as countries open up again. Nonetheless, we believe the Crisis has sparked
additional interest in gaming that will last in the long term.
Monthly visitor traffic (million) & Mobafire.com % (Oct 2019 - Apr 2020)
Source: Similarweb.com, Redeye Research
74%
76%
78%
80%
82%
84%
86%
88%
90%
92%
0
5
10
15
20
25
30
35
40
45
Oct Nov Dec Jan Feb Mar Apr
2019 2020
Vis
itur
Tra
ffic
(m
illio
n)
Vaingloryfire.com
Heroesfire.com
Runeterrafire.com
Dotafire.com
Leaguespy.gg
Smitefire.com
Counterstats.net
Mobafire.com
Mobafire.com % of total
Weekly visitor traffic to Mobafire.com (million) (Week 8-18, Feb 29 - Apr 30)
Source: Similarweb.com, Redeye Research
5.25.8
5.35.6
7.0 7.27.5
7.27.5
7.0
6.0
0
1
2
3
4
5
6
7
8
8 9 10 11 12 13 14 15 16 17 18
Week
Vis
itur
Tra
ffic
(m
illio
n)
dsfdsf REDEYE Equity Research M.O.B.A. Network 1 June 2020
18
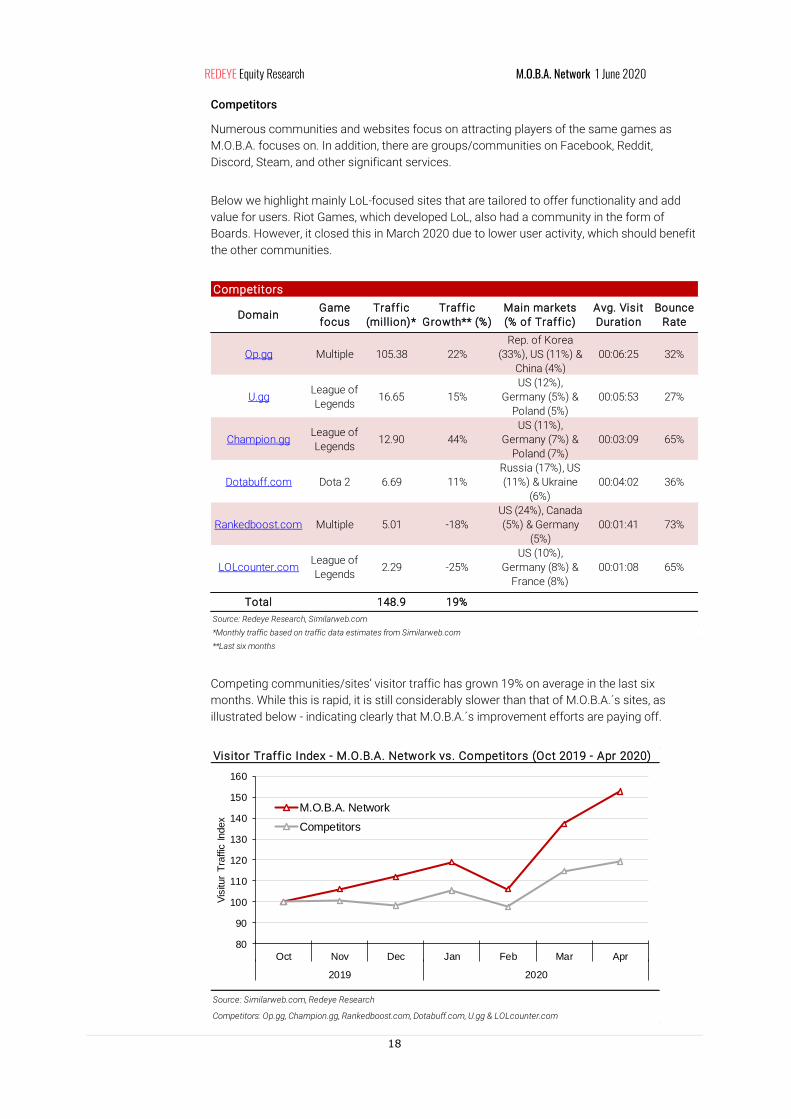
Competitors
Numerous communities and websites focus on attracting players of the same games as
M.O.B.A. focuses on. In addition, there are groups/communities on Facebook, Reddit,
Discord, Steam, and other significant services.
Below we highlight mainly LoL-focused sites that are tailored to offer functionality and add
value for users. Riot Games, which developed LoL, also had a community in the form of
Boards. However, it closed this in March 2020 due to lower user activity, which should benefit
the other communities.
Competing communities/sites’ visitor traffic has grown 19% on average in the last six
months. While this is rapid, it is still considerably slower than that of M.O.B.A.´s sites, as
illustrated below - indicating clearly that M.O.B.A.´s improvement efforts are paying off.
DomainGame
focus
Traffic
(million)*
Traffic
Growth** (%)
Main markets
(% of Traffic)
Avg. Visit
Duration
Bounce
Rate
Op.gg Multiple 105.38 22%
Rep. of Korea
(33%), US (11%) &
China (4%)
00:06:25 32%
U.ggLeague of
Legends16.65 15%
US (12%),
Germany (5%) &
Poland (5%)
00:05:53 27%
Champion.ggLeague of
Legends12.90 44%
US (11%),
Germany (7%) &
Poland (7%)
00:03:09 65%
Dotabuff.com Dota 2 6.69 11%
Russia (17%), US
(11%) & Ukraine
(6%)
00:04:02 36%
Rankedboost.com Multiple 5.01 -18%
US (24%), Canada
(5%) & Germany
(5%)
00:01:41 73%
LOLcounter.comLeague of
Legends2.29 -25%
US (10%),
Germany (8%) &
France (8%)
00:01:08 65%
Total 148.9 19%
Source: Redeye Research, Similarweb.com
*Monthly traffic based on traffic data estimates from Similarweb.com
**Last six months
Competitors
Visitor Traffic Index - M.O.B.A. Network vs. Competitors (Oct 2019 - Apr 2020)
Source: Similarweb.com, Redeye Research
Competitors: Op.gg, Champion.gg, Rankedboost.com, Dotabuff.com, U.gg & LOLcounter.com
80
90
100
110
120
130
140
150
160
Oct Nov Dec Jan Feb Mar Apr
2019 2020
Vis
itur
Tra
ffic
Index
M.O.B.A. Network
Competitors

dsfdsf REDEYE Equity Research M.O.B.A. Network 1 June 2020
19
Estimated Revenue per Visit, Minute and Page view during the full year of 2019
Source: Similarweb.com, Redeye Research
6.30
2.5
1.20
0.68
0.18 0.10 0.09
0
1
2
3
4
5
6
7
Revenue (SEK) per
Visit
Reve
nue (
SE
K)
Everysports Media Group
HLTV.org
Enthusiast Gaming
M.O.B.A. Network
0.86
0.34
0.2
0.070.02 0.02 n.m.
0.00
0.10
0.20
0.30
0.40
0.50
0.60
0.70
0.80
0.90
1.00
Revenue (SEK) per
Minute
0.95
0.31 0.3
0.06 0.03 0.03 0.02
0.00
0.20
0.40
0.60
0.80
1.00
1.20
Revenue (SEK) per
Page view
Capitalizing on traffic
To understand how well M.O.B.A. capitalizes on its traffic volumes, we gathered traffic data
(number of visits, minutes spent per visit, and page views per visit) for several other
communities. Please note that the data is based on estimates from Similarweb.com: the goal
is to give a rough picture of the potential for improving capitalization.
We then compared traffic data to revenues, as illustrated below. The companies we looked at
include several major services (Facebook, LinkedIn, and Twitter). We also added several
smaller community-focused companies that are gaming, sports, and Esports-related
(Enthusiast Gaming, Everysport Media Group, and HLTV.org). Enthusiast Gaming owns over
100 gaming-related sites and communities. Everysport Media Group owns several sports-
related sites and communities. HLTV.org is an Esports-related community that Better
Collective acquired earlier in 2020.
The graphs below show that M.O.B.A. is in line with other gaming-related communities, such
as Enthusiast Gaming and HLTV.org. Its revenue model is similar to Enthusiast Gaming, while
HLTV.org has a significant focus on leads for betting companies. However, we see a huge
difference. One reason is that, for example, LinkedIn makes most of its revenues from
premium functions and other services, while only around 20% is marketing-related. Facebook,
on the other hand, generates close to all its revenues from marketing, which is more like
M.O.B.A.´s business model. However, Facebook has much more data and information about
its users, which is very valuable from a marketing perspective.
Note that Everysport Media Group manages to capitalize on its traffic volumes quite well
despite being a small company. In our view, this reflects its strong affiliate partnerships.
As a result, we see considerable scope for M.O.B.A. and the gaming communities to improve
the capitalization of their traffic volumes. New solutions and partnerships are crucial to
achieving higher revenue per visitor, we judge. This makes the timing of M.O.B.A.´s new
segment, M.O.B.A. Services, very suitable. Increased marketing interest in M.O.B.A.´s target
group, gamers, should also improve user values. However, we do not expect these to expand
without substantial investment and effort.
dsfdsf REDEYE Equity Research M.O.B.A. Network 1 June 2020
20
Management, board and ownership
Management team CEO - Björn Mannerqvist
Björn Mannerqvist has worked with digital marketing and SEO all over the world for 20 years.
He has a broad experience of digital solutions and rapidly growing companies. He is the
former CEO of Future Gaming Group International AB and the former Director of Operations
at Ayima Nordic AB. Currently he is a board member of several Swedish listed companies
including Tourn International AB and Orgo Tech AB.
CFO - Anna Jansson
Over five years experience of CFO-functions in listed companies, including day-to-day
bookkeeping, consolidation of group companies, producing quarterly/annual reports.
Degree of Master of Science in Business and Economics, University of Stockholm.
Head of law & IR - David Nylén
David Nylén has a vast experience of providing legal advice to listed companies, including
matters relating to M&A, IPO, and securities law. Previous professional experience include
work at a law firm, administrative court, and a listed company.
Master of Laws, LLM degree, University of Gothenburg.
Head of Direct Sales & Partnerships - Peter Lindberg
Peter Lindberg has a broad experience from marketing, sales, and leadership with a
longstanding background in various sales and sales leadership roles, including at MTG and
Lagardère Sports. Most recently, he comes from a position as Business Director at content
agency Brand New Story.

dsfdsf REDEYE Equity Research M.O.B.A. Network 1 June 2020
21
Board of directors Chairman - Fredrik Burvall
Experience: Fredrik Burvall has a broad experience from digital companies and complex
organizations. As the CEO of Cherry AB (publ), chairman of Speqta, and board member at
Aspire Global, he has gained extensive experience within leadership, M&A, and Financing.
Current board assignments: Chairman of Speqta, board member Aspire Global,
Gambling.com Group, Enteractive Ltd, and tNN AB.
Previous board assignments: Chairman of Cherry Spelglädje AB. Board member and CEO of
Cherry Casino Syd AB, Playcherry PR & Media AB, and Svenska Klubbspel AB. CEO of Cherry
AB (publ). Board member of Bell Maritime Gaming AB. Board member of Yggdrasil Polska,
Yggdrasil Holding Ltd, Cherry Polska, and Cherry Holding Ltd.
Board member - Maria A. Grimaldi
Experience: Currently CEO of Bublar Group and has a vast experience from the gaming
industry as well as extensive experience of investing in gaming and tech companies.
Previously Senior Investment Manager at Goodbye Kansas Group, the investment arm of the
international gaming company the Goodbye Kansas Group. Previously CEO for the Nordic
Game Association for more than 12 years.
Current board assignments: Bublar Group (NGM), Esportal, and Full Damage Studio
(Chairman)
Previous board assignments: Pan European Game Association, Fishbrain, and Ztorm
Board member - Jonas Bertilsson
Experience: Currently CEO at AB Rugosa Invest and has a broad experience from financing,
M&As, and tech investments. Previously Partner and co-CIO at the investment fund manager
Elementa Management and Investment Director at Varenne. Prior experience also includes
Investment Banking at Carnegie and M&A at Addnode Group, a leading IT-solutions Group.
Current board assignments: Chairman of Nordic e trade AB, Board member of Net Gaming
Europe, and AB Rugosa Invest.
Previous board assignments: Varenne Invest, Pema Sweden, Bed Facory Sweden, and
Mengus Funds
Board member - Henrik Henriksson
Experience: Currently CFO at ETON Shirts. Previously Brand Controller/CFO of ”WEEKDAY" -
New Business Organisation at H&M and Brand Controller/CFO of ”COS" at H&M. . Prior
experience also includes Country Controller at H&M - US, based in New York, US.
Current board assignments (private companies): Atigarden AB, and Torrahf Invest AB
Board member - Manfred Gottschlich
Experience: Experience from investing, operating, and running companies in the areas of food
and beverage, building, and mechanical production.
Current board assignments: Olearys Holding AB, Olearys restaurants AB, Olearys trademark
AB, Interoc Holding AB, Interoc AB, Interoc projektutveckling AB, and Interoc
fastighetsutveckling AB
Previous board assignments: Powerwave Technologies, Lgp Holding AB, Lgp Telecom
Holding AB, and MG Instrument AB

dsfdsf REDEYE Equity Research M.O.B.A. Network 1 June 2020
22
Ownership structure In total, the Management and Board own around 15% of the shares in M.O.B.A., as illustrated
in the tables below. Five of nine members in the management and the Board owns shares
directly or indirectly. We highly value the large ownership amongst the management and the
Board, as it should ensure shareholder-friendly decisions.
M.O.B.A. also has two large owners in New Equity Venture International AB, and Trottholmen
AB that can add further value to the group. Moreover, the company has two institutions, TIN
Fonder (3.3%) and Alcur Fonder (1.4%), amongst its ten largest owners, which is impressive
given M.O.B.A.’s relatively small market cap and low stock liquidity.
We view the ownership structure as strong and believe it ticks all crucial boxes. However, due
to the quite large ownership amongst insiders and the largest owners, the liquidity in the
stock is below SEK 100k per trading day in the last three months. The very low liquidity
creates a liquidity risk and a large spread in the share price.
Name
Number of
shares
Value in SEKm at share price 120
SEK (excluding warrants)
Management
Björn Mannerqvist 50 000 6.0
Anna Jansson 0 0.0
David Nylen 0 0.0
Peter Lindberg 0 0.0
Board
Fredrik Burvall 2 700 0.3
Jonas Bertilsson 158 384 19.0
Manfred Gottschlich 43 000 5.2
Henrik Henriksson 1 087 0.1
Maria A. Grimaldi 0 0.0
Source: M.O.B.A. Network, Holdings.se, Redeye Research
Holdings of the management and board
Ownership structure M.O.B.A. Network
Name Capital % Management and board Capital %
New Equity Venture International AB 28.5% Management 2.9%
Trottholmen AB 22.4% Board 12.0%
AB B21 12.9% Total 15.0%
AB Rugosa Invest 9.3%
Cloverhill 9.2%
TIN Fonder 3.3%
Digital Spine AB 2.9%
Manfred Gottschlich 2.5%
Alcur Fonder 1.4%
Nordnet Pensionsförsäkring 1.1%
Other owners 6.5%
Source: M.O.B.A. Network (March 31, 2020)

dsfdsf REDEYE Equity Research M.O.B.A. Network 1 June 2020
23
Financials M.O.B.A. Network´s journey has just started, and the focus since the CriticialClick acquisition
has been to improve CriticalClick´s operations, with a shift towards more commercialized
operations. The main improvements have been to optimize the revenue by getting better
advertisement deals and enhance the value of the traffic to its domains. The impact of these
improvements can be seen in the graph below as the revenue level increased significantly in
the financial year of 2018/2019, with a growth of 56%.
This development has continued into 19/20, as illustrated in the graph below, with net
revenue growth of 47% for Q1’19/20 (Oct-Dec) and 32% for Q2’19/20 (Jan-Mar), despite a
negative Corona effect in March. The company has stated that the growth in April reach 47%
thanks to an increased focus on direct sales. The graph also demonstrates the seasonality
effect where Q1 (Oct-Dec) is the strongest quarter driven by the buying-side´s large marketing
budgets in conjunction with Black-Friday and Christmas. We find the continuous growth
evidence that there is a long-lasting growth driver behind the development.
Revenue and EBITDA margin for CriticaClick (14/15-17/18) & M.O.B.A. (18/19)
Source: M.O.B.A. Network, Redeye Research
9.510.3
9.1
14.9
23.3
0%
10%
20%
30%
40%
50%
60%
70%
80%
0
5
10
15
20
25
Marg
in
Reve
nue (
SE
Km
)
Revenue EBITDA margin
M.O.B.A.CriticalClick
M.O.B.A. Network: Revenues and EBITDA margin
Source: M.O.B.A. Network, Redeye Research
6.35
4.79
5.955.42
9.33
6.32
0%
10%
20%
30%
40%
50%
60%
70%
0
1
2
3
4
5
6
7
8
9
10
Q1'18/19 Q2'18/19 Q3'18/19 Q4'18/19 Q1'19/20 Q2'19/20
Marg
in
SE
Km
Net Revenues Other Revenues EBITDA margin (%)

dsfdsf REDEYE Equity Research M.O.B.A. Network 1 June 2020
24
Earnings
The EBITDA in Q2´19/20 has not grown at the same pace as the revenues, as illustrated in
the graph below, due to significant investments in improving and optimizing the underlying
operations. Furthermore, the EPS has been negatively impacted by the new issue of shares in
conjunction with the IPO in December 2019.
Balance sheet
M.O.B.A. has a robust financial position with SEK 32m in cash and a net cash position of SEK
19m, which gives the group to take advantage of M&A opportunities that can create
significant equity leverage. We assess that the company could increase the debt level with an
additional SEK 20m to take on a larger acquisition, if necessary, and still maintain a stable
financial position. The company has a case by case M&A financing agreement with a large
Nordic bank, which ensures swift excisions when the right M&A opportunity emerges.
M.O.B.A. Network: EBITDA and EPS
Source: M.O.B.A. Network, Redeye Research
0.0
0.5
1.0
1.5
2.0
2.5
3.0
Q1'18/19 Q2'18/19 Q3'18/19 Q4'18/19 Q1'19/20 Q2'19/20
0.0
0.5
1.0
1.5
2.0
2.5
3.0
3.5
4.0
4.5
5.0
EP
S (
SE
K)
EB
ITD
A (
SE
Km
)
EBITDA EPS

dsfdsf REDEYE Equity Research M.O.B.A. Network 1 June 2020
25
M.O.B.A. Network: Financial Forecasts
(SEKm) 18/19 Q1'19/20 Q2'19/20 Q3'19/20E Q4'19/20E 19/20E 20/21E 21/22E
Net Revenues 22.5 9.3 6.3 7.6 7.5 30.7 42.2 55.4
Revenues 23.3 9.3 7.4 7.8 7.7 32.2 43.2 56.6
EBITDA 12.0 4.7 3.5 3.7 3.4 15.3 21.1 28.3
EBIT 11.0 4.4 3.1 3.3 2.9 13.6 18.7 25.4
Net Profit 7.1 2.9 1.8 2.2 1.9 8.9 12.9 17.7
EPS, SEK 4.93 1.87 1.07 1.30 1.13 5.37 7.57 10.29
Growth Y/Y (%) 56% 42% 52% 30% 31% 38% 34% 31%
Growth Q/Q (%) 60% -20% 4% -1%
EBITDA (%) 51% 51% 47% 48% 44% 48% 49% 50%
EBIT (%) 47% 47% 42% 42% 37% 42% 43% 45%
Source: Redeye Research
M.O.B.A. Network: Financial Forecasts by Segment
(SEKm) Q3'19/20E Q4'19/20E 19/20E 20/21E 21/22E
Business Segment - M.O.B.A. Ads
Net Revenues - Ads 7.5 7.2 30.3 39.9 50.7
Growth Y/Y (%) - Ads 25% 34% 35% 32% 27%
Growth Q/Q (%) - Ads 18% -3%
EBITDA - Ads 3.6 3.2 13.9 19.2 24.6
EBITDA margin (%) - Ads 48% 44% 46% 48% 49%
Business Segment - M.O.B.A. Services
Net Revenues - Services 0.1 0.3 0.4 2.3 4.7
Growth Y/Y (%) - Services n.m. n.m. n.m. 549% 106%
Growth Q/Q (%) - Services n.m. 150%
EBITDA - Services -0.1 0.0 -0.1 0.9 2.5
EBITDA margin (%) - Services -50% 0% -14% 37% 53%
Services % of total Net Rev. 1% 3% 1% 5% 8%
Source: Redeye Research
Financial projections Our forecasts are affected by many different factors, none of which are guaranteed,
especially from quarter to quarter. Nonetheless, some of them are very likely to occur over
time.
The growth for M.O.B.A. Network and its subsidiary, CriticalClick, has been rapid since the
acquisition in September 2018. We believe that much of this growth has been a result of
several “low-hanging fruits” when it comes to optimizing the operations. However, we still see
significant potential in operational improvements, and the last two quarters indicate a long-
lasting growth driver. Furthermore, there are several additional growth drivers going forward.
In the short-term, we expect that the Corona Crisis will have both positive and negative
effects on the company´s operations. The visitor traffic to M.O.B.A.´s websites has been
significantly boosted by the Corona Crisis as a large part of the world are isolated at home.
On the negative side, the Crisis has hit the advertisement industry with lowered budgets for
several segments.
Segments
With its new segment, “M.O.B.A. Services”, M.O.B.A. is broadening its revenue streams, and as
the business grows, we expect that this segment will become more important. The increased
focus on direct sales, sponsorships, and partnerships should generate higher prices for
M.O.B.A.´s ads, i.e. CPM. We believe this will offer both growth and scalability for the
company as well as an important step in becoming a major media partner. However, given
that it is a new segment, we only make moderate assumptions, and the Service segment will
still only generate about 8% of the sales in 2021/2022, as illustrated below.

dsfdsf REDEYE Equity Research M.O.B.A. Network 1 June 2020
26
Growth drivers
• Underlying market: The underlying markets of gaming, Esport, and digital advertising
is expected to grow in the range of 10-20% in the coming years.
• New communities/sites: CriticalClick launched, on average, one new brand each
year since 2009, and M.O.B.A. has continued to maintain that level. We expect that
the company will be able to increase to two launches each year from 2021 by
expanded operations. The main focus will, however, be to keep up with the game
releases by Riot Games as there are considerable cross-promotion opportunities.
• Product improvements: M.O.B.A. has made several product improvements to
increase both the number of active users as well as the value of each user. We
believe that there still are considerable product improvement possibilities that can
be realized in the near term, such as improved SEO, social channels, e-mails, and
premium functions.
• Direct advertisement sales: M.O.B.A. is mainly selling its ads spots through a
programmatic platform, which is resource-efficient. However, M.O.B.A. has
launched a new segment towards direct sales to sell a part of the ads inventory
directly to the advertisers, which could bring in considerable higher fees per ads.
• New Services towards gaming/Esport: The company newly launched a new
Business Area, M.O.B.A. Services focusing on sponsorship, direct partnerships, and
to develop new services toward the growing gaming/Esport market.
• Acquisitions: M.O.B.A. has communicated that it is aiming to make acquisitions. We
believe that the company has the financial position to make acquisitions of a
relatively large size and that it is very likely that the company will make at least one
acquisition during 2020. We also believe that the company has all the prerequisites
to create value-adding acquisitions within its niche. However, until we know the
condition of the acquisitions, we will not add any acquisitions to our estimates but
merely add it as an important catalyst for M.O.B.A.
Cost allocation
• Employee costs: Currently, only the top management is employed in the company
as the operational team members work as consultants due to the flexible set up of
the operations.
• Other external expenses: This is the largest cost item, including most of the
operational expenses, such as consultant and sales-related expenses. We expect
the expenses for consultants to increase as the operations expand with the annual
relation to sales to be maintained. Furthermore, based on the interim reports before
the adaption to IFRS we can conclude that there are sales-related costs in the size
of around 30% in relation to revenues. We expect that the sales-related cost will
decrease slightly in relation to revenues as the company grows.
• Activated development costs: M.O.B.A. invests much in the development of its
websites and products. We expect that this item will increase slightly slower than
the revenue growth in the long-run as more maintenance than development will be
conducted on its websites and products. Note that the item is included as a revenue
item in M.O.B.A.´s PnL, while we have added it as a positive cost item.
• Other operational expenses: This is a small cost item that does not affect the overall
view.

dsfdsf REDEYE Equity Research M.O.B.A. Network 1 June 2020
27
Revenues by Segment - Trailing Twelve Months
We expect that the rapid growth rate will continue in the coming years and estimate with and
CAGR of 33% for the next three years. The Service segment will help maintain the growth
pace at a high level. The launch of the new segment will, however, have a slight negative
impact on the margins at first but will contribute with a margin improvement as the segment
scales, we believe.
Profit Margin - Trailing Twelve Months
We believe that M.O.B.A. has a highly scalable business with communities that are much
driven by user content and the underlying growth of the gaming market. However, we expect
that M.O.B.A. will continue to invest in product improvements and new sites over the
foreseeable future, with a maintain the TTM EBITDA margin in the interval 45-50% as a result.
M.O.B.A. TTM: Revenues and Margin (Q4'18/19 - Q4'21/22E)
Source: M.O.B.A. Network, Redeye Research
40%
42%
44%
46%
48%
50%
52%
0
10
20
30
40
50
60
70
EB
ITD
A m
arg
in
Reve
nues T
TM
(S
EK
m)
Net Revenues TTM - Ads Net Revenues TTM - Services
EBITDA margin TTM
M.O.B.A. TTM: EBT and Margin (Q4'18/19 - Q4'21/22E)
Source: M.O.B.A. Network, Redeye Research
40%
42%
44%
46%
48%
50%
52%
0
5
10
15
20
25
30
Marg
in
EB
T T
TM
(S
EK
m)
EBT TTM EBITDA margin TTM EBIT margin TTM

dsfdsf REDEYE Equity Research M.O.B.A. Network 1 June 2020
28
M.O.B.A. Network: Fair value range
Source: Redeye Research
Last price 140
0 50 100 150 200 250 300 350Bear-case: 85Bear-case: 85 Base-case: 170 Bull-case: 300
Valuation Valuation conclusion
We argue that M.O.B.A. Network is well-positioned in an attractive market space, with an
underlying market growth of 10-20%. The company has proven that it can make operational
improvements that will help the company to grow substantially faster than the market.
Furthermore, the company has a clear M&A strategy where is can target “hobby” driven
communities and commercialize the operations. As similar acquisition like the one of
CriticalClick, could add substantial value to the group. On the downside, we still believe that
M.O.B.A. needs to prove its M&A strategy further and broaden its revenues stream. The low
liquidity in the stock is also hampering the valuation.
Nonetheless, we still see significant upside to our base case. The strong underlying growth of
the network, together with improved capitalization on the traffic volumes, could multiply the
revenues. Our Base-case valuation, based on a DCF model, amounts to 170 SEK per share,
about 20% above market levels. Our valuation range amounts to 85-300 SEK per share.
To find support for our DCF valuation, we also compare against the peers´ valuation
multiples. For peers, we have looked at companies in the gaming, Esports, and community
industries, as they are exposed to similar business conditions as M.O.B.A. When making the
comparison, we argue that an EV/EBITDA multiple of around 13x is reasonable on our
estimates for 2021 and 10x for 2022, which lines up well with our DCF valuation.
Bear Case 85 SEK Base Case 170 SEK Bull Case 300 SEK Sales CAGR of about 14% between 2019-2028
Average EBIT margin of approximately 35% during the period
Terminal growth of 2% and terminal EBIT margin of 27%
Our Bear case assumes increased competition both for the communities and for League of Legends, which will pressure the profit margins. In the aftermath of the Corona Crisis, we also expect a recession that will lower the CPM levels and putting additional pressure on the margins. Meanwhile, the new communities will only contribute to limited top-line growth.
Sales CAGR of about 21% between 2019-2028
An average EBIT margin of approximately 43% during the same period
Terminal growth of 2% and terminal EBIT margin of 38%
Our base case assumes that M.O.B.A. will continue to make significant improvements in the business in the coming years, and therefore continue to grow faster than the underlying market. We estimate with moderate revenue contribution for the new Service segment and a slight decline in the profit margins for the group beyond 2023.
Sales CAGR of about 28% between 2019-2028
Average EBIT margin of approximately 48% during the period
Terminal growth of 2% and terminal EBIT margin of 45%
Our bull case scenario assumes a substantial improvement in both revenues and profit margins in the coming years. The development will be driven by increased traffic for its communities as well as several successful launches of new communities, while the M.O.B.A. Service segment will add media partnerships. The improved capitalization on its traffic volumes will multiply the revenues. We also estimate that M.O.B.A. will make several value-adding acquisitions in the coming years.

dsfdsf REDEYE Equity Research M.O.B.A. Network 1 June 2020
29
DCF Valuation Redeye derives its fair value from a fundamental DCF framework with three scenarios - Base
case (most likely), Bear case (pessimistic), and Bull case (optimistic). A central part of the
valuation is the weighted average cost of capital (WACC). Based on Redeye Rating and the
debt ratio, we estimate a WACC of 10.5%, which is used in all three scenarios.
Base case - Scenario
Summary:
• Sales CAGR of about 21% between 2019-2028
• An average EBIT margin of approximately 43% during the same period
• Terminal growth of 2% and terminal EBIT margin of 38%
• Our base case assumes that M.O.B.A. will continue to make significant
improvements in the business in the coming years, and therefore continue to grow
faster than the underlying market. We estimate with moderate revenue contribution
for the new Service segment and a slight decline in the profit margins for the group
beyond 2023.
Furthermore, as M.O.B.A. has a clear M&A strategy, we believe that the company will make
several acquisitions in the coming years. However, as we don´t know the conditions for the
acquisitions, we have not included them in the estimates. Nonetheless, we still believe that
acquisitions will be an important catalyst for M.O.B.A.
M.O.B.A. Network: Base case assumptions
Assumptions: 2019-28 2019-22 2022-28 DCF-value
CAGR Sales 20.8% 34.5% 14.6% WACC 10.5%
EBIT margin (avg.) 43.2% 44.4% 42.8% PV of FCF 151
ROE (avg.) 14% 12% 15% PV of Terminal Value 139
Terminal EV 290
Growth of FCF 2.0% Net cash (Start of FY 19/20) -6
EBIT margin 38.0% Dividend correction 0
EV/S Exit multiple 2.8x
EV/EBIT Exit multiple 7.3x
DCF-value 284
Fair value per share 170
Todays price 140
Potential/Risk 22%
Source: Redeye Research

dsfdsf REDEYE Equity Research M.O.B.A. Network 1 June 2020
30
Peer valuation
Sales EBIT
EV CAGR CAGR
Company (SEK bn) 2020E 2021E 2022E 2020E 2021E 2022E 2020E 2021E 2022E 19-22E 19-22E 2020E 2021E 2022E
Gaming
Tencent 4 918.7 7.7x 6.3x 5.3x 20.7x 17.2x 14.6x 26.0x 21.4x 17.7x 21% 22% 30% 30% 30%
Activision 481.2 7.0x 6.6x 6.0x 17.9x 16.0x 13.8x 19.2x 16.3x 13.6x 9% 33% 36% 40% 44%
EA 287.4 5.4x 5.0x 4.7x 15.4x 14.0x 12.8x 16.6x 15.2x 13.0x 11% 35% 32% 33% 36%
Take-Two 126.8 5.0x 3.8x 3.3x 30.7x 16.6x 12.8x 25.5x 15.7x 21.6x 17% 47% 20% 24% 15%
Bandai Namco 100.7 1.5x 1.4x 1.3x 9.5x 8.7x 7.9x 12.7x 11.7x 12.4x 9% 6% 12% 12% 11%
Ubisoft 90.5 3.4x 3.2x 3.2x 8.2x 7.8x 6.6x 17.3x 15.2x 9.5x 14% 79% 20% 21% 33%
CD projekt 89.6 10.8x 16.4x 17.7x 14.1x 23.0x 24.7x 15.8x 27.1x 28.5x 58% 92% 69% 61% 62%
Embracer 38.0 4.7x 4.0x 3.9x 11.5x 9.6x 9.3x 75.7x 41.4x 31.5x 34% 44% 6% 10% 12%
Stillfront 22.7 5.8x 4.9x 4.4x 14.4x 11.6x 10.1x 20.8x 16.0x 14.6x 38% 44% 28% 31% 30%
Paradox 21.1 11.8x 10.9x 9.5x 19.7x 17.9x 15.8x 26.5x 27.7x 24.7x 20% 22% 44% 39% 39%
Team17 8.0 10.0x 9.0x 8.2x 28.0x 24.3x 22.0x 30.2x 27.8x 25.6x 9% 11% 33% 32% 32%
Sumo 3.3 4.8x 4.0x 3.6x 20.0x 15.1x 13.3x 24.8x 19.7x 18.8x 15% 25% 19% 21% 19%
Remedy 2.5 6.3x 5.4x 4.6x 22.4x 18.3x 13.7x 24.4x 20.1x 15.7x 18% 32% 26% 27% 29%
EG7 1.1 1.8x 1.5x 1.4x 8.9x 7.6x 6.9x 29.5x 20.2x 16.3x 72% n.m. 6% 8% 9%
Median 63.8 5.6x 5.0x 4.5x 16.6x 15.5x 13.1x 24.6x 19.9x 17.0x 18% 33% 27% 28% 30%
Communities
Facebook 5 604.7 7.6x 6.1x 5.1x 16.1x 12.4x 10.3x 22.3x 17.4x 14.6x 18% 19% 34% 35% 35%
Twitter 200.1 6.2x 5.1x 4.4x 24.6x 17.0x 14.4x 91.0x 39.4x 18.8x 11% 45% 7% 13% 24%
Pinterest 94.5 7.7x 5.6x 4.5x n.m. 182.7x 43.2x n.m. n.m. 82.7x 25% n.m. -24% -6% 5%
Enthusiast 1.0 4.2x 3.0x 2.1x n.m. 130.1x 28.1x n.m. n.m. n.m. 73% n.m. -43% -10% -1%
Median 147.3 6.9x 5.4x 4.5x 20.4x 73.5x 21.3x 56.6x 28.4x 18.8x 21% 32% -9% 4% 15%
Other
MTG 6.7 1.5x 1.3x 1.2x 26.3x 11.7x 10.7x n.m. 31.8x 18.9x 10% n.m. -3% 4% 6%
Better Collective 4.5 5.0x 3.6x 3.2x 12.1x 8.3x 7.1x 16.3x 10.1x 8.4x 26% 34% 30% 36% 38%
M.O.B.A.* 0.220 6.8x 5.1x 3.9x 14.3x 10.4x 7.7x 16.1x 11.8x 8.6x 36% 32% 42% 43% 45%
At Base case 0.271 8.4x 6.3x 4.8x 17.6x 12.8x 9.5x 19.9x 14.5x 10.6x
Source: Bloomberg & Redeye Research
* For M.O.B.A Network : 2019, 2020E, 2021E & 2022E are corresponding to the FY 18/19, 19/20E, 20/21E & 20/22E respectively
EV/EBITDA EBIT marginEV/Sales EV/EBIT
Relative Valuation To find support for our DCF valuation, we also look at valuation multiples and compare them
to peers. However, finding the perfect peer is not an easy task as few gaming communities
are listed or make up a significant part of a listed company. Hence, we have compared with
companies exposed to the same underlying industries as well as similar business models.
• For industry exposure, we have taken gaming-related companies as they are
exposed to the same underlying industry as M.O.B.A. Several of these companies
also has a clear M&A focus.
• For the business model, we have taken companies that own large communities and
have similar exposure to digital marketing through its business model.
• To broaden the peer compares, we have also added MTG and Better Collective,
which are two companies that have exposure to the Esport industry.

dsfdsf REDEYE Equity Research M.O.B.A. Network 1 June 2020
31
Relative valuation: Gaming companies
The group of gaming companies we are comparing with mainly focuses on PC and console
games, which is the same category as for M.O.B.A. The main exception is Stillfront that
primarily focuses on mobile but has, just like M.O.B.A., a clear M&A strategy.
Looking at the estimates for 2021 and 2022, the earnings multiples for the gaming category
is much higher than for M.O.B.A. We argue that the company should be valued at a discount
as the gaming-related companies are larger and have significantly better stock liquidity.
Furthermore, the gaming companies are also higher up in the value chain. Nonetheless, the
current valuation indicates a discount of close to 50%, which seems far too large as we
expect M.O.B.A. to have a profit growth in line with the gaming companies beyond 2022.
Relative valuation: Community companies
The group of community companies we are comparing with have similar business models
and exposure towards digital marketing as M.O.B.A. Network. As a result, the EV/Sales
multiple becomes relevant. However, M.O.B.A. has a substantially higher profit margin than
its peers, which is impressive, and we believe the company deserves a higher EV/S multiple.
For the earnings multiple, the comparison becomes unreliable since both Pinterest and
Enthusiast are at breakeven. Meanwhile, Facebook and Twitter are two companies on a
completely different level. However, we argue that the EV/EBITDA multiple of 2022E indicates
that there is much upside potential for M.O.B.A.´s earnings multiple.
Another community, Reddit (private company), took in external capital in at a valuation of
USD 2.7bn in early 2019. Equal to a P/S multiple of around 30x based on the TTM revenues
up to June 2018, according to CNBC2.
Relative valuation: Other
Amongst the other companies, we are comparing with MTG that has substantial exposure to
the Esport industry. The business model is different, but we still argue that the earnings
multiples based on the estimates for 2021 and 2022 indicate that M.O.B.A. should be valued
at a higher multiple.
Another company with significant exposure to the Esport industry is Better Collective. Earlier
in 2020, Better Collective acquired HLTV.org an Esport community focus on CS:GO. For the
entire deal, Better Collective pays an EV/EBITDA multiple of 10x on the result for FY18/19. On
a group level, Better Collective is valued at a similar level as M.O.B.A. However, given the
regulatory risk, we argue that this yet again supports a higher multiple for M.O.B.A.
Relative valuation: Conclusion
We argue that the peer comparison indicates that M.O.B.A. is valued at a far too low multiple,
and potentially we are looking at an upside of 50-100%. However, given M.O.B.A. small size
and poor stock liquidity, we believe that it is fair that the company is valued at a discount as
indicated by our base case. In simple, the risk and WACC are lower for most of M.O.B.A.´s
peers. Nonetheless, a substantial upside still lies within its reach during its growth journey,
especially if the company manages to add value-adding acquisitions similar to the one of
CriticalClick.
2 https://techcrunch.com/2019/02/11/reddit-300-million/

dsfdsf REDEYE Equity Research M.O.B.A. Network 1 June 2020
32
Stock performance
After a bumpy start, the stock performance has improved much in the last few months, as
illustrated in the graph below. We believe that positive news flow in the form of strong
quarterly reports has been a significant driver. Furthermore, the Corona Crisis initially had a
negative impact due to the huge turmoil in the global stock markets and a negative effect on
the ads industry. However, it soon became apparent that digital solutions and gaming related
businesses would be the winners as traffic volumes boomed, which M.O.B.A. indicated in its
COVID-19 business update. Consequently, M.O.B.A.´s share price is up around 80% since the
bottom level in March.
Free float and stock liquidity
M.O.B.A. Network´s free float and stock liquidity are very limited. This hampers valuation as it
increases the risk for potential investors. We believe that M.O.B.A. would benefit from issuing
new shares for shareholder diversification purposes. This could go well together with the
M&A strategy and keep the debt ratios at a healthy level despite major future acquisitions.

dsfdsf REDEYE Equity Research M.O.B.A. Network 1 June 2020
33
Catalysts
We see several potential catalysts within the next 12 months that may close the valuation
gap between the share’s current level and our base case as well as our bull case.
• Acquisitions: M.O.B.A. has a clear M&A strategy, though it has only acquired
CriticalClick so far. If this starts to deliver results, we believe investors will value this
highly and bid up the share significantly. Both through its Board and CEO, it benefits
from extensive experience in adding value via M&A.
• Potential target: M.O.B.A. could be a potential acquisition target for companies
seeking to access attractive traffic volumes from the rapidly growing gaming
community.
• Corona boosted traffic volumes: With the Coronavirus Crisis having put much of the
world into isolation, gaming activity and traffic on game-related websites have
increased. M.O.B.A.’s communities should particularly benefit, given their focus on
social games.
• Expansion of the services: The new business area M.O.B.A Services is developing
new services. First out is direct sales, partnership, and sponsorship, which
potentially could multiple M.O.B.A.´s revenues.
• Quarterly reports: Quarterly reports showing underlying user activity growth being
converted to revenues would be positive for the case. So too would the platform’s
scalability increase profit margins
Scenarios analysis
Bull case
Summary:
• Sales CAGR of about 28% between 2019 and 2028
• Average EBIT margin of approximately 48% during the period
• Terminal growth of 2% and terminal EBIT margin of 45%
• Our bull case scenario assumes a substantial improvement in both revenues and
profit margins in the coming years. The development will be driven by increased
traffic for its communities as well as several successful launches of new
communities, while the M.O.B.A. Service segment will add media partnerships. The
improved capitalization on its traffic volumes will multiply the revenues. We also
estimate that M.O.B.A. will make several value-adding acquisitions in the coming
years.
Our Bull case yields a fair value of SEK 300 per share.
Bear case
Summary:
• Sales CAGR of about 14% between 2019 and 2028
• Average EBIT margin of approximately 35% during the period
• Terminal growth of 2% and terminal EBIT margin of 27%
• Our Bear case assumes increased competition both for the communities and for
League of Legends, which will pressure the profit margins. In the aftermath of the
Corona Crisis, we also expect a recession that will lower the CPM levels and putting
additional pressure on the margins. Meanwhile, the new communities will only
contribute to limited top-line growth.
Our Bear case yields a fair value of SEK 85 per share

dsfdsf REDEYE Equity Research M.O.B.A. Network 1 June 2020
34
Summary Redeye Rating The rating consists of three valuation keys, each constituting an overall assessment of several factors that are rated
on a scale of 0 to 1 points. The maximum score for a valuation key is 5 points.
Rating changes in the report
People: 3
M.O.B.A. Network´s management and board have extensive experience from the gaming industry, digital platforms, and
consolidating e-commercial companies. The management has, during the last year, proved that it could commercialize and
improve the operations of CriticalClick. We believe that M.O.B.A.´s CEO, Björn Mannerqvist, has used much of his experience from
working with digital marketing and SEO in the improvement work of CriticalClick. Furthermore, M.O.B.A. has a clear M&A strategy
in which the experience of the Board members Jonas Bertilsson and Fredrik Burvall will be essential. In addition, the Board
member Maria A. Grimaldi has a broad experience from the gaming industry, both operational and as an investor. What we would
like to see in order to increase our score is for the organization with the management team to settle and for M.O.B.A. to deliver on
its M&A strategy. We argue that the ownership structure is robust as the Management and Board own around 15% of the shares in
M.O.B.A. In addition, the company has two institutions, TIN Fonder (3.3%) and Alcur Fonder (1.4%), amongst its ten largest owners,
which is impressive given M.O.B.A.’s relatively small market cap and low stock liquidity.
Business: 4
M.O.B.A. Network is a gaming community-focused company capitalizing on the rapidly growing gaming and Esport sectors. The
underlying growth for the sectors is around 15%, and the company has proven that it can grow much faster than the underlying
market. The propriety platform communities are connected to sharp gaming IPs that ensure long-lasting activity, while the user
content and network effects create strong traffic inflow to the websites. What we would like to see in order to increase our score is
a lower concentration of its traffic to one website and one game.
Financials: 4
M.O.B.A. Network´s current financial position is strong with SEK 32m in cash and a net cash position of SEK 19m. The company
has a substantial EBIT margin of around 40% and an impressive cash conversion. The company could likely continue to multiply
without more substantial in-house investments. The company´s M&A strategy will, however, probably put pressure on the
financials, but we see room for additional leverage that can improve the Return on Equity.

dsfdsf REDEYE Equity Research M.O.B.A. Network 1 June 2020
35
PROFITABILITY 18/19 19/20E 20/21E 21/22E ROE 13% 9% 11% 13% ROCE 18% 12% 14% 18% ROIC 46% 10% 14% 19% EBITDA margin 52% 48% 49% 50% EBIT margin 47% 42% 43% 45% Net margin 31% 28% 31% 32%
Please comment on the changes in Rating factors……
INCOME STATEMENT 18/19 19/20E
20/21E
21/22E Net sales 23 32 43 57
Total operating costs -11 -17 -22 -28 EBITDA 12 15 21 28 Depreciation 0 0 0 0 Amortization -1 -2 -2 -3 Impairment charges 0 0 0 0 EBIT 11 14 19 25 Share in profits 0 0 0 0 Net financial items -1 -1 0 0 Exchange rate dif. 0 0 0 0 Pre-tax profit 10 13 18 25 Tax -3 -4 -5 -7 Net earnings 7 9 13 18
BALANCE SHEET 18/19 19/20E
20/21E
21/22E Assets
Current assets Cash in banks 10 34 43 58 Receivables 4 5 7 9 Inventories 0 0 0 0 Other current assets 0 1 1 1 Current assets 14 39 51 67 Fixed assets Tangible assets 0 0 0 0 Associated comp. 0 0 0 0 Investments 0 0 0 0 Goodwill 52 52 52 52 Cap. exp. for dev. 0 0 0 0 O intangible rights 47 49 50 51 O non-current assets 0 0 0 0 Total fixed assets 100 101 103 104 Deferred tax assets 0 0 0 0 Total (assets) 114 141 154 172 Liabilities Current liabilities Short-term debt 7 0 0 0 Accounts payable 3 4 5 7 O current liabilities 0 0 0 0 Current liabilities 9 4 5 7 Long-term debt 10 10 8 6 O long-term liabilities 0 0 0 0 Convertibles 0 0 0 0 Total Liabilities 19 14 13 13 Deferred tax liab 10 10 10 10 Provisions 0 0 0 0 Shareholders' equity 85 117 130 148 Minority interest (BS) 0 0 0 0 Minority & equity 85 117 130 148 Total liab & SE 114 141 154 172
FREE CASH FLOW 18/19 19/20
E 20/21
E 21/22
E Net sales 23 32 43 57 Total operating costs -11 -17 -22 -28 Depreciations total -1 -2 -2 -3 EBIT 11 14 19 25 Taxes on EBIT -3 -4 -5 -7 NOPLAT 8 9 13 18 Depreciation 1 2 2 3 Gross cash flow 9 11 16 21 Change in WC -63 -1 -1 -1 Gross CAPEX -13 -3 -4 -4 Free cash flow -67 7 12 16 CAPITAL STRUCTURE 18/19 19/20
E 20/21
E 21/22
E Equity ratio 74% 83% 85% 86% Debt/equity ratio 20% 9% 6% 4% Net debt 6 -23 -35 -51 Capital employed 91 93 95 97 Capital turnover rate 0.2 0.2 0.3 0.3 GROWTH 18/19 19/20
E 20/21
E 21/22
E Sales growth 581,547%
38% 34% 31% EPS growth (adj) 0% -4% 47% 35%
DATA PER SHARE 18/19 19/20E 20/21E 21/22E EPS 5.55 5.34 7.83 10.59 EPS adj 5.55 5.34 7.83 10.59 Dividend 0.00 0.00 0.00 2.12 Net debt 4.87 -13.99 -20.46 -29.54 Total shares 1.28 1.67 1.70 1.73 VALUATION 18/19 19/20E 20/21E 21/22E EV 153.4 210.3 198.8 182.7 P/E 20.7 26.2 17.9 13.2 P/E diluted 20.7 26.2 17.9 13.2 P/Sales 6.3 7.3 5.5 4.3 EV/Sales 6.6 6.5 4.6 3.2 EV/EBITDA 12.8 13.7 9.4 6.4 EV/EBIT 13.9 15.4 10.6 7.2 P/BV 1.7 2.0 1.8 1.6
SHARE INFORMATION Reuters code MOBA List First North Stockholm Share price 140 Total shares, million 1.7 Market Cap, MSEK 240 MANAGEMENT & BOARD CEO Björn Mannerqvist CFO Anna Jansson IR Chairman Fredrik Burvall FINANCIAL INFORMATION ANALYSTS Redeye AB Jonas Amnesten Mäster Samuelsgatan 42, 10tr [email protected] 111 57 Stockholm Tomas Otterbeck [email protected]
SHARE PERFORMANCE 1 month 25.0 % 3 month 35.6 % 12 month -
99,999,999,900.0 %
Since start of the year 21.7 %
SHAREHOLDER STRUCTURE % CAPITAL VOTES New Equity Venture 28.5 % 28.5 % Trottholmen 22.4 % 22.4 % AB B21 Invest 12.9 % 12.9 % AB Rugosa Invest 9.3 % 9.3 % Cloverhill Holdings Ltd 9.2 % 9.2 % TIN Fonder 3.3 % 3.3 % Digital Spine 2.9 % 2.9 % Manfred Gottschlich 2.5 % 2.5 % Alcur Select 1.4 % 1.4 %
DCF VALUATION WACC (%) 10.5 %

dsfdsf REDEYE Equity Research M.O.B.A. Network 1 June 2020
36
Redeye Rating and Background Definitions Company Quality
Company Quality is based on a set of quality checks across three categories; PEOPLE, BUSINESS, FINANCE. These
are the building blocks that enable a company to deliver sustained operational outperformance and attractive long-
term earnings growth.
Each category is grouped into multiple sub-categories assessed by five checks. These are based on widely
accepted and tested investment criteria and used by demonstrably successful investors and investment firms. Each
sub-category may also include a complementary check that provides additional information to assist with
investment decision-making.
If a check is successful, it is assigned a score of one point; the total successful checks are added to give a score for
each sub-category. The overall score for a category is the average of all sub-category scores, based on a scale that
ranges from 0 to 5 rounded up to the nearest whole number. The overall score for each category is then used to
generate the size of the bar in the Company Quality graphic.
People
At the end of the day, people drive profits. Not numbers. Understanding the motivations of people behind a business
is a significant part of understanding the long-term drive of the company. It all comes down to doing business with
people you trust, or at least avoiding dealing with people of questionable character.
The People rating is based on quantitative scores in seven categories:
• Passion, Execution, Capital Allocation, Communication, Compensation, Ownership, and Board.
Business
If you don’t understand the competitive environment and don’t have a clear sense of how the business will engage
customers, create value and consistently deliver that value at a profit, you won’t succeed as an investor. Knowing
the business model inside out will provide you some level of certainty and reduce the risk when you buy a stock.
The Business rating is based on quantitative scores grouped into five sub-categories:
• Business Scalability, Market Structure, Value Proposition, Economic Moat, and Operational Risks.
Financials
Investing is part art, part science. Financial ratios make up most of the science. Ratios are used to evaluate the
financial soundness of a business. Also, these ratios are key factors that will impact a company’s financial
performance and valuation. However, you only need a few to determine whether a company is financially strong or
weak.
The Financial rating is based on quantitative scores that are grouped into five separate categories:
• Earnings Power, Profit Margin, Growth Rate, Financial Health, and Earnings Quality.

REDEYE Equity Research M.O.B.A. Network 1 June 2020
37
Redeye Equity Research team
Management Björn Fahlén
Håkan Östling
Technology Team Jonas Amnesten
Henrik Alveskog
Havan Hanna
Kristoffer Lindström
Erika Madebrink
Fredrik Nilsson
Tomas Otterbeck
Eddie Palmgren
Oskar Vilhelmsson
Viktor Westman
Editorial Eddie Palmgren
Mark Siöstedt
Life Science Team Gergana Almquist
Oscar Bergman
Anders Hedlund
Arvid Necander
Erik Nordström
Klas Palin
Jakob Svensson
Ludvig Svensson
Niklas Elmhammer
Mats Hyttinge

REDEYE Equity Research M.O.B.A. Network 1 June 2020
38
Disclaimer Important information Redeye AB ("Redeye" or "the Company") is a specialist financial advisory boutique that focuses on small and mid-cap growth companies in the Nordic region. We focus on the technology and life science sectors. We provide services within Corporate Broking, Corporate Finance, equity research and investor relations. Our strengths are our award-winning research department, experienced advisers, a unique investor network, and the powerful distribution channel redeye.se. Redeye was founded in 1999 and since 2007 has been subject to the supervision of the Swedish Financial Supervisory Authority. Redeye is licensed to; receive and transmit orders in financial instruments, provide investment advice to clients regarding financial instruments, prepare and disseminate financial analyses/recommendations for trading in financial instruments, execute orders in financial instruments on behalf of clients, place financial instruments without position taking, provide corporate advice and services within mergers and acquisition, provide services in conjunction with the provision of guarantees regarding financial instruments and to operate as a Certified Advisory business (ancillary authorization). Limitation of liability This document was prepared for information purposes for general distribution and is not intended to be advisory. The information contained in this analysis is based on sources deemed reliable by Redeye. However, Redeye cannot guarantee the accuracy of the information. The forward-looking information in the analysis is based on subjective assessments about the future, which constitutes a factor of uncertainty. Redeye cannot guarantee that forecasts and forward-looking statements will materialize. Investors shall conduct all investment decisions independently. This analysis is intended to be one of a number of tools that can be used in making an investment decision. All investors are therefore encouraged to supplement this information with additional relevant data and to consult a financial advisor prior to an investment decision. Accordingly, Redeye accepts no liability for any loss or damage resulting from the use of this analysis. Potential conflict of interest Redeye’s research department is regulated by operational and administrative rules established to avoid conflicts of interest and to ensure the objectivity and independence of its analysts. The following applies:
• For companies that are the subject of Redeye’s research analysis, the applicable rules include those established by the Swedish Financial Supervisory Authority pertaining to investment recommendations and the handling of conflicts of interest. Furthermore, Redeye employees are not allowed to trade in financial instruments of the company in question, from the date Redeye publishes its analysis plus one trading day after this date.
• An analyst may not engage in corporate finance transactions without the express approval of management and may not receive any remuneration directly linked to such transactions.
• Redeye may carry out an analysis upon commission or in exchange for payment from the company that is the subject of the analysis, or from an underwriting institution in conjunction with a merger and acquisition (M&A) deal, new share issue or a public listing. Readers of these reports should assume that Redeye may have received or will receive remuneration from the company/companies cited in the report for the performance of financial advisory services. Such remuneration is of a predetermined amount and is not dependent on the content of the analysis.
Redeye’s research coverage Redeye’s research analyses consist of case-based analyses, which imply that the frequency of the analytical reports may vary over time. Unless otherwise expressly stated in the report, the analysis is updated when considered necessary by the research department, for example in the event of significant changes in market conditions or events related to the issuer/the financial instrument. Recommendation structure Redeye does not issue any investment recommendations for fundamental analysis. However, Redeye has developed a proprietary analysis and rating model, Redeye Rating, in which each company is analyzed and evaluated. This analysis aims to provide an independent assessment of the company in question, its opportunities, risks, etc. The purpose is to provide an objective and professional set of data for owners and investors to use in their decision-making. Redeye Rating (2020-06-01)
Duplication and distribution This document may not be duplicated, reproduced or copied for purposes other than personal use. The document may not be distributed to physical or legal entities that are citizens of or domiciled in any country in which such distribution is prohibited according to applicable laws or other regulations. Copyright Redeye AB.
Rating People Business Financials
5p 14 12 4 3p - 4p 108 82 32 0p - 2p 6 34 92 Company N 128 128 128
CONFLICT OF INTERESTS
Jonas Amnesten owns shares in the company: No Tomas Otterbeck. owns shares in the company: No Redeye performs/have performed services for the Company and receives/have
received compensation from the Company in connection with this.