
MNI Russia Consumer_Report 2014-03
56
MNI Russia Consumer Report March 2014 Insight and data for better decisions
-
Upload
mni-indicators-deutsche-boerse-group -
Category
Economy & Finance
-
view
163 -
download
0
Transcript of MNI Russia Consumer_Report 2014-03

MNI Russia Consumer Report March 2014
Insight and data for better decisions

2 MNI Russia Consumer Report - March 2014
About MNI Indicators Insight and data for better decisions
MNI Indicators offers unique macro-economic data and insight to businesses and the investment community. We produce data and intelligence that is unbiased, pertinent and responsive. Our data moves markets.
Specialising in business and consumer focused macro-economic reports, we give our customers the ability to make timely and relevant decisions. We strive to provide up-to-date information on business and consumer confidence on the economy.
MNI Indicators publishes data on a monthly basis. Our indicators are based on a unique and proprietary methodology and are designed to present an advance picture of the economic landscape as perceived by businesses and consumers every month.
Our monthly reports explore attitudes, perspectives and confidence across different countries and regions. They deliver in-depth analysis, highlight changing patterns and how these can affect potential developments in business and consumer activities.
MNI Indicators is part of MNI, a leading provider of news and intelligence. MNI is a wholly owned subsidiary of Deutsche Börse Group, one of the largest worldwide exchange organisations.
Written and researched byPhilip Uglow, Chief EconomistShaily Mittal, Economist
MNI Indicators | Deutsche Börse Group Westferry House11 Westferry CircusLondon E14 4HETel: +44 (0)20 7862 7444Email: [email protected]
www.mni-indicators.com@MNIIndicators
Copyright© 2014 MNI Indicators | Deutsche Börse Group. Reproduction or retransmission in whole or in part is prohibited except by permission. All rights reserved.
Release TimeEmbargoed until 9:45 a.m. Moscow timeApril 8, 2014

3MNI Russia Consumer Report - March 2014
MNI Russia Consumer Report - March 2014Contents
4 Editorial
6 Executive Summary
12 Economic Landscape
16 Indicators
17 MNI Russia Consumer Indicator
24 Personal Finances
26 Business Conditions
29 Durable Buying Conditions
30 Employment Outlook
31 Prices Sentiment
34 Interest Rates Expectations
35 Real Estate Investment
38 Car Purchase
40 Consumer Indicator - Regions
43 Consumer Indicator - Income Groups 44 What The Panel Said
46 Data Tables
54 Methodology
Spitzzeile Titel4
Russia’s growth in recent years has been driven by consumption at the expense of investment. It has relied on its vast reserves of gas and other commodities for years, while its industrial base has been left to wither.
Counting the Cost...

5MNI Russia Consumer Report - March 2014
I’ve written previously that Russia needs to change its growth model. Russia’s growth in recent years has been driven by consumption at the expense of investment. It has relied on its vast reserves of gas and other commodities for years, while its industrial base has been left to wither.
With growth of just 1.3% in 2013 and productivity at weak levels, even the government finally recognised that the current model wasn’t working.
In recent years, Russia has tried to present itself as an investable country and a place to do business. Holding the Sochi Olympics this year and the World Cup in 2018 would show the world that Russia is open for business and help to attract the investment it badly needs.
Whatever the rights and wrongs of Russia’s lightning annexation of Crimea, it has wiped out any hopes of attracting foreign investment and potentially set back Russia’s economy years. Our consumer survey shows sentiment falling more than 10% since the start of the year. Our business survey evidence this month showed sentiment among Russia’s largest companies fell sharply in March. Barring a resolution in the situation, it is difficult to see anything but a further worsening in April as well.
And having previously expected growth to maybe increase a little this year from 2013’s paltry gain, this is now looking unlikely, with the possibility that the Russian economy could at some point slip into recession. Should actions against Russia from the US
and EU escalate further to include wider financial and trade sanctions, then it will cause serious harm to the economy especially in the short-term.
And if the EU is determined to seek alternative sources of energy and wean itself off of its dependence on Russia’s vast gas and oil supplies, then Russia’s long-term growth potential could be even lower.
Philip UglowChief EconomistMNI Indicators

MNI Russia Consumer Report - March 20146
The MNI Russia Consumer Indicator fell to the lowest level since the survey started in March 2013 as worries over household finances, short-term business conditions and the spending climate all rose sharply.
Executive Summary

7MNI Russia Consumer Report - March 2014
The MNI Russia Consumer Indicator fell to the lowest level since the survey started in March 2013 as worries over household finances, short-term business conditions and the spending climate, all rose sharply.
This was the second consecutive monthly fall and left confidence down more than 10% since the start of the year as concerns over Russia’s actions in Ukraine have mounted. Asset freezes and travel bans have raised fears of wider sanctions against the country, leaving consumers very uncertain about their economic circumstances, denting sentiment significantly.
The Consumer Indicator declined 5.4% on the month to 89.1 in March from 94.1 in February.
The Current Indicator fell by 9.3% to 89.4 from 98.6 in February, following a pick-up in sentiment in January in the run up to the Olympics. The deterioration in the Current Indicator was led by Current Personal Finances which declined 8.9% on the month to a series low of 79.5. Durable Buying Conditions also fell sharply to 99.3 from 109.9 in February, as the current economic and political situation hit discretionary spending. The Expectations Indicator decreased to 88.8 in March from 91.2 in February.
The fall in consumer confidence in March was led by higher income households who likely have more to lose from the current tensions in Ukraine which have caused a sharp fall in the stock market and the currency.
Perceptions about business conditions in a year deteriorated sharply, as fears of further sanctions on Russian businesses grew. Current and longer term business conditions remained in contraction.
In spite of the current situation with Ukraine and the economic downturn, the Employment Outlook Indicator, improved for the first time in three months.
Concerns over the current price level increased slightly in March, while expectations for the future remained at an elevated level.
The Real Estate Investment Indicator declined to 110.0 in March from 111.4 in February, as a growing number of respondents said that it was not a good time to purchase a house.
The Car Purchase Indicator declined in March after rising for two consecutive months, driven by a decline in Car Purchase Expectations and a small rise in Expectations for Gasoline Prices.
MNI Russia Consumer Indicator - Components
Pers
onal
Fin
ance
: Cu
rren
t
Pers
onal
Fin
ance
s:
Expe
ctat
ions
Dur
able
Buy
ing
Cond
ition
s
Bus
ines
s Co
nditi
ons
in 1
Ye
ar
Bus
ines
s Co
nditi
ons
in 5
Ye
ars
0
100
8 MNI Russia Consumer Report - March 2014
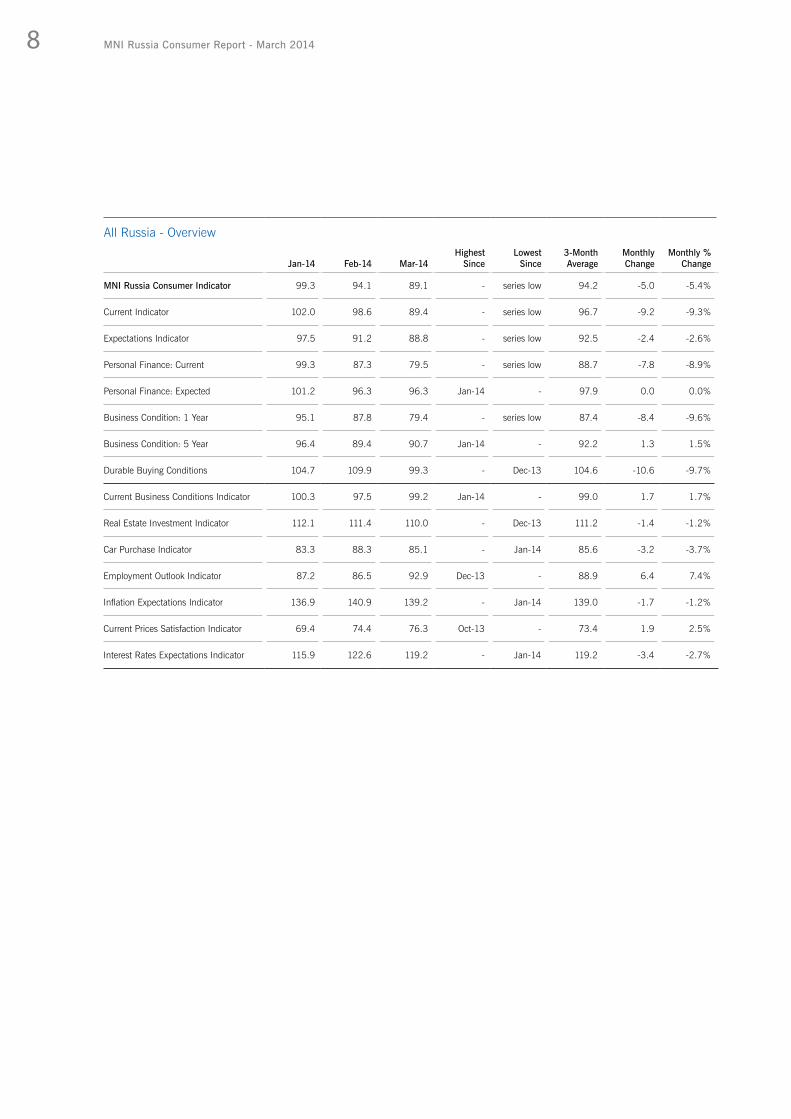
All Russia - Overview
Jan-14 Feb-14 Mar-14Highest
Since Lowest
Since 3-Month Average
Monthly Change
Monthly % Change
MNI Russia Consumer Indicator 99.3 94.1 89.1 - series low 94.2 -5.0 -5.4%
Current Indicator 102.0 98.6 89.4 - series low 96.7 -9.2 -9.3%
Expectations Indicator 97.5 91.2 88.8 - series low 92.5 -2.4 -2.6%
Personal Finance: Current 99.3 87.3 79.5 - series low 88.7 -7.8 -8.9%
Personal Finance: Expected 101.2 96.3 96.3 Jan-14 - 97.9 0.0 0.0%
Business Condition: 1 Year 95.1 87.8 79.4 - series low 87.4 -8.4 -9.6%
Business Condition: 5 Year 96.4 89.4 90.7 Jan-14 - 92.2 1.3 1.5%
Durable Buying Conditions 104.7 109.9 99.3 - Dec-13 104.6 -10.6 -9.7%
Current Business Conditions Indicator 100.3 97.5 99.2 Jan-14 - 99.0 1.7 1.7%
Real Estate Investment Indicator 112.1 111.4 110.0 - Dec-13 111.2 -1.4 -1.2%
Car Purchase Indicator 83.3 88.3 85.1 - Jan-14 85.6 -3.2 -3.7%
Employment Outlook Indicator 87.2 86.5 92.9 Dec-13 - 88.9 6.4 7.4%
Inflation Expectations Indicator 136.9 140.9 139.2 - Jan-14 139.0 -1.7 -1.2%
Current Prices Satisfaction Indicator 69.4 74.4 76.3 Oct-13 - 73.4 1.9 2.5%
Interest Rates Expectations Indicator 115.9 122.6 119.2 - Jan-14 119.2 -3.4 -2.7%
9MNI Russia Consumer Report - March 2014
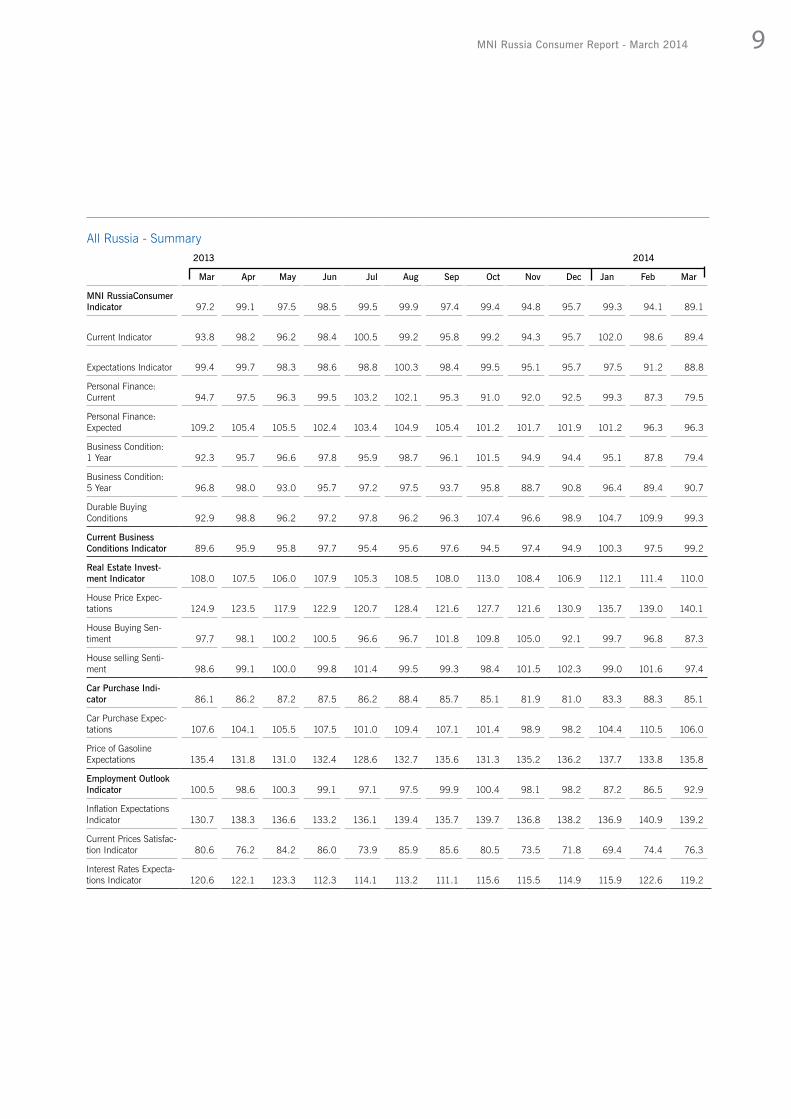
All Russia - Summary2013 2014
Mar Apr May Jun Jul Aug Sep Oct Nov Dec Jan Feb Mar
MNI RussiaConsumer Indicator 97.2 99.1 97.5 98.5 99.5 99.9 97.4 99.4 94.8 95.7 99.3 94.1 89.1
Current Indicator 93.8 98.2 96.2 98.4 100.5 99.2 95.8 99.2 94.3 95.7 102.0 98.6 89.4
Expectations Indicator 99.4 99.7 98.3 98.6 98.8 100.3 98.4 99.5 95.1 95.7 97.5 91.2 88.8
Personal Finance: Current 94.7 97.5 96.3 99.5 103.2 102.1 95.3 91.0 92.0 92.5 99.3 87.3 79.5
Personal Finance: Expected 109.2 105.4 105.5 102.4 103.4 104.9 105.4 101.2 101.7 101.9 101.2 96.3 96.3
Business Condition: 1 Year 92.3 95.7 96.6 97.8 95.9 98.7 96.1 101.5 94.9 94.4 95.1 87.8 79.4
Business Condition: 5 Year 96.8 98.0 93.0 95.7 97.2 97.5 93.7 95.8 88.7 90.8 96.4 89.4 90.7
Durable Buying Conditions 92.9 98.8 96.2 97.2 97.8 96.2 96.3 107.4 96.6 98.9 104.7 109.9 99.3
Current Business Conditions Indicator 89.6 95.9 95.8 97.7 95.4 95.6 97.6 94.5 97.4 94.9 100.3 97.5 99.2
Real Estate Invest-ment Indicator 108.0 107.5 106.0 107.9 105.3 108.5 108.0 113.0 108.4 106.9 112.1 111.4 110.0
House Price Expec-tations 124.9 123.5 117.9 122.9 120.7 128.4 121.6 127.7 121.6 130.9 135.7 139.0 140.1
House Buying Sen-timent 97.7 98.1 100.2 100.5 96.6 96.7 101.8 109.8 105.0 92.1 99.7 96.8 87.3
House selling Senti-ment 98.6 99.1 100.0 99.8 101.4 99.5 99.3 98.4 101.5 102.3 99.0 101.6 97.4
Car Purchase Indi-cator 86.1 86.2 87.2 87.5 86.2 88.4 85.7 85.1 81.9 81.0 83.3 88.3 85.1
Car Purchase Expec-tations 107.6 104.1 105.5 107.5 101.0 109.4 107.1 101.4 98.9 98.2 104.4 110.5 106.0
Price of Gasoline Expectations 135.4 131.8 131.0 132.4 128.6 132.7 135.6 131.3 135.2 136.2 137.7 133.8 135.8
Employment Outlook Indicator 100.5 98.6 100.3 99.1 97.1 97.5 99.9 100.4 98.1 98.2 87.2 86.5 92.9
Inflation Expectations Indicator 130.7 138.3 136.6 133.2 136.1 139.4 135.7 139.7 136.8 138.2 136.9 140.9 139.2
Current Prices Satisfac-tion Indicator 80.6 76.2 84.2 86.0 73.9 85.9 85.6 80.5 73.5 71.8 69.4 74.4 76.3
Interest Rates Expecta-tions Indicator 120.6 122.1 123.3 112.3 114.1 113.2 111.1 115.6 115.5 114.9 115.9 122.6 119.2

All Russia - Records2013- Current
Minimum Maximum Mean Median
MNI Russia Consumer Indicator 89.1 99.9 97.0 97.5
Current Indicator 89.4 102.0 97.0 98.2
Expectations Indicator 88.8 100.3 97.0 98.4
Personal Finance: Current 79.5 103.2 94.6 95.3
Personal Finance: Expected 96.3 109.2 102.7 102.4
Business Condition: 1 Year 79.4 101.5 94.3 95.7
Business Condition: 5 Year 88.7 98.0 94.1 95.7
Durable Buying Conditions 92.9 109.9 99.4 97.8
Current Business Conditions Indicator 89.6 100.3 96.3 95.9
Real Estate Investment Indicator 105.3 113.0 108.7 108.0
House Price Expectations 117.9 140.1 127.3 124.9
House Buying Sentiment 87.3 109.8 98.6 98.1
House Selling Sentiment 97.4 102.3 99.8 99.5
Car Purchase Indicator 81.0 88.4 85.5 86.1
Car Purchase expectations 98.2 110.5 104.7 105.5
Price of Gasoline expectations 128.6 137.7 133.7 133.8
Employment Outlook Indicator 86.5 100.5 96.6 98.2
Inflation Expectations Indicator 130.7 140.9 137.1 136.9
Current Prices Satisfaction Indicator 69.4 86.0 78.3 76.3
Interest Rates Expectations Indicator 111.1 123.3 117.0 115.6
10 MNI Russia Consumer Report - March 2014

Russian consumer sentiment fell to the lowest level since the survey started in March 2013...
...as worries over household finances, short-term business conditions and the spending climate, all rose sharply.

Spitzzeile Titel12
Russia’s annexation of Crimea has thrown the country into economic turmoil. The stock market has plunged and the rouble has come under intense pressure, forcing the central bank of Russia to raise its key policy rate from 5.5% to 7%.
Economic Landscape

13MNI Russia Consumer Report - March 2014
Russia’s annexation of Crimea has thrown the country into economic turmoil. The stock market has plunged and the rouble has come under increased pressure, forcing the central bank of Russia to raise its key policy rate from 5.5% to 7%. Forecasters are now rapidly revising down forecasts of growth for 2014, with some highlighting the possibility that Russia could slip into recession. Russia’s Central Bank governor expects growth of sub 1% in 2014. Credit rating agencies have downgraded Russia’s outlook to negative over the impact of sanctions from the United States and the European Union.
Economic data has been mixed with manufacturing output posting the highest growth in three months. The trade surplus showed an improvement from the previous year but fell on the month, due to the depreciation in the rouble.
Lowest economic growth since 2009Following meagre growth in 2013, growth has remained extremely weak at the beginning of 2014. Russia‘s GDP grew by just 0.3% on the year in February, marginally up from 0.1% in January. The Economy Ministry anticipates GDP growth of around zero for the first quarter as a whole.
According to the latest data from the Federal Service of State Statistics, economic growth accelerated in the fourth quarter of 2013 while the full year growth was left unchanged at 1.3% in 2013, down from 3.4% in 2012 to be the lowest since 2009. Growth remained reliant on consumer spending although this failed to make up for sagging investment and a drop in global demand for oil and natural gas. Private consumption expenditure remained relatively firm at 4.7% in 2013, but considerably down from the 7.9% rate seen in 2012. Government consumption declined 0.1%, following growth of 4.2% in 2012, while investment growth shrank sharply to 0.3% in 2012 from 6.4% a year earlier. On the positive side, exports rose 3.8% in 2013, recovering from growth of just 1.4% in 2012. Imports
of goods and services were less of a drag on the economy as they increased 5.9%, lower than the 8.8% reported in 2012.
According to the economy minister Alexei Ulyukayev, Russia’s 2014 economic growth is likely to be close to 2013’s level if economic trends seen early this year remain intact. Growth forecasts will be revised in April from the previously published expectation of 2.5% this year.
Central Bank governor Elvira Nabiullina recently revised the growth rates for 2014 to below 1% from 1.5-1.8% previously.
Industrial production expands in FebruaryIndustrial production increased 2.1% on the year in February, the highest growth in three months following a decline of 0.2% in January. The latest increase was driven by manufacturing output which grew by 3.4% in February after remaining flat in January.
In spite of the cold weather, utilities output continued to decline, although by a smaller 0.3% on the year, compared with 3.9% in the previous month. Mining
Economic Growth
-15%
-10%
-5%
0%
5%
10%
15%
2007 2008 2009 2010 2011 2012 2013
GDP Growth y/y %
Source: Federal State Statistics Service of Russia
14 MNI Russia Consumer Report - March 2014
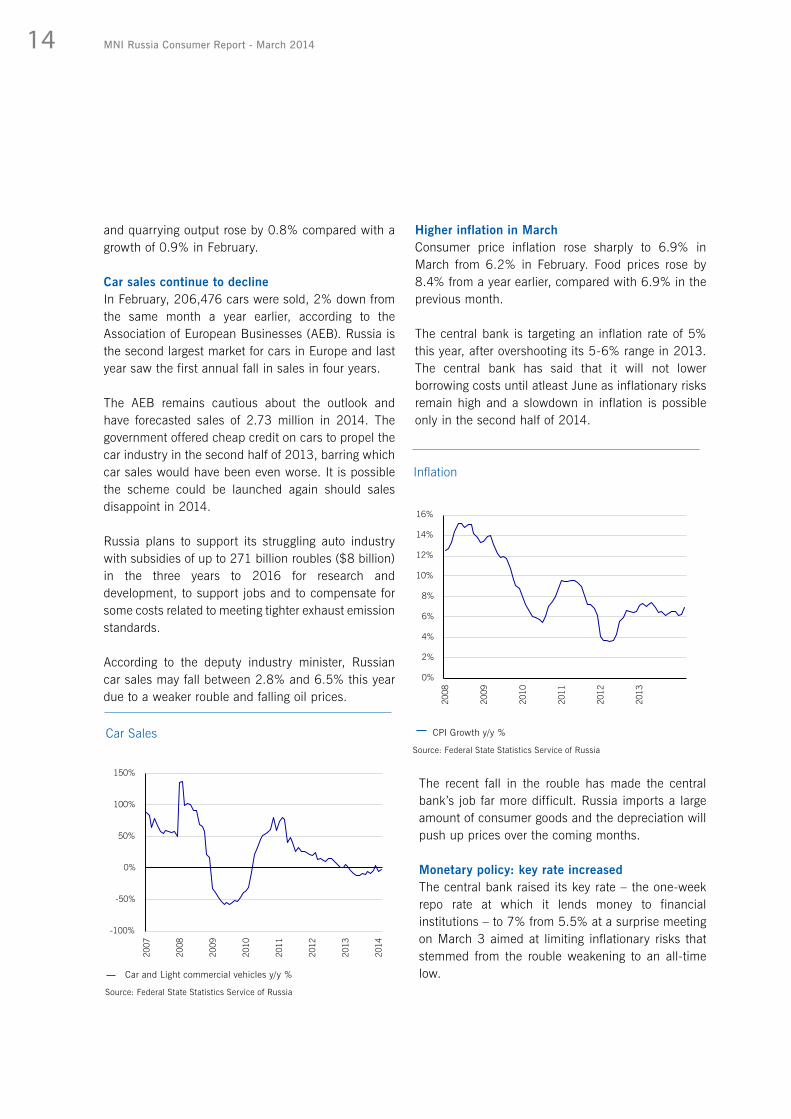
and quarrying output rose by 0.8% compared with a growth of 0.9% in February.
Car sales continue to declineIn February, 206,476 cars were sold, 2% down from the same month a year earlier, according to the Association of European Businesses (AEB). Russia is the second largest market for cars in Europe and last year saw the first annual fall in sales in four years.
The AEB remains cautious about the outlook and have forecasted sales of 2.73 million in 2014. The government offered cheap credit on cars to propel the car industry in the second half of 2013, barring which car sales would have been even worse. It is possible the scheme could be launched again should sales disappoint in 2014.
Russia plans to support its struggling auto industry with subsidies of up to 271 billion roubles ($8 billion) in the three years to 2016 for research and development, to support jobs and to compensate for some costs related to meeting tighter exhaust emission standards.
According to the deputy industry minister, Russian car sales may fall between 2.8% and 6.5% this year due to a weaker rouble and falling oil prices.
Higher inflation in MarchConsumer price inflation rose sharply to 6.9% in March from 6.2% in February. Food prices rose by 8.4% from a year earlier, compared with 6.9% in the previous month.
The central bank is targeting an inflation rate of 5% this year, after overshooting its 5-6% range in 2013. The central bank has said that it will not lower borrowing costs until atleast June as inflationary risks remain high and a slowdown in inflation is possible only in the second half of 2014.
Inflation
0%
2%
4%
6%
8%
10%
12%
14%
16%
2008
2009
2010
2011
2012
2013
CPI Growth y/y %
Source: Federal State Statistics Service of Russia
Car Sales
-100%
-50%
0%
50%
100%
150%
2007
2008
2009
2010
2011
2012
2013
2014
Car and Light commercial vehicles y/y %
Source: Federal State Statistics Service of Russia
The recent fall in the rouble has made the central bank’s job far more difficult. Russia imports a large amount of consumer goods and the depreciation will push up prices over the coming months.
Monetary policy: key rate increasedThe central bank raised its key rate – the one-week repo rate at which it lends money to financial institutions – to 7% from 5.5% at a surprise meeting on March 3 aimed at limiting inflationary risks that stemmed from the rouble weakening to an all-time low.
15MNI Russia Consumer Report - March 2014
The central bank left all interest rates unchanged at its scheduled meeting on March 14 and said it will maintain a tight monetary policy stance well into the foreseeable future. While the cental bank framed the surprise tighening in policy as a move to offset the
The Economy Ministry has forecast that the net capital outflow during the first quarter will be $65-70 billion. That compares with an outflow of $62.7 billion during the whole of 2013. The Economy Minister Alexei Ulyukayev ascertains that worsening political relations is a negative factor for economic growth and correspondingly influences the capital outflow.
Trade surplus narrows in FebruaryRussia‘s trade surplus narrowed to $17.6 billion in February, down from $18.9 billion a month earlier but up from $15.3 billion in the same month last year, as imports fell by the most since 2009 due to the sharp depreciation of the rouble.
Exports stood at $41.8 billion in February, broadly unchanged from a year earlier and imports stood at $24.2 billion, down by 9.1% on the year.
inflationary impact of the weaker rouble, a key aim was to try and avert a damaging run on the currency. Deputy Economy Minister Andrey Klepach said a temporary increase in the key rate would not hurt the economy, but rouble depreciation would increase inflation.
The bank has made it clear that its top priority is to limit the inflationary implication of exchange rate dynamics and to support financial stability. Low inflation would make borrowing more affordable and lead to a road of longer-term investment, which in turn would support economic growth.
Depreciation in the roubleSo far this year, the rouble has been one of the worst performing emerging market currencies. It fell to an all time low of 36.6 versus the US Dollar on March 14, following Russia’s actions in Ukraine and fears of an escalation in the situation.
The central bank spent $10 billion of its reserves on a single day on March 3 to prop up the rouble‘s sudden fall and has indicated that it would make major interventions due to the increased volatility. The bank has spent $23 billion in currency markets in the first two weeks of March alone, although there is no imminent cash danger as the bank has $440 billion in foreign exchange reserves.
Even before tensions intensified in Ukraine, the rouble had been weakening. The Russian authorities denied engaging in a deliberate policy to devalue the currency in order to raise export revenue or to provide a windfall gain for the state budget. Currency turmoil has been seen throughout most emerging market economies, although the move in Russia to a fully free floatingcurrency has meant reduced currency intervention from the central bank which has put further pressure on the rouble.
MNI Russia Consumer Report - March 201416
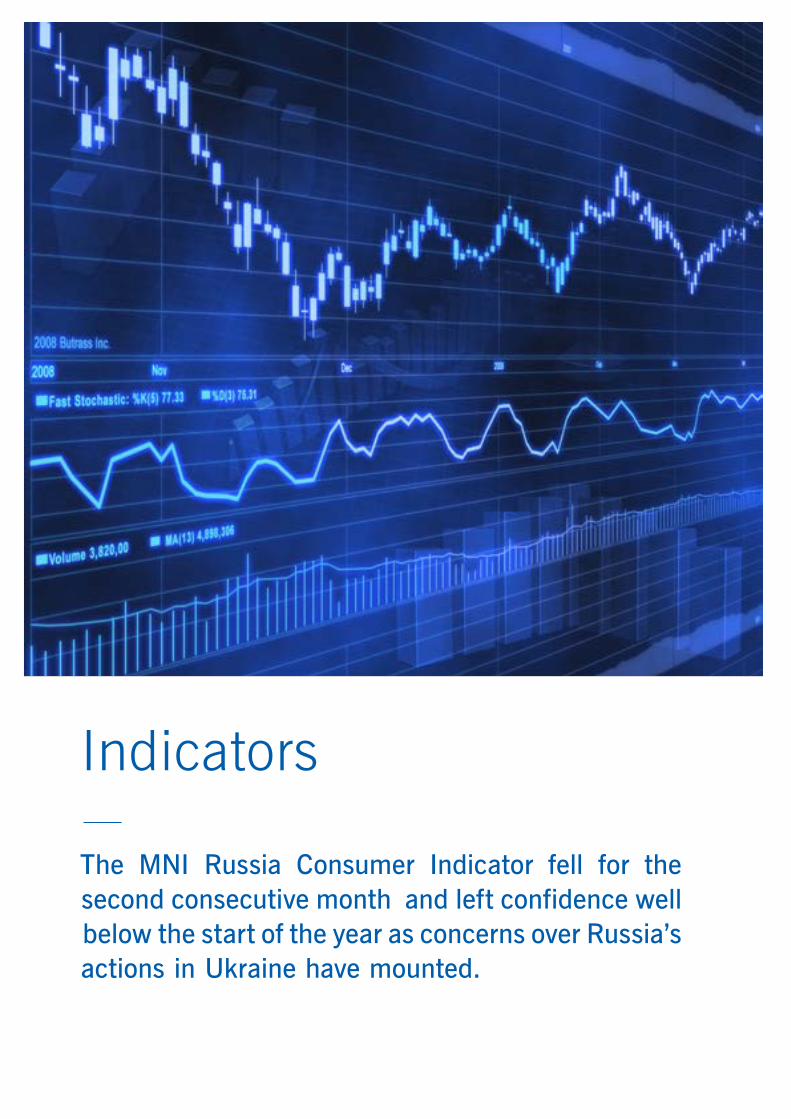
The MNI Russia Consumer Indicator fell for the second consecutive month and left confidence well below the start of the year as concerns over Russia’s actions in Ukraine have mounted.
Indicators

17MNI Russia Consumer Report - March 2014
The MNI Russia Consumer Indicator fell to the lowest level since the survey started in March 2013 as worries over household finances, short-term business conditions and the spending climate, all rose sharply.
This was the second consecutive monthly fall and left confidence down more than 10% since the start of the year as concerns over Russia’s actions in Ukraine have mounted. Asset freezes and travel bans have raised fears of wider sanctions against the country, leaving consumers very uncertain about their economic circumstances, denting sentiment significantly.
The Consumer Indicator declined 5.4% on the month to 89.1 in March from 94.1 in February. A reading below 100 indicates increasing negativity among consumers, while values above show increasing positivity. Consumer sentiment has remained below the 100 breakeven level since the series began in March 2013 but the first quarter of 2014 was the weakest on record.
The Current Indicator fell by 9.3% to 89.4 from 98.6 in February, following a pick-up in sentiment in January in the run up to the Olympics. The deterioration in the Current Indicator was led by Current Personal Finances which declined 8.9% on the month to a series low of 79.5. Durable Buying Conditions fell to 99.3 from 109.9 in February, as the current economic and political situation hit discretionary spending.
89.1MNI Russia Consumer Indicator Tumbles amid Tension
MNI Russia Consumer Indicator
Mar-13 Oct-13 Nov-13 Dec-13 Jan-14 Feb-14 Mar-14
MNI Russia Consumer Indicator 97.2 99.4 94.8 95.7 99.3 94.1 89.1
Current 93.8 99.2 94.3 95.7 102.0 98.6 89.4
Expectations 99.4 99.5 95.1 95.7 97.5 91.2 88.8
80
84
88
92
96
100
104
Mar-13 Jun-13 Sep-13 Dec-13 Mar-14
MNI Russia Consumer Indicator
80
84
88
92
96
100
104
Mar-13 Jun-13 Sep-13 Dec-13 Mar-14
Current and Expected Indicators
Current
Expectations

18 MNI Russia Consumer Report - March 2014
89.1 89.488.8
Total Indicator Current Indicator Expectations Indicator
All Russia
95.4
97.7
93.8
Total Indicator Current Indicator Expectations Indicator
Central Russia
100.1
96.3
102.6
Total Indicator Current Indicator Expectations Indicator
West Siberian
73.0
84.7
65.2
Total Indicator Current Indicator Expectations Indicator
Volga
80.1
78.4
81.3
Total Indicator Current Indicator Expectations Indicator
Urals
84.4
75.8
90.1
Total Indicator Current Indicator Expectations Indicator
North Caucasus

19MNI Russia Consumer Report - March 2014
The Expectations Indicator decreased to 88.8 in March from 91.2 in February. Business Conditions in One Year fell sharply by 9.6% to 79.4, while Business Conditions in Five Years increased slightly to 90.7 from 89.4 previously. The third component of the Expectations Indicator, Expected Personal Finances, which has trended downwards, remained stable and was below the 100 breakeven level for the second month in a row.
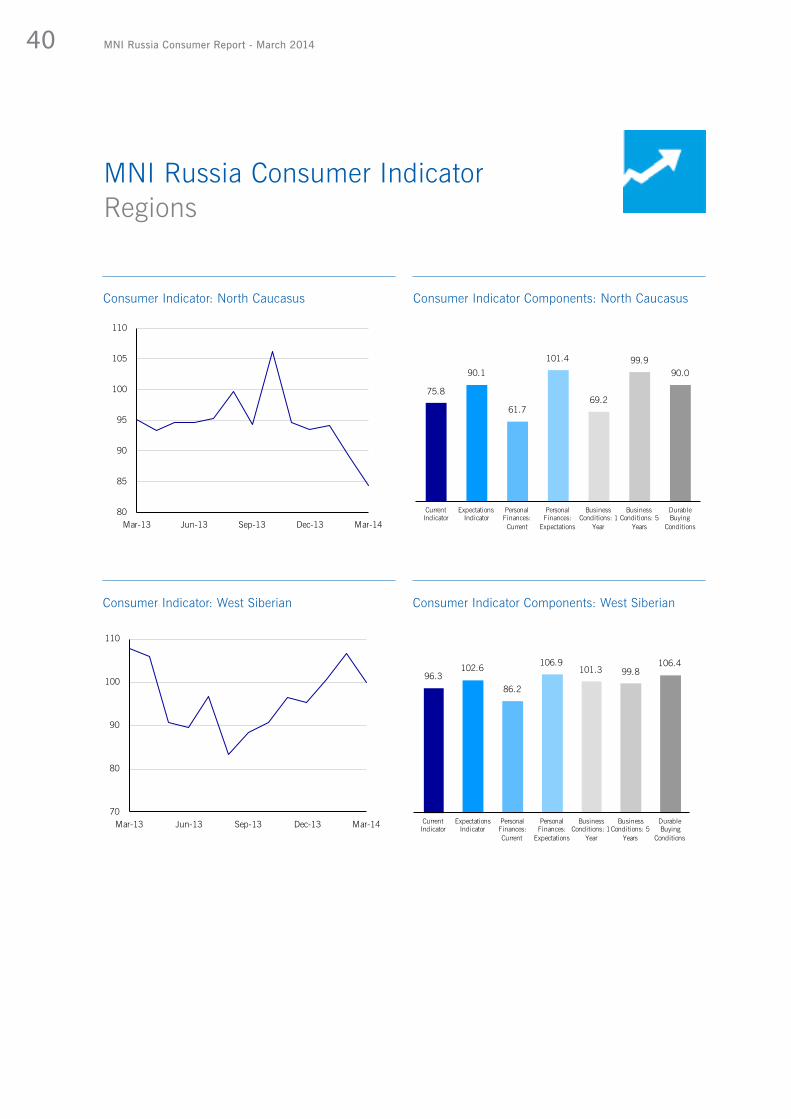
RegionsConsumer sentiment declined in 9 out of the 12 regions surveyed, with sentiment rising only in the East Siberian, Kaliningrad and Northern regions. Respondents from the West Siberian region were the most optimistic, although less positive than February as consumer confidence fell by 6.2% to 100.1 from 106.7.
Confidence declined the most in the Volga region, making the region the least optimistic, as the Consumer Indicator fell to 73.0 from 87.8 in February. Large declines were witnessed in all five components that make up the Consumer Indicator, apart from Business Conditions in Five Years which increased.
AgeConsumer sentiment fell for the second consecutive month among the youngest age group (18-34 year olds). The Consumer Indicator declined to a series low of 90.1 from 96.2 in February. The Current Indicator fell by almost 12% to 91.8 while the Expectations Indicator posted a smaller fall of 2.2% to 89.0.
Consumer sentiment was lowest among the middle age range in March, where the Consumer Indicator declined 5.2% to 87.3 from 92.0 in February. All five components of the Consumer Indicator fell apart from Expected Personal Finances. The largest fall was seen in expectations about Business Conditions in a Year which hit a series low. Consumers were also
-1.6
0.0
-1.8
0.3
-2.3
Personal Finance: Current
Personal Finance: Expected
Business Condition: 1 Year
Business Condition: 5 Year
Durable Buying Conditions
Consumer Indicator: Contribution to Monthly Change (% pt.)

20 MNI Russia Consumer Report - March 2014
highly dissatisfied with their Current Personal Finances which impacted their willingness to buy large household items.
Consumer sentiment among the oldest age range of 55-65 year olds remained broadly stable at 90.3 compared with 90.9 in February. Consumers were less optimistic about Business Conditions in Five Years and did not see it as a good time to purchase large household items. Personal Finances improved, although they remained below the 100 breakeven mark.
IncomeThe fall in confidence in March was led by higher income households who likely have more to lose from the current tensions in Ukraine which have caused a sharp fall in the stock market and the currency.
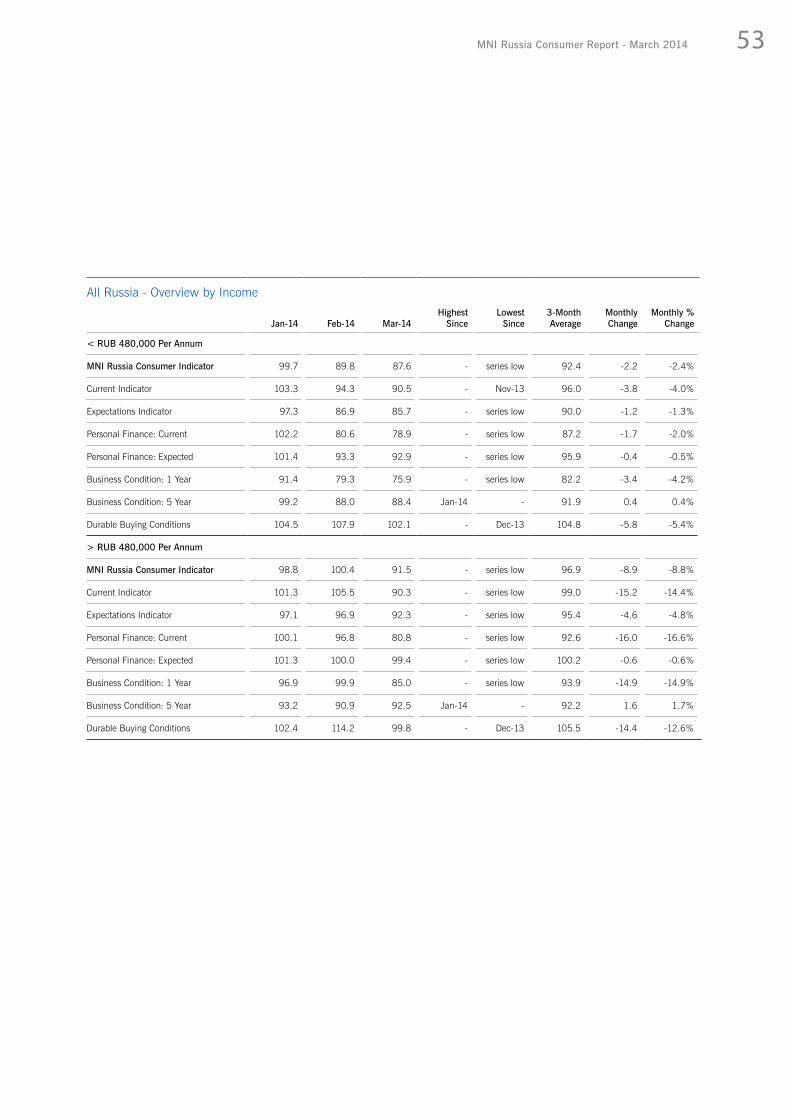
For households with an average income under RUB 480,000 per annum, sentiment declined for the second month in a row to a series low of 87.6 from 89.8 in the previous month. For households with an average income over RUB 480,000 per annum, consumer sentiment declined significantly by 8.8% to 91.5 in March from 100.4 in February, the lowest since the start of the survey in March 2013.
Consumer confidence was almost 9% down on the year among low income households, and was 9.5% down for higher income households. In March, it was the first time since September that the Consumer Indicator fell more in higher income households than in lower income households.
89.1
90.1
87.3
90.3
All 18-34 35-54 55-64
Consumer Indicator: Age Groups

21MNI Russia Consumer Report - March 2014
87.6
90.5
85.7
Total Indicator Current Indicator Expectations Indicator
< RUB 480,000 Per Annum
91.5
90.3
92.3
Total Indicator Current Indicator Expectations Indicator
> RUB 480,000 Per Annum
MNI Russia Consumer IndicatorIncome Groups

22 MNI Russia Consumer Report - March 2014
MNI Russia Consumer IndicatorMain Cities
The Consumer Indicator declined in six out of the 10 major cities surveyed in March and hit a series low in five of them.
In Moscow, consumer sentiment remained broadly stable at 96.9, compared with 96.2 in February, when it hit a series low. The small gain on the month made Moscow the most optimistic city in March. The Current Indicator remained broadly stable around the 100 mark, while the Expectations Indicator increased by 1.1% but remained in contraction.
Moscow consumers were more confident about their Personal Finances compared with the previous month but fewer found it a good time to buy a large household item. Consumers were less optimistic about Business Conditions in One and Five Years, with the latter hitting a record low.
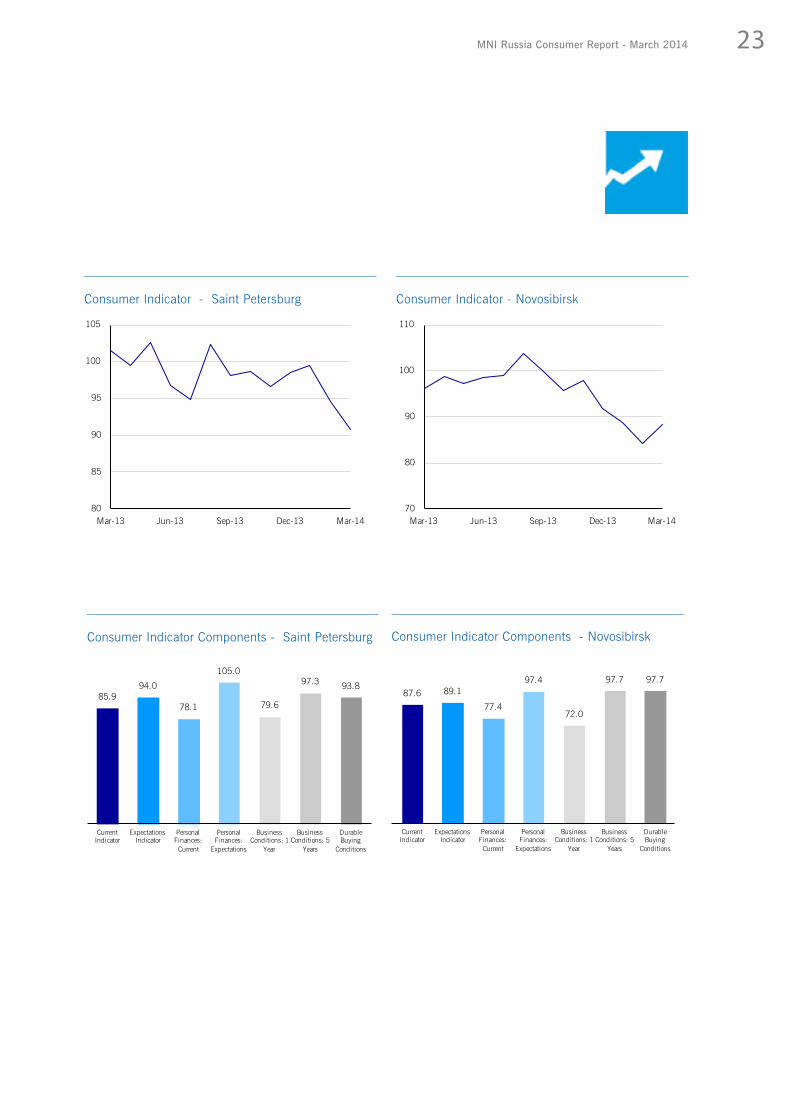
Consumer sentiment fell in Saint Petersburg, the second largest city of Russia, for the second consecutive month. The Consumer Indicator declined to 90.7 from 94.6 in February. Much of the decline was led by Current Personal Finances which fell more than 10% on the month. Consumers were also less confident about future business conditions. The Durable Buying Conditions Indicator remained in contraction and fell to the lowest since November.
In Novosibirsk, the third most populous city in Russia, consumer sentiment rose to 88.5 after falling for three consecutive months, hitting a series low in February of 84.2. Respondents were more optimistic about both their Current and Future Expectations. More consumers thought it was a good time to buy a large household item as the indicator rose by 13.5% on the month. Business Conditions in One Year declined, but those for Five Years hit a series high.
Samara was the least optimistic city in March. The Consumer Indicator fell to a series low of 84.1 compared with 86.5 in February. Consumer sentiment has trended downwards since June 2013 and the loss
90
95
100
105
110
Mar-13 Jun-13 Sep-13 Dec-13 Mar-14
Consumer Indicator - Moscow
100.694.4 91.6
101.1
90.3 91.7
109.7
Current Indicator
Expectations Indicator
Personal Finances: Current
Personal Finances:
Expectations
Business Conditions: 1
Year
Business Conditions: 5
Years
Durable Buying
Conditions
Consumer Indicator Components - Moscow
in sentiment in March put the indicator well below the level seen a year ago.
23MNI Russia Consumer Report - March 2014
80
85
90
95
100
105
Mar-13 Jun-13 Sep-13 Dec-13 Mar-14
Consumer Indicator - Saint Petersburg
70
80
90
100
110
Mar-13 Jun-13 Sep-13 Dec-13 Mar-14
Consumer Indicator - Novosibirsk
85.994.0
78.1
105.0
79.6
97.3 93.8
Current Indicator
Expectations Indicator
Personal Finances: Current
Personal Finances:
Expectations
Business Conditions: 1
Year
Business Conditions: 5
Years
Durable Buying
Conditions
Consumer Indicator Components - Saint Petersburg
87.6 89.1
77.4
97.4
72.0
97.7 97.7
Current Indicator
Expectations Indicator
Personal Finances: Current
Personal Finances:
Expectations
Business Conditions: 1
Year
Business Conditions: 5
Years
Durable Buying
Conditions
Consumer Indicator Components - Novosibirsk
MNI Russia Consumer Report - March 201424
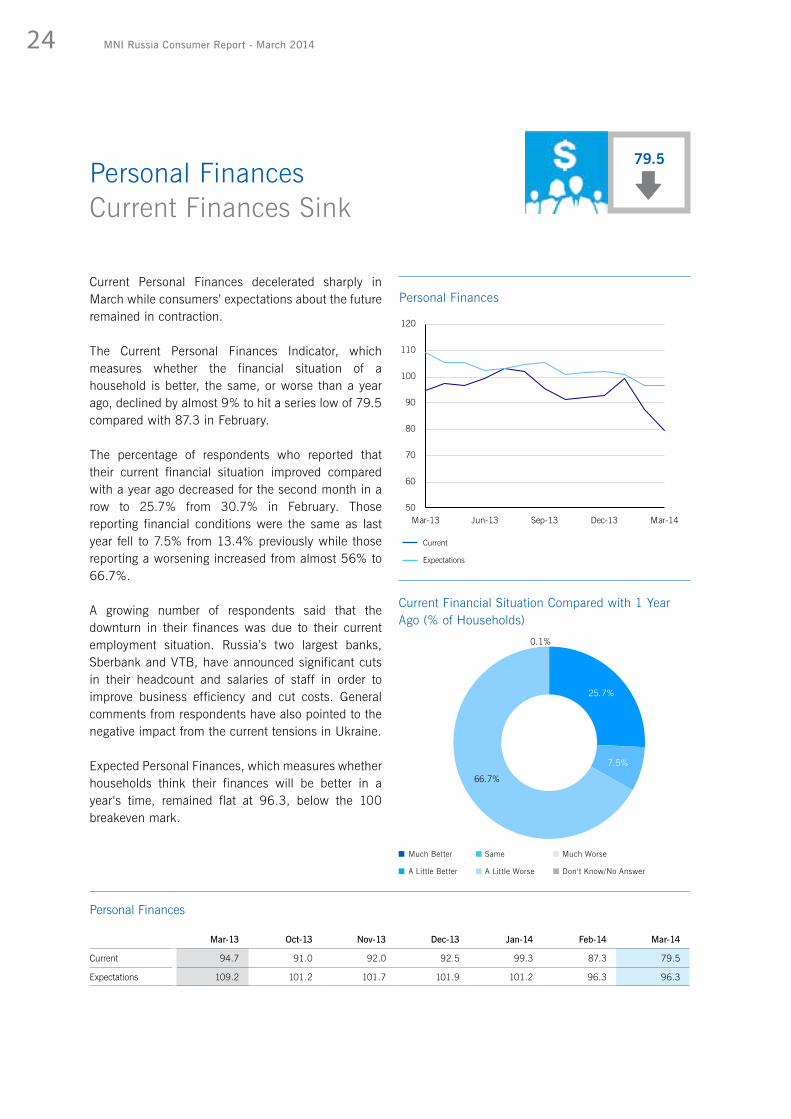
Current Personal Finances decelerated sharply in March while consumers’ expectations about the future remained in contraction.
The Current Personal Finances Indicator, which measures whether the financial situation of a household is better, the same, or worse than a year ago, declined by almost 9% to hit a series low of 79.5 compared with 87.3 in February.
The percentage of respondents who reported that their current financial situation improved compared with a year ago decreased for the second month in a row to 25.7% from 30.7% in February. Those reporting financial conditions were the same as last year fell to 7.5% from 13.4% previously while those reporting a worsening increased from almost 56% to 66.7%.
A growing number of respondents said that the downturn in their finances was due to their current employment situation. Russia’s two largest banks, Sberbank and VTB, have announced significant cuts in their headcount and salaries of staff in order to improve business efficiency and cut costs. General comments from respondents have also pointed to the negative impact from the current tensions in Ukraine.
Expected Personal Finances, which measures whether households think their finances will be better in a year‘s time, remained flat at 96.3, below the 100 breakeven mark.
79.5Personal Finances Current Finances Sink
Personal Finances
Mar-13 Oct-13 Nov-13 Dec-13 Jan-14 Feb-14 Mar-14
Current 94.7 91.0 92.0 92.5 99.3 87.3 79.5
Expectations 109.2 101.2 101.7 101.9 101.2 96.3 96.3
50
60
70
80
90
100
110
120
Mar-13 Jun-13 Sep-13 Dec-13 Mar-14
Personal Finances
Current
Expectations
25.7%
7.5%
66.7%
0.1%
Current Financial Situation Compared with 1 Year Ago (% of Households)
Much Better
A Little Better
Same
A Little Worse
Much Worse
Don‘t Know/No Answer
MNI Russia Consumer Report - March 2014 25
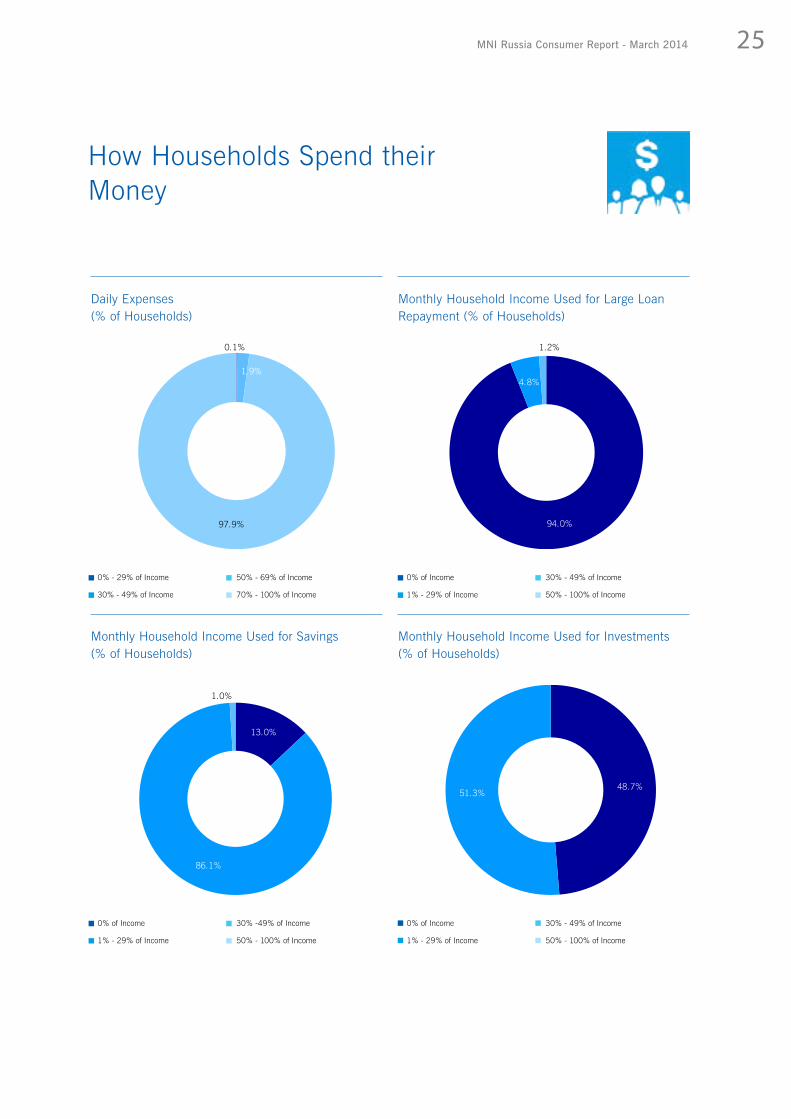
0.1%
1.9%
97.9%
Daily Expenses (% of Households)
13.0%
86.1%
1.0%
Monthly Household Income Used for Savings (% of Households)
94.0%
4.8%
1.2%
Monthly Household Income Used for Large Loan Repayment (% of Households)
48.7%51.3%
Monthly Household Income Used for Investments(% of Households)
How Households Spend their Money
0% - 29% of Income
30% - 49% of Income
0% of Income
1% - 29% of Income
0% of Income
1% - 29% of Income
0% of Income
1% - 29% of Income
50% - 69% of Income
70% - 100% of Income
30% - 49% of Income
50% - 100% of Income
30% - 49% of Income
50% - 100% of Income
30% -49% of Income
50% - 100% of Income

MNI Russia Consumer Report - March 201426
Increasing concerns that wider sanctions could be levied against Russian businesses prompted a sharp fall in short term expectations for business conditions.
Current and longer term business conditions remained in contraction, below the 100 breakeven level.
Expectations for Business Conditions in a Year declined sharply to a series low of 79.4 from 87.8 in February. The majority of the respondents expected business condtions to deteriorate, with the proportion increasing from 54.6% to 66.7%. The proportion who thought conditions would be better fell from 30.3% to 25.5%. There was also a significant decline in the proportion of respondents who felt business conditions would remain the same from 12.6% to 5.2%.
Respondents cited government policy, economic development and income as the main reasons for the deterioration in their outlook. General comments also cited the current tensions in Ukraine and their negative impact on the economy.
The Current Business Conditions Indicator, which measures respondents’ views on the state of business compared with a year ago, increased to 99.2 compared with 97.5 in February. Consumer sentiment about the current business environment has remained weak since the start of the survey in March 2013 and the only time it has been above the breakeven level was in January, a possible short-term boost in the run-up to the Sochi Olympics.
99.2Business ConditionsShort Term Expectations Worsen
Business Conditions
Mar-13 Oct-13 Nov-13 Dec-13 Jan-14 Feb-14 Mar-14
Current 89.6 94.5 97.4 94.9 100.3 97.5 99.2
In 1 Year 92.3 101.5 94.9 94.4 95.1 87.8 79.4
In 5 Years 96.8 95.8 88.7 90.8 96.4 89.4 90.7
86
88
90
92
94
96
98
100
102
Mar-13 Jun-13 Sep-13 Dec-13 Mar-14
Current Business Conditions Indicator
50
60
70
80
90
100
110
Mar-13 Jun-13 Sep-13 Dec-13 Mar-14
Expected Business Conditions
1 Year
5 Years

MNI Russia Consumer Report - March 2014 27
Business Conditions in 1 YearSelected Reasons
Government/Policy
Econ. Development
Income/Employment
Resource/Environment
Social Stability/ Security
Events
Government/Policy
Econ. Development
Income/Employment
Resource/Environment
Social Stability/ Security
Events
10.0%
20.9%
35.9%
5.6%
19.2%
8.4%
All Russia, Reasons for Better
21.3%
24.8%26.4%
9.9%
13.9%
3.8%
All Russia, Reasons for Worse
37.0%26.8%
63.0%73.2%
Feb-14 Mar-14
All RussiaThe proportion of respondents who believed that business conditions were “excellent” or “good” remained broadly stable at 9.4%. The majority continued to say that business conditions were “only fair”, and this proportion increased to 73.7% from 72.2% in the previous month, while the percentage of respondents reporting conditions were “poor” or “very poor” fell from 14.1% to 11.1%.
Longer term, Expectations for Business Conditions in Five Years increased slightly following a sharp decline in February. It rose to 90.7 from 89.4, about 6.3% below the same period a year ago.
Better
Worse
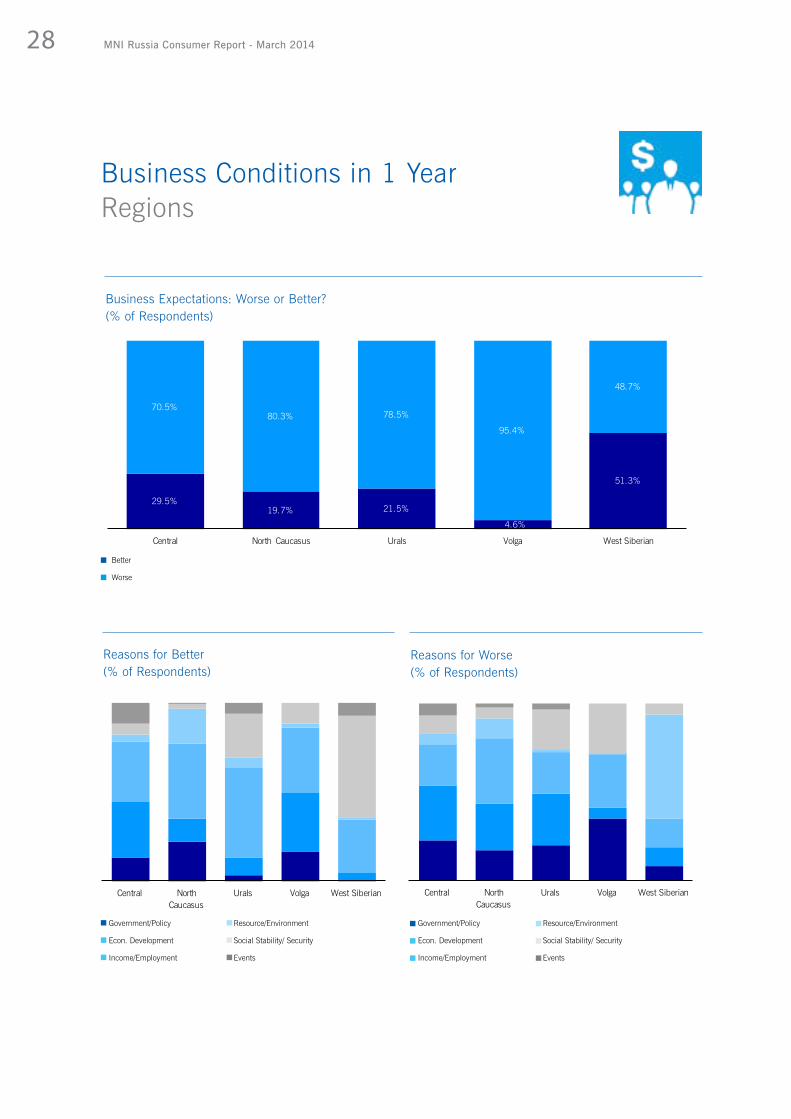
MNI Russia Consumer Report - March 201428
Business Conditions in 1 YearRegions
Central North Caucasus
Urals Volga West Siberian
Reasons for Better(% of Respondents)
29.5%19.7% 21.5%
4.6%
51.3%
70.5%80.3% 78.5%
95.4%
48.7%
Central North Caucasus Urals Volga West Siberian
Business Expectations: Worse or Better?(% of Respondents)
Central North Caucasus
Urals Volga West Siberian
Reasons for Worse (% of Respondents)
Better
Worse
Government/Policy
Econ. Development
Income/Employment
Resource/Environment
Social Stability/ Security
Events
Government/Policy
Econ. Development
Income/Employment
Resource/Environment
Social Stability/ Security
Events

29MNI Russia Consumer Report - March 2014
The Durable Buying Conditions Indicator, which measures whether respondents think it is a good or bad time to buy a large household good, declined sharply for the first time in four months to the lowest since December.
The indicator fell to 99.3 from 109.9 in February, a fall of 9.7% on the month, as the tension in Ukraine coupled with the current economic malaise saw consumers rein in their discretionary spending. Many respondents pointed to the high cost of household durable goods and that they could not afford to purchase more. The proportion of survey participants saying it was a “good time” to buy a large household durable declined to 43.1% from 48% in February, while the proportion of those saying it was a “bad time” or “very bad time” also increased significantly from 27.2% to 44.4%. There was a decline in the percentage of respondents who felt there had been “no change” to 11.1% from 23.3% in February.
Durable Buying Conditions Decline Significantly
Durable Buying Conditions
Mar-13 Oct-13 Nov-13 Dec-13 Jan-14 Feb-14 Mar-14
Durable Buying Conditions 92.9 107.4 96.6 98.9 104.7 109.9 99.3
99.3
90
95
100
105
110
115
Mar-13 Jun-13 Sep-13 Dec-13 Mar-14
Durable Buying Conditions
43.1%
11.1%
44.4%
1.4%
Is It a Good or Bad Time to Buy Large Household Goods? (% of Households)
Excellent Time
Good Time
Neutral
Bad Time
Very Bad Time
Don‘t Know/No Answer

30 MNI Russia Consumer Report - March 2014
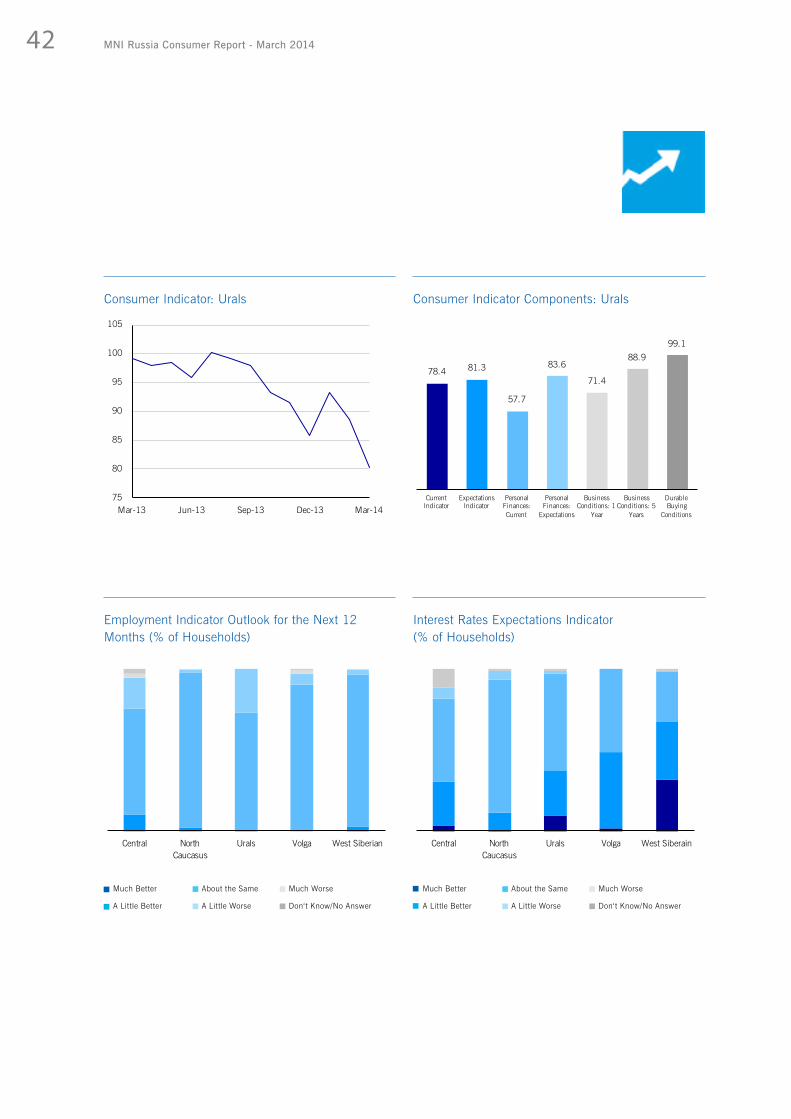
The Employment Outlook indicator which measures opinion on the outlook of the employment market over the next 12 months, increased to 92.9 in March from 86.5 in February. It has remained in contraction every month since the survey started, with the exception of March and October 2013.
Of the 12 regions surveyed, respondents from Central Black Earth were the most perturbed about the future employment situation, as the indicator dropped for the fourth month to hit a series low of 68.1. Respondents from the Volga region were highly optimistic about their employment situation as compared with the previous month with only 9.1% of them expecting the Employment Outlook to worsen as opposed to almost 40% in the previous month. The most optimistic respondents were from the Far Eastern region where the indicator was above the breakeven mark.
Official statistics showed that the unemployment rate remained steady in February at 5.6%, unchanged from the previous two months. Results from the March edition of our sister survey on Russian Businesses showed that majority of the companies reported that the current number of employees they had was just right and were not hiring currently, although they were a little more optimistic about future employment conditions.
Survey participants forecasting an improvement in the employment market totalled 5.4%, down from 6% in February; while the proportion of those forecasting a worsening also declined from 26.2% to 17.3%. The majority of respondents forecasted no change in the employment situation.
Employment OutlookHighest Since December
Employment Outlook
Mar-13 Oct-13 Nov-13 Dec-13 Jan-14 Feb-14 Mar-14
Employment Outlook 100.5 100.4 98.1 98.2 87.2 86.5 92.9
75
80
85
90
95
100
105
Mar-13 Jun-13 Sep-13 Dec-13 Mar-14
Employment Outlook Indicator
5.4%
75.1%
15.1%
2.2%
2.1%
Employment Outlook for the Next 12 Months (% of Households)
92.9
Much Better
A Little Better
Same
A Little Worse
Much Worse
Don‘t Know/No Answer

31MNI Russia Consumer Report - March 2014
Concerns over the current price level increased slightly in March, while expectations for the future remained at an elevated level.
The Current Prices Satisfaction Indicator increased for the second month in a row after hitting a record low in January. The indicator rose by 2.5% to 76.3 in March from 74.4 in February. A figure below 100 indicates wider dissatisfaction with current prices, and the further below 100, the greater the dissatisfaction. The indicator has remained below the breakeven level since the survey started. In spite of the latest monthly gain, the Current Prices Satisfaction Indicator averaged 73.3 in the first quarter, the lowest since the survey started.
Consumer price inflation rose to 6.9% in March, up from 6.2% in February. Food price inflation accelerated to 8.4% from 6.9% in the previous month. The central bank is targeting inflation of 5% in 2014, but expects the recent weakening of the rouble to fuel inflation further.
The Inflation Expectations Indicator, which measures whether respondents think prices will be higher or lower in 12 months’ time, has trended upwards since the survey started in March 2013. It eased slightly to 139.2 from a series high of 140.9 in February.
The majority of respondents, 70.3%, believed prices would be higher in a year’s time, while those saying prices would be unchanged rose to 28.5% from 26.4%. Only 0.5% of respondents thought prices would be lower in a year’s time.
Prices SentimentRemains Worrisome
Prices Sentiment
Mar-13 Oct-13 Nov-13 Dec-13 Jan-14 Feb-14 Mar-14
Satisfaction with Current Prices 80.6 80.5 73.5 71.8 69.4 74.4 76.3
Inflation Expec-tations 130.7 139.7 136.8 138.2 136.9 140.9 139.2
60
65
70
75
80
85
90
Mar-13 Jun-13 Sep-13 Dec-13 Mar-14
Satisfaction with Current Prices
126
128
130
132
134
136
138
140
142
Mar-13 Jun-13 Sep-13 Dec-13 Mar-14
Inflation Expectations Indicator
76.3

32 MNI Russia Consumer Report - March 2014
2.6%
55.9%
32.5%
8.8%
0.2%
Satisfaction with Current Prices (% of Households)
Very Satisfied
Quite Satisfied
So So
Not Very Satisfied
Not Satisfied At All
Don‘t Know/No Answer
8.6%
61.8%
28.5%
0.5% 0.6%
Inflation Expectations in 12 Months (% of Households)
Much Higher
A Little Higher
Same
A Little Lower
Much Lower
Don‘t Know/No Answer
Since November, most respondents thought prices would rise between 11-24% over the next year, but this changed in March. The proportion of respondents who thought they would rise by over 25% increased significantly and represented the majority, likely due to fears that the depreciation in the currency will push up inflation.
RegionsAll regions showed wide dissatisfaction with the current level of prices. Among the five major regions, the Central region showed the greatest dissatisfaction, although the indicator improved for the first time following six monthly declines.
Respondents from the Volga region had the highest inflationary expectations over the next 12 months as almost all the respondents thought prices would be higher in March.
Prices SentimentRegions
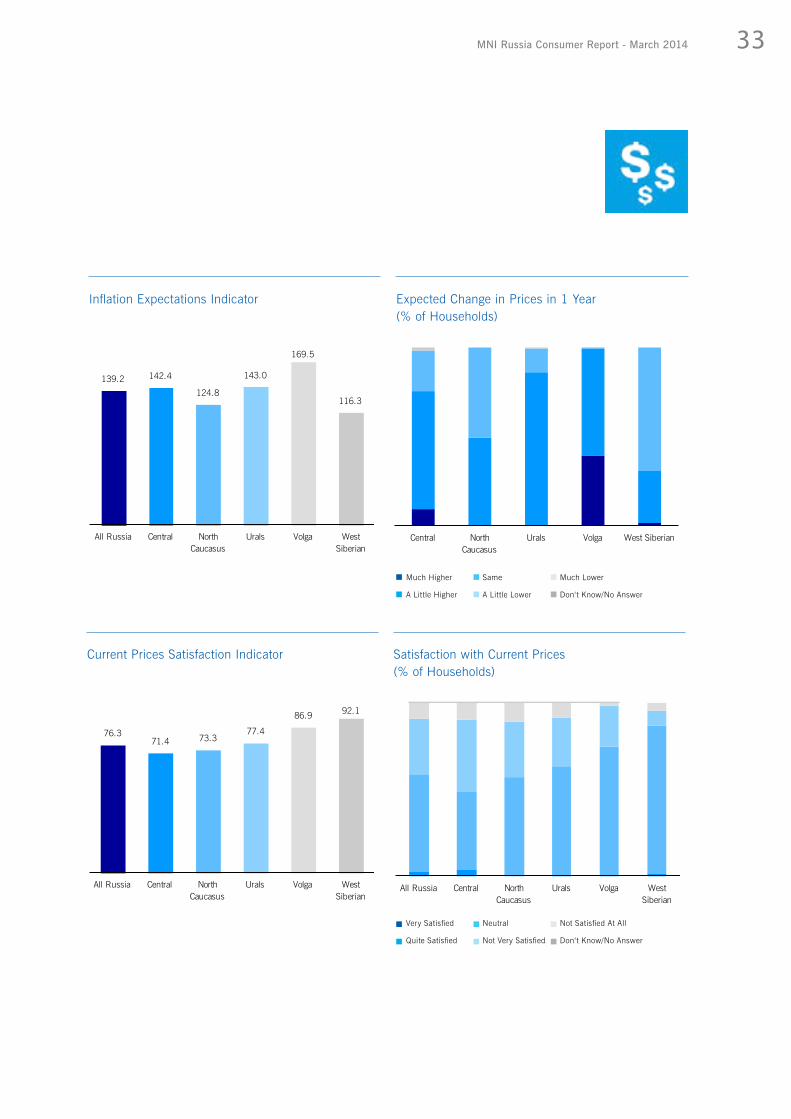
33MNI Russia Consumer Report - March 2014
76.371.4 73.3
77.4
86.9 92.1
All Russia Central North Caucasus
Urals Volga West Siberian
Current Prices Satisfaction Indicator
139.2 142.4
124.8
143.0
169.5
116.3
All Russia Central North Caucasus
Urals Volga West Siberian
Inflation Expectations Indicator
All Russia Central North Caucasus
Urals Volga West Siberian
Satisfaction with Current Prices (% of Households)
Very Satisfied
Quite Satisfied
Neutral
Not Very Satisfied
Not Satisfied At All
Don‘t Know/No Answer
Central North Caucasus
Urals Volga West Siberian
Expected Change in Prices in 1 Year(% of Households)
Much Higher
A Little Higher
Same
A Little Lower
Much Lower
Don‘t Know/No Answer

34 MNI Russia Consumer Report - March 2014
Expectations for Interest Rates on Car and Home Loans declined in March compared with the previous month and the majority of the respondents continued to expect them to stay at the same level next year.
The Interest Rate Expectations Indicator fell 2.7% to 119.2 from 122.6 in February, bang in line with the three month average.
The indicator has remained above 100 since the survey started in March. A reading above 100 indicates more households expected interest rates to rise over the coming year, while a figure below 100 means more households expected to see a fall.
In an emergency meeting on March 3, the Central Bank raised its key rate to 7% from 5.5% previously. The decision to hike rates was a response to heightened volatility in financial markets and aimed at stemming the fall in the exchange rate and its impact on inflation.
Survey participants forecasting that interest rates on home and car loans would be higher in a year’s time fell from 37.7% to 35.5%. Those forecasting lower rates remained broadly stable at 3.8% compared with 3.6% previously. The percentage of respondents expecting interest rates would be the same increased to 56% from 54.1%.
Interest Rate ExpectationsDecline in March
Interest Rate Expectations
Mar-13 Oct-13 Nov-13 Dec-13 Jan-14 Feb-14 Mar-14
Interest Rate Expectations 120.6 115.6 115.5 114.9 115.9 122.6 119.2
119.2
100
110
120
130
Mar-13 Jun-13 Sep-13 Dec-13 Mar-14
Interest Rate Expectations Indicator
6.9%
28.6%
56.0%
3.8%4.7%
Expected Change in Interest Rate in 1 year (% of Households)
Much Higher
A Little Higher
Same
A Little Lower
Much Lower
Don‘t Know/No Answer

35MNI Russia Consumer Report - March 2014
The Real Estate Investment Indicator declined to 110.0 in March from 111.4 in the previous month, the lowest since December 2013, as a growing number of respondents said that it was not a good time to purchase a house.
The Real Estate Investment Indicator is comprised of three sub-indicators to gauge sentiment on the housing market; House Price Expectations, House Buying Sentiment and House Selling Sentiment.
House Price Expectations increased slightly to 140.1 in March from 139.0 in February. Price Expectations have risen sharply since November and they are over 12% above the same month last year. A value above 100 indicates more people expect prices to increase in the next six months.
The percentage of respondents who said prices will go up in the next six months increased from 68.4% to 69.4%, while those saying prices would go down fell to 0.2%, the lowest since the survey started in March 2013. Those who said prices would “stay the same” remained broadly stable at 26% in March.
House Buying Sentiment, a measure of whether it is a good time in the next six months to buy a house, declined for the second month in a row, and by a sharp 9.8%. Sentiment fell to a series low of 87.3 from 96.8 in February.
The third component, House Selling Sentiment, is a measure of whether it is a good time in the next six
Real Estate Investment House Buying Sentiment Declines Sharply
Real Estate Investment Sentiment
Mar-13 Oct-13 Nov-13 Dec-13 Jan-14 Feb-14 Mar-14
Real Estate Invest-ment Sentiment 108.0 113.0 108.4 106.9 112.1 111.4 110.0
Price Expectations 124.9 127.7 121.6 130.9 135.7 139.0 140.1
House Buying 97.7 109.8 105.0 92.1 99.7 96.8 87.3
House Selling 98.6 98.4 101.5 102.3 99.0 101.6 97.4
110.0
100
102
104
106
108
110
112
114
Mar-13 Jun-13 Sep-13 Dec-13 Mar-14
Real Estate Investment Indicator
0.3
-2.8
1.3
House Price Expectations
House Buying Sentiment
House Selling Sentiment
Real Estate Investment Indicator: Contribution to Monthly Change (% pt.)

36 MNI Russia Consumer Report - March 2014
105
110
115
120
125
130
135
140
145
Mar-13 Jun-13 Sep-13 Dec-13 Mar-14
Real Estate Prices: Expected Changes
111.4
139.0
96.8 101.6110.0
140.1
87.397.4
Real Estate Investment Indicator
House Price Expectations
House Buying Sentiment
House Selling Sentiment
Real Estate Investment Indicator - Components
All Russia Central North Caucasus Urals Volga
Expected Changes in Real Estate Prices in the Next 6 months (% of Households)
Real Estate InvestmentComponents and Balances
months to sell a house and has a negative impact on the overall Real Estate Investment Indicator. The Indicator fell below the breakeven level to 97.4 from 101.6 in February. RegionsThe Real Estate Investment Indicator declined in the Central, North Caucasus, Urals and West Siberian regions. In the Volga region, respondents were more optimistic about housing sentiment, which was driven by a rise in Price Expectations and House Buying Sentiment and fall in House Selling Sentiment.
February 2014
March 2014
Go Up Dramatically
Go Up Slightly
Stay the Same
Gow Down Slightly
Go Down Sharply
Don‘t Know/No Answer
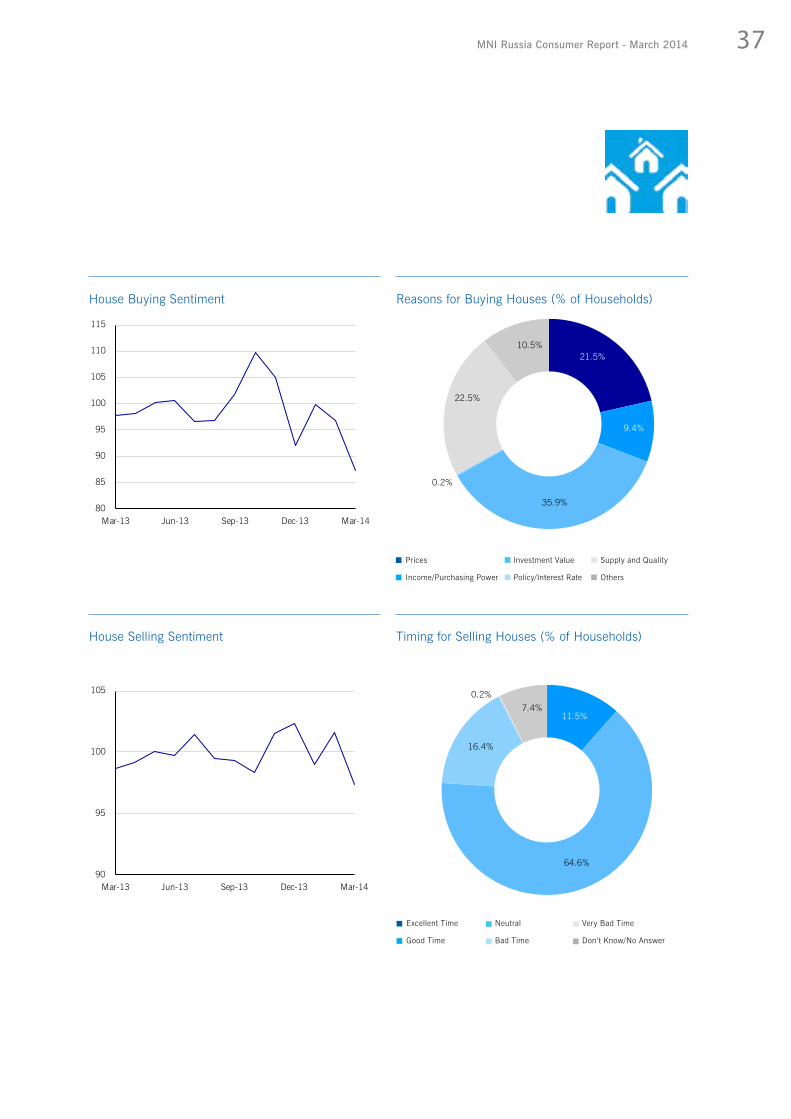
37MNI Russia Consumer Report - March 2014
80
85
90
95
100
105
110
115
Mar-13 Jun-13 Sep-13 Dec-13 Mar-14
House Buying Sentiment
90
95
100
105
Mar-13 Jun-13 Sep-13 Dec-13 Mar-14
House Selling Sentiment
21.5%
9.4%
35.9%
0.2%
22.5%
10.5%
Reasons for Buying Houses (% of Households)
11.5%
64.6%
16.4%
0.2%7.4%
Timing for Selling Houses (% of Households)
Excellent Time
Good Time
Neutral
Bad Time
Very Bad Time
Don‘t Know/No Answer
Prices
Income/Purchasing Power
Investment Value
Policy/Interest Rate
Supply and Quality
Others

38 MNI Russia Consumer Report - March 2014
The Car Purchase Indicator declined in March after rising for two consecutive months, driven by a decline in Car Purchase Expectations and a small rise in Expectations for Gasoline Prices.
The indicator fell 3.7% to 85.1 in March from 88.3 in February. The Car Purchase Indicator declined sharply in the second half of the previous year and the fall on the month put it 1.2% below the level of March 2013. The indicator assesses whether consumers believe it is a good or bad time to purchase a car and is composed of two components. The Car Purchase Expectations component, which measures the willingness to buy a car, declined from a series high of 110.5 in February to 106.0 in March, a fall of 4.1% on the month. Of those who felt it was a bad time to purchase a car, a growing proportion cited poor purchasing power and high interest rates as the reasons.
According to the Association of European Businesses, sales of new cars fell 2% in February compared with a year ago. 206,476 vehicles were sold, 35% more than January’s 152,662, but due to a seasonal boost.
The Indicator on Gasoline Prices, which measures expectations for the price of gasoline in a year and impacts the Car Purchase Indicator negatively, rose slightly to 135.8 after declining for the first time in February for four months to 133.8. Expectations about future gasoline prices have trended upwards after hitting a series low in July 2013.
Car Purchase Lowest Since January
70
80
90
100
Mar-13 Jun-13 Sep-13 Dec-13 Mar-14
Car Purchase Indicator
80
90
100
110
120
130
140
150
Mar-13 Jun-13 Sep-13 Dec-13 Mar-14
Car Purchase Indicator - Components
Car Purchase Expectations
Price of Gasoline
Car Purchase Sentiment
Mar-13 Oct-13 Nov-13 Dec-13 Jan-14 Feb-14 Mar-14
Car Purchase Sentiment 86.1 85.1 81.9 81.0 83.3 88.3 85.1
Car Purchase Expectations 107.6 101.4 98.9 98.2 104.4 110.5 106.0
Price of Gasoline 135.4 131.3 135.2 136.2 137.7 133.8 135.8
85.1

39MNI Russia Consumer Report - March 2014
111.8
96.6
100.2
106.8 106.9
Central North Caucasus
Urals Volga West Siberian
Car Purchase Expectations - Regions
All Russia Central North Caucasus
Urals Volga West Siberian
Reasons for a Bad Time to Buy a Car(% of Households)
Prices
Income/Purchasing Power
Policy/Interest Rate
Supply and Quality
Cost of Use/Upkeep
Others
Reasons for a Good Time to Buy a Car(% of Households)
All Russia Central North Caucasus
Urals Volga West Siberian
Prices
Income/Purchasing Power
Policy/Interest Rate
Supply and Quality
Cost of Use/Upkeep
Others
6.2%
59.7%
21.0%
0.4%
12.7%
Expected Change in the Price of Gasoline (% of Households)
Go Up Dramatically
Go Up Slightly
Stay the Same
Gow Down Slightly
Go Down Sharply
Don‘t Know/No Answer
40 MNI Russia Consumer Report - March 2014
MNI Russia Consumer Indicator Regions
75.8
90.1
61.7
101.4
69.2
99.990.0
Current Indicator
Expectations Indicator
Personal Finances: Current
Personal Finances:
Expectations
Business Conditions: 1
Year
Business Conditions: 5
Years
Durable Buying
Conditions
Consumer Indicator Components: North Caucasus
80
85
90
95
100
105
110
Mar-13 Jun-13 Sep-13 Dec-13 Mar-14
Consumer Indicator: North Caucasus
96.3102.6
86.2
106.9101.3 99.8
106.4
Current Indicator
Expectations Indicator
Personal Finances: Current
Personal Finances:
Expectations
Business Conditions: 1
Year
Business Conditions: 5
Years
Durable Buying
Conditions
Consumer Indicator Components: West Siberian
70
80
90
100
110
Mar-13 Jun-13 Sep-13 Dec-13 Mar-14
Consumer Indicator: West Siberian

41MNI Russia Consumer Report - March 2014
84.7
65.272.1 70.7
55.0
69.9
97.3
Current Indicator
Expectations Indicator
Personal Finances: Current
Personal Finances:
Expectations
Business Conditions: 1
Year
Business Conditions: 5
Years
Durable Buying
Conditions
Consumer Indicator Components: Volga
65
70
75
80
85
90
95
100
105
110
115
Mar-13 Jun-13 Sep-13 Dec-13 Mar-14
Consumer Indicator: Volga
97.7 93.8 92.5102.2
85.693.7
103.0
Current Indicator
Expectations Indicator
Personal Finances: Current
Personal Finances:
Expectations
Business Conditions: 1
Year
Business Conditions: 5
Years
Durable Buying
Conditions
Consumer Indicator Components: Central
90
95
100
105
110
Mar-13 Jun-13 Sep-13 Dec-13 Mar-14
Consumer Indicator: Central
42 MNI Russia Consumer Report - March 2014
Much Better
A Little Better
About the Same
A Little Worse
Much Worse
Don‘t Know/No Answer
Much Better
A Little Better
About the Same
A Little Worse
Much Worse
Don‘t Know/No Answer
78.4 81.3
57.7
83.6
71.4
88.999.1
Current Indicator
Expectations Indicator
Personal Finances: Current
Personal Finances:
Expectations
Business Conditions: 1
Year
Business Conditions: 5
Years
Durable Buying
Conditions
Central North Caucasus
Urals Volga West Siberain
Consumer Indicator Components: Urals
Interest Rates Expectations Indicator (% of Households)
75
80
85
90
95
100
105
Mar-13 Jun-13 Sep-13 Dec-13 Mar-14
Central North Caucasus
Urals Volga West Siberian
Consumer Indicator: Urals
Employment Indicator Outlook for the Next 12 Months (% of Households)

43MNI Russia Consumer Report - March 2014
MNI Russia Consumer Indicator Income Groups
78.9
92.9
75.9
88.4
102.1
Personal Finances: Current
Personal Finances:
Expectations
Business Conditions: 1
Year
Business Conditions: 5
Years
Durable Buying
Conditions
< RUB 480,000 - Components
89.8
94.3
86.987.6
90.5
85.7
Total Indicator Current Indicator Expectations Indicator
< RUB 480,000 Per Annum
80.8
99.4
85.092.5
99.8
Personal Finances: Current
Personal Finances:
Expectations
Business Conditions: 1
Year
Business Conditions: 5
Years
Durable Buying
Conditions
> RUB 480,000 - Components
100.4
105.5
96.9
91.590.3
92.3
Total Indicator Current Indicator Expectations Indicator
> RUB 480,000 Per Annum
February 2014
March 2014
February 2014
March 2014

MNI Russia Consumer Report - March 201444
A selection of comments from the panel of consumers surveyed over the past month.
What the Panel Said

MNI Russia Consumer Report - March 2014 45
“It’s better to live in owned flat rather than to rent.”
“Its better to buy a large durable item today as tomorrow it will be more expensive.”
“Political relations with Ukraine have gone worse.”
“The prices are up because of depreciation seen in the rouble.”
“Mortgage interest rates are high.”
“I have got a new position at higher salary.”
“Work is not stable as business is closing.”
“Income levels are rising slower as compared with prices.”
“Investment in real estate may protect the finances from inflation.”
“My income level does not allow me to change my car.”
“Because of the political crisis with Ukraine, a flow-out of foreign investments is visible.”
“Our everyday expenses have increased due to higher inflation.”
“My income has increased and we will change our car this year.”
“The macroeconomic situation in Russia is not good, economic growth is falling and it is impacted negatively because of Ukraine situation as well.”
“Additional expenses for car maintenance are not so high.”
“I don’t have the necessary finances to buy an apartment.”
“The economic situation of Russia is bad.”
“The credit rates in Russia are the highest in the world.”
“Car servicing prices have gone too high.”
“Rich people are becoming richer and our income levels are going down.”
“To find a job is more difficult.”

MNI Russia Consumer Report - March 201446
A closer look at the data from the March consumer survey.
Data Tables

47MNI Russia Consumer Report - March 2014
Russia - Central Overview
Jan-14 Feb-14 Mar-14Highest
Since Lowest
Since 3-Month Average
Monthly Change
Monthly % Change
Russia - Central Consumer Indicator 100.9 96.8 95.4 - series low 97.7 -1.4 -1.4%
Current Indicator 103.3 99.3 97.7 - series low 100.1 -1.6 -1.6%
Expectations Indicator 99.3 95.1 93.8 - series low 96.1 -1.3 -1.3%
Personal Finance: Current 102.1 88.7 92.5 Jan-14 - 94.4 3.8 4.2%
Personal Finance: Expected 104.7 102.5 102.2 - series low 103.1 -0.3 -0.3%
Business Condition: 1 Year 98.0 92.8 85.6 - series low 92.1 -7.2 -7.7%
Business Condition: 5 Year 95.2 90.0 93.7 Jan-14 - 93.0 3.7 4.1%
Durable Buying Conditions 104.4 109.9 103.0 - Jul-13 105.8 -6.9 -6.3%
Current Business Conditions Indicator 98.0 98.3 99.1 series high - 98.5 0.8 0.7%
Real Estate Investment Indicator 113.2 115.3 113.2 - Jan-14 113.9 -2.1 -1.8%
Car Purchase Indicator 85.9 87.6 87.2 - Jan-14 86.9 -0.4 -0.5%
Employment Outlook Indicator 93.9 87.4 93.1 Jan-14 - 91.5 5.7 6.5%
Inflation Expectations Indicator 139.8 143.7 142.4 - Jan-14 142.0 -1.3 -0.9%
Current Prices Satisfaction Indicator 69.0 68.5 71.4 Dec-13 - 69.6 2.9 4.1%
Interest Rates Expectations Indicator 114.6 116.0 113.8 - Dec-13 114.8 -2.2 -1.9%
48 MNI Russia Consumer Report - March 2014
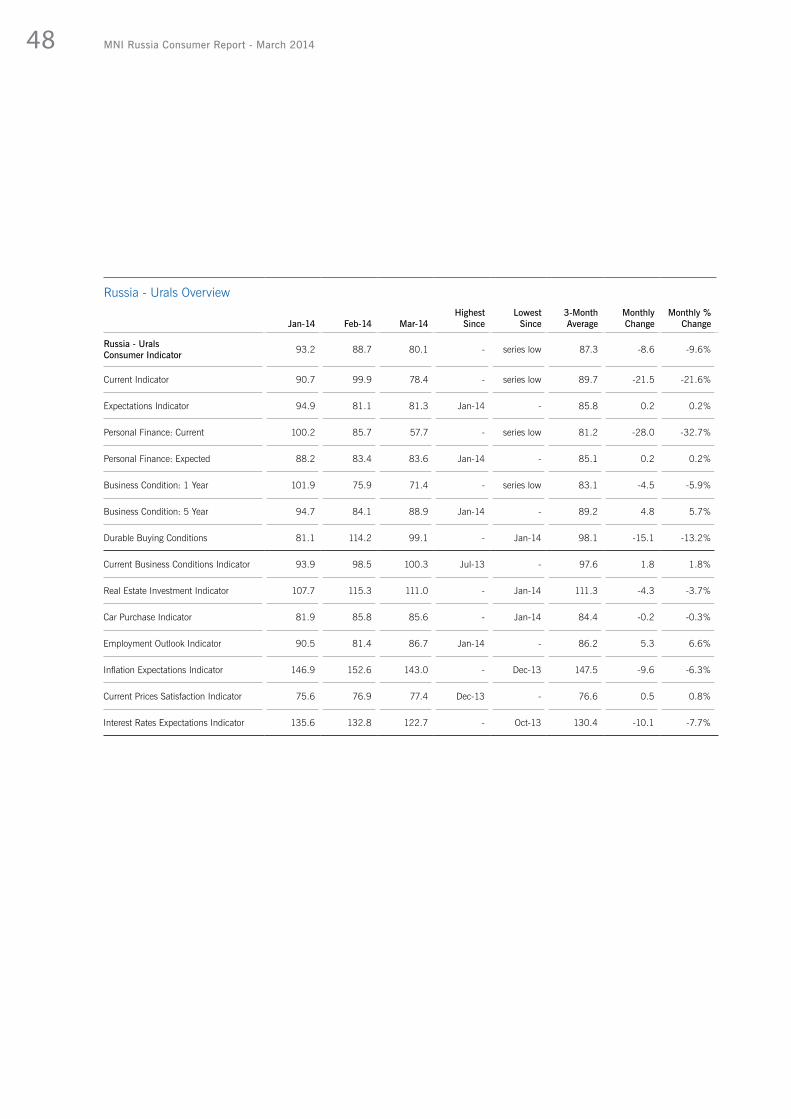
Russia - Urals Overview
Jan-14 Feb-14 Mar-14Highest
Since Lowest
Since 3-Month Average
Monthly Change
Monthly % Change
Russia - Urals Consumer Indicator 93.2 88.7 80.1 - series low 87.3 -8.6 -9.6%
Current Indicator 90.7 99.9 78.4 - series low 89.7 -21.5 -21.6%
Expectations Indicator 94.9 81.1 81.3 Jan-14 - 85.8 0.2 0.2%
Personal Finance: Current 100.2 85.7 57.7 - series low 81.2 -28.0 -32.7%
Personal Finance: Expected 88.2 83.4 83.6 Jan-14 - 85.1 0.2 0.2%
Business Condition: 1 Year 101.9 75.9 71.4 - series low 83.1 -4.5 -5.9%
Business Condition: 5 Year 94.7 84.1 88.9 Jan-14 - 89.2 4.8 5.7%
Durable Buying Conditions 81.1 114.2 99.1 - Jan-14 98.1 -15.1 -13.2%
Current Business Conditions Indicator 93.9 98.5 100.3 Jul-13 - 97.6 1.8 1.8%
Real Estate Investment Indicator 107.7 115.3 111.0 - Jan-14 111.3 -4.3 -3.7%
Car Purchase Indicator 81.9 85.8 85.6 - Jan-14 84.4 -0.2 -0.3%
Employment Outlook Indicator 90.5 81.4 86.7 Jan-14 - 86.2 5.3 6.6%
Inflation Expectations Indicator 146.9 152.6 143.0 - Dec-13 147.5 -9.6 -6.3%
Current Prices Satisfaction Indicator 75.6 76.9 77.4 Dec-13 - 76.6 0.5 0.8%
Interest Rates Expectations Indicator 135.6 132.8 122.7 - Oct-13 130.4 -10.1 -7.7%

49MNI Russia Consumer Report - March 2014
Russia - Volga Overview
Jan-14 Feb-14 Mar-14Highest
Since Lowest
Since 3-Month Average
Monthly Change
Monthly % Change
Russia - Volga Consumer Indicator 109.5 87.8 73.0 - series low 90.1 -14.8 -16.9%
Current Indicator 130.0 106.5 84.7 - Nov-13 107.1 -21.8 -20.5%
Expectations Indicator 95.8 75.4 65.2 - series low 78.8 -10.2 -13.5%
Personal Finance: Current 116.7 87.4 72.1 - Nov-13 92.1 -15.3 -17.6%
Personal Finance: Expected 113.3 88.9 70.7 - series low 91.0 -18.2 -20.4%
Business Condition: 1 Year 76.3 72.7 55.0 - series low 68.0 -17.7 -24.3%
Business Condition: 5 Year 97.9 64.5 69.9 Jan-14 - 77.4 5.4 8.3%
Durable Buying Conditions 143.4 125.6 97.3 - Nov-13 122.1 -28.3 -22.5%
Current Business Conditions Indicator 109.6 82.9 97.7 Jan-14 - 96.7 14.8 17.8%
Real Estate Investment Indicator 126.7 97.1 124.7 Jan-14 - 116.2 27.6 28.4%
Car Purchase Indicator 79.3 111.4 84.6 - Jan-14 91.8 -26.8 -24.0%
Employment Outlook Indicator 41.4 63.5 94.2 Oct-13 - 66.4 30.7 48.4%
Inflation Expectations Indicator 134.7 166.2 169.5 series high - 156.8 3.3 2.0%
Current Prices Satisfaction Indicator 70.7 69.3 86.9 Sep-13 - 75.6 17.6 25.5%
Interest Rates Expectations Indicator 116.7 170.2 125.2 - Jan-14 137.4 -45.0 -26.4%
50 MNI Russia Consumer Report - March 2014
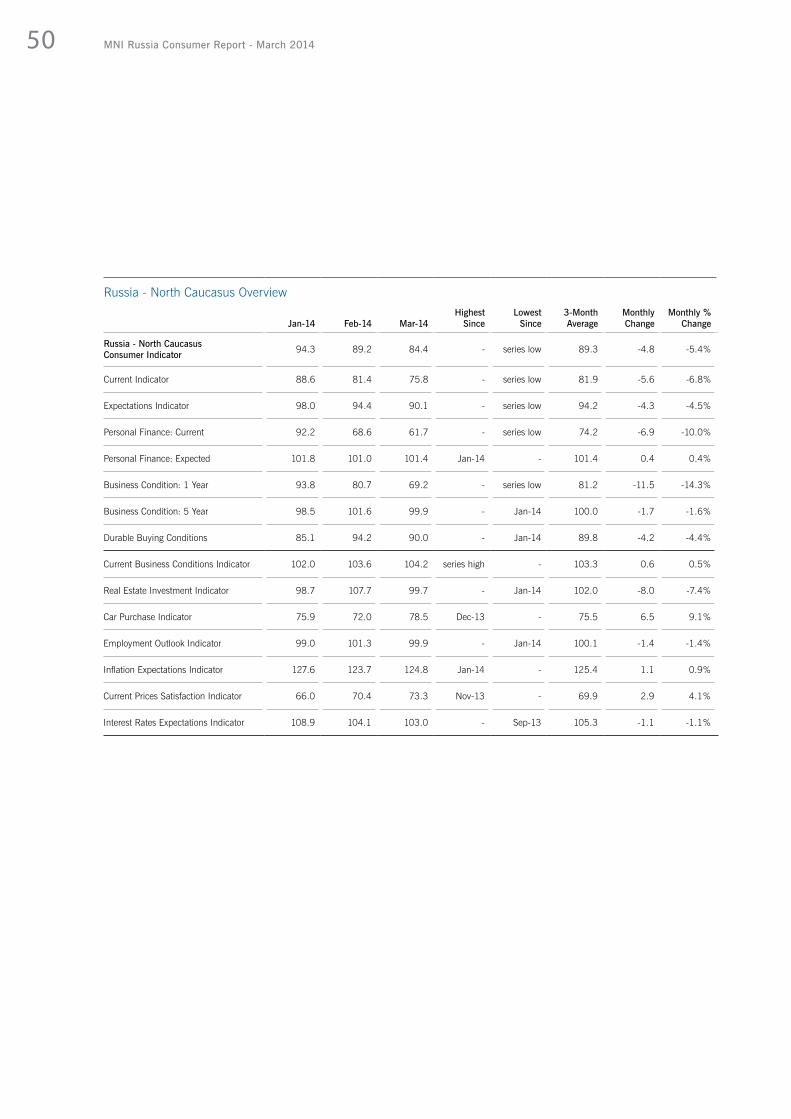
Russia - North Caucasus Overview
Jan-14 Feb-14 Mar-14Highest
Since Lowest
Since 3-Month Average
Monthly Change
Monthly % Change
Russia - North Caucasus Consumer Indicator 94.3 89.2 84.4 - series low 89.3 -4.8 -5.4%
Current Indicator 88.6 81.4 75.8 - series low 81.9 -5.6 -6.8%
Expectations Indicator 98.0 94.4 90.1 - series low 94.2 -4.3 -4.5%
Personal Finance: Current 92.2 68.6 61.7 - series low 74.2 -6.9 -10.0%
Personal Finance: Expected 101.8 101.0 101.4 Jan-14 - 101.4 0.4 0.4%
Business Condition: 1 Year 93.8 80.7 69.2 - series low 81.2 -11.5 -14.3%
Business Condition: 5 Year 98.5 101.6 99.9 - Jan-14 100.0 -1.7 -1.6%
Durable Buying Conditions 85.1 94.2 90.0 - Jan-14 89.8 -4.2 -4.4%
Current Business Conditions Indicator 102.0 103.6 104.2 series high - 103.3 0.6 0.5%
Real Estate Investment Indicator 98.7 107.7 99.7 - Jan-14 102.0 -8.0 -7.4%
Car Purchase Indicator 75.9 72.0 78.5 Dec-13 - 75.5 6.5 9.1%
Employment Outlook Indicator 99.0 101.3 99.9 - Jan-14 100.1 -1.4 -1.4%
Inflation Expectations Indicator 127.6 123.7 124.8 Jan-14 - 125.4 1.1 0.9%
Current Prices Satisfaction Indicator 66.0 70.4 73.3 Nov-13 - 69.9 2.9 4.1%
Interest Rates Expectations Indicator 108.9 104.1 103.0 - Sep-13 105.3 -1.1 -1.1%
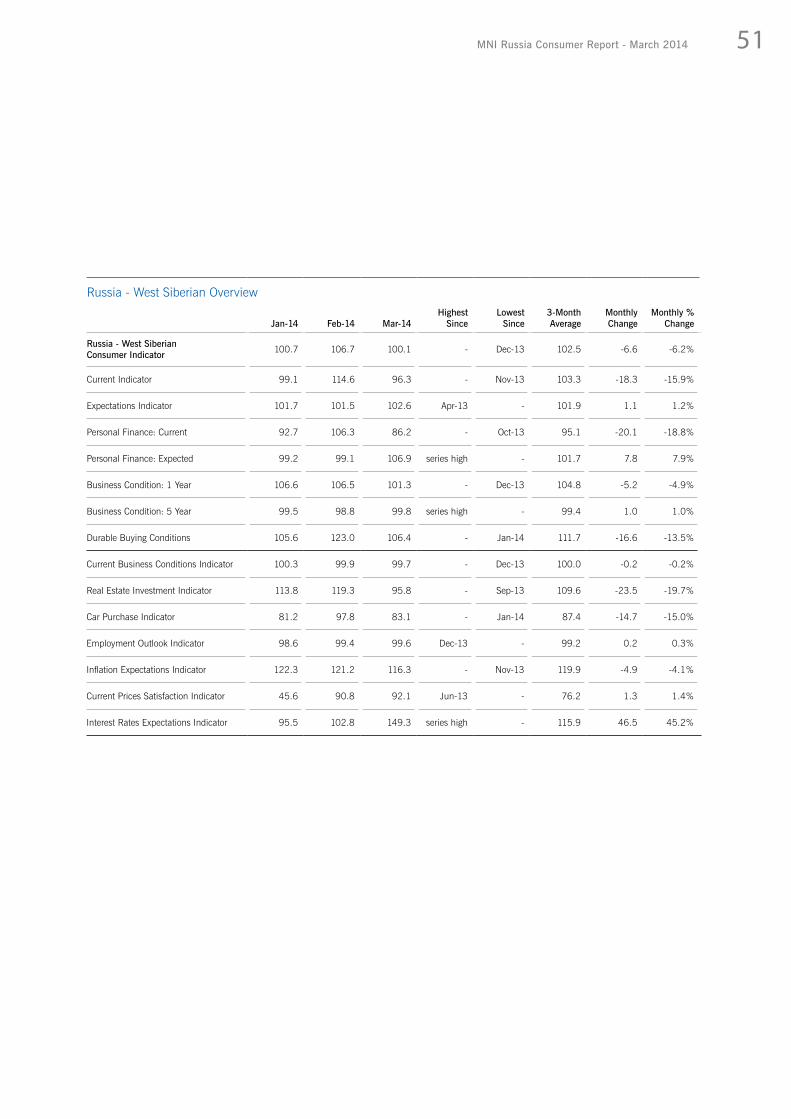
51MNI Russia Consumer Report - March 2014
Russia - West Siberian Overview
Jan-14 Feb-14 Mar-14Highest
Since Lowest
Since 3-Month Average
Monthly Change
Monthly % Change
Russia - West SiberianConsumer Indicator 100.7 106.7 100.1 - Dec-13 102.5 -6.6 -6.2%
Current Indicator 99.1 114.6 96.3 - Nov-13 103.3 -18.3 -15.9%
Expectations Indicator 101.7 101.5 102.6 Apr-13 - 101.9 1.1 1.2%
Personal Finance: Current 92.7 106.3 86.2 - Oct-13 95.1 -20.1 -18.8%
Personal Finance: Expected 99.2 99.1 106.9 series high - 101.7 7.8 7.9%
Business Condition: 1 Year 106.6 106.5 101.3 - Dec-13 104.8 -5.2 -4.9%
Business Condition: 5 Year 99.5 98.8 99.8 series high - 99.4 1.0 1.0%
Durable Buying Conditions 105.6 123.0 106.4 - Jan-14 111.7 -16.6 -13.5%
Current Business Conditions Indicator 100.3 99.9 99.7 - Dec-13 100.0 -0.2 -0.2%
Real Estate Investment Indicator 113.8 119.3 95.8 - Sep-13 109.6 -23.5 -19.7%
Car Purchase Indicator 81.2 97.8 83.1 - Jan-14 87.4 -14.7 -15.0%
Employment Outlook Indicator 98.6 99.4 99.6 Dec-13 - 99.2 0.2 0.3%
Inflation Expectations Indicator 122.3 121.2 116.3 - Nov-13 119.9 -4.9 -4.1%
Current Prices Satisfaction Indicator 45.6 90.8 92.1 Jun-13 - 76.2 1.3 1.4%
Interest Rates Expectations Indicator 95.5 102.8 149.3 series high - 115.9 46.5 45.2%

52 MNI Russia Consumer Report - March 2014
All Russia Overview by Age
Jan-14 Feb-14 Mar-14Highest
Since Lowest
Since 3-Month Average
Monthly Change
Monthly % Change
Age 18-34
MNI Russia Consumer Indicator 102.2 96.2 90.1 - series low 96.2 -6.1 -6.3%
Current Indicator 106.8 104.1 91.8 - series low 100.9 -12.3 -11.8%
Expectations Indicator 99.1 91.0 89.0 - series low 93.0 -2.0 -2.2%
Personal Finance: Current 108.4 93.4 82.8 - series low 94.9 -10.6 -11.4%
Personal Finance: Expected 102.8 98.7 96.1 - series low 99.2 -2.6 -2.6%
Business Condition: 1 Year 96.4 88.7 79.7 - series low 88.3 -9.0 -10.1%
Business Condition: 5 Year 97.9 85.5 91.1 Jan-14 - 91.5 5.6 6.5%
Durable Buying Conditions 105.2 114.7 100.9 - Dec-13 106.9 -13.8 -12.0%
Age 35-54
MNI Russia Consumer Indicator 96.8 92.0 87.3 - series low 92.0 -4.7 -5.2%
Current Indicator 98.2 93.5 86.8 - series low 92.8 -6.7 -7.2%
Expectations Indicator 95.9 91.1 87.6 - series low 91.5 -3.5 -3.8%
Personal Finance: Current 93.6 82.1 76.0 - series low 83.9 -6.1 -7.4%
Personal Finance: Expected 101.8 93.7 97.0 Jan-14 - 97.5 3.3 3.5%
Business Condition: 1 Year 90.7 87.0 75.8 - series low 84.5 -11.2 -12.8%
Business Condition: 5 Year 95.2 92.6 90.1 - Dec-13 92.6 -2.5 -2.7%
Durable Buying Conditions 102.8 104.9 97.5 - Aug-13 101.7 -7.4 -7.0%
Age 55-64
MNI Russia Consumer Indicator 96.8 90.9 90.3 - series low 92.7 -0.6 -0.7%
Current Indicator 96.4 88.6 87.5 - Dec-13 90.8 -1.1 -1.3%
Expectations Indicator 97.0 92.4 92.1 - series low 93.8 -0.3 -0.3%
Personal Finance: Current 84.4 73.9 76.9 Jan-14 - 78.4 3.0 4.1%
Personal Finance: Expected 93.9 92.9 94.9 Dec-13 - 93.9 2.0 2.2%
Business Condition: 1 Year 102.9 86.3 90.5 Jan-14 - 93.2 4.2 4.8%
Business Condition: 5 Year 94.3 98.0 91.0 - Nov-13 94.4 -7.0 -7.2%
Durable Buying Conditions 108.4 103.4 98.0 - Dec-13 103.3 -5.4 -5.2%
53MNI Russia Consumer Report - March 2014
All Russia - Overview by Income
Jan-14 Feb-14 Mar-14Highest
Since Lowest
Since 3-Month Average
Monthly Change
Monthly % Change
< RUB 480,000 Per Annum
MNI Russia Consumer Indicator 99.7 89.8 87.6 - series low 92.4 -2.2 -2.4%
Current Indicator 103.3 94.3 90.5 - Nov-13 96.0 -3.8 -4.0%
Expectations Indicator 97.3 86.9 85.7 - series low 90.0 -1.2 -1.3%
Personal Finance: Current 102.2 80.6 78.9 - series low 87.2 -1.7 -2.0%
Personal Finance: Expected 101.4 93.3 92.9 - series low 95.9 -0.4 -0.5%
Business Condition: 1 Year 91.4 79.3 75.9 - series low 82.2 -3.4 -4.2%
Business Condition: 5 Year 99.2 88.0 88.4 Jan-14 - 91.9 0.4 0.4%
Durable Buying Conditions 104.5 107.9 102.1 - Dec-13 104.8 -5.8 -5.4%
> RUB 480,000 Per Annum
MNI Russia Consumer Indicator 98.8 100.4 91.5 - series low 96.9 -8.9 -8.8%
Current Indicator 101.3 105.5 90.3 - series low 99.0 -15.2 -14.4%
Expectations Indicator 97.1 96.9 92.3 - series low 95.4 -4.6 -4.8%
Personal Finance: Current 100.1 96.8 80.8 - series low 92.6 -16.0 -16.6%
Personal Finance: Expected 101.3 100.0 99.4 - series low 100.2 -0.6 -0.6%
Business Condition: 1 Year 96.9 99.9 85.0 - series low 93.9 -14.9 -14.9%
Business Condition: 5 Year 93.2 90.9 92.5 Jan-14 - 92.2 1.6 1.7%
Durable Buying Conditions 102.4 114.2 99.8 - Dec-13 105.5 -14.4 -12.6%

54 MNI Russia Consumer Report - March 2014
Methodology
The MNI Russia Consumer Sentiment Survey is a wide ranging monthly survey of consumer confidence across Russia.
Data is collected through computer aided telephone interviews (CATI), with each interviewee selected randomly by computer. At least 1,000 interviews are conducted each month.
The survey adopts a similar methodology to the University of Michigan survey of U.S. consumer sentiment.
The MNI Russia Consumer Indicator is derived from five questions, two on current conditions and three on future expectations:
1) Current personal financial situation compared to a year ago2) Current willingness to buy major household items3) Personal financial situation one year from now4) Overall business conditions one year from now5) Overall business conditions for the next 5 years
Indicators relating to specific questions in the report are diffusion indices with 100 representing a neutral level, meaning positive and negative answers are equal. Values above 100 indicate increasing positivity while values below show increasing negativity.

Insight and data for better decisions
Discovering trends in Emerging MarketsMNI‘s Emerging Markets Indicators explore attitudes, perspectives and confidence in Russia, India and China. Our data and monthly reports present an advance picture of the economic landscape as perceived by businesses and consumers.
Our indicators allow investors, economists, analysts, and companies to identify economic trends and make informed investment and business decisions. Our data moves markets.
www.mni-indicators.com

Published byMNI Indicators | Deutsche Börse GroupWestferry House11 Westferry CircusLondon E14 [email protected]@MNIIndicators
Copyright© 2014 MNI Indicators | Deutsche Börse Group. Reproduction or retransmission in whole or in part is prohibited except by permission. All rights reserved.


![MNI infographic_14[1]](https://static.fdocuments.us/doc/165x107/587011f61a28ab7f428b4693/mni-infographic141.jpg)


