M.N. Murty and Surender Kumar - IDFC · PDF fileM.N. Murty and Surender Kumar 19 certain...
14
Introduction Water pollution is a serious problem in India as almost 70 per cent of its surface water resources and a growing percentage of its groundwater reserves are contaminated by biological, toxic, organic, and inorganic pollutants. In many cases, these sources have been rendered unsafe for human consumption as well as for other activities, such as irrigation and industrial needs. is shows that degraded water quality can contribute to water scarcity as it limits its availability for both human use and for the ecosystem. In 1995, the Central Pollution Control Board (CPCB) identified severely polluted stretches on 18 major rivers in India. Not surprisingly, a majority of these stretches were found in and around large urban areas. e high incidence of severe contamination near urban areas indicates that the industrial and domes- tic sectors’ contribution to water pollution is much higher than their relative importance implied in the Indian economy. Agricultural activities also contribute in terms of overall impact on water quality. Besides a rapidly depleting groundwater table in different parts, the country faces another major problem on the water front—groundwater contamination—a problem which has affected as many as 19 states, including Delhi. Geo- genic contaminants, including salinity, iron, fluoride, and arsenic have affected groundwater in over 200 districts spread across 19 states. Water as an environmental resource is regenerative in the sense that it could absorb pollution loads up to Water Pollution in India An Economic Appraisal M.N. Murty and Surender Kumar 19 certain levels without affecting its quality. In fact there could be a problem of water pollution only if the pol- lution loads exceed the natural regenerative capacity of a water resource. e control of water pollution is therefore to reduce the pollution loads from anthropo- genic activities to the natural regenerative capacity of the resource. e benefits of the preservation of water quality are manifold. Not only can abatement of water pollution provide marketable benefits, such as reduced water borne diseases, savings in the cost of supplying water for household, industrial and agricultural uses, control of land degradation, and development of fish- eries, it can also generate non-marketable benefits like improved environmental amenities, aquatic life, and biodiversity. Using available data and case studies, this chapter aims to provide an overview of the extent, impacts, and control of water pollution in India. It also tries to identify the theoretical and policy issues involved in the abatement and avoidance of water pollution in India. Extent of Water Pollution in India e level of water pollution in the country can be gauged by the status of water quality around India. e water quality monitoring results carried out by CPCB particularly with respect to the indicator of oxygen consuming substances (biochemical oxygen demand, BOD) and the indicator of pathogenic bacteria (total coliform and faecal coliform) show that there is gradual
Transcript of M.N. Murty and Surender Kumar - IDFC · PDF fileM.N. Murty and Surender Kumar 19 certain...

IntroductionWater pollution is a serious problem in India as almost 70 per cent of its surface water resources and a growing percentage of its groundwater reserves are contaminated by biological, toxic, organic, and inorganic pollutants. In many cases, these sources have been rendered unsafe for human consumption as well as for other activities, such as irrigation and industrial needs. Th is shows that degraded water quality can contribute to water scarcity as it limits its availability for both human use and for the ecosystem. In 1995, the Central Pollution Control Board (CPCB) identifi ed severely polluted stretches on 18 major rivers in India. Not surprisingly, a majority of these stretches were found in and around large urban areas. Th e high incidence of severe contamination near urban areas indicates that the industrial and domes-tic sectors’ contribution to water pollution is much higher than their relative importance implied in the Indian economy. Agricultural activities also contribute in terms of overall impact on water quality. Besides a rapidly depleting groundwater table in diff erent parts, the country faces another major problem on the water front—groundwater contamination—a problem which has aff ected as many as 19 states, including Delhi. Geo-genic contaminants, including salinity, iron, fl uoride, and arsenic have aff ected groundwater in over 200 districts spread across 19 states. Water as an environmental resource is regenerative in the sense that it could absorb pollution loads up to
Water Pollution in India
An Economic Appraisal
M.N. Murty and Surender Kumar
19
certain levels without aff ecting its quality. In fact there could be a problem of water pollution only if the pol-lution loads exceed the natural regenerative capacity of a water resource. Th e control of water pollution is therefore to reduce the pollution loads from anthropo-genic activities to the natural regenerative capacity of the resource. Th e benefi ts of the preservation of water quality are manifold. Not only can abatement of water pollution provide marketable benefi ts, such as reduced water borne diseases, savings in the cost of supplying water for household, industrial and agricultural uses, control of land degradation, and development of fi sh-eries, it can also generate non-marketable benefi ts like improved environmental amenities, aquatic life, and biodiversity. Using available data and case studies, this chapter aims to provide an overview of the extent, impacts, and control of water pollution in India. It also tries to identify the theoretical and policy issues involved in the abatement and avoidance of water pollution in India.
Extent of Water Pollution in IndiaTh e level of water pollution in the country can be gauged by the status of water quality around India. Th e water quality monitoring results carried out by CPCB particularly with respect to the indicator of oxygen consuming substances (biochemical oxygen demand, BOD) and the indicator of pathogenic bacteria (total coliform and faecal coliform) show that there is gradual

286 India Infrastructure Report 2011
degradation in water quality (CPCB 2009). During 1995–2009, the number of observed sample with BOD values less than 3 mg/l were between 57–69 per cent; in 2007 the observed samples were 69 per cent. Similarly, during this period of 15 years between 17–28 per cent of the samples observed BOD value between 3-6 mg/l and the maximum number of samples in this category were observed in 1998. It was observed that the number of observations remained unchanged and followed a static trend in percentage of observations having BOD between 3–6 mg/l. Th e number of observed BOD value > 6 mg/l was between 13 and 19 per cent during 1995–2009, and the maximum value of 19 per cent was observed in 2001, 2002, and 2009. It was observed that there was a gradual decrease in the BOD levels and in 2009, 17 per cent had BOD value > 6 mg/1. Th e worrying aspect of this trend is the high percentage (19 per cent) of sampling stations exhibiting unacceptable levels of BOD, which might either mean that the discharge sources are not complying with the standards or even after their compliance their high quantum of discharge contributes to elevated levels of contaminants (Rajaram and Das 2008). However, the status of water quality cannot be adequately assessed through monitoring of basic parameters in the current inadequate number of sampling stations.
Another aspect of water pollution in India is inade-quate infrastructure, comprising of monitoring stations and frequency of monitoring for monitoring pollution. Monitoring is conducted by CPCB at 1,700 stations, (Figure 19.2), under a global environment monitoring system (GEMS) and Monitoring of Indian National Aquatic Resources (MINARS) programmes (CPCB 2009). Th ere is an urgent need to increase the num-ber of monitoring stations from their current number, which translate as one station per 1,935 km2 to levels found in developed nations for eff ective monitoring. For example, in the state of Arkansas in the US there are monitoring stations per 356 km2 (Rajaram and Das 2008). CPCB (2009) also reports the frequency of monitoring in the country. It is observed that 32 per cent of the stations have frequency of monitoring on a monthly basis, 28.82 per cent on a half-yearly basis, and 38.64 per cent on a quarterly basis. Th is indicates the need for not only increasing the number of moni-toring stations but also the frequency of monitoring. Th e water quality monitoring results obtained by CPCB during 1995 to 2009 indicate that organic and bacterial contamination was critical in the water bod-ies. Th e main cause for such contamination is discharge of domestic and industrial wastewater in water bod-ies mostly in an untreated form from urban centres.
Figure 19.1 Trend of Biochemical Oxygen Demand (BOD), 1995–2009
Source: CPCB (2009).
57 59 60 57 57 59 60 64 67 66 68 64 69 67 64
27 25 23 28 27 25 21 17 18 19 18 1818 18 19
16 16 17 15 16 16 19 19 15 15 14 18 13 15 17
0
20
40
60
80
100
1995
1996
1997
1998
1999
2000
2001
2002
2003
2004
2005
2006
2007
2008
2009
BOD<3 BOD 3–6 BOD>6
Year

Water Pollution in India 287
Secondly the receiving water bodies also do not have adequate water fl ow for dilution. Th erefore, the oxygen demand and bacterial pollution is increasing. Household borne effl uents contribute a substantial proportion of water pollution in India. Untreated effl u-ents from households pollute surface and groundwater sources. Local governments (city corporations, mu-nicipalities, and panchayats) have the responsibility of water supply and sanitation and are supposed to treat the effl uents as per national water pollution standards or minimal national standards (MINAS) However, about 70 per cent of the effl uents are not treated and disposed off into the environmental media untreated. Table 19.1 provides the summary statistics of wastewater generation and treatment in India in 2008. Th is table shows that cities, which have a population of more than one lakh
(Class-I), treat only about 32 per cent of the wastewater generated. Note that out of the total effl uent treatment capacity of 11554 MLD in the country, about 70 per cent (8040 MLD) has been created in 35 metropoli-tan cities. Metropolitan cities treat about 52 per cent of their wastewater. Delhi and Mumbai account for about 69 per cent of the treatment capacity of metropolitan cities. Th is indicates that smaller towns and cities have very little wastewater treatment capacity. Meanwhile, only 3.15 per cent of the rural population has access to sanitation services and 115 million homes have no access to toilets of any type. CPCB provides source-specifi c pollution standards for industries with respect to pollution concentration of major water pollutants: (BOD), chemical oxygen de-mand (COD), suspended solids (SS), and pH. CPCB
Figure 19.2 Growth of Water Pollution Monitoring Network in India
Source: CPCB (2009).
No.
ofM
onit
orin
gSt
atio
ns
18 29 43 67
73
74 89 120
136
168
200 310 400
450
480
480
480
480
480
480
507
507
507
784
784
784
784 870 1
019
1032 1
245 1
429
1700
0
200
400
600
800
1000
1200
1400
1600
1800
1977–8
1978–9
1979–80
1980–1
1981–2
1982–3
1983–4
1984–5
1985–6
1986–7
1987–8
1988–9
1989–90
1990–1
1991–2
1992–3
1993–4
1994–5
1995–6
1996–7
1997–8
1998–9
1999–2000
2000–1
2001–2
2002–3
2003–4
2004–5
2005–6
2006–7
2007–8
2008–9
2009–10
Year
Table 19.1 Wastewater Treatment Capacity in Urban Areas in India, 2008
Category No. of cities Total water supply Wastewater generation Treatment capacity (in MLD) (in MLD) (in MLD)
Class-I City 498 44,769.05 35,558.12 11,553.68 (32%)
Class-II town 410 3,324.83 2,696.7 233.7 (8%)
Total 908 48,093.88 38,254 11787.38 (31%)
Source: CPCB (2008).
288 India Infrastructure Report 2011
launched a water pollution control programme in 1992 for industries. It identifi ed 1,551 large and medium industries, and gave a time schedule to these industries for compliance with prescribed standards. It was found that many of these industries have effl uent treatment plants (ETPs) but despite these they did not comply with prescribed pollution standards. In the industrial sector only 59 per cent of the large and medium in-dustries had adequate effl uent treatment in 1995. Th ere are 0.32 million small-scale industrial units in India and due to the presence of scale economies in water pollution reduction, it is uneconomical for these units to have ETPs of their own (Murty et al. 1999). Th ese small-scale units contribute almost 40 per cent of the industrial water pollution in India. However, small-scale units located in many industrial estates in India have gone for common effl uent treatment plants (CETPs). Agricultural run-off s aff ect groundwater and surface water sources as they contain pesticide and fertilizer residues. Fertilizers have an indirect adverse impact on water resources. Indeed, by increasing the nutritional content of water courses, fertilizers allow organisms to proliferate. Th ese organisms may be disease vectors or algae. Th e proliferation of algae may slow the fl ow in water courses, thus increasing the proliferation of organisms and sedimentation. WHO has defi ned a permissible limit of concentration of nitrates of 45 mg/L of NO3, which is also accepted by the Indian Council of Medical Research (ICMR). In the agricultural sector, fertilizer use increased from 7.7 MT in 1984 to 13.4 MT in 1996 and pesticide use increased from 24 MT in 1971 to 85 MT in 1995 (Bhalla et al. 1999). It has been observed that in states, such as Haryana, the NO3 concentration has exceeded the permissible limits (Maria 2003).
Effects of Water PollutionLack of water, sanitation, and hygiene results in the loss of 0.4 million lives while air pollution contributes to the death of 0.52 million people annually in India (WHO 2007). Environmental factors contribute to 60 years of ill-health per 1,000 population in India compared to 54 in Russia, 37 in Brazil, and 34 in China. Th e socio-economic costs of water pollution are extremely high: 1.5 million children under 5 years die each year due to water related diseases, 200 million person days
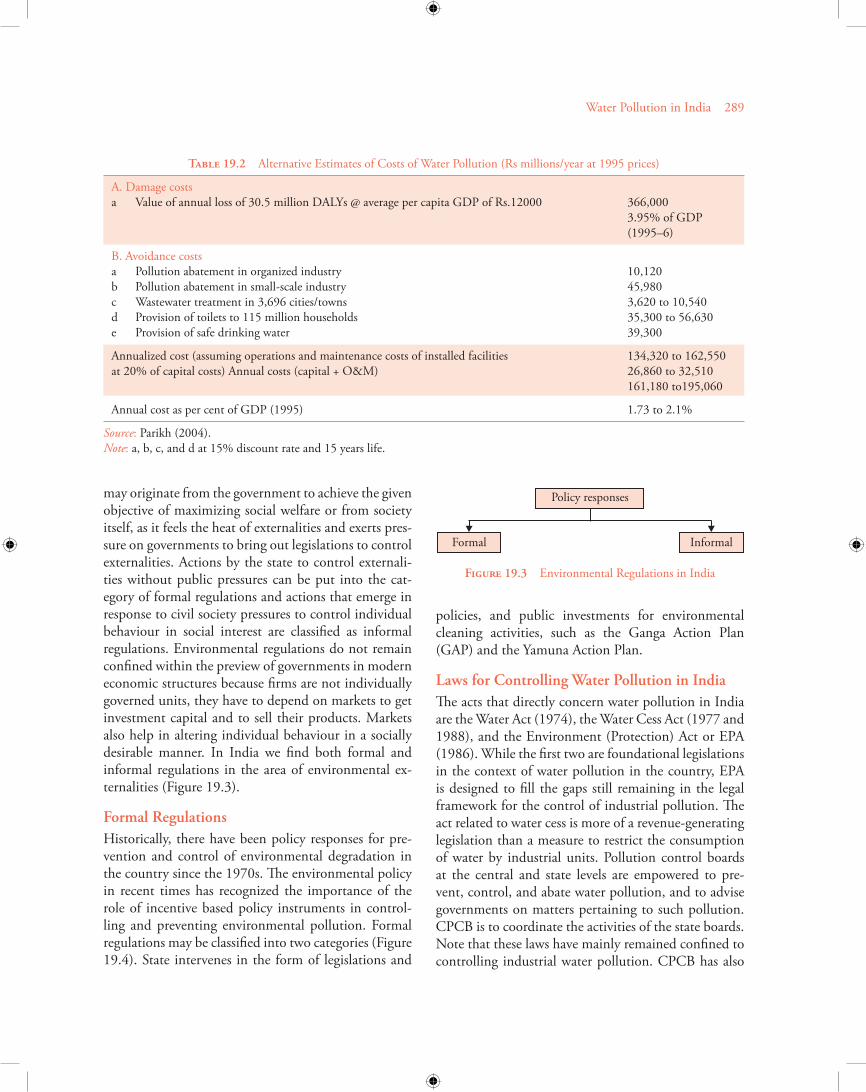
of work are lost each year, and the country loses about Rs 366 billion each year due to water related diseases (Parikh 2004). McKenzie and Ray (2004) also observe similar eff ects of water pollution; however, the magnitude of the eff ect was modest. Th e study shows that India loses 90 million days a year due to water borne diseases with production losses and treatment costs worth Rs 6 billion. Poor water quality, sanitation, and hygiene result in the loss of 30.5 million disabilities adjusted life years (DALY) in India. Groundwater resources in vast tracts of India are contaminated with fl uoride and arsenic. Fluoride problems exist in 150 districts in 17 states in the country with Orissa and Rajasthan being the most severely aff ected. High concentration of fl uoride in drinking water causes fl uorosis resulting in weak bones, weak teeth, and anaemia. Th e presence of arsenic, a poison and a carcinogen, in the groundwater of the Gangetic delta causes health risks to 35–70 million people in West Bengal, Bihar, and Bangladesh. Murty and Kumar (2004) estimated the cost of industrial water pollution abatement and found that these costs account for about 2.5 per cent of industrial GDP in India. Parikh (2004) shows that the cost of avoidance is much lower than damage costs (Table 19.2). According to one estimate (Parikh 2004), India lost about Rs 366 billions, which account for about 3.95 per cent of the GDP, due to ill eff ects of water pollution and poor sanitation facilities in 1995. If India had made eff orts for mitigating these eff ects in terms of providing better sanitation facilities and doing abatement of water pollution the required resources had ranged between 1.73 to 2.2 per cent of GDP. It may however, be emphasized that these damage costs do not fully refl ect the loss in social welfare. Th ese estimates only suggest that the abatement of pollution is socially desirable and economically justifi ed.
Regulation of Water PollutionEnvironmental policies are designed to alter the behav-iour of economic agents, either individuals or group of individuals, in such a manner that the environmental externalities generated during the course of individual actions are internalized. As shown in Figure 19.3 policy responses can be classifi ed into two categories: formal and informal. A legislative response requires policy re-sponses mandated by the state. Th ese policy responses
Water Pollution in India 289
may originate from the government to achieve the given objective of maximizing social welfare or from society itself, as it feels the heat of externalities and exerts pres-sure on governments to bring out legislations to control externalities. Actions by the state to control externali-ties without public pressures can be put into the cat-egory of formal regulations and actions that emerge in response to civil society pressures to control individual behaviour in social interest are classifi ed as informal regulations. Environmental regulations do not remain confi ned within the preview of governments in modern economic structures because fi rms are not individually governed units, they have to depend on markets to get investment capital and to sell their products. Markets also help in altering individual behaviour in a socially desirable manner. In India we fi nd both formal and informal regulations in the area of environmental ex-ternalities (Figure 19.3).
Formal Regulations
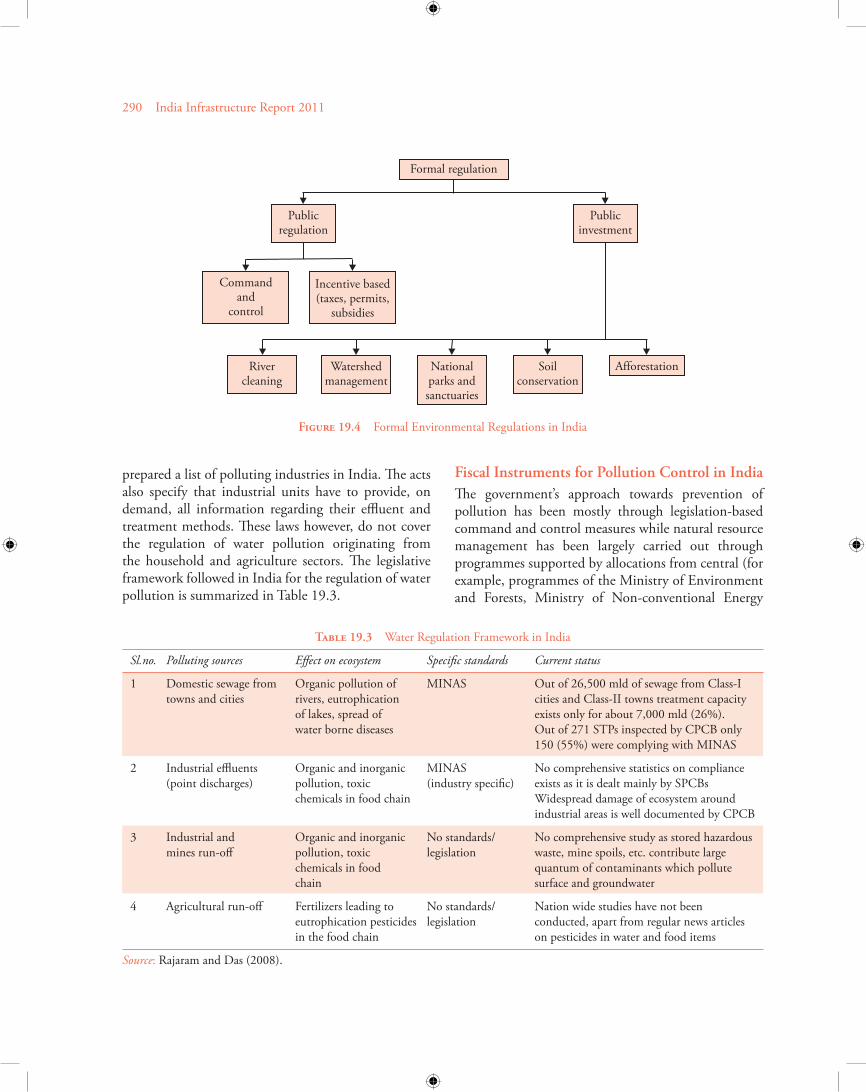
Historically, there have been policy responses for pre-vention and control of environmental degradation in the country since the 1970s. Th e environmental policy in recent times has recognized the importance of the role of incentive based policy instruments in control-ling and preventing environmental pollution. Formal regulations may be classifi ed into two categories (Figure 19.4). State intervenes in the form of legislations and
policies, and public investments for environmental cleaning activities, such as the Ganga Action Plan (GAP) and the Yamuna Action Plan.
Laws for Controlling Water Pollution in India
Th e acts that directly concern water pollution in India are the Water Act (1974), the Water Cess Act (1977 and 1988), and the Environment (Protection) Act or EPA (1986). While the fi rst two are foundational legislations in the context of water pollution in the country, EPA is designed to fi ll the gaps still remaining in the legal framework for the control of industrial pollution. Th e act related to water cess is more of a revenue-generating legislation than a measure to restrict the consumption of water by industrial units. Pollution control boards at the central and state levels are empowered to pre-vent, control, and abate water pollution, and to advise governments on matters pertaining to such pollution. CPCB is to coordinate the activities of the state boards. Note that these laws have mainly remained confi ned to controlling industrial water pollution. CPCB has also
Table 19.2 Alternative Estimates of Costs of Water Pollution (Rs millions/year at 1995 prices)
A. Damage costs a Value of annual loss of 30.5 million DALYs @ average per capita GDP of Rs.12000 366,000 3.95% of GDP (1995–6)
B. Avoidance costs a Pollution abatement in organized industry 10,120 b Pollution abatement in small-scale industry 45,980 c Wastewater treatment in 3,696 cities/towns 3,620 to 10,540 d Provision of toilets to 115 million households 35,300 to 56,630 e Provision of safe drinking water 39,300
Annualized cost (assuming operations and maintenance costs of installed facilities 134,320 to 162,550 at 20% of capital costs) Annual costs (capital + O&M) 26,860 to 32,510 161,180 to195,060
Annual cost as per cent of GDP (1995) 1.73 to 2.1%
Source: Parikh (2004).Note: a, b, c, and d at 15% discount rate and 15 years life.
Figure 19.3 Environmental Regulations in India
Policy responses
Formal Informal
290 India Infrastructure Report 2011
prepared a list of polluting industries in India. Th e acts also specify that industrial units have to provide, on demand, all information regarding their effl uent and treatment methods. Th ese laws however, do not cover the regulation of water pollution originating from the household and agriculture sectors. Th e legislative framework followed in India for the regulation of water pollution is summarized in Table 19.3.
Fiscal Instruments for Pollution Control in India
Th e government’s approach towards prevention of pollution has been mostly through legislation-based command and control measures while natural resource management has been largely carried out through programmes supported by allocations from central (for example, programmes of the Ministry of Environment and Forests, Ministry of Non-conventional Energy
Formal regulation
Publicregulation
Publicinvestment
Commandand
control
Incentive based(taxes, permits,
subsidies
Rivercleaning
Watershedmanagement
Nationalparks andsanctuaries
Soilconservation
Afforestation
Figure 19.4 Formal Environmental Regulations in India
Table 19.3 Water Regulation Framework in India
Sl.no. Polluting sources Eff ect on ecosystem Specifi c standards Current status
1 Domestic sewage from Organic pollution of MINAS Out of 26,500 mld of sewage from Class-I towns and cities rivers, eutrophication cities and Class-II towns treatment capacity of lakes, spread of exists only for about 7,000 mld (26%). water borne diseases Out of 271 STPs inspected by CPCB only 150 (55%) were complying with MINAS
2 Industrial effl uents Organic and inorganic MINAS No comprehensive statistics on compliance (point discharges) pollution, toxic (industry specifi c) exists as it is dealt mainly by SPCBs chemicals in food chain Widespread damage of ecosystem around industrial areas is well documented by CPCB
3 Industrial and Organic and inorganic No standards/ No comprehensive study as stored hazardous mines run-off pollution, toxic legislation waste, mine spoils, etc. contribute large chemicals in food quantum of contaminants which pollute chain surface and groundwater
4 Agricultural run-off Fertilizers leading to No standards/ Nation wide studies have not been eutrophication pesticides legislation conducted, apart from regular news articles in the food chain on pesticides in water and food items
Source: Rajaram and Das (2008).
Water Pollution in India 291
Sources, and the Ministry of Agriculture, etc.) and state budgets. Th e use of fi scal instruments (other than the expenditure policy) in the environmental policy has been limited, even though the need to employ economic and fi scal policy instruments for the control of pollution and management of natural resources has gained recognition since the 1990s (Datt et al. 2004). A task force was constituted by the Ministry of Environment and Forests (MoEF) in 1995 to evaluate the scope for market based instruments (MBIs) for industrial pollution abatement (Government of India 1997). Th e task force recommended explicit incorpora-tion of MBIs in pollution control laws, greater reliance on economic penalties in the short and medium term, and completely replacing criminal penalties by MBIs in the long run. It also recommended modifying the existing water cess to make it a genuine effl uent-based tax based on pollution load rather than the amount of water consumed, as also abolishing tax concessions on installation of pollution control equipment. It recog-nized the need for systematic data collection to estimate marginal abatement costs and the regulatory burden and called for the introduction of additional MBIs. Th e actual use of fi scal incentives in the country has, however, been rather limited. Th ese take the form of tax concessions for the adoption of pollution control equipment. Tax incentives are usually specifi ed for identifi ed abatement technologies and activities, not providing dynamic incentives for technological innova-tion and diff usion. Also, since most of these are end-of-the-pipe treatment technologies, these incentives do not promote more effi cient use of resources. Th ere are some provisions for the use of levies, cess, fi nes, and penalties, etc. for polluters, but their implementation and eff ectiveness needs strengthening (Kumar and Managi 2009). Although it is widely known that command and control measures do not provide necessary incen-tives to polluters for the choice of least cost methods of pollution control, the Government of India has so far resorted only to such measures for controlling in-dustrial pollution in India. On the other hand, fi scal instruments, such as pollution taxes or marketable pol-lution permits though also coercive, provide incentives
to factories for adopting least cost pollution abatement technologies. Ironically, there have been no serious attempts in India to use such instruments for the abate-ment of industrial pollution. Th e current water cess, whose objective is to raise revenue to pollution control boards, is very nominal (Rs 0.015 to 0.07 per kilolitre [Kl]). Some of the recent research studies on water pollution abatement in India conclude that the rate of pollution tax on industrial water use should be several times higher than the prevailing rate of water cess if we want to realize the prescribed water quality standards in the country. One study carried out in 1989 (Gupta et al. 1989) estimated the cost of treatment per a Kl of residual water at 1987–9 prices at Rs 3.60 for the paper and pulp industry, at Rs 2.61 for oil refi neries, Rs 2.21 for chemicals, and Rs 1.64 for sugar. Another study (Mehta et al. 1994) carried out in 1994 estimated the marginal cost of abatement for the reduction of 100 mg of bio oxygen demand in the residual water for the paper and pulp industry at Re 0.38 at 1991–2 prices. Yet another study published in 1999 (Murty et al. 1999) found that the pollution tax per 100 mg reduc-tion of COD by the Indian manufacturing industry for realizing the standard of 250 mg per litre of residual water was Re 0.32 at 1995–6 prices. MoEF also commissioned several case studies to examine issues relating to economic instruments for pollution abatement. Th ese studies estimated abate-ment costs of pollutants and recorded wide variations across diff erent industries. Th e studies pointed out the ineffi ciency of the current legislation, which requires all polluters to meet the same discharge standards, and called for the introduction of economic instruments for cost eff ective pollution control. Th ey emphasized the need for regulators to allocate their monitoring resources more effi ciently by targeting industries char-acterized by relatively high discharges and low costs of pollution abatement. Th ese studies also observed that taxes and incentives based on effi ciency instruments better align pollution control agencies with polluters than the command and control regime. Some studies1 give some information about the rate of tax to be levied on industries for making them comply with the prescribed water standards. Mehta
1 See Gupta et al. (1989); Mehta et al. (1994); Murty et al. (1999); Pandey (1998); Misra (1999); World Bank (1999); and Murty and Kumar (2004).

292 India Infrastructure Report 2011
et al. (1994) considered an abatement cost function for an effl uent treatment plant in paper and pulp units in India, and concluded that marginal abatement costs of relatively high cost producers should serve as the basis for setting charges/taxes so as to ensure that producers fi nd it cheaper to abate than to pollute. Th ey recommended four options for experimenting by policymakers: (i) abatement charges with the govern-ment undertaking cleaning up, (ii) abatement charges with cleaning-up contracted out based on competitive bidding, (iii) a tax proportional to excess pollution on fi rms violating standards and subsidies for those going beyond the prescribed abatement standards, and (iv) a private permit trading system. Th e water polluting fi rms in Indian industry are sup-posed to meet the standards set for pollutants (35mg/l for BOD, 250mg/l for COD, and 100mg/l for SSP) by the Central Pollution Control Board. A survey2 of a sample of water polluting industries in India shows that most of the fi rms have effl uent treatment plants and in addition some fi rms are using process changes in production and input choices to achieve effl uent stan-dards. However, there is a large variation in the degree of compliance among the fi rms measured in terms of ratio of standard to effl uent quality. Th e laxity of for-mal environmental regulations by the government and the use of command and control instruments could be regarded as factors responsible for large variations in complying with pollution standards by fi rms. Using this data, Murty and Kumar (2004) provide estimates of taxes on one tonne of BOD, COD, and SS as Rs 20,157, Rs 48,826, and Rs 21,444 respectively.
Informal Regulation and People’s Participation
Economic instruments and command and controls are instruments of formal regulation. Th e designing and implementation of these instruments involves a top-down or a centralized approach. Th e success of these instruments in controlling pollution depends upon the quality of governance and its ability to incur high trans-action costs. A bottom-up or decentralized regulation involving civic society and local communities and with a very limited role of the government could save trans-action costs and get rid of political and bureaucratic
corruption. Th is approach draws theoretical support from the Coase Th eorem (Coase 1960). Th e Coase Th eorem states that the optimal level of pollution con-trol could be realized through the bargaining between the polluters and the aff ected parties, given the initial property rights to either of the parties in the absence of transaction costs. Even with positive transaction costs, the bargaining could result in the reduction of external-ity though not to the optimum level. Recent empirical experiences show that the bargaining between the com-munities and polluters helped in reducing the water pollution when the government had been protecting the property rights to the environmental resource to the people (Murty et al. 1999; Paragal and Wheeler 1996; World Bank 1999). Th e management of environmental resources can no longer be taken as the responsibility of a single institution like a market or the government (Murty 2008). Th e now well-known limitations of either the market or the government in managing the environ-ment have paved the way for a mixture of institutions. Market agents, consumers, producers, and stockholders have incentives for controlling pollution. Consumers regulate the market for pollution intensive commodi-ties by expressing preferences for green products or commodities produced using cleaner technologies. Investors also have incentives to invest in industries using cleaner technologies. Higher level of observed pollution in a fi rm is an indication to the investors that the fi rm uses ineffi cient technology resulting in the loss of profi ts. Profi t losses may occur because of reduced demand for its products by green consumers, increased costs due to higher penalties imposed by the govern-ment for non-compliance with pollution standards, and the settlement of compensation to victims. In this case there may be a downward revaluation of the fi rm’s stocks in the capital market. On the other hand, a good environmental performance by a fi rm may result in an upward evaluation of its stocks (Murty 2008). Some recent studies have shown that stock markets in both developed and developing countries react to the environmental performance of fi rms. Also studies about fi rms’ behaviour with respect to environment performance related changes in stock prices show that
2 ‘A Survey of Water Polluting Industries in India’ (1996) and ‘A Survey of Water and Air polluting Industries in India’ (2000), Institute of Economic Growth, Delhi.

Water Pollution in India 293
fi rms react to such changes by reducing pollution loads. Recent studies about this phenomenon in some devel-oping countries like India (Gupta and Goldar 2005), Argentina, Chile, Mexico, and Philippines show that stock prices are even more volatile to news about the environmental performance of fi rms. Th e average gain in stock prices due to good news about environmen-tal performance is found to be 20 per cent in these countries. Th ere is now evidence about a number of industries in the developing countries complying with environ-mental standards even in the absence of formal regu-lations by the government. One interesting example is the success story of PT Indah Kiat Pulp and Paper (IKPP) in Indonesia (World Bank 1999). IKPP is the largest and the cleanest paper producing company in Indonesia. A clean up started in some of its mills in the 1990s with pressures from local communities. Local villagers claimed damages from the mills with the help of local NGOs. Indonesia’s national pollution control agency, BAPEDAL, mediated an agreement in which IKPP acceded to the villagers’ demands. Fur-ther, the need for going to western bond markets for fi nancing the expansion of IKPP to meet the growing export demand, made the company go in for cleaner technologies. Th e good performance of the company in pollution management has resulted in an increase in its stock value in comparison to Jakarta’s composite stock index. Figure 19.5 describes the structure of informal environmental regulations in India. Take for example pollution abatement by small-scale enterprises located in industrial estates in India. Use of
command and control instruments by the government in an environment of non-availability of economically viable technological options for pollution abatement has been causing considerable hardships to small-scale enterprises. Th e government managed public sector has been the fountainhead of industrial development. But the government has not made any sincere eff orts to promote economically viable pollution abatement technologies for small-scale enterprises via R&D in the public sector. Th e presence of scale economies in pollution abatement, especially in water pollution abatement, has compounded problems for industrial estates. In such a situation, it is not economical for the small-scale enterprises to have their own individual effl uent treatment plants to comply with the command and control regulation. Collective action involving all the relevant parties for water pollution abatement (factories, aff ected parties, and the government) is now seen as an institutional alternative for dealing with the problem of water pollution abatement in industrial estates, especially in India (Murty et al. 1999). Collective action in industrial water pollution abatement is meant to bring about necessary institutional changes that are compatible with the choice of cost saving technologies. For example, a CETP can be adopted if necessary legislation is in place to defi ne the property rights of the factories and the aff ected parties. A CETP for an industrial estate confers the benefi ts of saving in costs to the factories and the reduction in damages to aff ected parties. Th ere are many incentives for polluters, aff ected parties, and the government for promoting collective action in industrial water pollution abatement.
Figure 19.5 Informal Environmental Regulation in India
Source: Kumar and Managi (2009).
Informal regulation
Industry Other sectorsForest Agriculture
Big (publiclitigation,political
influence, andcompliance)
Joint protectedarea management
Small(contractof smallfactories
and CETP)
Joint forestmanagement

294 India Infrastructure Report 2011
Historical developments leading to the adoption of CETP technologies by some of the industrial estates are clear evidence of the success of collection action approach. In this case collection action involves facto-ries (polluters), people aff ected from pollution, NGOs, and government (see Murty and Prasad cited in Murty et al. 1999). Th ere are three processes involved in the collective action for control of water pollution in an industrial estate. Th ese are: (i) collective action of aff ected parties; (ii) collective action of factories, and (iii) the bargaining between a coalition of aff ected people and a coalition of factories. Collective action by aff ected people is possible if the damages from pollu-tion are substantive enough to justify the transaction costs of coalition and bargaining. Factories in an in-dustrial estate have to take recourse to pollution abate-ment methods taking into account possible collective action by the aff ected people. Th e available pollution abatement technologies may provide small factories a broad spectrum of technological choices out of which the common effl uent treatment plant may be the least cost technology. Th erefore, collective action by facto-ries can be technology driven. Finally, the bargaining between a coalition of aff ected people and a coalition of factories produces the end result of collective action that is the realization of prescribed environmental standards. Murty et al. (1999) reported the results of a survey of a number of industrial estates and an all-India survey of large-scale water polluting factories providing evidence of local community pressure resulting in the industries complying with standards. A number of agencies, such as local communities, elected representatives (members of Parliament, state assemblies, and municipal com-mittees), industries, NGOs, and the government are found to be involved in the processes leading to the establishment of common effl uent treatment plants in industrial estates. Th ere are also several examples of physical threats, and public litigation cases against fac-tories for claiming damages from pollution by the local people resulting in the big factories complying with the standards. Take, for example, the Pattancheru indus-trial estate in Andhra Pradesh. Local opposition to the pollution started in 1986 when about 3,000 villagers marched to the Chief Minister’s offi ce after suff ering large-scale crop losses and health damages due to con-tamination of groundwater and the pollution of nearby
river. In 1989, about 5,000 people held a demonstra-tion before the state assembly, demanding an end to industrial pollution. In the same years farmers blocked the highway running through Pattancheru for two days. Th e villagers also fi led court cases by jointly sharing the cost with contributions of Rs 200 per household. Th is legal action through the collective eff ort of the people ultimately forced the factories in the industrial estate to have a CETP for complying with water pollution standards. Similar experiences are reported from many other industrial estates in the region. Informal regulation by local communities is result-ing in factories complying with standards as explained by the examples given earlier. Th e amount of infl uence that the local communities exert on factories to un-dertake pollution depends, among other factors, upon their affl uence, the degree of political organization, education, and environmental awareness. Pargal and Wheeler (1996) found a negative relationship between BOD load in a factory effl uent and per capita income and educational levels of local communities in a sample of 243 factories in Indonesia. Similarly, Murty and Prasad (1999) found a negative relationship between the BOD effl uent-infl uent ratio and a relative index of development of local community, and the political activity of the local community measured in terms of percentage of votes polled in the recent elections to the Indian Parliament. Collective action constitutes costs to factories, the government, and aff ected parties. Factories incur the cost of abatement to meet standards. Th e eff ected people incur the cost of public litigation cases and the cost of organizing themselves as a society. Th e govern-ment incurs the cost of fi nancial incentives provided to the factories. We now discuss a method of estimating cost to factories is given with a case study. Given a threat of closure or legal action by an association of aff ected people, small-scale industries in an industrial estate are made to reduce pollution to meet prescribed standards. Th e industries have a choice between the following technologies for meeting the standards: (i) in house treatment, (ii) CETP, and (iii) a mix of both. Given the scale economies in water pollu-tion abatement, in house treatment is not economical for small-scale enterprises. A survey of pollution abate-ment practices of isolated industries (Murty et al. 1999) shows that the capital cost of an effl uent treatment

Water Pollution in India 295
plant for meeting water pollution standards for small-scale enterprises is almost equal to the capital cost of the main plant. Th erefore, industries may prefer to go for a CETP, which is possible only if they are located as a cluster in an industrial estate. Th ey can have a CETP only if there is a contract among the factories about (i) sharing capital and the operating costs, (ii) the prices charged for treating the pollutants, and (iii) the quality of infl uent accepted by CETP. Industrial estates normally contain heterogeneous factories belonging to diff erent industries with varying pollution loads and concentrations. As the members of the CETP, the member factories are required to sup-ply wastewater of a standard quality, therefore, some of the factories may have to do some ‘in house treat-ment’ of their wastewater to bring the water pollution concentration at the agreed level before standing to the CETP for effl uents treatment. Th erefore, the cost of water pollution abatement in an industrial estate may also consist of in house treatment costs and the cost of CETP. In this model, government regulators have still a role to play. But their role is not creating and enforcing environmental standards. It is merely a catalytic role of providing information about the environmental programmes designed and available cleaner technolo-gies, and providing some fi nancial incentives to local communities. Th erefore, this new model constitutes a regulatory triangle consisting of the local community, the market, and the government.
Economic Instruments and Institutions
Th e discussion so far indicates that choices for policy responses will involve some mix of regulatory and mar-ket-based instruments, but this policy analysis must be done with respect to specifi c problems that need to be solved. Based on an analysis of the application of incentive based policies in other countries, Table 19.4 provides an inventory of economic instruments avail-able and the targets that they are supposed to address. Th e fi rst three policy options are suited for munici-palities’ to reduce water pollution and the remaining policy options are better suited for reducing industrial water affl uent. To address the problem of urban waste-water treatment for better handling of organic wastes coupled with chronic revenue shortages for such invest-ments, introduction of wastewater user fees could be a strong consideration. Similarly, as a potential corollary to enhanced revenues from higher service fees (and possible partial privatization), considering increased government subsidies for wastewater treatment system development—common in many countries—is also deemed to merit a careful analysis. Groundwater con-tamination has been observed from leaking septic fi elds and the dumping of waste from cesspits into canals. It was considered timely for the government to explore providing technical assistance and possibly subsidized sanitation technologies to municipalities to encour-age small-scale environmentally acceptable ways of
Table 19.4 Summary Evaluation of Economic Instruments for Water Quality Management
Economic instrument Principal problem addressed by the instrument
User fees for wastewater treatment Pollution of rivers, canals, and aquatic systems
Subsidies for wastewater treatment facilities Pollution of rivers, canals and aquatic systems
Subsidized pollution control equipment Pollution of rivers, canals, and aquatic systems
Subsidized sanitation Surface and groundwater pollution plus off site impacts
Industrial pollution discharge fees Adverse impacts of industrial pollution
Tradable effl uent discharge permits Adverse impacts of industrial pollution
Voluntary agreements for environmental improvements Potentially address wide range of water quality problems
Environmental damage charges and fi nes Potentially address wide range of water quality problems
Environmental performance bonds Potentially address wide range of water quality problems
Public environmental information disclosure Potentially address wide range of water quality problems

296 India Infrastructure Report 2011
disposing off household sewage in areas unlikely to be served by sewage treatment plants. For reducing industrial water pollution, the govern-ment is providing tax rebates on the use and imple-mentation of pollution reduction equipment. Th is is analogous to the subsidization of water-saving technol-ogies. Note that the reduction of tariff s on the import of pollution control equipment could create incentives for increased pollution abatement and higher quality domestic production of environmental technologies. Similarly, various voluntary agreement options, such as enhanced self-monitoring of effl uent discharges by industry, hold promise for introducing positive new relationships between the government and individual enterprises, municipalities, industry associations, com-munity groups, and/or other entities to encourage a less polluting behaviour. Th e Indian experience shows that most of the action for reducing pollution is the result of public interest litigation (PIL) cases fi led by various organizations in courts. Th erefore, public environmen-tal information disclosure can be an important tool for addressing the environmental problems in India. Great-er disclosure of environmental information—perhaps starting with public dissemination of data from Envi-ronmental Impact Assessments and ambient environ-mental quality data collected by various agencies—can be used to hold those damaging the environment more accountable to the public and their fi nanciers. Effl uent discharge tax or fees and tradable effl uent discharge permits are the most popular incentive based policy options for reducing industrial pollution. Fees for industrial effl uent discharge help in raising rev-enues and encourage the polluters to reduce pollution. Similarly, maximum discharges could be established for various types of discharges and tradable permits allo-cated among dischargers to lower compliance costs for achieving specifi ed goals. At present the country is considering the implemen-tation of economic instruments for reducing air pollu-tion, both domestic and global. Th e country is looking at avenues of controlling air pollution to reduce pollu-tion through schemes like renewable energy certifi cates (RECs) and perform, achieve, and trade (PAT). Pilot schemes are also being conducted for pollutants like sulphur dioxide (SO2) and nitrogen oxide (NOx). Th e implementation of these schemes requires the setting up of meaningful emission caps and allocating per-
mits; establishing an accurate monitoring mechanism; establishing the appropriate baseline based on the data that is currently available; identifying the appropriate institutional framework to manage the mechanism; and creating a legal framework necessary to manage emission of pollutant through market mechanism. However, unlike air pollution tradable permit schemes, water affl uent trading programmes require spatial dis-tribution of non-uniformly mixed pollution. Th ough theoretically this issue has been addressed in literature, establishing trading ratios that vary by each potential trading partner pair is diffi cult in practice. Signifi cant institutional adjustments are required that will take time to address and, therefore, warrant immediate attention. Within MoEF and pollution control boards, there appears to be an acute shortage of professionals with training in resource and environ-mental economics required for conducting a further analysis of economic instruments. Further, information is needed on the availability of staff in the context of a broader needs analysis for institutional strengthening. Th e same constraints and needs would seem to apply to other government agencies with water management responsibilities. In the meantime, consideration should be given to creating capacity for economic analysis within the MoEF and pollution control boards, perhaps by adding an environmental and resource economics section. Th is section could also be tasked with coordi-nating the needs assessment and even be drawn upon to help with in house training, where warranted. A second set of institutional adjustments is needed to build a stronger working network of agencies responsible for water management within the country. If acceptable, it would seem appropriate for MoEF and the pollution control boards to take the lead. With MoEF remain-ing as the lead authority in the water pollution sector, much stronger outreach to and engagement of related ministries and their associate bodies is needed if the recommendations relating to specifi c economic instru-ments identifi ed as promising are to be acted upon in the interest of improving water resource management in the country.
Policy ImplicationsMeasuring water pollution, estimating benefi ts from reduced pollution, and designing regulatory instru-ments for environmental improvements require inter-

Water Pollution in India 297
disciplinary approaches. Detailed studies are needed to establish relationships between pollution at sources and ambient pollution of surface water bodies and ground-water resources. Some useful work on river quality modelling has been already going on in India but many more studies are needed for identifying the changes in water quality due to anthropogenic activities. Data of physical accounts of environmental changes are needed for the valuation of environmental services and the design of environmental policy instruments. Environmental valuation is central for natural re-source management. It is required for designing an en-vironmental policy and environmental accounting for estimating a green GDP. Environmental value could be measured either as cost of abatement of environmental changes or the value that the households place on these changes. Th ere are already a few studies about benefi ts and costs of water pollution abatement in India but many more detailed studies are needed. Th ere is an urgent need of increasing the number of monitoring stations in India to levels found in de-veloped nations for eff ective monitoring. Moreover, presently the scope of monitoring is limited to con-ventional compounds (such as BOD, total suspended solids, faecal coli form, and oil and grease), which needs to be expanded to non-conventional pollutants, such as ammonia, chlorine, and iron also which have hazardous health impacts. Eff ective regulation requires that the monitoring responsibilities should be devolved to the states and further down to local bodies. An eff ective industrial water pollution regulation policy requires the use of a combination of regulatory instruments consisting of economic instruments of pollution taxes and marketable permits, informal regu-lation by local communities, and direct public invest-ments for environmental improvements. India still uses command and control regulatory instruments for water pollution abatement resulting in some big industries having effl uent treatment plants and many industrial estates housing small-scale industries having common effl uent treatment plants. However, their eff ectiveness in reducing water pollution is unclear. Th e top-down regulatory approach, in which the government plays a central role, has become ineff ective in India because of high monitoring and enforcement costs and the quality of the regulator or the government. Some recent devel-
opments in India show that informal or voluntary regu-lation by local communities has resulted in some big industries complying with safe pollution standards. In India, municipalities have the treatment capacity only for about 30 per cent of the wastewater gener-ated in urban areas. Th is evidently indicates a gloomy picture of sewage treatment, which is the main source of pollution of rivers and lakes. To improve the water quality of rivers and lakes, there is an urgent need to in-crease the sewage treatment capacity and its optimum utilization. Moreover, as recognized by CPCB (2008), operations and maintenance of existing plants and sew-age pumping stations is also very poor. Municipalities lack fi nancial resources and skilled manpower capacity and as a result the existing treatment capacity remains underutilized in a number of cities. Municipal authori-ties should realize the problem of pollution of water bodies and pay attention to their liability to set up sewage treatment plants in cities and towns to prevent this pollution. Conditioning intergovernmental fi scal transfers from state governments to local bodies on the basis of wastewater treated could be an eff ective instru-ment for strengthening the fi nancial position of mu-nicipalities (Kumar and Managi 2010). It will not only strengthen the fi nancial position of local governments but also help in addressing the problem of domestic water pollution. India should give emphasis on developing a 100 per cent treatment capacity up to the secondary level of treatment (CPCB 2008). Treated water can be used for irrigation purposes and for recharging replenish-ing groundwater. Industries should be encouraged to re-use treated municipal wastewater. Revenue obtained from the sale of treated wastewater for irrigation and industrial purposes could be used to supplement sew-age treatment costs. Note also that though India has defi ned wastewater discharge standards for the domestic and industrial sectors, there are no discharge standards for the pol-lution emanating from agriculture. Agriculture is the source of non-point water pollution and agricultural water pollution is linked, among other things, to the use of fertilizers and pesticides. Th erefore, corrections in fertilizer and pesticide and electricity pricing policies could be an instrument for addressing the non-point water pollution in India.

298 India Infrastructure Report 2011
References
Bhalla, G.S., Peter Hazell, and John Kerr (1999), ‘Prospects for India’s Cereal Supply and Demand to 2020’, 2020 Brief No. 63, International Food Policy Research Insti-tute, Washington DC.
Central Pollution Control Board [CPCB] (2008), Status of Water Supply, Wastewater Generation and Treatment in Class-I Cities and Class-II Towns of India, Control of Urban Pollution Series, CUPS/70/2009-10, New Delhi.
———— (2009), ‘Status of Water Quality in India—2009’, Monitoring of Indian Aquatic Resources Series, MINARS/ /2009-10, New Delhi.
Coase, R.H. (1960), ‘Th e Problem of Social Cost’, Journal of Law and Economics, Vol. 3, pp. 1–44.
Datt, D., S.C. Garg, G.K. Kadekodi, K.K. Narang, D. Sharma, and J.P. Singh (2004), ‘Environmental Fiscal Reform in India: Issues and Some Steps Forward’, (Draft), TERI, New Delhi.
Government of India (1997), Report of the Task Force to Evaluate Market Based Instruments for Industrial Pollu-tion Abatement, submitted to the Ministry of Environ-ment and Forests.
Gupta, S. and B. Goldar (2005), ‘Do Stock Markets Penal-ize Environment-unfriendly Behaviour? Evidence from India’, Ecological Economics, Vol. 52, pp. 81–95.
Gupta, D.B., M.N. Murty, and R. Pandey (1989), ‘Water Conservation and Pollution Abatement in Indian Industry: A Study of Water Tariff ’, (mimeo), National Institute of Public Finance and Policy, Delhi.
Kumar, Surender and Shunsuke Managi (2009), Economics of Sustainable Development: Th e Case of India, Springer, New York.
———— (2010), ‘Compensation for Environmental Ser-vices and Intergovernmental Fiscal Transfers: Th e Case of India’, Ecological Economics, Vol. 68, pp. 3052–9.
Maria, A. (2003), ‘Th e Costs of Water Pollution in India’, paper presented at the conference on Market Develop-ment of Water & Waste Technologies through Environ-mental Economics, 30–1 October 2003, Delhi.
McKenzie, David and Isha Ray (2004), ‘Household Water Delivery Options in Urban and Rural India’, Working Paper No. 224, Stanford Centre for International De-velopment, Stanford University, USA.
Mehta, S., S. Mundle, and U. Sankar (1994), Controlling Pollution: Incentives and Regulation, Sage Publications, New Delhi.
Misra, S. (1999), ‘Water Pollution Abatement in Small-Scale Industries: An Exploration of Collective Action Possi-
bilities in Nandesari Industrial Area in Gujarat’, PhD Th esis, University of Delhi.
Murty, M.N. (2008), ‘Policy Responses to Ecosystem Con-servation in Hindukush Region’, Discussion Paper, ‘Ecosystem Services and Poverty Alleviation Study in South Asia (ESPASSA): A Situation Analysis for India and the Hindu-kush Himalayan Region, Annex 3’, TERI, New Delhi.
Murty, M.N. and Surender Kumar (2002), ‘Measuring Cost of Environmentally Sustainable Industrial Development in India: A Distance Function Approach’, Environment and Development Economics, Vol. 7, pp. 467–86.
———— (2004), Environmental and Economic Accounting for Industry, Oxford University Press, New Delhi.
Murty, M.N., A.J. James, and Smita Misra (1999), Econom-ics of Water Pollution: Th e Indian Experience. Oxford University Press, New Delhi.
Murty, M.N. and U.R. Prasad (1999) ‘Emissions Reduction and Infl uence of Local Communities in India’, in M.N. Murty, A.J. James, and Smita Misra (eds), Economics of Industrial Pollution Abatement: Th eory and Empirical Evidence from the Indian Experience, Oxford University Press, Delhi.
Pandey, Rita (1998), ‘Pollution Taxes for Industrial Water Pollution Control’, (mimeo), National Institute of Public Finance and Policy, New Delhi.
Pargal, S. and D. Wheeler (1996), ‘Informal Regulation of Industrial Pollution in Developing Countries: Evidence from Indonesia’, Journal of Political Economy, Vol. 104, pp. 1314–27.
Parikh, J. (2004), ‘Environmentally Sustainable Development in India’, available at http://scid.stanford.edu/events/India2004/JParikh.pdf last accessed on 22 August 2008.
Rajaram, T. and A. Das (2008), ‘Water Pollution by Indus-trial Effl uent in India: Discharge Scenarios and Case for Participatory Ecosystem Specifi c Local Regulation’, Futures, Vol. 40, pp. 56–69.
World Bank (1999), Greening Industry: New Roles for Com-munities, Markets, and Governments, Oxford University Press, New York.
World Health Organization [WHO] (2007), Guidelines for drinking-water quality, Incorporation First Addendum, Volume 1, Recommendations, Th ird edition, WHO, Geneva.