MMembers b em ers ee ng MMeeting ti - Centers for ... Report – Clinical Document Laboratory System...
44
em ers ee ng M b M ti Members Meeting Friday, March 19, 2010 12:15 – 1:30 p.m. Montreal/Vancouver Room
Transcript of MMembers b em ers ee ng MMeeting ti - Centers for ... Report – Clinical Document Laboratory System...

em ers ee ng
M b M tiMembers Meeting
Friday, March 19, 2010 12:15 – 1:30 p.m.
Montreal/Vancouver Room
–
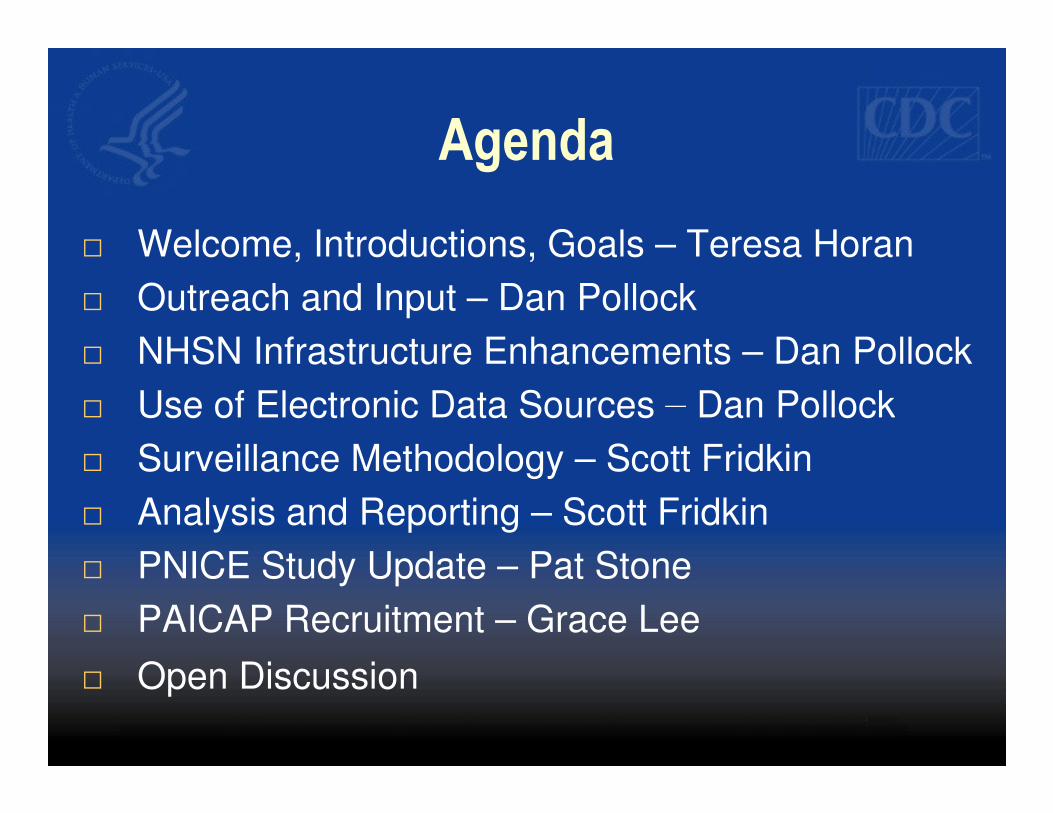
Agenda
□ Welcome, Introductions, Goals – Teresa Horan
□ Outreach and Input – Dan Pollock
□ NHSN Infrastructure Enhancements – Dan Pollock
□ Use of Electronic Data Sources – Dan Pollock Dan Pollock □ Use of Electronic Data Sources
□ Surveillance Methodology – Scott Fridkin
□ Analysis and Reporting – Scott Fridkin
□ PNICE Study Update – Pat Stone
□ PAICAP Recruitment – Grace Lee
□ Open Discussion

□ Collaborating with the Center for Medicare and
NHSN Outreach and Input (1)
□ NHSN Training and User support team
□ NHSN State Users group
□ New state HAI program funded through American
Recovery and Reinvestment Act (ARRA) of 2009
□ Collaborating with the Center for Medicare and
Medicaid Services (CMS):
- Quality Improvement Organization (QIO)
program
- Reporting Hospital Quality Data for the Annual
Payment Update (RHQDAPU) program

NHSN Outreach and Input (2) □ Collaborating with the Agency for Healthcare
Research and Quality (AHRQ):
- Comprehensive Unit-based Safety Program
(CUSP)
- Patient Safety Organization (PSO) program
□ Roll out of the U.S. Department of Health and
Human Services Office of Public Health and
Science on the HHS Action Plan for HAIs
- Feedback from NHSN users at regional
meetings n Chicago, Denver, Seattle
□ Conferring regularly with the NHSN Steering Work
Group

,
–
NHSN Outreach and Input (3) NHSN Steering Work Group Members & Liaisons
NHSN sites – Elise McKee, Teresa Accuntius,
Connie Steed, Ellen Smith, Dana Trocino
State Health Departments – Rachel Stricof (NY), Steve Ostroff (PA), Neil Pascoe (TX)
HICPAC – Russ Olmstead
CDC – Chesley Richards, Joe Perz, Gautam Kesarinath CDC Chesley Richards, Joe Perz, Gautam Kesarinath, Ahmed Gomaa, Nancy Sonnenfeld
CMS – Barry Straube (or Paul McGann)
AHRQ- Bill Munier (or Amy Helwig)
SHEA – Henry Blumberg (or Lisa Maragakis, Jesse Jacob)
APIC – Patti Grant
AHA – Kathy Ciccone (or Mary Therriault)
CSTE – Marion Kainer
ASTHO – James Kirkwood (or Belinda Haerum)

type, location and server load
NHSN Performance and Infrastructure Enhancements
• Installed performance widgets on every
NHSN web page to measure user wait
times as a function of time of day, request
type, location and server load
• Currently monitoring this dataset and have
a baseline from which to measure
progress.

Performance Improvements (to be completed in the coming months)
• Re-engineer the NHSN database
• Reduce page sizes so that pages will
load faster
• Streamline data input screens so that
entering data will be easier
• Move away from the use of digital
certificates to passwords
• Increase our ability to receive electronic
messages to reduce manual data entry
burden

NHSN Performance Improvements: Initial Results
• Though most of the improvements are still in
the testing phase, we have moved into
production, new streamlined versions of our
database queries for group reporting database queries for group reporting
• On average we have seen an overall
reduction of the time it takes to perform a
query by 28% and individual queries by as
much as 83%

Use of Electronic Data Sources: Collaboration Needed
Public
Health
Healthcare
Assuring
Subject
Matter
Experts
Payors and Regulators
Standard Setting
Bodies
Information Technology
Suppliers
Assuring Sound Surveillance
Methods, Successful Implementations, and
Wide Benefits

-
Where We Are Today: Dependent on Manual Processes
Paper records
Manual
Processes - Case finding - Data collection
NHSNNHSNNHSNNHSN ServersServersServersServersNHSN web interfaceNHSN web interfaceNHSN web interfaceNHSN web interface ––––
reporting, analysis,reporting, analysis,reporting, analysis,reporting, analysis, and data sharingand data sharingand data sharingand data sharing
Data collection
- Data entry
Disparate electronicDisparate electronicDisparate electronicDisparate electronic data sourcesdata sourcesdata sourcesdata sources

Data collectionData collectionData collectionData collection
Where We Want to Go Over the Next 10 Years
EEEElllleeeeccccttttrrrroooonnnniiiicccc rrrreeeeccccoooorrrrddddssss
AutomatedAutomatedAuA tomatedutomated PPPPrrrroooocccceeeesssssssseeeessss
NNNNHHHHSSSSNNNN ddddaaaattttaaaa CCCCaaaasssseeee ffffiiiinnnnddddiiiinnnngggg ttttrrrraaaannnnssssffffeeeerrrr DDDDaaaattttaaaa ccccoooolllllllleeeeccccttttiiiioooonnnn
Data entryData entryDatDa a entryta entry NNNNHHHHSSSSNNNNNNNNHHHHSSSSNNNN
SSSSeeeerrrrvvvveeeerrrrssss
NNNNHHHHSSSSNNNN wwwweeeebbbb iiiinnnntttteeeerrrrffffaaaacccceeee –––– IIIInnnntttteeeerrrrooooppppeeeerrrraaaabbbblllleeee vvvviiiissssuuuuaaaalllliiiizzzzaaaattttiiiioooonnnn,,,, aaaannnnaaaallllyyyyssssiiiissss,,,, EEEElllleeeeccccttttrrrroooonnnniiiicccc DDDDaaaattttaaaa aaaannnndddd ddddaaaattttaaaa sssshhhhaaaarrrriiiinnnngggg SSSSoooouuuurrrrcccceeeessss

Future use beginning 2010
Clinical Document Architecture (CDA): A StandardsBased Solution for Electronic
Reporting to NHSN
Initial use beginning December 2009
• Bloodstream infections and summary denominator
• Surgical Site Infection and procedure denominator
Future use beginning 2010
• Urinary tract infections
• Central line insertion practices
• Laboratory-identified multi-drug resistant organism (MDRO)
or Clostridium difficile-associated disease (CDAD) events
• MDRO or CDAD infections
• Pneumonia

Pharmacy
Sending Sites use ADT, Lab, and Clinical Data to Detect Cases and Submit Electronic Reports
NHSN
Admission Discharge TransferAdmission Discharge TransferAdmission Discharge TransferAdmission Discharge Transfer (ADT) System(ADT) System(ADT) System(ADT) System
InfectionInfectionInfectionInfection ControlControlControlControl SystemSystemSystemSystem HAI Report –
Clinical Document
Laboratory
System
Current
NHSN web interfaceNHSN web interfaceNHSN web interfaceNHSN web interface visualization, analysis,
and data sharing
NHSN
Servers
ElectronicElectronicElectronicElectronic Health RecordHealth RecordHealth RecordHealth Record
SystemSystemSystemSystem
Document Architecture
(CDA) file
Pharmacy
System
Clinical DepartmentalClinical DepartmentalClinical DepartmentalClinical Departmental SystemSystemSystemSystem
Future

-
Use of Electronic Data Sources: Guiding Principles
• Work closely with IT vendors
• Collect only the minimum necessary data for use
in the NHSN application
• Use standards-based Clinical Document • Use standards based Clinical Document
Architecture CDA approach
□ Much of the processing and denominator calculations occur within the IT vendor software at the sending facility

NHSN Surveillance Methodology
Developments • Algorithmic detection
• EIP NHSN Network
• Antimicrobial Use/Resistance Module
• PNEU• PNEU
• Areas of Attention
– SSI Procedure specific denominator data
– Pediatrics
– Long Term Care
– Hemodialysis
– Ambulatory Surgery
-
-
- -
-
-
-
-
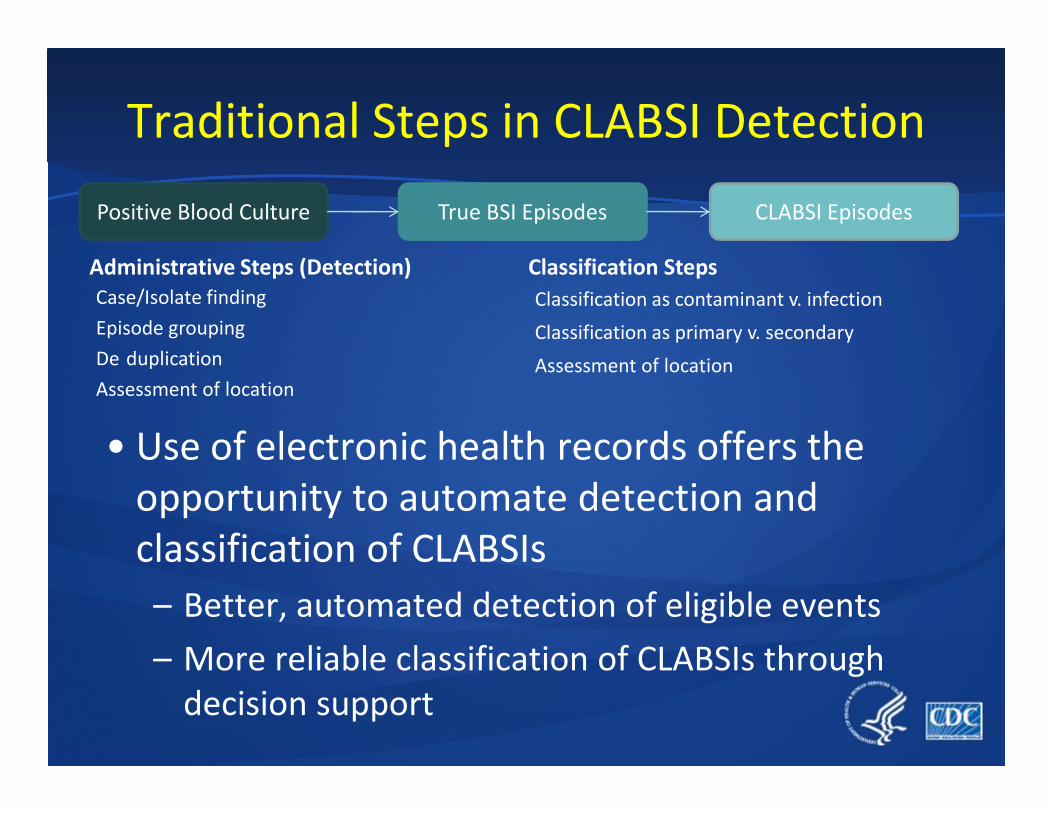
Traditional Steps in CLABSI Detection
Positive Blood Culture True BSI Episodes CLABSI Episodes
Administrative Steps (Detection)
Case/Isolate finding
Episode grouping
De duplication
Assessment of location
Classification Steps
Classification as contaminant v. infection
Classification as primary v. secondary
Assessment of location
• Use of electronic health records offers the
opportunity to automate detection and
classification of CLABSIs
– Better, automated detection of eligible events
– More reliable classification of CLABSIs through
decision support

2010 Chicago EpiCenter/CDC/Premiere
Reference standard project high level overview
•20 NHSN facilities also reporting microbiology data centrally (vendor)
•Stratified random sample positive blood culture isolates (N=1000)
2 External Expert review of
episodes
(reference standard)
Existing IP determinations
(already reported to NHSN) (reference standard)
Conduct multivariate analysis to generate models that predict CLABSIs
based on patient and culture characteristics (location, organism, length of stay)
√ classify episode based CLABSI probability estimates
√ Develop decision support using probability estimates
√ Develop a CLABSI proxy measure
Incorporate
algorithms into
NHSN methods

nua a a en ry no re
Medication associated Module
Antimicrobial Use and Resistance Option
AUR Pharmacy AUR Microbiology
Obstacles to useful surveillance
• Ma l d t t t • Hi d 80%
Steps taken to enhance AUR
http://www.cdc.gov/nhsn/psc_ma.html
• Manual data entry not
sustainable
• Limited ability to expand
antimicrobial list
• Advancing science of
measurement
• DDD problematic for
benchmarking
• Source of data not standard
• Hired 80%
Pharmacoepidemiologist
• Experts Meeting to
• Prioritize utility of
surveillance
• Define best metrics
• Refine best methods
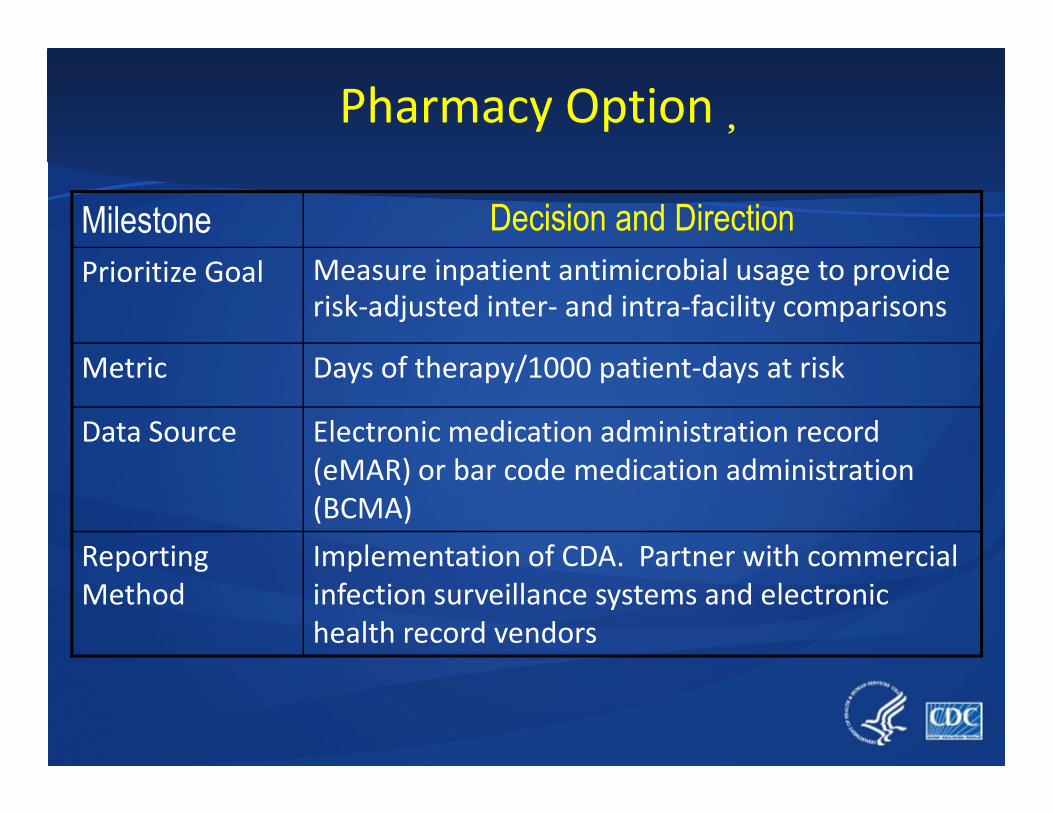
Pharmacy Option�
Milestone Decision and Direction Prioritize Goal Measure inpatient antimicrobial usage to provide
risk-adjusted inter- and intra-facility comparisons
Metric Days of therapy/1000 patient-days at risk
Data Source Electronic medication administration record
(eMAR) or bar code medication administration
(BCMA)
Reporting
Method
Implementation of CDA. Partner with commercial
infection surveillance systems and electronic
health record vendors

CDC Emerging Infections Program�
EIP
FoodNet ABCs Hepatitis HPV Influenza HAIC�
••�Cooperative Agreement/Collaborative with 10 State Health Cooperative Agreement/Collaborative with 10 State Health
Departments
• Core surveillance for food borne, respiratory, and select other
issues
• Added Healthcare-Associated Infections – Community
Interface in 2009/2010 (HAIC EIP Activity)

– o states ave some man ates, expect a out
7 f 10 h d b 200
EIP-HAIC NHSN-Related Focus Areas
• NHSN networks
– Each site to recruit facilities to join NHSN
– Facilities will share data for the purpose of performing
surveillance innovation and other EIP HAIC projects
– 7 of 10 states have some mandates, expect about 200
facilities across 10 states
• HAI surveillance innovation
– Use EIP NHSN network facilities to perform projects aimed
at reducing the burden of data collection and reporting
– First effort = simplification of CLABSI denominator data
collection

epor ng a a rom
Analysis and Reporting
• Facility use/reporting
– SSI Risk Models over NNIS Risk Index
– Enhancements
• R ti d t f CDC • Reporting data from CDC
– State Summary HAI data
– Validation issues
– Access of data to inform prevention among
hospital groups

a ven orm ange or s an ar za on an mp emen a on
• Facility-wide locations defined more clearly for LabID Event reporting
• Enhancements to speed of application (page refresh, dataset generation)
• Creating alerts for missing denominators and zero events/numerators
• Removing forced regeneration of datasets
• Developing audit log for tracking user edits
• Adding ability to analyze by State
• Updating Custom Fields for easier utilization
• Required fields for denominator for Procedures under review
Planned NHSN Improvements (based on identified reporting and analysis issues)
• Adding ability to confer rights beyond 2010
• CBGB and CBGC procedures cannot both be entered for same day
• CLIP form revised for faster data entry
• New patient-care locations defined for mixed acuity bed areas
• L bID E t f ch d f t d di ti d CDA i l t ti
▀ Q2 ▀ Q3 ▀ Q4 or later Timeline:
• LabID Event form changed for standardization and CDA implementation�
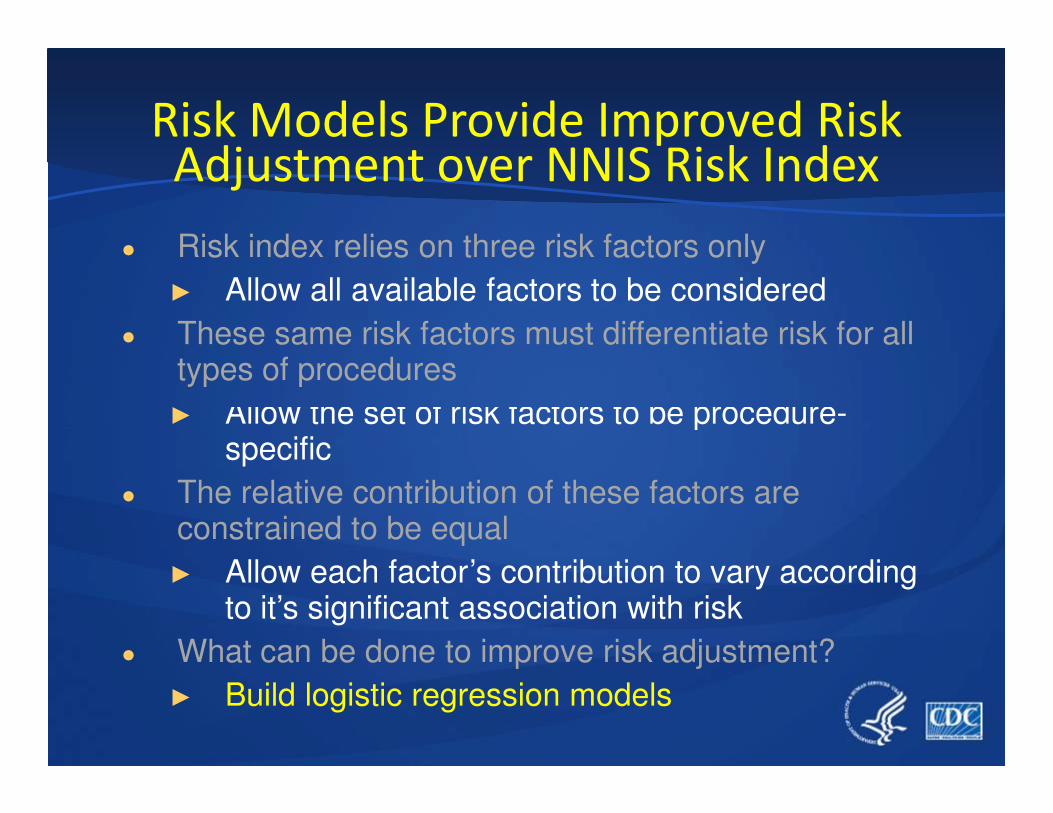
ow t e set o r actors to e proce ure-
All h f isk f b d
► Allow the set of risk factors to be procedure
● The relative contribution of these factors are constrained to be equal
► Allow each factor’s contribution to vary according to it’s significant association with risk
● What can be done to improve risk adjustment?
► Build logistic regression models
Risk Models Provide Improved Risk Adjustment over NNIS Risk Index
● Risk index relies on three risk factors only
► Allow all available factors to be considered
● These same risk factors must differentiate risk for all types of procedures
►
specific

– epor genera es
R t t
Summary of SSI Risk Index Use • CDC develops unique logistic regression model for
each procedure (J Edwards, Sunday 2:00 SSI symp)
• NHSN Application changed
– Probability for infection calculated for every operation
(with denominator data)
– Report generates
• “Expected” (E) infections by Procedure, surgeon, date range, etc.
• “observed” (O) infections (entered by IP)
• Standardized Infection Ratio: O/E
– Uses 2006-2008 NHSN data for reference comparison
• <1.0 then fewer infections than predicted given the risks of
all patients
– Data can be aggregated at various levels

State Obscured
Standardized Infection Ratio:
No. expected / no. observed
State-Summary Report of HAI Data
Reported to NHSN
• Public report limited to states with mandate
• Sharing summary data with state officials
• Encouraging all facilities to work with state officials
State Obscured

Training of expert reviewers Training at CDC, and audits by reviewers at a sample
Possible NHSN Validation Initiatives
Validation Initiative Examples
State-based validation Provide states with validation toolkit: data
collection form, database, sampling scheme of
facilities
Facility-based validation Provide facility with self-validation toolkit
Training of expert reviewers Training at CDC, and audits by reviewers at a sample
of sites
Proficiency testing of NHSN users Use of standardized cases
Comparison of NHSN data with
external data systems Medical Provider Analysis Review (MEDPAR)
Isolate testing Collection of a sample of isolates from EIP sites
Informatics approaches Audits built into system, thresholds and systematic
check of outliers
Patricia Stone, Principal Investigator
Prevention of Nosocomial Infections and�Cost-Effectiveness Analysis (PNICE Study)�
Funded by the National Institute of Nursing Research Grant #R01NR010107
Conducted in collaboration by investigators and consultants from Columbia�University School of Nursing, RAND, CDC, IHI, Joint Commission, Southwestern�Medical Center, Harvard, University of Pittsburgh, University of Maryland, and�
the University of Illinois in Chicago�
Patricia Stone, Principal Investigator
Phone : 212 305-1738
Fax : 212 305-6937
E-mail: [email protected]
Monika Pogorzelska, Project Coordinator
Phone: 212 305-3431
Fax : 212 305-6937
E-mail : [email protected]

• To estimate long-term health and cost
Study Aims
• To describe infection control staffing and
resource allocation
• To describe infection control activities in ICUs�
• To estimate long-term health and cost
outcomes attributable to healthcare
associated infections
• To investigate the cost effectiveness of
infection control practices
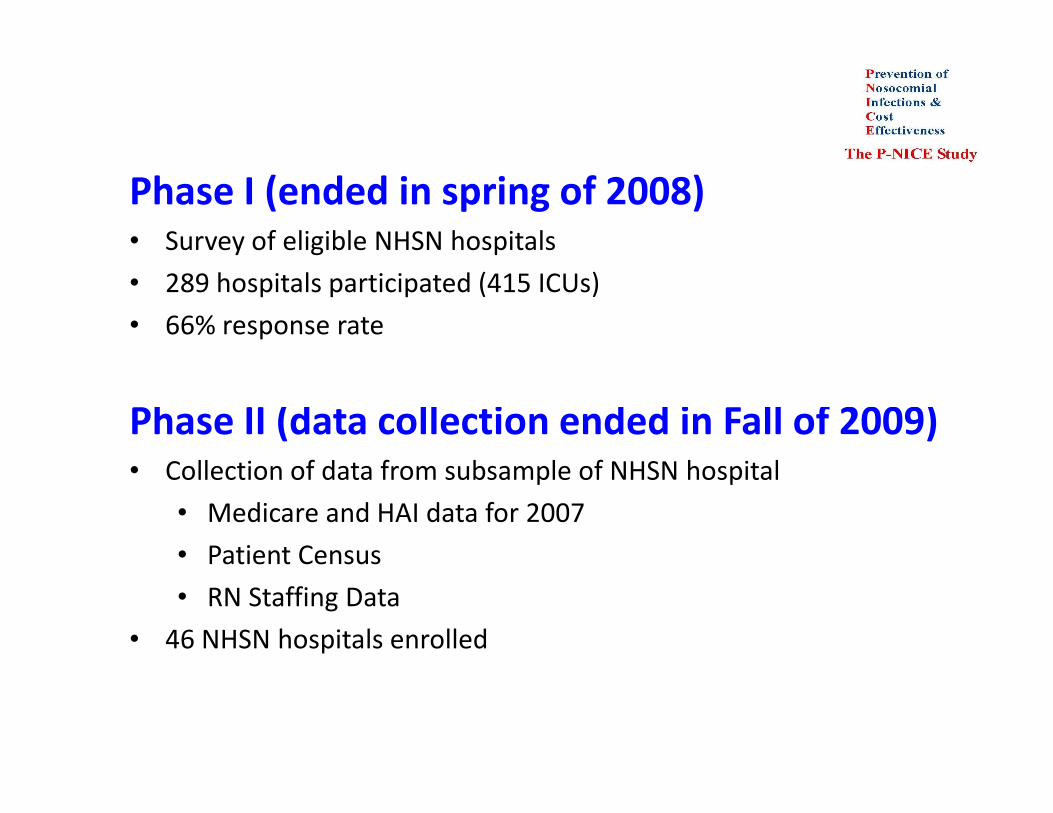
Phase II (data collection ended in Fall of 2009)
Phase I (ended in spring of 2008) • Survey of eligible NHSN hospitals
• 289 hospitals participated (415 ICUs)
• 66% response rate
Phase II (data collection ended in Fall of 2009)�• Collection of data from subsample of NHSN hospital
• Medicare and HAI data for 2007
• Patient Census
• RN Staffing Data
• 46 NHSN hospitals enrolled


Me
an
I F
TE
Decreased IP Staffing in 2008�M
ea
n IP
P
FT
E
Infection Preventionist (IP) Full-time Equivalent (FTE) per 100 Beds
2.5
2
Mean
1.5 95% CI
Overall
1 Mean
0.5
0
100 200 300 400 500 600 700 800 900 >900
Number of Beds
• IP Staffing significantly related to hospital size with higher staffing in smaller hospitals (p < 0.001)
• IP FTE staffing was 0.69 (sd�+/- 0.54) per 100 beds
– 1 IP per 144 beds�
• NNIS hospitals in 1999
– I IP per 115 beds�
Stone et al., in press AJIC
uruya , c , erencev c , ogorze s a , o mann , tone .
Presentation at the Decennial
• Central Line Bundle Implementation and Impact on Infection Rates in US Intensive Care Units (ICUs).
F EY Di k A P i h EN P l k M G ld D S PWFuruya EY, Dick A, Perencevich EN, Pogorzelska M, Goldmann D, Stone PW.�
Presented in The Cutting Edge of Infection Prevention: The Top Four Submitted Scientific Papers of the 2010 Decennial
Saturday, 8:30 – 9:30 am in the Centennial Ballroom (Hyatt Regency Atlanta)�
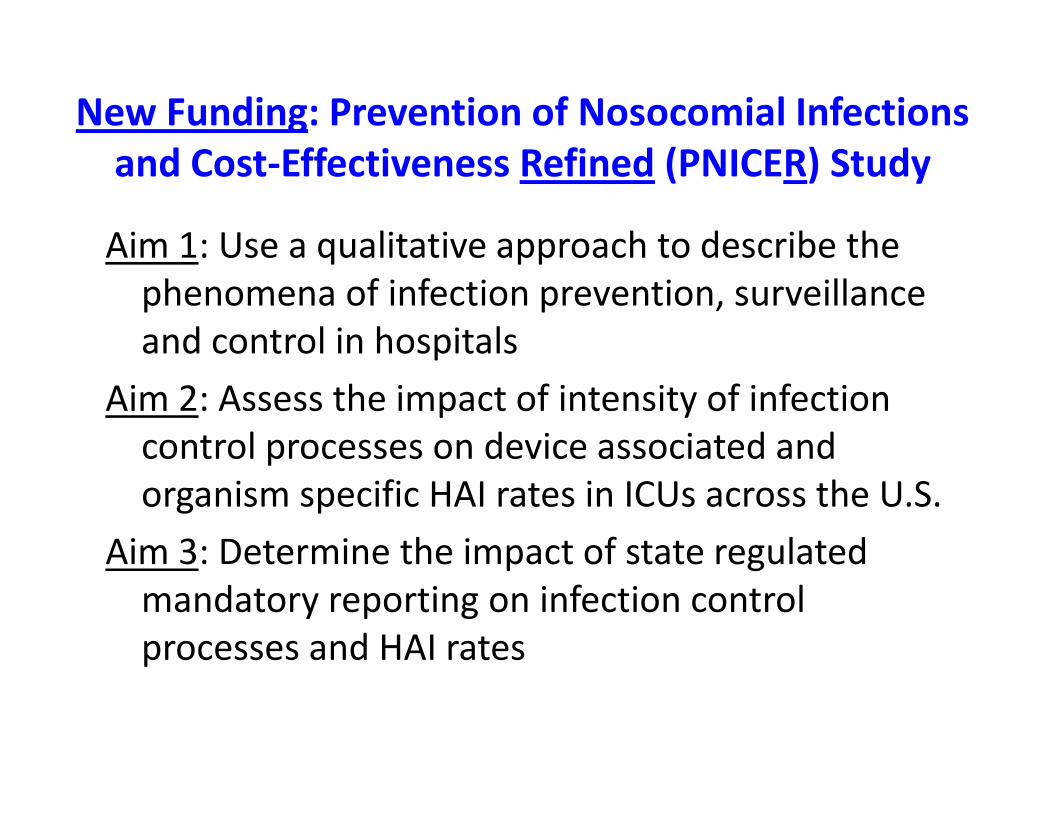
New Funding: Prevention of Nosocomial Infections�and Cost-Effectiveness Refined (PNICER) Study�
Aim 1: Use a qualitative approach to describe the
phenomena of infection prevention, surveillance
and control in hospitals
Aim 2: Assess the impact of intensity of infection Aim 2: Assess the impact of intensity of infection
control processes on device associated and
organism specific HAI rates in ICUs across the U.S.
Aim 3: Determine the impact of state regulated
mandatory reporting on infection control
processes and HAI rates

PNICER Timeline
Phase I:
• Summer/Fall 2010
• Qualitative in-depth interviews in 12 hospitals that participated in PNICE – Interviews with multiple personnel including IPs, HEs, hospital
administrators, nurses and ancillary service personnel
– $1000 honorarium per hospital ($100 per participant)
Phase II:
• Summer 2011
• Web-based survey of eligible NHSN hospitals – Collect up to 6 years of ICU specific NHSN data (2006-2011)�

P-NICE Study Website�
http://cumc.columbia.edu/studies/pnice/

Ad ustin Pa ment PAICAP
The PAICAP Project Conducted by Harvard Medical School and Harvard Pilgrim Health Care Institute
Preventing Avoidable
Infectious Complications by
Adjusting Payment (PAICAP) g y ( )j
Grace M. Lee, MD MPH
Harvard Medical School & Harvard
Pilgrim Healthcare Institute
AHRQ-R01HS018414-01

complications (NPPC) on health
The PAICAP Project Conducted by Harvard Medical School and Harvard Pilgrim Health Care Institute
Goal To assess the impact of Medicare’s policy of nonpayment for preventable
complications (NPPC) on health outcomes and costs in U.S. hospitals.

reported by NHSN (i.e. “true” infection rates)
The PAICAP Project Conducted by Harvard Medical School and Harvard Pilgrim Health Care Institute
Specific Aims 1.To evaluate the impact of NPPC on HAI rates
reported by Medicare (i.e. “billing” rates)
2.To evaluate the impact of NPPC on HAI rates reported by NHSN (i.e. “true” infection rates)
3.To explore whether NPPC has the intended impact of reducing both “billing” and “true” infection rates
4.To assess whether reduced reimbursement for HAIs disproportionately affects hospitals that care for a high proportion of poor and minority patients
Sign-up sheet, website, email, phone
The PAICAP Project Conducted by Harvard Medical School and Harvard Pilgrim Health Care Institute
To Participate Hospitals that report to NHSN are eligible
Please let us know you are interested! Sign-up sheet, website, email, phone
Time Commitment 15-20 min in total to join the NHSN
PAICAP group

presentations or publications
The PAICAP Project Conducted by Harvard Medical School and Harvard Pilgrim Health Care Institute
We are committed to protecting confidentiality
No patient identifiers needed
Your hospital will NOT be identified in any presentations or publications
Benefits
Participants will receive regular updates on study findings over the next 4 years
You can play a key role in helping policymakers shape future healthcare decisions
Don Goldmann IHI
The PAICAP Project Conducted by Harvard Medical School and Harvard Pilgrim Health Care Institute
Policy Advisory Board
Scott Fridkin (CDC)
Don Goldmann (IHI) )(
Denise Graham (APIC)
John Jernigan (CDC)
William Kassler (CMS)
Infection Prevention Advisory Board
Vicky Fraser (Wash U)
Teresa Horan (CDC)
Susan Huang (UC Irvine)
John Jernigan (CDC)
Jeanmarie Mayer (Utah)
Kurt Stevenson (OSUMC)
Bob Weinstein (Rush/Stroger)
Deborah Yokoe (HMS/BWH)

Email us at [email protected]
Contact Us
www.PAICAP.org
The PAICAP Project Conducted by Harvard Medical School and Harvard Pilgrim Health Care Institute
Email us at [email protected]
1-877-97-PAICAP (1-877-977-2422)
www.APIC.org to link to the PAICAP website

www.cdc.gov/ncidod/dhqp/nhsn.html