MLP Investment Company
54
MLP Investment Company KYN Annual Report November 30, 2017
Transcript of MLP Investment Company
MLP Investment Company
KYN Annual ReportNovember 30, 2017
CONTENTS
Page
Letter to Stockholders . . . . . . . . . . . . . . . . . . . . . . . . . . . . . . . . . . . . . . . . . . . . . . . . . . . . . . . . . . . . . . . . . . . . 1
Portfolio Summary . . . . . . . . . . . . . . . . . . . . . . . . . . . . . . . . . . . . . . . . . . . . . . . . . . . . . . . . . . . . . . . . . . . . . . 6
Management Discussion . . . . . . . . . . . . . . . . . . . . . . . . . . . . . . . . . . . . . . . . . . . . . . . . . . . . . . . . . . . . . . . . . . 7
Schedule of Investments . . . . . . . . . . . . . . . . . . . . . . . . . . . . . . . . . . . . . . . . . . . . . . . . . . . . . . . . . . . . . . . . . . 13
Statement of Assets and Liabilities . . . . . . . . . . . . . . . . . . . . . . . . . . . . . . . . . . . . . . . . . . . . . . . . . . . . . . . . . 16
Statement of Operations . . . . . . . . . . . . . . . . . . . . . . . . . . . . . . . . . . . . . . . . . . . . . . . . . . . . . . . . . . . . . . . . . . 17
Statement of Changes in Net Assets Applicable to Common Stockholders . . . . . . . . . . . . . . . . . . . . . . . . . . 18
Statement of Cash Flows . . . . . . . . . . . . . . . . . . . . . . . . . . . . . . . . . . . . . . . . . . . . . . . . . . . . . . . . . . . . . . . . . 19
Financial Highlights . . . . . . . . . . . . . . . . . . . . . . . . . . . . . . . . . . . . . . . . . . . . . . . . . . . . . . . . . . . . . . . . . . . . . 20
Notes to Financial Statements . . . . . . . . . . . . . . . . . . . . . . . . . . . . . . . . . . . . . . . . . . . . . . . . . . . . . . . . . . . . . 24
Report of Independent Registered Public Accounting Firm . . . . . . . . . . . . . . . . . . . . . . . . . . . . . . . . . . . . . . 42
Privacy Policy Notice . . . . . . . . . . . . . . . . . . . . . . . . . . . . . . . . . . . . . . . . . . . . . . . . . . . . . . . . . . . . . . . . . . . . 43
Dividend Reinvestment Plan . . . . . . . . . . . . . . . . . . . . . . . . . . . . . . . . . . . . . . . . . . . . . . . . . . . . . . . . . . . . . . 45
Information Concerning Directors and Corporate Officers . . . . . . . . . . . . . . . . . . . . . . . . . . . . . . . . . . . . . . . 48
Annual Certification . . . . . . . . . . . . . . . . . . . . . . . . . . . . . . . . . . . . . . . . . . . . . . . . . . . . . . . . . . . . . . . . . . . . . 51
Information Regarding Changes to Investment Policy . . . . . . . . . . . . . . . . . . . . . . . . . . . . . . . . . . . . . . . . . . . 51
Proxy Voting and Portfolio Holdings Information . . . . . . . . . . . . . . . . . . . . . . . . . . . . . . . . . . . . . . . . . . . . . . 51
Repurchase Disclosure . . . . . . . . . . . . . . . . . . . . . . . . . . . . . . . . . . . . . . . . . . . . . . . . . . . . . . . . . . . . . . . . . . . 51
CAUTIONARY NOTE REGARDING FORWARD-LOOKING STATEMENTS: This report ofKayne Anderson MLP Investment Company (“the Company”) contains “forward-looking statements” as definedunder the U.S. federal securities laws. Generally, the words “believe,” “expect,” “intend,” “estimate,”“anticipate,” “project,” “will” and similar expressions identify forward-looking statements, which generally arenot historical in nature. Forward-looking statements are subject to certain risks and uncertainties that could causeactual results to materially differ from the Company’s historical experience and its present expectations orprojections indicated in any forward-looking statements. These risks include, but are not limited to, changes ineconomic and political conditions; regulatory and legal changes; master limited partnership (“MLP”) industryrisk; leverage risk; valuation risk; interest rate risk; tax risk; and other risks discussed in the Company’s filingswith the Securities and Exchange Commission (“SEC”). You should not place undue reliance on forward-lookingstatements, which speak only as of the date they are made. The Company undertakes no obligation to update orrevise any forward-looking statements made herein. There is no assurance that the Company’s investmentobjectives will be attained.
KAYNE ANDERSON MLP INVESTMENT COMPANYLETTER TO STOCKHOLDERS
January 24, 2018
Dear Fellow Stockholders:
It would be easy to start this letter by saying what a difficult year it was for the MLP/Midstream space, butwe believe the full story is far more positive. While stock price performance fell well short of expectations, thefundamentals that drive operating performance improved meaningfully during the year. The operatingenvironment for companies in the midstream sector is much better today than the prior few years, and the MLPsector is on much stronger footing. This backdrop makes us very optimistic about the outlook for the next fewyears — we believe MLPs/Midstream companies are poised to generate very attractive returns.
Taking this a step further, we are optimistic about the Company’s outlook as well. We believe that theportfolio is well positioned to benefit from a recovery in MLP/Midstream valuations, and the Company’s balancesheet is in excellent shape. Tax reform was very positive for the Company’s net asset value per share, and futureperformance will benefit from lower corporate tax rates.
We recognize that the last three years have been very tough for MLP/Midstream investors. Equity prices arewell below their August 2014 peak, have been more volatile than expected and have meaningfullyunderperformed the broader markets. Quite a few MLPs reduced their distributions either directly or indirectly(through simplification transactions) during this downturn. While this should not be a total surprise given themagnitude and duration of the commodity price downturn, this was not how the MLP structure was supposed towork. There are numerous company-specific reasons, but most of the cuts can be linked to (i) more commodityprice volatility (both direct and indirect) in operating results than advertised, (ii) inadequate distribution coverageratios, (iii) commitments to spend capital to build new midstream assets that were predicated on continuedvolume growth and (iv) too much financial leverage. Finally, and perhaps most importantly, the downturnpointed out some weaknesses in the MLP structure – instances where limited partners and the general partnerwere not aligned and the structure did not provide adequate protections for the limited partners. Not only werethese transactions unfavorable for these partnerships’ unitholders, they were bad for the MLP sector as a whole.
We mention these facts in an effort to address some of the sector’s challenges. Much like the energyindustry as a whole, the MLP sector has had to evolve in an effort to respond to the downturn. That evolutionprocess has started, but more progress must be made. We believe that more changes are needed to regain investortrust. We think that most management teams in the MLP sector will be receptive to such changes, and we plan tobe an active participant in helping guide the process.
Industry Outlook
Energy-related commodity prices (most notably crude oil) have recovered very nicely from the multi-yearlows set in early 2016. Crude oil prices are above $60 per barrel and at their highest levels since late 2014.Activity levels for the energy industry have steadily increased over the last two years as the sector has becomevery good at “doing more with less.” Perhaps one of the most astounding statistics in light of the multi-yeardownturn is that the United States is projected to produce record volumes of crude oil, natural gas and natural gasliquids (NGLs) during 2018. Production levels for all three commodities in 2018 will be meaningfully higherthan what the U.S. produced in 2014 even though commodity prices are expected to be substantially lower thisyear than in 2014. This is an impressive accomplishment that should lead to improved operating results forMLPs/Midstream companies and bode well for future stock price performance.
Currently, the U.S. is producing approximately 9.8 million barrels of crude oil and is the third largestproducer of crude oil in the world — trailing only Saudi Arabia and Russia. The current production levels arenearly 1 million barrels per day higher than last year. The EIA is projecting that the U.S. will exit 2018 around10.5 million barrels per day (up 8% year-over-year) and exit 2019 around 11.0 million barrels per day (up
1
KAYNE ANDERSON MLP INVESTMENT COMPANYLETTER TO STOCKHOLDERS
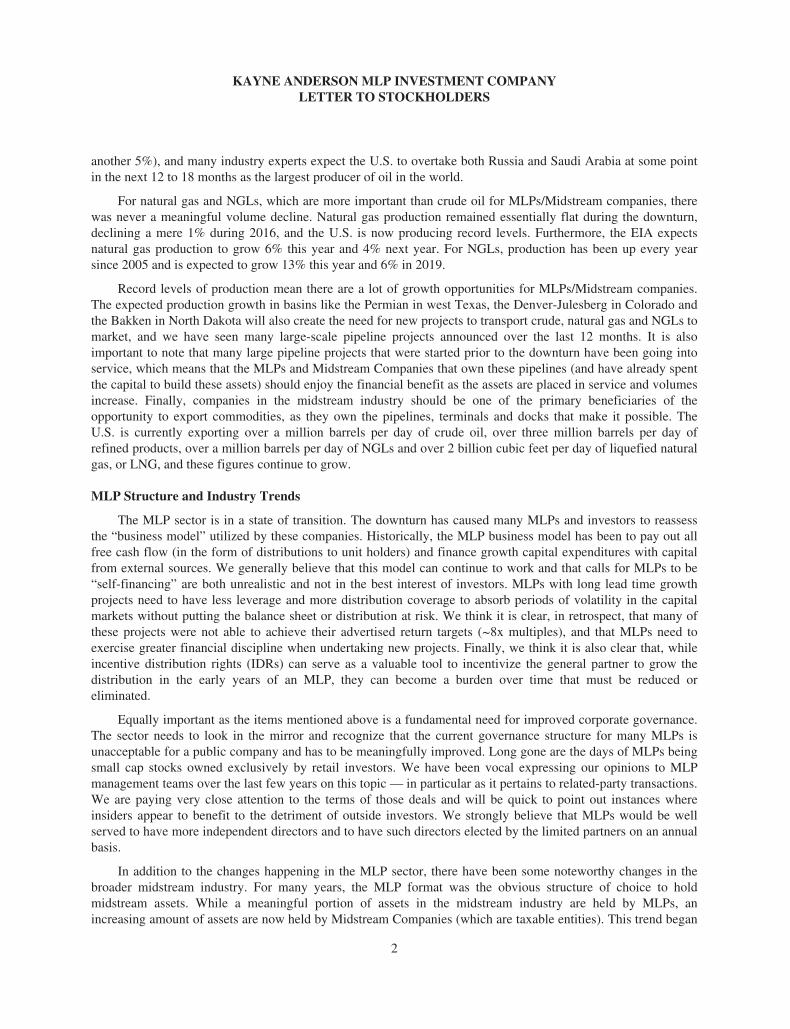
another 5%), and many industry experts expect the U.S. to overtake both Russia and Saudi Arabia at some pointin the next 12 to 18 months as the largest producer of oil in the world.
For natural gas and NGLs, which are more important than crude oil for MLPs/Midstream companies, therewas never a meaningful volume decline. Natural gas production remained essentially flat during the downturn,declining a mere 1% during 2016, and the U.S. is now producing record levels. Furthermore, the EIA expectsnatural gas production to grow 6% this year and 4% next year. For NGLs, production has been up every yearsince 2005 and is expected to grow 13% this year and 6% in 2019.
Record levels of production mean there are a lot of growth opportunities for MLPs/Midstream companies.The expected production growth in basins like the Permian in west Texas, the Denver-Julesberg in Colorado andthe Bakken in North Dakota will also create the need for new projects to transport crude, natural gas and NGLs tomarket, and we have seen many large-scale pipeline projects announced over the last 12 months. It is alsoimportant to note that many large pipeline projects that were started prior to the downturn have been going intoservice, which means that the MLPs and Midstream Companies that own these pipelines (and have already spentthe capital to build these assets) should enjoy the financial benefit as the assets are placed in service and volumesincrease. Finally, companies in the midstream industry should be one of the primary beneficiaries of theopportunity to export commodities, as they own the pipelines, terminals and docks that make it possible. TheU.S. is currently exporting over a million barrels per day of crude oil, over three million barrels per day ofrefined products, over a million barrels per day of NGLs and over 2 billion cubic feet per day of liquefied naturalgas, or LNG, and these figures continue to grow.
MLP Structure and Industry Trends
The MLP sector is in a state of transition. The downturn has caused many MLPs and investors to reassessthe “business model” utilized by these companies. Historically, the MLP business model has been to pay out allfree cash flow (in the form of distributions to unit holders) and finance growth capital expenditures with capitalfrom external sources. We generally believe that this model can continue to work and that calls for MLPs to be“self-financing” are both unrealistic and not in the best interest of investors. MLPs with long lead time growthprojects need to have less leverage and more distribution coverage to absorb periods of volatility in the capitalmarkets without putting the balance sheet or distribution at risk. We think it is clear, in retrospect, that many ofthese projects were not able to achieve their advertised return targets (~8x multiples), and that MLPs need toexercise greater financial discipline when undertaking new projects. Finally, we think it is also clear that, whileincentive distribution rights (IDRs) can serve as a valuable tool to incentivize the general partner to grow thedistribution in the early years of an MLP, they can become a burden over time that must be reduced oreliminated.
Equally important as the items mentioned above is a fundamental need for improved corporate governance.The sector needs to look in the mirror and recognize that the current governance structure for many MLPs isunacceptable for a public company and has to be meaningfully improved. Long gone are the days of MLPs beingsmall cap stocks owned exclusively by retail investors. We have been vocal expressing our opinions to MLPmanagement teams over the last few years on this topic — in particular as it pertains to related-party transactions.We are paying very close attention to the terms of those deals and will be quick to point out instances whereinsiders appear to benefit to the detriment of outside investors. We strongly believe that MLPs would be wellserved to have more independent directors and to have such directors elected by the limited partners on an annualbasis.
In addition to the changes happening in the MLP sector, there have been some noteworthy changes in thebroader midstream industry. For many years, the MLP format was the obvious structure of choice to holdmidstream assets. While a meaningful portion of assets in the midstream industry are held by MLPs, anincreasing amount of assets are now held by Midstream Companies (which are taxable entities). This trend began
2
KAYNE ANDERSON MLP INVESTMENT COMPANYLETTER TO STOCKHOLDERS
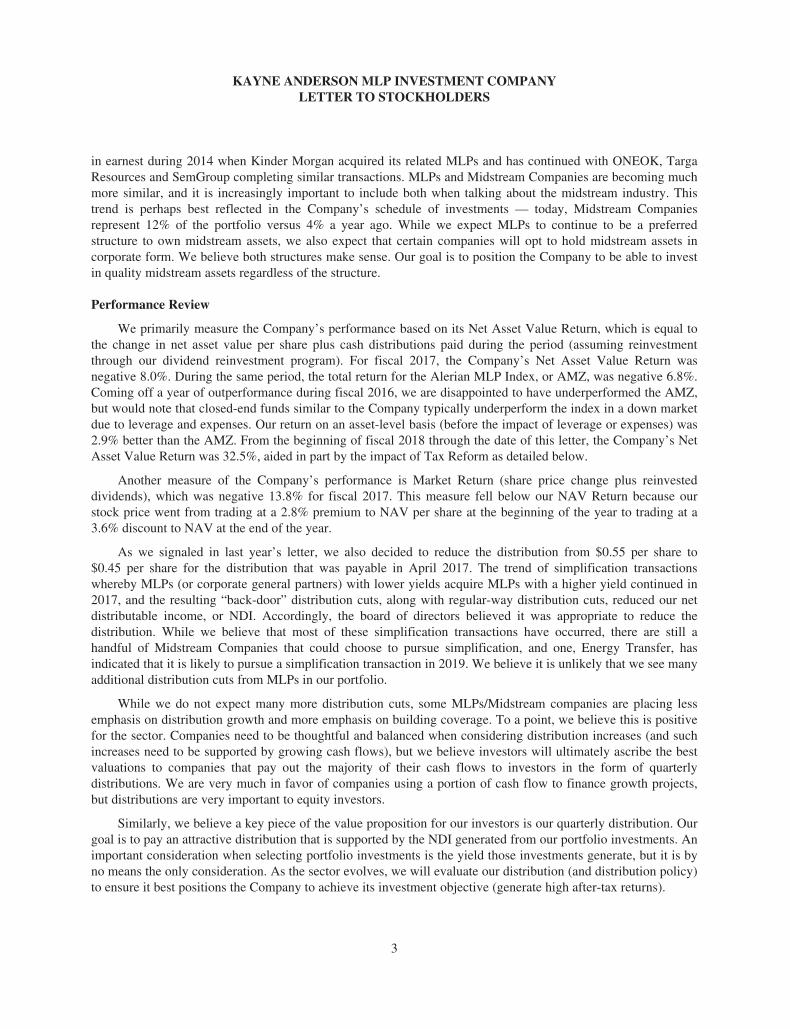
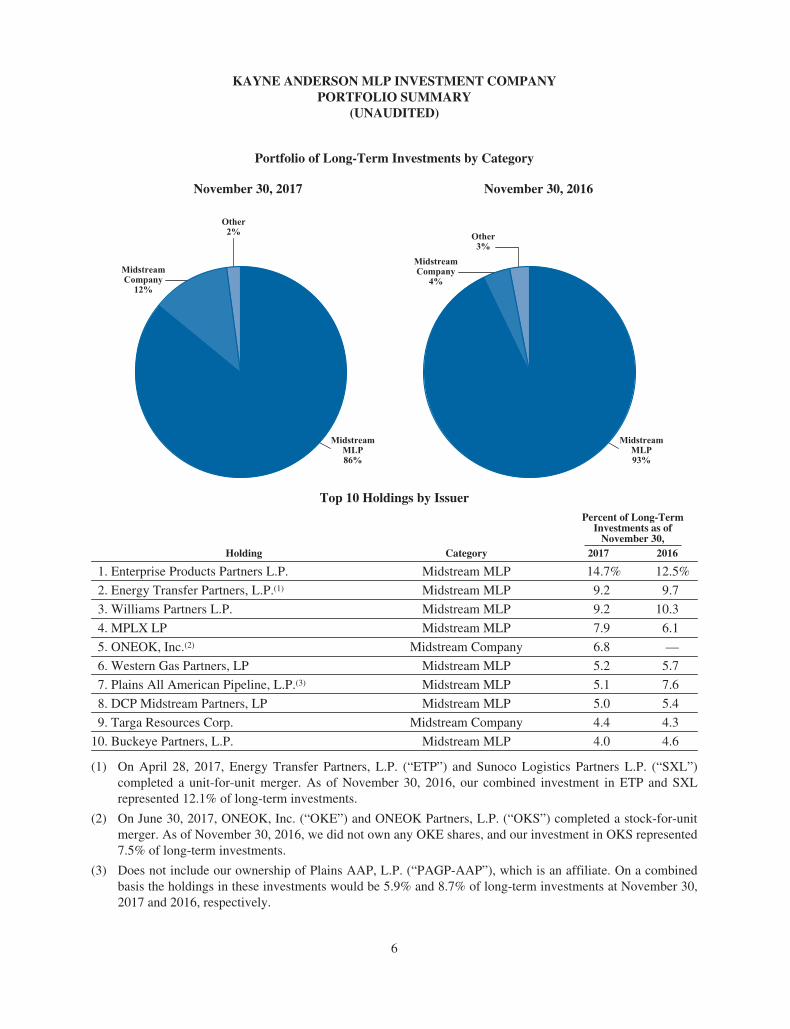
in earnest during 2014 when Kinder Morgan acquired its related MLPs and has continued with ONEOK, TargaResources and SemGroup completing similar transactions. MLPs and Midstream Companies are becoming muchmore similar, and it is increasingly important to include both when talking about the midstream industry. Thistrend is perhaps best reflected in the Company’s schedule of investments — today, Midstream Companiesrepresent 12% of the portfolio versus 4% a year ago. While we expect MLPs to continue to be a preferredstructure to own midstream assets, we also expect that certain companies will opt to hold midstream assets incorporate form. We believe both structures make sense. Our goal is to position the Company to be able to investin quality midstream assets regardless of the structure.
Performance Review
We primarily measure the Company’s performance based on its Net Asset Value Return, which is equal tothe change in net asset value per share plus cash distributions paid during the period (assuming reinvestmentthrough our dividend reinvestment program). For fiscal 2017, the Company’s Net Asset Value Return wasnegative 8.0%. During the same period, the total return for the Alerian MLP Index, or AMZ, was negative 6.8%.Coming off a year of outperformance during fiscal 2016, we are disappointed to have underperformed the AMZ,but would note that closed-end funds similar to the Company typically underperform the index in a down marketdue to leverage and expenses. Our return on an asset-level basis (before the impact of leverage or expenses) was2.9% better than the AMZ. From the beginning of fiscal 2018 through the date of this letter, the Company’s NetAsset Value Return was 32.5%, aided in part by the impact of Tax Reform as detailed below.
Another measure of the Company’s performance is Market Return (share price change plus reinvesteddividends), which was negative 13.8% for fiscal 2017. This measure fell below our NAV Return because ourstock price went from trading at a 2.8% premium to NAV per share at the beginning of the year to trading at a3.6% discount to NAV at the end of the year.
As we signaled in last year’s letter, we also decided to reduce the distribution from $0.55 per share to$0.45 per share for the distribution that was payable in April 2017. The trend of simplification transactionswhereby MLPs (or corporate general partners) with lower yields acquire MLPs with a higher yield continued in2017, and the resulting “back-door” distribution cuts, along with regular-way distribution cuts, reduced our netdistributable income, or NDI. Accordingly, the board of directors believed it was appropriate to reduce thedistribution. While we believe that most of these simplification transactions have occurred, there are still ahandful of Midstream Companies that could choose to pursue simplification, and one, Energy Transfer, hasindicated that it is likely to pursue a simplification transaction in 2019. We believe it is unlikely that we see manyadditional distribution cuts from MLPs in our portfolio.
While we do not expect many more distribution cuts, some MLPs/Midstream companies are placing lessemphasis on distribution growth and more emphasis on building coverage. To a point, we believe this is positivefor the sector. Companies need to be thoughtful and balanced when considering distribution increases (and suchincreases need to be supported by growing cash flows), but we believe investors will ultimately ascribe the bestvaluations to companies that pay out the majority of their cash flows to investors in the form of quarterlydistributions. We are very much in favor of companies using a portion of cash flow to finance growth projects,but distributions are very important to equity investors.
Similarly, we believe a key piece of the value proposition for our investors is our quarterly distribution. Ourgoal is to pay an attractive distribution that is supported by the NDI generated from our portfolio investments. Animportant consideration when selecting portfolio investments is the yield those investments generate, but it is byno means the only consideration. As the sector evolves, we will evaluate our distribution (and distribution policy)to ensure it best positions the Company to achieve its investment objective (generate high after-tax returns).
3
KAYNE ANDERSON MLP INVESTMENT COMPANYLETTER TO STOCKHOLDERS
Impact of Tax Reform
Let me take a moment to comment on the recently enacted Tax Cuts and Jobs Act (“Tax Reform”), both asit relates to the Company and the MLP/Midstream sector. For MLPs, the best news coming out of Tax Reform isthat the provisions in the tax code that allow energy companies to organize as publicly traded partnerships wereleft alone. For years, the prospect of Congress removing the exemption from corporate taxes was a constantoverhang on the sector. MLPs (and unitholders) will also benefit from the immediate expensing of capitalexpenditures for the next five years, which should increase, all else equal, the percentage of distributions that istreated as return of capital (and thus tax deferred). Tax Reform also introduced a new limitation on thedeductibility of net interest expense. For at least the next four years, we do not believe this limitation will have ameaningful impact on MLPs. For individual owners of MLPs, Tax Reform also will allow a deduction of 20% ofthe qualified income passed through from MLPs, which should enhance the attractiveness of owning MLPs. Forthe Midstream Companies in our portfolio, many do not pay a significant amount of cash taxes, and we believethe immediate expensing of capital expenditures should extend the time period during which these companieswill pay minimal cash taxes.
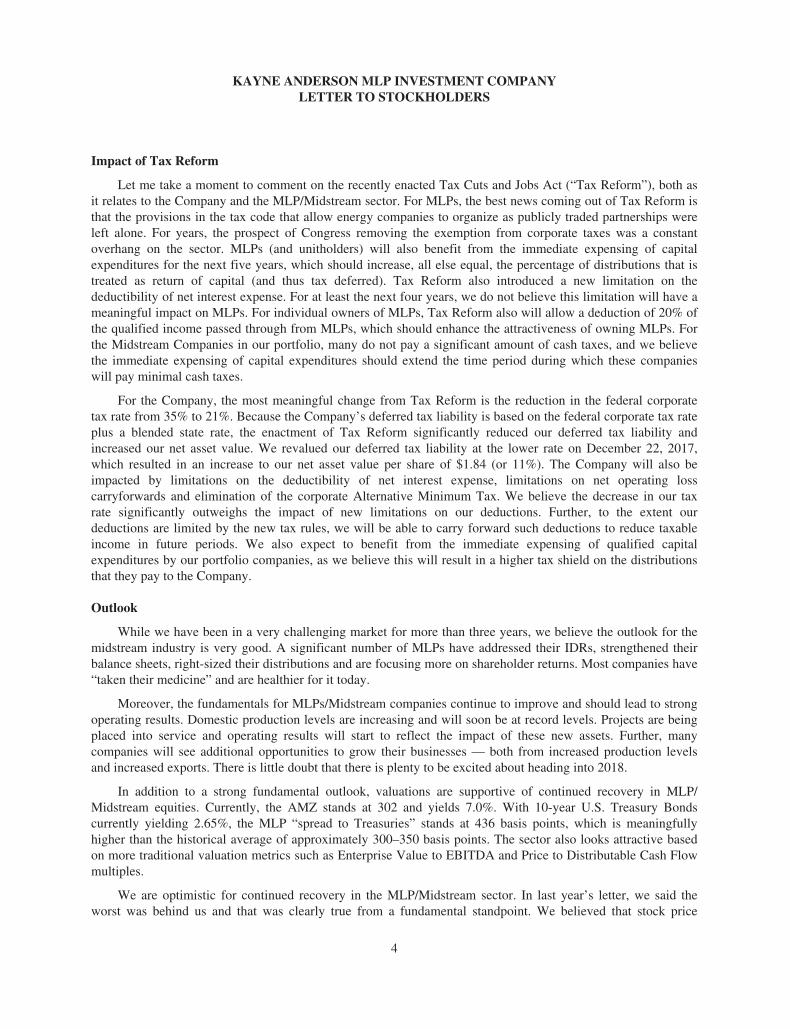
For the Company, the most meaningful change from Tax Reform is the reduction in the federal corporatetax rate from 35% to 21%. Because the Company’s deferred tax liability is based on the federal corporate tax rateplus a blended state rate, the enactment of Tax Reform significantly reduced our deferred tax liability andincreased our net asset value. We revalued our deferred tax liability at the lower rate on December 22, 2017,which resulted in an increase to our net asset value per share of $1.84 (or 11%). The Company will also beimpacted by limitations on the deductibility of net interest expense, limitations on net operating losscarryforwards and elimination of the corporate Alternative Minimum Tax. We believe the decrease in our taxrate significantly outweighs the impact of new limitations on our deductions. Further, to the extent ourdeductions are limited by the new tax rules, we will be able to carry forward such deductions to reduce taxableincome in future periods. We also expect to benefit from the immediate expensing of qualified capitalexpenditures by our portfolio companies, as we believe this will result in a higher tax shield on the distributionsthat they pay to the Company.
Outlook
While we have been in a very challenging market for more than three years, we believe the outlook for themidstream industry is very good. A significant number of MLPs have addressed their IDRs, strengthened theirbalance sheets, right-sized their distributions and are focusing more on shareholder returns. Most companies have“taken their medicine” and are healthier for it today.
Moreover, the fundamentals for MLPs/Midstream companies continue to improve and should lead to strongoperating results. Domestic production levels are increasing and will soon be at record levels. Projects are beingplaced into service and operating results will start to reflect the impact of these new assets. Further, manycompanies will see additional opportunities to grow their businesses — both from increased production levelsand increased exports. There is little doubt that there is plenty to be excited about heading into 2018.
In addition to a strong fundamental outlook, valuations are supportive of continued recovery in MLP/Midstream equities. Currently, the AMZ stands at 302 and yields 7.0%. With 10-year U.S. Treasury Bondscurrently yielding 2.65%, the MLP “spread to Treasuries” stands at 436 basis points, which is meaningfullyhigher than the historical average of approximately 300–350 basis points. The sector also looks attractive basedon more traditional valuation metrics such as Enterprise Value to EBITDA and Price to Distributable Cash Flowmultiples.
We are optimistic for continued recovery in the MLP/Midstream sector. In last year’s letter, we said theworst was behind us and that was clearly true from a fundamental standpoint. We believed that stock price
4

KAYNE ANDERSON MLP INVESTMENT COMPANYLETTER TO STOCKHOLDERS
performance would follow fundamentals, but that didn’t happen in 2017. This year, we believe that stock pricesshould “catch up” to the improved fundamentals and lead to strong returns. Needless to say, the fact that theAMZ is up 15% since year-end gives us even more confidence that our current expectation will be more accuratethan last year’s prediction.
We appreciate your investment in the Company and look forward to executing on our business plan ofachieving high after-tax total returns by investing in MLPs and other Midstream Companies. We invite you tovisit our website at kaynefunds.com for the latest updates.
Sincerely,
Kevin S. McCarthyChairman of the Board of Directorsand Chief Executive Officer
5
KAYNE ANDERSON MLP INVESTMENT COMPANYPORTFOLIO SUMMARY
(UNAUDITED)
Portfolio of Long-Term Investments by Category
November 30, 2017 November 30, 2016
MidstreamCompany12%
MidstreamMLP86%
Other2%
MidstreamCompany4%
MidstreamMLP93%
Other3%
Top 10 Holdings by IssuerPercent of Long-Term
Investments as ofNovember 30,
Holding Category 2017 2016
1. Enterprise Products Partners L.P. Midstream MLP 14.7% 12.5%
2. Energy Transfer Partners, L.P.(1) Midstream MLP 9.2 9.7
3. Williams Partners L.P. Midstream MLP 9.2 10.3
4. MPLX LP Midstream MLP 7.9 6.1
5. ONEOK, Inc.(2) Midstream Company 6.8 —
6. Western Gas Partners, LP Midstream MLP 5.2 5.7
7. Plains All American Pipeline, L.P.(3) Midstream MLP 5.1 7.6
8. DCP Midstream Partners, LP Midstream MLP 5.0 5.4
9. Targa Resources Corp. Midstream Company 4.4 4.3
10. Buckeye Partners, L.P. Midstream MLP 4.0 4.6
(1) On April 28, 2017, Energy Transfer Partners, L.P. (“ETP”) and Sunoco Logistics Partners L.P. (“SXL”)completed a unit-for-unit merger. As of November 30, 2016, our combined investment in ETP and SXLrepresented 12.1% of long-term investments.
(2) On June 30, 2017, ONEOK, Inc. (“OKE”) and ONEOK Partners, L.P. (“OKS”) completed a stock-for-unitmerger. As of November 30, 2016, we did not own any OKE shares, and our investment in OKS represented7.5% of long-term investments.
(3) Does not include our ownership of Plains AAP, L.P. (“PAGP-AAP”), which is an affiliate. On a combinedbasis the holdings in these investments would be 5.9% and 8.7% of long-term investments at November 30,2017 and 2016, respectively.
6
KAYNE ANDERSON MLP INVESTMENT COMPANYMANAGEMENT DISCUSSION
(UNAUDITED)
Company Overview
Kayne Anderson MLP Investment Company is a non-diversified, closed-end fund that commencedoperations in September 2004. Our investment objective is to obtain a high after-tax total return by investing atleast 85% of our total assets in energy-related master limited partnerships and their affiliates (“MLPs”) and inother companies that operate assets used in the gathering, transporting, processing, storing, refining, distributing,mining or marketing of natural gas, natural gas liquids, crude oil, refined petroleum products or coal (collectivelywith MLPs, “Midstream Energy Companies”).
As of November 30, 2017, we had total assets of $3.4 billion, net assets applicable to our commonstockholders of $1.8 billion (net asset value of $15.90 per share), and 114.9 million shares of common stockoutstanding.
Our investments are principally in equity securities issued by MLPs, but we also may invest in debtsecurities of MLPs and equity/debt securities of other Midstream Energy Companies. As the Midstream Industrycontinues to evolve there are more Midstream Energy Companies structured as corporations for tax purposes. Asa result of this trend, our ownership of Midstream Companies has increased (12% of long-term investments as ofNovember 30, 2017 versus 4% of long-term investments as of November 30, 2016). We are evaluating this trendand will make sure the Company is well positioned to generate high after-tax total returns by investing inMidstream Energy Companies. As of November 30, 2017, we held $3.3 billion in equity investments and no debtinvestments.
Recent Events
On December 22, 2017, the Tax Cuts and Jobs Act (the “Tax Reform Bill”) was signed into law, reducingthe federal corporate tax rate from 35% to 21%. Because our deferred tax liability is based primarily on thefederal corporate tax rate, the enactment of the Tax Reform Bill significantly reduced our deferred tax liabilityand increased our net asset value. We revalued our deferred tax liability at the lower rate on December 22, 2017,which resulted in an increase to our net asset value of $1.84 per share (or 11.0%).
Other changes in the Tax Reform Bill that impact us include limitations on the deductibility of net interestexpense and limitations on the usage of net operating loss carryforwards (and elimination of carrybacks). Whilethese new limitations will impact certain deductions to taxable income, we believe that the benefits of a lowerfederal corporate tax rate will far outweigh such limitations. To the extent certain deductions are limited in anygiven year, we will be able to utilize such deductions in future periods if we have sufficient taxable income.
The Tax Reform Bill also repealed the corporate Alternative Minimum Tax (“AMT”) for tax yearsbeginning after December 31, 2017 and provides that existing AMT credit carryforwards will be refundable. Wewill remain subject to corporate AMT for fiscal 2018 but expect to file for refunds of AMT credit carryforwards,if any, beginning in fiscal 2019. Further, the Tax Reform Bill permits immediate expensing of qualified capitalexpenditures for the next five years, and as a result, we believe that our portfolio companies may pass throughmore deduction to us which may result in a higher portion of distributions received to be characterized as returnof capital.
Results of Operations — For the Three Months Ended November 30, 2017
Investment Income. Investment income totaled $7.5 million for the quarter. We received $64.7 million ofdividends and distributions, of which $54.4 million was treated as return of capital and $2.9 million was treatedas distributions in excess of cost basis. Interest income was $0.1 million. We also received $0.8 million ofpaid-in-kind dividends during the quarter, which are not included in investment income, but are reflected as anunrealized gain.
7
KAYNE ANDERSON MLP INVESTMENT COMPANYMANAGEMENT DISCUSSION
(UNAUDITED)
Operating Expenses. Operating expenses totaled $22.9 million, including $11.9 million of investmentmanagement fees, $7.1 million of interest expense, $3.0 million of preferred stock distributions and $0.9 millionof other operating expenses. Interest expense includes $0.4 million of non-cash amortization of debt issuancecosts. Preferred stock distributions include $0.2 million of non-cash amortization.
Net Investment Loss. Our net investment loss totaled $9.6 million and included a current tax benefit of$0.7 million and a deferred tax benefit of $5.1 million.
Net Realized Gains. We had net realized gains from our investments of $19.4 million, consisting ofrealized gains from long term investments of $34.9 million, $0.1 million of realized gains from option activity, acurrent tax expense of $1.3 million and a deferred tax expense of $14.3 million.
Net Change in Unrealized Gains. We had a net decrease in our unrealized gains of $114.3 million. The netchange consisted of a $184.3 million decrease in our unrealized gains on investments and a deferred tax benefitof $70.0 million.
Net Decrease in Net Assets Resulting from Operations. We had a decrease in net assets resulting fromoperations of $104.5 million. This decrease was comprised of a net investment loss of $9.6 million, net realizedgains of $19.4 million and a net decrease in unrealized gains of $114.3 million, as noted above.
Results of Operations — For the Fiscal Year Ended November 30, 2017
Investment Income. Investment income totaled $20.9 million for the fiscal year. We received $276.9million of dividends and distributions, of which $244.9 million was treated as return of capital and $11.2 millionwas treated as distributions in excess of cost basis. Return of capital was increased by $14.7 million due to 2016tax reporting information that we received in fiscal 2017. Interest income was $0.1 million. We also received$3.7 million of paid-in-kind dividends during the fiscal year, which are not included in investment income, butare reflected as an unrealized gain.
Operating Expenses. Operating expenses totaled $97.6 million, including $52.3 million of investmentmanagement fees, $29.6 million of interest expense, $12.2 million of preferred stock distributions and $3.5million of other operating expenses. Interest expense includes $1.6 million of non-cash amortization of debtissuance costs. Preferred stock distributions include $0.8 million of non-cash amortization.
Net Investment Loss. Our net investment loss totaled $51.4 million and included a current tax benefit of$3.9 million and a deferred tax benefit of $21.4 million.
Net Realized Gains. We had net realized gains from our investments of $206.0 million, consisting ofrealized gains from long term investments of $322.9 million, $0.5 million of realized gains from option activity,a current tax expense of $18.3 million and a deferred tax expense of $99.1 million.
Net Change in Unrealized Gains. We had a net decrease in our unrealized gains of $313.7 million. The netchange consisted of a $492.7 million decrease in our unrealized gains on investments, $0.2 million of unrealizedgains from option activity and a deferred tax benefit of $178.8 million.
Net Decrease in Net Assets Resulting from Operations. We had a decrease in net assets resulting fromoperations of $159.1 million. This decrease was comprised of a net investment loss of $51.4 million, net realizedgains of $206.0 million and a net decrease in unrealized gains of $313.7 million, as noted above.
8
KAYNE ANDERSON MLP INVESTMENT COMPANYMANAGEMENT DISCUSSION
(UNAUDITED)
Distributions to Common Stockholders
We pay quarterly distributions to our common stockholders, funded generally by net distributable income(“NDI”) generated from our portfolio investments. NDI is the amount of income received by us from ourportfolio investments less operating expenses, subject to certain adjustments as described below. NDI is not afinancial measure under the accounting principles generally accepted in the United States of America (“GAAP”).Refer to the “Reconciliation of NDI to GAAP” section below for a reconciliation of this measure to our resultsreported under GAAP.
Income from portfolio investments includes (a) cash dividends and distributions, (b) paid-in-kind dividendsreceived (i.e., stock dividends), (c) interest income from debt securities and commitment fees from privateinvestments in public equity (“PIPE investments”) and (d) net premiums received from the sale of covered calls.
Operating expenses include (a) investment management fees paid to our investment adviser (KAFA),(b) other expenses (mostly comprised of fees paid to other service providers), (c) interest expense and preferredstock distributions and (d) current and deferred income tax expense/benefit on net investment income/loss.
9
KAYNE ANDERSON MLP INVESTMENT COMPANYMANAGEMENT DISCUSSION
(UNAUDITED)
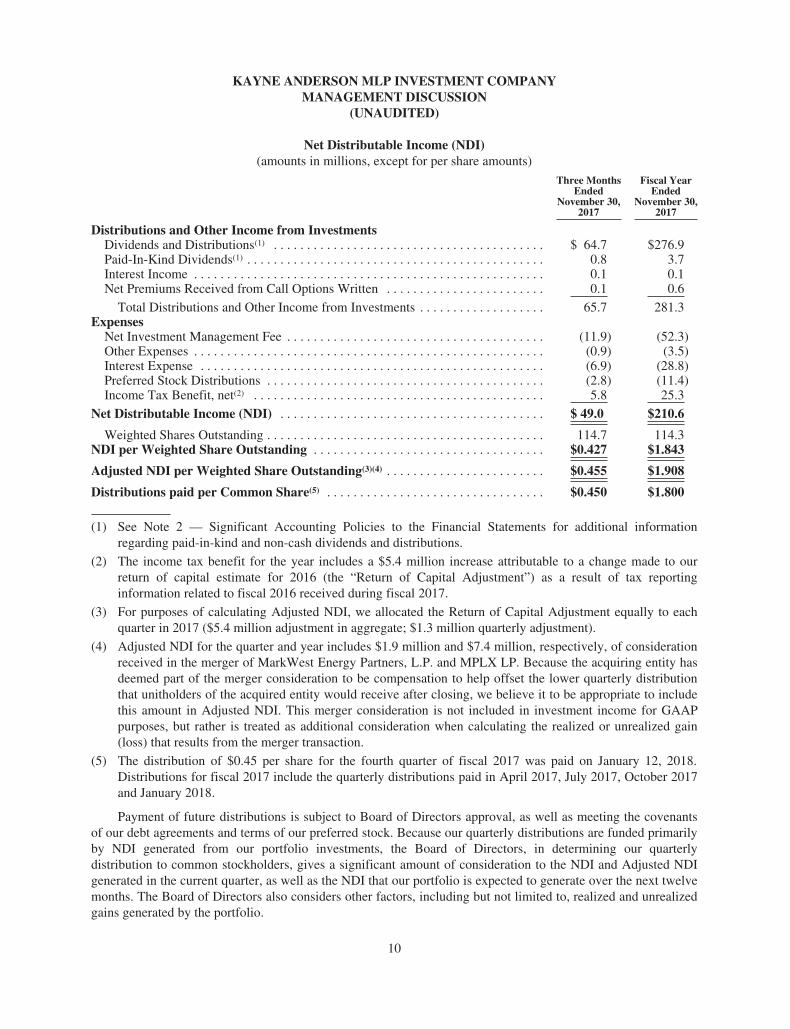
Net Distributable Income (NDI)(amounts in millions, except for per share amounts)
Three MonthsEnded
November 30,2017
Fiscal YearEnded
November 30,2017
Distributions and Other Income from InvestmentsDividends and Distributions(1) . . . . . . . . . . . . . . . . . . . . . . . . . . . . . . . . . . . . . . . . . $ 64.7 $276.9Paid-In-Kind Dividends(1) . . . . . . . . . . . . . . . . . . . . . . . . . . . . . . . . . . . . . . . . . . . . . 0.8 3.7Interest Income . . . . . . . . . . . . . . . . . . . . . . . . . . . . . . . . . . . . . . . . . . . . . . . . . . . . . 0.1 0.1Net Premiums Received from Call Options Written . . . . . . . . . . . . . . . . . . . . . . . . 0.1 0.6
Total Distributions and Other Income from Investments . . . . . . . . . . . . . . . . . . . 65.7 281.3Expenses
Net Investment Management Fee . . . . . . . . . . . . . . . . . . . . . . . . . . . . . . . . . . . . . . . (11.9) (52.3)Other Expenses . . . . . . . . . . . . . . . . . . . . . . . . . . . . . . . . . . . . . . . . . . . . . . . . . . . . . (0.9) (3.5)Interest Expense . . . . . . . . . . . . . . . . . . . . . . . . . . . . . . . . . . . . . . . . . . . . . . . . . . . . (6.9) (28.8)Preferred Stock Distributions . . . . . . . . . . . . . . . . . . . . . . . . . . . . . . . . . . . . . . . . . . (2.8) (11.4)Income Tax Benefit, net(2) . . . . . . . . . . . . . . . . . . . . . . . . . . . . . . . . . . . . . . . . . . . . 5.8 25.3
Net Distributable Income (NDI) . . . . . . . . . . . . . . . . . . . . . . . . . . . . . . . . . . . . . . . . $ 49.0 $210.6
Weighted Shares Outstanding . . . . . . . . . . . . . . . . . . . . . . . . . . . . . . . . . . . . . . . . . . 114.7 114.3NDI per Weighted Share Outstanding . . . . . . . . . . . . . . . . . . . . . . . . . . . . . . . . . . . $0.427 $1.843
Adjusted NDI per Weighted Share Outstanding(3)(4) . . . . . . . . . . . . . . . . . . . . . . . . $0.455 $1.908
Distributions paid per Common Share(5) . . . . . . . . . . . . . . . . . . . . . . . . . . . . . . . . . $0.450 $1.800
(1) See Note 2 — Significant Accounting Policies to the Financial Statements for additional informationregarding paid-in-kind and non-cash dividends and distributions.
(2) The income tax benefit for the year includes a $5.4 million increase attributable to a change made to ourreturn of capital estimate for 2016 (the “Return of Capital Adjustment”) as a result of tax reportinginformation related to fiscal 2016 received during fiscal 2017.
(3) For purposes of calculating Adjusted NDI, we allocated the Return of Capital Adjustment equally to eachquarter in 2017 ($5.4 million adjustment in aggregate; $1.3 million quarterly adjustment).
(4) Adjusted NDI for the quarter and year includes $1.9 million and $7.4 million, respectively, of considerationreceived in the merger of MarkWest Energy Partners, L.P. and MPLX LP. Because the acquiring entity hasdeemed part of the merger consideration to be compensation to help offset the lower quarterly distributionthat unitholders of the acquired entity would receive after closing, we believe it to be appropriate to includethis amount in Adjusted NDI. This merger consideration is not included in investment income for GAAPpurposes, but rather is treated as additional consideration when calculating the realized or unrealized gain(loss) that results from the merger transaction.
(5) The distribution of $0.45 per share for the fourth quarter of fiscal 2017 was paid on January 12, 2018.Distributions for fiscal 2017 include the quarterly distributions paid in April 2017, July 2017, October 2017and January 2018.
Payment of future distributions is subject to Board of Directors approval, as well as meeting the covenantsof our debt agreements and terms of our preferred stock. Because our quarterly distributions are funded primarilyby NDI generated from our portfolio investments, the Board of Directors, in determining our quarterlydistribution to common stockholders, gives a significant amount of consideration to the NDI and Adjusted NDIgenerated in the current quarter, as well as the NDI that our portfolio is expected to generate over the next twelvemonths. The Board of Directors also considers other factors, including but not limited to, realized and unrealizedgains generated by the portfolio.
10
KAYNE ANDERSON MLP INVESTMENT COMPANYMANAGEMENT DISCUSSION
(UNAUDITED)
Reconciliation of NDI to GAAP
The difference between distributions and other income from investments in the NDI calculation and totalinvestment income as reported in our Statement of Operations is reconciled as follows:
• GAAP recognizes that a significant portion of the cash distributions received from MLPs ischaracterized as a return of capital and therefore excluded from investment income, whereas the NDIcalculation includes the return of capital portion of such distributions.
• GAAP recognizes distributions received from MLPs that exceed the cost basis of our securities to berealized gains and are therefore excluded from investment income, whereas the NDI calculation includesthese distributions.
• NDI includes the value of paid-in-kind dividends and distributions, whereas such amounts are not includedas investment income for GAAP purposes, but rather are recorded as unrealized gains upon receipt.
• NDI includes commitment fees from PIPE investments, whereas such amounts are generally notincluded in investment income for GAAP purposes, but rather are recorded as a reduction to the cost ofthe investment.
• We may hold debt securities from time to time. Certain of our investments in debt securities may bepurchased at a discount or premium to the par value of such security. When making such investments,we consider the security’s yield to maturity, which factors in the impact of such discount (or premium).Interest income reported under GAAP includes the non-cash accretion of the discount (or amortizationof the premium) based on the effective interest method. When we calculate interest income for purposesof determining NDI, in order to better reflect the yield to maturity, the accretion of the discount (oramortization of the premium) is calculated on a straight-line basis to the earlier of the expected call dateor the maturity of the debt security.
• We may sell covered call option contracts to generate income or to reduce our ownership of certainsecurities that we hold. In some cases, we are able to repurchase these call option contracts at a priceless than the call premium that we received, thereby generating a profit. The premium we receive fromselling call options, less (i) the premium that we pay to repurchase such call option contracts and (ii) theamount by which the market price of an underlying security is above the strike price at the time a newcall option is written (if any), is included in NDI. For GAAP purposes, premiums received from calloption contracts sold are not included in investment income. See Note 2 — Significant AccountingPolicies for a full discussion of the GAAP treatment of option contracts.
The treatment of expenses included in NDI also differs from what is reported in the Statement of Operationsas follows:
• The non-cash amortization or write-offs of capitalized debt issuance costs, premiums on newly issueddebt and preferred stock offering costs related to our financings is included in interest expense anddistributions on mandatory redeemable preferred stock for GAAP purposes, but is excluded from ourcalculation of NDI.
• NDI also includes recurring payments (or receipts) on interest rate swap contracts or the amortization oftermination payments on interest rate swap contracts entered into in anticipation of an offering ofunsecured notes (“Notes”) or mandatory redeemable preferred stock (“MRP Shares”). The terminationpayments on interest rate swap contracts are amortized over the term of the Notes or MRP Shares issued.For GAAP purposes, these amounts are included in the realized gains/losses section of the Statement ofOperations.
11
KAYNE ANDERSON MLP INVESTMENT COMPANYMANAGEMENT DISCUSSION
(UNAUDITED)
Liquidity and Capital Resources
At November 30, 2017, we had total leverage outstanding of $1,039 million, which represented 31% of totalassets. Our current policy is to utilize leverage in an amount that represents approximately 25%-30% of our totalassets. At quarter end, total leverage was comprised of $747 million of Notes and $292 million of MRP Shares.At November 30, 2017, we did not have any borrowings outstanding under our unsecured revolving creditfacility (the “Credit Facility”) or our unsecured term loan (the “Term Loan”), and we had $77 million of cash andcash equivalents. As of January 19, 2018, we had total leverage outstanding of $1,052 million, which represented28% of total assets. As of this date, we had no borrowings outstanding under our Credit Facility, $13 millionoutstanding under our Term Loan, and we had $1 million of cash and cash equivalents.
Our Credit Facility has a two-year term maturing on February 28, 2018 and a total commitment amount of$150 million. While we currently have no borrowings outstanding on this facility, we have launched a renewaltransaction which we expect to finalize prior to the maturity date. The interest rate on outstanding loan balancesmay vary between LIBOR plus 1.60% and LIBOR plus 2.25%, depending on our asset coverage ratios. We pay afee of 0.30% per annum on any unused amounts of the Credit Facility.
Our Term Loan has a total commitment of $150 million and matures on February 18, 2019. Borrowings underthe Term Loan bear interest at a rate of LIBOR plus 1.30%. Amounts borrowed under the Term Loan may be repaidand subsequently borrowed. We pay a fee of 0.25% per annum on any unused amounts of the Term Loan.
At November 30, 2017, we had $747 million of Notes outstanding that mature between 2018 and 2025 and wehad $292 million of MRP Shares outstanding that are subject to mandatory redemption between 2020 and 2022.
At November 30, 2017, our asset coverage ratios under the Investment Company Act of 1940, as amended(the “1940 Act”), were 384% for debt and 276% for total leverage (debt plus preferred stock). As a result of theTax Reform Bill and lower federal corporate tax rate, we recently increased our target asset coverage ratio withrespect to our debt from 385% to 400% and our target total leverage asset coverage ratio from 290% to 300%.The goal of these increased target asset coverage ratios is to ensure that the Company can withstand the samemarket decline prior to the change in federal corporate tax rate set forth in the Tax Reform Bill. At times we maybe above or below this target depending on market conditions as well as certain other factors, including the basicmaintenance amount as stated in our rating agency guidelines.
As of November 30, 2017, our total leverage consisted 100% of fixed rate obligations. At such date, theweighted average interest/dividend rate on our total leverage was 3.66%.
12
KAYNE ANDERSON MLP INVESTMENT COMPANYSCHEDULE OF INVESTMENTS
NOVEMBER 30, 2017(amounts in 000’s)
DescriptionNo. of
Shares/Units Value
Long-Term Investments — 181.6%Equity Investments(1) — 181.6%
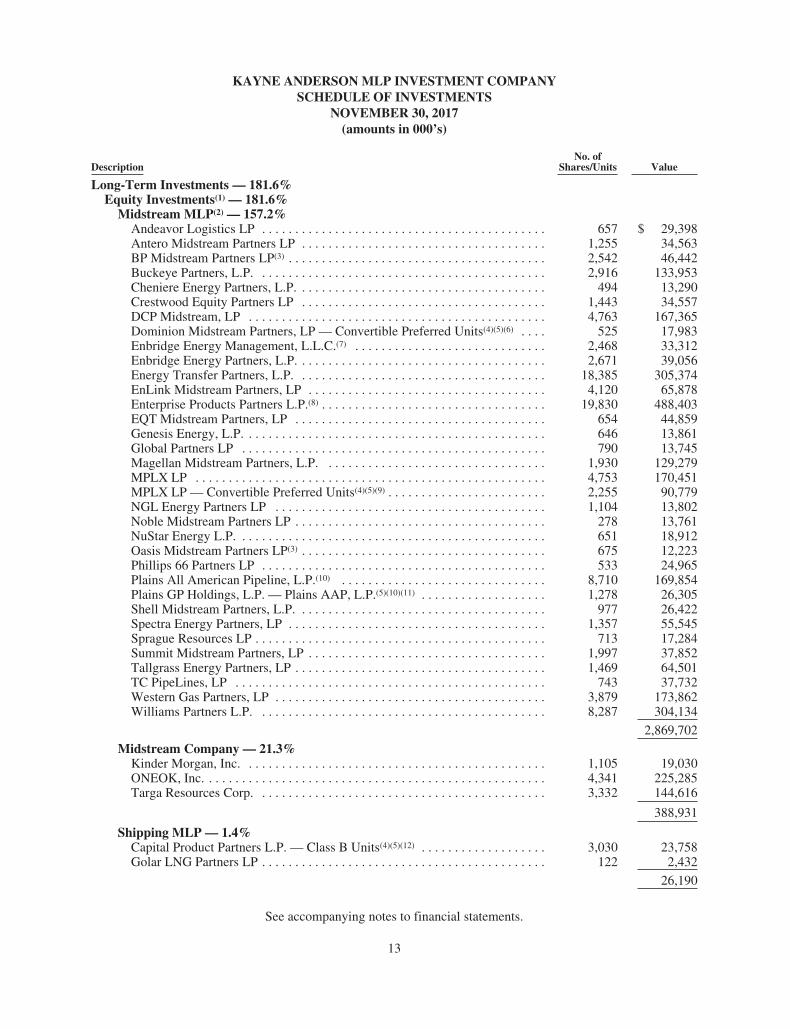
Midstream MLP(2) — 157.2%Andeavor Logistics LP . . . . . . . . . . . . . . . . . . . . . . . . . . . . . . . . . . . . . . . . . . . 657 $ 29,398Antero Midstream Partners LP . . . . . . . . . . . . . . . . . . . . . . . . . . . . . . . . . . . . . 1,255 34,563BP Midstream Partners LP(3) . . . . . . . . . . . . . . . . . . . . . . . . . . . . . . . . . . . . . . . 2,542 46,442Buckeye Partners, L.P. . . . . . . . . . . . . . . . . . . . . . . . . . . . . . . . . . . . . . . . . . . . 2,916 133,953Cheniere Energy Partners, L.P. . . . . . . . . . . . . . . . . . . . . . . . . . . . . . . . . . . . . . 494 13,290Crestwood Equity Partners LP . . . . . . . . . . . . . . . . . . . . . . . . . . . . . . . . . . . . . 1,443 34,557DCP Midstream, LP . . . . . . . . . . . . . . . . . . . . . . . . . . . . . . . . . . . . . . . . . . . . . 4,763 167,365Dominion Midstream Partners, LP — Convertible Preferred Units(4)(5)(6) . . . . 525 17,983Enbridge Energy Management, L.L.C.(7) . . . . . . . . . . . . . . . . . . . . . . . . . . . . . 2,468 33,312Enbridge Energy Partners, L.P. . . . . . . . . . . . . . . . . . . . . . . . . . . . . . . . . . . . . . 2,671 39,056Energy Transfer Partners, L.P. . . . . . . . . . . . . . . . . . . . . . . . . . . . . . . . . . . . . . 18,385 305,374EnLink Midstream Partners, LP . . . . . . . . . . . . . . . . . . . . . . . . . . . . . . . . . . . . 4,120 65,878Enterprise Products Partners L.P.(8) . . . . . . . . . . . . . . . . . . . . . . . . . . . . . . . . . . 19,830 488,403EQT Midstream Partners, LP . . . . . . . . . . . . . . . . . . . . . . . . . . . . . . . . . . . . . . 654 44,859Genesis Energy, L.P. . . . . . . . . . . . . . . . . . . . . . . . . . . . . . . . . . . . . . . . . . . . . . 646 13,861Global Partners LP . . . . . . . . . . . . . . . . . . . . . . . . . . . . . . . . . . . . . . . . . . . . . . 790 13,745Magellan Midstream Partners, L.P. . . . . . . . . . . . . . . . . . . . . . . . . . . . . . . . . . 1,930 129,279MPLX LP . . . . . . . . . . . . . . . . . . . . . . . . . . . . . . . . . . . . . . . . . . . . . . . . . . . . . 4,753 170,451MPLX LP — Convertible Preferred Units(4)(5)(9) . . . . . . . . . . . . . . . . . . . . . . . . 2,255 90,779NGL Energy Partners LP . . . . . . . . . . . . . . . . . . . . . . . . . . . . . . . . . . . . . . . . . 1,104 13,802Noble Midstream Partners LP . . . . . . . . . . . . . . . . . . . . . . . . . . . . . . . . . . . . . . 278 13,761NuStar Energy L.P. . . . . . . . . . . . . . . . . . . . . . . . . . . . . . . . . . . . . . . . . . . . . . . 651 18,912Oasis Midstream Partners LP(3) . . . . . . . . . . . . . . . . . . . . . . . . . . . . . . . . . . . . . 675 12,223Phillips 66 Partners LP . . . . . . . . . . . . . . . . . . . . . . . . . . . . . . . . . . . . . . . . . . . 533 24,965Plains All American Pipeline, L.P.(10) . . . . . . . . . . . . . . . . . . . . . . . . . . . . . . . 8,710 169,854Plains GP Holdings, L.P. — Plains AAP, L.P.(5)(10)(11) . . . . . . . . . . . . . . . . . . . 1,278 26,305Shell Midstream Partners, L.P. . . . . . . . . . . . . . . . . . . . . . . . . . . . . . . . . . . . . . 977 26,422Spectra Energy Partners, LP . . . . . . . . . . . . . . . . . . . . . . . . . . . . . . . . . . . . . . . 1,357 55,545Sprague Resources LP . . . . . . . . . . . . . . . . . . . . . . . . . . . . . . . . . . . . . . . . . . . . 713 17,284Summit Midstream Partners, LP . . . . . . . . . . . . . . . . . . . . . . . . . . . . . . . . . . . . 1,997 37,852Tallgrass Energy Partners, LP . . . . . . . . . . . . . . . . . . . . . . . . . . . . . . . . . . . . . . 1,469 64,501TC PipeLines, LP . . . . . . . . . . . . . . . . . . . . . . . . . . . . . . . . . . . . . . . . . . . . . . . 743 37,732Western Gas Partners, LP . . . . . . . . . . . . . . . . . . . . . . . . . . . . . . . . . . . . . . . . . 3,879 173,862Williams Partners L.P. . . . . . . . . . . . . . . . . . . . . . . . . . . . . . . . . . . . . . . . . . . . 8,287 304,134
2,869,702
Midstream Company — 21.3%Kinder Morgan, Inc. . . . . . . . . . . . . . . . . . . . . . . . . . . . . . . . . . . . . . . . . . . . . . 1,105 19,030ONEOK, Inc. . . . . . . . . . . . . . . . . . . . . . . . . . . . . . . . . . . . . . . . . . . . . . . . . . . . 4,341 225,285Targa Resources Corp. . . . . . . . . . . . . . . . . . . . . . . . . . . . . . . . . . . . . . . . . . . . 3,332 144,616
388,931
Shipping MLP — 1.4%Capital Product Partners L.P. — Class B Units(4)(5)(12) . . . . . . . . . . . . . . . . . . . 3,030 23,758Golar LNG Partners LP . . . . . . . . . . . . . . . . . . . . . . . . . . . . . . . . . . . . . . . . . . . 122 2,432
26,190
See accompanying notes to financial statements.
13
KAYNE ANDERSON MLP INVESTMENT COMPANYSCHEDULE OF INVESTMENTS
NOVEMBER 30, 2017(amounts in 000’s)
DescriptionNo. of
Shares/Units Value
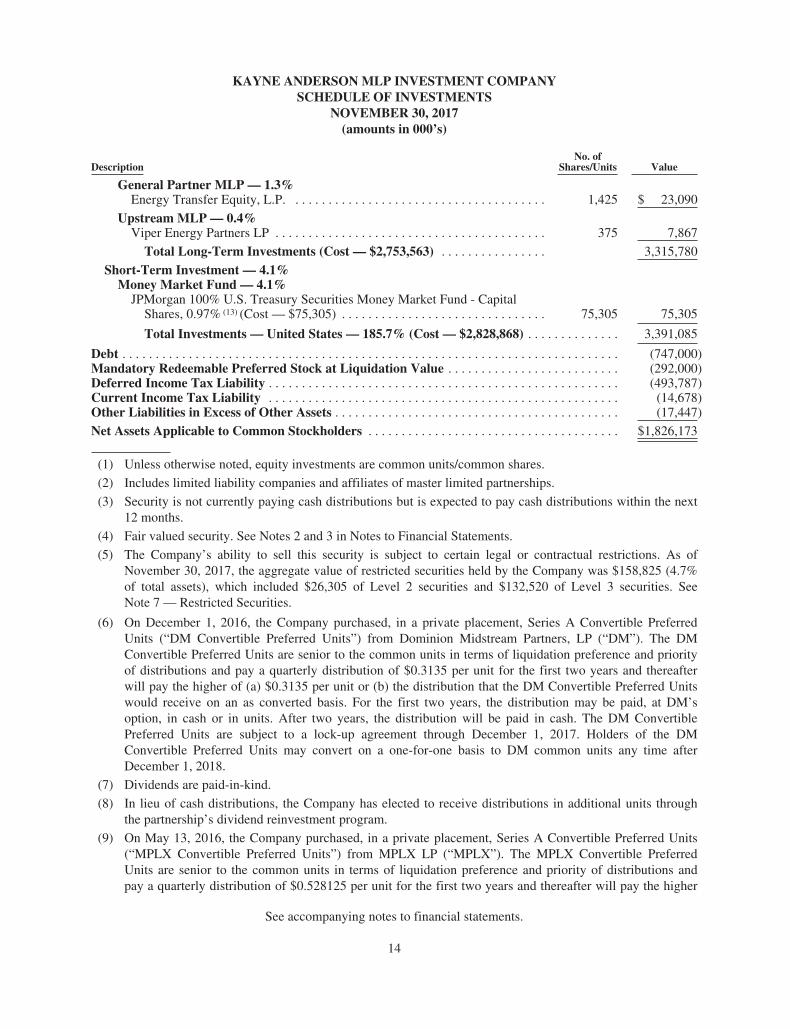
General Partner MLP — 1.3%Energy Transfer Equity, L.P. . . . . . . . . . . . . . . . . . . . . . . . . . . . . . . . . . . . . . . 1,425 $ 23,090
Upstream MLP — 0.4%Viper Energy Partners LP . . . . . . . . . . . . . . . . . . . . . . . . . . . . . . . . . . . . . . . . . 375 7,867
Total Long-Term Investments (Cost — $2,753,563) . . . . . . . . . . . . . . . . 3,315,780
Short-Term Investment — 4.1%Money Market Fund — 4.1%
JPMorgan 100% U.S. Treasury Securities Money Market Fund - CapitalShares, 0.97% (13) (Cost — $75,305) . . . . . . . . . . . . . . . . . . . . . . . . . . . . . . . 75,305 75,305
Total Investments — United States — 185.7% (Cost — $2,828,868) . . . . . . . . . . . . . . 3,391,085
Debt . . . . . . . . . . . . . . . . . . . . . . . . . . . . . . . . . . . . . . . . . . . . . . . . . . . . . . . . . . . . . . . . . . . . . . . . . . . (747,000)Mandatory Redeemable Preferred Stock at Liquidation Value . . . . . . . . . . . . . . . . . . . . . . . . . . (292,000)Deferred Income Tax Liability . . . . . . . . . . . . . . . . . . . . . . . . . . . . . . . . . . . . . . . . . . . . . . . . . . . . . (493,787)Current Income Tax Liability . . . . . . . . . . . . . . . . . . . . . . . . . . . . . . . . . . . . . . . . . . . . . . . . . . . . . (14,678)Other Liabilities in Excess of Other Assets . . . . . . . . . . . . . . . . . . . . . . . . . . . . . . . . . . . . . . . . . . . (17,447)
Net Assets Applicable to Common Stockholders . . . . . . . . . . . . . . . . . . . . . . . . . . . . . . . . . . . . . . $1,826,173
(1) Unless otherwise noted, equity investments are common units/common shares.
(2) Includes limited liability companies and affiliates of master limited partnerships.
(3) Security is not currently paying cash distributions but is expected to pay cash distributions within the next12 months.
(4) Fair valued security. See Notes 2 and 3 in Notes to Financial Statements.
(5) The Company’s ability to sell this security is subject to certain legal or contractual restrictions. As ofNovember 30, 2017, the aggregate value of restricted securities held by the Company was $158,825 (4.7%of total assets), which included $26,305 of Level 2 securities and $132,520 of Level 3 securities. SeeNote 7 — Restricted Securities.
(6) On December 1, 2016, the Company purchased, in a private placement, Series A Convertible PreferredUnits (“DM Convertible Preferred Units”) from Dominion Midstream Partners, LP (“DM”). The DMConvertible Preferred Units are senior to the common units in terms of liquidation preference and priorityof distributions and pay a quarterly distribution of $0.3135 per unit for the first two years and thereafterwill pay the higher of (a) $0.3135 per unit or (b) the distribution that the DM Convertible Preferred Unitswould receive on an as converted basis. For the first two years, the distribution may be paid, at DM’soption, in cash or in units. After two years, the distribution will be paid in cash. The DM ConvertiblePreferred Units are subject to a lock-up agreement through December 1, 2017. Holders of the DMConvertible Preferred Units may convert on a one-for-one basis to DM common units any time afterDecember 1, 2018.
(7) Dividends are paid-in-kind.
(8) In lieu of cash distributions, the Company has elected to receive distributions in additional units throughthe partnership’s dividend reinvestment program.
(9) On May 13, 2016, the Company purchased, in a private placement, Series A Convertible Preferred Units(“MPLX Convertible Preferred Units”) from MPLX LP (“MPLX”). The MPLX Convertible PreferredUnits are senior to the common units in terms of liquidation preference and priority of distributions andpay a quarterly distribution of $0.528125 per unit for the first two years and thereafter will pay the higher
See accompanying notes to financial statements.
14
KAYNE ANDERSON MLP INVESTMENT COMPANYSCHEDULE OF INVESTMENTS
NOVEMBER 30, 2017(amounts in 000’s)
of (a) $0.528125 per unit or (b) the distribution that the MPLX Convertible Preferred Units would receiveon an as converted basis. Holders of the MPLX Convertible Preferred Units may convert on a one-for-onebasis to MPLX common units any time after May 13, 2019.
(10) The Company believes that it is an affiliate of Plains AAP, L.P. (“PAGP-AAP”) and Plains All AmericanPipeline, L.P. (“PAA”). See Note 5 — Agreements and Affiliations.
(11) The Company’s ownership of PAGP-AAP is exchangeable on a one-for-one basis into either Plains GPHoldings, L.P. (“PAGP”) shares or PAA units at the Company’s option. The Company values its PAGP-AAP investment on an “as exchanged” basis based on the higher public market value of either PAGP orPAA. As of November 30, 2017, the Company’s PAGP-AAP investment is valued at PAGP’s closingprice. See Notes 3 and 7 in Notes to Financial Statements.
(12) Class B Units are convertible on a one-for-one basis into common units of Capital Product Partners L.P.(“CPLP”) and are senior to the common units in terms of liquidation preference and priority ofdistributions (liquidation preference of $9.00 per unit). The Class B Units pay quarterly cash distributionsand are convertible at any time at the option of the holder. The Class B Units paid a distribution of$0.21375 per unit for the fourth quarter.
(13) The rate indicated is the current yield as of November 30, 2017.
See accompanying notes to financial statements.
15
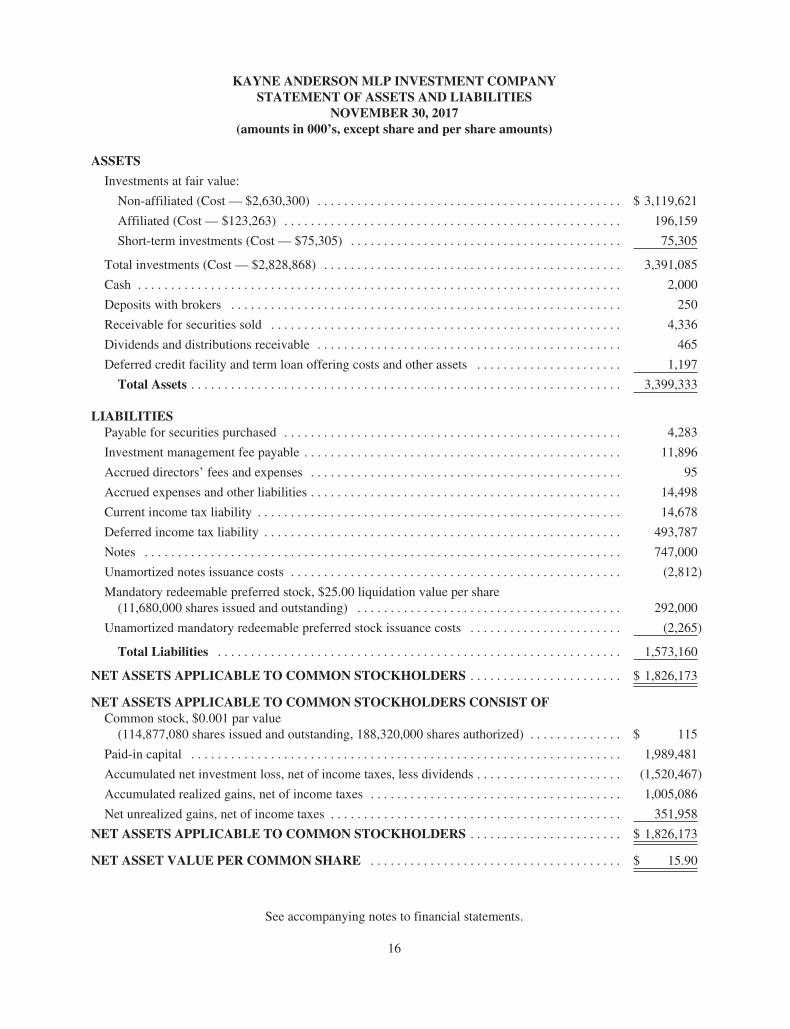
KAYNE ANDERSON MLP INVESTMENT COMPANYSTATEMENT OF ASSETS AND LIABILITIES
NOVEMBER 30, 2017(amounts in 000’s, except share and per share amounts)
ASSETS
Investments at fair value:
Non-affiliated (Cost — $2,630,300) . . . . . . . . . . . . . . . . . . . . . . . . . . . . . . . . . . . . . . . . . . . . . . $ 3,119,621
Affiliated (Cost — $123,263) . . . . . . . . . . . . . . . . . . . . . . . . . . . . . . . . . . . . . . . . . . . . . . . . . . . 196,159
Short-term investments (Cost — $75,305) . . . . . . . . . . . . . . . . . . . . . . . . . . . . . . . . . . . . . . . . . 75,305
Total investments (Cost — $2,828,868) . . . . . . . . . . . . . . . . . . . . . . . . . . . . . . . . . . . . . . . . . . . . . 3,391,085
Cash . . . . . . . . . . . . . . . . . . . . . . . . . . . . . . . . . . . . . . . . . . . . . . . . . . . . . . . . . . . . . . . . . . . . . . . . . 2,000
Deposits with brokers . . . . . . . . . . . . . . . . . . . . . . . . . . . . . . . . . . . . . . . . . . . . . . . . . . . . . . . . . . . 250
Receivable for securities sold . . . . . . . . . . . . . . . . . . . . . . . . . . . . . . . . . . . . . . . . . . . . . . . . . . . . . 4,336
Dividends and distributions receivable . . . . . . . . . . . . . . . . . . . . . . . . . . . . . . . . . . . . . . . . . . . . . . 465
Deferred credit facility and term loan offering costs and other assets . . . . . . . . . . . . . . . . . . . . . . 1,197
Total Assets . . . . . . . . . . . . . . . . . . . . . . . . . . . . . . . . . . . . . . . . . . . . . . . . . . . . . . . . . . . . . . . . . 3,399,333
LIABILITIESPayable for securities purchased . . . . . . . . . . . . . . . . . . . . . . . . . . . . . . . . . . . . . . . . . . . . . . . . . . . 4,283
Investment management fee payable . . . . . . . . . . . . . . . . . . . . . . . . . . . . . . . . . . . . . . . . . . . . . . . . 11,896
Accrued directors’ fees and expenses . . . . . . . . . . . . . . . . . . . . . . . . . . . . . . . . . . . . . . . . . . . . . . . 95
Accrued expenses and other liabilities . . . . . . . . . . . . . . . . . . . . . . . . . . . . . . . . . . . . . . . . . . . . . . . 14,498
Current income tax liability . . . . . . . . . . . . . . . . . . . . . . . . . . . . . . . . . . . . . . . . . . . . . . . . . . . . . . . 14,678
Deferred income tax liability . . . . . . . . . . . . . . . . . . . . . . . . . . . . . . . . . . . . . . . . . . . . . . . . . . . . . . 493,787
Notes . . . . . . . . . . . . . . . . . . . . . . . . . . . . . . . . . . . . . . . . . . . . . . . . . . . . . . . . . . . . . . . . . . . . . . . . 747,000
Unamortized notes issuance costs . . . . . . . . . . . . . . . . . . . . . . . . . . . . . . . . . . . . . . . . . . . . . . . . . . (2,812)
Mandatory redeemable preferred stock, $25.00 liquidation value per share(11,680,000 shares issued and outstanding) . . . . . . . . . . . . . . . . . . . . . . . . . . . . . . . . . . . . . . . . 292,000
Unamortized mandatory redeemable preferred stock issuance costs . . . . . . . . . . . . . . . . . . . . . . . (2,265)
Total Liabilities . . . . . . . . . . . . . . . . . . . . . . . . . . . . . . . . . . . . . . . . . . . . . . . . . . . . . . . . . . . . . 1,573,160
NET ASSETS APPLICABLE TO COMMON STOCKHOLDERS . . . . . . . . . . . . . . . . . . . . . . . $ 1,826,173
NET ASSETS APPLICABLE TO COMMON STOCKHOLDERS CONSIST OFCommon stock, $0.001 par value
(114,877,080 shares issued and outstanding, 188,320,000 shares authorized) . . . . . . . . . . . . . . $ 115
Paid-in capital . . . . . . . . . . . . . . . . . . . . . . . . . . . . . . . . . . . . . . . . . . . . . . . . . . . . . . . . . . . . . . . . . 1,989,481
Accumulated net investment loss, net of income taxes, less dividends . . . . . . . . . . . . . . . . . . . . . . (1,520,467)
Accumulated realized gains, net of income taxes . . . . . . . . . . . . . . . . . . . . . . . . . . . . . . . . . . . . . . 1,005,086
Net unrealized gains, net of income taxes . . . . . . . . . . . . . . . . . . . . . . . . . . . . . . . . . . . . . . . . . . . . 351,958
NET ASSETS APPLICABLE TO COMMON STOCKHOLDERS . . . . . . . . . . . . . . . . . . . . . . . $ 1,826,173
NET ASSET VALUE PER COMMON SHARE . . . . . . . . . . . . . . . . . . . . . . . . . . . . . . . . . . . . . . $ 15.90
See accompanying notes to financial statements.
16
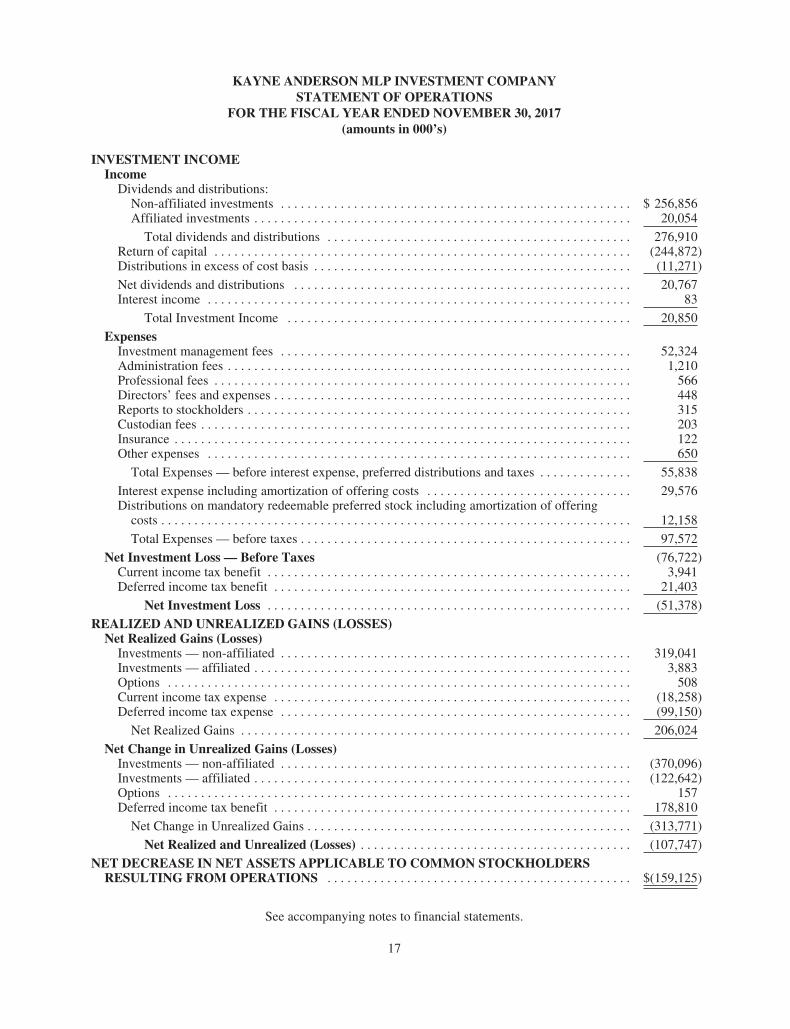
KAYNE ANDERSON MLP INVESTMENT COMPANYSTATEMENT OF OPERATIONS
FOR THE FISCAL YEAR ENDED NOVEMBER 30, 2017(amounts in 000’s)
INVESTMENT INCOMEIncome
Dividends and distributions:Non-affiliated investments . . . . . . . . . . . . . . . . . . . . . . . . . . . . . . . . . . . . . . . . . . . . . . . . . . . . . $ 256,856Affiliated investments . . . . . . . . . . . . . . . . . . . . . . . . . . . . . . . . . . . . . . . . . . . . . . . . . . . . . . . . . 20,054
Total dividends and distributions . . . . . . . . . . . . . . . . . . . . . . . . . . . . . . . . . . . . . . . . . . . . . . 276,910Return of capital . . . . . . . . . . . . . . . . . . . . . . . . . . . . . . . . . . . . . . . . . . . . . . . . . . . . . . . . . . . . . . . (244,872)Distributions in excess of cost basis . . . . . . . . . . . . . . . . . . . . . . . . . . . . . . . . . . . . . . . . . . . . . . . . (11,271)
Net dividends and distributions . . . . . . . . . . . . . . . . . . . . . . . . . . . . . . . . . . . . . . . . . . . . . . . . . . . 20,767Interest income . . . . . . . . . . . . . . . . . . . . . . . . . . . . . . . . . . . . . . . . . . . . . . . . . . . . . . . . . . . . . . . . 83
Total Investment Income . . . . . . . . . . . . . . . . . . . . . . . . . . . . . . . . . . . . . . . . . . . . . . . . . . . . 20,850
ExpensesInvestment management fees . . . . . . . . . . . . . . . . . . . . . . . . . . . . . . . . . . . . . . . . . . . . . . . . . . . . . 52,324Administration fees . . . . . . . . . . . . . . . . . . . . . . . . . . . . . . . . . . . . . . . . . . . . . . . . . . . . . . . . . . . . . 1,210Professional fees . . . . . . . . . . . . . . . . . . . . . . . . . . . . . . . . . . . . . . . . . . . . . . . . . . . . . . . . . . . . . . . 566Directors’ fees and expenses . . . . . . . . . . . . . . . . . . . . . . . . . . . . . . . . . . . . . . . . . . . . . . . . . . . . . . 448Reports to stockholders . . . . . . . . . . . . . . . . . . . . . . . . . . . . . . . . . . . . . . . . . . . . . . . . . . . . . . . . . . 315Custodian fees . . . . . . . . . . . . . . . . . . . . . . . . . . . . . . . . . . . . . . . . . . . . . . . . . . . . . . . . . . . . . . . . . 203Insurance . . . . . . . . . . . . . . . . . . . . . . . . . . . . . . . . . . . . . . . . . . . . . . . . . . . . . . . . . . . . . . . . . . . . . 122Other expenses . . . . . . . . . . . . . . . . . . . . . . . . . . . . . . . . . . . . . . . . . . . . . . . . . . . . . . . . . . . . . . . . 650
Total Expenses — before interest expense, preferred distributions and taxes . . . . . . . . . . . . . . 55,838
Interest expense including amortization of offering costs . . . . . . . . . . . . . . . . . . . . . . . . . . . . . . . 29,576Distributions on mandatory redeemable preferred stock including amortization of offering
costs . . . . . . . . . . . . . . . . . . . . . . . . . . . . . . . . . . . . . . . . . . . . . . . . . . . . . . . . . . . . . . . . . . . . . . . 12,158
Total Expenses — before taxes . . . . . . . . . . . . . . . . . . . . . . . . . . . . . . . . . . . . . . . . . . . . . . . . . . 97,572
Net Investment Loss — Before Taxes (76,722)Current income tax benefit . . . . . . . . . . . . . . . . . . . . . . . . . . . . . . . . . . . . . . . . . . . . . . . . . . . . . . . 3,941Deferred income tax benefit . . . . . . . . . . . . . . . . . . . . . . . . . . . . . . . . . . . . . . . . . . . . . . . . . . . . . . 21,403
Net Investment Loss . . . . . . . . . . . . . . . . . . . . . . . . . . . . . . . . . . . . . . . . . . . . . . . . . . . . . . . (51,378)
REALIZED AND UNREALIZED GAINS (LOSSES)Net Realized Gains (Losses)
Investments — non-affiliated . . . . . . . . . . . . . . . . . . . . . . . . . . . . . . . . . . . . . . . . . . . . . . . . . . . . . 319,041Investments — affiliated . . . . . . . . . . . . . . . . . . . . . . . . . . . . . . . . . . . . . . . . . . . . . . . . . . . . . . . . . 3,883Options . . . . . . . . . . . . . . . . . . . . . . . . . . . . . . . . . . . . . . . . . . . . . . . . . . . . . . . . . . . . . . . . . . . . . . 508Current income tax expense . . . . . . . . . . . . . . . . . . . . . . . . . . . . . . . . . . . . . . . . . . . . . . . . . . . . . . (18,258)Deferred income tax expense . . . . . . . . . . . . . . . . . . . . . . . . . . . . . . . . . . . . . . . . . . . . . . . . . . . . . (99,150)
Net Realized Gains . . . . . . . . . . . . . . . . . . . . . . . . . . . . . . . . . . . . . . . . . . . . . . . . . . . . . . . . . . . 206,024
Net Change in Unrealized Gains (Losses)Investments — non-affiliated . . . . . . . . . . . . . . . . . . . . . . . . . . . . . . . . . . . . . . . . . . . . . . . . . . . . . (370,096)Investments — affiliated . . . . . . . . . . . . . . . . . . . . . . . . . . . . . . . . . . . . . . . . . . . . . . . . . . . . . . . . . (122,642)Options . . . . . . . . . . . . . . . . . . . . . . . . . . . . . . . . . . . . . . . . . . . . . . . . . . . . . . . . . . . . . . . . . . . . . . 157Deferred income tax benefit . . . . . . . . . . . . . . . . . . . . . . . . . . . . . . . . . . . . . . . . . . . . . . . . . . . . . . 178,810
Net Change in Unrealized Gains . . . . . . . . . . . . . . . . . . . . . . . . . . . . . . . . . . . . . . . . . . . . . . . . . (313,771)
Net Realized and Unrealized (Losses) . . . . . . . . . . . . . . . . . . . . . . . . . . . . . . . . . . . . . . . . . (107,747)
NET DECREASE IN NET ASSETS APPLICABLE TO COMMON STOCKHOLDERSRESULTING FROM OPERATIONS . . . . . . . . . . . . . . . . . . . . . . . . . . . . . . . . . . . . . . . . . . . . . . $(159,125)
See accompanying notes to financial statements.
17
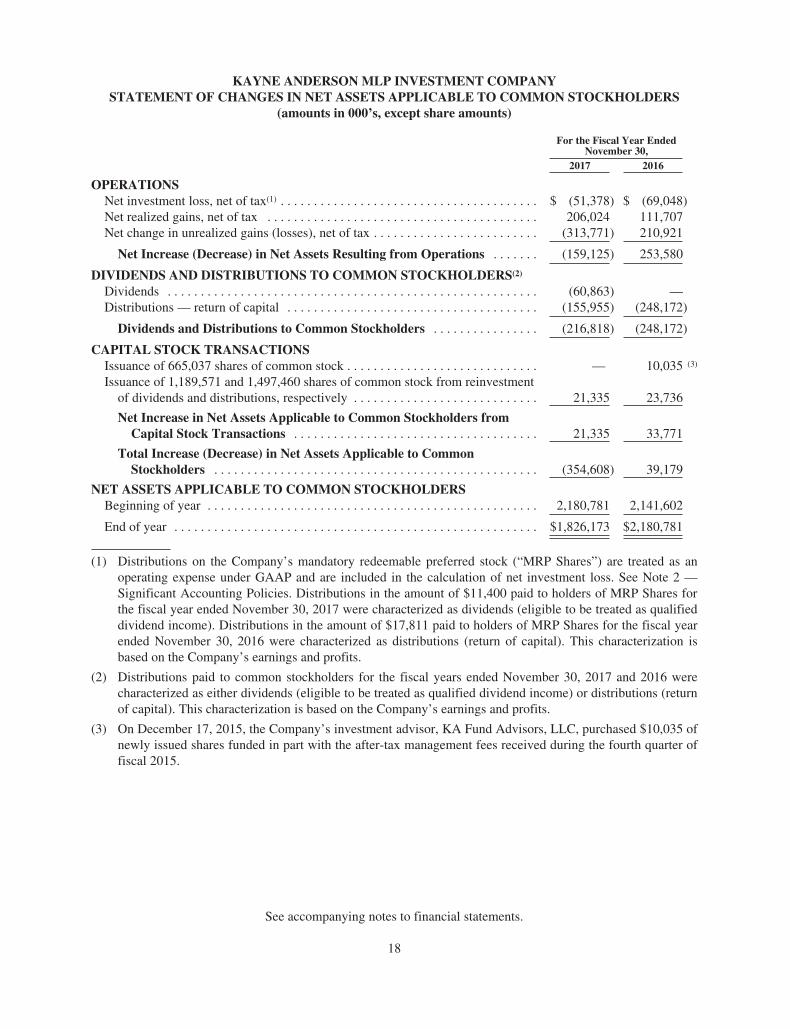
KAYNE ANDERSON MLP INVESTMENT COMPANYSTATEMENT OF CHANGES IN NET ASSETS APPLICABLE TO COMMON STOCKHOLDERS
(amounts in 000’s, except share amounts)
For the Fiscal Year EndedNovember 30,
2017 2016
OPERATIONSNet investment loss, net of tax(1) . . . . . . . . . . . . . . . . . . . . . . . . . . . . . . . . . . . . . . . $ (51,378) $ (69,048)Net realized gains, net of tax . . . . . . . . . . . . . . . . . . . . . . . . . . . . . . . . . . . . . . . . . 206,024 111,707Net change in unrealized gains (losses), net of tax . . . . . . . . . . . . . . . . . . . . . . . . . (313,771) 210,921
Net Increase (Decrease) in Net Assets Resulting from Operations . . . . . . . (159,125) 253,580
DIVIDENDS AND DISTRIBUTIONS TO COMMON STOCKHOLDERS(2)
Dividends . . . . . . . . . . . . . . . . . . . . . . . . . . . . . . . . . . . . . . . . . . . . . . . . . . . . . . . . (60,863) —Distributions — return of capital . . . . . . . . . . . . . . . . . . . . . . . . . . . . . . . . . . . . . . (155,955) (248,172)
Dividends and Distributions to Common Stockholders . . . . . . . . . . . . . . . . (216,818) (248,172)
CAPITAL STOCK TRANSACTIONSIssuance of 665,037 shares of common stock . . . . . . . . . . . . . . . . . . . . . . . . . . . . . — 10,035 (3)
Issuance of 1,189,571 and 1,497,460 shares of common stock from reinvestmentof dividends and distributions, respectively . . . . . . . . . . . . . . . . . . . . . . . . . . . . 21,335 23,736
Net Increase in Net Assets Applicable to Common Stockholders fromCapital Stock Transactions . . . . . . . . . . . . . . . . . . . . . . . . . . . . . . . . . . . . . 21,335 33,771
Total Increase (Decrease) in Net Assets Applicable to CommonStockholders . . . . . . . . . . . . . . . . . . . . . . . . . . . . . . . . . . . . . . . . . . . . . . . . . (354,608) 39,179
NET ASSETS APPLICABLE TO COMMON STOCKHOLDERSBeginning of year . . . . . . . . . . . . . . . . . . . . . . . . . . . . . . . . . . . . . . . . . . . . . . . . . . 2,180,781 2,141,602
End of year . . . . . . . . . . . . . . . . . . . . . . . . . . . . . . . . . . . . . . . . . . . . . . . . . . . . . . . $1,826,173 $2,180,781
(1) Distributions on the Company’s mandatory redeemable preferred stock (“MRP Shares”) are treated as anoperating expense under GAAP and are included in the calculation of net investment loss. See Note 2 —Significant Accounting Policies. Distributions in the amount of $11,400 paid to holders of MRP Shares forthe fiscal year ended November 30, 2017 were characterized as dividends (eligible to be treated as qualifieddividend income). Distributions in the amount of $17,811 paid to holders of MRP Shares for the fiscal yearended November 30, 2016 were characterized as distributions (return of capital). This characterization isbased on the Company’s earnings and profits.
(2) Distributions paid to common stockholders for the fiscal years ended November 30, 2017 and 2016 werecharacterized as either dividends (eligible to be treated as qualified dividend income) or distributions (returnof capital). This characterization is based on the Company’s earnings and profits.
(3) On December 17, 2015, the Company’s investment advisor, KA Fund Advisors, LLC, purchased $10,035 ofnewly issued shares funded in part with the after-tax management fees received during the fourth quarter offiscal 2015.
See accompanying notes to financial statements.
18
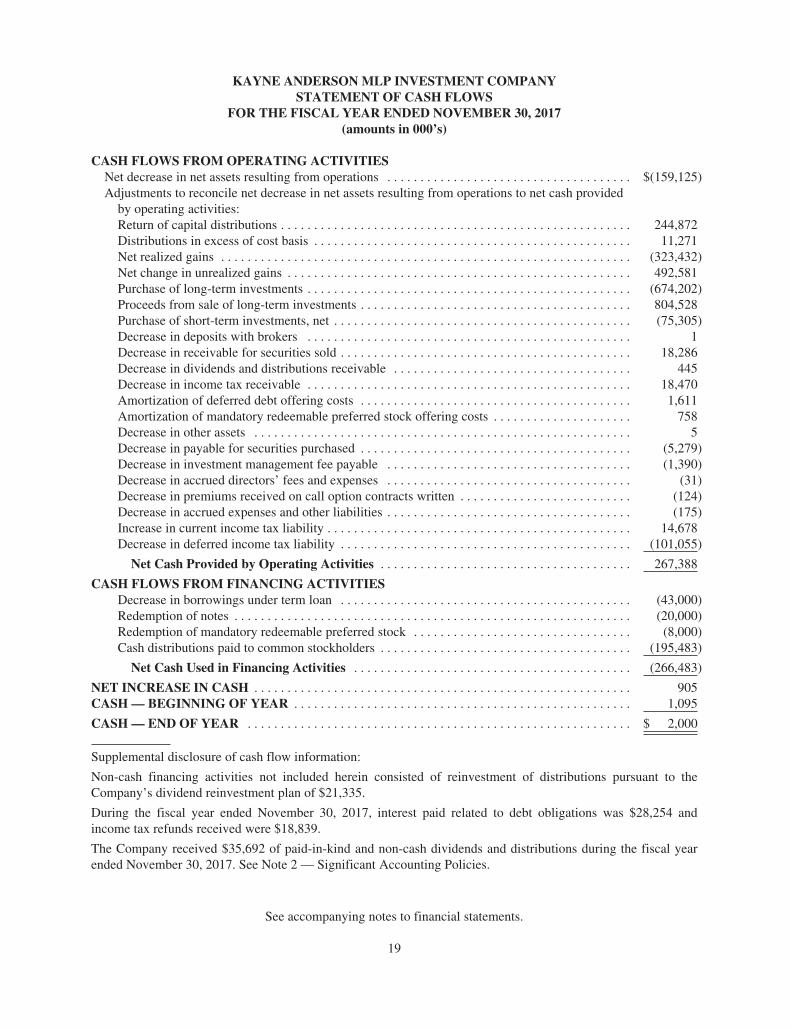
KAYNE ANDERSON MLP INVESTMENT COMPANYSTATEMENT OF CASH FLOWS
FOR THE FISCAL YEAR ENDED NOVEMBER 30, 2017(amounts in 000’s)
CASH FLOWS FROM OPERATING ACTIVITIESNet decrease in net assets resulting from operations . . . . . . . . . . . . . . . . . . . . . . . . . . . . . . . . . . . . . $(159,125)Adjustments to reconcile net decrease in net assets resulting from operations to net cash provided
by operating activities:Return of capital distributions . . . . . . . . . . . . . . . . . . . . . . . . . . . . . . . . . . . . . . . . . . . . . . . . . . . . . 244,872Distributions in excess of cost basis . . . . . . . . . . . . . . . . . . . . . . . . . . . . . . . . . . . . . . . . . . . . . . . . 11,271Net realized gains . . . . . . . . . . . . . . . . . . . . . . . . . . . . . . . . . . . . . . . . . . . . . . . . . . . . . . . . . . . . . . (323,432)Net change in unrealized gains . . . . . . . . . . . . . . . . . . . . . . . . . . . . . . . . . . . . . . . . . . . . . . . . . . . . 492,581Purchase of long-term investments . . . . . . . . . . . . . . . . . . . . . . . . . . . . . . . . . . . . . . . . . . . . . . . . . (674,202)Proceeds from sale of long-term investments . . . . . . . . . . . . . . . . . . . . . . . . . . . . . . . . . . . . . . . . . 804,528Purchase of short-term investments, net . . . . . . . . . . . . . . . . . . . . . . . . . . . . . . . . . . . . . . . . . . . . . (75,305)Decrease in deposits with brokers . . . . . . . . . . . . . . . . . . . . . . . . . . . . . . . . . . . . . . . . . . . . . . . . . 1Decrease in receivable for securities sold . . . . . . . . . . . . . . . . . . . . . . . . . . . . . . . . . . . . . . . . . . . . 18,286Decrease in dividends and distributions receivable . . . . . . . . . . . . . . . . . . . . . . . . . . . . . . . . . . . . 445Decrease in income tax receivable . . . . . . . . . . . . . . . . . . . . . . . . . . . . . . . . . . . . . . . . . . . . . . . . . 18,470Amortization of deferred debt offering costs . . . . . . . . . . . . . . . . . . . . . . . . . . . . . . . . . . . . . . . . . 1,611Amortization of mandatory redeemable preferred stock offering costs . . . . . . . . . . . . . . . . . . . . . 758Decrease in other assets . . . . . . . . . . . . . . . . . . . . . . . . . . . . . . . . . . . . . . . . . . . . . . . . . . . . . . . . . 5Decrease in payable for securities purchased . . . . . . . . . . . . . . . . . . . . . . . . . . . . . . . . . . . . . . . . . (5,279)Decrease in investment management fee payable . . . . . . . . . . . . . . . . . . . . . . . . . . . . . . . . . . . . . (1,390)Decrease in accrued directors’ fees and expenses . . . . . . . . . . . . . . . . . . . . . . . . . . . . . . . . . . . . . (31)Decrease in premiums received on call option contracts written . . . . . . . . . . . . . . . . . . . . . . . . . . (124)Decrease in accrued expenses and other liabilities . . . . . . . . . . . . . . . . . . . . . . . . . . . . . . . . . . . . . (175)Increase in current income tax liability . . . . . . . . . . . . . . . . . . . . . . . . . . . . . . . . . . . . . . . . . . . . . . 14,678Decrease in deferred income tax liability . . . . . . . . . . . . . . . . . . . . . . . . . . . . . . . . . . . . . . . . . . . . (101,055)
Net Cash Provided by Operating Activities . . . . . . . . . . . . . . . . . . . . . . . . . . . . . . . . . . . . . . 267,388
CASH FLOWS FROM FINANCING ACTIVITIESDecrease in borrowings under term loan . . . . . . . . . . . . . . . . . . . . . . . . . . . . . . . . . . . . . . . . . . . . (43,000)Redemption of notes . . . . . . . . . . . . . . . . . . . . . . . . . . . . . . . . . . . . . . . . . . . . . . . . . . . . . . . . . . . . (20,000)Redemption of mandatory redeemable preferred stock . . . . . . . . . . . . . . . . . . . . . . . . . . . . . . . . . (8,000)Cash distributions paid to common stockholders . . . . . . . . . . . . . . . . . . . . . . . . . . . . . . . . . . . . . . (195,483)
Net Cash Used in Financing Activities . . . . . . . . . . . . . . . . . . . . . . . . . . . . . . . . . . . . . . . . . . (266,483)
NET INCREASE IN CASH . . . . . . . . . . . . . . . . . . . . . . . . . . . . . . . . . . . . . . . . . . . . . . . . . . . . . . . . . 905CASH — BEGINNING OF YEAR . . . . . . . . . . . . . . . . . . . . . . . . . . . . . . . . . . . . . . . . . . . . . . . . . . . 1,095
CASH — END OF YEAR . . . . . . . . . . . . . . . . . . . . . . . . . . . . . . . . . . . . . . . . . . . . . . . . . . . . . . . . . . $ 2,000
Supplemental disclosure of cash flow information:
Non-cash financing activities not included herein consisted of reinvestment of distributions pursuant to theCompany’s dividend reinvestment plan of $21,335.
During the fiscal year ended November 30, 2017, interest paid related to debt obligations was $28,254 andincome tax refunds received were $18,839.
The Company received $35,692 of paid-in-kind and non-cash dividends and distributions during the fiscal yearended November 30, 2017. See Note 2 — Significant Accounting Policies.
See accompanying notes to financial statements.
19
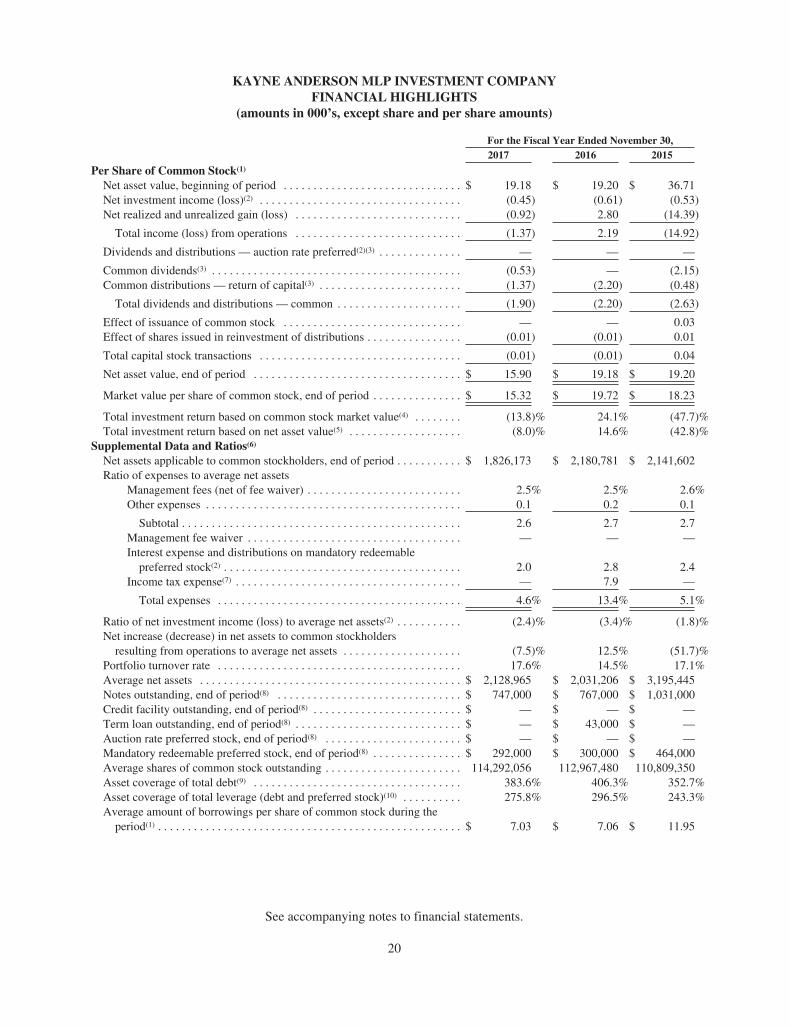
KAYNE ANDERSON MLP INVESTMENT COMPANYFINANCIAL HIGHLIGHTS
(amounts in 000’s, except share and per share amounts)
For the Fiscal Year Ended November 30,2017 2016 2015
Per Share of Common Stock(1)
Net asset value, beginning of period . . . . . . . . . . . . . . . . . . . . . . . . . . . . . . $ 19.18 $ 19.20 $ 36.71Net investment income (loss)(2) . . . . . . . . . . . . . . . . . . . . . . . . . . . . . . . . . . (0.45) (0.61) (0.53)Net realized and unrealized gain (loss) . . . . . . . . . . . . . . . . . . . . . . . . . . . . (0.92) 2.80 (14.39)
Total income (loss) from operations . . . . . . . . . . . . . . . . . . . . . . . . . . . . (1.37) 2.19 (14.92)
Dividends and distributions — auction rate preferred(2)(3) . . . . . . . . . . . . . . — — —
Common dividends(3) . . . . . . . . . . . . . . . . . . . . . . . . . . . . . . . . . . . . . . . . . . (0.53) — (2.15)Common distributions — return of capital(3) . . . . . . . . . . . . . . . . . . . . . . . . (1.37) (2.20) (0.48)
Total dividends and distributions — common . . . . . . . . . . . . . . . . . . . . . (1.90) (2.20) (2.63)
Effect of issuance of common stock . . . . . . . . . . . . . . . . . . . . . . . . . . . . . . — — 0.03Effect of shares issued in reinvestment of distributions . . . . . . . . . . . . . . . . (0.01) (0.01) 0.01
Total capital stock transactions . . . . . . . . . . . . . . . . . . . . . . . . . . . . . . . . . . (0.01) (0.01) 0.04
Net asset value, end of period . . . . . . . . . . . . . . . . . . . . . . . . . . . . . . . . . . . $ 15.90 $ 19.18 $ 19.20
Market value per share of common stock, end of period . . . . . . . . . . . . . . . $ 15.32 $ 19.72 $ 18.23
Total investment return based on common stock market value(4) . . . . . . . . (13.8)% 24.1% (47.7)%Total investment return based on net asset value(5) . . . . . . . . . . . . . . . . . . . (8.0)% 14.6% (42.8)%
Supplemental Data and Ratios(6)
Net assets applicable to common stockholders, end of period . . . . . . . . . . . $ 1,826,173 $ 2,180,781 $ 2,141,602Ratio of expenses to average net assets
Management fees (net of fee waiver) . . . . . . . . . . . . . . . . . . . . . . . . . . 2.5% 2.5% 2.6%Other expenses . . . . . . . . . . . . . . . . . . . . . . . . . . . . . . . . . . . . . . . . . . . 0.1 0.2 0.1
Subtotal . . . . . . . . . . . . . . . . . . . . . . . . . . . . . . . . . . . . . . . . . . . . . . . 2.6 2.7 2.7Management fee waiver . . . . . . . . . . . . . . . . . . . . . . . . . . . . . . . . . . . . — — —Interest expense and distributions on mandatory redeemable
preferred stock(2) . . . . . . . . . . . . . . . . . . . . . . . . . . . . . . . . . . . . . . . . 2.0 2.8 2.4Income tax expense(7) . . . . . . . . . . . . . . . . . . . . . . . . . . . . . . . . . . . . . . — 7.9 —
Total expenses . . . . . . . . . . . . . . . . . . . . . . . . . . . . . . . . . . . . . . . . . 4.6% 13.4% 5.1%
Ratio of net investment income (loss) to average net assets(2) . . . . . . . . . . . (2.4)% (3.4)% (1.8)%Net increase (decrease) in net assets to common stockholders
resulting from operations to average net assets . . . . . . . . . . . . . . . . . . . . (7.5)% 12.5% (51.7)%Portfolio turnover rate . . . . . . . . . . . . . . . . . . . . . . . . . . . . . . . . . . . . . . . . . 17.6% 14.5% 17.1%Average net assets . . . . . . . . . . . . . . . . . . . . . . . . . . . . . . . . . . . . . . . . . . . . $ 2,128,965 $ 2,031,206 $ 3,195,445Notes outstanding, end of period(8) . . . . . . . . . . . . . . . . . . . . . . . . . . . . . . . $ 747,000 $ 767,000 $ 1,031,000Credit facility outstanding, end of period(8) . . . . . . . . . . . . . . . . . . . . . . . . . $ — $ — $ —Term loan outstanding, end of period(8) . . . . . . . . . . . . . . . . . . . . . . . . . . . . $ — $ 43,000 $ —Auction rate preferred stock, end of period(8) . . . . . . . . . . . . . . . . . . . . . . . $ — $ — $ —Mandatory redeemable preferred stock, end of period(8) . . . . . . . . . . . . . . . $ 292,000 $ 300,000 $ 464,000Average shares of common stock outstanding . . . . . . . . . . . . . . . . . . . . . . . 114,292,056 112,967,480 110,809,350Asset coverage of total debt(9) . . . . . . . . . . . . . . . . . . . . . . . . . . . . . . . . . . . 383.6% 406.3% 352.7%Asset coverage of total leverage (debt and preferred stock)(10) . . . . . . . . . . 275.8% 296.5% 243.3%Average amount of borrowings per share of common stock during the
period(1) . . . . . . . . . . . . . . . . . . . . . . . . . . . . . . . . . . . . . . . . . . . . . . . . . . . $ 7.03 $ 7.06 $ 11.95
See accompanying notes to financial statements.
20
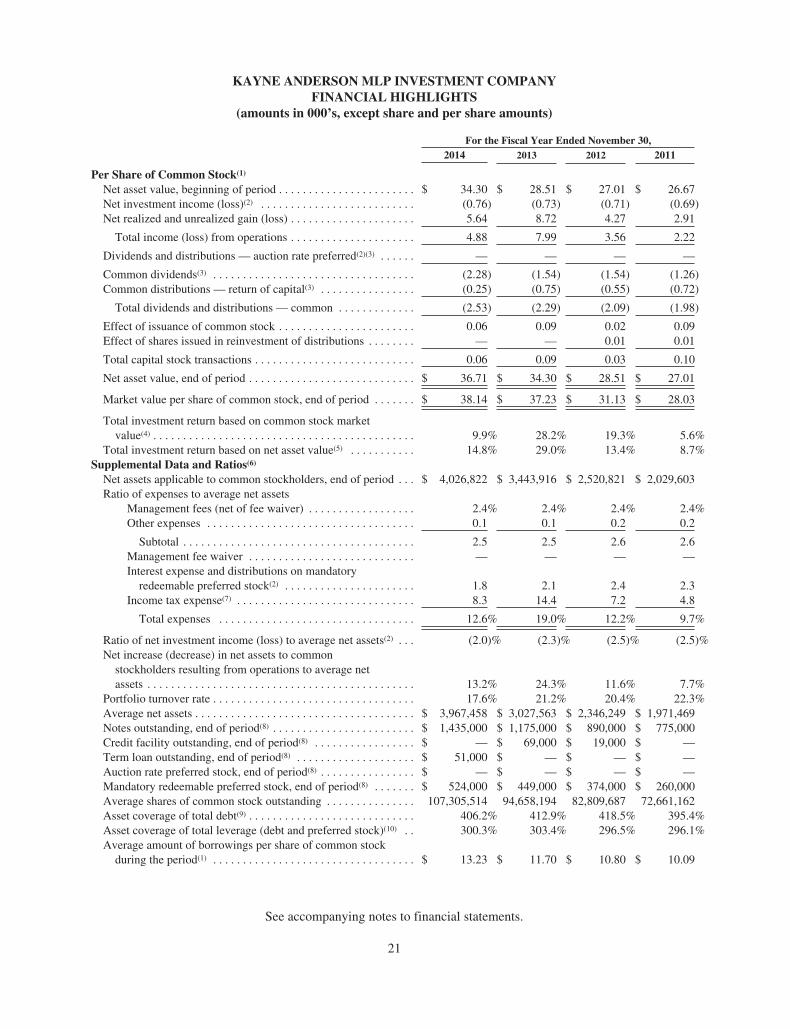
KAYNE ANDERSON MLP INVESTMENT COMPANYFINANCIAL HIGHLIGHTS
(amounts in 000’s, except share and per share amounts)
For the Fiscal Year Ended November 30,2014 2013 2012 2011
Per Share of Common Stock(1)
Net asset value, beginning of period . . . . . . . . . . . . . . . . . . . . . . . $ 34.30 $ 28.51 $ 27.01 $ 26.67Net investment income (loss)(2) . . . . . . . . . . . . . . . . . . . . . . . . . . (0.76) (0.73) (0.71) (0.69)Net realized and unrealized gain (loss) . . . . . . . . . . . . . . . . . . . . . 5.64 8.72 4.27 2.91
Total income (loss) from operations . . . . . . . . . . . . . . . . . . . . . 4.88 7.99 3.56 2.22
Dividends and distributions — auction rate preferred(2)(3) . . . . . . — — — —
Common dividends(3) . . . . . . . . . . . . . . . . . . . . . . . . . . . . . . . . . . (2.28) (1.54) (1.54) (1.26)Common distributions — return of capital(3) . . . . . . . . . . . . . . . . (0.25) (0.75) (0.55) (0.72)
Total dividends and distributions — common . . . . . . . . . . . . . (2.53) (2.29) (2.09) (1.98)
Effect of issuance of common stock . . . . . . . . . . . . . . . . . . . . . . . 0.06 0.09 0.02 0.09Effect of shares issued in reinvestment of distributions . . . . . . . . — — 0.01 0.01
Total capital stock transactions . . . . . . . . . . . . . . . . . . . . . . . . . . . 0.06 0.09 0.03 0.10
Net asset value, end of period . . . . . . . . . . . . . . . . . . . . . . . . . . . . $ 36.71 $ 34.30 $ 28.51 $ 27.01
Market value per share of common stock, end of period . . . . . . . $ 38.14 $ 37.23 $ 31.13 $ 28.03
Total investment return based on common stock marketvalue(4) . . . . . . . . . . . . . . . . . . . . . . . . . . . . . . . . . . . . . . . . . . . . 9.9% 28.2% 19.3% 5.6%
Total investment return based on net asset value(5) . . . . . . . . . . . 14.8% 29.0% 13.4% 8.7%Supplemental Data and Ratios(6)
Net assets applicable to common stockholders, end of period . . . $ 4,026,822 $ 3,443,916 $ 2,520,821 $ 2,029,603Ratio of expenses to average net assets
Management fees (net of fee waiver) . . . . . . . . . . . . . . . . . . 2.4% 2.4% 2.4% 2.4%Other expenses . . . . . . . . . . . . . . . . . . . . . . . . . . . . . . . . . . . 0.1 0.1 0.2 0.2
Subtotal . . . . . . . . . . . . . . . . . . . . . . . . . . . . . . . . . . . . . . . 2.5 2.5 2.6 2.6Management fee waiver . . . . . . . . . . . . . . . . . . . . . . . . . . . . — — — —Interest expense and distributions on mandatory
redeemable preferred stock(2) . . . . . . . . . . . . . . . . . . . . . . 1.8 2.1 2.4 2.3Income tax expense(7) . . . . . . . . . . . . . . . . . . . . . . . . . . . . . . 8.3 14.4 7.2 4.8
Total expenses . . . . . . . . . . . . . . . . . . . . . . . . . . . . . . . . . 12.6% 19.0% 12.2% 9.7%
Ratio of net investment income (loss) to average net assets(2) . . . (2.0)% (2.3)% (2.5)% (2.5)%Net increase (decrease) in net assets to common
stockholders resulting from operations to average netassets . . . . . . . . . . . . . . . . . . . . . . . . . . . . . . . . . . . . . . . . . . . . . 13.2% 24.3% 11.6% 7.7%
Portfolio turnover rate . . . . . . . . . . . . . . . . . . . . . . . . . . . . . . . . . . 17.6% 21.2% 20.4% 22.3%Average net assets . . . . . . . . . . . . . . . . . . . . . . . . . . . . . . . . . . . . . $ 3,967,458 $ 3,027,563 $ 2,346,249 $ 1,971,469Notes outstanding, end of period(8) . . . . . . . . . . . . . . . . . . . . . . . . $ 1,435,000 $ 1,175,000 $ 890,000 $ 775,000Credit facility outstanding, end of period(8) . . . . . . . . . . . . . . . . . $ — $ 69,000 $ 19,000 $ —Term loan outstanding, end of period(8) . . . . . . . . . . . . . . . . . . . . $ 51,000 $ — $ — $ —Auction rate preferred stock, end of period(8) . . . . . . . . . . . . . . . . $ — $ — $ — $ —Mandatory redeemable preferred stock, end of period(8) . . . . . . . $ 524,000 $ 449,000 $ 374,000 $ 260,000Average shares of common stock outstanding . . . . . . . . . . . . . . . 107,305,514 94,658,194 82,809,687 72,661,162Asset coverage of total debt(9) . . . . . . . . . . . . . . . . . . . . . . . . . . . . 406.2% 412.9% 418.5% 395.4%Asset coverage of total leverage (debt and preferred stock)(10) . . 300.3% 303.4% 296.5% 296.1%Average amount of borrowings per share of common stock
during the period(1) . . . . . . . . . . . . . . . . . . . . . . . . . . . . . . . . . . $ 13.23 $ 11.70 $ 10.80 $ 10.09
See accompanying notes to financial statements.
21
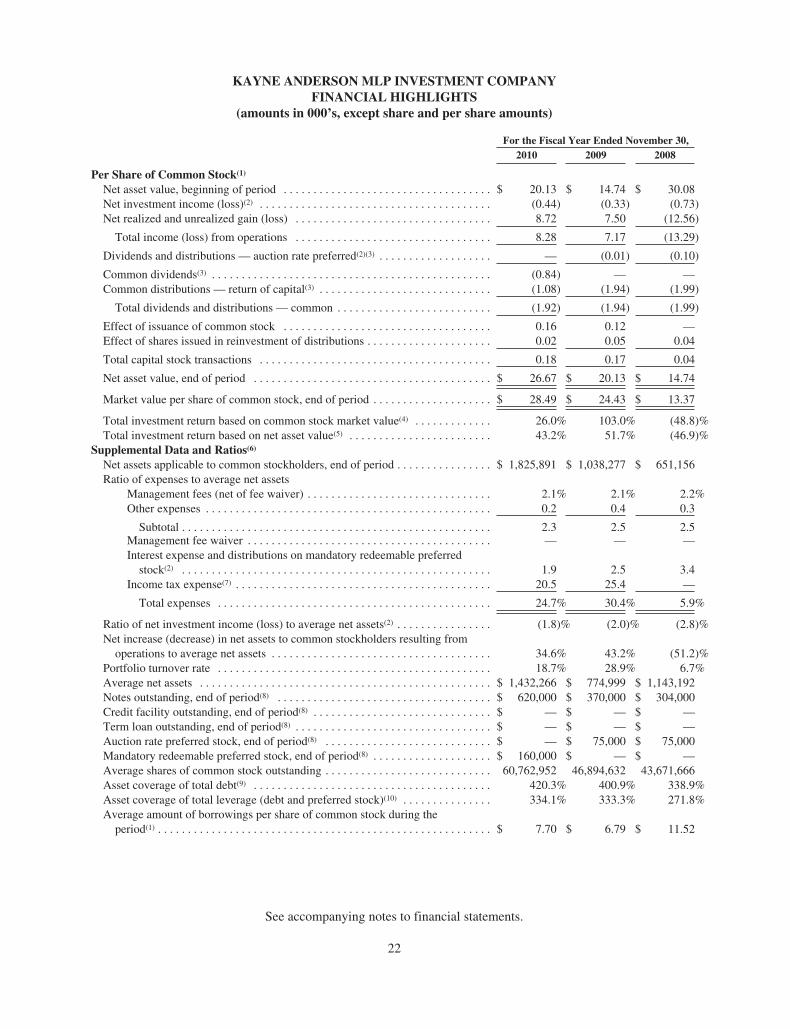
KAYNE ANDERSON MLP INVESTMENT COMPANYFINANCIAL HIGHLIGHTS
(amounts in 000’s, except share and per share amounts)
For the Fiscal Year Ended November 30,2010 2009 2008
Per Share of Common Stock(1)
Net asset value, beginning of period . . . . . . . . . . . . . . . . . . . . . . . . . . . . . . . . . . . $ 20.13 $ 14.74 $ 30.08Net investment income (loss)(2) . . . . . . . . . . . . . . . . . . . . . . . . . . . . . . . . . . . . . . . (0.44) (0.33) (0.73)Net realized and unrealized gain (loss) . . . . . . . . . . . . . . . . . . . . . . . . . . . . . . . . . 8.72 7.50 (12.56)
Total income (loss) from operations . . . . . . . . . . . . . . . . . . . . . . . . . . . . . . . . . 8.28 7.17 (13.29)
Dividends and distributions — auction rate preferred(2)(3) . . . . . . . . . . . . . . . . . . . — (0.01) (0.10)
Common dividends(3) . . . . . . . . . . . . . . . . . . . . . . . . . . . . . . . . . . . . . . . . . . . . . . . (0.84) — —Common distributions — return of capital(3) . . . . . . . . . . . . . . . . . . . . . . . . . . . . . (1.08) (1.94) (1.99)
Total dividends and distributions — common . . . . . . . . . . . . . . . . . . . . . . . . . . (1.92) (1.94) (1.99)
Effect of issuance of common stock . . . . . . . . . . . . . . . . . . . . . . . . . . . . . . . . . . . 0.16 0.12 —Effect of shares issued in reinvestment of distributions . . . . . . . . . . . . . . . . . . . . . 0.02 0.05 0.04
Total capital stock transactions . . . . . . . . . . . . . . . . . . . . . . . . . . . . . . . . . . . . . . . 0.18 0.17 0.04
Net asset value, end of period . . . . . . . . . . . . . . . . . . . . . . . . . . . . . . . . . . . . . . . . $ 26.67 $ 20.13 $ 14.74
Market value per share of common stock, end of period . . . . . . . . . . . . . . . . . . . . $ 28.49 $ 24.43 $ 13.37
Total investment return based on common stock market value(4) . . . . . . . . . . . . . 26.0% 103.0% (48.8)%Total investment return based on net asset value(5) . . . . . . . . . . . . . . . . . . . . . . . . 43.2% 51.7% (46.9)%
Supplemental Data and Ratios(6)
Net assets applicable to common stockholders, end of period . . . . . . . . . . . . . . . . $ 1,825,891 $ 1,038,277 $ 651,156Ratio of expenses to average net assets
Management fees (net of fee waiver) . . . . . . . . . . . . . . . . . . . . . . . . . . . . . . . 2.1% 2.1% 2.2%Other expenses . . . . . . . . . . . . . . . . . . . . . . . . . . . . . . . . . . . . . . . . . . . . . . . . 0.2 0.4 0.3
Subtotal . . . . . . . . . . . . . . . . . . . . . . . . . . . . . . . . . . . . . . . . . . . . . . . . . . . . 2.3 2.5 2.5Management fee waiver . . . . . . . . . . . . . . . . . . . . . . . . . . . . . . . . . . . . . . . . . — — —Interest expense and distributions on mandatory redeemable preferred
stock(2) . . . . . . . . . . . . . . . . . . . . . . . . . . . . . . . . . . . . . . . . . . . . . . . . . . . . 1.9 2.5 3.4Income tax expense(7) . . . . . . . . . . . . . . . . . . . . . . . . . . . . . . . . . . . . . . . . . . . 20.5 25.4 —
Total expenses . . . . . . . . . . . . . . . . . . . . . . . . . . . . . . . . . . . . . . . . . . . . . . 24.7% 30.4% 5.9%
Ratio of net investment income (loss) to average net assets(2) . . . . . . . . . . . . . . . . (1.8)% (2.0)% (2.8)%Net increase (decrease) in net assets to common stockholders resulting from
operations to average net assets . . . . . . . . . . . . . . . . . . . . . . . . . . . . . . . . . . . . . 34.6% 43.2% (51.2)%Portfolio turnover rate . . . . . . . . . . . . . . . . . . . . . . . . . . . . . . . . . . . . . . . . . . . . . . 18.7% 28.9% 6.7%Average net assets . . . . . . . . . . . . . . . . . . . . . . . . . . . . . . . . . . . . . . . . . . . . . . . . . $ 1,432,266 $ 774,999 $ 1,143,192Notes outstanding, end of period(8) . . . . . . . . . . . . . . . . . . . . . . . . . . . . . . . . . . . . $ 620,000 $ 370,000 $ 304,000Credit facility outstanding, end of period(8) . . . . . . . . . . . . . . . . . . . . . . . . . . . . . . $ — $ — $ —Term loan outstanding, end of period(8) . . . . . . . . . . . . . . . . . . . . . . . . . . . . . . . . . $ — $ — $ —Auction rate preferred stock, end of period(8) . . . . . . . . . . . . . . . . . . . . . . . . . . . . $ — $ 75,000 $ 75,000Mandatory redeemable preferred stock, end of period(8) . . . . . . . . . . . . . . . . . . . . $ 160,000 $ — $ —Average shares of common stock outstanding . . . . . . . . . . . . . . . . . . . . . . . . . . . . 60,762,952 46,894,632 43,671,666Asset coverage of total debt(9) . . . . . . . . . . . . . . . . . . . . . . . . . . . . . . . . . . . . . . . . 420.3% 400.9% 338.9%Asset coverage of total leverage (debt and preferred stock)(10) . . . . . . . . . . . . . . . 334.1% 333.3% 271.8%Average amount of borrowings per share of common stock during the
period(1) . . . . . . . . . . . . . . . . . . . . . . . . . . . . . . . . . . . . . . . . . . . . . . . . . . . . . . . . $ 7.70 $ 6.79 $ 11.52
See accompanying notes to financial statements.
22
KAYNE ANDERSON MLP INVESTMENT COMPANYFINANCIAL HIGHLIGHTS
(amounts in 000’s, except share and per share amounts)
(1) Based on average shares of common stock outstanding.
(2) Distributions on the Company’s MRP Shares are treated as an operating expense under GAAP and areincluded in the calculation of net investment income (loss). See Note 2 — Significant Accounting Policies.
(3) The information presented for each period is a characterization of the total distributions paid to preferredstockholders and common stockholders as either a dividend (eligible to be treated as qualified dividendincome) or a distribution (return of capital) and is based on the Company’s earnings and profits.
(4) Total investment return based on market value is calculated assuming a purchase of common stock at themarket price on the first day and a sale at the current market price on the last day of the period reported.The calculation also assumes reinvestment of distributions at actual prices pursuant to the Company’sdividend reinvestment plan.
(5) Total investment return based on net asset value is calculated assuming a purchase of common stock at thenet asset value on the first day and a sale at the net asset value on the last day of the period reported. Thecalculation also assumes reinvestment of distributions at actual prices pursuant to the Company’s dividendreinvestment plan.
(6) Unless otherwise noted, ratios are annualized.
(7) For the fiscal years ended November 30, 2017, November 30, 2015 and November 30, 2008, the Companyreported an income tax benefit of $86,746 (4.1% of average net assets), $980,647 (30.7% of average netassets) and $339,991 (29.7% of average net assets), respectively, primarily related to unrealized losses oninvestments. The income tax expense is assumed to be 0% because the Company reported a net deferredincome tax benefit during the period.
(8) Principal/liquidation value.
(9) Calculated pursuant to section 18(a)(1)(A) of the 1940 Act. Represents the value of total assets less allliabilities not represented by Notes (principal value) or any other senior securities representingindebtedness and MRP Shares (liquidation value) divided by the aggregate amount of Notes and any othersenior securities representing indebtedness. Under the 1940 Act, the Company may not declare or makeany distribution on its common stock nor can it incur additional indebtedness if, at the time of suchdeclaration or incurrence, its asset coverage with respect to senior securities representing indebtednesswould be less than 300%. For purposes of this test, the Credit Facility and the Term Loan are consideredsenior securities representing indebtedness.
(10) Calculated pursuant to section 18(a)(2)(A) of the 1940 Act. Represents the value of total assets less allliabilities not represented by Notes (principal value), any other senior securities representing indebtednessand MRP Shares (liquidation value) divided by the aggregate amount of Notes, any other senior securitiesrepresenting indebtedness and MRP Shares. Under the 1940 Act, the Company may not declare or makeany distribution on its common stock nor can it issue additional preferred stock if at the time of suchdeclaration or issuance, its asset coverage with respect to all senior securities would be less than 200%. Inaddition to the limitations under the 1940 Act, the Company, under the terms of its MRP Shares, would notbe able to declare or pay any distributions on its common stock if such declaration would cause its assetcoverage with respect to all senior securities to be less than 225%. For purposes of these tests, the CreditFacility and the Term Loan are considered senior securities representing indebtedness.
See accompanying notes to financial statements.
23
KAYNE ANDERSON MLP INVESTMENT COMPANYNOTES TO FINANCIAL STATEMENTS
(amounts in 000’s, except number of option contracts, share and per share amounts)
1. Organization
Kayne Anderson MLP Investment Company (the “Company”) was organized as a Maryland corporation onJune 4, 2004, and is a non-diversified closed-end management investment company registered under theInvestment Company Act of 1940, as amended (the “1940 Act”). The Company’s investment objective is toobtain a high after-tax total return by investing at least 85% of its total assets in energy-related partnerships andtheir affiliates (collectively, “master limited partnerships” or “MLPs”), and in other companies that, as theirprincipal business, operate assets used in the gathering, transporting, processing, storing, refining, distributing,mining or marketing of natural gas, natural gas liquids, crude oil, refined petroleum products or coal (collectivelywith MLPs, “Midstream Energy Companies”). The Company commenced operations on September 28, 2004.The Company’s shares of common stock are listed on the New York Stock Exchange, Inc. (“NYSE”) under thesymbol “KYN.”
2. Significant Accounting Policies
The following is a summary of the significant accounting policies that the Company uses to prepare itsfinancial statements in accordance with accounting principles generally accepted in the United States of America(“GAAP”). The Company is an investment company and follows accounting and reporting guidance of theFinancial Accounting Standards Board (FASB) Accounting Standards Codification (ASC) Topic 946 —“Financial Services — Investment Companies.”
A. Use of Estimates — The preparation of financial statements in conformity with GAAP requiresmanagement to make estimates and assumptions that affect the reported amount of assets and liabilities anddisclosure of contingent assets and liabilities as of the date of the financial statements and the reported amountsof income and expenses during the period. Actual results could differ materially from those estimates.
B. Cash and Cash Equivalents — Cash and cash equivalents include short-term, liquid investments with anoriginal maturity of three months or less and include money market fund accounts.
C. Calculation of Net Asset Value — The Company determines its net asset value on a daily basis and reportsits net asset value on its website. Net asset value is computed by dividing the value of the Company’s assets(including accrued interest and distributions and current and deferred income tax assets), less all of its liabilities(including accrued expenses, distributions payable, current and deferred accrued income taxes, and any borrowings)and the liquidation value of any outstanding preferred stock, by the total number of common shares outstanding.
D. Investment Valuation — Readily marketable portfolio securities listed on any exchange other than theNASDAQ Stock Market, Inc. (“NASDAQ”) are valued, except as indicated below, at the last sale price on thebusiness day as of which such value is being determined. If there has been no sale on such day, the securities arevalued at the mean of the most recent bid and ask prices on such day. Securities admitted to trade on theNASDAQ are valued at the NASDAQ official closing price. Portfolio securities traded on more than onesecurities exchange are valued at the last sale price on the business day as of which such value is beingdetermined at the close of the exchange representing the principal market for such securities.
Equity securities traded in the over-the-counter market, but excluding securities admitted to trading on theNASDAQ, are valued at the closing bid prices. Debt securities that are considered bonds are valued by using themean of the bid and ask prices provided by an independent pricing service or, if such prices are not available orin the judgment of KA Fund Advisors, LLC (“KAFA”) such prices are stale or do not represent fair value, by anindependent broker. For debt securities that are considered bank loans, the fair market value is determined byusing the mean of the bid and ask prices provided by the agent or syndicate bank or principal market maker.When price quotes for securities are not available, or such prices are stale or do not represent fair value in thejudgment of KAFA, fair market value will be determined using the Company’s valuation process for securitiesthat are privately issued or otherwise restricted as to resale.
24
KAYNE ANDERSON MLP INVESTMENT COMPANYNOTES TO FINANCIAL STATEMENTS
(amounts in 000’s, except number of option contracts, share and per share amounts)
Exchange-traded options and futures contracts are valued at the last sales price at the close of trading in themarket where such contracts are principally traded or, if there was no sale on the applicable exchange on suchday, at the mean between the quoted bid and ask price as of the close of such exchange.
The Company holds securities that are privately issued or otherwise restricted as to resale. For thesesecurities, as well as any security for which (a) reliable market quotations are not available in the judgment ofKAFA, or (b) the independent pricing service or independent broker does not provide prices or provides a pricethat in the judgment of KAFA is stale or does not represent fair value, shall each be valued in a manner that mostfairly reflects fair value of the security on the valuation date. Unless otherwise determined by the Board ofDirectors, the following valuation process is used for such securities:
• Investment Team Valuation. The applicable investments are valued by senior professionals of KAFAwho are responsible for the portfolio investments. The investments will be valued monthly with newinvestments valued at the time such investment was made.
• Investment Team Valuation Documentation. Preliminary valuation conclusions will be determinedby senior management of KAFA. Such valuations and supporting documentation are submitted to theValuation Committee (a committee of the Company’s Board of Directors) and the Board of Directors ona quarterly basis.
• Valuation Committee. The Valuation Committee meets to consider the valuations submitted by KAFAat the end of each quarter. Between meetings of the Valuation Committee, a senior officer of KAFA isauthorized to make valuation determinations. All valuation determinations of the Valuation Committeeare subject to ratification by the Board of Directors at its next regular meeting.
• Valuation Firm. Quarterly, a third-party valuation firm engaged by the Board of Directors reviews thevaluation methodologies and calculations employed for these securities, unless the aggregate fair valueof such security is less than 0.1% of total assets.
• Board of Directors Determination. The Board of Directors meets quarterly to consider the valuationsprovided by KAFA and the Valuation Committee and ratify valuations for the applicable securities. TheBoard of Directors considers the report provided by the third-party valuation firm in reviewing anddetermining in good faith the fair value of the applicable portfolio securities.
At November 30, 2017, the Company held 7.3% of its net assets applicable to common stockholders (3.9%of total assets) in securities that were fair valued pursuant to procedures adopted by the Board of Directors(Level 3 securities). The aggregate fair value of these securities at November 30, 2017 was $132,520. SeeNote 3 — Fair Value and Note 7 — Restricted Securities.
E. Security Transactions — Security transactions are accounted for on the date these securities arepurchased or sold (trade date). Realized gains and losses are calculated using the specific identification cost basismethod for GAAP purposes. For tax purposes, the Company utilizes the average cost method to compute theadjusted tax cost basis of its MLP securities.
F. Return of Capital Estimates — Distributions received from the Company’s investments in MLPs andother securities generally are comprised of income and return of capital. The Company records investmentincome and return of capital based on estimates made at the time such distributions are received. The Companyestimates that 92% of distributions received from its MLP investments were return of capital distributions. Thisestimate is adjusted to actual in the subsequent fiscal year when tax reporting information related to theCompany’s MLP investments is received. Such estimates for MLPs and other investments are based on historicalinformation available from each investment and other industry sources. These return of capital estimates do notinclude any changes that may result from the Tax Cuts and Jobs Act. See Note 14 — Subsequent Events.
25
KAYNE ANDERSON MLP INVESTMENT COMPANYNOTES TO FINANCIAL STATEMENTS
(amounts in 000’s, except number of option contracts, share and per share amounts)
The return of capital portion of the distributions is a reduction to investment income that results in anequivalent reduction in the cost basis of the associated investments and increases net realized gains (losses) andnet change in unrealized gains (losses). If the distributions received by the Company exceed its cost basis (i.e. itscost basis has been reduced to zero), the distributions are treated as realized gains.
The Company includes all distributions received on its Statement of Operations and reduces its investmentincome by (i) the estimated return of capital and (ii) the distributions in excess of cost basis, if any. For the fiscalyear ended November 30, 2017, the Company estimated $244,872 of return of capital and $11,271 ofdistributions that were in excess of cost basis. The distributions that were in excess of cost basis were treated asrealized gains.
In accordance with GAAP, the return of capital cost basis reductions for the Company’s MLP investmentsare limited to the total amount of the cash distributions received from such investments. For income tax purposes,the cost basis reductions for the Company’s MLP investments typically exceed cash distributions received fromsuch investments due to allocated losses from these investments. See Note 6 — Income Taxes.
The following table sets forth the Company’s estimated return of capital portion of the distributions receivedfrom its investments.
For theFiscal Year
EndedNovember 30,
2017
Return of capital portion of dividends and distributions received . . . . . . . . . . . . . . . . . . . . . . . . . . 88%Return of capital — attributable to net realized gains (losses) . . . . . . . . . . . . . . . . . . . . . . . . . . . . . $ 21,436Return of capital — attributable to net change in unrealized gains (losses) . . . . . . . . . . . . . . . . . . . 223,436
Total return of capital . . . . . . . . . . . . . . . . . . . . . . . . . . . . . . . . . . . . . . . . . . . . . . . . . . . . . . . . . . $244,872
For the fiscal year ended November 30, 2017, the Company estimated the return of capital portion ofdistributions received to be $230,202 (83%). This amount was increased by $14,670 due to 2016 tax reportinginformation received by the Company in fiscal 2017. As a result, the return of capital percentage for the fiscalyear ended November 30, 2017 was 88%. In addition, for the fiscal year ended November 30, 2017, theCompany estimated the cash distributions that were in excess of cost basis to be $11,280. This amount wasdecreased by $9 due to the 2016 tax reporting information received by the Company in fiscal 2017.
G. Investment Income — The Company records dividends and distributions on the ex-dividend date. Interestincome is recognized on the accrual basis, including amortization of premiums and accretion of discounts. Wheninvesting in securities with payment in-kind interest, the Company will accrue interest income during the life ofthe security even though it will not be receiving cash as the interest is accrued. To the extent that interest incometo be received is not expected to be realized, a reserve against income is established.
Debt securities that the Company may hold will typically be purchased at a discount or premium to thepar value of the security. The non-cash accretion of a discount to par value increases interest income while thenon-cash amortization of a premium to par value decreases interest income. The accretion of a discount andamortization of a premium are based on the effective interest method. The amount of these non-cash adjustments,if any, can be found in the Company’s Statement of Cash Flows. The non-cash accretion of a discount increasesthe cost basis of the debt security, which results in an offsetting unrealized loss. The non-cash amortization of apremium decreases the cost basis of the debt security, which results in an offsetting unrealized gain. To the extentthat par value is not expected to be realized, the Company discontinues accruing the non-cash accretion of thediscount to par value of the debt security.
The Company may receive paid-in-kind and non-cash dividends and distributions in the form of additionalunits or shares from its investments. For paid-in-kind dividends, the additional units are not reflected in
26
KAYNE ANDERSON MLP INVESTMENT COMPANYNOTES TO FINANCIAL STATEMENTS
(amounts in 000’s, except number of option contracts, share and per share amounts)
investment income during the period received, but are recorded as unrealized gains upon receipt. Non-cashdistributions are reflected in investment income because the Company has the option to receive its distributionsin cash or in additional units of the security. During the fiscal year ended November 30, 2017, the Companyreceived $3,729 of paid-in-kind dividends from its investment in Enbridge Energy Management, L.L.C. and$31,963 of non-cash distributions from its investment in Enterprise Products Partners L.P.
H. Distributions to Stockholders — Distributions to common stockholders are recorded on the ex-dividenddate. Distributions to holders of MRP Shares are accrued on a daily basis as described in Note 12 — PreferredStock. As required by the Distinguishing Liabilities from Equity topic of the FASB Accounting StandardsCodification (ASC 480), the Company includes the accrued distributions on its MRP Shares as an operatingexpense due to the fixed term of this obligation. For tax purposes, the payments made to the holders of theCompany’s MRP Shares are treated as dividends or distributions.
The characterization of the distributions paid to holders of MRP Shares and common stock as either adividend (eligible to be treated as qualified dividend income) or a distribution (return of capital) is determinedafter the end of the fiscal year based on the Company’s actual earnings and profits and, therefore, thecharacterization may differ from preliminary estimates.
I. Partnership Accounting Policy — The Company records its pro-rata share of the income (loss), to theextent of distributions it has received, allocated from the underlying partnerships and adjusts the cost basis of theunderlying partnerships accordingly. These amounts are included in the Company’s Statement of Operations.
J. Federal and State Income Taxation — The Company, as a corporation, is obligated to pay federal andstate income tax on its taxable income. The Company invests its assets primarily in MLPs, which generally aretreated as partnerships for federal income tax purposes. As a limited partner in the MLPs, the Company includesits allocable share of the MLP’s taxable income or loss in computing its own taxable income. Deferred incometaxes reflect (i) taxes on unrealized gains (losses), which are attributable to the difference between fair value andtax cost basis, (ii) the net tax effects of temporary differences between the carrying amounts of assets andliabilities for financial reporting purposes and the amounts used for income tax purposes and (iii) the net taxbenefit of accumulated net operating and capital losses. To the extent the Company has a deferred tax asset,consideration is given as to whether or not a valuation allowance is required. The need to establish a valuationallowance for deferred tax assets is assessed periodically by the Company based on the Income Tax Topic of theFASB Accounting Standards Codification (ASC 740), that it is more likely than not that some portion or all ofthe deferred tax asset will not be realized. In the assessment for a valuation allowance, consideration is given toall positive and negative evidence related to the realization of the deferred tax asset. This assessment considers,among other matters, the nature, frequency and severity of current and cumulative losses, forecasts of futureprofitability (which are highly dependent on future cash distributions from the Company’s MLP holdings), theduration of statutory carryforward periods and the associated risk that operating and capital loss carryforwardsmay expire unused.
The Company may rely to some extent on information provided by the MLPs, which may not necessarily betimely, to estimate taxable income allocable to the MLP units held in the portfolio and to estimate the associateddeferred tax liability. Such estimates are made in good faith. From time to time, as new information becomesavailable, the Company modifies its estimates or assumptions regarding the deferred tax liability.
The Company utilizes the average cost method to compute the adjusted tax cost basis of its MLP securities.
The Company’s policy is to classify interest and penalties associated with underpayment of federal and stateincome taxes, if any, as income tax expense on its Statement of Operations. Tax years subsequent to fiscal year2012 remain open and subject to examination by the federal and state tax authorities. See Note 14 — SubsequentEvents.
27
KAYNE ANDERSON MLP INVESTMENT COMPANYNOTES TO FINANCIAL STATEMENTS
(amounts in 000’s, except number of option contracts, share and per share amounts)
K. Derivative Financial Instruments — The Company may utilize derivative financial instruments in itsoperations.
In October 2016, the Securities and Exchange Commission (“SEC”) adopted new rules and forms, andamendments to certain current rules and forms, to modernize reporting and disclosure of information byregistered investment companies. The amendments to Regulation S-X required standardized, enhanced disclosureabout derivatives in investment company financial statements, and changed the rules governing the form andcontent of such financial statements. The Company adopted the amendments to Regulation S-X as of August 1,2017, which requires disclosure of the notional amount of open call option contracts written. As of November 30,2017, the Company did not have any open option contracts.
Interest rate swap contracts. The Company may use hedging techniques such as interest rate swaps tomitigate potential interest rate risk on a portion of the Company’s leverage. Such interest rate swaps wouldprincipally be used to protect the Company against higher costs on its leverage resulting from increases ininterest rates. The Company does not hedge any interest rate risk associated with portfolio holdings. Interest ratetransactions the Company may use for hedging purposes may expose it to certain risks that differ from the risksassociated with its portfolio holdings. A decline in interest rates may result in a decline in the value of the swapcontracts, which, everything else being held constant, would result in a decline in the net assets of the Company.In addition, if the counterparty to an interest rate swap defaults, the Company would not be able to use theanticipated net receipts under the interest rate swap to offset its cost of financial leverage.
Interest rate swap contracts are recorded at fair value with changes in value during the reporting period, andamounts accrued under the agreements, included as unrealized gains or losses in the Statement of Operations.Monthly cash settlements under the terms of the interest rate swap agreements or termination payments arerecorded as realized gains or losses in the Statement of Operations. The Company generally values its interestrate swap contracts based on dealer quotations, if available, or by discounting the future cash flows from thestated terms of the interest rate swap agreement by using interest rates currently available in the market.See Note 8 — Derivative Financial Instruments.
Option contracts. The Company is also exposed to financial market risks including changes in the valuationsof its investment portfolio. The Company may purchase or write (sell) call options. A call option on a security is acontract that gives the holder of the option, in return for a premium, the right to buy from the writer of the option thesecurity underlying the option at a specified exercise price at any time during the term of the option.
The Company would realize a gain on a purchased call option if, during the option period, the value of suchsecurities exceeded the sum of the exercise price, the premium paid and transaction costs; otherwise theCompany would realize either no gain or a loss on the purchased call option. The Company may also purchaseput option contracts. If a purchased put option is exercised, the premium paid increases the cost basis of thesecurities sold by the Company.
The Company may also write (sell) call options with the purpose of generating realized gains or reducing itsownership of certain securities. If the Company writes a call option on a security, the Company has the obligationupon exercise of the option to deliver the underlying security upon payment of the exercise price. The Companywill only write call options on securities that the Company holds in its portfolio (i.e., covered calls).
When the Company writes a call option, an amount equal to the premium received by the Company is recorded asa liability and is subsequently adjusted to the current fair value of the option written. Premiums received from writingoptions that expire unexercised are treated by the Company on the expiration date as realized gains from investments.If the Company repurchases a written call option prior to its exercise, the difference between the premium received andthe amount paid to repurchase the option is treated as a realized gain or loss. If a call option is exercised, the premiumis added to the proceeds from the sale of the underlying security in determining whether the Company has realized again or loss. The Company, as the writer of an option, bears the market risk of an unfavorable change in the price of thesecurity underlying the written option. See Note 8 — Derivative Financial Instruments.
28
KAYNE ANDERSON MLP INVESTMENT COMPANYNOTES TO FINANCIAL STATEMENTS
(amounts in 000’s, except number of option contracts, share and per share amounts)
L. Indemnifications — Under the Company’s organizational documents, its officers and directors areindemnified against certain liabilities arising out of the performance of their duties to the Company. In addition,in the normal course of business, the Company enters into contracts that provide general indemnification to otherparties. The Company’s maximum exposure under these arrangements is unknown, as this would involve futureclaims that may be made against the Company that have not yet occurred, and may not occur. However, theCompany has not had prior claims or losses pursuant to these contracts and expects the risk of loss to be remote.
M. Offering and Debt Issuance Costs — Offering costs incurred by the Company related to the issuance ofits common stock reduce additional paid-in capital when the stock is issued. Costs incurred by the Companyrelated to the issuance of its debt (credit facility, term loan or notes) or its preferred stock are capitalized andamortized over the period the debt or preferred stock is outstanding.
In April 2015, the FASB issued Accounting Standards Update (“ASU”) No. 2015-03 “Interest —Imputation of Interest (Subtopic 835-30), Simplifying the Presentation of Debt Issuance Costs”.ASU No. 2015-03 requires that all costs incurred to issue debt be presented in the balance sheet as a directdeduction from the carrying value of the debt. In August 2015, the FASB issued ASU No. 2015-15 “Interest —Imputation of Interest (Subtopic 835-30), Presentation and Subsequent Measurement of Debt Issuance CostsAssociated with Line-of-Credit Arrangements”. ASU No. 2015-15 states that the SEC staff will not object to anentity presenting the cost of securing a revolving line of credit as an asset, regardless of whether a balance isoutstanding. In the first quarter of fiscal 2017, the Company adopted ASU No. 2015-03 and ASU No. 2015-15and has classified the costs incurred to issue Notes and MRP Shares as a deduction from the carrying value ofNotes and MRP Shares on the Statement of Assets and Liabilities. Previously, these issuance costs werecapitalized as an asset on the Statement of Assets and Liabilities. Additionally, the Company has updated itsdisclosure in Notes 11 and 12 related to the unamortized Note and MRP Share issuance costs. For the purpose ofcalculating the Company’s asset coverage ratios pursuant to the 1940 Act, deferred issuance costs are notdeducted from the carrying value of Notes and MRP Shares. There was no financial reporting impact toinformation presented for prior periods as a result of this accounting standard update.
3. Fair Value
The Fair Value Measurement Topic of the FASB Accounting Standards Codification (ASC 820) defines fairvalue as the price at which an orderly transaction to sell an asset or to transfer a liability would take placebetween market participants under current market conditions at the measurement date. As required by ASC 820,the Company has performed an analysis of all assets and liabilities (other than deferred taxes) measured at fairvalue to determine the significance and character of all inputs to their fair value determination. Inputs are theassumptions, along with considerations of risk, that a market participant would use to value an asset or a liability.In general, observable inputs are based on market data that is readily available, regularly distributed andverifiable that the Company obtains from independent, third-party sources. Unobservable inputs are developed bythe Company based on its own assumptions of how market participants would value an asset or a liability.
The fair value hierarchy prioritizes the inputs to valuation techniques used to measure fair value into thefollowing three broad categories.
• Level 1 — Valuations based on quoted unadjusted prices for identical instruments in active marketstraded on a national exchange to which the Company has access at the date of measurement.
• Level 2 — Valuations based on quoted prices for similar instruments in active markets; quoted prices foridentical or similar instruments in markets that are not active; and model-derived valuations in which allsignificant inputs and significant value drivers are observable in active markets. Level 2 inputs are thosein markets for which there are few transactions, the prices are not current, little public information existsor instances where prices vary substantially over time or among brokered market makers.
29
KAYNE ANDERSON MLP INVESTMENT COMPANYNOTES TO FINANCIAL STATEMENTS
(amounts in 000’s, except number of option contracts, share and per share amounts)
• Level 3 — Model derived valuations in which one or more significant inputs or significant value driversare unobservable. Unobservable inputs are those inputs that reflect the Company’s own assumptions thatmarket participants would use to price the asset or liability based on the best available information.
The following table presents the Company’s assets measured at fair value on a recurring basis atNovember 30, 2017, and the Company presents these assets by security type and description on its Schedule ofInvestments. Note that the valuation levels below are not necessarily an indication of the risk or liquidityassociated with the underlying investment.
Total
Quoted Prices inActive Markets
(Level 1)
Prices with OtherObservable Inputs
(Level 2)
UnobservableInputs
(Level 3)
Assets at Fair ValueEquity investments . . . . . . . . . . . . . . . . . . . . . . . . . $3,315,780 $3,156,955 $26,305(1) $132,520Short-term investments . . . . . . . . . . . . . . . . . . . . . . 75,305 75,305 — —
Total assets at fair value . . . . . . . . . . . . . . . . . . . $3,391,085 $3,232,260 $26,305 $132,520
(1) The Company’s investment in Plains AAP, L.P. (“PAGP-AAP”) is exchangeable on a one-for-one basis intoeither Plains GP Holdings, L.P. (“PAGP”) shares or Plains All American Pipeline, L.P. (“PAA”) units at theCompany’s option. The Company values its PAGP-AAP investment on an “as exchanged” basis based on thehigher public market value of either PAGP or PAA. As of November 30, 2017, the Company’s PAGP-AAPinvestment is valued at PAGP’s closing price. The Company categorizes its investment as a Level 2 securityfor fair value reporting purposes.
The Company did not have any liabilities that were measured at fair value on a recurring basis usingsignificant unobservable inputs (Level 3) at November 30, 2017. For the fiscal year ended November 30, 2017,there were no transfers between Level 1 and Level 2.
As of November 30, 2017, the Company had Notes outstanding with aggregate principal amount of$747,000 and 11,680,000 shares of MRP Shares outstanding with a total liquidation value of $292,000. SeeNote 11 — Notes and Note 12 — Preferred Stock.
Of the $292,000 of MRP Shares, Series F ($125,000 liquidation value) is publicly traded on the NYSE. As aresult, the Company categorizes this series of MRP Shares as Level 1. The remaining series of MRP Shares andall of the Notes were issued in private placements to institutional investors and are not listed on any exchange orautomated quotation system. As such, the Company categorizes all of the Notes ($747,000 aggregate principalamount) and the remaining MRP Shares ($167,000 aggregate liquidation value) as Level 3 and determines thefair value of these instruments based on estimated market yields and credit spreads for comparable instrumentswith similar maturity, terms and structure.
The Company records these Notes and MRP Shares on its Statement of Assets and Liabilities at principalamount or liquidation value. As of November 30, 2017, the estimated fair values of these leverage instrumentsare as follows.
InstrumentPrincipal Amount/Liquidation Value Fair Value
Notes (Series W, Z through GG and II through OO) . . . . . . . . . . . . . . . . . . . . . . . . . $747,000 $766,100MRP Shares (Series C, H, I and J) . . . . . . . . . . . . . . . . . . . . . . . . . . . . . . . . . . . . . . . $167,000 $167,900MRP Shares (Series F) . . . . . . . . . . . . . . . . . . . . . . . . . . . . . . . . . . . . . . . . . . . . . . . . $125,000 $127,450
30
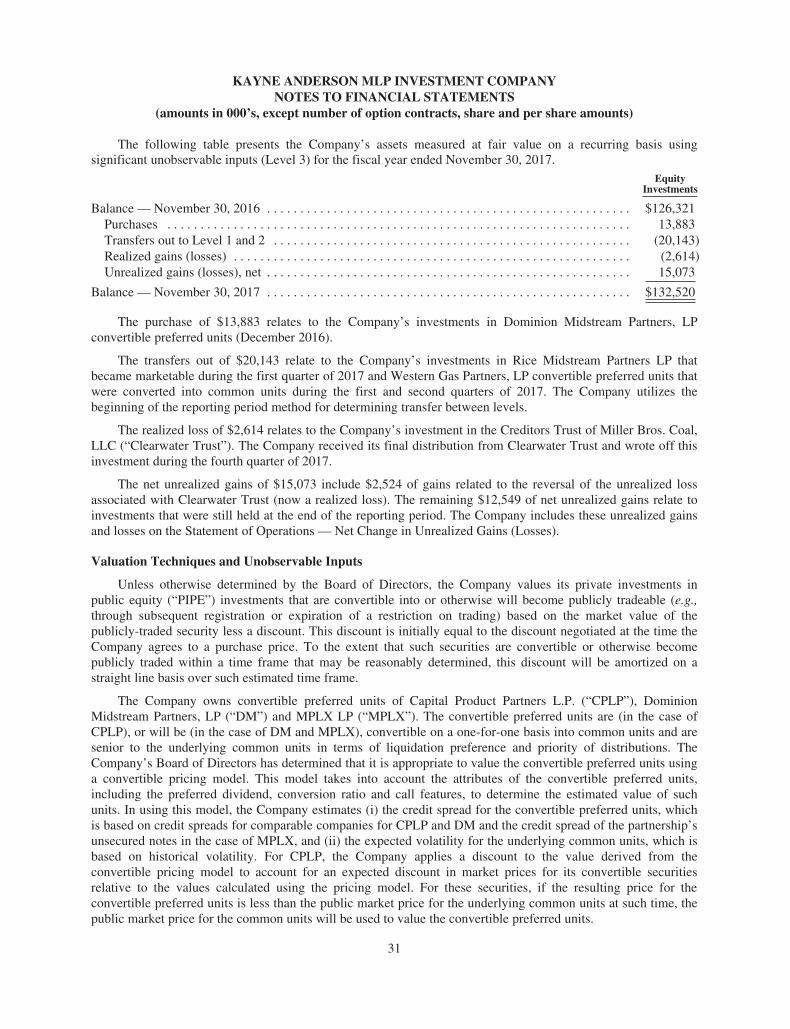
KAYNE ANDERSON MLP INVESTMENT COMPANYNOTES TO FINANCIAL STATEMENTS
(amounts in 000’s, except number of option contracts, share and per share amounts)
The following table presents the Company’s assets measured at fair value on a recurring basis usingsignificant unobservable inputs (Level 3) for the fiscal year ended November 30, 2017.
EquityInvestments
Balance — November 30, 2016 . . . . . . . . . . . . . . . . . . . . . . . . . . . . . . . . . . . . . . . . . . . . . . . . . . . . . . . $126,321Purchases . . . . . . . . . . . . . . . . . . . . . . . . . . . . . . . . . . . . . . . . . . . . . . . . . . . . . . . . . . . . . . . . . . . . . . 13,883Transfers out to Level 1 and 2 . . . . . . . . . . . . . . . . . . . . . . . . . . . . . . . . . . . . . . . . . . . . . . . . . . . . . . (20,143)Realized gains (losses) . . . . . . . . . . . . . . . . . . . . . . . . . . . . . . . . . . . . . . . . . . . . . . . . . . . . . . . . . . . . (2,614)Unrealized gains (losses), net . . . . . . . . . . . . . . . . . . . . . . . . . . . . . . . . . . . . . . . . . . . . . . . . . . . . . . . 15,073
Balance — November 30, 2017 . . . . . . . . . . . . . . . . . . . . . . . . . . . . . . . . . . . . . . . . . . . . . . . . . . . . . . . $132,520
The purchase of $13,883 relates to the Company’s investments in Dominion Midstream Partners, LPconvertible preferred units (December 2016).
The transfers out of $20,143 relate to the Company’s investments in Rice Midstream Partners LP thatbecame marketable during the first quarter of 2017 and Western Gas Partners, LP convertible preferred units thatwere converted into common units during the first and second quarters of 2017. The Company utilizes thebeginning of the reporting period method for determining transfer between levels.
The realized loss of $2,614 relates to the Company’s investment in the Creditors Trust of Miller Bros. Coal,LLC (“Clearwater Trust”). The Company received its final distribution from Clearwater Trust and wrote off thisinvestment during the fourth quarter of 2017.
The net unrealized gains of $15,073 include $2,524 of gains related to the reversal of the unrealized lossassociated with Clearwater Trust (now a realized loss). The remaining $12,549 of net unrealized gains relate toinvestments that were still held at the end of the reporting period. The Company includes these unrealized gainsand losses on the Statement of Operations — Net Change in Unrealized Gains (Losses).
Valuation Techniques and Unobservable Inputs
Unless otherwise determined by the Board of Directors, the Company values its private investments inpublic equity (“PIPE”) investments that are convertible into or otherwise will become publicly tradeable (e.g.,through subsequent registration or expiration of a restriction on trading) based on the market value of thepublicly-traded security less a discount. This discount is initially equal to the discount negotiated at the time theCompany agrees to a purchase price. To the extent that such securities are convertible or otherwise becomepublicly traded within a time frame that may be reasonably determined, this discount will be amortized on astraight line basis over such estimated time frame.
The Company owns convertible preferred units of Capital Product Partners L.P. (“CPLP”), DominionMidstream Partners, LP (“DM”) and MPLX LP (“MPLX”). The convertible preferred units are (in the case ofCPLP), or will be (in the case of DM and MPLX), convertible on a one-for-one basis into common units and aresenior to the underlying common units in terms of liquidation preference and priority of distributions. TheCompany’s Board of Directors has determined that it is appropriate to value the convertible preferred units usinga convertible pricing model. This model takes into account the attributes of the convertible preferred units,including the preferred dividend, conversion ratio and call features, to determine the estimated value of suchunits. In using this model, the Company estimates (i) the credit spread for the convertible preferred units, whichis based on credit spreads for comparable companies for CPLP and DM and the credit spread of the partnership’sunsecured notes in the case of MPLX, and (ii) the expected volatility for the underlying common units, which isbased on historical volatility. For CPLP, the Company applies a discount to the value derived from theconvertible pricing model to account for an expected discount in market prices for its convertible securitiesrelative to the values calculated using the pricing model. For these securities, if the resulting price for theconvertible preferred units is less than the public market price for the underlying common units at such time, thepublic market price for the common units will be used to value the convertible preferred units.
31
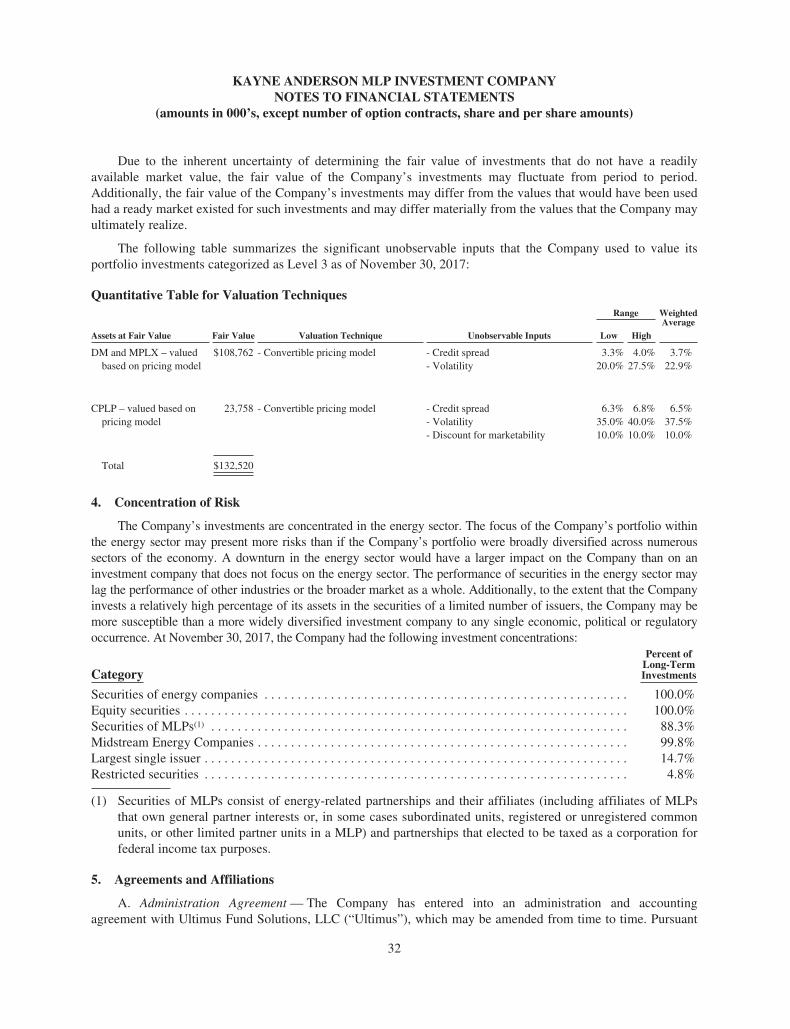
KAYNE ANDERSON MLP INVESTMENT COMPANYNOTES TO FINANCIAL STATEMENTS
(amounts in 000’s, except number of option contracts, share and per share amounts)
Due to the inherent uncertainty of determining the fair value of investments that do not have a readilyavailable market value, the fair value of the Company’s investments may fluctuate from period to period.Additionally, the fair value of the Company’s investments may differ from the values that would have been usedhad a ready market existed for such investments and may differ materially from the values that the Company mayultimately realize.
The following table summarizes the significant unobservable inputs that the Company used to value itsportfolio investments categorized as Level 3 as of November 30, 2017:
Quantitative Table for Valuation TechniquesRange Weighted
AverageAssets at Fair Value Fair Value Valuation Technique Unobservable Inputs Low High
DM and MPLX – valuedbased on pricing model
$108,762 - Convertible pricing model - Credit spread- Volatility
3.3%20.0%
4.0%27.5%
3.7%22.9%
CPLP – valued based onpricing model
23,758 - Convertible pricing model - Credit spread- Volatility- Discount for marketability
6.3%35.0%10.0%
6.8%40.0%10.0%
6.5%37.5%10.0%
Total $132,520
4. Concentration of Risk
The Company’s investments are concentrated in the energy sector. The focus of the Company’s portfolio withinthe energy sector may present more risks than if the Company’s portfolio were broadly diversified across numeroussectors of the economy. A downturn in the energy sector would have a larger impact on the Company than on aninvestment company that does not focus on the energy sector. The performance of securities in the energy sector maylag the performance of other industries or the broader market as a whole. Additionally, to the extent that the Companyinvests a relatively high percentage of its assets in the securities of a limited number of issuers, the Company may bemore susceptible than a more widely diversified investment company to any single economic, political or regulatoryoccurrence. At November 30, 2017, the Company had the following investment concentrations:
Category
Percent ofLong-TermInvestments
Securities of energy companies . . . . . . . . . . . . . . . . . . . . . . . . . . . . . . . . . . . . . . . . . . . . . . . . . . . . . . . 100.0%Equity securities . . . . . . . . . . . . . . . . . . . . . . . . . . . . . . . . . . . . . . . . . . . . . . . . . . . . . . . . . . . . . . . . . . . 100.0%Securities of MLPs(1) . . . . . . . . . . . . . . . . . . . . . . . . . . . . . . . . . . . . . . . . . . . . . . . . . . . . . . . . . . . . . . . 88.3%Midstream Energy Companies . . . . . . . . . . . . . . . . . . . . . . . . . . . . . . . . . . . . . . . . . . . . . . . . . . . . . . . . 99.8%Largest single issuer . . . . . . . . . . . . . . . . . . . . . . . . . . . . . . . . . . . . . . . . . . . . . . . . . . . . . . . . . . . . . . . . 14.7%Restricted securities . . . . . . . . . . . . . . . . . . . . . . . . . . . . . . . . . . . . . . . . . . . . . . . . . . . . . . . . . . . . . . . . 4.8%
(1) Securities of MLPs consist of energy-related partnerships and their affiliates (including affiliates of MLPsthat own general partner interests or, in some cases subordinated units, registered or unregistered commonunits, or other limited partner units in a MLP) and partnerships that elected to be taxed as a corporation forfederal income tax purposes.
5. Agreements and Affiliations
A. Administration Agreement — The Company has entered into an administration and accountingagreement with Ultimus Fund Solutions, LLC (“Ultimus”), which may be amended from time to time. Pursuant
32
KAYNE ANDERSON MLP INVESTMENT COMPANYNOTES TO FINANCIAL STATEMENTS
(amounts in 000’s, except number of option contracts, share and per share amounts)
to the agreement, Ultimus will provide certain administrative and accounting services for the Company. Theagreement has automatic one-year renewals unless earlier terminated by either party as provided under the termsof the agreement.
B. Investment Management Agreement — The Company has entered into an investment managementagreement with KA Fund Advisors, LLC (“KAFA”) under which KAFA, subject to the overall supervision of theCompany’s Board of Directors, manages the day-to-day operations of, and provides investment advisory servicesto, the Company. For providing these services, KAFA receives an investment management fee from theCompany. KAFA has also entered into a fee waiver agreement with the Company that provides for amanagement fee of 1.375% on average total assets up to $4,500,000, a fee of 1.25% on average total assetsbetween $4,500,000 and $9,500,000, a fee of 1.125% on average total assets between $9,500,000 and$14,500,000 and a fee of 1.0% on average total assets in excess of $14,500,000. On March 30, 2017, theCompany renewed its investment management agreement and fee waiver agreement with KAFA for a period ofone year. The investment management and fee waiver agreements will expire on March 31, 2018 and may berenewed annually thereafter upon approval of the Company’s Board of Directors (including a majority of theCompany’s directors who are not “interested persons” of the Company, as such term is defined in the 1940 Act).For the fiscal year ended November 30, 2017, the Company paid management fees at an annual rate of 1.375% ofthe Company’s average quarterly total assets (as defined in the investment management agreement).
For purposes of calculating the management fee the average total assets for each quarterly period aredetermined by averaging the total assets at the last day of that quarter with the total assets at the last day of theprior quarter. The Company’s total assets are equal to the Company’s gross asset value (which includes assetsattributable to the Company’s use of preferred stock, commercial paper or notes and other borrowings andexcludes any net deferred tax asset), minus the sum of the Company’s accrued and unpaid dividends anddistributions on any outstanding common stock and accrued and unpaid dividends and distributions on anyoutstanding preferred stock and accrued liabilities (other than liabilities associated with borrowing or leverage bythe Company and any accrued taxes, including, a deferred tax liability). Liabilities associated with borrowing orleverage by the Company include the principal amount of any borrowings, commercial paper or notes issued bythe Company, the liquidation preference of any outstanding preferred stock, and other liabilities from other formsof borrowing or leverage such as short positions and put or call options held or written by the Company.
C. Portfolio Companies — From time to time, the Company may “control” or may be an “affiliate” of oneor more of its portfolio companies, as each of these terms is defined in the 1940 Act. In general, under the 1940Act, the Company would be presumed to “control” a portfolio company if the Company and its affiliates owned25% or more of its outstanding voting securities and would be an “affiliate” of a portfolio company if theCompany and its affiliates owned 5% or more of its outstanding voting securities. The 1940 Act containsprohibitions and restrictions relating to transactions between investment companies and their affiliates (includingthe Company’s investment adviser), principal underwriters and affiliates of those affiliates or underwriters.
The Company believes that there are several factors that determine whether or not a security should beconsidered a “voting security” in complex structures such as limited partnerships of the kind in which theCompany invests. The Company also notes that the Securities and Exchange Commission (the “SEC”) staff hasissued guidance on the circumstances under which it would consider a limited partnership interest to constitute avoting security. Under most partnership agreements, the management of the partnership is vested in the generalpartner, and the limited partners, individually or collectively, have no rights to manage or influence managementof the partnership through such activities as participating in the selection of the managers or the board of thelimited partnership or the general partner. As a result, the Company believes that many of the limited partnershipinterests in which it invests should not be considered voting securities. However, it is possible that the SEC staffmay consider the limited partner interests the Company holds in certain limited partnerships to be votingsecurities. If such a determination were made, the Company may be regarded as a person affiliated with andcontrolling the issuer(s) of those securities for purposes of Section 17 of the 1940 Act.
33
KAYNE ANDERSON MLP INVESTMENT COMPANYNOTES TO FINANCIAL STATEMENTS
(amounts in 000’s, except number of option contracts, share and per share amounts)
In making such a determination as to whether to treat any class of limited partnership interests the Companyholds as a voting security, the Company considers, among other factors, whether or not the holders of suchlimited partnership interests have the right to elect the board of directors of the limited partnership or the generalpartner. If the holders of such limited partnership interests do not have the right to elect the board of directors, theCompany generally has not treated such security as a voting security. In other circumstances, based on the factsand circumstances of those partnership agreements, including the right to elect the directors of the generalpartner, the Company has treated those securities as voting securities. If the Company does not consider thesecurity to be a voting security, it will not consider such partnership to be an “affiliate” unless the Company andits affiliates own more than 25% of the outstanding securities of such partnership. Additionally, certainpartnership agreements give common unitholders the right to elect the partnership’s board of directors, but limitthe amount of voting securities any limited partner can hold to no more than 4.9% of the partnership’soutstanding voting securities (i.e., any amounts held in excess of such limit by a limited partner do not havevoting rights). In such instances, the Company does not consider itself to be an affiliate if it owns more than 5%of such partnership’s common units.
There is no assurance that the SEC staff will not consider that other limited partnership securities that theCompany owns and does not treat as voting securities are, in fact, voting securities for the purposes of Section 17of the 1940 Act. If such determination were made, the Company will be required to abide by the restrictions on“control” or “affiliate” transactions as proscribed in the 1940 Act. The Company or any portfolio company that itcontrols, and its affiliates, may from time to time engage in certain of such joint transactions, purchases, salesand loans in reliance upon and in compliance with the conditions of certain exemptive rules promulgated by theSEC. The Company cannot make assurances, however, that it would be able to satisfy the conditions of theserules with respect to any particular eligible transaction, or even if the Company were allowed to engage in such atransaction, that the terms would be more or as favorable to the Company or any company that it controls asthose that could be obtained in an arm’s length transaction. As a result of these prohibitions, restrictions may beimposed on the size of positions that may be taken for the Company or on the type of investments that it couldmake.
Plains GP Holdings, L.P., Plains AAP, L.P. and Plains All American Pipeline, L.P. — Robert V. Sinnott isCo-Chairman of Kayne Anderson Capital Advisors, L.P. (“KACALP”), the managing member of KAFA.Mr. Sinnott also serves as a director of PAA GP Holdings LLC, which is the general partner of Plains GPHoldings L.P. (“PAGP”). Members of senior management of KACALP and KAFA and various affiliated fundsmanaged by KACALP own PAGP shares, Plains All American Pipeline, L.P. (“PAA”) units and interests inPlains AAP, L.P. (“PAGP-AAP”). The Company believes that it is an affiliate of PAA, PAGP and PAGP-AAPunder the 1940 Act by virtue of (i) the Company’s and other affiliated Kayne Anderson funds’ ownership interestin PAA, PAGP and PAGP-AAP and (ii) Mr. Sinnott’s participation on the board of PAA GP Holdings LLC.
ONEOK, Inc. and ONEOK Partners, L.P. — Kevin S. McCarthy, the Chief Executive Officer of theCompany, served as a director of ONEOK, Inc. (“OKE”) from December 2015 through May 1, 2017. EffectiveMay 2, 2017, Mr. McCarthy resigned as a director of OKE. OKE is the general partner of ONEOK Partners,L.P. (“OKS”). Despite Mr. McCarthy’s participation on the board of OKE during a portion of the fiscal yearended November 30, 2017, the Company does not believe that it is an affiliate of OKE or OKS because theCompany’s and other Kayne Anderson funds’ aggregate ownership of each entity does not meet the criteriadescribed above.
34
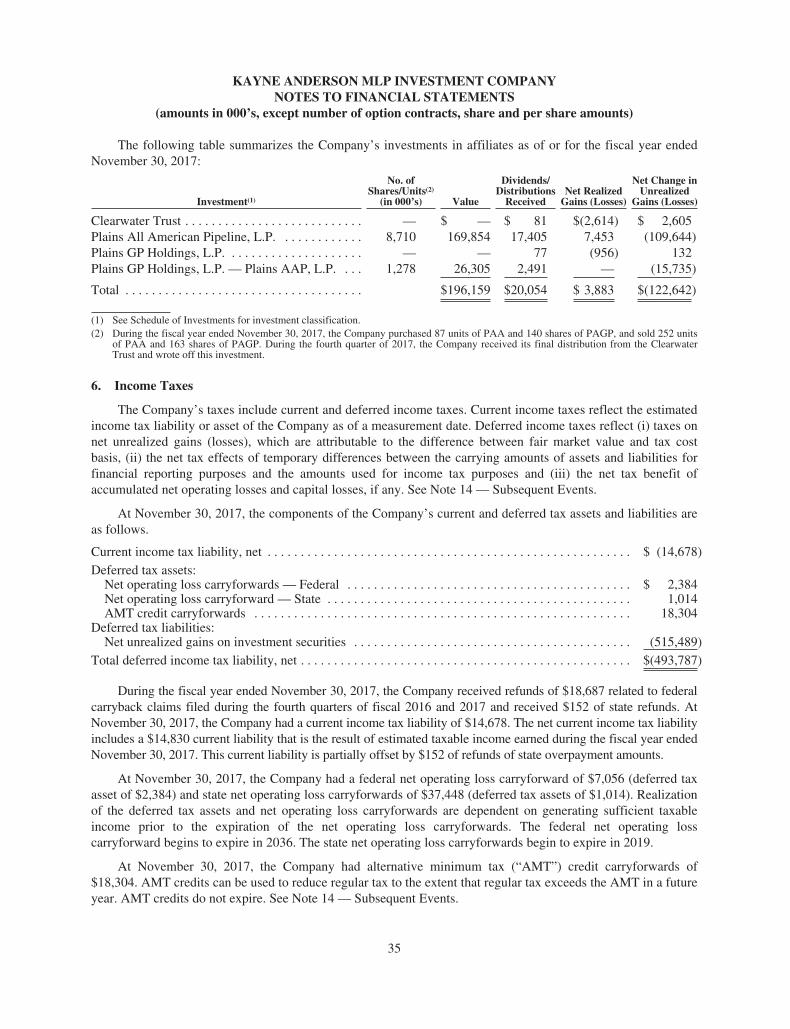
KAYNE ANDERSON MLP INVESTMENT COMPANYNOTES TO FINANCIAL STATEMENTS
(amounts in 000’s, except number of option contracts, share and per share amounts)
The following table summarizes the Company’s investments in affiliates as of or for the fiscal year endedNovember 30, 2017:
Investment(1)
No. ofShares/Units(2)
(in 000’s) Value
Dividends/Distributions
ReceivedNet Realized
Gains (Losses)
Net Change inUnrealized
Gains (Losses)
Clearwater Trust . . . . . . . . . . . . . . . . . . . . . . . . . . . — $ — $ 81 $(2,614) $ 2,605Plains All American Pipeline, L.P. . . . . . . . . . . . . 8,710 169,854 17,405 7,453 (109,644)Plains GP Holdings, L.P. . . . . . . . . . . . . . . . . . . . . — — 77 (956) 132Plains GP Holdings, L.P. — Plains AAP, L.P. . . . 1,278 26,305 2,491 — (15,735)
Total . . . . . . . . . . . . . . . . . . . . . . . . . . . . . . . . . . . . $196,159 $20,054 $ 3,883 $(122,642)
(1) See Schedule of Investments for investment classification.(2) During the fiscal year ended November 30, 2017, the Company purchased 87 units of PAA and 140 shares of PAGP, and sold 252 units
of PAA and 163 shares of PAGP. During the fourth quarter of 2017, the Company received its final distribution from the ClearwaterTrust and wrote off this investment.
6. Income Taxes
The Company’s taxes include current and deferred income taxes. Current income taxes reflect the estimatedincome tax liability or asset of the Company as of a measurement date. Deferred income taxes reflect (i) taxes onnet unrealized gains (losses), which are attributable to the difference between fair market value and tax costbasis, (ii) the net tax effects of temporary differences between the carrying amounts of assets and liabilities forfinancial reporting purposes and the amounts used for income tax purposes and (iii) the net tax benefit ofaccumulated net operating losses and capital losses, if any. See Note 14 — Subsequent Events.
At November 30, 2017, the components of the Company’s current and deferred tax assets and liabilities areas follows.
Current income tax liability, net . . . . . . . . . . . . . . . . . . . . . . . . . . . . . . . . . . . . . . . . . . . . . . . . . . . . . . . $ (14,678)Deferred tax assets:
Net operating loss carryforwards — Federal . . . . . . . . . . . . . . . . . . . . . . . . . . . . . . . . . . . . . . . . . . . $ 2,384Net operating loss carryforward — State . . . . . . . . . . . . . . . . . . . . . . . . . . . . . . . . . . . . . . . . . . . . . . 1,014AMT credit carryforwards . . . . . . . . . . . . . . . . . . . . . . . . . . . . . . . . . . . . . . . . . . . . . . . . . . . . . . . . . 18,304
Deferred tax liabilities:Net unrealized gains on investment securities . . . . . . . . . . . . . . . . . . . . . . . . . . . . . . . . . . . . . . . . . . (515,489)
Total deferred income tax liability, net . . . . . . . . . . . . . . . . . . . . . . . . . . . . . . . . . . . . . . . . . . . . . . . . . . $(493,787)
During the fiscal year ended November 30, 2017, the Company received refunds of $18,687 related to federalcarryback claims filed during the fourth quarters of fiscal 2016 and 2017 and received $152 of state refunds. AtNovember 30, 2017, the Company had a current income tax liability of $14,678. The net current income tax liabilityincludes a $14,830 current liability that is the result of estimated taxable income earned during the fiscal year endedNovember 30, 2017. This current liability is partially offset by $152 of refunds of state overpayment amounts.
At November 30, 2017, the Company had a federal net operating loss carryforward of $7,056 (deferred taxasset of $2,384) and state net operating loss carryforwards of $37,448 (deferred tax assets of $1,014). Realizationof the deferred tax assets and net operating loss carryforwards are dependent on generating sufficient taxableincome prior to the expiration of the net operating loss carryforwards. The federal net operating losscarryforward begins to expire in 2036. The state net operating loss carryforwards begin to expire in 2019.
At November 30, 2017, the Company had alternative minimum tax (“AMT”) credit carryforwards of$18,304. AMT credits can be used to reduce regular tax to the extent that regular tax exceeds the AMT in a futureyear. AMT credits do not expire. See Note 14 — Subsequent Events.
35
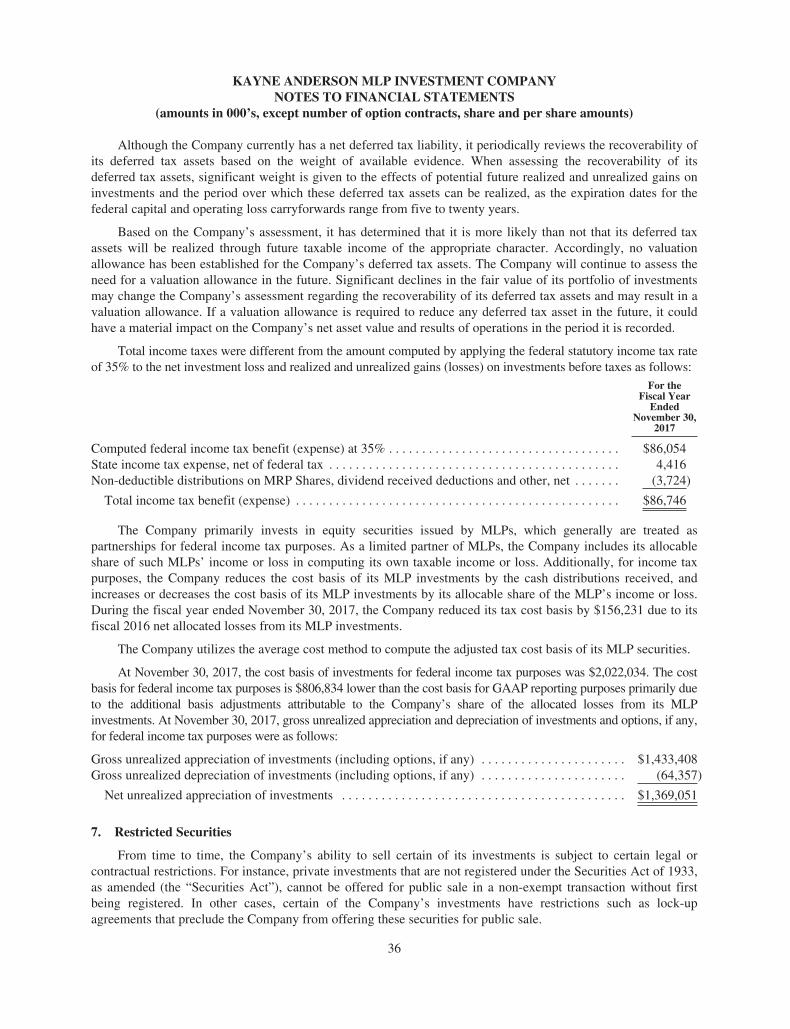
KAYNE ANDERSON MLP INVESTMENT COMPANYNOTES TO FINANCIAL STATEMENTS
(amounts in 000’s, except number of option contracts, share and per share amounts)
Although the Company currently has a net deferred tax liability, it periodically reviews the recoverability ofits deferred tax assets based on the weight of available evidence. When assessing the recoverability of itsdeferred tax assets, significant weight is given to the effects of potential future realized and unrealized gains oninvestments and the period over which these deferred tax assets can be realized, as the expiration dates for thefederal capital and operating loss carryforwards range from five to twenty years.
Based on the Company’s assessment, it has determined that it is more likely than not that its deferred taxassets will be realized through future taxable income of the appropriate character. Accordingly, no valuationallowance has been established for the Company’s deferred tax assets. The Company will continue to assess theneed for a valuation allowance in the future. Significant declines in the fair value of its portfolio of investmentsmay change the Company’s assessment regarding the recoverability of its deferred tax assets and may result in avaluation allowance. If a valuation allowance is required to reduce any deferred tax asset in the future, it couldhave a material impact on the Company’s net asset value and results of operations in the period it is recorded.
Total income taxes were different from the amount computed by applying the federal statutory income tax rateof 35% to the net investment loss and realized and unrealized gains (losses) on investments before taxes as follows:
For theFiscal Year
EndedNovember 30,
2017
Computed federal income tax benefit (expense) at 35% . . . . . . . . . . . . . . . . . . . . . . . . . . . . . . . . . . . $86,054State income tax expense, net of federal tax . . . . . . . . . . . . . . . . . . . . . . . . . . . . . . . . . . . . . . . . . . . . 4,416Non-deductible distributions on MRP Shares, dividend received deductions and other, net . . . . . . . (3,724)
Total income tax benefit (expense) . . . . . . . . . . . . . . . . . . . . . . . . . . . . . . . . . . . . . . . . . . . . . . . . . $86,746
The Company primarily invests in equity securities issued by MLPs, which generally are treated aspartnerships for federal income tax purposes. As a limited partner of MLPs, the Company includes its allocableshare of such MLPs’ income or loss in computing its own taxable income or loss. Additionally, for income taxpurposes, the Company reduces the cost basis of its MLP investments by the cash distributions received, andincreases or decreases the cost basis of its MLP investments by its allocable share of the MLP’s income or loss.During the fiscal year ended November 30, 2017, the Company reduced its tax cost basis by $156,231 due to itsfiscal 2016 net allocated losses from its MLP investments.
The Company utilizes the average cost method to compute the adjusted tax cost basis of its MLP securities.
At November 30, 2017, the cost basis of investments for federal income tax purposes was $2,022,034. The costbasis for federal income tax purposes is $806,834 lower than the cost basis for GAAP reporting purposes primarily dueto the additional basis adjustments attributable to the Company’s share of the allocated losses from its MLPinvestments. At November 30, 2017, gross unrealized appreciation and depreciation of investments and options, if any,for federal income tax purposes were as follows:
Gross unrealized appreciation of investments (including options, if any) . . . . . . . . . . . . . . . . . . . . . . $1,433,408Gross unrealized depreciation of investments (including options, if any) . . . . . . . . . . . . . . . . . . . . . . (64,357)
Net unrealized appreciation of investments . . . . . . . . . . . . . . . . . . . . . . . . . . . . . . . . . . . . . . . . . . . $1,369,051
7. Restricted Securities
From time to time, the Company’s ability to sell certain of its investments is subject to certain legal orcontractual restrictions. For instance, private investments that are not registered under the Securities Act of 1933,as amended (the “Securities Act”), cannot be offered for public sale in a non-exempt transaction without firstbeing registered. In other cases, certain of the Company’s investments have restrictions such as lock-upagreements that preclude the Company from offering these securities for public sale.
36
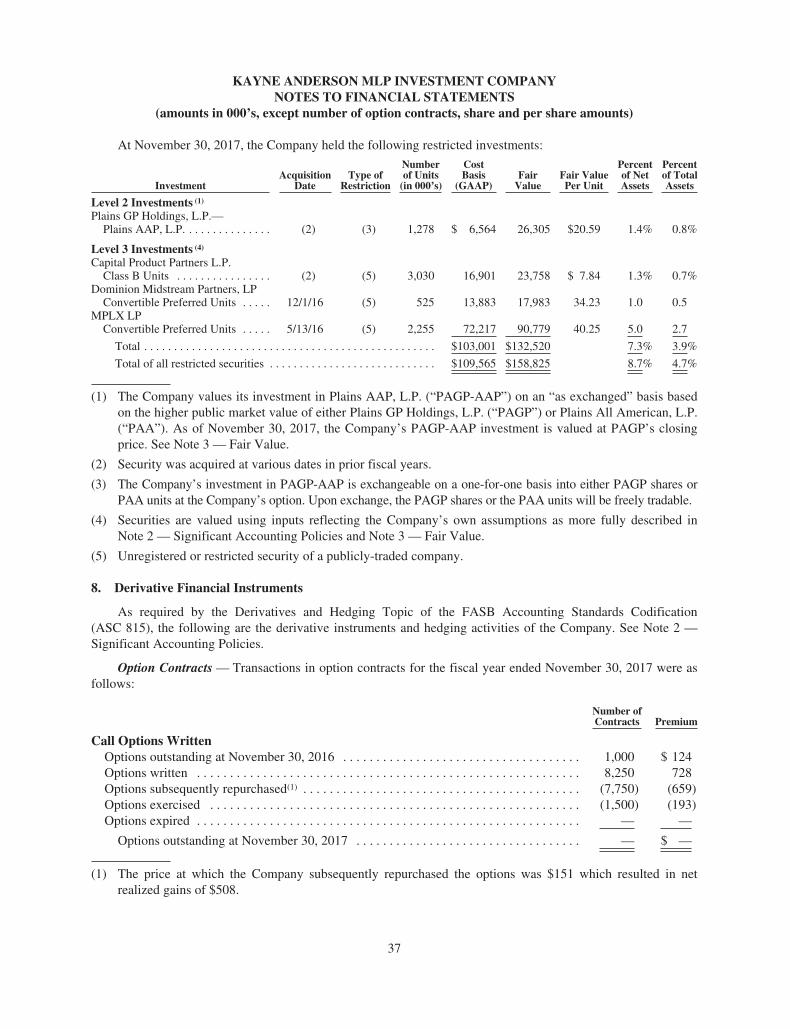
KAYNE ANDERSON MLP INVESTMENT COMPANYNOTES TO FINANCIAL STATEMENTS
(amounts in 000’s, except number of option contracts, share and per share amounts)
At November 30, 2017, the Company held the following restricted investments:
InvestmentAcquisition
DateType of
Restriction
Numberof Units
(in 000’s)
CostBasis
(GAAP)Fair
ValueFair ValuePer Unit
Percentof NetAssets
Percentof TotalAssets
Level 2 Investments (1)
Plains GP Holdings, L.P.—Plains AAP, L.P. . . . . . . . . . . . . . . (2) (3) 1,278 $ 6,564 26,305 $20.59 1.4% 0.8%
Level 3 Investments (4)
Capital Product Partners L.P.Class B Units . . . . . . . . . . . . . . . . (2) (5) 3,030 16,901 23,758 $ 7.84 1.3% 0.7%
Dominion Midstream Partners, LPConvertible Preferred Units . . . . . 12/1/16 (5) 525 13,883 17,983 34.23 1.0 0.5
MPLX LPConvertible Preferred Units . . . . . 5/13/16 (5) 2,255 72,217 90,779 40.25 5.0 2.7
Total . . . . . . . . . . . . . . . . . . . . . . . . . . . . . . . . . . . . . . . . . . . . . . . . . $103,001 $132,520 7.3% 3.9%
Total of all restricted securities . . . . . . . . . . . . . . . . . . . . . . . . . . . . $109,565 $158,825 8.7% 4.7%
(1) The Company values its investment in Plains AAP, L.P. (“PAGP-AAP”) on an “as exchanged” basis basedon the higher public market value of either Plains GP Holdings, L.P. (“PAGP”) or Plains All American, L.P.(“PAA”). As of November 30, 2017, the Company’s PAGP-AAP investment is valued at PAGP’s closingprice. See Note 3 — Fair Value.
(2) Security was acquired at various dates in prior fiscal years.
(3) The Company’s investment in PAGP-AAP is exchangeable on a one-for-one basis into either PAGP shares orPAA units at the Company’s option. Upon exchange, the PAGP shares or the PAA units will be freely tradable.
(4) Securities are valued using inputs reflecting the Company’s own assumptions as more fully described inNote 2 — Significant Accounting Policies and Note 3 — Fair Value.
(5) Unregistered or restricted security of a publicly-traded company.
8. Derivative Financial Instruments
As required by the Derivatives and Hedging Topic of the FASB Accounting Standards Codification(ASC 815), the following are the derivative instruments and hedging activities of the Company. See Note 2 —Significant Accounting Policies.
Option Contracts — Transactions in option contracts for the fiscal year ended November 30, 2017 were asfollows:
Number ofContracts Premium
Call Options WrittenOptions outstanding at November 30, 2016 . . . . . . . . . . . . . . . . . . . . . . . . . . . . . . . . . . . . 1,000 $ 124Options written . . . . . . . . . . . . . . . . . . . . . . . . . . . . . . . . . . . . . . . . . . . . . . . . . . . . . . . . . . 8,250 728Options subsequently repurchased(1) . . . . . . . . . . . . . . . . . . . . . . . . . . . . . . . . . . . . . . . . . . (7,750) (659)Options exercised . . . . . . . . . . . . . . . . . . . . . . . . . . . . . . . . . . . . . . . . . . . . . . . . . . . . . . . . (1,500) (193)Options expired . . . . . . . . . . . . . . . . . . . . . . . . . . . . . . . . . . . . . . . . . . . . . . . . . . . . . . . . . . — —
Options outstanding at November 30, 2017 . . . . . . . . . . . . . . . . . . . . . . . . . . . . . . . . . . — $ —
(1) The price at which the Company subsequently repurchased the options was $151 which resulted in netrealized gains of $508.
37
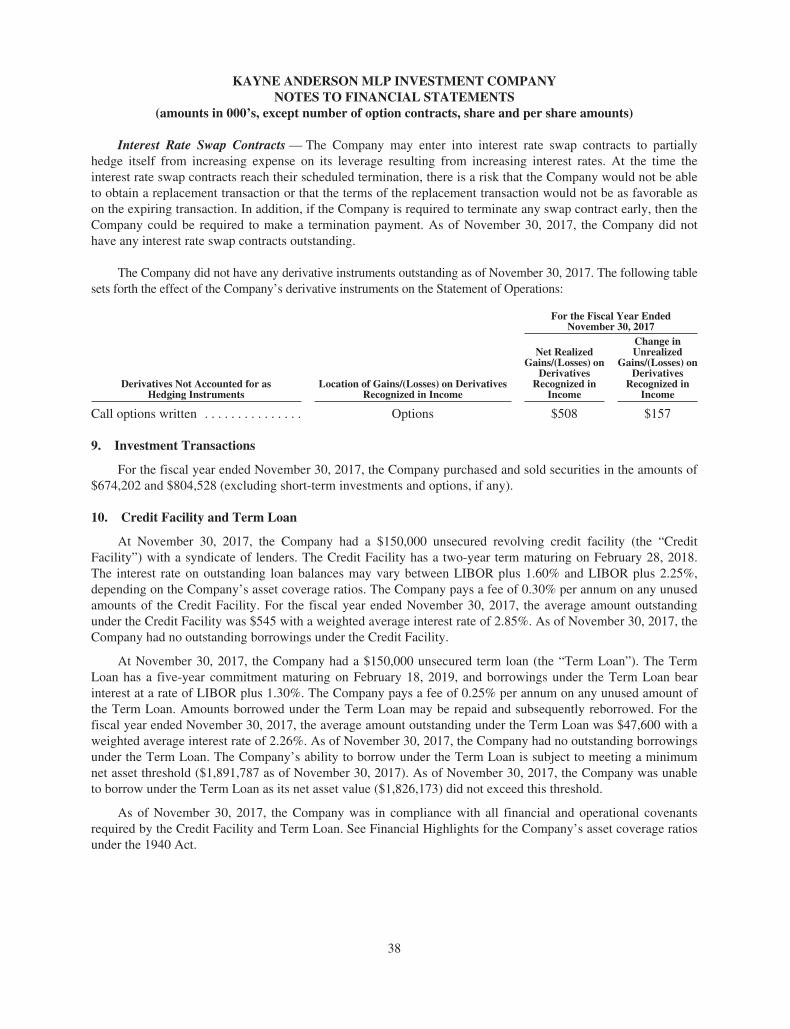
KAYNE ANDERSON MLP INVESTMENT COMPANYNOTES TO FINANCIAL STATEMENTS
(amounts in 000’s, except number of option contracts, share and per share amounts)
Interest Rate Swap Contracts — The Company may enter into interest rate swap contracts to partiallyhedge itself from increasing expense on its leverage resulting from increasing interest rates. At the time theinterest rate swap contracts reach their scheduled termination, there is a risk that the Company would not be ableto obtain a replacement transaction or that the terms of the replacement transaction would not be as favorable ason the expiring transaction. In addition, if the Company is required to terminate any swap contract early, then theCompany could be required to make a termination payment. As of November 30, 2017, the Company did nothave any interest rate swap contracts outstanding.
The Company did not have any derivative instruments outstanding as of November 30, 2017. The following tablesets forth the effect of the Company’s derivative instruments on the Statement of Operations:
For the Fiscal Year EndedNovember 30, 2017
Derivatives Not Accounted for asHedging Instruments
Location of Gains/(Losses) on DerivativesRecognized in Income
Net RealizedGains/(Losses) on
DerivativesRecognized in
Income
Change inUnrealized
Gains/(Losses) onDerivatives
Recognized inIncome
Call options written . . . . . . . . . . . . . . . Options $508 $157
9. Investment Transactions
For the fiscal year ended November 30, 2017, the Company purchased and sold securities in the amounts of$674,202 and $804,528 (excluding short-term investments and options, if any).
10. Credit Facility and Term Loan
At November 30, 2017, the Company had a $150,000 unsecured revolving credit facility (the “CreditFacility”) with a syndicate of lenders. The Credit Facility has a two-year term maturing on February 28, 2018.The interest rate on outstanding loan balances may vary between LIBOR plus 1.60% and LIBOR plus 2.25%,depending on the Company’s asset coverage ratios. The Company pays a fee of 0.30% per annum on any unusedamounts of the Credit Facility. For the fiscal year ended November 30, 2017, the average amount outstandingunder the Credit Facility was $545 with a weighted average interest rate of 2.85%. As of November 30, 2017, theCompany had no outstanding borrowings under the Credit Facility.
At November 30, 2017, the Company had a $150,000 unsecured term loan (the “Term Loan”). The TermLoan has a five-year commitment maturing on February 18, 2019, and borrowings under the Term Loan bearinterest at a rate of LIBOR plus 1.30%. The Company pays a fee of 0.25% per annum on any unused amount ofthe Term Loan. Amounts borrowed under the Term Loan may be repaid and subsequently reborrowed. For thefiscal year ended November 30, 2017, the average amount outstanding under the Term Loan was $47,600 with aweighted average interest rate of 2.26%. As of November 30, 2017, the Company had no outstanding borrowingsunder the Term Loan. The Company’s ability to borrow under the Term Loan is subject to meeting a minimumnet asset threshold ($1,891,787 as of November 30, 2017). As of November 30, 2017, the Company was unableto borrow under the Term Loan as its net asset value ($1,826,173) did not exceed this threshold.
As of November 30, 2017, the Company was in compliance with all financial and operational covenantsrequired by the Credit Facility and Term Loan. See Financial Highlights for the Company’s asset coverage ratiosunder the 1940 Act.
38
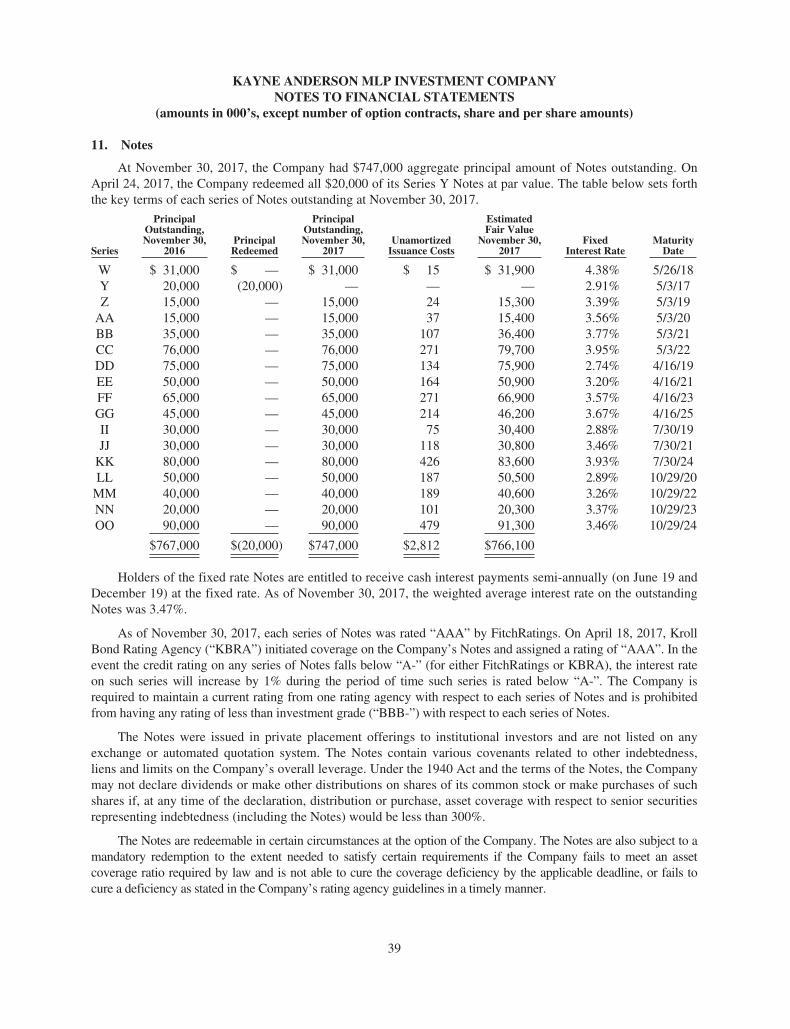
KAYNE ANDERSON MLP INVESTMENT COMPANYNOTES TO FINANCIAL STATEMENTS
(amounts in 000’s, except number of option contracts, share and per share amounts)
11. Notes
At November 30, 2017, the Company had $747,000 aggregate principal amount of Notes outstanding. OnApril 24, 2017, the Company redeemed all $20,000 of its Series Y Notes at par value. The table below sets forththe key terms of each series of Notes outstanding at November 30, 2017.
Series
PrincipalOutstanding,November 30,
2016PrincipalRedeemed
PrincipalOutstanding,November 30,
2017Unamortized
Issuance Costs
EstimatedFair Value
November 30,2017
FixedInterest Rate
MaturityDate
W $ 31,000 $ — $ 31,000 $ 15 $ 31,900 4.38% 5/26/18Y 20,000 (20,000) — — — 2.91% 5/3/17Z 15,000 — 15,000 24 15,300 3.39% 5/3/19
AA 15,000 — 15,000 37 15,400 3.56% 5/3/20BB 35,000 — 35,000 107 36,400 3.77% 5/3/21CC 76,000 — 76,000 271 79,700 3.95% 5/3/22DD 75,000 — 75,000 134 75,900 2.74% 4/16/19EE 50,000 — 50,000 164 50,900 3.20% 4/16/21FF 65,000 — 65,000 271 66,900 3.57% 4/16/23GG 45,000 — 45,000 214 46,200 3.67% 4/16/25II 30,000 — 30,000 75 30,400 2.88% 7/30/19JJ 30,000 — 30,000 118 30,800 3.46% 7/30/21
KK 80,000 — 80,000 426 83,600 3.93% 7/30/24LL 50,000 — 50,000 187 50,500 2.89% 10/29/20
MM 40,000 — 40,000 189 40,600 3.26% 10/29/22NN 20,000 — 20,000 101 20,300 3.37% 10/29/23OO 90,000 — 90,000 479 91,300 3.46% 10/29/24
$767,000 $(20,000) $747,000 $2,812 $766,100
Holders of the fixed rate Notes are entitled to receive cash interest payments semi-annually (on June 19 andDecember 19) at the fixed rate. As of November 30, 2017, the weighted average interest rate on the outstandingNotes was 3.47%.
As of November 30, 2017, each series of Notes was rated “AAA” by FitchRatings. On April 18, 2017, KrollBond Rating Agency (“KBRA”) initiated coverage on the Company’s Notes and assigned a rating of “AAA”. In theevent the credit rating on any series of Notes falls below “A-” (for either FitchRatings or KBRA), the interest rateon such series will increase by 1% during the period of time such series is rated below “A-”. The Company isrequired to maintain a current rating from one rating agency with respect to each series of Notes and is prohibitedfrom having any rating of less than investment grade (“BBB-”) with respect to each series of Notes.
The Notes were issued in private placement offerings to institutional investors and are not listed on anyexchange or automated quotation system. The Notes contain various covenants related to other indebtedness,liens and limits on the Company’s overall leverage. Under the 1940 Act and the terms of the Notes, the Companymay not declare dividends or make other distributions on shares of its common stock or make purchases of suchshares if, at any time of the declaration, distribution or purchase, asset coverage with respect to senior securitiesrepresenting indebtedness (including the Notes) would be less than 300%.
The Notes are redeemable in certain circumstances at the option of the Company. The Notes are also subject to amandatory redemption to the extent needed to satisfy certain requirements if the Company fails to meet an assetcoverage ratio required by law and is not able to cure the coverage deficiency by the applicable deadline, or fails tocure a deficiency as stated in the Company’s rating agency guidelines in a timely manner.
39
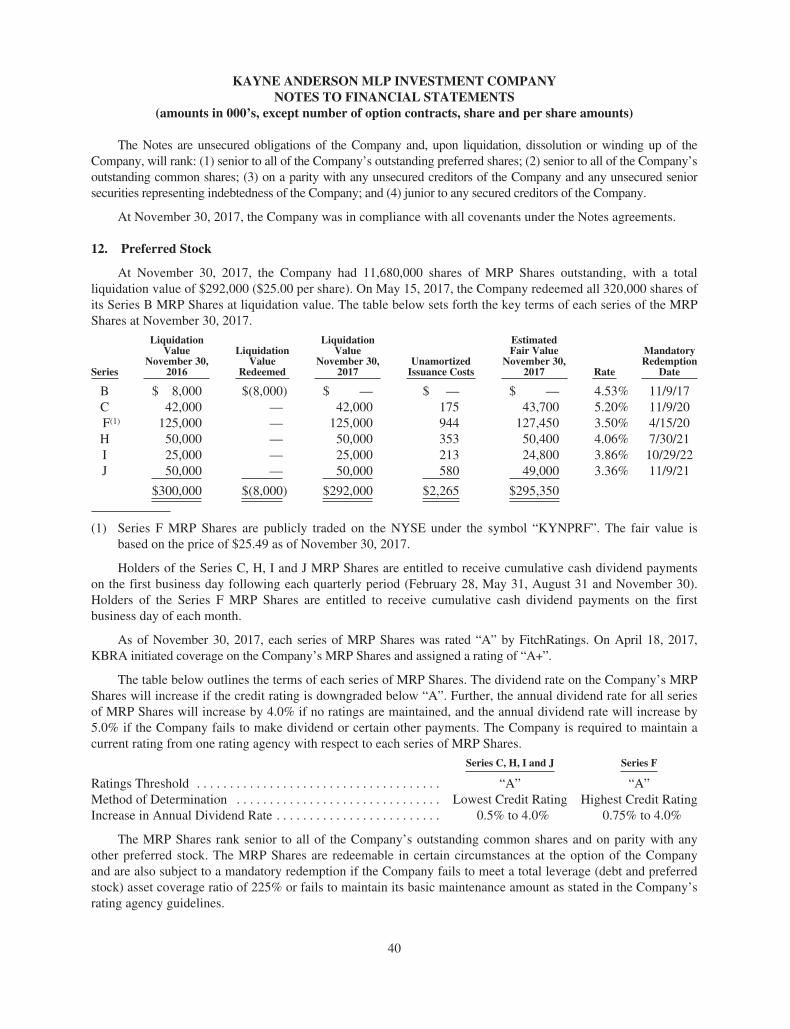
KAYNE ANDERSON MLP INVESTMENT COMPANYNOTES TO FINANCIAL STATEMENTS
(amounts in 000’s, except number of option contracts, share and per share amounts)
The Notes are unsecured obligations of the Company and, upon liquidation, dissolution or winding up of theCompany, will rank: (1) senior to all of the Company’s outstanding preferred shares; (2) senior to all of the Company’soutstanding common shares; (3) on a parity with any unsecured creditors of the Company and any unsecured seniorsecurities representing indebtedness of the Company; and (4) junior to any secured creditors of the Company.
At November 30, 2017, the Company was in compliance with all covenants under the Notes agreements.
12. Preferred Stock
At November 30, 2017, the Company had 11,680,000 shares of MRP Shares outstanding, with a totalliquidation value of $292,000 ($25.00 per share). On May 15, 2017, the Company redeemed all 320,000 shares ofits Series B MRP Shares at liquidation value. The table below sets forth the key terms of each series of the MRPShares at November 30, 2017.
Series
LiquidationValue
November 30,2016
LiquidationValue
Redeemed
LiquidationValue
November 30,2017
UnamortizedIssuance Costs
EstimatedFair Value
November 30,2017 Rate
MandatoryRedemption
Date
B $ 8,000 $(8,000) $ — $ — $ — 4.53% 11/9/17C 42,000 — 42,000 175 43,700 5.20% 11/9/20F(1) 125,000 — 125,000 944 127,450 3.50% 4/15/20H 50,000 — 50,000 353 50,400 4.06% 7/30/21I 25,000 — 25,000 213 24,800 3.86% 10/29/22J 50,000 — 50,000 580 49,000 3.36% 11/9/21
$300,000 $(8,000) $292,000 $2,265 $295,350
(1) Series F MRP Shares are publicly traded on the NYSE under the symbol “KYNPRF”. The fair value isbased on the price of $25.49 as of November 30, 2017.
Holders of the Series C, H, I and J MRP Shares are entitled to receive cumulative cash dividend paymentson the first business day following each quarterly period (February 28, May 31, August 31 and November 30).Holders of the Series F MRP Shares are entitled to receive cumulative cash dividend payments on the firstbusiness day of each month.
As of November 30, 2017, each series of MRP Shares was rated “A” by FitchRatings. On April 18, 2017,KBRA initiated coverage on the Company’s MRP Shares and assigned a rating of “A+”.
The table below outlines the terms of each series of MRP Shares. The dividend rate on the Company’s MRPShares will increase if the credit rating is downgraded below “A”. Further, the annual dividend rate for all seriesof MRP Shares will increase by 4.0% if no ratings are maintained, and the annual dividend rate will increase by5.0% if the Company fails to make dividend or certain other payments. The Company is required to maintain acurrent rating from one rating agency with respect to each series of MRP Shares.
Series C, H, I and J Series F
Ratings Threshold . . . . . . . . . . . . . . . . . . . . . . . . . . . . . . . . . . . . . “A” “A”Method of Determination . . . . . . . . . . . . . . . . . . . . . . . . . . . . . . . Lowest Credit Rating Highest Credit RatingIncrease in Annual Dividend Rate . . . . . . . . . . . . . . . . . . . . . . . . . 0.5% to 4.0% 0.75% to 4.0%
The MRP Shares rank senior to all of the Company’s outstanding common shares and on parity with anyother preferred stock. The MRP Shares are redeemable in certain circumstances at the option of the Companyand are also subject to a mandatory redemption if the Company fails to meet a total leverage (debt and preferredstock) asset coverage ratio of 225% or fails to maintain its basic maintenance amount as stated in the Company’srating agency guidelines.
40
KAYNE ANDERSON MLP INVESTMENT COMPANYNOTES TO FINANCIAL STATEMENTS
(amounts in 000’s, except number of option contracts, share and per share amounts)
Under the terms of the MRP Shares, the Company may not declare dividends or pay other distributions onshares of its common stock or make purchases of such shares if, at any time of the declaration, distribution orpurchase, asset coverage with respect to total leverage would be less than 225% or the Company would fail tomaintain its basic maintenance amount as stated in the Company’s rating agency guidelines.
The holders of the MRP Shares have one vote per share and will vote together with the holders of commonstock as a single class except on matters affecting only the holders of MRP Shares or the holders of commonstock. The holders of the MRP Shares, voting separately as a single class, have the right to elect at least twodirectors of the Company.
At November 30, 2017, the Company was in compliance with the asset coverage and basic maintenancerequirements of its MRP Shares.
13. Common Stock
At November 30, 2017, the Company had 188,320,000 shares of common stock authorized and 114,877,080shares outstanding. As of November 30, 2017, KACALP owned 285,929 shares of the Company. Transactions incommon shares for the fiscal year ended November 30, 2017 were as follows:
Shares outstanding at November 30, 2016 . . . . . . . . . . . . . . . . . . . . . . . . . . . . . . . . . . . . . . . . . . . . . 113,687,509Shares issued through reinvestment of distributions . . . . . . . . . . . . . . . . . . . . . . . . . . . . . . . . . . . . . . 1,189,571
Shares outstanding at November 30, 2017 . . . . . . . . . . . . . . . . . . . . . . . . . . . . . . . . . . . . . . . . . . . . . 114,877,080
14. Subsequent Events
On December 14, 2017, the Company declared its quarterly distribution of $0.45 per common share for thefourth quarter. The total distribution of $51,695 was paid January 12, 2018. Of this total, pursuant to theCompany’s dividend reinvestment plan, $4,800 was reinvested into the Company through the issuance of255,984 shares of common stock.
On December 22, 2017, the Tax Cuts and Jobs Act (the “Tax Reform Bill”) was signed into law. Prior toenactment of the Tax Reform Bill, the Company’s deferred tax liability was based primarily on the federal rate of35%. The Tax Reform Bill cut the federal tax rate to 21%, significantly reducing the Company’s deferred taxliability and increasing the Company’s net asset value. The decrease to the deferred tax liability was reflected inthe Company’s net asset value reported on December 22, 2017 (the date of enactment).
Other changes in the Tax Reform Bill that impact the Company include limitations on the deductibility ofnet interest expense and limitations on the usage of net operating loss carryforwards (and elimination ofcarrybacks). To the extent certain deductions are limited in any given year, the Company will be able to utilizesuch deductions in future periods if it has sufficient taxable income.
The Tax Reform Bill also repealed the corporate Alternative Minimum Tax (“AMT”) for tax yearsbeginning after December 31, 2017 and provides that existing AMT credit carryforwards will be refundable. TheCompany will remain subject to corporate AMT for fiscal 2018 but expects to file for refunds of AMT creditcarryforwards, if any, beginning in fiscal 2019. Further, the Tax Reform Bill permits immediate expensing ofqualified capital expenditures for the next five years, and as a result, the Company’s portfolio companies maypass through more deductions which may result in a higher portion of distributions received to be characterizedas return of capital.
The Company has performed an evaluation of subsequent events through the date the financial statementswere issued and has determined that no additional items require recognition or disclosure.
41
KAYNE ANDERSON MLP INVESTMENT COMPANYREPORT OF INDEPENDENT REGISTERED PUBLIC ACCOUNTING FIRM
To the Board of Directors and Stockholders ofKayne Anderson MLP Investment Company
In our opinion, the accompanying statement of assets and liabilities, including the schedule of investments, andthe related statements of operations, of changes in net assets applicable to common stockholders, and of cashflows and the financial highlights present fairly, in all material respects, the financial position of the KayneAnderson MLP Investment Company (the “Company”) as of November 30, 2017, the results of its operationsand its cash flows for the year then ended, the changes in its net assets applicable to common stockholders foreach of the two years in the period then ended and the financial highlights for each of the ten years in the periodthen ended, in conformity with accounting principles generally accepted in the United States of America. Thesefinancial statements and financial highlights (hereafter referred to as “financial statements”) are the responsibilityof the Company’s management. Our responsibility is to express an opinion on these financial statements basedon our audits. We conducted our audits of these financial statements in accordance with the standards of thePublic Company Accounting Oversight Board (United States). Those standards require that we plan and performthe audit to obtain reasonable assurance about whether the financial statements are free of material misstatement.An audit includes examining, on a test basis, evidence supporting the amounts and disclosures in the financialstatements, assessing the accounting principles used and significant estimates made by management, andevaluating the overall financial statement presentation. We believe that our audits, which included confirmationof securities as of November 30, 2017 by correspondence with the custodian and brokers, provide a reasonablebasis for our opinion.
/s/ PricewaterhouseCoopers LLP
Los Angeles, CaliforniaJanuary 29, 2018
42
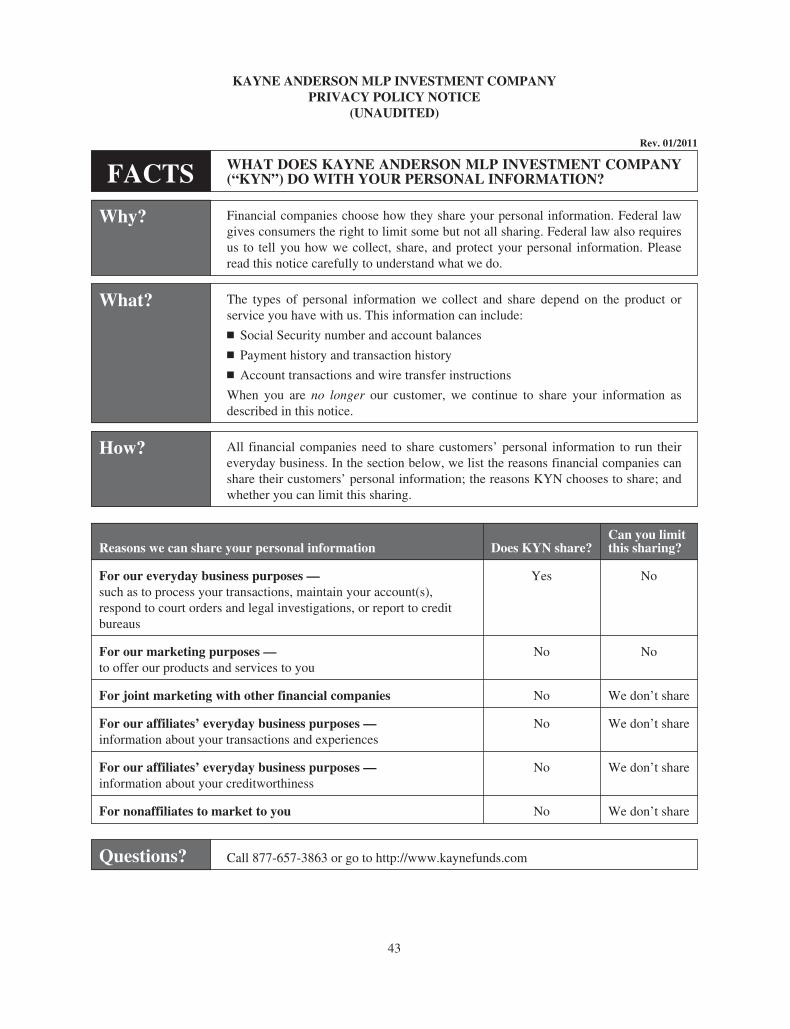
KAYNE ANDERSON MLP INVESTMENT COMPANYPRIVACY POLICY NOTICE
(UNAUDITED)
Rev. 01/2011
FACTS WHAT DOES KAYNE ANDERSON MLP INVESTMENT COMPANY(“KYN”) DO WITH YOUR PERSONAL INFORMATION?
Why? Financial companies choose how they share your personal information. Federal lawgives consumers the right to limit some but not all sharing. Federal law also requiresus to tell you how we collect, share, and protect your personal information. Pleaseread this notice carefully to understand what we do.
What? The types of personal information we collect and share depend on the product orservice you have with us. This information can include:
� Social Security number and account balances
� Payment history and transaction history
� Account transactions and wire transfer instructions
When you are no longer our customer, we continue to share your information asdescribed in this notice.
How? All financial companies need to share customers’ personal information to run theireveryday business. In the section below, we list the reasons financial companies canshare their customers’ personal information; the reasons KYN chooses to share; andwhether you can limit this sharing.
Reasons we can share your personal information Does KYN share?Can you limitthis sharing?
For our everyday business purposes —such as to process your transactions, maintain your account(s),respond to court orders and legal investigations, or report to creditbureaus
Yes No
For our marketing purposes —to offer our products and services to you
No No
For joint marketing with other financial companies No We don’t share
For our affiliates’ everyday business purposes —information about your transactions and experiences
No We don’t share
For our affiliates’ everyday business purposes —information about your creditworthiness
No We don’t share
For nonaffiliates to market to you No We don’t share
Questions? Call 877-657-3863 or go to http://www.kaynefunds.com
43
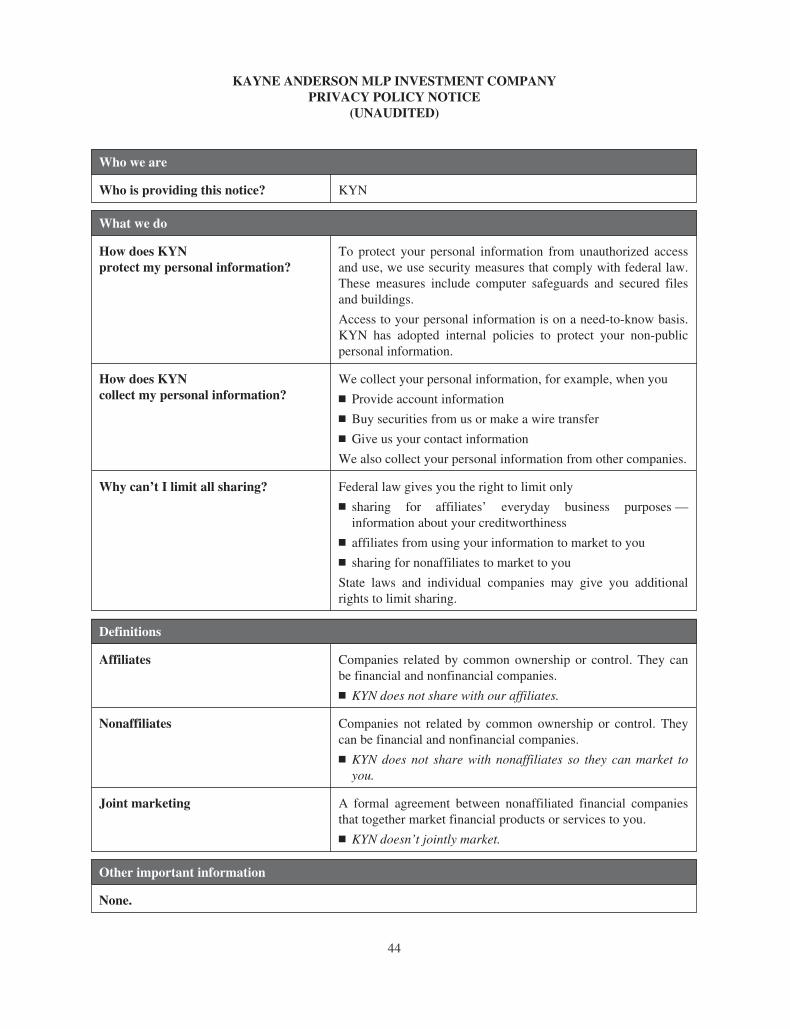
KAYNE ANDERSON MLP INVESTMENT COMPANYPRIVACY POLICY NOTICE
(UNAUDITED)
Who we are
Who is providing this notice? KYN
What we do
How does KYNprotect my personal information?
To protect your personal information from unauthorized accessand use, we use security measures that comply with federal law.These measures include computer safeguards and secured filesand buildings.
Access to your personal information is on a need-to-know basis.KYN has adopted internal policies to protect your non-publicpersonal information.
How does KYNcollect my personal information?
We collect your personal information, for example, when you
� Provide account information
� Buy securities from us or make a wire transfer
� Give us your contact information
We also collect your personal information from other companies.
Why can’t I limit all sharing? Federal law gives you the right to limit only
� sharing for affiliates’ everyday business purposes —information about your creditworthiness
� affiliates from using your information to market to you
� sharing for nonaffiliates to market to you
State laws and individual companies may give you additionalrights to limit sharing.
Definitions
Affiliates Companies related by common ownership or control. They canbe financial and nonfinancial companies.
� KYN does not share with our affiliates.
Nonaffiliates Companies not related by common ownership or control. Theycan be financial and nonfinancial companies.
� KYN does not share with nonaffiliates so they can market toyou.
Joint marketing A formal agreement between nonaffiliated financial companiesthat together market financial products or services to you.
� KYN doesn’t jointly market.
Other important information
None.
44
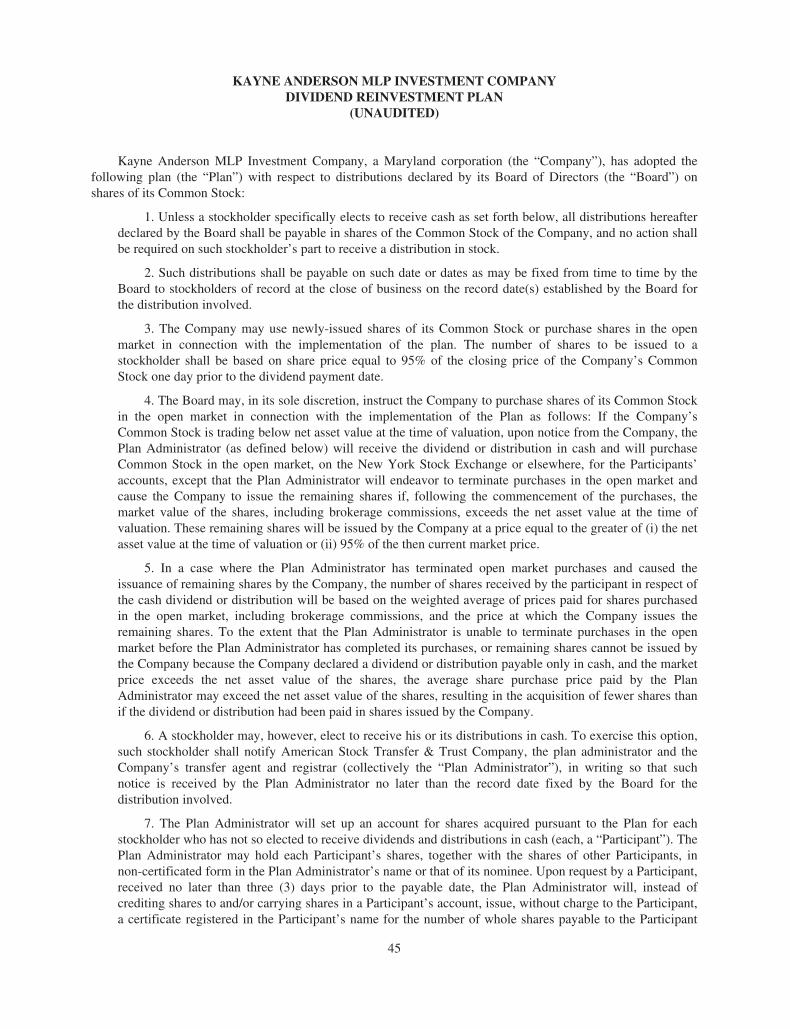
KAYNE ANDERSON MLP INVESTMENT COMPANYDIVIDEND REINVESTMENT PLAN
(UNAUDITED)
Kayne Anderson MLP Investment Company, a Maryland corporation (the “Company”), has adopted thefollowing plan (the “Plan”) with respect to distributions declared by its Board of Directors (the “Board”) onshares of its Common Stock:
1. Unless a stockholder specifically elects to receive cash as set forth below, all distributions hereafterdeclared by the Board shall be payable in shares of the Common Stock of the Company, and no action shallbe required on such stockholder’s part to receive a distribution in stock.
2. Such distributions shall be payable on such date or dates as may be fixed from time to time by theBoard to stockholders of record at the close of business on the record date(s) established by the Board forthe distribution involved.
3. The Company may use newly-issued shares of its Common Stock or purchase shares in the openmarket in connection with the implementation of the plan. The number of shares to be issued to astockholder shall be based on share price equal to 95% of the closing price of the Company’s CommonStock one day prior to the dividend payment date.
4. The Board may, in its sole discretion, instruct the Company to purchase shares of its Common Stockin the open market in connection with the implementation of the Plan as follows: If the Company’sCommon Stock is trading below net asset value at the time of valuation, upon notice from the Company, thePlan Administrator (as defined below) will receive the dividend or distribution in cash and will purchaseCommon Stock in the open market, on the New York Stock Exchange or elsewhere, for the Participants’accounts, except that the Plan Administrator will endeavor to terminate purchases in the open market andcause the Company to issue the remaining shares if, following the commencement of the purchases, themarket value of the shares, including brokerage commissions, exceeds the net asset value at the time ofvaluation. These remaining shares will be issued by the Company at a price equal to the greater of (i) the netasset value at the time of valuation or (ii) 95% of the then current market price.
5. In a case where the Plan Administrator has terminated open market purchases and caused theissuance of remaining shares by the Company, the number of shares received by the participant in respect ofthe cash dividend or distribution will be based on the weighted average of prices paid for shares purchasedin the open market, including brokerage commissions, and the price at which the Company issues theremaining shares. To the extent that the Plan Administrator is unable to terminate purchases in the openmarket before the Plan Administrator has completed its purchases, or remaining shares cannot be issued bythe Company because the Company declared a dividend or distribution payable only in cash, and the marketprice exceeds the net asset value of the shares, the average share purchase price paid by the PlanAdministrator may exceed the net asset value of the shares, resulting in the acquisition of fewer shares thanif the dividend or distribution had been paid in shares issued by the Company.
6. A stockholder may, however, elect to receive his or its distributions in cash. To exercise this option,such stockholder shall notify American Stock Transfer & Trust Company, the plan administrator and theCompany’s transfer agent and registrar (collectively the “Plan Administrator”), in writing so that suchnotice is received by the Plan Administrator no later than the record date fixed by the Board for thedistribution involved.
7. The Plan Administrator will set up an account for shares acquired pursuant to the Plan for eachstockholder who has not so elected to receive dividends and distributions in cash (each, a “Participant”). ThePlan Administrator may hold each Participant’s shares, together with the shares of other Participants, innon-certificated form in the Plan Administrator’s name or that of its nominee. Upon request by a Participant,received no later than three (3) days prior to the payable date, the Plan Administrator will, instead ofcrediting shares to and/or carrying shares in a Participant’s account, issue, without charge to the Participant,a certificate registered in the Participant’s name for the number of whole shares payable to the Participant
45
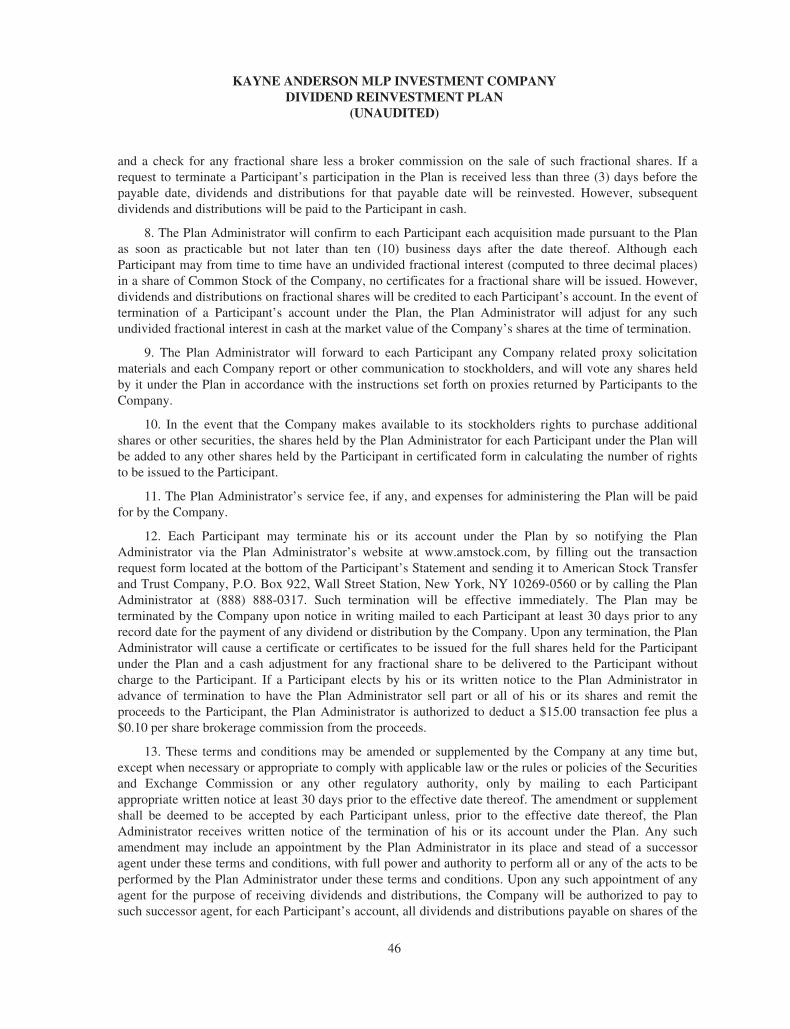
KAYNE ANDERSON MLP INVESTMENT COMPANYDIVIDEND REINVESTMENT PLAN
(UNAUDITED)
and a check for any fractional share less a broker commission on the sale of such fractional shares. If arequest to terminate a Participant’s participation in the Plan is received less than three (3) days before thepayable date, dividends and distributions for that payable date will be reinvested. However, subsequentdividends and distributions will be paid to the Participant in cash.
8. The Plan Administrator will confirm to each Participant each acquisition made pursuant to the Planas soon as practicable but not later than ten (10) business days after the date thereof. Although eachParticipant may from time to time have an undivided fractional interest (computed to three decimal places)in a share of Common Stock of the Company, no certificates for a fractional share will be issued. However,dividends and distributions on fractional shares will be credited to each Participant’s account. In the event oftermination of a Participant’s account under the Plan, the Plan Administrator will adjust for any suchundivided fractional interest in cash at the market value of the Company’s shares at the time of termination.
9. The Plan Administrator will forward to each Participant any Company related proxy solicitationmaterials and each Company report or other communication to stockholders, and will vote any shares heldby it under the Plan in accordance with the instructions set forth on proxies returned by Participants to theCompany.
10. In the event that the Company makes available to its stockholders rights to purchase additionalshares or other securities, the shares held by the Plan Administrator for each Participant under the Plan willbe added to any other shares held by the Participant in certificated form in calculating the number of rightsto be issued to the Participant.
11. The Plan Administrator’s service fee, if any, and expenses for administering the Plan will be paidfor by the Company.
12. Each Participant may terminate his or its account under the Plan by so notifying the PlanAdministrator via the Plan Administrator’s website at www.amstock.com, by filling out the transactionrequest form located at the bottom of the Participant’s Statement and sending it to American Stock Transferand Trust Company, P.O. Box 922, Wall Street Station, New York, NY 10269-0560 or by calling the PlanAdministrator at (888) 888-0317. Such termination will be effective immediately. The Plan may beterminated by the Company upon notice in writing mailed to each Participant at least 30 days prior to anyrecord date for the payment of any dividend or distribution by the Company. Upon any termination, the PlanAdministrator will cause a certificate or certificates to be issued for the full shares held for the Participantunder the Plan and a cash adjustment for any fractional share to be delivered to the Participant withoutcharge to the Participant. If a Participant elects by his or its written notice to the Plan Administrator inadvance of termination to have the Plan Administrator sell part or all of his or its shares and remit theproceeds to the Participant, the Plan Administrator is authorized to deduct a $15.00 transaction fee plus a$0.10 per share brokerage commission from the proceeds.
13. These terms and conditions may be amended or supplemented by the Company at any time but,except when necessary or appropriate to comply with applicable law or the rules or policies of the Securitiesand Exchange Commission or any other regulatory authority, only by mailing to each Participantappropriate written notice at least 30 days prior to the effective date thereof. The amendment or supplementshall be deemed to be accepted by each Participant unless, prior to the effective date thereof, the PlanAdministrator receives written notice of the termination of his or its account under the Plan. Any suchamendment may include an appointment by the Plan Administrator in its place and stead of a successoragent under these terms and conditions, with full power and authority to perform all or any of the acts to beperformed by the Plan Administrator under these terms and conditions. Upon any such appointment of anyagent for the purpose of receiving dividends and distributions, the Company will be authorized to pay tosuch successor agent, for each Participant’s account, all dividends and distributions payable on shares of the
46
KAYNE ANDERSON MLP INVESTMENT COMPANYDIVIDEND REINVESTMENT PLAN
(UNAUDITED)
Company held in the Participant’s name or under the Plan for retention or application by such successoragent as provided in these terms and conditions.
14. The Plan Administrator will at all times act in good faith and use its best efforts within reasonablelimits to ensure its full and timely performance of all services to be performed by it under this Plan and tocomply with applicable law, but assumes no responsibility and shall not be liable for loss or damage due toerrors unless such error is caused by the Plan Administrator’s negligence, bad faith, or willful misconduct orthat of its employees or agents.
15. These terms and conditions shall be governed by the laws of the State of Maryland.
Adopted: September 27, 2004Amended: December 13, 2005Amended: March 12, 2009
47
KAYNE ANDERSON MLP INVESTMENT COMPANYINFORMATION CONCERNING DIRECTORS AND CORPORATE OFFICERS
(UNAUDITED)
Independent Directors(1)
Name(2),(Year Born)
Position(s)Held with Company,
Term of Office/Time of Service
Principal OccupationsDuring Past Five Years
Other Directorships Held byDirector/Officer During
Past Five Years
Anne K. Costin(born 1950)
Director. 3-year term(until the 2019 AnnualMeeting of Stockholders)/served since inception
Professor at the Amsterdam Institute of Financefrom 2007 to 2013. Adjunct Professor in theFinance and Economics Department of ColumbiaUniversity Graduate School of Business inNew York from 2004 through 2007. As of March1, 2005, Ms. Costin retired after a 28-year careerat Citigroup. During the seven years prior to herretirement, Ms. Costin was Managing Directorand Global Deputy Head of the Project &Structured Trade Finance product group withinCitigroup’s Investment Banking Division.
• Kayne Anderson Energy TotalReturn Fund, Inc. (“KYE”)
Steven C. Good(born 1942)
Director. 3-year term(until the 2018 AnnualMeeting of Stockholders)/served since inception
Independent consultant since February 2010,when he retired from CohnReznick LLP, wherehe had been an active partner since 1976.CohnReznick LLP offers accounting, tax andbusiness advisory services to middle marketprivate and publicly-traded companies, theirowners and their management. Founded Block,Good and Gagerman in 1976, which laterevolved in stages into CohnReznick LLP.
Current:
• KYE• OSI Systems, Inc.
(specialized electronic products)• Rexford Industrial Realty, Inc. (real
estate investment trust)Prior:• California Pizza Kitchen, Inc.
(restaurant chain)• Arden Realty, Inc.
(real estate investment trust)
William H. Shea, Jr.(born 1954)
Director. 3-year term(until the 2019 AnnualMeeting of Stockholders)/served since March 2008
Chief Executive Officer of Mainline EnergyPartners, LLC since July 2016. Chief ExecutiveOfficer and President of Niska Gas StoragePartners LLC from May 2014 to July 2016. ChiefExecutive Officer of the general partner of PVRPartners, L.P. (PVR) from March 2010 toMarch 2014. Chief Executive Officer andPresident of the general partner of Penn VirginiaGP Holdings, L.P. (PVG), from March 2010 toMarch 2011. Private investor from June 2007 toMarch 2010. From September 2000 to June2007, President, Chief Executive Officer andDirector (Chairman from May 2004 to June2007) of Buckeye Partners L.P. (BPL). FromMay 2004 to June 2007, President, ChiefExecutive Officer and Chairman of Buckeye GPHoldings L.P. (BGH) and its predecessors.
Current:
• KYE• Mainline Energy Partners, LLC
(midstream energy)• USA Compression Partners, LP
(natural gas compression MLP)Prior:• BGH
(general partner of BPL)• BPL
(midstream MLP)• Gibson Energy ULC
(midstream energy)• Niska Gas Storage Partners LLC
(natural gas storage)• PVG
(owned general partner of PVR)• PVR
(midstream MLP)• Penn Virginia Corporation
(oil and gas exploration andproduction company)
48
KAYNE ANDERSON MLP INVESTMENT COMPANYINFORMATION CONCERNING DIRECTORS AND CORPORATE OFFICERS
(UNAUDITED)
Interested Director and Non-Director Officers
Name(2),(Year Born)
Position(s)Held with Company,
Term of Office/Time of Service
Principal OccupationsDuring Past Five Years
Other Directorships Held byDirector/Officer During
Past Five Years
Kevin S. McCarthy(4)
(born 1959)Chairman of the Board ofDirectors and ChiefExecutive Officer. 3-yearterm as a director (untilthe 2018 Annual Meetingof Stockholders), electedannually as an officer/served since inception
Managing Partner of KACALP since June 2004and Co-Managing Partner of KAFA since 2006.Chief Executive Officer of KYE; KayneAnderson Energy Development Company(“KED”); and Kayne Anderson Midstream/Energy Fund, Inc. (“KMF”) since inception(KYE inception in 2005; KED inception in 2006;and KMF inception in 2010).
Current:• KYE• KED• KMF• Kayne Anderson Acquisition Corp.
(special purpose acquisitioncompany)
• Range Resources Corporation(oil and gas exploration andproduction company)
Prior:• Clearwater Natural Resources, L.P.
(coal mining)• Direct Fuels Partners, L.P.
(transmix refining and fuelsdistribution)
• Emerge Energy Services LP(frac sand MLP)
• International Resource Partners LP(coal mining)
• K-Sea Transportation Partners LP(shipping MLP)
• ONEOK, Inc.(midstream company)
• ProPetro Services, Inc.(oilfield services)
J.C. Frey(born 1968)
Executive Vice President,Assistant Treasurer andAssistant Secretary.Elected annually. Servedas Assistant Treasurer andAssistant Secretary sinceinception; served asExecutive Vice Presidentsince June 2008
Managing Partner of KACALP since 2004 andCo-Managing Partner of KAFA since 2006.Assistant Secretary and Assistant Treasurer ofKYE since 2005 and of KED since 2006.Executive Vice President of KYE and KED sinceJune 2008 and of KMF since August 2010.
None
James C. Baker(born 1972)
President since June 2016.Executive Vice Presidentfrom June 2008 to June2016. Elected annually/served since June 2005
Senior Managing Director of KACALP andKAFA since February 2008. President of KYE,KED and KMF since June 2016. Executive VicePresident of KYE and KED from June 2008 toJune 2016 and of KMF from August 2010 toJune 2016.
Current:• KEDPrior:• K-Sea Transportation Partners LP
(shipping MLP)• Petris Technology, Inc.
(data management for energycompanies)
• ProPetro Services, Inc.(oilfield services)
Terry A. Hart(born 1969)
Chief Financial Officerand Treasurer. Electedannually/served since2005
Managing Director of KACALP sinceDecember 2005 and Chief Financial Officer ofKAFA since 2006. Chief Financial Officer andTreasurer of KYE since December 2005; of KEDsince September 2006; and of KMF since August2010. Chief Financial Officer of KayneAnderson Acquisition Corp. since December2016.
Current:• KED• The Source for Women
(not-for-profit organization)
49
KAYNE ANDERSON MLP INVESTMENT COMPANYINFORMATION CONCERNING DIRECTORS AND CORPORATE OFFICERS
(UNAUDITED)
Interested Director and Non-Director Officers
Name(2),(Year Born)
Position(s)Held with Company,
Term of Office/Time of Service
Principal OccupationsDuring Past Five Years
Other Directorships Held byDirector/Officer During
Past Five Years
Ron M. Logan, Jr.(born 1960)
Senior Vice PresidentElected annually/servedsince September 2012
Senior Managing Director of KACALP andKAFA since February 2014. Managing Directorof KACALP and KAFA from September 2006 toFebruary 2014. Senior Vice President of KEDsince September 2006, of KMF since June 2012and of KYE since September 2012.
Prior• VantaCore Partners LP
(aggregates MLP)
Jody C. Meraz(born 1978)
Vice President. Electedannually/served since2011
Managing Director of KACALP and KAFAsince February 2014. Senior Vice President ofKACALP and KAFA from 2011 to February2014. Vice President of KYE, KED and KMFsince 2011.
None
Alan R. Boswell(born 1978)
Vice President. Electedannually/served since2017
Managing Director of KACALP and KAFAsince January 2018. Senior Vice President ofKACALP and KAFA from July 2014 to January2018. Vice President of KACALP and KAFAfrom 2012 to July 2014. Vice President of KYE,KED and KMF since 2017.
None
Michael O’Neil(born 1983)
Chief ComplianceOfficer. Electedannually/served since2013
Chief Compliance Officer of KACALP andKAFA since March 2012 and of KYE, KED,KMF since December 2013 and of KAAssociates, Inc. (broker-dealer) since January2013. A compliance officer at BlackRock Inc.from January 2008 to February 2012.
None
David J. Shladovsky(born 1960)
Secretary. Electedannually/served sinceinception
General Counsel of KACALP since 1997 and ofKAFA since 2006. Secretary and ChiefCompliance Officer (through December 2013) ofKYE since 2005; of KED since 2006; and ofKMF since August 2010.
None
(1) The 1940 Act requires the term “Fund Complex” to be defined to include registered investment companiesadvised by KAFA, the Company’s investment adviser, and the Fund Complex included the Company, KYE,KED and KMF. Each Independent Director oversees two registered investment companies in the FundComplex the Company and KYE, as noted above.
(2) The address of each director and corporate officer is c/o KA Fund Advisors, LLC, 811 Main Street, 14thFloor, Houston, Texas, 77002.
(3) The investment adviser to the Kayne Anderson Rudnick Mutual Funds, Kayne Anderson RudnickInvestment Management, LLC, formerly was an affiliate of KACALP.
(4) Mr. McCarthy is an “interested person” of the Company as defined in the 1940 Act by virtue of hisemployment relationship with KAFA.
Additional information regarding the Company’s directors is contained in the Company’s Statement ofAdditional Information, the most recent version of which can be found on the Company’s website athttp://www.kaynefunds.com or is available without charge, upon request, by calling (877) 657-3863.
50
KAYNE ANDERSON MLP INVESTMENT COMPANYANNUAL CERTIFICATION
(UNAUDITED)
The Company’s Chief Executive Officer has filed an annual certification with the NYSE that, as of the dateof the certification, he was unaware of any violation by the Company of the NYSE’s corporate governance listingstandards.
INFORMATION REGARDING CHANGES TO INVESTMENT POLICY(UNAUDITED)
On April 20, 2017, the Company’s Board of Directors approved the following change to its non-fundamental investment policy related to the use of leverage:
The prior policy allowed for the Company to utilize borrowings and preferred stock (each a “LeverageInstrument” and collectively “Leverage Instruments”) in an amount that represented approximately 30% of totalassets, including proceeds from such Leverage Instruments. The revised policy has established target leveragelevels of approximately 25-30% of total assets, including proceeds from such Leverage Instruments.
The revised policy became effective June 30, 2017, as follows:
“Under normal market conditions, the Company’s policy is to utilize borrowings and preferred stock (each a“Leverage Instrument” and collectively “Leverage Instruments”) in an amount that represents approximately25%-30% of total assets (the “target leverage levels”), including proceeds from such Leverage Instruments.However, the Company reserves the right at any time, based on market conditions, (i) to reduce the targetleverage levels or (ii) to use Leverage Instruments to the extent permitted by the 1940 Act.”
PROXY VOTING AND PORTFOLIO HOLDINGS INFORMATION(UNAUDITED)
The policies and procedures that the Company uses to determine how to vote proxies relating to its portfoliosecurities are available:
• without charge, upon request, by calling (877) 657-3863/MLP-FUND;
• on the Company’s website, http://www.kaynefunds.com; and
• on the SEC’s website, http://www.sec.gov.
Information regarding how the Company voted proxies relating to portfolio securities during the most recent12-month period ended June 30 is available without charge, upon request, by calling (877) 657-3863/MLP-FUND,and on the SEC’s website at http://www.sec.gov (see Form N-PX).
The Company files a complete schedule of its portfolio holdings for the first and third quarters of each of itsfiscal years with the SEC on Form N-Q and Form N-30B-2. The Company’s Form N-Q and Form N-30B-2 areavailable on the SEC’s website at http://www.sec.gov and may be reviewed and copied at the SEC’s PublicReference Room in Washington, DC. Information on the operation of the SEC’s Public Reference Room may beobtained by calling 1-800-SEC-0330. The Company also makes its Form N-Q and Form N-30B-2 available on itswebsite at http://www.kaynefunds.com.
REPURCHASE DISCLOSURE(UNAUDITED)
Notice is hereby given in accordance with Section 23(c) of the 1940 Act, that the Company may from timeto time purchase shares of its common and preferred stock and its Notes in the open market or in privatelynegotiated transactions.
51
Directors and Corporate Officers
Kevin S. McCarthy Chairman of the Board of Directors andChief Executive Officer
Anne K. Costin Director
Steven C. Good Director
William H. Shea, Jr. Director
James C. Baker President
Terry A. Hart Chief Financial Officer and Treasurer
David J. Shladovsky Secretary
Michael J. O’Neil Chief Compliance Officer
J.C. Frey Executive Vice President,Assistant Secretary and Assistant Treasurer
Ron M. Logan, Jr. Senior Vice President
Alan R. Boswell Vice President
Jody C. Meraz Vice President
Investment AdviserKA Fund Advisors, LLC811 Main Street, 14th FloorHouston, TX 77002
AdministratorUltimus Fund Solutions, LLC225 Pictoria Drive, Suite 450Cincinnati, OH 45246
1800 Avenue of the Stars, Third FloorLos Angeles, CA 90067
Stock Transfer Agent and RegistrarAmerican Stock Transfer & Trust Company, LLC6201 15th AvenueBrooklyn, NY 11219(888) 888-0317
CustodianJPMorgan Chase Bank, N.A.14201 North Dallas Parkway, Second FloorDallas, TX 75254
Independent Registered Public Accounting FirmPricewaterhouseCoopers LLP601 S. Figueroa Street, Suite 900Los Angeles, CA 90017
Legal CounselPaul Hastings LLP101 California Street, Forty-Eighth FloorSan Francisco, CA 94111
Please visit us on the web at http://www.kaynefunds.com or call us toll-free at 1-877-657-3863.
This report, including the financial statements herein, is made available to stockholders of the Company for theirinformation. It is not a prospectus, circular or representation intended for use in the purchase or sale of shares ofthe Company or of any securities mentioned in this report.