Mixed HCV Genotype Infection and Response to anti-HCV treatment in HIV/HCV Co-Infected Patients Lucy...
15
Mixed HCV Genotype Infection and Response to anti-HCV treatment in HIV/HCV Co- Infected Patients Lucy Porrino, Sabrina Bagaglio, Giulia Morsica, Giulia Gallotta, Hamid Hasson, Laura Galli,Vega Rusconi, Adriano Lazzarin, Caterina Uberti- Foppa Infectious Diseases Dept, San Raffaele Scientific Institute, Milan, Italy WEAB0102
-
Upload
tobias-kennedy -
Category
Documents
-
view
218 -
download
1
Transcript of Mixed HCV Genotype Infection and Response to anti-HCV treatment in HIV/HCV Co-Infected Patients Lucy...

Mixed HCV Genotype Infection and Response to anti-HCV treatment in HIV/HCV Co-
Infected Patients
Lucy Porrino, Sabrina Bagaglio, Giulia Morsica, Giulia Gallotta, Hamid Hasson, Laura Galli,Vega Rusconi, Adriano Lazzarin, Caterina Uberti-Foppa
Infectious Diseases Dept, San Raffaele Scientific Institute, Milan, Italy
WEAB0102

Background
• The frequency of mixed infection in HCV monoinfection is about 2-13% (Schroter et al. 2003; Qian et al. 2000)
• There is a single study on viral infections with different genotypes in HIV/HCV coinfected patients and has not been evaluated the performance of the genotype during the anti-viral therapy (Soriano et al. 2005)
• Previous reports from Japan identified a mutational pattern within the core protein (70Q-91M) of HCV-1b related to the responsiveness to standard treatment for HCV
• This finding possibly mediated by an interaction with interferon signalling cellular protein STAT-1

To determine the HCV genotype pattern and core domain in HIV/HCV coinfected patients during anti-HCV treatment
AIM
Study Patients
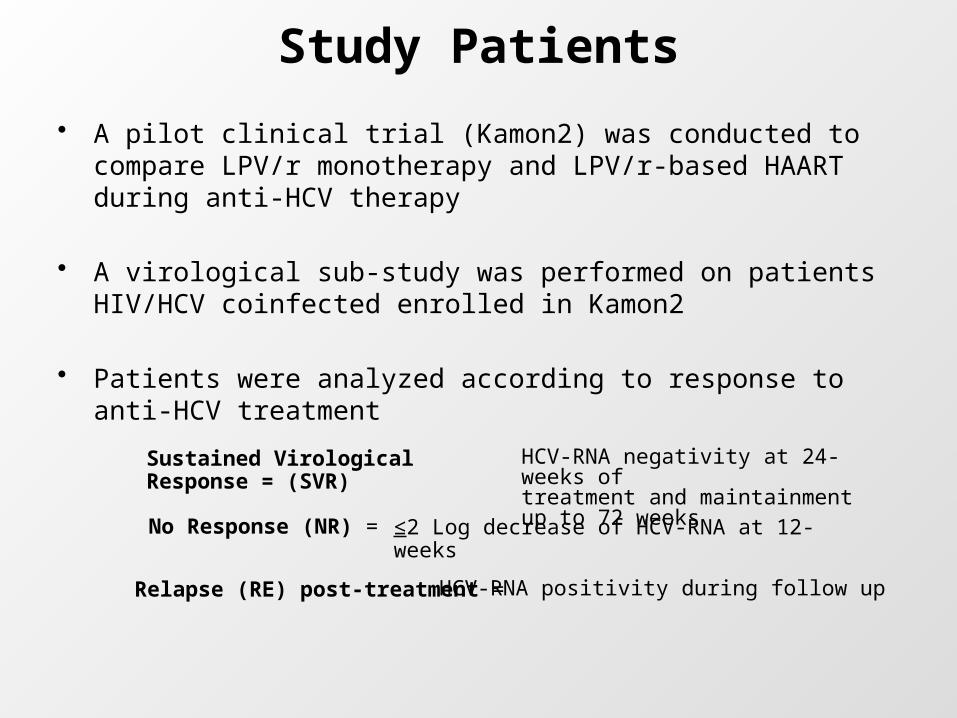
• A pilot clinical trial (Kamon2) was conducted to compare LPV/r monotherapy and LPV/r-based HAART during anti-HCV therapy
• A virological sub-study was performed on patients HIV/HCV coinfected enrolled in Kamon2
• Patients were analyzed according to response to anti-HCV treatment
HCV-RNA negativity at 24-weeks of treatment and maintainment up to 72 weeks
Sustained Virological Response = (SVR)
≤2 Log decrease of HCV-RNA at 12-weeks
No Response (NR) =
HCV-RNA positivity during follow up Relapse (RE) post-treatment =

Methods
• Sequence analysis of HCV-5’ UTR was performed in plasma at different time points: baseline (BL), during 48 weeks treatment and after treatment
• The entire sequence of core was inferred in plasma at BL, during treatment and/or after treatment. All these sequences were compared with the respective prototype (based on HCV genotyping)

Baseline Characteristics of HIV/HCV Coinfected Individuals According to Anti-HCV Treatment
ResponseAll patients
(N=22)SVR
(N=11)NR(NR+RE)
(N=11)P
(SVR vs NR)
Age (years) 42 (40-44) 44 (41-45) 42 (39-43) 0.95
Males/Females
13/9 6/5 7/4 1
ALT (U/I) 79.5 (59-164) 95 (74-150) 59 (45-137) 0.77
AST (U/I) 48 (36-88) 51 (41-84) 39 (29-83) 0.80
CD4+cells count
(cell/mmc)
592 (414-794)
596 (421-739)
514 (407-921)
0.70
CD8+cells count
(cell/mmc)
925 (693-1167)
926 (837-1116)
935 (595-1258)
0.70
HCV-RNA (Log IU/ml)
6.05 (4.83-6.34)
5.37(4055-6.03)
6.34 (6.11-6.42)
0.05
HCV Genotype (1-4 vs 2-3)
13/9 2/9 0/11 0.0002

HCV Genotype Pattern in NR during Follow-Up
BL W4 W12 W24 W36 W48 W60 W72
NR 1 1a NA 3a
NR 2 4a 3a 4a 4a 4c/d
NR 3 1b NA 1b 3a NA NA 1 1b
NR 4 1b 1b 3a 2a 1b
RE 1 1b 3a NA neg neg neg neg 1b
6 (55%) maintained the same HCV genotype during follow up
5 (45%) showed an alternance of HCV genotype in plasma
lost in follow up
lost in follow up
lost in follow up

Core sequence analysis at BL
• We obtained the core sequences of 10 SVR and 8 NR
• Different distribution of amino acids (aa) mutations in different genotype (G)
HCV Genotype (n) Median number of aa mutations (IQR)
G1 (7) 1 (0-4.5)
G2 (2) 4 (3-5)
G3 (6) 6 (6-12)
G4 (3) 4 (4-4.50)
G1-G4 vs G2-G3 p= 0.0276
G1 vs G3 p= 0.018

Core sequence analysis during follow up in 8 NR patients
• 1pt showed the same sequence at each time point • 7 pts showed at least one aa substitution during
follow up• This aa mutation were recurrent in specific position
aapositio
n20 36 70 71 75 110
N°pts 6/8 3/8 2/8 3/8 6/8 5/8

...in particular
• 6/8 showed at least aa substitution in 1-20* and 69-75 **region
• 5/8 showed at least aa substitution in 110-115* region
110 120 130 140 ....|....|....|....|....|....|....|....|...
.| RGSRPSWGPTDPRRRSRNLGKVIDTLTCGFADLMGYIPLVGAPLG
10 20 30 40 50 ....|....|....|....|....|....|....|....|....|....|MSTNPKPQRKTKRNTNRRPQDVKFPGGGQIVGGVYLLPRRGPRLGVRATR
60 70 80 90 100....|....|....|....|....|....|....|....|....|....|KTSERSQPRGRRQPIPKARRPEGRTWAQPGYPWPLYGNEGCGWAGWLLSP
*epitope regions
**peptide-specific CD4+ T-cell

• 5/8 pts showed 70Q and/or 91M» 70Q was undetectable at BL in 3pts
and appeared during treatment» in 1pt this mutation was detectable at
BL and disapperead during treatment» 1pt had 91M at BL and maintained
during treatment

Characteristic mutational pattern in 2 RE at BL...
NR vs RE p= 0.0056
...and disappeared during follow up

Conclusions - 5’ UTR analysis
• The dynamic pattern of HCV genotypes in half of NR suggests a mixed HCV-infection
• The anti-HCV treatment may induce a change balance of dominant strain
• Work in progress: ultradeep sequencing (pyrosequencing) will be performed to verify viral population in plasma

Conclusions - Core domain analysis
• At BL difficult to treat genotypes are more similar to the respective prototype than “favourable”genotypes
• On treatment the most prominent variability of specific residues in specific regions of the core domain could be consequent to the pressure exerted by interferon and/or ribavirin
Thanks to
• Infectious Diseases Dept, San Raffaele Scientific Institute, Milan
Giulia MorsicaSabrina BagaglioMarco MerliAlice DaddaHamid HassonGiulia GallottaLaura GalliVega RusconiCaterina Uberti-FoppaAdriano Lazzarin
• National Institute of Infectious Diseases, Spallanzani, Roma
• Infectious Diseases Section, Hospital SS Annunziata, Firenze
• Institute of Infectious Diseases, University of Bari, Bari