Mixed-effects regression and eye-tracking datawieling/lotschool2013/day2/presentation.pdf ·...
38
Mixed-effects regression and eye-tracking data Lecture 2 of advanced regression methods for linguists Martijn Wieling and Jacolien van Rij Seminar für Sprachwissenschaft University of Tübingen LOT Summer School 2013, Groningen, June 25 1 | Martijn Wieling and Jacolien van Rij Mixed-effects regression and eye-tracking data University of Tübingen
Transcript of Mixed-effects regression and eye-tracking datawieling/lotschool2013/day2/presentation.pdf ·...

Mixed-effects regression and eye-tracking dataLecture 2 of advanced regression methods for linguists
Martijn Wieling and Jacolien van Rij
Seminar für SprachwissenschaftUniversity of Tübingen
LOT Summer School 2013, Groningen, June 25
1 | Martijn Wieling and Jacolien van Rij Mixed-effects regression and eye-tracking data University of Tübingen

Today’s lectureI Introduction
I Gender processing in DutchI Eye-tracking to reveal gender processing
I Design
I Analysis
I Conclusion
2 | Martijn Wieling and Jacolien van Rij Mixed-effects regression and eye-tracking data University of Tübingen

Gender processing in DutchI The goal of this study is to investigate if Dutch people use grammatical
gender to anticipate upcoming wordsI This study was conducted together with Hanneke Loerts and is published in
the Journal of Psycholinguistic Research (Loerts, Wieling and Schmid, 2012)
I What is grammatical gender?I Gender is a property of a nounI Nouns are divided into classes: masculine, feminine, neuter, ...I E.g., hond (‘dog’) = common, paard (‘horse’) = neuter
I The gender of a noun can be determined from the forms of otherelements syntactically related to it (Matthews, 1997: 36)
3 | Martijn Wieling and Jacolien van Rij Mixed-effects regression and eye-tracking data University of Tübingen

Gender in Dutch
I Gender in Dutch: 70% common, 30% neuterI When a noun is diminutive it is always neuter
I Gender is unpredictable from the root noun and hard to learnI Children overgeneralize until the age of 6 (Van der Velde, 2004)
4 | Martijn Wieling and Jacolien van Rij Mixed-effects regression and eye-tracking data University of Tübingen

Why use eye tracking?I Eye tracking reveals incremental processing of the listener during the
time course of the speech signal
I As people tend to look at what they hear (Cooper, 1974), lexicalcompetition can be tested
5 | Martijn Wieling and Jacolien van Rij Mixed-effects regression and eye-tracking data University of Tübingen

Testing lexical competition using eye trackingI Cohort Model (Marslen-Wilson & Welsh, 1978): Competition between
words is based on word-initial activation
I This can be tested using the visual world paradigm: following eyemovements while participants receive auditory input to click on one ofseveral objects on a screen
6 | Martijn Wieling and Jacolien van Rij Mixed-effects regression and eye-tracking data University of Tübingen

Support for the Cohort ModelI Subjects hear: “Pick up the candy” (Tanenhaus et al., 1995)
I Fixations towards target (Candy) and competitor (Candle): support forthe Cohort Model
7 | Martijn Wieling and Jacolien van Rij Mixed-effects regression and eye-tracking data University of Tübingen

Lexical competition based on syntactic genderI Other models of lexical processing state that lexical competition occurs
based on all acoustic input (e.g., TRACE, Shortlist, NAM)
I Does gender information restrict the possible set of lexical candidates?I I.e. if you hear de, will you focus more on an image of a dog (de hond) than
on an image of a horse (het paard)?I Previous studies (e.g., Dahan et al., 2000 for French) have indicated gender
information restricts the possible set of lexical candidates
I In the following, we will investigate if this also holds for Dutch with itsdifficult gender system using the visual world paradigm
I We analyze the data using mixed-effects regression in R
8 | Martijn Wieling and Jacolien van Rij Mixed-effects regression and eye-tracking data University of Tübingen

Experimental designI 28 Dutch participants heard sentences like:
I Klik op de rode appel (‘click on the red apple’)I Klik op het plaatje met een blauw boek (‘click on the image of a blue book’)
I They were shown 4 nouns varying in color and genderI Eye movements were tracked with a Tobii eye-tracker (E-Prime extensions)
9 | Martijn Wieling and Jacolien van Rij Mixed-effects regression and eye-tracking data University of Tübingen

Experimental design: conditions
I Subjects were shown 96 different screensI 48 screens for indefinite sentences (klik op het plaatje met een rode appel)I 48 screens for definite sentences (klik op de rode appel)
10 | Martijn Wieling and Jacolien van Rij Mixed-effects regression and eye-tracking data University of Tübingen

Visualizing fixation proportions: different color
11 | Martijn Wieling and Jacolien van Rij Mixed-effects regression and eye-tracking data University of Tübingen

Visualizing fixation proportions: same color
12 | Martijn Wieling and Jacolien van Rij Mixed-effects regression and eye-tracking data University of Tübingen

Which dependent variable?I Difficulty 1: choosing the dependent variable
I Fixation difference between Target and CompetitorI Fixation proportion on Target - requires transformation to empirical logit, to
ensure the dependent variable is unbounded: log( (y+0.5)(N−y+0.5) )
I ...
I Difficulty 2: selecting a time spanI Note that about 200 ms. is needed to plan and launch an eye movementI It is possible (and better) to take every individual sampling point into account,
but we will opt for the simpler approach here (in contrast to lecture 4)
I In this lecture we use:I The difference in fixation time between Target and CompetitorI Averaged over the time span starting 200 ms. after the onset of the
determiner and ending 200 ms. after the onset of the noun (about 800 ms.)I This ensures that gender information has been heard and processed, both
for the definite and indefinite sentences
13 | Martijn Wieling and Jacolien van Rij Mixed-effects regression and eye-tracking data University of Tübingen

Independent variablesI Variable of interest
I Competitor gender vs. target gender
I Variables which could be importantI Competitor color vs. target colorI Gender of target (common or neuter)I Definiteness of target
I Participant-related variablesI Gender (male/female), age, education levelI Trial number
I Design control variablesI Competitor position vs. target position (up-down or down-up)I Color of targetI ... (anything else you are not interested in, but potentially problematic)
14 | Martijn Wieling and Jacolien van Rij Mixed-effects regression and eye-tracking data University of Tübingen

Some remarks about data preparationI Check if variables correlate highly
I If so: exclude one variable, or transform variableI See Chapter 6.2.2 of Baayen (2008)
I Check if numerical variables are normally distributedI If not: try to make them normal (e.g., logarithmic or inverse transformation)I Note that your dependent variable does not need to be normally distributed
(the residuals of your model do!)
I Center your numerical predictors when doing mixed-effects regressionI See previous lecture
15 | Martijn Wieling and Jacolien van Rij Mixed-effects regression and eye-tracking data University of Tübingen

Our data> head(eye)
Subject Item TargetDefinite TargetNeuter TargetColor TargetBrown TargetPlace1 S300 appel 1 0 red 0 12 S300 appel 0 0 red 0 23 S300 vat 1 1 brown 1 44 S300 vat 0 1 brown 1 15 S300 boek 1 1 blue 0 46 S300 boek 0 1 blue 0 1TargetTopRight CompColor CompPlace TupCdown CupTdown TrialID Age IsMale
1 0 red 2 0 0 44 52 02 1 brown 4 1 0 2 52 03 0 yellow 2 0 1 14 52 04 0 brown 3 1 0 43 52 05 0 blue 3 0 0 5 52 06 0 yellow 3 1 0 30 52 0Edulevel SameColor SameGender TargetPerc CompPerc FocusDiff
1 1 1 1 40.90909 6.818182 34.0909092 1 0 0 63.63636 0.000000 63.6363643 1 0 0 47.72727 43.181818 4.5454554 1 1 0 27.90698 9.302326 18.6046515 1 1 0 11.11111 25.000000 -13.8888896 1 0 1 23.80952 50.000000 -26.190476
16 | Martijn Wieling and Jacolien van Rij Mixed-effects regression and eye-tracking data University of Tübingen

Our first mixed-effects regression model# A model having only random intercepts for Subject and Item> model = lmer( FocusDiff ~ (1|Subject) + (1|Item) , data=eye )
# Show results of the model> print( model, corr=F )
[...]Random effects:Groups Name Variance Std.Dev.Item (Intercept) 22.968 4.7925Subject (Intercept) 257.111 16.0347Residual 3275.691 57.2336Number of obs: 2280, groups: Item, 48; Subject, 28
Fixed effects:Estimate Std. Error t value
(Intercept) 30.867 3.377 9.14
17 | Martijn Wieling and Jacolien van Rij Mixed-effects regression and eye-tracking data University of Tübingen
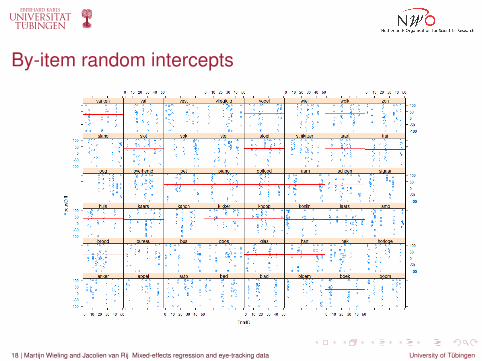
By-item random intercepts
18 | Martijn Wieling and Jacolien van Rij Mixed-effects regression and eye-tracking data University of Tübingen

By-subject random intercepts
19 | Martijn Wieling and Jacolien van Rij Mixed-effects regression and eye-tracking data University of Tübingen

Is a by-item analysis necessary?# comparing two models> model1 = lmer(FocusDiff ~ (1|Subject), data=eye)> model2 = lmer(FocusDiff ~ (1|Subject) + (1|Item), data=eye)> anova( model1 , model2 )
Data: eyeModels:model1: FocusDiff ~ (1 | Subject)model2: FocusDiff ~ (1 | Subject) + (1 | Item)
Df AIC BIC logLik Chisq Chi Df Pr(>Chisq)model1 3 25001 25018 -12497model2 4 25000 25023 -12496 2.0772 1 0.1495
I anova always compares the simplest model (above) to the more complexmodel (below)
I The p-value > 0.05 indicates that there is no support for the by-itemrandom slopes
I This indicates that the different conditions were very well controlled in theresearch design
20 | Martijn Wieling and Jacolien van Rij Mixed-effects regression and eye-tracking data University of Tübingen

Adding a fixed-effect factor# model with fixed effects, but no random-effect factor for Item> eye$cSameColor = eye$SameColor - 0.5 # centering before inclusion> model3 = lmer(FocusDiff ~ cSameColor + (1|Subject), data=eye)> print(model3, corr=F)
Random effects:Groups Name Variance Std.Dev.Subject (Intercept) 211.22 14.534Residual 2778.65 52.713Number of obs: 2280, groups: Subject, 28
Fixed effects:Estimate Std. Error t value
(Intercept) 30.138 3.003 10.04cSameColor -45.858 2.217 -20.69
I cSameColor is highly important as |t | > 2I negative estimate: more difficult to distinguish target from competitor
I We need to test if the effect of cSameColor varies per subjectI If there is much between-subject variation, this will influence the significance
of the variable in the fixed effects
21 | Martijn Wieling and Jacolien van Rij Mixed-effects regression and eye-tracking data University of Tübingen

Testing for a random slope# a model with an uncorrelated random slope for cSameColor per Subject> model4 = lmer(FocusDiff ~ cSameColor + (1|Subject) +
(0+cSameColor|Subject), data=eye)> anova(model3,model4)
model3: FocusDiff ~ cSameColor + (1 | Subject)model4: FocusDiff ~ cSameColor + (1 | Subject) + (0 + cSameColor | Subject)
Df AIC BIC logLik Chisq Chi Df Pr(>Chisq)model3 4 24610 24633 -12301model4 5 24607 24636 -12299 4.8056 1 0.02837 *
# model4 is an improvement, but what about a model with a random slope for# cSameColor per Subject correlated with the random intercept> model5 = lmer(FocusDiff ~ cSameColor + (1+cSameColor|Subject), data=eye)> anova(model4,model5)
Df AIC BIC logLik Chisq Chi Df Pr(>Chisq)model4 5 24607 24636 -12299model5 6 24603 24637 -12295 6.3052 1 0.01204 *
22 | Martijn Wieling and Jacolien van Rij Mixed-effects regression and eye-tracking data University of Tübingen

Investigating the model structure> print(model5, corr=F)
Linear mixed model fit by REMLFormula: FocusDiff ~ cSameColor + (1 + cSameColor | Subject)
Data: eyeAIC BIC logLik deviance REMLdev
24595 24629 -12292 24591 24583Random effects:Groups Name Variance Std.Dev. CorrSubject (Intercept) 196.34 14.012
cSameColor 115.33 10.739 -0.735Residual 2754.06 52.479Number of obs: 2280, groups: Subject, 28
Fixed effects:Estimate Std. Error t value
(Intercept) 29.765 2.914 10.21cSameColor -46.511 3.035 -15.32
I Note SameColor is still highly significant as the |t | > 2 (absolute value)
23 | Martijn Wieling and Jacolien van Rij Mixed-effects regression and eye-tracking data University of Tübingen
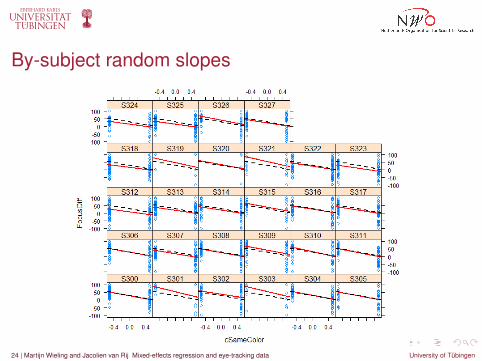
By-subject random slopes
24 | Martijn Wieling and Jacolien van Rij Mixed-effects regression and eye-tracking data University of Tübingen

Correlation of random intercepts and slopesr = −0.735
10 20 30 40 50 60
−65
−60
−55
−50
−45
−40
−35
●
●●
●
●
●
●
●
●
●
●
●
●
●
●
●
●
●
●
●
●
●
●
●
●
●
●
●
S312 S323 S324
S318
S325
S309
S319 S321
S301 S303
Coefficient Intercept
Coe
ffici
ent c
Sam
eCol
or
25 | Martijn Wieling and Jacolien van Rij Mixed-effects regression and eye-tracking data University of Tübingen

Investigating the gender effect> model6 = lmer(FocusDiff ~ cSameColor + SameGender +
(1+cSameColor|Subject), data=eye)> print(model6, corr=F)
Fixed effects:Estimate Std. Error t value
(Intercept) 29.8863 3.1104 9.609cSameColor -46.5077 3.0349 -15.324SameGender -0.2454 2.2008 -0.112
I It seems there is no gender effect...I Perhaps we can take a look at the fixation proportions again (now within
our time span)
26 | Martijn Wieling and Jacolien van Rij Mixed-effects regression and eye-tracking data University of Tübingen

Visualizing fixation proportions: different color
27 | Martijn Wieling and Jacolien van Rij Mixed-effects regression and eye-tracking data University of Tübingen
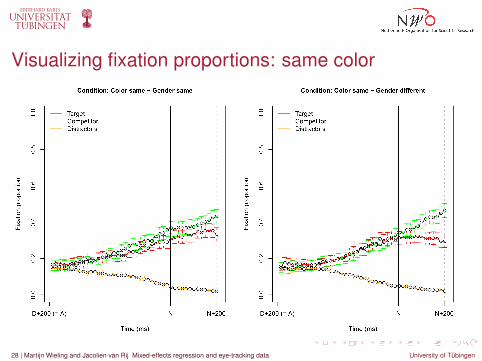
Visualizing fixation proportions: same color
28 | Martijn Wieling and Jacolien van Rij Mixed-effects regression and eye-tracking data University of Tübingen
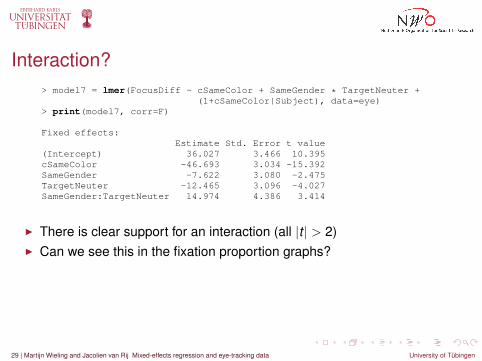
Interaction?> model7 = lmer(FocusDiff ~ cSameColor + SameGender * TargetNeuter +
(1+cSameColor|Subject), data=eye)> print(model7, corr=F)
Fixed effects:Estimate Std. Error t value
(Intercept) 36.027 3.466 10.395cSameColor -46.693 3.034 -15.392SameGender -7.622 3.080 -2.475TargetNeuter -12.465 3.096 -4.027SameGender:TargetNeuter 14.974 4.386 3.414
I There is clear support for an interaction (all |t | > 2)I Can we see this in the fixation proportion graphs?
29 | Martijn Wieling and Jacolien van Rij Mixed-effects regression and eye-tracking data University of Tübingen

Visualizing fixation proportions: target neuter
30 | Martijn Wieling and Jacolien van Rij Mixed-effects regression and eye-tracking data University of Tübingen
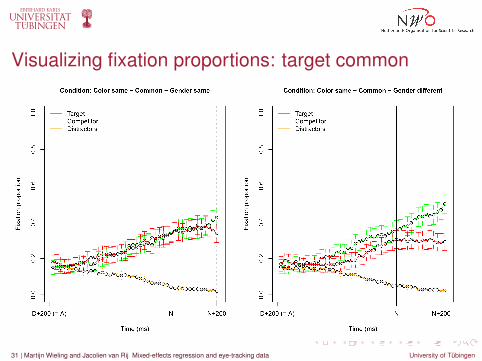
Visualizing fixation proportions: target common
31 | Martijn Wieling and Jacolien van Rij Mixed-effects regression and eye-tracking data University of Tübingen
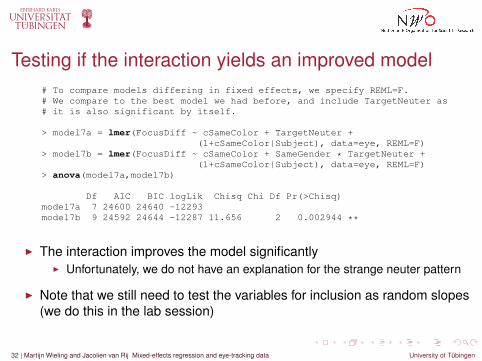
Testing if the interaction yields an improved model# To compare models differing in fixed effects, we specify REML=F.# We compare to the best model we had before, and include TargetNeuter as# it is also significant by itself.
> model7a = lmer(FocusDiff ~ cSameColor + TargetNeuter +(1+cSameColor|Subject), data=eye, REML=F)
> model7b = lmer(FocusDiff ~ cSameColor + SameGender * TargetNeuter +(1+cSameColor|Subject), data=eye, REML=F)
> anova(model7a,model7b)
Df AIC BIC logLik Chisq Chi Df Pr(>Chisq)model7a 7 24600 24640 -12293model7b 9 24592 24644 -12287 11.656 2 0.002944 **
I The interaction improves the model significantlyI Unfortunately, we do not have an explanation for the strange neuter pattern
I Note that we still need to test the variables for inclusion as random slopes(we do this in the lab session)
32 | Martijn Wieling and Jacolien van Rij Mixed-effects regression and eye-tracking data University of Tübingen

How well does the model fit?# "explained variance" of the model (r-squared)> cor( eye$FocusDiff , fitted( model7 ) )^2[1] 0.2347539
> qqnorm( resid( model7 ) )> qqline( resid( model7 ) )
33 | Martijn Wieling and Jacolien van Rij Mixed-effects regression and eye-tracking data University of Tübingen

Adding a factor and a continuous variable# set a reference level for the factor> eye$TargetColor = relevel( eye$TargetColor, "brown" )> model8 = lmer(FocusDiff ~ cSameColor + SameGender * TargetNeuter +
TargetColor + Age +(1+cSameColor|Subject), data=eye)
> print(model8, corr=F)
Fixed effects:Estimate Std. Error t value
(Intercept) 58.3515 17.5968 3.316cSameColor -46.8083 3.0218 -15.490SameGender -7.5730 3.0641 -2.472TargetNeuter -12.4801 3.0794 -4.053TargetColorblue 11.6108 3.5878 3.236TargetColorgreen 15.3901 3.5768 4.303TargetColorred 16.5084 3.5798 4.612TargetColoryellow 16.0423 3.5931 4.465Age -0.7300 0.3592 -2.032SameGender:TargetNeuter 14.8669 4.3637 3.407
34 | Martijn Wieling and Jacolien van Rij Mixed-effects regression and eye-tracking data University of Tübingen

Converting the factor to a contrast> eye$TargetBrown = (eye$TargetColor == "brown")*1> model9 = lmer(FocusDiff ~ cSameColor + SameGender * TargetNeuter +
TargetBrown + Age +(1+cSameColor|Subject), data=eye)
> print(model9, corr=F)Fixed effects:
Estimate Std. Error t value(Intercept) 96.6001 17.5691 5.498cSameColor -46.8328 3.0300 -15.456SameGender -7.5911 3.0635 -2.478TargetNeuter -12.5225 3.0789 -4.067TargetBrown -14.8923 2.9256 -5.090Age -0.7284 0.3588 -2.030SameGender:TargetNeuter 14.8965 4.3626 3.415
# model8b and model9b: REML=F> anova(model8b, model9b)
Df AIC BIC logLik Chisq Chi Df Pr(>Chisq)model9b 11 24566 24629 -12272model8b 14 24570 24650 -12271 2.6164 3 0.4546
35 | Martijn Wieling and Jacolien van Rij Mixed-effects regression and eye-tracking data University of Tübingen

Many more things to do...I We need to see if the significant fixed effects remain significant when
adding these variables as random slopes per subjectI There are other variables we should test (e.g., education level)I There are other interactions we can testI Model criticism
I We will experiment with these issues in the lab session after the break!I We use a subset of the data (only same color)I Simple R-functions are used to generate all plots
36 | Martijn Wieling and Jacolien van Rij Mixed-effects regression and eye-tracking data University of Tübingen

What you should remember...I Mixed-effects regression models offer an easy-to-use approach to obtain
generalizable results even when your design is not completely balanced
I Mixed-effects regression models allow a fine-grained inspection of thevariability of the random effects, which may provide additional insight inyour data
I Mixed-effects regression models are easy in R!
37 | Martijn Wieling and Jacolien van Rij Mixed-effects regression and eye-tracking data University of Tübingen

Thank you for your attention!
38 | Martijn Wieling and Jacolien van Rij Mixed-effects regression and eye-tracking data University of Tübingen