
MITSUI BUSSAN KABUSHIKI KAISHA MITSUI & CO., …...2015/07/16 · included in this annual report....
281
UNITED STATES SECURITIES AND EXCHANGE COMMISSION Washington, D.C. 20549 FORM 20-F ‘ REGISTRATION STATEMENT PURSUANT TO SECTION 12(b) OR (g) OF THE SECURITIES EXCHANGE ACT OF 1934 OR È ANNUAL REPORT PURSUANT TO SECTION 13 OR 15(d) OF THE SECURITIES EXCHANGE ACT OF 1934 For the fiscal year ended March 31, 2008 OR ‘ TRANSITION REPORT PURSUANT TO SECTION 13 OR 15(d) OF THE SECURITIES EXCHANGE ACT OF 1934 For the transition period from to OR ‘ SHELL COMPANY REPORT PURSUANT TO SECTION 13 OR 15(d) OF THE SECURITIES EXCHANGE ACT OF 1934 Date of event requiring this shell company report Commission file number 0-9929 MITSUI BUSSAN KABUSHIKI KAISHA (Exact name of Registrant as specified in its charter) MITSUI & CO., LTD. (Translation of Registrant’s name into English) JAPAN (Jurisdiction of incorporation or organization) 2-1, OHTEMACHI 1-CHOME, CHIYODA-KU, TOKYO 100-0004, JAPAN (Address of principal executive offices) Katsurao Yoshimori, 81-3-3285-7533, [email protected] (Name, Telephone, E-mail Address of Company Contact Person) Securities registered or to be registered pursuant to Section 12(b) of the Act. Title of Each Class Name of Each Exchange On Which Registered Common Stock Nasdaq Stock Market Securities registered or to be registered pursuant to Section 12(g) of the Act. None Securities for which there is a reporting obligation pursuant to Section 15(d) of the Act. None Indicate the number of outstanding shares of each of the issuer’s classes of capital or common stock as of the close of the period covered by the annual report. As of March 31, 2008, 1,816,639,918 shares of common stock were outstanding including 17,626,180 shares represented by an aggregate of 881,309 American Depositary Shares. Indicate by check mark if the registrant is a well-known seasoned issuer, as defined in Rule 405 of the Securities Act. Yes È No ‘ If this report is an annual or transition report, indicate by check mark if the registrant is not required to file reports pursuant to Section 13 or 15(d) of the Securities Exchange Act of 1934. Yes ‘ No È Indicate by check mark whether the registrant (1) has filed all reports required to be filed by Section 13 or 15(d) of the Securities Exchange Act of 1934 during the preceding 12 months (or for such shorter period that the registrant was required to file such reports), and (2) has been subject to such filing requirements for the past 90 days. Yes È No ‘ Indicate by check mark whether the registrant is a large accelerated filer, an accelerated filer, or a non-accelerated filer. See definition of “accelerated filer and large accelerated filer” in Rule 12b-2 of the Exchange Act. (Check one): Large accelerated filer È Accelerated filer ‘ Non-accelerated filer ‘ Indicate by check mark which basis of accounting the registrant has used to prepare the financial statements included in this filing: U.S. GAAP È International Financial Reporting Standards as issued Other ‘ by the International Accounting Standards Board ‘ If “Other” has been checked in response to the previous question, indicate by check mark which financial statement item the registrant has elected to follow. Item 17 ‘ Item 18 ‘ If this is an annual report, indicate by check mark whether the registrant is a shell company (as defined in Rule 12b-2 of the Exchange Act). Yes ‘ No È
Transcript of MITSUI BUSSAN KABUSHIKI KAISHA MITSUI & CO., …...2015/07/16 · included in this annual report....

UNITED STATES SECURITIES AND EXCHANGE COMMISSIONWashington, D.C. 20549
FORM 20-F‘ REGISTRATION STATEMENT PURSUANT TO SECTION 12(b) OR (g) OF THE SECURITIES
EXCHANGE ACT OF 1934OR
È ANNUAL REPORT PURSUANT TO SECTION 13 OR 15(d) OF THE SECURITIES EXCHANGE ACTOF 1934For the fiscal year ended March 31, 2008
OR‘ TRANSITION REPORT PURSUANT TO SECTION 13 OR 15(d) OF THE SECURITIES EXCHANGE
ACT OF 1934For the transition period from to
OR‘ SHELL COMPANY REPORT PURSUANT TO SECTION 13 OR 15(d) OF THE SECURITIES
EXCHANGE ACT OF 1934Date of event requiring this shell company report
Commission file number 0-9929
MITSUI BUSSAN KABUSHIKI KAISHA(Exact name of Registrant as specified in its charter)
MITSUI & CO., LTD.(Translation of Registrant’s name into English)
JAPAN(Jurisdiction of incorporation or organization)
2-1, OHTEMACHI 1-CHOME, CHIYODA-KU, TOKYO 100-0004, JAPAN(Address of principal executive offices)
Katsurao Yoshimori, 81-3-3285-7533, [email protected](Name, Telephone, E-mail Address of Company Contact Person)
Securities registered or to be registered pursuant to Section 12(b) of the Act.Title of Each Class Name of Each Exchange On Which RegisteredCommon Stock Nasdaq Stock Market
Securities registered or to be registered pursuant to Section 12(g) of the Act.None
Securities for which there is a reporting obligation pursuant to Section 15(d) of the Act.None
Indicate the number of outstanding shares of each of the issuer’s classes of capital or common stock as of the close of the period covered bythe annual report.
As of March 31, 2008, 1,816,639,918 shares of common stock were outstanding including17,626,180 shares represented by an aggregate of 881,309 American Depositary Shares.
Indicate by check mark if the registrant is a well-known seasoned issuer, as defined in Rule 405 of the Securities Act.Yes È No ‘
If this report is an annual or transition report, indicate by check mark if the registrant is not required to file reports pursuant to Section 13 or15(d) of the Securities Exchange Act of 1934.
Yes ‘ No ÈIndicate by check mark whether the registrant (1) has filed all reports required to be filed by Section 13 or 15(d) of the Securities Exchange
Act of 1934 during the preceding 12 months (or for such shorter period that the registrant was required to file such reports), and (2) has beensubject to such filing requirements for the past 90 days.
Yes È No ‘Indicate by check mark whether the registrant is a large accelerated filer, an accelerated filer, or a non-accelerated filer. See definition of
“accelerated filer and large accelerated filer” in Rule 12b-2 of the Exchange Act. (Check one):Large accelerated filer È Accelerated filer ‘ Non-accelerated filer ‘
Indicate by check mark which basis of accounting the registrant has used to prepare the financial statements included in this filing:U.S. GAAP È International Financial Reporting Standards as issued Other ‘
by the International Accounting Standards Board ‘If “Other” has been checked in response to the previous question, indicate by check mark which financial statement item the registrant has
elected to follow.Item 17 ‘ Item 18 ‘
If this is an annual report, indicate by check mark whether the registrant is a shell company (as defined in Rule 12b-2 of the Exchange Act).Yes ‘ No È

Certain References and Information
As used in this report, “Mitsui” is used to refer to Mitsui & Co., Ltd. (Mitsui Bussan Kabushiki Kaisha),“we”, “us”, and “our” are used to indicate Mitsui & Co., Ltd. and subsidiaries, unless otherwise indicated.“Share” means one share of Mitsui’s common stock, “ADS” means an American Depositary Share representing20 shares, and “ADR” means an American Depositary Receipt evidencing one or more ADSs. Also, “dollar” or“$” means the lawful currency of the United States of America, and “yen” or “¥” means the lawful currency ofJapan.
All financial statements and information contained in this annual report have been prepared in accordancewith accounting principles generally accepted in the United States, or U.S. GAAP, except where otherwise noted.
A Cautionary Note on Forward-Looking Statements
This annual report includes forward-looking statements based on our current expectations, assumptions,estimates and projections about our business, our industry and capital markets around the world. Generally, theseforward-looking statements can be identified by the use of forward-looking terminology such as “may”,“expect”, “anticipate”, “estimate”, “plan” or similar words. The forward-looking statements in this annual reportare subject to various risks, uncertainties and assumptions. These statements discuss future expectations, identifystrategies, contain projections of results of operations or of our financial position, or state other forward-lookinginformation. Known and unknown risks, uncertainties and other factors could cause our actual operating resultsto differ materially from those contained or implied in any forward-looking statement. Our expectationsexpressed in these forward-looking statements may not turn out to be correct, and our actual results couldmaterially differ from and be worse than our expectations.
Important risks and factors that could cause our actual results to differ materially from our expectations arediscussed in this “Item 3.D. Risk Factors” or elsewhere in this annual report and include, without limitation:
• changes in economic conditions that may lead to unforeseen developments in markets for productshandled by us;
• fluctuations in currency exchange rates that may cause unexpected deterioration in the value oftransactions;
• adverse political developments in the various jurisdictions where we operate, which among things, maycreate delays or postponements of transactions and projects;
• changes in laws, regulations or policies in any of the countries where we conduct our operations; and
• significant changes in the competitive environment.
We do not assume, and specifically disclaim, any obligation to update any forward-looking statementswhich speak only as of the date made.
2

TABLE OF CONTENTS
Page
PART I . . . . . . . . . . . . . . . . . . . . . . . . . . . . . . . . . . . . . . . . . . . . . . . . . . . . . . . . . . . . . . . . . . . . . . . . . . . . . . . 5Item 1. Identity of Directors, Senior Management and Advisers . . . . . . . . . . . . . . . . . . . . . . . . . . . . . . . . . 5Item 2. Offer Statistics and Expected Timetable . . . . . . . . . . . . . . . . . . . . . . . . . . . . . . . . . . . . . . . . . . . . . 5Item 3. Key Information . . . . . . . . . . . . . . . . . . . . . . . . . . . . . . . . . . . . . . . . . . . . . . . . . . . . . . . . . . . . . . . . 5
A. Selected Financial Data . . . . . . . . . . . . . . . . . . . . . . . . . . . . . . . . . . . . . . . . . . . . . . . . . . . . . . . . . . 5B. Capitalization and Indebtedness . . . . . . . . . . . . . . . . . . . . . . . . . . . . . . . . . . . . . . . . . . . . . . . . . . . 7C. Reasons for the Offer and Use of Proceeds . . . . . . . . . . . . . . . . . . . . . . . . . . . . . . . . . . . . . . . . . . . 7D. Risk Factors . . . . . . . . . . . . . . . . . . . . . . . . . . . . . . . . . . . . . . . . . . . . . . . . . . . . . . . . . . . . . . . . . . . 7
Item 4. Information on the Company . . . . . . . . . . . . . . . . . . . . . . . . . . . . . . . . . . . . . . . . . . . . . . . . . . . . . . 13A. History and Development of the Company . . . . . . . . . . . . . . . . . . . . . . . . . . . . . . . . . . . . . . . . . . . 13B. Business Overview . . . . . . . . . . . . . . . . . . . . . . . . . . . . . . . . . . . . . . . . . . . . . . . . . . . . . . . . . . . . . . 20C. Organizational Structure . . . . . . . . . . . . . . . . . . . . . . . . . . . . . . . . . . . . . . . . . . . . . . . . . . . . . . . . . 55D. Property, Plant and Equipment . . . . . . . . . . . . . . . . . . . . . . . . . . . . . . . . . . . . . . . . . . . . . . . . . . . . 60
Item 4A. Unresolved Staff Comments . . . . . . . . . . . . . . . . . . . . . . . . . . . . . . . . . . . . . . . . . . . . . . . . . . . . . 73Item 5. Operating and Financial Review and Prospects . . . . . . . . . . . . . . . . . . . . . . . . . . . . . . . . . . . . . . . . 73
A. Operating Results . . . . . . . . . . . . . . . . . . . . . . . . . . . . . . . . . . . . . . . . . . . . . . . . . . . . . . . . . . . . . . . 73B. Liquidity and Capital Resources . . . . . . . . . . . . . . . . . . . . . . . . . . . . . . . . . . . . . . . . . . . . . . . . . . . 129C. Research & Development . . . . . . . . . . . . . . . . . . . . . . . . . . . . . . . . . . . . . . . . . . . . . . . . . . . . . . . . 142D. Trend Information . . . . . . . . . . . . . . . . . . . . . . . . . . . . . . . . . . . . . . . . . . . . . . . . . . . . . . . . . . . . . . 142E. Off-Balance Sheet Arrangements . . . . . . . . . . . . . . . . . . . . . . . . . . . . . . . . . . . . . . . . . . . . . . . . . . 142F. Tabular Disclosure of Contractual Obligations . . . . . . . . . . . . . . . . . . . . . . . . . . . . . . . . . . . . . . . . 144
Item 6. Directors, Senior Management and Employees . . . . . . . . . . . . . . . . . . . . . . . . . . . . . . . . . . . . . . . . 144A. Directors and Senior Management . . . . . . . . . . . . . . . . . . . . . . . . . . . . . . . . . . . . . . . . . . . . . . . . . 144B. Compensation . . . . . . . . . . . . . . . . . . . . . . . . . . . . . . . . . . . . . . . . . . . . . . . . . . . . . . . . . . . . . . . . . . 154C. Board Practices . . . . . . . . . . . . . . . . . . . . . . . . . . . . . . . . . . . . . . . . . . . . . . . . . . . . . . . . . . . . . . . . 155D. Employees . . . . . . . . . . . . . . . . . . . . . . . . . . . . . . . . . . . . . . . . . . . . . . . . . . . . . . . . . . . . . . . . . . . . 161E. Share Ownership . . . . . . . . . . . . . . . . . . . . . . . . . . . . . . . . . . . . . . . . . . . . . . . . . . . . . . . . . . . . . . . 162
Item 7. Major Shareholders and Related Party Transactions . . . . . . . . . . . . . . . . . . . . . . . . . . . . . . . . . . . . 163A. Major Shareholders . . . . . . . . . . . . . . . . . . . . . . . . . . . . . . . . . . . . . . . . . . . . . . . . . . . . . . . . . . . . . 163B. Related Party Transactions . . . . . . . . . . . . . . . . . . . . . . . . . . . . . . . . . . . . . . . . . . . . . . . . . . . . . . . 165C. Interests of Experts and Counsel . . . . . . . . . . . . . . . . . . . . . . . . . . . . . . . . . . . . . . . . . . . . . . . . . . . 166
Item 8. Financial Information . . . . . . . . . . . . . . . . . . . . . . . . . . . . . . . . . . . . . . . . . . . . . . . . . . . . . . . . . . . . 166A. Consolidated Statements and Other Financial Information . . . . . . . . . . . . . . . . . . . . . . . . . . . . . . . 166B. Significant Changes . . . . . . . . . . . . . . . . . . . . . . . . . . . . . . . . . . . . . . . . . . . . . . . . . . . . . . . . . . . . . 167
Item 9. The Offer and Listing . . . . . . . . . . . . . . . . . . . . . . . . . . . . . . . . . . . . . . . . . . . . . . . . . . . . . . . . . . . . 167A. Offer and Listing Details . . . . . . . . . . . . . . . . . . . . . . . . . . . . . . . . . . . . . . . . . . . . . . . . . . . . . . . . . 167B. Plan of Distribution . . . . . . . . . . . . . . . . . . . . . . . . . . . . . . . . . . . . . . . . . . . . . . . . . . . . . . . . . . . . . 168C. Markets . . . . . . . . . . . . . . . . . . . . . . . . . . . . . . . . . . . . . . . . . . . . . . . . . . . . . . . . . . . . . . . . . . . . . . . 168D. Selling Shareholders . . . . . . . . . . . . . . . . . . . . . . . . . . . . . . . . . . . . . . . . . . . . . . . . . . . . . . . . . . . . 168E. Dilution . . . . . . . . . . . . . . . . . . . . . . . . . . . . . . . . . . . . . . . . . . . . . . . . . . . . . . . . . . . . . . . . . . . . . . . 168F. Expenses of the Issue . . . . . . . . . . . . . . . . . . . . . . . . . . . . . . . . . . . . . . . . . . . . . . . . . . . . . . . . . . . . 168
Item 10. Additional Information . . . . . . . . . . . . . . . . . . . . . . . . . . . . . . . . . . . . . . . . . . . . . . . . . . . . . . . . . . 168A. Share Capital . . . . . . . . . . . . . . . . . . . . . . . . . . . . . . . . . . . . . . . . . . . . . . . . . . . . . . . . . . . . . . . . . . 168B. Memorandum and Articles of Association . . . . . . . . . . . . . . . . . . . . . . . . . . . . . . . . . . . . . . . . . . . 168C. Material Contracts . . . . . . . . . . . . . . . . . . . . . . . . . . . . . . . . . . . . . . . . . . . . . . . . . . . . . . . . . . . . . . 178D. Exchange Controls . . . . . . . . . . . . . . . . . . . . . . . . . . . . . . . . . . . . . . . . . . . . . . . . . . . . . . . . . . . . . . 178E. Taxation . . . . . . . . . . . . . . . . . . . . . . . . . . . . . . . . . . . . . . . . . . . . . . . . . . . . . . . . . . . . . . . . . . . . . . 179F. Dividends and Paying Agents . . . . . . . . . . . . . . . . . . . . . . . . . . . . . . . . . . . . . . . . . . . . . . . . . . . . . 182G. Statement by Experts . . . . . . . . . . . . . . . . . . . . . . . . . . . . . . . . . . . . . . . . . . . . . . . . . . . . . . . . . . . . 182
3

Page
H. Documents on Display . . . . . . . . . . . . . . . . . . . . . . . . . . . . . . . . . . . . . . . . . . . . . . . . . . . . . . . . . . . 182I. Subsidiary Information . . . . . . . . . . . . . . . . . . . . . . . . . . . . . . . . . . . . . . . . . . . . . . . . . . . . . . . . . . . 182
Item 11. Quantitative and Qualitative Disclosures about Market Risk . . . . . . . . . . . . . . . . . . . . . . . . . . . . 183Item 12. Description of Securities Other than Equity Securities . . . . . . . . . . . . . . . . . . . . . . . . . . . . . . . . . 186
PART II . . . . . . . . . . . . . . . . . . . . . . . . . . . . . . . . . . . . . . . . . . . . . . . . . . . . . . . . . . . . . . . . . . . . . . . . . . . . . . 187Item 13. Defaults, Dividend Arrearages and Delinquencies . . . . . . . . . . . . . . . . . . . . . . . . . . . . . . . . . . . . 187Item 14. Material Modifications to the Rights of Security Holders and Use of Proceeds . . . . . . . . . . . . . . 187Item 15. Controls and Procedures . . . . . . . . . . . . . . . . . . . . . . . . . . . . . . . . . . . . . . . . . . . . . . . . . . . . . . . . . 187Item 16A. Audit Committee Financial Expert . . . . . . . . . . . . . . . . . . . . . . . . . . . . . . . . . . . . . . . . . . . . . . . 188Item 16B. Code of Ethics . . . . . . . . . . . . . . . . . . . . . . . . . . . . . . . . . . . . . . . . . . . . . . . . . . . . . . . . . . . . . . . 188Item 16C. Principal Accountant Fees and Services . . . . . . . . . . . . . . . . . . . . . . . . . . . . . . . . . . . . . . . . . . . 189Item 16D. Exemptions from the Listing Standards for Audit Committees . . . . . . . . . . . . . . . . . . . . . . . . . 190Item 16E. Purchases of Equity Securities by the Issuer and Affiliated Purchasers . . . . . . . . . . . . . . . . . . . 191
PART III . . . . . . . . . . . . . . . . . . . . . . . . . . . . . . . . . . . . . . . . . . . . . . . . . . . . . . . . . . . . . . . . . . . . . . . . . . . . . . 192Item 17. Financial Statements . . . . . . . . . . . . . . . . . . . . . . . . . . . . . . . . . . . . . . . . . . . . . . . . . . . . . . . . . . . 192Item 18. Financial Statements . . . . . . . . . . . . . . . . . . . . . . . . . . . . . . . . . . . . . . . . . . . . . . . . . . . . . . . . . . . 192Item 19. Exhibits . . . . . . . . . . . . . . . . . . . . . . . . . . . . . . . . . . . . . . . . . . . . . . . . . . . . . . . . . . . . . . . . . . . . . . 192
4

PART I
Item 1. Identity of Directors, Senior Management and Advisers.
Not applicable.
Item 2. Offer Statistics and Expected Timetable.
Not applicable.
Item 3. Key Information.
A. Selected Financial Data.
The selected consolidated income statement data and the selected consolidated cash flow statement data forthe years ended March 31, 2008, 2007 and 2006 and the selected consolidated balance sheet data as of March 31,2008 and 2007 below are derived from our audited consolidated financial statements prepared in accordance withU.S. GAAP, which are included elsewhere in this annual report. The selected consolidated income statement dataand the selected consolidated cash flow statement data for the years ended March 31, 2005 and 2004 and theselected consolidated balance sheet data as of March 31, 2006, 2005 and 2004 are derived from our previouslypublished audited consolidated financial statements prepared in accordance with U.S. GAAP, which are notincluded in this annual report. The consolidated financial statements as of March 31, 2008 and 2007 and for theyears ended March 31, 2008, 2007 and 2006 have been audited by Deloitte Touche Tohmatsu, independentregistered public accounting firm, whose report is filed as part of this annual report.
The selected financial data have been prepared in accordance with U.S. GAAP and should be read inconjunction with, and are qualified in their entirety by reference to “Item 5. Operating and Financial Review andProspects,” and our consolidated financial statements and notes thereto included elsewhere in this annual report.
In Billions of Yen, Except Amounts per Share and Common Stock Data
As of or for the Years Ended March 31,
2008 2007 2006 2005 2004
Consolidated Income Statement Data:Results of Operations:
Revenues(1) . . . . . . . . . . . . . . . . . . . . . . . . ¥ 5,739 ¥ 4,794 ¥ 4,028 ¥3,421 ¥2,915Gross Profit(1) . . . . . . . . . . . . . . . . . . . . . . 988 866 785 680 595Equity in Earnings of Associated
Companies(1) . . . . . . . . . . . . . . . . . . . . . 154 153 94 64 40Income from Continuing Operations(1) . . 339 299 215 114 80Net Income . . . . . . . . . . . . . . . . . . . . . . . . 410 302 202 121 68Income from Continuing Operations per
Share(1):Basic . . . . . . . . . . . . . . . . . . . . . . . . . 187.87 172.88 134.16 72.34 50.70Diluted . . . . . . . . . . . . . . . . . . . . . . . 185.91 164.02 126.26 68.18 47.88
Net Income per Share:Basic . . . . . . . . . . . . . . . . . . . . . . . . . 227.20 174.26 126.26 76.55 43.25Diluted . . . . . . . . . . . . . . . . . . . . . . . 224.82 165.32 118.85 72.12 40.89
Cash Dividends Declared per Share . . . . . . . . . 40 31 20 9 8Cash Dividends Declared per Share in
U.S. Dollars(2) . . . . . . . . . . . . . . . . . . . . . . . . $ 0.35 $ 0.27 $ 0.17 $ 0.09 $ 0.07
5
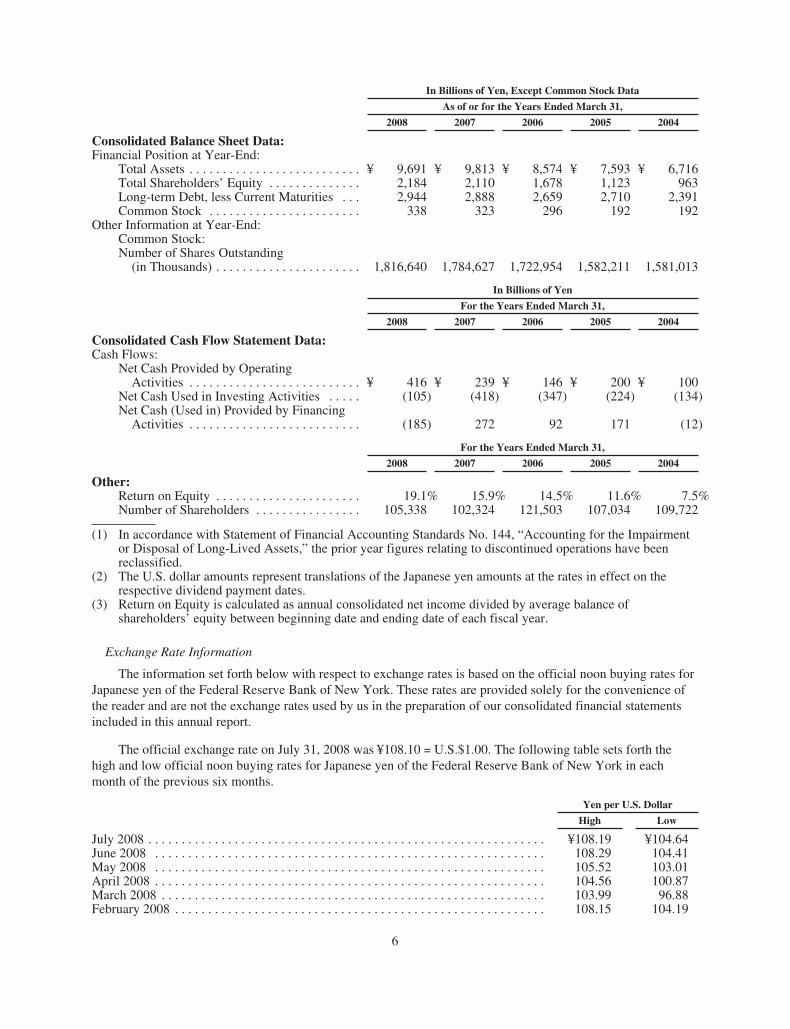
In Billions of Yen, Except Common Stock Data
As of or for the Years Ended March 31,
2008 2007 2006 2005 2004
Consolidated Balance Sheet Data:Financial Position at Year-End:
Total Assets . . . . . . . . . . . . . . . . . . . . . . . . . . ¥ 9,691 ¥ 9,813 ¥ 8,574 ¥ 7,593 ¥ 6,716Total Shareholders’ Equity . . . . . . . . . . . . . . 2,184 2,110 1,678 1,123 963Long-term Debt, less Current Maturities . . . 2,944 2,888 2,659 2,710 2,391Common Stock . . . . . . . . . . . . . . . . . . . . . . . 338 323 296 192 192
Other Information at Year-End:Common Stock:Number of Shares Outstanding
(in Thousands) . . . . . . . . . . . . . . . . . . . . . . 1,816,640 1,784,627 1,722,954 1,582,211 1,581,013
In Billions of Yen
For the Years Ended March 31,
2008 2007 2006 2005 2004
Consolidated Cash Flow Statement Data:Cash Flows:
Net Cash Provided by OperatingActivities . . . . . . . . . . . . . . . . . . . . . . . . . . ¥ 416 ¥ 239 ¥ 146 ¥ 200 ¥ 100
Net Cash Used in Investing Activities . . . . . (105) (418) (347) (224) (134)Net Cash (Used in) Provided by Financing
Activities . . . . . . . . . . . . . . . . . . . . . . . . . . (185) 272 92 171 (12)
For the Years Ended March 31,
2008 2007 2006 2005 2004
Other:Return on Equity . . . . . . . . . . . . . . . . . . . . . . 19.1% 15.9% 14.5% 11.6% 7.5%Number of Shareholders . . . . . . . . . . . . . . . . 105,338 102,324 121,503 107,034 109,722
(1) In accordance with Statement of Financial Accounting Standards No. 144, “Accounting for the Impairmentor Disposal of Long-Lived Assets,” the prior year figures relating to discontinued operations have beenreclassified.
(2) The U.S. dollar amounts represent translations of the Japanese yen amounts at the rates in effect on therespective dividend payment dates.
(3) Return on Equity is calculated as annual consolidated net income divided by average balance ofshareholders’ equity between beginning date and ending date of each fiscal year.
Exchange Rate Information
The information set forth below with respect to exchange rates is based on the official noon buying rates forJapanese yen of the Federal Reserve Bank of New York. These rates are provided solely for the convenience ofthe reader and are not the exchange rates used by us in the preparation of our consolidated financial statementsincluded in this annual report.
The official exchange rate on July 31, 2008 was ¥108.10 = U.S.$1.00. The following table sets forth thehigh and low official noon buying rates for Japanese yen of the Federal Reserve Bank of New York in eachmonth of the previous six months.
Yen per U.S. Dollar
High Low
July 2008 . . . . . . . . . . . . . . . . . . . . . . . . . . . . . . . . . . . . . . . . . . . . . . . . . . . . . . . . . . . . ¥108.19 ¥104.64June 2008 . . . . . . . . . . . . . . . . . . . . . . . . . . . . . . . . . . . . . . . . . . . . . . . . . . . . . . . . . . . 108.29 104.41May 2008 . . . . . . . . . . . . . . . . . . . . . . . . . . . . . . . . . . . . . . . . . . . . . . . . . . . . . . . . . . . 105.52 103.01April 2008 . . . . . . . . . . . . . . . . . . . . . . . . . . . . . . . . . . . . . . . . . . . . . . . . . . . . . . . . . . . 104.56 100.87March 2008 . . . . . . . . . . . . . . . . . . . . . . . . . . . . . . . . . . . . . . . . . . . . . . . . . . . . . . . . . . 103.99 96.88February 2008 . . . . . . . . . . . . . . . . . . . . . . . . . . . . . . . . . . . . . . . . . . . . . . . . . . . . . . . . 108.15 104.19
6

The following table sets forth the average exchange rate for each of the last five fiscal years. We havecalculated these average rates by using the rate on the official noon buying rates for Japanese yen of the FederalReserve Bank of New York on the last business day of each month during the relevant fiscal year.
Yen per U.S. Dollar
Year Ended March 31, Average Rate
2008 . . . . . . . . . . . . . . . . . . . . . . . . . . . . . . . . . . . . . . . . . . . . . . . . . . . . . . . . . . . . . . . . . . . . . . . ¥113.612007 . . . . . . . . . . . . . . . . . . . . . . . . . . . . . . . . . . . . . . . . . . . . . . . . . . . . . . . . . . . . . . . . . . . . . . . 116.552006 . . . . . . . . . . . . . . . . . . . . . . . . . . . . . . . . . . . . . . . . . . . . . . . . . . . . . . . . . . . . . . . . . . . . . . . 113.672005 . . . . . . . . . . . . . . . . . . . . . . . . . . . . . . . . . . . . . . . . . . . . . . . . . . . . . . . . . . . . . . . . . . . . . . . 107.282004 . . . . . . . . . . . . . . . . . . . . . . . . . . . . . . . . . . . . . . . . . . . . . . . . . . . . . . . . . . . . . . . . . . . . . . . 112.75
Fluctuations in the exchange rate between the yen and the U.S. dollar will affect the U.S. dollar equivalentof the yen-denominated prices of Mitsui’s shares and, as a result, will affect the market prices of Mitsui’s ADSsin the United States.
B. Capitalization and Indebtedness.
Not required.
C. Reasons for the Offer and Use of Proceeds.
Not applicable.
D. Risk Factors.
You should carefully consider the risks and uncertainties described below and the other information in thisannual report, including the discussion in “Item 5. Operating and Financial Review and Prospects,” as well asour consolidated financial statements and related notes included elsewhere in this annual report.
The decrease in the volume of trade and the flow of goods and materials resulting from the worldwideeconomic downturn may adversely impact our business, results of operations and financial condition.
Our global business activities are affected by economic conditions both globally and regionally. Amongother locations, we are particularly vulnerable to downward economic trends in Japan, China and the UnitedStates. An economic downturn may cause a reduction in the flow of goods and materials, a decline in privateconsumption and fixed investment, and subsequently a decrease in demand from our customers for our productsand services, which may have an adverse impact on our business, results of operations and financial condition.
Fluctuations in commodity prices, especially crude oil, iron ore, coal and copper may adversely affect ourresults of operations and financial condition.
We are engaged in trades in and, as the case may be, production of a variety of commodities in the globalcommodities market including metal, energy, chemical and agricultural products. Among others, significance ofoperating results from our mineral resources and energy producing activities in our overall operating results hasconsiderably intensified, reflecting the rising prices of such commodities as well as increased production in theseoperations. Unexpected movements in commodity prices may adversely affect our business, operating results andfinancial condition.
For further information about the impact by commodity price fluctuations on our business and results ofoperations for the year ended March 31, 2008 and in the future, see “Item 5.A. Operating Results.”
7

Exchange rate fluctuations may adversely affect our operating results, especially because a major part ofour operating results are generated at our overseas subsidiaries and associated companies.
Although our reporting currency is the Japanese yen, a significant portion of our business operations,consolidated revenues and operating expenses is denominated in currencies other than the Japanese yen. As aresult, appreciation or depreciation in the value of other currencies as compared to the Japanese yen could resultin material transactional gains or losses. As most of revenues, costs of revenues, and selling, general andadministrative expenses incurred from regular business activities at overseas subsidiaries and associatedcompanies are quoted in the U.S. dollar, the Australian dollar, the Brazilian Real, or other currencies, our netincome may be affected by the fluctuations of these currencies and we are exposed to translation risk in ourassets and liabilities denominated in foreign currencies. In addition, exchange rate fluctuations may reduce thevalue of investment in overseas subsidiaries and associated companies and adversely affect our accumulatedother comprehensive income. As a result, exchange rate fluctuations may negatively affect our operating results.
See “Item 3.A. Selected Financial Data—Exchange Rate Information”, “Item 5.A. Operating Results—Impact of Foreign Currency Exchange Fluctuation on Operating Results” and “Item 5. B. Liquidity and CapitalResources.”
We are subject to diverse counterparty credit risks which our management policy for credit exposure cannoteliminate entirely.
We are exposed to diverse counterparty credit risks reflecting a variety of businesses. For example:
• Many of our customers purchase products and services from us on credit. At March 31, 2008, currenttrade receivable (less unearned interest and allowance for doubtful receivables—current) was ¥2,755.6billion, representing 28.4% of our total assets and recognized losses for doubtful receivables—currentfor the year ended March 31, 2008 and balance of the allowance for doubtful receivables—current were¥4.0 billion and ¥23.3 billion, respectively;
• We engage in significant project financing activities as a lender or guarantor whereby we assumerepayment risk; and
• We have counterparty payment risk from various derivative transactions we enter into as part of ourhedging activities.
Diverse types of credit losses may adversely affect our operating results and business.
Changes in interest rates could have an adverse effect on our operating results because of our significantshort-term and long-term debt.
We are exposed to risks associated with interest rate fluctuations, which may affect our overall operationalcosts and the value of our financial assets and liabilities, particularly our significant debt obligations, including¥464.5 billion short-term debt and ¥3,221.0 billion long-term debt as of March 31, 2008. An increase in interestrates, especially in Japan and the United States, may adversely affect our results of operations.
See “Item 5.B. Liquidity and Capital Resources—Funding Sources.”
If the value of assets for which we act as lessor, such as real property, rolling stock, ocean transport vessels,aircraft and equipment declines, we may record a significant impairment loss.
Assets for which we act as lessor, such as real property, aircraft, ocean transport vessels, rolling stock andequipment, are exposed to potential significant impairment losses due to the decline in the value of these assets.
As of March 31, 2008, the value of these assets in which we act as lessor, presented on our ConsolidatedBalance Sheets as “Property leased to others—at cost, less accumulated depreciation,” was ¥184.4 billion. The
8

carrying amounts of these assets in which we act as lessor are affected by certain factors which are beyond ourcontrol such as their global supply and demand, prevailing interest rates, prices of relevant products and servicesand regional and/or global cyclical trends. Any adjustments for impairment losses with respect to such assetsmay have an adverse effect on our financial condition and results of operations.
For information on our accounting policies and estimates with respect to impairment on long-lived assets,see “Critical Accounting Policies and Estimates” of “Item 5.A. Operating Results.”
Declines in the market value of equity and/or debt securities in Japan may decrease the value of ourpension assets which in turn may increase the cost of satisfying our unfunded pension obligations.
Declines in the market value of Japanese government bonds, other debt securities and marketable equitysecurities in Japan would reduce the value of our pension plan assets. Decline in the value of our pension planassets or increase in our unfunded pension obligations could adversely affect our results of operations andfinancial condition.
See “Item 5.A. Operating Results” and Note 14, “PENSION COSTS AND SEVERANCE INDEMNITIES,”to our consolidated financial statements.
Our liquidity could be adversely affected by a downgrade in our credit ratings, significant changes in thelending or investment policies of our creditors or investors.
A downgrade in our credit ratings or a significant change in the lending or investment policies of ourcreditors or investors could result in an increase in our interest expense and could adversely impact our ability toaccess the debt markets, and could have an adverse effect on our financial position and liquidity.
For information on our funding sources and credit ratings, see “Item 5.B. Liquidity and Capital Resources.”
Due to our significant investments in marketable equity securities of Japanese issuers, a substantial declinein the Japanese stock market, as experienced in the past, could negatively affect our investment portfolio.
A significant portion of our investment portfolio consists of marketable equity securities of Japanese issuers.At March 31, 2008, our marketable equity securities were carried at a fair value of ¥652.0 billion. Among others,Mitsui’s marketable equity securities of Japanese issuers amounted to ¥383.1 billion, representing 53.9% of thefair value of our total available-for-sale securities and 4.0% of our total assets. Volatility and decline in theJapanese equity securities market could negatively impact the value of our investment portfolio and our results ofoperations and financial condition.
For information on our accounting policies and estimates with respect to impairment on marketablesecurities, see “Critical Accounting Policies and Estimates” of “Item 5.A. Operating Results.”
Some of our operations are concentrated in a limited number of regions or countries, which could harm ourbusiness and results of operations if activity levels in these regions or countries decline.
Various types of businesses worldwide sometimes expose us to risks associated with regional political andeconomic instabilities. Furthermore, some of our business activities may be exposed to concentration risk inparticular industries located in specific regions or countries. For example:
• In Russia and Brazil, we have significant size of interests in the exploration, development andproduction of mineral resources and energy.
• In Indonesia, we actively participate in infrastructure projects, including the operation of power plants,and maintain a nationwide motorcycle retail finance business.
9

As a result, declining levels of trading activities or asset volumes in specific sectors in certain regions orcountries could have a disproportionately negative effect on our business, financial condition and results ofoperations.
For more information, see “Energy Segment”, “Mineral & Metal Resources Segment” and “Machinery &Infrastructure Projects Segment” of “Item 4.B. Business Overview.”
We may not be able to successfully restructure or eliminate unprofitable or underperforming subsidiaries orassociated companies in a timely manner and any efforts to do so may not lead to improved results ofoperations.
As of March 31, 2008, we had 356 consolidated subsidiaries and 202 associated companies. We have beencontinuously restructuring underperforming businesses of our consolidated subsidiaries and associatedcompanies from the viewpoint of operational efficiency as well as profitability. If we fail to successfullyeliminate or restructure our underperforming subsidiaries and associated companies in a timely manner or ifthese efforts fail to improve our business operations as contemplated, our business operations may become lessefficient and our results of operations may be adversely affected.
Our alliances by forming joint ventures with, and strategic investments in, third parties may not result insuccessful operations.
We participate in various businesses directly or indirectly through joint ventures or by making strategicinvestments in other companies and business enterprises. The outcome of these joint ventures and strategicinvestments is unpredictable because:
• operational success is critically dependent on factors that are beyond our control such as the financialcondition and performance of the partner companies or the strategic investees; or
• with respect to certain associated companies, we may fail to exercise adequate control over themanagement, operations and assets of the companies in which we invested or may fail to make majordecisions without the consent of other shareholders or participants due to lack of common businessgoals and strategic objectives with our alliance partners.
Any occurrence of these events could have a material adverse effect on our business, results of operations orfinancial condition.
Our businesses in exploration, development and production of mineral resources and oil and gas may notdevelop in line with assumed costs and schedules, and are subject to the risks associated with estimatingreserves and the operating performance of third party operators.
Reflecting rising prices of mineral resources and oil and gas in recent years, exploration, development andproduction of mineral resources and oil and gas are gaining in importance to our operating results. Mining and oiland gas projects involve risks, for example:
• development of projects may face schedule delays or cost overruns due to difficulties in technicalconditions, procurement of materials, financial conditions and government regulations;
• reserves are estimated based on available geological, technical, contractual and economic information,therefore actual development and production may significantly differ from originally estimated reserves;and
• reserve replacement, on which future production will depend, may not be successfully implemented dueto uncertainties such as failures in exploration or negotiations for acquisitions of known reserves withtheir owners.
We participate as a non-operator in many of these projects. Under these circumstances, we carefullyconsider the business potential and profitability of projects based on the information and data provided by
10

operators, who substantially control operations of such projects, including decision-making in the course ofdevelopment and production. In addition to the above-mentioned risks, operators’ failure in managing thoseprojects may adversely affect our operating results and financial condition.
For more information, see “Mineral & Metal Resources Segment” and “Energy Segment” of “Item 4.B.Business Overview.”
Intense competition from other Japanese general trading companies could have an adverse effect on ourresults of operations.
Our primary competition is with other Japanese general trading companies which engage in similar businessactivities in various fields. Our competitors may have:
• stronger business associations and relationships with our customers, suppliers and business partners inboth domestic and global markets; or
• stronger global network and regional expertise, diversified global customer bases, greater financialengineering skills and market insights.
Unless we can successfully continue to meet the changing needs of our customers by providing them withinnovative and integrated services in a cost effective manner, we may lose our market share or relationships withour existing customers in certain of our operating segments. Failure to successfully compete with our competitorsmay have an adverse effect on our business, financial condition and results of operations.
We may lose opportunities for entry into new business areas because of the limitation of required humanresources.
In response to the maturation of consumption in Japan and other developed countries, we have beenfocusing on entering new consumer oriented businesses. Additionally, we are undertaking a reorganization of ourtraditional businesses in industrial products and raw materials to better reflect the globalization of the economyand the rapid progress of information technology. However, in certain new business areas which we regard asimportant, we may have a shortage of required human resources for carrying out our business plans andmanaging other personnel, which can cause a loss of opportunities to start new businesses, which in turn mayadversely affect our future business.
Restrictions under environmental laws and regulations and any accidents relating to our use of hazardousmaterials could negatively affect our business, results of operations and financial condition.
We are involved in various projects and business transactions worldwide that are subject to extensiveenvironmental laws and regulations. In particular, our Mineral & Metal Resources Segment and Energy Segmentmay be adversely affected by present or future environmental regulations or enforcement in connection with ourexploration, development and production activities. For example, we are subject to complex sets ofenvironmental regulations in Australia, Brazil, Russia, and the Middle East. These laws and regulations may:
• require us to perform site clean-ups;
• require us to curtail or cease certain operations;
• impose fines and payments for significant environmental damage;
• require us to install costly pollution control equipment; and
• require us to modify our operations.
Newly enacted environmental laws and regulations or changes therein and protests by environmental groupsmay materially impact the progress of these projects.
11

Mitsui and its United States subsidiary, Mitsui & Co. (U.S.A.), Inc. are shareholders of Coronet IndustriesInc. (“Coronet”), a former manufacturer of animal feed supplements, each with 18% and 12% share interestrespectively. Coronet has been working with the U.S. Environmental Protection Agency (“EPA”) and the State ofFlorida on an investigation on environmental conditions related to its prior operations at its facility in the state ofFlorida. In addition, Coronet has been named as defendant in two civil actions initiated by residents residing inareas adjacent to the facility. Mitsui and Mitsui & Co. (U.S.A.), Inc., together with prior owners of Coronet’sassets, have been named as defendants in one of these actions.
We are subject to extensive laws and regulations in Japan and other countries throughout the world.Changes in these laws and regulations could adversely affect our results of operations.
Our business operations are subject to extensive laws and regulations in Japan and other countriesthroughout the world. Our operations are subject to laws and regulations governing, among other things, taxation,business and investment approvals, import and export (including restrictions from the viewpoint of national andinternational-security), antitrust, consumer and commercial restrictions, currency exchange control, andenvironmental protection. Moreover, many of our infrastructure projects in developing countries are subject toless developed legal systems. As a result, our costs may increase due to factors such as the lack of acomprehensive set of laws and regulations, an unpredictable judicial system based on inconsistent applicationand interpretation of laws and regulations, and changing practices of regulatory and administrative bodies. Forexample, we are subject to sudden and unpredictable changes to:
• tariffs for products and services that we provide;
• technical specifications with respect to environmental regulations;
• income tax and duty rates; and
• foreign exchange controls with respect to repatriation of investments and dividends.
Furthermore, while we are involved in the exploration, development and production activities throughvarious contractual arrangements, the contracts may not be upheld or extended when they expire. Moreover, theregulatory bodies of these areas may unilaterally interfere and alter the contractual terms of our oil and gasoperations involving production rates, pricing formulas, royalties, environmental protection cost, land tenure orotherwise. If these regulatory bodies unilaterally alter such contractual terms or if we are unable to comply withany new laws and regulations, our business, operating results and financial condition could be adversely affected.Furthermore, we could incur substantial additional costs to comply with any new laws and regulations.
See “Item 4.B. Business Overview—Government Regulations.”
Employee misconduct could adversely affect our results of operations and reputation.
Due to our size, as well as the operational and geographic breadth of our activities, our day-to-dayoperations are necessarily de-centralized. As a result, we cannot fully ensure that our employees comply with allapplicable laws and regulations as well as our internal policies. For example, our employees may engage inunauthorized trading activities and exceed the allotted market risk exposure for various commodities or extend anunauthorized amount of credit to a client, which, in either case, may result in unknown losses or unmanageablerisks. Moreover, our employees could engage in various unauthorized activities prohibited under the laws ofJapan or other jurisdictions to which we are subject, including export regulations, anticorruption laws, antitrustlaws and tax regulations. The efforts we undertake to ensure employees’ compliance with applicable laws andregulations as well as our internal policies may not succeed in preventing misconduct by our employees.Depending on its nature, employees’ misconduct could have negative effects on our results of operations andreputation.
12

Failure to maintain adequate internal controls over financial reporting could negatively affect ourreputation.
The adequate maintenance of our internal controls over financial reporting requires effective monitoring ofour business activities in a variety of products and services worldwide. We may fail to prevent the occurrence ofmaterial weaknesses in our internal controls over financial reporting, or due to any unanticipated issues, may beunable to assert that our internal control over financial reporting is effective, which could adversely affect thecapital market’s perception of us and may cause negative market reactions.
Because of daily price range limitations under Japanese stock exchange rules, you may not be able to sellyour shares of our common stock at a particular price on any particular trading day, or at all.
Stock prices on Japanese stock exchanges are determined on a real-time basis by the equilibrium betweenbids and offers. These exchanges are order-driven markets without specialists or market makers to guide priceformation. To prevent excessive volatility, these exchanges set daily upward and downward price rangelimitations for each stock, based on the previous day’s closing price. Although transactions may continue at theupward or downward limit price if the limit price is reached on a particular trading day, no transactions may takeplace outside these limits on these exchanges. Consequently, an investor wishing to sell at a price above or belowthe relevant daily limit on these exchanges may not be able to effect a sale at such price on a particular tradingday, or at all.
See “Item 10.B. Memorandum and Articles of Association—Daily Price Fluctuation Limits under JapaneseStock Exchange Rules.”
As holders of ADSs, you will have fewer rights than a direct shareholder and you will have to act throughthe depositary to exercise those rights.
The rights of shareholders under Japanese law to take actions, including exercising voting rights, receivingdividends and distributions, bringing derivative actions, examining our accounting books and records andexercising appraisal rights are available only to holders recorded on our register of shareholders. Because thedepositary, through its custodian agents, is the recorded holder of the shares underlying the ADSs, only thedepositary can exercise those rights in connection with the deposited shares. The depositary will make efforts tovote the shares underlying your ADSs as instructed by you and will pay to you the dividends and distributionscollected from us. However, as ADS holders, you will not be able to bring a derivative action, examine ouraccounting books and records or exercise appraisal rights except through and with the consent of the depositary.
Item 4. Information on the Company.
A. History and Development of the Company.
History
Mitsui Bussan Kabushiki Kaisha (“Mitsui & Co., Ltd.” in English) was incorporated on July 25, 1947, asDaiichi Bussan Kabushiki Kaisha, a corporation (Kabushiki Kaisha) under the Commercial Code of Japan withcommon stock of ¥195,000. We were originally listed on the Tokyo Stock Exchange in May 1949.
Our registered office is located at 2-1, Ohtemachi 1-chome, Chiyoda-ku, Tokyo 100-0004, Japan. Mitsui’stelephone number is +81-3-3285-1111.
Since our establishment, our business lines have involved trading in a variety of commodities, including theimport of raw materials and the export of industrial products. As we grew in tandem with the Japanese postwareconomic recovery, we expanded into overseas activities, such as the establishment of Mitsui & Co. (Australia)Ltd. in 1956. During the 1950s, Daiichi Bussan Kabushiki Kaisha was formed through the merger of varioustrading companies. On February 16, 1959, that entity took our present name, after having attained the status of
13

being one of the largest general trading companies, and a history closely connected to the development of foreigntrade in postwar Japan. An example of a business activity which introduced innovative industrial systems toJapan in our early days was the establishment of Nippon Remington Univac Kaisha Ltd. (currently Nihon UnisysLtd.), a domestic computer related joint venture with Sperry Rand Corporation of the United States, in 1958.
During the 1960s, the Japanese government promoted trade with foreign countries and deregulated Japanesecapital markets, which led to high growth of the Japanese economy. We played a pivotal role in promoting thegrowth of certain basic industries by supplying foods, industrial raw material and energy such as oil and coalfrom abroad. This included the development of mineral resources overseas, nurturing markets for Japaneseexports and introducing various new technologies. We established Mitsui & Co. (U.S.A.), Inc. in April 1966, andMitsui Knowledge Industry Co., Ltd. in October 1967. In May 1963, we issued American Depositary Shareswhich were subsequently listed on The NASDAQ National Market in February 1971.
In the 1970s, as the world economy weathered two oil crises, we began to diversify the supply source ofnatural resources including development of liquefied natural gas (“LNG”) resources. During this time, the exportof industrial plant from Japan, mainly to oil producing countries, drastically increased and we organized andsupported projects by arranging finance and on occasion establishing markets for products.
During this period, we suffered losses with respect to a joint venture project we entered into in connectionwith Iranian petrochemicals. These losses were a result of the petrochemical manufacturing complex beingdamaged by military attacks, causing the project to finally be dissolved in 1991.
Also during the 1970s, we entered into new industries. For example, in 1971 we established MitsuiLeasing & Development, our associated company in the leasing industry, and in 1972 we purchased an equityinterest in Mikuni Coca-Cola Bottling Co., Ltd. in the beverage industry.
In the 1980s, Japan’s industrial structure moved increasingly towards the production of high-value-addedproducts such as products related to information technology (“IT”) and new materials used for high techproducts. Consequently, we began extending our business field to target these new markets. Most notable werethe semiconductor materials and carbon fiber fields promoted mainly by our chemical related divisions.
In the late 1990s, the Asian economies experienced a financial crisis. Although the appreciation in realestate and stocks prior to the crisis created a temporary economic boom in Japan, their eventual collapse resultedin a wide-ranging economic slowdown. These conditions necessitated the reorganization of our profit structuresand the development of new businesses.
At the same time, however, there was also a rapid development of information infrastructure worldwide,reflecting the deregulation of the communication sector proceeding from the 1980s in Japan and other countries,and the spread of new technology, such as Internet, accelerated communication among market participants in realtime and at reduced costs. From the late 1980s, we made investments in IT and communication businesses,including in common carriers such as Tokyo Telecommunication Network Co., Inc (currently KDDICorporation), JSAT Corporation, a communications satellites company, and broadcasting companies, such asSKY Perfect Communications Inc.
Medium-Term Strategic and Financial Plan to March 2006
In May 2004, Mitsui formulated and announced the Medium-Term Strategic and Financial Plan for the twoyears to March 31, 2006, aiming at a solid foundation for sustainable longer-term growth. The plan called forinvestments in the amount of ¥500 billion (including ¥100 billion in property and equipment) over the two yearperiod to March 2006, mainly in our core areas of strength, namely mineral resources, including expansion ofiron ore and coal mines in Australia, and energy, including the Sakhalin II LNG and oil development project inRussia and the Enfield oil project in Western Australia, and infrastructure project businesses, including ourpower producing business. It also called for developing other key areas, such as consumer products and servicesbusinesses. The investing activities resulted in net cash outflows of ¥347.3 billion and ¥224.0 billion for the yearsended March 31, 2006 and 2005, respectively.
14
Medium-Term Management Outlook Announced in May 2006
Following the completion of the period covered by the Medium-Term Strategic and Financial Plan toMarch, 2006, Mitsui established and announced a new Medium-Term Management Outlook in May 2006, basedon a company-wide consideration of the business activities that we should develop over the next three-to-fiveyears (namely, years ending March 31, 2009 to 2011) as below:
Development of Strategic Business Portfolio
We developed key policies based on dividing our business into the four areas outlined below. In workingtoward our vision for the next three to five years, we intended to make investments of approximately ¥800 billionover two years up to March 2008.
• In mineral resources and energy, we intend to complete the development of large-scale projects such asSakhalin II, and to expand existing projects such as our LNG project in Western Australia and iron oreand coal production in Australia, while investing selectively in high-quality new projects.
• In the area of global marketing networks, particularly in steel products, chemical products andmachinery, we provide and refine supply chain management (“SCM”) and other sophisticated functions.We will focus on the automobile, IT and energy businesses, and focus on developing areas throughcollaboration among operating segments outside Japan, particularly Asia.
• In the consumer service area, we plan to create closer collaboration by bringing together the Lifestyle,Consumer Services and Information, Electronics & Telecommunication business units, and to focus ondeveloping businesses that have the potential to become future earnings sources.
• In the infrastructure area, we plan to invest selectively in high-quality projects, mainly in powergeneration, water supply, energy and transportation.
For further information, including the development of investing activities for the years ended March 31,2008 and 2007, also see “Item 5.B. Liquidity and Capital Resources.”
Evolution of business models leveraging business engineering capabilities
We seek to leverage our strengths in marketing, finance and logistics, and actively promote joint operationsbetween business units. Furthermore, we continue to make efforts to develop new business opportunities, forexample:
• We plan to focus on consumer-oriented services in Japan that show great potential for growth,including: media and information, health, medical and senior care, retail support and outsourcing.
• We plan to pursue business development in environment-related businesses, such as emission rightstrading and recycling, along with new energy businesses, such as biomass ethanol and solar power.
Implementation of global strategies
We will focus the allocation of human resources on growth sectors in Asia, and align our strategy with ourcustomers. We will employ and foster the development of a diverse group of personnel at overseas trading andother subsidiaries and associated companies around the world.
15

Capital Expenditures
Major expenditures
See “Item 5.B. Liquidity and Capital Resources—Cash Flows” for further information. Our capitalexpenditures, including investments in debt securities, property and equipment and leased assets, amounted to¥735 billion, ¥798 billion and ¥613 billion for the years ended March 31, 2008, 2007 and 2006, respectively. Abreakdown is provided below.
Billions of Yen
Years Ended March 31,
2008 2007 2006
Investments in and advances to associated companies . . . . . . . . . . . . . . . . . . . . . ¥207 ¥222 ¥176Acquisitions of available-for-sale securities . . . . . . . . . . . . . . . . . . . . . . . . . . . . . 63 135 121Acquisitions of held-to-maturity debt securities . . . . . . . . . . . . . . . . . . . . . . . . . . — — 2Acquisitions of other investments . . . . . . . . . . . . . . . . . . . . . . . . . . . . . . . . . . . . . 131 102 67Additions to property leased to others and property and equipment . . . . . . . . . . . 282 327 247Acquisitions of subsidiaries, net of cash acquired . . . . . . . . . . . . . . . . . . . . . . . . . 52 12 —
Total . . . . . . . . . . . . . . . . . . . . . . . . . . . . . . . . . . . . . . . . . . . . . . . . . . . . . . . . . . . . ¥735 ¥798 ¥613
Of additions to property leased to others and property and equipment, the following were our mostsignificant expenditures with respect to property and equipment:
• acquisition of property and equipment in the Energy Segment for the oil projects of the Enfield andVincent oil fields in Australia, Tui oil field in New Zealand, oil and gas projects in Oman, and oil andgas projects offshore in the Gulf of Mexico as well as oil and gas projects by Mitsui Oil ExplorationCo., Ltd. mainly in offshore Thailand for the years ended March 31, 2008, 2007 and 2006 amounting to¥80 billion, ¥91 billion and ¥22 billion, respectively; and
• expansion of our iron ore and coal mines in Australia in the Mineral & Metal Resources Segment andthe Energy Segment for ¥62 billion, ¥58 billion and ¥36 billion for the years ended March 31, 2008,2007 and 2006, respectively.
See “Energy Segment” and “Mineral & Metal Resources Segment” of “Item 4.B. Business Overview.”
Additions to property leased to others included rolling stock leased to railway companies mainly in theUnited States and European countries, aircraft leased to global carriers and ocean vessels chartered to globalshipping companies as follows:
• ¥11 billion of rolling stock for the year ended March 31, 2008;
• ¥71 billion of rolling stock for the year ended March 31, 2007; and
• ¥54 billion of rolling stock and ¥8 billion of aircraft for the year ended March 31, 2006.
16

Investments in and advances to associated companies, and acquisitions of subsidiaries include the followingcapital expenditures:
Years EndedMarch 31, Investee Country
InvestmentAmount
(Billions of Yen)
2008 Sims Group Limited Associated company Australia 71
Steel Technologies, Inc. Subsidiary United States 45
Erdos Electrical Power &Metallurgical Co., Ltd.
Associated company China 16
IPM (UK) Power HoldingsLimited
Associated company United Kingdom 22
2007 Sakhalin Energy InvestmentCompany Ltd.
Associated company Bermuda(United Kingdom)
108
Greenfield Energy Center LP Associated company Canada 11
Asahi Tec Corporation Associated company Japan 12
Toyo Engineering Corporation Associated company Japan 10
Gas distribution operations inBrazil
Associated company Brazil 10
2006 Sakhalin Energy InvestmentCompany Ltd.
Associated company Bermuda(United Kingdom)
84
IPM Eagle LLP Associated company United Kingdom 13
Thai Tap Water Supply Co. Ltd. Associated company Thailand 11
Also see “Item 4.B. Business Overview” of “Mineral & Metal Resources Segment”, “Energy Segment” and“Machinery & Infrastructure Projects Segment”.
Acquisitions of available-for-sale securities included the followings:
• the additional investment in Sakhalin Energy Investment for ¥45.7 billion in the Energy Segment andpurchases of shares in Yamaha Motor Co., Ltd. for ¥24.3 billion (excluding loss on write-down) andpreferred stock in Japan Airlines Co., Ltd. for ¥20.0 billion in the Machinery & Infrastructure ProjectsSegment for the year ended March 31, 2008;
• the acquisition of shares in Recruit Co., Ltd. for ¥27 billion in the Consumer and IT Segment for theyear ended March 31, 2007; and
• the acquisition of shares in Seven & I Holdings Co., Ltd in the amount of ¥50 billion in the Foods &Retail Segment for the year ended March 31, 2006.
Capital expenditures are usually financed by external sources, such as commercial banking institutions.
17

Major divestitures
Divestitures including those of matured debt securities amounted to ¥639 billion, ¥315 billion and¥251 billion for the years ended March 31, 2008, 2007 and 2006, respectively. A breakdown of our divestitures isprovided below.
Billions of Yen
Years Ended March 31,
2008 2007 2006
Sales of investments in and collection of advances to associated companies . . . . ¥310 ¥ 34 ¥ 38Proceeds from sales of available-for-sale securities . . . . . . . . . . . . . . . . . . . . . . . 46 61 37Proceeds from maturities of available-for-sale securities . . . . . . . . . . . . . . . . . . . 4 107 52Proceeds from maturities of held-to-maturity debt securities . . . . . . . . . . . . . . . . 6 2 2Proceeds from sales of other investments . . . . . . . . . . . . . . . . . . . . . . . . . . . . . . . 51 53 48Proceeds from sales of property leased to others and property and equipment . . . 116 53 74Proceeds from sales of subsidiaries, net of cash held by subsidiaries . . . . . . . . . . 106 5 —
Total . . . . . . . . . . . . . . . . . . . . . . . . . . . . . . . . . . . . . . . . . . . . . . . . . . . . . . . . . . . . ¥639 ¥315 ¥251
The sales of investments in and collection of advances to associated companies for the year endedMarch 31, 2008 included a ¥226.4 billion proceed from the 50% divestiture of our stake in Sakhalin II project.
The sales of available-for-sale securities for the years ended March 31, 2008, 2007 and 2006 mostlyconsisted of those of Japanese listed companies such as the sale of shares in Toho Titanium Co., Ltd., a Japanesemanufacturer for ¥11.2 billion. In addition, for the year ended March 31, 2008 they included the sale of shares inEmpreendimentos Brasileiros de Mineração S.A., a Brazilian iron ore company, for ¥13.8 billion.
Sales of property leased to others and property and equipment included the sales of rolling stock leased torailway companies mainly in the United States, aircraft leased to global airline carriers and ocean vesselschartered to worldwide shipping companies. Particularly, they include the sales of rolling stock for the yearsended March 31, 2008, 2007 and 2006 amounting to ¥22 billion, ¥19 billion and ¥26 billion, respectively.
Proceeds from sales of subsidiaries, net of cash held by subsidiaries for the year ended March 31, 2008included the sale of Sesa Goa, an Indian iron ore company, for ¥92.8 billion.
Proceeds from maturities of available-for-sale securities and held-to-maturity debt securities were used forgeneral corporate purposes. See “Item 5.B. Liquidity and Capital Resources—Finance and LiquidityManagement.”
18

Major mineral resources and energy producing projects
The table below provides information about major mineral resources and energy producing projects whichhave involved or will involve significant capital expenditures for property and equipment. See “Item 4.B.Business Overview”, “Item 4.D. Property, Plant and Equipment—Mining Activities” and “Item 5.B. Liquidityand Capital Resources” for further information.
OperatingSegment
Project / JointVenture
(Country)Partner
(Operator)Mitsui’s
sharePlanned Capacity orActual Production(*1)
BudgetedCapital
Expenditure(*2)Investment
Decision
Completion /Initial
Production
Mineral& MetalResources
Robe RiverJoint Venture(Australia)
Rio Tinto 33% iron ore exportcapacity at CapeLambert from 55 to 80million tons perannum(“Mtpa”)
US$860(US$284)
2007 end 2008
Mesa A/Warramboomine, iron oreproduction capacity25 Mtpa
US$901(US$297)
2007 2010
Mt Newman,Yandi,Mt.Goldsworthy(Australia)
BHPBilliton
7% Iron ore productioncapacity from 109Mtpa to 129 Mtpa
A$2,200(A$150)
2005 2007
Iron ore productioncapacity from 129Mtpa to 155 Mtpa
A$2,730(A$190)
2007 First half2010
Iron ore productioncapacity from 155Mtpa to more than200 Mtpa
US$1,090(US$80)
2008(*3) 2011
Energy Enfield OilField(Australia)
WoodsidePetroleum
40% 47,000 barrels of oilper day on averageduring 2007(*4)
US$1,000(US$400)(*4)
2004 2006
Vincent OilField(Australia)
100,000 barrels oil perday
US$720(US$290)
2006 2008
Tui Oil Field(New Zealand)
AustralianWorldwideExploration
35% 50,000 barrels oil perday
US$200(US$70)
2005 2007
Dawson(Australia)
AngloAmerican
49% Coal productioncapacity from 7.0Mtpa to 12.7 Mtpa
A$900(A$440)
2004 2007
Kestrel(Australia)
Rio Tinto 20% Extention for newmining area, coalproduction capacity6.5 Mtpa
A$1,443(A$289)
2008 2012
(*1) The figures of capacity or production represent 100% volume of projects.(*2) Millions of currency units. Figures in parenthesis show Mitsui’s budgeted expenditure.(*3) Approval of early funding.(*4) The US$1,000 million total budget represents the original development for initial production. In October 2006, shortly
after commencement of commercial production, one of the major wells was shut-in due to unexpected sand productionand early water breakthrough. A work over program was made under an additional total budget of US$390 million.
19

B. Business Overview.
Throughout this section “B. Business Overview,” we describe the domicile of our subsidiaries andassociated companies, in parentheses following names of those companies. For example, Mitsui Iron OreDevelopment, Pty. Ltd. (Australia) means that the company’s name is Mitsui Iron Ore Development, Pty. Ltd.and that it is domiciled in Australia.
Nature of Our Operations and Principal Activities
We are a general trading company engaged in a range of global business activities including worldwidetrading of various commodities, arranging financing for customers and suppliers in connection with our tradingactivities, organizing and coordinating industrial projects, participating in financing and investing arrangements,assisting in the procurement of raw materials and equipment, providing new technologies and processes formanufacturing, and coordinating transportation and marketing of finished goods. Our trading activities as ageneral trading company include the sale, distribution, purchase, marketing, supply of and dealing in a widevariety of products and services, as a principal or an agent, including iron and steel, non-ferrous metals,machinery, electronics, chemicals, energy-related commodities and products, food products, textiles, generalmerchandise and real estate. We also participate in the development of natural resources such as oil, gas, iron andsteel raw materials. Recently, we have been proactively making strategic business investments whereby weinvest our own capital and provide management expertise in the development of joint ventures and newenterprises in certain industries such as information technology (“IT”), media and other consumer services.
While we continue to diversify our activities, the provision of services remains one of our core activities.Specifically, we act as an intermediary between customers and suppliers engaged in import, export, and offshoreand domestic trading activities. For example, we develop markets overseas for exporters and locate raw materialsor product sources that meet the needs of importers. To facilitate smooth customer transactions betweencustomers and suppliers, we draw upon our various capabilities such as market information analysis, creditsupervision, financing and transportation logistics.
In addition to our Head Office, Mitsui had 14 branches and offices located in Japan and 147 branches,offices and overseas trading subsidiaries(1) located in other parts of the world as of April 1, 2008. They providemarket information to each other and cooperate in developing various business opportunities.
The U.S. Department of State designates Iran, Sudan, Syria, Cuba and North Korea as state sponsors ofterrorism and subjects them to export controls. As a globally operating organization, we conduct business withcustomers in various countries including Iran, Sudan, Cuba and Syria. Our activities with customers in thesestates are insignificant when compared to our entire business (less than 1% of our consolidated revenues, grossprofit and assets for the years ended March 31, 2008, 2007 and 2006) and do not, in our view, represent eitherindividually or in aggregate, a material investment risk.
Our Iran-related operations primarily consist of business activities in which we have acted as an agent forJapanese companies such as Japanese engineering and heavy machinery companies, and assist them with variousaspects of entering into and completing industrial projects in Iran. In addition, we have arranged financingsprovided by export credit agencies for the principals of industrial projects in Iran. Furthermore, under limitedcircumstances, we engaged in Iran-related business activities as a principal, where we purchased crude oil, oilproducts and petrochemical products from Iranian entities and sold them in Japan and elsewhere. Mitsui has onlyone asset located in Iran, a subsidiary which renders services to support Mitsui’s implementing the above-mentioned activities.
(1) In this annual report, “overseas trading subsidiary” means subsidiaries such as Mitsui & Co. (U.S.A.), Inc., whichrepresent major parts of the geographic operating segments of Americas; Europe, the Middle East and Africa; andAsia Pacific. See “Products and Services and Principal Activities by Reportable Operating Segments” for furtherdetails.
20

Our Sudan-related operations consist of sales of chemical raw materials for consumer products in which weact as an agent, where our counterparties are neither Sudanese governmental bodies nor entities engaged in oilexploration and production in the country. In the past there were insignificant amount of sales of steel pipes andpurchase of sesame seeds. We have no business assets located in Sudan.
Seasonality of Our Business Activities
The trading of individual products such as heating oil, foods and textiles is influenced by seasonal factors.For example, heating oil is traded more frequently in winter than in summer months. Another example is ourfood wholesale business where the revenues of MITSUI FOODS CO., LTD. (Japan) increase from October toDecember and decrease from January to March, reflecting seasonal consumption habit in Japan. Nonetheless, theseasonality of any product either individually or in the aggregate has marginal impact on our annual operatingresults.
Dependence on Patents and Licenses and Industrial, Commercial or Financial Contracts
We have various patents and licenses as well as industrial, commercial and financial contracts (includingcontracts with customers or suppliers) to conduct our business. These patents, licenses or contracts eitherindividually or in the aggregate are not material to our business operations or results of operations.
Marketing Channels
Marketing channels vary by commodity, customer and region. We have established subsidiaries andassociated companies for promotion and distribution in response to specific business environments.
See “Products and Services and Principal Activities by Reportable Operating Segments” below. Specialsales or purchase methods, including financial arrangements, provided by the Machinery & InfrastructureProjects Segment and the Energy Segment, and supply chain management (“SCM”) systems conducted by someoperating segments are also described therein. SCM means a planning and management of successive andintegrated activities which cover procurement of raw materials, inventory control, processing, and logisticsmanagement for materials and products, ordinarily maintained through collaboration among suppliers,intermediaries and/or third-party service providers, and customers.
Competitive Position
Our main competitors are other Japanese general trading companies. Moreover, all of our potential businesspartners, for supply of products and services; or for establishment of joint venture operations, could also becompetitors. To ensure our competitiveness, we strive to continue to successfully meet the changing needs of ourcustomers and suppliers worldwide. Analysis of competitive position by operating segment is provided in“Products and Services and Principal Activities by Reportable Operating Segments” below and also see“Item 3.D. Risk Factors.”
Government Regulations
Our business activities are subject to various governmental regulations in the countries in which we operate.These regulations generally relate to obtaining business and investment approvals, and meeting the requirementsof export regulations, including those related to national security considerations, tariffs, antitrust, consumer andbusiness taxation, exchange controls and environmental laws and regulations. Certain of our businesstransactions such as our activities in the energy, mining, telecommunications, financing, food, consumerproducts, machinery, chemicals, etc. are regulated and subject to the relevant laws and regulations. See“Item 3.D. Risk Factors.”
21

Governmental Regulations with Respect to the Exploration and Production of Oil, Gas, and MineralResources
We are involved in various projects involving exploration for and production of crude oil, natural gas, ironraw material and non-ferrous metals in many different countries in which we participate as a minoritystakeholder and non-operator. These exploration and production activities are subject to a broad range of locallaws and regulations, which affect virtually all aspects of these activities. Contractual arrangements in connectionwith our oil, gas and mining activities, such as leases, licenses and production agreements are generally enteredinto with a government entity or a government owned company. See “Mineral & Metal Resources Segment” and“Energy Segment” of “Products and Services and Principal Activities by Reportable Operating Segments” below.
To date, changes in governmental laws and regulations have not had a material adverse effect on our oil, gasand mining projects. Some of our oil, gas and mineral projects are located in politically and economically stableregions, such as Australia, where the legal systems are relatively developed. However, we also hold interests inoil, gas and mineral resources in regions where legal systems are less developed. These investments may beadversely impacted by factors such as a lack of comprehensive sets of laws and regulations, an unpredictablejudicial system based on inconsistent application and interpretation of laws and regulations, and constantlychanging practices of regulatory and administrative bodies.
Governmental Regulations with Respect to Infrastructure Projects
We are engaged in various infrastructure projects worldwide. These include construction of power plants,oil and gas pipelines, telecommunications and broadcasting systems, cargo transportation systems, and publictransit systems in developing countries. In these projects, we are subject to extensive laws and regulations withrespect to technical specifications, environmental protection, pricing, labor, taxation, foreign exchange and othermatters. We commonly enter into contractual arrangements with government owned companies that are subjectto their own sets of laws and regulations. Changes in laws and regulations after the commencement of projectsmay result in lengthy delays which can negatively impact our cash flows and hinder the repatriation of capitalfrom such projects.
Governmental Regulations with Respect to Human Health and Environment
We are subject to extensive laws and regulations worldwide with respect to human health and theenvironment. Regulations governing food products for human consumption are complex, detailed and stringent.For instance, in Japan, our food related operations are under the supervision of the Ministry of Agriculture,Forestry and Fisheries, and the Ministry of Health, Labor and Welfare. We are subject to the Food Safety BasicLaw, which codifies the safety standard for food products. For example, it determines the threshold amount atwhich harmful substances such as pesticide residues are considered to be unacceptable. We must expendsignificant resources to comply with these regulations not only in Japan but in all jurisdictions where we engagein food-related operations.
We are also subject to complex environmental laws and regulations worldwide. For example, in Japan,when trading, storing or transporting chemical products or disposing of wastes and by-products from ourindustrial plants, we are required to notify the local regulators and/or obtain approvals or licenses. Any violationof laws and regulations may not only result in severe fines and penalties, but the regulators may require us tocurtail or even cease operations, install expensive pollution control systems, and comply with enhancednotification obligations.
22

Products and Services and Principal Activities by Reportable Operating Segments
For the year ended March 31, 2008, we had eleven reportable operating segments which consisted of eightproducts and services focused reportable operating segments and three region-focused reportable operatingsegments listed as below:
Our eight products and services focused operating segments were:
• Iron & Steel Products
• Mineral & Metal Resources
• Machinery & Infrastructure Projects
• Chemical
• Energy
• Foods & Retail
• Consumer Service & IT
• Logistics & Financial Markets
Our three region-focused operating segments were:
• Americas
• Europe, the Middle East and Africa
• Asia Pacific
For information on the composition of our products and services focused reportable segments and region-focused reportable operating segments, also see “Item 5.A. Operating Results—Operating Results by OperatingSegment.” Gross Profit, Operating Income (Loss) and Net Income (Loss) by reportable operating segment for theyears ended March 31, 2008, 2007 and 2006 were as follows(1)(2)(3)(4):
Gross Profit
In Billions, Except Percentages
Years Ended March 31,
2008 2007 2006
Iron & Steel Products . . . . . . . . . . . . . . . . . . . . . . . . . . . . . ¥ 61.3 6.2% ¥ 57.7 6.7% ¥ 54.4 6.9%Mineral & Metal Resources . . . . . . . . . . . . . . . . . . . . . . . . 95.8 9.7 111.0 12.8 88.5 11.3Machinery & Infrastructure Projects . . . . . . . . . . . . . . . . . . 134.1 13.6 108.0 12.5 90.6 11.5Chemical . . . . . . . . . . . . . . . . . . . . . . . . . . . . . . . . . . . . . . . 110.3 11.2 103.1 11.9 97.8 12.5Energy . . . . . . . . . . . . . . . . . . . . . . . . . . . . . . . . . . . . . . . . . 219.3 22.2 123.9 14.3 107.0 13.6Foods & Retail . . . . . . . . . . . . . . . . . . . . . . . . . . . . . . . . . . 81.2 8.2 81.3 9.4 79.9 10.2Consumer Service & IT . . . . . . . . . . . . . . . . . . . . . . . . . . . . 116.7 11.8 130.0 15.0 128.4 16.4Logistics & Financial Markets . . . . . . . . . . . . . . . . . . . . . . 55.1 5.6 60.5 7.0 51.4 6.6Americas . . . . . . . . . . . . . . . . . . . . . . . . . . . . . . . . . . . . . . . 54.0 5.5 64.7 7.5 61.6 7.9Europe, the Middle East and Africa . . . . . . . . . . . . . . . . . . 26.8 2.7 25.4 2.9 24.3 3.1Asia Pacific . . . . . . . . . . . . . . . . . . . . . . . . . . . . . . . . . . . . . 33.1 3.3 30.7 3.5 30.4 3.9
Total . . . . . . . . . . . . . . . . . . . . . . . . . . . . . . . . . . . . . . . . . . 987.7 100.0 896.3 103.5 814.3 103.9
All Other . . . . . . . . . . . . . . . . . . . . . . . . . . . . . . . . . . . . . . . 5.5 0.6 4.3 0.5 7.1 0.9Adjustments and Eliminations . . . . . . . . . . . . . . . . . . . . . . (5.1) (0.6) (34.3) (4.0) (36.8) (4.8)
Consolidated Total . . . . . . . . . . . . . . . . . . . . . . . . . . . . . . . ¥988.1 100.0% ¥866.3 100.0% ¥784.6 100.0%
23

Operating Income (Loss)
In Billions, Except Percentages
Years Ended March 31,
2008 2007 2006
Iron & Steel Products . . . . . . . . . . . . . . . . . . . . . . . . . . . . . ¥ 25.6 6.8% ¥ 25.6 9.1% ¥ 26.5 10.7%Mineral & Metal Resources . . . . . . . . . . . . . . . . . . . . . . . . 79.0 21.1 91.3 32.3 68.5 27.7Machinery & Infrastructure Projects . . . . . . . . . . . . . . . . . . 32.0 8.5 20.9 7.4 21.7 8.8Chemical . . . . . . . . . . . . . . . . . . . . . . . . . . . . . . . . . . . . . . . 46.2 12.3 35.3 12.5 34.0 13.7Energy . . . . . . . . . . . . . . . . . . . . . . . . . . . . . . . . . . . . . . . . . 172.4 46.0 81.3 28.7 70.7 28.5Foods & Retail . . . . . . . . . . . . . . . . . . . . . . . . . . . . . . . . . . 16.6 4.4 10.9 3.9 9.2 3.7Consumer Service & IT . . . . . . . . . . . . . . . . . . . . . . . . . . . . 18.9 5.0 20.3 7.2 25.0 10.1Logistics & Financial Markets . . . . . . . . . . . . . . . . . . . . . . 20.9 5.6 24.2 8.6 17.6 7.1Americas . . . . . . . . . . . . . . . . . . . . . . . . . . . . . . . . . . . . . . . 2.0 0.5 21.4 7.6 21.7 8.8Europe, the Middle East and Africa . . . . . . . . . . . . . . . . . . 1.8 0.5 3.0 1.1 4.7 1.9Asia Pacific . . . . . . . . . . . . . . . . . . . . . . . . . . . . . . . . . . . . . 7.6 2.0 9.5 3.4 11.2 4.5
Total . . . . . . . . . . . . . . . . . . . . . . . . . . . . . . . . . . . . . . . . . . 423.0 112.7 343.7 121.8 310.8 125.5
All Other . . . . . . . . . . . . . . . . . . . . . . . . . . . . . . . . . . . . . . . (1.4) (0.4) (4.4) (1.6) (3.2) (1.3)Adjustments and Eliminations . . . . . . . . . . . . . . . . . . . . . . (46.8) (12.3) (56.5) (20.2) (59.9) (24.2)
Consolidated Total . . . . . . . . . . . . . . . . . . . . . . . . . . . . . . . ¥374.8 100.0% ¥282.8 100.0% ¥247.7 100.0%
* Operating income (loss) reflects our (a) Gross Profit, (b) Selling, general and administrative expenses and(c) Provision for doubtful receivables, as presented in the Statements of Consolidated Income.
Net Income (Loss)
In Billions, Except Percentages
Years Ended March 31,
2008 2007 2006
Iron & Steel Products . . . . . . . . . . . . . . . . . . . . . . . . . . . . . ¥ 20.3 5.0% ¥ 20.6 6.8% ¥ 19.3 9.5%Mineral & Metal Resources . . . . . . . . . . . . . . . . . . . . . . . . 177.0 43.2 98.3 32.6 44.8 22.1Machinery & Infrastructure Projects . . . . . . . . . . . . . . . . . . 35.0 8.5 33.6 11.1 30.6 15.1Chemical . . . . . . . . . . . . . . . . . . . . . . . . . . . . . . . . . . . . . . . 18.4 4.5 19.3 6.4 12.1 6.0Energy . . . . . . . . . . . . . . . . . . . . . . . . . . . . . . . . . . . . . . . . . 124.1 30.3 75.7 25.1 50.8 25.1Foods & Retail . . . . . . . . . . . . . . . . . . . . . . . . . . . . . . . . . . 10.5 2.6 (12.3) (4.1) (3.2) (1.6)Consumer Service & IT . . . . . . . . . . . . . . . . . . . . . . . . . . . . 12.0 2.9 16.6 5.5 17.5 8.6Logistics & Financial Markets . . . . . . . . . . . . . . . . . . . . . . 7.5 1.8 14.6 4.8 13.4 6.6Americas . . . . . . . . . . . . . . . . . . . . . . . . . . . . . . . . . . . . . . . 4.3 1.0 16.9 5.6 12.7 6.3Europe, the Middle East and Africa . . . . . . . . . . . . . . . . . . 5.0 1.2 4.1 1.4 5.0 2.5Asia Pacific . . . . . . . . . . . . . . . . . . . . . . . . . . . . . . . . . . . . . 22.5 5.5 22.0 7.3 22.8 11.3
Total . . . . . . . . . . . . . . . . . . . . . . . . . . . . . . . . . . . . . . . . . . 436.6 106.5 309.4 102.5 225.8 111.5
All Other . . . . . . . . . . . . . . . . . . . . . . . . . . . . . . . . . . . . . . . (7.1) (1.7) 5.8 1.9 11.8 5.8Adjustments and Eliminations . . . . . . . . . . . . . . . . . . . . . . (19.4) (4.8) (13.7) (4.4) (35.2) (17.3)
Consolidated Total . . . . . . . . . . . . . . . . . . . . . . . . . . . . . . . ¥410.1 100.0% ¥301.5 100.0% ¥202.4 100.0%
Notes:(1) The figures for “Consolidated Total” for the years ended March 31, 2007 and 2006 have been reclassified to
conform to the change in current year presentation for discontinued operations, in accordance withStatement of Financial Accounting Standards (“SFAS”) No. 144, “Accounting for the Impairment orDisposal of Long-Lived Assets.”
24

(2) “All Other” includes business activities which primarily provide services, such as financing services, andoperations services to external customers, and/or to us and associated companies.
(3) Net loss of “Adjustments and Eliminations” includes income and expense items that are not allocated tospecific reportable operating segments, such as certain expenses of corporate departments, and eliminationsof intersegment transactions.
(4) Transfers between operating segments are made at cost plus a markup.
Iron & Steel Products Segment
The Iron & Steel Products Segment consists of one business unit, the Iron & Steel Products Business Unit,which has:
• 16 subsidiaries including Mitsui & Co. Steel Ltd. (Japan), Regency Steel Asia Pte Ltd. (Singapore),Mitsui Bussan Kozai Hanbai Co., Ltd. (Japan) and Mitsui Bussan Steel Trade Co., Ltd. (Japan); and
• 18 associated companies including Nippon Steel Trading Co., Ltd. (Japan), SIAM YAMATO STEELCOMPANY LIMITED (Thailand) and Shanghai Bao-Mit Steel Distribution Co., Ltd. (China).
Gross profit and net income for this segment for the year ended March 31, 2008 were ¥61.3 billion or 6.2%and ¥20.3 billion or 5.0% of our consolidated total, respectively.
Iron and steel products are used in a wide range of industries including the automobile, electronics,transportation, construction and energy sectors. We have served our customers in these industries worldwide andprovided support services for Japanese steel makers. The Iron & Steel Products Business Unit conductsmanufacturing, trading, marketing, processing and distribution of:
• steel sheet for automobile and electric appliances, steel plates for shipbuilding and heavy electricmachinery, galvanized steel products and tin material and products;
• steel products for oil and gas projects including oil well tube and line pipe;
• wire rod, specialty steel and bearing;
• steel bars and other steel construction materials; and
• semi-finished items including steel slabs to be processed into steel plates and steel billets to beprocessed into steel bars and wire rods.
This business unit has made investments in subsidiaries and associated companies including coil centers asbases for processing and distribution; steel makers as manufacturing bases; and steel product specialized tradingcompanies. Recently, this business unit has focused on businesses in emerging countries as below:
• Regency Steel Asia Pte Ltd. (Singapore), a steel products wholesale subsidiary which this business unitacquired in the year ended March 31, 2004, has expanded wholesale operations in the rapidly growingsteel products markets in Asia.
• This business unit also focuses on business opportunities in Russia and in India among other countries,by setting up joint ventures with local business entities and creating our service networks such as coilcenters.
In the steel products business, both manufacturers and users are large-scale and sophisticated organizations.As low value added intermediation between these entities is no longer sufficient to serve their needs, the businessunit has developed its services based on the proprietary SCM network by making use of accumulated IT andlogistics expertise. By working closely with manufacturers and users, we optimize distribution and inventorycontrol, thus sharing with customers and suppliers the benefit of associated cost reductions. For example:
• We have established steel service centers, galvanized steel plants and tin-plating facilities at oursubsidiaries and/or joint ventures with Japanese and overseas steel makers and other local partners in
25

order to meet the rising demand from manufacturers of automobiles, electric appliances and heavyelectric machinery that have transplanted their production centers to the United States, Southeast Asiaand China. The most representative case is Shanghai Bao-Mit Steel Distribution Co., Ltd. (China), ajoint venture established in 2002 with Shanghai Baosteel Group Corporation, a Chinese integrated steelmanufacturer, in order to build a network of steel products service centers in China. Through this jointventure, we have been setting up SCM network by integrating service centers within China andimproving operational efficiency and have been actively pursuing additional investments.
• We frequently draw upon the unit’s logistics expertise in delivering a wide range of materials andproducts in large volume under an optimized schedule along with expertise in project financing. We alsotake advantage of the business relationships and marketing channels of other business units in the fieldsof energy, industrial plants, shipping and machinery. This enabled us to be involved in various industrialprojects including the construction of oil and gas pipeline projects such as the Sakhalin project wherewe supplied the steel structure and the Western Australia offshore LNG project operated by WoodsidePetroleum Ltd. where we supplied high grade steel pipe.
Some competitors of this business unit, other Japanese trading companies, have reorganized their businessesand established new joint ventures, such as Marubeni-Itochu Steel Inc. and Metal One Corporation in their effortsto achieve low-cost operations through economy of scale. In contrast, this business unit puts priority in efficientlyleveraging business resources of other operating segments through groupwide collaborations. In order to increasecompetitiveness as well as pursuing strategic business opportunities, the Investment & Planning Division withinthis business unit, specializes in investments in steel-related enterprises, particularly joint investments inresponse to the needs from steel users and steel manufacturers in Japan and overseas, strengthening ties withJapanese steel makers and wholesalers through collaboration in sales of products, procurement of raw materialsand equity investments. Furthermore, in the domestic market which has been already mature, this business unitconcentrates on reorganizations of subsidiaries to improve their sales force and operational efficiency. Forexample, this business unit established Mitsui & Co. Steel Ltd. (Japan) by consolidating 4 subsidiaries for steelproducts in April 2008.
In July 2006, as a result of the merger between the world’s largest integrated steel manufacturers, MittalSteel Company N.V. and Arcelor S.A., ArcelorMittal was organized. We have been carefully watchingreorganizations in the global steel industry. We have observed that operational optimization throughreorganization of integrated steel manufacturers tends to contribute to the stabilization of steel prices. In newlydeveloping countries such as China and India, an increase in local steel demand and an increase in local steelproduction are ongoing in tandem, providing a definite forecast on the global supply-demand balance in thefuture becomes extremely difficult. Continuously offering efficient SCM services is still a key for this businessunit to survive in such worldwide reorganization of steel industry.
Mineral & Metal Resources Segment
The Mineral & Metal Resources Segment consists of one business unit, the Mineral & Metal ResourcesBusiness Unit. Effective April 1, 2007, the former Iron & Steel Raw Materials and Non-Ferrous Metals Segmentwas renamed as the Mineral & Metal Resources Segment, and the businesses of coal, nuclear fuels, carboncredits, and hydrogen and fuel cell were transferred to the Energy Segment.
This segment has:
• 12 subsidiaries, including Mitsui Iron Ore Development Pty. Ltd. (Australia), Mitsui Itochu Iron Pty.Ltd. (Australia), Japan Collahuasi Resources B.V. (Netherlands), Mitsui Raw Materials DevelopmentPty. Limited (Australia), Mitsui Bussan Raw Materials Development Corp. (Japan) and MITSUIBUSSAN METALS SALES CO., LTD. (Japan); and
26

• 11 associated companies, including Valepar S.A. (Brazil), CORAL BAY NICKEL CORPORATION(The Republic of Philippines), NIPPON AMAZON ALUMINUM CO., LTD. (Japan), SUMIC NickelNetherlands B.V. (Netherlands) and Inner Mongolia Erdos Electric Power & Metallurgy Co., Ltd.(China).
Gross profit and net income for this segment for the year ended March 31, 2008 were ¥95.8 billion or 9.7%and ¥177.0 billion or 43.2% of our consolidated totals, respectively.
This business unit is engaged in various business activities including:
• trading, investment, logistics management and transportation services related to iron and steel rawmaterials, such as iron ore, steel scrap, ferro-alloys and other minerals; and
• trading, investment, transportation and processing of non-ferrous metal ores and ingots such as copper,lead, zinc, tin, nickel, aluminum, magnesium, cobalt, titanium, other non-ferrous metals; and sales andmarketing of semi-fabricated non-ferrous products such as construction materials.
In the field of iron and steel raw materials, in 1960s we started investments in raw materials sourcingprojects based on concept of “develop-and-import”, aiming at stable procurement of those raw materials to Japanthrough diversified channels. Those projects are supplying raw materials to major iron and steel manufacturingcountries including Japan.
The following tables provide information on our investments in iron ore resource projects. For moreinformation on our mining activities including production and reserves, See “Item 4.D. Property, Plants andEquipment—Mining Activities.”
Iron Ore Mining Activities
Joint Venture or InvesteeMitsui’s Subsidiary orAssociated Company Name of Mines Location
Mitsui’sPercentage of
Ownership
Other Major Participantsand Their Percentages of
Ownership
Robe River IronAssociates
Mitsui Iron OreDevelopment Pty. Ltd.
Pannawonica WestAngelas
Pilbara Region,Western Australia
33.00% Rio TintoNippon SteelSumitomo MetalIndustries
53.00%10.50%3.50%
Mt. Newman JointVenture
Mitsui Itochu Iron Pty.Ltd.
Mt. Whaleback Pilbara Region,Western Australia
7.00% BHP BillitonItochu
85.00%8.00%
Yandi Joint Venture Mitsui Iron OreDevelopment Pty. Ltd.
Marillana Creek Pilbara Region,Western Australia
7.00% BHP BillitonItochu
85.00%8.00%
Mt. Goldsworthy JointVenture
Mitsui Iron OreDevelopment Pty. Ltd.
Northern (Yarrie)(Nimingarra)Area C
Pilbara Region,Western Australia
7.00% BHP BillitonItochu
85.00%8.00%
In addition, we have a 15% ownership interest (or 18.24% in terms of voting shares as of March 31, 2008),of Valepar S.A. (Brazil), the controlling shareholder of Companhia Vale do Rio Doce (“Vale”, formerly called asCVRD) in Brazil. Vale is a mining enterprise with operations that include mining of iron ore and other rawnon-ferrous metals. We purchased the ownership interest in Valepar S.A. in September 2003.
In July, Vale made a public offering of its shares. Valepar S.A. maintained the current controlling ownershipat Vale by exercising its priority subscription rights, and Mitsui contributed to Valepar S.A. on a pro rata basis.Mitsui’s investment amount was ¥78.4 billion.
27
In April 2007, this business unit sold its entire stake in Sesa Goa Limited. Iron ore mining businesses remainour core business, and we continue to engage in investments for the enhancement of production capacity andoperational efficiency in existing mining operations. Regarding further information and discussion ondevelopment of our iron ore mining projects, see “Item 4.A. History and Development of the Company— CapitalExpenditure”, “Item 5.A. Operating Results—Operating Results by Operating Segment—Mineral & MetalResources Segment” and “Item 5.B. Liquidity and Capital Resources—Investment Plans and Financial policiesof the Medium Term Management Outlook”.
Revenues from iron ore producing activities account for a significant portion of this business unit. The tablebelow sets forth the break down of revenues of the Mineral & Metal Resources Business Unit.
Revenues
Billions of Yen
Revenues from Sales of Products
Revenues fromSales of Servicesand Other Sales
Years Ended March 31,
Revenues fromIron Ore
ProducingActivities
Revenues fromSales of
Other Products(*)
Commissions andTrading Margins on
Intermediary Servicesand Other Total Revenues
2008 . . . . . . . . . . . . . . . . . . . . . . . . . . . . . . . . . . . . . . . ¥116.8 ¥159.2 ¥16.7 ¥292.72007 . . . . . . . . . . . . . . . . . . . . . . . . . . . . . . . . . . . . . . . ¥ 86.4 ¥148.7 ¥26.1 ¥261.22006 . . . . . . . . . . . . . . . . . . . . . . . . . . . . . . . . . . . . . . . 72.1 141.3 21.5 234.9
(*) Revenues from sales of other products mainly consist of sales of scrap metals and non-ferrous metals such as copper and aluminum. Thisbusiness unit reports no revenues from mineral producing activities other than iron ore producing activities.
This business unit recognizes scrap recycling as industrial solutions to environmental problems, and has setrecycling business as one of its key businesses. In Japan, Mitsui Bussan Raw Materials Development Corporationhas operated a scrap recycling business. In April, it was merged with a former non-ferrouos metal tradingsubsidiary Mitsui Bussan Metals Sales Co., Ltd., to form Mitsui Bussan Metals Co., Ltd. (Japan), which engagesin wide range of products and services in metal resources, recycling and non-ferrous metal products.
In addition, in June 2007, this business unit acquired 19.99% of the issued ordinary shares of Sims GroupLimited (Australia), a scrap metal recycler with worldwide operating bases in Australia and Europe as well as inNorth America, its main operating zone, for ¥61.2 billion. In March 2008, Sims Group Limited merged withMetal Management, Inc, a United States recycler. Mitsui’s ownership interest in Sims Metal Management as ofMarch 31, 2008 was 16%, reflecting dilution from the merger and additional acquisition of share interest. Mitsuiand Sims Group Limited seek opportunities for a joint recycling business in Japan and abroad.
We participate in a joint venture which produces Silico-Manganese in the Inner Mongolia AutonomousRegion, China, together with Erdos Electrical Power and Metallurgical Co., Ltd. (“Erdos EPM”) and JFE SteelCorporation, a major Japanese integrated steel manufacturer. This project started production of Silico-Manganesein July 2006 with an annual production capacity of 75,000 tons at its initial stage, and an expansion plan todouble the capacity to 150,000 tons (expected start-up at the end of 2008) was decided in October 2007. ErdosEPM operates four major businesses in the Inner Mongolia Autonomous Region: power generation, coal mining,ferrous alloy production and water pumping from the Yellow River. In April 2007, this business unit completedthe acquisition of 25% share ownership in Erdos EPM.
We have been operating joint venture projects to meet the increasing demand for iron and steel rawmaterials in Japan and abroad. POSCO Terminal Co., Ltd. is the representative case established in January 2003with POSCO, an integrated steel manufacturer in Republic of Korea. It provides logistics services including bulkmaterial transportation, storage and transshipment involving iron and steel raw materials for various customers inAsia.
28

In non-ferrous metals field, we have been engaging in trading of copper, nickel, cobalt, aluminum ingotsand other non-ferrous metal materials. We are also expanding our investments and participation in variousnon-ferrous metals mining and smelting projects to secure stable sources of supply. For example:
• We participate in Compania Minera Dona Ines de Collahuasi SCM (Chile), a copper mine developmentproject, in which we hold a 7.43% interest. The project, which commenced commercial production in1998, has been developed jointly with Anglo American Plc and Falconbridge Ltd. and has an annualproduction capacity of about 500,000 tons of copper. In addition, we have a 1.25% interest in MineraLos Pelambres in Chile, whose production capacity is about 360,000 tons of copper per annum.
• We participate in a nickel-cobalt smelting project in the Rio Tuba area in the Republic of Philippineswhich has been developed jointly with Sumitomo Metal Mining Co., Ltd., Sojitz Corporation and a localpartner. This project started commercial production of nickel-cobalt mixed sulfide in April 2005 using ahigh-pressure acid leaching process, an advanced processing technology for nickel production, and isoperating at its design capacity (10,000 ton Nickel content and 750 ton cobalt content per annum). InFebruary 2007, we decided to participate in the expansion plan for the second production line to doublethe production capacity. In April 2005, we, jointly with Sumitomo Metal Mining Co., Ltd., concluded anagreement for participation in the Goro Nickel Development Project in New Caledonia, which has beendeveloped by former Inco Limited, (currently called as Vale Inco Ltd.). The plant construction of thisproject is expected to be completed by the end of 2008 and to produce in total about 60,000 tons ofnickel and about 5,000 tons of cobalt per annum.
• We have a 15.04% interest in NIPPON AMAZON ALUMINUM CO., LTD. (Japan) which has investedin aluminum smelting and alumina refining business in Brazil. On June 30, 2006, we exited fromMitalco Inc., an aluminum smelting operation in the United States. However, this business unitrecoginizes that aluminum continues to be an important material and pursues relevant businessopportunities.
• We established a special department for rare metals which underpin high-tech industries. Thedepartment has been studying development and undertaking feasibility studies of various rare metalprojects.
Machinery & Infrastructure Projects Segment
The Machinery & Infrastructure Projects Segment consists of three business units, the InfrastructureProjects Business Unit, the Motor Vehicles Business Unit and the Marine & Aerospace Business Unit. Effectivefrom April 2007, the former Machinery Business Unit was reorganized to form the Motor Vehicles Business Unitand the Marine & Aerospace Business Unit.
Gross profit and net income for this segment for the year ended March 31, 2008 were ¥134.1 billion or13.6% and ¥35.0 billion or 8.5% of our consolidated totals, respectively.
The Machinery & Infrastructure Projects Segment holds 71 subsidiaries, including:
• MBK Project Holdings Ltd. (Japan), Mitsui & Co. Plant Systems, Ltd. (Japan), Mitsui Power VenturesLimited (United Kingdom), MIT Power Canada LP Inc. (Canada), Mitsui Rail Capital Holdings, Inc.(United States), Mitsui Rail Capital Europe B.V. (Netherland), MRCE Dispolok GmbH (Germany),Mitsui Rail Capital Participacoes Ltda. (Brazil) and Mitsui Gas e Energia do Brasil Ltda. (Brazil) in theInfrastructure Projects Business Unit;
• Toyota Chile S.A. (Chile), PT. Bussan Auto Finance (Indonesia), Mitsui Automotive Europe B.V.(Netherlands), MMK Co., Ltd. (Japan) and Ellison Technologies Inc. (Unites States) in the MotorVehicles Business Unit; and
29

• CLIO MARINE INC. (Liberia), Lepta Shipping Co., Ltd. (Liberia) and Mitsui Bussan Aerospace Co.,Ltd. (Japan) in the Marine & Aerospace Business Unit.
Additionally it has 65 associated companies such as:
• IPM Eagle LLP (United Kingdom), IPM(UK)Power Holdings Limited (United Kingdom), P.T. PaitonEnergy (Indonesia), Toyo Engineering Corporation (Japan) and Compania de Generacion de Valladrid(Mexico) in the Infrastructure Projects Business Unit; and
• Toyota Canada Inc. (Canada), Penske Automotive Group, Inc. (United States), PT. Yamaha IndonesiaMotor Manufacturing (Indonesia), Japan Automobile Auction, Inc. (Japan), ASAHI TEC Corporation(Japan) and Komatsu Australia Pty. Ltd. (Australia) in the Motor Vehicles Business Unit.
Infrastructure Projects Business Unit
The business activities of the Infrastructure Projects Business Unit together with 30 subsidiaries and18associated companies cover a wide range of involvement in project implementation and related services,including:
• electric power projects such as power plants, power transmission and substation facilities;
• energy related projects such as oil and gas development projects, oil refineries, LNG receiving facilitiesand pipelines;
• water supply projects such as desalination plants, wastewater processing facilities and water supply andsewerage facilities;
• railway transportation-related business such as rolling stock and railway facilities and systems;
• social infrastructure projects such as construction of airport, port, road and other public facilities;
• basic industry projects such as iron, non-ferrous metals and chemical plants; and
• environment-related projects such as waste disposal and recycling plants.
We are undertaking various projects that may stimulate economic growth in developing countries andcountries rich in natural resources. In response to their needs, we apply our project engineering capabilitiesincluding expert knowledge in financing, logistics, taxation and legal affairs. This business unit often arrangesfinancing for projects by international financial institutions and export credit agencies worldwide. Moreover, itfrom time to time provides loans or issues guarantees on behalf of the project owners.
The following are examples of the types of projects and the activities in which this business unit rendersservices, mainly as an agent in securing the contract, arranging financing and executing the contract:
• In the Commonwealth of Independent States (“CIS”), the Middle East, Brazil and Indonesia, we havebeen engaged in the structuring and the arrangement of debt and equity project financing for variousnatural gas and/or oil projects. Together with export credit agencies and commercial banks, we alsoextended loans to project participants.
• We have acted as the Engineering, Procurement and Construction (“EPC”) contractor for various oil andgas production projects and for the construction of infrastructure facilities including power plants andpetrochemical plants in which we procured manufacturing equipment from Japanese and overseassubcontractors.
• For the Taiwan High Speed Rail project, we are the commercial leader of a consortium consisting ofJapanese railway car manufacturers and general trading companies, which supplied rolling stock andtransportation facilities.
This business unit is increasing activities which go beyond the conventional EPC approach of acting as anintermediary between project owners and sub-contractors. Instead, these activities often involve arrangement of
30

sophisticated financing schemes, risk sharing through equity participation and operation and maintenance ofplant and facilities after their construction completion. Based on this concept, the unit has been proactivelyinvesting in several types of infrastructure projects. In particular, independent power producer (“IPP”) businessoverseas lies as a core domain. Most of these IPP projects operate under long term power sales contracts withusers such as state-owned electricity companies, which enable us to forecast stable returns.
• IPM Eagle LLP (United Kingdom), which we established jointly with International Power plc, is thecore operation of our overseas power producing businesses. In December 2004, we, together withInternational Power plc, purchased the international power generation portfolio (nine power plants inEurope, Australia and Asia in total, 4,514 megawatts, as of March 2005) of Edison Mission Energy.Since then, IPM Eagle LLP has held and managed these power generation businesses. In July 2005, IPMEagle LLP acquired the Saltend 1,200 megawatt combined cycle power plant in the United Kingdom.Furthermore, In June 2007, International Power plc and Mitsui reorganized the ownership of powergenerating assets in the United Kingdom. 3 power generating assets formerly owned by InternationalPower plc and 2 power generating assets formerly owned by IPM Eagle LLP were transferred to anewly established joint venture (ownership: International Power plc 75% and Mitsui 25%). Some of theabove-mentioned projects sell electricity at wholesale on the power market, instead of supplying it underlong term contracts, so that the joint ventures optimize their profit structure.
• We have formed a joint venture with Calpine Corporation to construct, own and operate the1,005 megawatt combined cycle power plants called Greenfield Energy Center LP (Canada). The jointventure will start commercial operation from 2008 and has already secured a 20 year Clean EnergySupply contract with Ontario Power Authority, Canada.
• We have a 36.3% voting interest in P.T. Paiton Energy (Indonesia), an Indonesian power producer,which owns a 1,230 megawatt coal fired power plant in East Java, Indonesia. (In addition, IPM EagleLLP owns a 44.7% voting interest.) P.T. Paiton Energy sells electricity to P.T. Perusahaan ListrikNegara, a government-owned electric utility company, under a power purchase agreement. P.T. PaitonEnergy was originally established in 1994 by Mitsui and other partners including Edison MissionEnergy.
Reflecting these developments, the combined power generation capacities for the unit’s equity share invarious power projects as of the end of March 2008 in operation and under construction were 3,102 megawattand 672 megawatt, respectively. As well as the above-mentioned projects, these power generation capacitiesincluded those under the operation of Umm Al Nar in the United Arab Emirates, Tarong North Power Station inAustralia and Valladolid III in Mexico and those under construction by Amman East in Jordan and Ras Laffan inQatar.
This business unit is also engaged in the following projects:
• Mitsui owns a 25% interest in the LNG terminal in Altamira, Mexico. The facility started operations inSeptember 2006, providing services of receiving and regasification of LNG for the ultimate customer,Comisión Federal de Electricidad, a state power company. In addition, in March 2008 this business unitsigned a service agreement with Comisión Federal de Electricidad in regards to the concession rights forconstruction and operation of an LNG receiving terminal in Manzanillo city. Mitsui participates in thisproject with a 37.5% interest. Commercial start-up is planned in the middle of 2011.
• Mitsui owns a 35% interest in Thai Tap Water Supply Company Limited and a 34.3% interest inPathum Thani Water Supply Company Limited, to supply tap water to the provincial authorities nearBangkok, Thailand under 30-year and 25-year water supply agreements, respectively.
• Mitsui Gas e Energia do Brasil Ltda. (Brazil), formerly named Gás Participações Ltda., which Mitsuiwholly acquired in April 2006, participates in seven local gas distribution companies with a 24.5%interest in each, with other shareholders, Petrobras Gas S.A., and the respective state governments inBrazil.
31

This business unit runs rolling stock leasing businesses providing relevant maintenance and managementservices.
• In North America, Mitsui Rail Capital, LLC. (United States) engages in freight car leasing for railwaycompanies and logistic management and maintenance service of freight cars for coal transportation topower companies.
• In Brazil, Mitsui Rail Capital Participacoes Ltda. engages in finance leasing of freight car for majorgrain shippers and railroad companies.
• In Europe, we have two rolling stock leasing subsidiaries, MRCE Dispolok GmbH (Germany), whichwe acquired from Siemens Aktiengesellschaft in October 2006, and Mitsui Rail Capital Europe B.V.(Netherlands), which was established in 2004, covering locomotives leasing in all of Europe.
Environmental issues are a worldwide concern. Our initiatives in this field include creating andimplementing recycling systems for automobiles, electric appliances and plastic bottles made from polyethyleneterephthalate. Also, we are engaged in the construction of wind power facilities and other environment-relatedprojects such as greenhouse gas emission reduction.
Our major competitors include other Japanese general trading companies, international financial institutions,global engineering companies, construction companies and multi-national IPP’s.
Motor Vehicle Business Unit
The Motor vehicle Business Unit, together with 28 subsidiaries and 19 associated companies, is engaged inthe following business activities:
• import and export, assembly and manufacturing, distribution and dealership of motor vehicles, motorcycles and their parts; and retail finance; and
• trading of industrial machinery including mining and construction equipment, production equipment andmachine tools.
This business unit has a long track record of exporting and marketing Japanese automobiles and hasdeveloped networks of our subsidiaries and associated companies as import wholesalers, dealers and assemblerfor Japanese vehicles in many regions of the world. For example, we have been exporting Toyota, Subaru andmotor vehicles of other Japanese manufacturers to various countries worldwide including Canada (Toyota), Chile(Toyota), Peru (Toyota), Italy (Subaru), Germany (Subaru and Yamaha), Thailand (Hino) and Malaysia(Daihatsu).
In recent years, the relocation of Japan’s automobile production sites from domestic locations to overseashas been accelerating, and we have diversified our activities to cope with such trend by allocating our financialand human resources strategically to prioritized areas of our motor vehicles business worldwide, such as logisticsservices for manufacturing components, retail operations and retail finance. For example:
• We have operated our subsidiary PT. Bussan Auto Finance (Indonesia), a retail finance company forYamaha motorcycles since 1997;
• We have ownership in Penske Automotive Group, Inc., previously named as United Auto Group, Inc.,an automobile dealership group in the United States, with a 16.3% voting share. By combining what welearned from our involvement in Penske Automotive Group, Inc. with our knowledge of the globalmarket, we continue to explore other opportunities to expand into retail dealership operations indeveloping markets such as Russia, China and India;
• We have been handling the logistics operations of automobile parts for some of Toyota’s manufacturingoperations in North America, Europe, India and China; and
32

• We acquired a 19.1% voting share in ASAHI TEC CORPORATION (Japan), a manufacturer of ductileiron cast parts and aluminum forged parts for major automakers in January 2007.
In our construction machinery and industrial system businesses, we have been acquiring and establishingdistributors and dealers in major overseas markets, in order to respond growing worldwide demand to theseproducts. In Australia, through Komatsu Australia Pty Ltd. (Australia), an associated company, we have engagedin distribution and leasing of construction machinery and mining equipment such as dump trucks and hydraulicshovel since 2001. We have also extended these businesses in other regions, through Road Machinery, LLC(United States) acquired in 2005 and KOMEK Machinery LLC (Russia) acquired in 2006. We are also engagedin trading and distribution of high-precision machine tools, manufacturing equipment and control systemssupplied by Japanese manufacturers. Jointly with FANUC LTD, we established Fanuc Roboshot Europe GmbH(Germany) in 2005, and jointly with Mori Seiki Co., Ltd, we acquired Ellison Technologies, Inc. (United States)in 2007.
Marine & Aerospace Business Unit
The Marine & Aerospace Business Unit, together with 13 subsidiaries and 28 associated companies, isengaged in the following business activities:
• sales, marketing and intermediary service of cargo vessels, tankers, container vessels, refrigeratorvessels, automobile carriers, LNG and LPG carriers, Floating Storage and Offloading (“FSO”) andFloating Production Storage and Offloading (“FPSO”) facilities as well as owning and operating,leasing and financing for these vessels and facilities; ship management services; an intermediary servicefor chartering vessels and sales of second hand vessels; and marketing equipment for vessels; and
• marketing and sales of passenger aircraft and cargo aircraft, helicopters, aircraft engine, defense-relatedequipment and aerospace systems; leasing of passenger aircraft and cargo aircraft and aircraft engines.
Our vessel and marine project related activities include marketing newly built vessels (mainly commercialvessels) to ship owners and shipping firms in Japan and overseas, ship management services, acting as broker forchartering vessels and for the sale and purchase of second hand vessels, and marketing equipment for vessels toshipbuilding companies.
We are engaged in energy-related marine projects, including joint ownership and operation of LNG vessels;and joint ownership and operations management of FSO and FPSO facilities. In addition, we arrange varioustypes of financing for our customers and/or those projects, such as syndicated loans involving internationalfinancial institutions for large scale transactions. We also provide direct loans to some of our clients.
The following are recent developments in energy-related marine projects businesses:
• In December 2007, Mitsui, NYK Bulkship (Europe) Ltd. and Teekay Corporation in a 3 companyconsortium, entered into a contract for the long term charter of four new LNG vessels from the AngolaLNG Project, which is developed by Chevron, Angola national oil company Sonangol and others.
• Together with the Infrastructure Projects Business Unit, this business unit set up a joint venture withPetrobras in Brazil, which owns drill ships for sub sea oil field development. This business unit arrangedthe building and chartering contracts of the drill ships.
In addition, this business unit owns and operates various vessels, by itself or jointly with trusted partners.
In our aerospace systems related activities, we provide and arrange operating leases and finance leases ofpassenger aircraft and cargo aircraft and aircraft engines to airlines in Japan and overseas. We are also engagedin the import and sale of helicopters and defense-related equipment. This business unit is an agent in Japan toAirbus S.A.S. of France and Bell Helicopter Textron, Inc. of the United States. In March 2008, Mitsui acquirednon-voting preferred shares in Japan Airline Corporation (“JAL”), convertible into common shares. Mitsui
33

believes this acquisition will contribute to the reinforcement of JAL’s business infrastructure such as renovationof its aircraft fleet and through this transaction, Mitsui envisages developing new business with JAL in future.
Chemical Segment
The Chemical Segment consists of the First Chemicals Business Unit (formerly the Organic ChemicalsBusiness Unit) and the Second Chemicals Business Unit (formerly the Plastics & Inorganic Chemicals BusinessUnit).
Gross profit and net income for this segment for the year ended March 31, 2008 were ¥110.3 billion or11.2% and ¥18.4 billion or 4.5% of our consolidated totals, respectively.
The Chemical Segment has 33 subsidiaries, including:
• P.T. Kaltim Pasifik Amoniak (Indonesia), Japan-Arabia Methanol Company Ltd. (Japan), Mitsui BussanSolvent & Coating Co., Ltd. (Japan), Mitsui AgriScience International S.A./N.V. (Belgium), MitsuiBussan Agro-Business Co., Ltd. (Japan), Daiichi Tanker Co., Ltd. (Japan) and Fertilizantes Mitsui S.A.Industria e Comercio (Brazil) in the First Chemicals Business Unit; and
• Mitsui Bussan Plastics Co., Ltd. (Japan), Nippon Trading Co., Ltd. (Japan), Salt Asia Holdings Pty. Ltd.(Australia) and Mitsui Bussan Frontier Co., Ltd. (Japan) in the Second Chemicals Business Unit.
It has 28 associated companies, including:
• Agro Kanesho Co., Ltd. (Japan) in the First Chemicals Business Unit; and
• TG Missouri Corporation (United States) and Advanced Composites Inc. (United States) in the SecondChemicals Business Unit.
First Chemicals Business Unit
Together with 15 subsidiaries and 11 associated companies, the First Chemicals Business Unit is engaged intrade, sales, distribution and production of the following commodities and related activities:
• Petrochemical businesses
— Natural gas chemicals: methanol, ammonia
— Chlor-Alkali: Ethylene Dichloride (“EDC”), Vinyl Chloride Monomer (“VCM”), caustic soda
— Basic petrochemicals: olefins, aromatics, Acetyls, Styrene Monomer (“SM”)
— Petrochemicals & fiber intermediates: Para-Xylene (“PX”), Purified Terephthalic Acid (“PTA”),Monoethylene Glycol (“MEG”), Acrylonitrile (“AN”),.
— Industrial chemicals: phenol, acetone, bisphenol A, Methyl Methacrylate (“MMA”), nylon,acrylates intermediates
• Specialty chemical businesses
— Detergent intermediates and oleochemicals, polyurethanes, colors & functional chemicals, rosin,aroma chemicals
• Agri science businesses
— Crop protection chemicals (herbicide, insecticide, fungicide, intermediates for these chemicals),feed additives
• Fertilizer businesses
— Urea, ammonium sulfate, phosphate rock, diammonium phosphate, fused magnesium phosphate,potash
34

In petrochemical products areas, the unit’s main activities is trading of the above-mentioned products inJapan and worldwide through extensive business relationships with customers and suppliers such as MitsuiChemicals, Inc., Toray Industries, Inc., Tosoh Corporation, Dow Chemical Company, BP p.l.c., and BayerAktiengesellschaft.
We have invested in manufacturing operations and logistic facilities. For example, we have:
• a 19.25% equity share in a joint venture, International Methanol Company (Saudi Arabia), whichcommenced commercial operation with a production capacity of 1 million tons per annum of methanolat the end of 2004;
• an ammonia producing subsidiary, P.T. Kaltim Pasifik Amoniak (Indonesia), which has a productioncapacity of 0.7 million tons per annum of ammonia;
• tank terminals in Ningbo, China; Bangkok, Thailand; Johor, Malaysia; and Merak, Indonesia; and
• a subsidiary and parcel chemical tanker operator Daiichi Tanker Co., Ltd. (Japan), which runs a fleetconsisting of 33 owned and chartered ships serving its customers.
This business unit has been successful in earning revenues by increasing market share in certain productssuch as olefins, aromatics and other plastic monomers. Moreover, the steady growth of demand forpetrochemicals in the world, particularly in China and other Asian countries, is driving earnings for this unit.
During the past several years, most worldwide petrochemical companies have been struggling to survivethrough drastic restructurings which include the reorganization of their sales structures and mergers andacquisitions. Furthermore, changes in the market structure of petrochemical products are ongoing includingincreasing demand from China and other Asian countries, rising material costs reflecting higher crude oil pricesand shifting in olefin production to the Middle East using cost-effective natural gas. In these operatingenvironments, we believe that we remain competitive with other Japanese general trading companies and plan tostrengthen our market position by expanding our trade volume and market share. Our sales channels to variouscustomers in diverse geographic areas enable us to make geographical and/or time swap arrangements. Ourglobal logistics services network functions as a competitive advantage over other Japanese general tradingcompanies in gaining more business transactions.
In agri science business, we have extended the distribution of agricultural chemical products worldwidethrough subsidiaries such as Mitsui Agri Science International sa/nv (Belgium).
In fertilizer business, we are engaged in import, export and offshore transactions involving various types offertilizers, fertilizer raw materials and phosphoric acid derivatives. In addition, this business unit runs a fertilizermanufacturing subsidiary, Fertilizantes Mitsui S.A. Industria e Comercio (Brazil).
Second Chemicals Business Unit
The Second Chemicals Business Unit has 18 subsidiaries and 17 associated companies and is engaged insales, trade, distribution and production of the following commodities and related activities:
• Inorganic chemical business
— basic inorganic materials such as sulfur, sulfuric acid, salt, titanium ore and iodine
— inorganic products such as soda ash, caustic soda, catalyst, industrial gas and titanium oxide
• Plastics business
— electronics materials such as electrolytic copper foil, optical fiber, and high-purity chemicalsemployed in semiconductor production
35

— plastic materials and products such as polyvinyl chloride, elastomers, polyolefin, ABS resin,engineering plastics, polystyrene, plastic food containers, wrapping materials, industrial films andcarbon fiber
— additives of plastic such as elasticizer, stabilizer and pigment
— SCM related businesses for production and distribution of office automation equipment, cellphone and electric appliances
In the inorganic raw materials field, this business unit operates logistics systems for various industries inJapan and overseas. For example, we export sulfur, a byproduct of petroleum refining, to Asian countries, byoperating specialized tankers.
In order to overcome various unfavorable economic conditions such as depletion in the supply of mineralresources or an increase in acquisition cost of raw materials from our existing suppliers, we have been seekingopportunities to participate in new supply sources. We reallocated resources by restructuring logistics operations,and built up our capabilities in sulfur, soda ash, and fiberglass materials in Asia, primarily in China.
While we have been expanding the logistics network of our salt business in China which complements ourexisting sea salt joint venture business in Shark Bay, Australia, Mitsui acquired a major share in the Onslow saltfield in Australia in August 2006. As a result, our annual salt production capacity increased to 3.8 million tons,which enable us to secure a stable supply for the chlor-alkali industry in Japan and other Asian countries.
In the plastics field, this business unit has traditionally handled various kinds of raw plastic materials andplastic products in domestic and overseas markets. This business unit has also handled newly developedelectronic materials and products as well as SCM services. We expanded SCM services for printers and liquidcrystal display panels as well as reinforced our resin compound operations in China, Southeast Asia, the UnitedStates and Europe.
With the focus of economic activity shifting to Asia, this business unit enhanced its business in China.Mitsui Plastics Trading (Shanghai) Co., Ltd., an engineering plastics and related manufacturing materials salescompany established in 2003, is a representative case. In the plastic materials and products market where thescope of their usage is expanding, other Japanese general trading companies are our competitors.
In Japan, 3 sales subsidiaries merged to form MITSUI BUSSAN PLASTICS TRADE CO., LTD. in April2008, for the purpose of sales enhancement and efficient business operations.
Energy Segment
The Energy Segment consists of two business units, Energy Business Units I and II. Effective from April2007, the former Energy Business Unit was divided into Energy Business Units I and II, to build structure forcomprehensive strategy based on the view for worldwide energy resources, combined with the transfer ofbusinesses of coal, nuclear energy, carbon credits, and hydrogen and fuel cell from the former Iron & Steel RawMaterials and Non-Ferrous Metals Segment.
Gross profit and net income for this segment for the year ended March 31, 2008 were ¥219.3 billion or22.2% and ¥124.1 billion or 30.3% of our consolidated totals, respectively.
This segment has:
• 32 subsidiaries, including Mitsui E&P Australia Pty Limited (Australia), Mittwell EnergyResources Pty., Ltd. (Australia), Mitsui E&P Middle East B.V. (Netherlands), Mitsui Oil ExplorationCo., Ltd. (Japan), Mitsui Gas Development Qatar B.V. (Netherlands), Mitsui LNG Nederland B.V.(Netherlands), MitEnergy Upstream LLC (United States), Mitsui Sakhalin Holdings B.V. (Netherlands),
36

Mitsui Oil Co., Ltd. (Japan), Mitsui Liquefied Gas Co., Ltd. (Japan), Kokusai Oil & Chemical Co., Ltd.(Japan) and Mitsui Coal Holdings Pty. Ltd. (Australia), Mitsui LNG Nederland B.V. (Netherlands) ;and,
• 6 associated companies, including Japan Australia LNG (MIMI) PTY. Ltd. (Australia), UnitedPetroleum Development Co., Ltd. (Japan) and BHP Mitsui Coal Pty., Ltd.
Energy Business Unit I is engaged in:
• Exploration and production of oil and gas, coal, uranium and other energy resources;
• Trading of oil, petroleum products, coal, uranium and other energy resources;
• Petroleum refining and marketing of gasoline, liquefied petroleum gas (“LPG”) and other petroleumproducts in the Japanese domestic market; and
• Development of carbon credit business and other environmental related business.
Energy Business Unit II is engaged in:
• Development of liquefied natural gas (“LNG”) projects;
• Trading of LNG; and
• Development of biomass ethanol and other next generation energy sources.
The Energy Segment is engaged in various LNG, natural gas and oil development projects which requirelong lead-times for their development and implementation. We are involved in the following five LNG projectscurrently in operation:
• Abu Dhabi Gas Liquefaction Limited, in which we hold a 15% interest in natural gas liquefaction andLNG exporting activities, and which has some 5 million tons per annum LNG production capacity;
• Northwest Shelf JV (“NWS JV”) in Australia, in which we hold an 8.33% interest in natural gasproduction and liquefaction and LNG exporting activities, and which has some 11.7 million tons perannum production capacity;
• Qatar Liquefied Gas Company Ltd., in which we hold a 7.5% interest in natural gas liquefaction andLNG exporting activities, and which has some 9.6 million tons per annum production capacity. We alsohold a 1.5% interest in Qatar Liquefied Gas Company Ltd. 3, which is expected to start production inmid 2009 with some 7.8 million tons per annum production capacity;
• Oman LNG L.L.C., in which we hold a 2.77% interest in natural gas liquefaction and LNG exportingactivities, and which has some 6.6 million tons per annum production capacity; and
• Equatorial Guinea LNG Company, S.A., in which we hold an 8.5% interest in natural gas liquefactionand LNG exporting activities, and which has some 3.4 million tons per annum production capacity andstarted commercial production in May 2007.
Under long term contracts, the NWS JV supplies most of its LNG output to Japanese electricity and gas utilitycompanies. Korea has been also a long lasting market. In addition, in May 2006, the NWS JV started LNG supplyto China, via the LNG terminal in Guangdong. Also with respect to NWS JV, we made a final investment decisionfor the fifth train in June 2005 following the successful production start-up of the fourth LNG producing train in2004. The capacity of this fifth train is planned to be 4.2 million tons per annum and is scheduled to begin in thelatter half of 2008. As of March 2008, construction of the fifth-train project is progressing as scheduled. An “LNGproducing train” is a set of facilities in a liquefaction plant to produce LNG from natural gas.
In the Sakhalin II project, we held a 25% interest in Sakhalin Energy Investment Company Ltd. (Bermuda) asof March 31, 2007. Since 1999, seasonal oil production continued from the Molikpaq facility on the Astokhskoyefield, offshore Sakhalin Island. Sakhalin Energy Investment Co., Ltd. announced on May 15, 2003, that it would
37

begin the Phase II development of the Sakhalin II Project. This announcement marked the beginning of the full-scale development of the Piltun-Astokhskoye oil field aimed at year-round crude oil production, and the Lunskoyegas field, including construction of a two-train LNG plant in the south of Sakhalin Island for export to the AsiaPacific LNG markets based on long-term contracts. At its peak, the facility is expected to produce 60 million barrelsper annum of crude oil and 9.6 million tons per annum of LNG.
The total required funds for the Phase II development of the Sakhalin II Project was revised to beUS$20 billion, double the original budget of US$10 billion, due to increased expenses related to changes infacility design and construction delays, as well as the rising procurement costs of labor and materials.
In April 2007, the Sakhalin II Amended Development Budget for the phase II of the project was approvedby the Supervisory Board, a special committee which consists of the representatives of Russian Federation,Sakhalin Oblast, Sakhalin Energy Investment Company. And the Ministry of Natural Resources of the RussianFederation had approved the revised Environmental Action Plan (“EAP”) prepared by Sakhalin EnergyInvestment Company Ltd.
In addition, in April 2007, Mitsui, Royal Dutch Shell plc (“Shell”) and Mitsubishi Corporation(“Mitsubishi”) signed a Sale and Purchase Agreement with OAO Gazprom (“Gazprom”) to transfer the shares inSakhalin Energy Investment Company Ltd. This transaction implements a protocol signed on December 21, 2006in Moscow. Under its terms, the shareholders of Sakhalin Energy Investment Company Ltd. consist of Gazprom(50% plus 1 share), Shell (27.5% minus 1 share), Mitsui (12.5%) and Mitsubishi (10%). The whole purchaseprice was US$7.45 billion, and Mitsui’s proportionate share was US$1.8625 billion. Under the new combination,the four shareholders agreed to make every effort for completion of Sakhalin II project aiming at timely start-upof LNG delivery to customers in Japan, Korea, and North American West Coast who have already committed topurchase. In addition the four shareholders entered into an agreement that covers future Sakhalin oil and gasexploration and production opportunities and the building of Sakhalin II into a regional oil and LNG hub.
Sakhalin Energy Investment Company has been making every effort to achieve the earliest possible start ofLNG shipments following completion of construction in 2008 and start-up of the LNG liquefaction plant.Sakhalin Energy Investment Company Ltd. has concluded LNG sales contracts to customers in Asia Pacific LNGmarkets, including those contracts with buyer’s option, up to virtually its LNG production capacity. The latestexecution of an LNG sales contract was made in February 2007, with Osaka Gas Co., Ltd.
This segment holds interests in other LNG projects which are under construction. Through our subsidiary,Overseas Petroleum Corporation (Japan), we own a 2.3% interest in the Tangguh LNG project in Indonesia,which is expected to start production in 2009 with production capacity being 7.6 million tons per annum.
With respect to our LNG related operations, we have entered into various long term sales contracts, basedon “take or pay” conditions, with customers such as Japanese utility companies. We believe the worldwide LNGbusiness has been undergoing gradual structural changes since the late 1990s as follows:
• Exploration and development of natural gas and production of LNG require significant capital andfinancial commitments. Moreover, this involves a broad range of logistical and technological expertise,including linking suppliers to distributors and consumers while developing plants in order to efficientlyextract and liquefy the natural gas for transportation and then re-gasifying the LNG. Up until themid-1990s, purchase commitments by buyers with full “take or pay” obligations for a period of 20 yearsor more had been an essential element for equity holders, distributors and sellers of LNG projects tomake the capital and financial commitment to build LNG production facilities. These equity investorshad resisted making a capital and financial commitment without being able to fully secure stable long-term purchase commitments. In recent years, however, equity holders of several LNG projects havebeen making investments without fully securing long-term purchase commitments from buyers.
38

• Due to technological innovations in the last decade, LNG producers have successfully reduced capitalcosts with respect to the construction of LNG production plants and LNG vessels. Technologicalinnovation has also enabled the producers to increase the design capacities of LNG production plantsand LNG vessels allowing them to benefit from economies of scale. These technological developmentsallow LNG to be more competitive with other types of energy sources.
• In response to the needs of LNG buyers, the LNG spot market has been expanding, whereby thepercentage of spot trades in worldwide LNG contracts rose to 20% in 2007 from 1.3% in 1992.
• In addition to the traditional core LNG markets in Japan, the Republic of Korea and Taiwan, the marketis rapidly expanding in Europe and the United States. At the same time, new markets have beenemerging in countries such as China and India due to an increasing demand for electricity. Consideringthe sizable economies of these countries and the increasing popularity of LNG as a “clean energy”source, the LNG market has been developing rapidly worldwide.
The recent structural changes in the LNG industry, including those mentioned above, continue to have amixed effect on our business operations. For example, due to the reduction in capital costs from technologicalinnovations, the emergence of the spot LNG market and other factors, not only has the LNG industry becomemore competitive among existing energy-related companies, but it has also seen an increase in new entrants.However, if we focus on the period up to 2010, we believe that overall tight supply-demand balance willcontinue, because there will be a limited number of start-ups in commercial operations from expansion ofexisting LNG producing facilities and/or newly developed facilities during the period.
Identifying, exploring and developing oil and gas reserve prospects are key factors to success for the EnergySegment. The principal strategic regions for this business are Oceania, Southeast Asia, the Middle East and NorthAmerica.
Oceania
The development and production projects of offshore oil fields of the Enfield and the Vincent in whichMitsui E&P Australia Pty Limited (Australia) has participating interests are the core projects of this segment interms of large scale capital expenditures next to the Sakhalin II project.
In March 2004, Mitsui E&P Australia Pty Limited (Australia) acquired a 40% interest in each of WA-28-Land exploration block WA-271-P located in the North West Shelf area in Australia, which together containedthree undeveloped oil fields, Enfield, Vincent, and Laverda. The commercial production from the Enfield OilField started in July 2006. In October 2006, one of the major production wells was shut-in due to unexpectedsand production and early water breakthrough. With Woodside Petroleum Ltd., an operator of the project, MitsuiE&P Australia Pty Limited conducted drilling of additional wells and work-over of the existing well, whichreturned to production in September 2007. Following the completion of the work-over, the average productionrate during 2007 was approximately 47,000 barrels per day. Due to sand production at two other major oil wellsobserved since December 2007, the average production rate during the first quarter of 2008 was below 29,000barrels per day. The joint venture was conducting work-over of those wells as of June 2008. At the same time,the Vincent oil field, adjacent to the Enfield oil field, is under development and is expected to start production in2008, following the final investment decision in March 2006 with total development cost of approximatelyUS$720 million.
Mitsui E&P Australia Pty Limited owns a 35% interest in Tui area oil fields offshore North Island of NewZealand. Commercial production of the Tui area oil project started with a designed production capacity of 50,000barrels per day in July 2007. It also owns an interest in the Casino gas & condensate field offshore SouthAustralia which started commercial production in February 2006.
In June 2007, Wandoo Petroleum Pty. Ltd. sold its entire Australian upstream oil and gas producinginterests, including Cliff Head oil field offshore Western Australia and BassGas project (Yolla gas & Condensatefield, offshore Victoria).
39

Southeast Asia
Mitsui Oil Exploration Co., Ltd. (Japan) has been actively engaged in oil and natural gas exploration,development and production projects in Thailand and neighboring Southeast Asian countries as well as in theMiddle East. In June 2005, Mitsui Oil Exploration Co., Ltd. acquired assets in offshore Thailand, a 46.34%interest in the B8/32 Concession and the adjacent Block 9A Concession, jointly with a partner in Thailand. Thepurchase price was US$820 million, and it has approximately 40% share. In October 2007, Mitsui OilExploration Co., Ltd. and its co-concessionaires agreed with the Thai Ministry of Energy to extend theproduction period of four offshore blocks (Block No. 10—13) in the Gulf of Thailand to 2022.
Together with Mitsui Oil Exploration Co., Ltd. (Japan), the Energy Segment continues putting a highpriority on expanding our oil and gas equity reserves. In March 2006, Mitsui agreed with Mitsui Engineering &Shipping Co., Ltd. to purchase 6% of the total issued shares of Mitsui Oil Exploration Co., Ltd. of which Mitsuiheld a 44.35% share prior to concluding the agreement. As a result of the transactions, Mitsui Oil ExplorationCo., Ltd. became a subsidiary of Mitsui with a 50.34% voting share. As of March 31, 2008, Mitsui’s ownershipinterest was 51.03%, reflecting an additional share purchase transaction.
Middle East
In Oman, Mitsui E&P Middle East B.V. (Netherlands) has 35% participating interests in the Block 27 oilfields which started commercial production in June 2006 and the Block 9 oil fields in production.
North America
In April 2006, MitEnergy Upstream LLC (United States) was established by Mitsui, Mitsui & Co. (U.S.A.)Inc. and Mitsui Oil Exploration Co., Ltd., to acquire 50% share of an undivided interest in oil and gas leaseholdassets of Pogo Producing Company located offshore in the Gulf of Mexico. The purchase price amounted to¥53.8 billion. More than half of total 85 blocks are currently producing oil and gas, with an approximate dailyproduction capacity of up to 12,000 barrels of oil equivalent, thus we expect a relatively short payback period.
In addition, seeking to replenish and enhance our oil and gas reserves, we are engaged in explorationactivities in the above-mentioned regions as well as Mozambique and Namibia.
Reflecting the reduction of Mitsui’s interest in the Sakhalin II project as well as production of 55 millionbarrels of oil equivalent (“BOE”) during the year ended March 31, 2008, despite the above-mentioneddeveloping activities, our oil and gas reserves significantly decreased from 724 million BOE at the end of March2007 to 427 million BOE at the end of March 2008. See “Item 4.D. Property, Plants and Equipment—Oil andGas Producing Activities” and “Supplemental Information on Oil and Gas Producing Activities” to theconsolidated financial statements included elsewhere in this annual report on Form 20-F.
We participate in oil and gas related joint venture activities, typically as a “non-operator” equity holder,relying on our project partner as an operator which is responsible for managing operation including theexploration, development and production of oil and gas resources. In these projects, we, as a non-operator,collaborate with partners with sufficient technical knowledge and expertise, to reduce operational risks, and havecontrols over focused criteria including the timing and scheduling of the development, capital expenditures,production of the reserves, and the safety and environmental standards used in connection with these jointventures. Also see the discussion on our exploration, development and production of mineral resources and oiland gas in “Item 3.D. Risk Factors.”
With respect to oil and gas exploration and production (“E&P”) business, in our view, the key to success is toconstantly increase, or at a minimum maintain, certain volumes of oil and gas reserve prospects as is the commonpractice for international oil and gas companies. However, despite our management’s intensive focus on expandingour E&P business activities, our oil and gas reserves are still far less than that of the national oil companies of oilproducing countries and major oil and gas companies. Other Japanese companies that participate in E&P activities
40

do not commonly disclose their proved oil and gas reserves. Based on the limited proved oil and gas reservesinformation of other Japanese E&P companies that are publicly available, we believe that we generally have higheramounts of proved oil and gas reserves as compared to most Japanese E&P companies. Accordingly, we believethat we are competitive with other Japanese E&P companies.
The following tables provide information on our investments in coal resource projects undertaken by theEnergy Segment. For more information on our mining activities including production and reserves, See“Item 4.D. Property, Plants and Equipment—Mining Activities.”
COAL
Joint Venture or Investee(1)Mitsui’s Subsidiary orAssociated Company(2) Name of Mines(3) Location
Mitsui’sPercentage of
Ownership
Other Major Participantsand Their Percentages of
Ownership
BHP Mitsui Coal Pty. Ltd. BHP Mitsui Coal Pty.Ltd.
Poitrel SouthWalker Creek
Queensland,Australia
20.00% BHP Billiton 80.00%
Bengalla Joint Venture Mitsui Coal HoldingsPty. Ltd.
Bengalla New SouthWales,Australia
10.00% Rio TintoWesfarmersTaiwan Power
40.00%40.00%10.00%
Kestrel Joint Venture Mitsui Coal HoldingsPty. Ltd.
Kestrel Queensland,Australia
20.00% Rio Tinto 80.00%
Dawson Joint Venture Mitsui Coal HoldingsPty. Ltd.
Dawson Queensland,Australia
49.00% Anglo American 51.00%
German Creek Joint Venture Mitsui Coal HoldingsPty. Ltd.
German Creek Queensland,Australia
30.00% Anglo American 70.00%
(1) The term “Investee” refers only to BHP Mitsui Coal Pty. Ltd.(2) “Mitsui’s Subsidiary or Associated Company” indicates names of the companies through which we own our interests in the joint
ventures or the investee. BHP Mitsui Coal Pty. Ltd. is a Mitsui associated company in which we directly own a 20% stake.(3) “Name of Mines” indicates the names of principal producing mines.(4) In addition to the above-mentioned coal mining projects, through Mitsui Coal Holdings Pty. Ltd., we have small interests in two projects
in Australia operated by Anglo American, namely, Moranbah North Joint Venture in Queensland and Drayton Joint Venture in NewSouth Wales. Our ownership percentage and annual production capacity of Moranbah North Joint Venture and Drayton Joint Venture are4.75%, 4 million tons and 3.83%, 5 million tons, respectively.
Regarding further information and discussion on development of our coal mining projects, see “Item 4.A.History and Development of the Company—Capital Expenditure”, “Item 5.A. Operating Results—OperatingResults by Operating Segment—Energy Segment” and “Item 5.B. Liquidity and Capital Resources—InvestmentPlans and Financial policies of the Medium Term Management Outlook.”
Revenues from oil and gas producing activities and coal mining activities account for a critical portion ofthis segment. The table below sets forth the break down of revenues of the Energy Segment.
Revenues
Billions of Yen
Revenues from Sales of Products
Revenues fromSales of Servicesand Other Sales
Total RevenuesYears Ended March 31,
Revenues fromOil and GasProducingActivities
Revenues fromCoal Mining
Activities
Revenues fromSales of
Other Products(*)
Commissions andTrading Margins on
Intermediary Servicesand Other
2008 . . . . . . . . . . . . . . . . . . . . . . . . ¥248.7 ¥34.3 ¥986.2 ¥14.6 ¥1,283.82007 . . . . . . . . . . . . . . . . . . . . . . . . 99.1 27.9 941.6 1.9 1,070.52006 . . . . . . . . . . . . . . . . . . . . . . . . 35.4 26.6 767.5 12.9 842.4
(*) Revenues from sales of other products mainly consist of sales of crude oil and petroleum products.
41

The Energy Segment is engaged in oil trading operations conducted by Mitsui and Mitsui Oil (Asia) HongKong Ltd. (Hong Kong, China). This segment has a 20% minority share in Westport Petroleum, Inc. (UnitedStates).
The international markets for crude oil and petroleum products are highly competitive and volatile. Inmaintaining our competitive edge under these circumstances, it is critical for us to maintain good relationshipswith customers and suppliers as well as to mitigate price risks by utilizing hedging tools such as the futuresmarkets. We are active in seeking to secure long-term offtake contracts of petroleum products such as fuel oiland condensate to be sold to worldwide companies including Japanese utility and refining companies. Long-termofftake contracts are sales and purchase contracts for various commodities, such as crude oil and petroleumproducts, entered into by suppliers and buyers, or “offtakers”, of such commodities for more than one year.Concurrent with the offtake contracts, the sellers of such commodities usually enter into financing arrangementswhereby the sales proceeds from such commodities are used for repayment.
Within Japan, we are also engaged in refining and sales of oil and gas related products through Mitsui OilCo., Ltd. (Japan), our oil sales subsidiary, and Kyokuto Petroleum Industries, Ltd. (Japan). Kyokuto PetroleumIndustries, Ltd. is a refinery jointly owned (50:50) by the ExxonMobil Corp. Group and Mitsui Oil Co., Ltd..
In the domestic refining and marketing business for oil and gas related products, we have faced severecompetition from domestic oil refining and distributing companies due to the structural surplus situation forrefining capacity in Japan. Kyokuto Petroleum Industries, Ltd. and Mitsui Oil Co., Ltd. are in relatively soundfinancial situations owing to the extensive restructuring of inefficient assets and work force, and are pursuingefficient and competitive operations. In the LPG gas business, Mitsui Liquefied Gas Co., Ltd. (Japan) mergedwith Marubeni Liquefied Gas, Inc. in April 2008 to form Mitsui Marubeni Liquefied Gas Co., Ltd. Mitsui’sownership interest in the new company is 60%. It concentrates on improvement in operational efficiency andselling capacity by consolidating whole procedures of domestic LPG distribution from importing to retail.
We are also exploring various new business opportunities in the emerging new energy area. Mitsui expectsbio-ethanol to be a significant renewable fuel in the future, and world demand to rise. In April 2006, Mitsuireached an agreement with Petróleo Brasileiro SA (“Petrobras”) to jointly carry out a feasibility study forproduction of bio-ethanol and related products in Brazil and for the marketing of such products in theinternational market. In July 2008, Mitsui, Petrobras and another Brazilian company reached agreement to jointlyset up and invest in a project company to develop a bio-ethanol production project.
As one of new business areas, this segment has been developing carbon credits business based on theframework of the Kyoto Protocol and implementing Clean Development Mechanism (“CDM”) projects. CDM isan arrangement under the Kyoto Protocol allowing industrialized countries with a greenhouse gas reductioncommitment to invest in emission reducing projects in developing countries as an alternative to what areconsidered more costly emission reductions in their own countries.
Foods & Retail Segment
The Foods & Retail Segment consists of one business unit, the Foods & Retail Business Unit, which has 27subsidiaries including Wilsey Foods Inc. (United States), MITSUI FOODS CO., LTD. (Japan), MCM FoodsB.V. (Netherland), Mitsui Norin Co., Ltd. (Japan), DAI-ICHI BROILER CO., LTD. (Japan), and VENDORSERVICE CO., LTD. (Japan); and 14 associated companies including Mikuni Coca-Cola Bottling Co., Ltd.(Japan), Mitsui Sugar Co., Ltd. (Japan), Kadoya Sesame Mills Inc. (Japan) and MULTIGRAIN AG (Brazil).
Gross profit for this segment for the year ended March 31, 2008 was ¥81.2 billion or 8.2% of our consolidatedtotal. This segment recorded a net loss of ¥10.5 billion or 2.6% of our consolidated total.
42

The Foods & Retail Business Unit engages in:
• Import and domestic/offshore trade of wheat, barley, soybeans, corn, rapeseed, fats and oils, raw sugar,rice and investments in these food raw material production and distribution businesses abroad;
• Import and domestic/offshore trade of processed foods such as canned products, frozen foods andcondiments, liquor, beverages such as coffee, tea and juice, dairy products, foodstuffs such as marineproducts, animal products and vegetables and investment in overseas dairy farming businesses;
• Import and domestic trade of packaging, wrapping materials, and miscellaneous daily goods;
• Manufacture of beverages, beverage ingredients, broiler chicken raising;
• Domestic distribution and sales through the nationwide wholesaler subsidiary MITSUI FOODS CO.,LTD. (Japan); and
• Support services, such as supply chain management including logistics management, and productplanning and development for retailers.
The Foods & Retail Business Unit is involved in a wide range of fields in a value chain of foods, from theglobal procurement of food material and production of food products to the traffic and wholesale of foods,packaging materials, and sundry goods.
To secure a stable supply source, we purchase grain, oilseeds, and raw sugar from the United States,Canada, Brazil Australia, Thailand and China and sell them in Japan and other Asian countries. We sell coffee toJapan and United States from our production bases primarily in Brazil. We purchase raw materials for beverages,such as tea leaves and juice, marine products, animal products, and dairy products from major supply sourcesaround the world and deliver them primarily to Japan. We are also engaged in domestic broiler chicken raising,processing, and sales through a subsidiary DAI-ICHI BROILER CO., LTD. (Japan, currently named PRIFOODSCO., LTD, as a result of a business consolidation in April 2008).
We have positioned the United States as our main base of operations and the core of our global food supplystrategy. In collaboration with Mitsui & Co. (U.S.A.), Inc., this business unit has developed and maintained thefollowing businesses:
• In the cereals and grains area, we have formed a joint venture, United Harvest, LLC, with CHS Inc., anagricultural cooperative-based company in the United States. Our exports of wheat from the UnitedStates are among the largest, amounting to approximately 4 million tons per annum.
• Ventura Foods, LLC, another joint venture formed with CHS Inc., is one of the largest suppliers ofcooking oils for the institutional market in the United States. We invest in this company throughWILSEY FOODS, INC. (United States).
In food-manufacturing operations, Mitsui Norin Co., Ltd. (Japan), which became our subsidiary during the yearended March 31, 2004, is engaged in beverage business as one of the major manufacturers of tea leaves in Japan.
Competition varies depending on raw materials and products in the upstream areas of grain, feed, sugar andfood materials, but is primarily based on price and quality of products. Many Japanese general tradingcompanies, international producers, and traders are competitors to varying degrees with respect to most of thefood products we handle.
In 2007 and 2008, this business unit made several investments in food production abroad, such as adiversified farming company in Brazil, rapeseed oil producing facilities in North America, a dairy foodproducing company in New Zealand and a shrimp farm company in China. This business unit aims to secure safeand stable supply sources of food, considering rapidly increasing food demand from emerging countries andconflict in supply capacity for bio-fuel purpose production. The individual investment amount is relatively small,but this business unit intends to expand market channels to Japan and Asia, starting from the above-mentionedjoint operations with the most reliable partners in major food material producing countries.
43

In overseas wholesale operations, MCM Foods B.V (Netherland) engages in the import and sales of cannedfood products and groceries in England and other European market.
MITSUI FOODS CO., LTD. (Japan) plays a vital role in this unit’s wholesale operations. Its wide-rangebusiness activities and customers include general merchandise stores, supermarkets, convenience stores, andcatering and restaurant chains throughout Japan, focusing on processed food and liquor transactions. In thefoodstuffs distribution field, the needs for reduced distribution costs, secure temperature-controlled supply, andfaster delivery are becoming more sophisticated and diverse. In April 2006, MITSUI FOODS CO., LTD. andMitsui agreed with KOKUBU & CO., LTD. (“KOKUBU”), a major Japanese food wholesaler, to form abusiness alliance, which includes support by KOKUBU for improvement of management and operations ofMITSUI FOODS CO., LTD. and cooperation in product categories to be reinforced by both companies. InOctober 2007, this business unit transferred 70% of the shares of Hokushuren Co., Ltd. (Japan), formerly a foodsand liquor wholesale subsidiary, to KOKUBU, following transfer of MITSUI FOODS CO., LTD.’s business inthe Hokkaido area (excluding Seven & i Holdings Co., Ltd.-related businesses) to Hokushuren Co., Ltd.
Mitsui maintains a comprehensive alliance with Seven & i Holdings Co., Ltd., Japan’s nationwidediversified retailer, which mainly engages in convenience stores, general merchandise stores, department stores,restaurant chains, retail banking service. Seven & i Holdings Co., Ltd. maintains operation in China such asSEVEN-ELEVEN (BEIJING) established in April 2004.
Mitsui offers the following supply services to Seven & i Holdings Co., Ltd. through our domestic subsidiaries,such as MITSUI FOODS CO., LTD., Retail System Service Co., Ltd. and VENDOR SERVICE CO., LTD.
• supply sundry goods and consumables, such as processed food, liquor, fast food, toys, and games, tomore than eleven thousand 7-Eleven stores in Japan;
• supply food materials, containers, and packaging materials to vendors who supply boxed lunches,pre-cooked meals, and processed food to 7-Eleven stores in Japan;
• supply various temperature-controlled products to 7-Eleven stores in Japan; and
• supply cold products through the affiliate company Beijing Sanxin Refrigeration Logistics Co., Ltd. to7-Eleven stores in Beijing.
As of end of February 2008, Mitsui owned 1.70% of Seven & i Holdings Co., Ltd.’s outstanding shares.Mitsui purchased the shares for a total cost of ¥50 billion in 2005, seeking to strengthen business ties with them.
Our competitors in the wholesale and retail businesses are mainly general trading companies in Japan. In thetraffic area, our competitors are also traffic companies that operate third-party logistics providing customized andintegrated warehousing and transportation services. In domestic wholesaling, there has been fierce competitionamong suppliers, and from time to time they conduct mergers and acquisitions to increase revenues and reducelogistics costs.
Consumer Service & IT Segment
This segment is comprised of the First Consumer Service Business Unit; the Second Consumer ServiceBusiness Unit; and the IT Business Unit. Effective April 2007, the First and the Second Consumer ServiceBusiness Units were established by reorganizing the former Lifestyle Business Unit and the former ConsumerService Business Unit.
Gross profit and net income for this segment for the year ended March 31, 2008 were ¥116.7 billion or11.8% and ¥12.0 billion or 2.9% of our consolidated total, respectively.
44

This segment owns 37 subsidiaries including:
• Mitsui Bussan Inter-Fashion Ltd. (Japan) and Kids Station Inc. (Japan) in the First Consumer ServiceBusiness Unit;
• BUSSAN REAL ESTATE CO., LTD. (Japan) and MBK Real Estate Europe Limited (United Kingdom)in the Second Consumer Service Business Unit; and
• Telepark Corp. (Japan), Mitsui Knowledge Industry Co., Ltd. (Japan), J-SCube INC. (Japan) and MitsuiElectronics Inc. (Japan) in the IT Business Unit.
And it has 37 associated companies including:
• ALCANTARA S.p.A. (Italy), QVC Japan Inc. (Japan), AIM Services Co., Ltd. (Japan) and SogoMedical Co., Ltd. (Japan) in the First Consumer Service Business Unit and
• Sumisho & Mitsuibussan Kenzai Co., Ltd. (Japan) in the Second Consumer Service Business Unit; and
• Nihon Unisys, Ltd. (Japan), Moshi Moshi Hotline, Inc. (Japan), Brightstar Logistics Pty. Ltd. (Australia)in the IT Business Unit.
First Consumer Service Business Unit
Together with 14 subsidiaries and 20 associated companies, the First Consumer Service Business Unit isengaged in domestic, import, export and offshore services, trading and manufacturing of the following:
• media-related service business including broadcasting, content service, television shopping channels,software service, amusement business and Internet-based marketing service;
• outsourcing services including catering, uniform rental, building maintenance, temporary personnelservice and child care service;
• medical service and health care related businesses such as nursing care-related services, clinic facilitiesand medical-related information service;
• apparel products, including development and manufacturing of those products; and brand merchandize-related businesses including equity participation in joint ventures with brand owners and brandlicensing; and
• consumer goods including beauty and health products; and interior and living items.
In the media-related service business, as a consumer service and content provider, we provide televisionshopping services operated by an associated company, QVC Japan, Inc. (Japan), which was established jointlywith QVC Inc. of the United States; and an entertainment and educational channel for children and parentsoperated by Kids Station Inc. (Japan), our subsidiary, both of which are delivered over cable or digital satellitebroadcast networks. Our BS digital high definition free television channel subsidiary, World Hi-Vision Channel,Inc. started broadcasting in Japan in December 2007. This business unit engages in development of businessopportunities by accessing from broadcasting business to Internet and mobile-related businesses.
In the outsourcing businesses, AIM Services Co., Ltd. (Japan), an associated company jointly establishedwith ARAMARK Corporation in the United States, has provided a variety of services in Japan since 1976. Itsmajor businesses are contract food service and related support services for companies, schools, hospitals andsocial welfare facilities. In December 2005 it acquired MEFOS Ltd, a provider of hospital food service, at 100%share ownership. Domestic food service market has stagnated and mergers and acquisitions by leading companiesare ongoing. It is also engaged in refreshment services for offices, design, cleaning and facilities management,uniform rental and contract staffing to dining facilities.
We position medical and healthcare business as a business domain subject to company wide intensification,and integrated the whole medical and pharmaceutical businesses within this business unit. Mitsui acquired 5% ofthe outstanding shares in Recruit Co., Ltd. for ¥27 billion in February 2007. Recruit Co., Ltd. mainly conducts
45
business in the two areas of comprehensive staffing services and information services. Mitsui and Recruit Co.,Ltd. entered into a business collaboration agreement, under which both have developed new businessopportunities such as senior-care, newly developed medical businesses and medical related information services.This business unit handles pharmaceutical businesses which formerly the First Chemicals Business Unitshandled.
In the apparel products and textile field, we provide services to accommodate developments in the fashionand apparel markets in:
• original equipment manufacturing (“OEM”) business for apparel manufacturers; and
• brand name products as well as brand licensing businesses.
In the field of apparel and OEM, we play roles at various stages in the value chain, including design,planning and procurement of materials as well as sewing and processing. To minimize costs and enhance quality,we work with apparel makers and their affiliated companies to select the optimal materials and processing sitesfrom a variety of measures available in Japan, Europe, the Americas, Asia and other areas. Among others, weconsider China as an important manufacturing base and also a significant consumer market as well.
With respect to brand businesses in Japan, we are engaged in both license and import business transactionsinvolving internationally well-known branded merchandise from Europe and the United States such as Burberry,Paul Stuart and Max Mara. With overseas brand owners, we enter into license agreements to retain our exclusivemarketing rights or to sublicense certain rights including marketing and manufacturing rights to apparel makers.We, if necessary, establish joint ventures with the brand owners, which control license arrangements or distributeimported products in order to establish nationwide sales network.
In the business area of consumer goods, responding to the changes in lifestyles, we seek new materials andnew suppliers, arrange effective distribution methods and develop attractive brands. We import high-qualityconsumer goods such as Maglite hand flashlights.
Second Consumer Service Business Unit
Major business areas of this business unit, including 11 subsidiaries and 10 associated companies, consist ofthe following:
• real estate development including construction, sale and leasing of houses, condominiums, commercialfacilities, senior housing and office buildings and related construction material businesses;
• industrial materials such as pulp, paper and specialty fiber products.
Real estate development businesses include the following activities:
• Mitsui engages in development of condominium and commercial property in the Tokyo metropolitanarea. Mitsui Bussan House-Techno, Inc. (Japan) had engaged in the high-end home units business;however, due to the shrinking market in Japan, it decided to withdraw from the business in August 2006.
• Mitsui, BUSSAN REAL ESTATE CO., LTD. (Japan) and MBK Real Estate Europe Limited (UnitedKingdom) engage in real estate sales, leasing, management and development in Japan and Europe.
• An associated company, Sumisho & Mitsuibussan Kenzai Co., Ltd. (Japan), supplies constructionmaterials in the domestic market.
In the business of industrial materials, we trade woodchips and pulp; furthermore, we develop severalafforestation projects in Australia, some of which are jointly developed with several Japanese and local partnersincluding a paper manufacturing company. As for paper products, we have established and operated jointventures in China with Japanese manufacturers, as well as handling those products for domestic and exportmarkets in Japan.
46

IT Business Unit
The Information, Electronics and Telecommunication Business Unit is involved in information technologyservices and solutions. These are delivered through the unit’s 12 subsidiaries and 7 associated companiesestablished in the following five major fields:
• network and systems integration (“NI/ SI”) businesses;
• mobile communication businesses including sales agency of mobile handset and telecommunicationslines; distribution of mobile handsets; and development and sales of mobile content;
• business process outsourcing services including enterprise information management and call-centerservices;
• semiconductors related businesses including sales agency for semiconductor chips, semiconductormanufacturing equipments and semiconductor inspection equipments; and
• display related businesses including export and trading of flat-panel displays and parts.
In the field of NI/SI businesses, a subsidiary, Mitsui Knowledge Industry Co., Ltd. (Japan), and anassociated company, Nihon Unisys, Ltd. (Japan), both listed on the Tokyo Stock Exchange, provide integratedsolutions to a wide range of customers.
• Mitsui Knowledge Industry Co., Ltd. provides services, such as consultation, designing, building andoperation of network systems to a wide range of customers including telecommunications carriers,government offices, local municipalities and healthcare and education related public bodies. It is alsoengaged in planning and development of network systems which are equipped with voice recognitiontechnology and typically used by call centers and in high-security systems such as automatic billingsystems used by pay-TV broadcasters. Mitsui Knowledge Industry Co., Ltd. was formed by a merger inApril 2007 between NextCom K.K. and Mitsui Knowledge Industry Co., Ltd.
• Nihon Unisys, Ltd. is engaged in the designing and building of computer systems, business processoutsourcing services, support services and other peripheral services as well as sales of computersystems. These services are provided to business enterprises in the financial, manufacturing anddistribution and public sectors. Mitsui owns a 31.9% voting interest in Nihon Unisys, Ltd. as of March2008. Unisys Corporation in the United States, which formerly held the same equity stake as Mitsui,sold its entire shareholding in Nihon Unisys, Ltd. in March 2006, and Mitsui has since been its singlelargest shareholder.
The market for business process outsourcing services has been expanding in Japan. We have developedthose businesses through a subsidiary, J-SCube Inc. (Japan), and an associated company, Moshi Moshi Hotline,Inc. (Japan). J-SCube Inc., which has been engaged in distribution of information processing devices such asoptical character readers (“OCR”) and information input devices, has recently focused on enterprise informationmanagement such as customer information input, management and operation. Moshi Moshi Hotline, Inc. (Japan)is one of the Japan’s major providers of call centers and related outsourcing services. In 1987, it was establishedby Mitsui and eleven minor shareholders. Moshi Moshi Hotline, Inc. later went public on the over-the-countermarket and is now listed on the Tokyo Stock Exchange, with our current voting interest at 34.4%.
We are engaged in various mobile communication businesses through alliances with domestic cell phoneservice providers and manufacturers. Telepark Corp. (Japan), one of the major agencies for cell phonesubscription as well as a retailer and distributor of cell phone handsets in Japan, is a core subsidiary in this field.It sold 3.9 million cell phones for the year ended March 31, 2008. It has also acted as agent for subscription offixed telecommunications lines, including broadband connections. Telepark Corp. was established in 2001 by amerger of three Mitsui subsidiaries that had engaged in sales agency of telecommunications lines and relatedbusinesses since the 1990s. Today, Telepark Corp. is listed on the Tokyo Stock Exchange. In May 2008,Telepark Corp. signed a merger agreement (scheduled) to be effective on October 1, 2008, with MSCommunications Co., Ltd., a domestic large scale agency and distributor engaged in the same business line. The
47

merger is to establish its leading position in domestic mobile handset sales and distribution market, byreinforcing cost-efficiency. In order to further expand our sales and distribution network, we formed two jointventures covering the Asia Pacific market with Brightstar Inc., a U.S.-based worldwide distributor of mobilehandsets.
In the field of electronics products, Mitsui Electronics Inc. (Japan) acts as a sales agent for semiconductorrelated devices, manufacturing equipment and inspection equipment. In recent years, Mitsui Electronics Inc. hasfocused on providing semiconductor related products and services to Japanese customers who are shifting theirproduction bases to China. This business unit also engages in export and offshore trading of flat-panel displaysand related parts and has expanded into sales and distribution of consumer electronics durables such as LCDtelevisions. In July 2007, it established a subsidiary in Brazil for the sales and distribution of Japanesemanufacturer Sharp Corporation’s electronic consumer and office products.
This business unit is dependent on the business of our subsidiaries and associated companies, most of whichare located in Japan, where technological development is rapid and competition is fierce. Our important functioninvolves business incubation of IT related products and services, as seen in the case with Telepark Corp. andMoshi Moshi Hotline, Inc.
Logistics & Financial Markets Segment
The Logistics & Financial Markets Segment is engaged in transportation and logistics services, insuranceand financial business in Japan and abroad.
Gross profit and net income for this segment for the year ended March 31, 2008 were ¥55.1 billion or 5.6%and ¥7.5 billion or 1.8% of our consolidated totals, respectively.
This segment is composed of the Financial Markets Business Unit and the Transportation Logistics BusinessUnit, and has 33 subsidiaries including:
• in the Financial Markets Business Unit, Mitsui & Co. Energy Risk Management Ltd. (United Kingdom),Mitsui & Co. Precious Metals, Inc. (United States) and Mitsui Bussan Precious Metals HK Ltd. (HongKong, China); and
• in the Transportation Logistics Business Unit, Mitsui Bussan Logistics Holdings Ltd. (Japan),Mitsuibussan Insurance and Consulting Co., Ltd. (Japan), TRI-NET (JAPAN) INC. (Japan) and Tri-NetLogistics (Asia) Pte Ltd. (Singapore).
This segment has 5 associated companies including Mitsui Leasing & Development, Ltd. (Japan) in theFinancial Markets Business Unit and Mitsui Direct General Insurance Company, Limited (Japan) in theTransportation Logistics Business Unit.
Financial Markets Business Unit
This business unit has 22 subsidiaries and 1 associated company and is engaged in the following businessactivities:
• trading in precious metals, non-ferrous metals listed on the London Metal Exchange (“LME”) andderivative commodity instruments for energy, agricultural foods and other commodities;
• financial equity investments including principal investment and venture capital operation;
• asset management business including real estate investment trust (“REIT”) related businesses;
• development, origination and sales of financial products, investment in and portfolio management offinancial products; and
• leasing businesses
48

Mitsui and its subsidiaries such as Mitsui & Co. Precious Metals, Inc. (United States) and Mitsui BussanPrecious Metals HK Ltd. (Hong Kong, China) are engaged in trading and brokerage in precious metals,non-ferrous metals listed on the LME and derivative commodity instruments for energy, agricultural foods andother commodities. We are also engaged in sales and marketing of various derivative and financial instruments ofour own development to investors and market participants. Mitsui & Co., Energy Risk Management Ltd. (UnitedKingdom), engages in derivative trading operations, mainly of crude oil and natural gas related commodities.Japan Alternative Investment Co., Ltd. (Japan) acts as placement agent for alternative investment products suchas funds of hedge funds.
In the financial equity investments field, subsidiaries such as MVC Corporation (Japan) have madeinvestments in ventures mainly in IT and medical care businesses. Since August 2006, this business unit has hada 9.3% stake as a limited partner in a limited partnership which was established for investment in Skylark Co.,Ltd., a Japanese restaurant chain.
In REIT related businesses, Mitsui & Co., Logistics Partners Ltd. (Japan) provides asset managementservice to Japan Logistics Fund Inc, a listed REIT on the Tokyo Stock Exchange that specializes in themanagement of investments in warehouses and distribution centers.
As of end of March 2008, we have a 40.7% voting interest in Mitsui Leasing & Development, Ltd. (Japan),a leasing company with its strengths in leasing of information-processing equipments and large scale equipment,as well as industrial machinery, aircraft and ocean vessels. Mitsui Leasing & Development, Ltd. has agreed withKyodo Leasing Co., Ltd. on a business merger to reinforce operating bases, and a joint holding company wasestablished in April 2008 to combine operations of the two companies.
As of March 31, 2008, this business unit has an 8.8% share of outstanding common stock in Central FinanceCo., Ltd., a consumer credit and credit card company in Japan. With other parties, Mitsui is studying expansionof domestic and overseas credit card business operations and development of new businesses.
Transportation Logistics Business Unit
The Transportation Logistics Business Unit provides sophisticated, high value added logistics services tocustomers, leveraging its longstanding experience in offering such services groupwide. This business unit alsoseeks the development of new business domains through integrating logistics, financial and informationtechnology.
Together with 11 subsidiaries and 4 associated companies, this business unit is engaged in the followingbusiness activities:
• international and domestic transportation services including transportation of plants and other specialcargos, tramper shipping, and airfreight;
• solutions services for logistics, including SCM;
• warehousing and port services; operation, construction and management of warehouses and harborfacilities;
• insurance agency and insurance consultation; and
• establishment and operation of REITs which invest in logistics facilities.
In the international and domestic transport services field, we have established Tri-Net (Japan) Inc. and othercore subsidiaries, which are located in Japan, the Americas, Europe, South East Asia, and China. Each of thosesubsidiaries collaborates with the Head Office and overseas trading subsidiaries worldwide and provides internationaltransportation services mainly using marine containers. They also provide international combined transportationservices by integrating land, sea and air transportation. In the tramper business, they provide transportation servicesfor bulky cargoes such as coal, grain and fertilizers, as well as power and chemical plant projects.
49

We have been making investments to expand our logistics businesses in the BRICs (Brazil, Russia, Indiaand China), the Middle East and other emerging markets. For example, in Russia, we have organized large scaledistribution operations outside Moscow that provide services to local bases of Japanese electronics, constructionmachinery and automotive companies. In India, we plan joint development projects with Indian partners in a freetrade warehouse zone near Delhi.
Trinet Logistics Co., Ltd. (Japan) operates in the field of warehousing, distribution, and port service-relatedbusiness within Japan, focusing on bulk cargo transportation. Trinet Logistics Co., Ltd. was established in April2007 by reorganizing 3 former warehousing and distribution subsidiaries. Trinet Logistics Co., Ltd. is asubsidiary of the holding company Mitsui Bussan Logistics Holdings Ltd. (Japan).
This business unit has a subsidiary, Mitsuibussan Insurance and Consulting Co., Ltd. (Japan), as aninsurance agency. In addition, the business unit has acquired insurance companies for captive insurance andoperates subsidiaries which are engaged in this business field, including Insurance Company of Trinet (USA),Inc. This business unit also maintains certain direct insurance businesses, by taking advantage of the experienceand know-how in risk management of this business unit. In addition, this business unit has a 25% share interestin an associated company, Mitsui Direct General Insurance Co., Ltd., a direct marketing non-life insurer, whichparticularly focuses on contracting through Internet.
In collaboration with the Financial Markets Business Unit, this business unit has developed logistics-relatedreal estate property REITs. This unit intends to increase the assets for such REIT programs, seeking opportunitiesfor the development of facilities, brokerage in properties and tenants.
Americas Segment
The Americas Segment is engaged in sales, intermediary service and manufacturing of various commoditiesand conducts related business led by overseas trading subsidiaries in North, Central and South America.Mitsui & Co. (U.S.A.), Inc., or Mitsui U.S.A., manages the business of the segment as the center of the regionalstrategy.
Gross profit and net income for this segment for the year ended March 31, 2008 were ¥54.0 billion or 5.5%and ¥4.3 billion or 1.0% of our consolidated totals, respectively.
This segment consists of 9 trading subsidiaries including Mitsui U.S.A., Mitsui & Co. (Canada) Ltd. andMitsui Brasileira Importacao e Exportacao S.A., 30 other subsidiaries owned mainly by Mitsui U.S.A. includingSteel Technologies, Inc., Champions Pipe & Supply, Inc., Intercontinental Terminals Company LLC, NovusInternational, Inc., CornerStone Research & Development Inc., Westport Petroleum Inc., United Grain Corp,MBK Real Estate LLC and AFC Holdings Co. and 5 associated companies.
Mitsui U.S.A. is our largest overseas subsidiary, and it carries out many diversified business activitiestogether with subsidiaries and associated companies, in collaboration with the operating segments of the HeadOffice in Japan. Mitsui U.S.A. has been leading our entry in the U.S. market, and we believe that Mitsui U.S.A.is one of the major exporters of American products.
Business activities of Mitsui U.S.A.’s major operating divisions are as follows:
• The Iron & Steel Products Division maintains alliances with steel makers, steel processors, andcustomers in the U.S. and other countries. It specializes in SCM of steel products, managing inventoryand process arrangements. Steel Technologies Inc., a steel processor which operates more than 20 steelprocessing facilities in North America, which Mitsui U.S.A acquired in June 2007, is a core operation ofthis division. It processes flat-rolled steel and provides a wide range of value added services includingcold strip, blanking for automotive steel plate and pickling. Among various customers, the United Statesautomotive makers and their affiliated industry are major customers. Tubular products sales anddistribution within Americas and other areas is another core operation, operated byChampion Pipe & Supply, Inc.
50

• The Mineral & Metal Resources Division engages in copper ingot; aluminum ingot; aluminum product;other non-ferrous metal materials; iron and steel raw materials; and steel and nonferrous metal scrap.
• The Infrastructure Projects Division engages in projects of power, water treatment and supply,transportation, energy and social infrastructure in the Americas in collaboration with the InfrastructureProjects Business Unit. This division has subsidiaries such as Hydro Capital Corp. for water treatmentprojects in Mexico and MIT Wind Power, Inc. for wind power generation in Texas.
• The Machinery Division engages in the businesses of motor vehicles, ship and marine projects, aircraftand construction and industrial machinery. It focuses on automobiles, construction machinery, outdoorpower equipment, newly built vessels to major oil and shipping companies, and aircraft leasing forregional airlines. In September 2007, Mitsui U.S.A. acquired an 87.5% share interest in AffiliatedFinancial Corporation and BayQuest Capital Corporation. They provide automotive related financingservices throughout the United States.
• The Chemicals Division and the Plastics & Inorganic Chemicals Division are engaged in the domesticand international trade of various chemical products. Novus International, Inc., a feed additivemanufacturing subsidiary, produces and sells amino acids. In addition, Intercontinental TerminalCompany is engaged in the chemical tank leasing business, and CornerStone Research &Development Inc. focuses on processing and packaging of healthcare foods and supplements.
• The Energy Division specializes in the global trading of petroleum products, crude oil and petroleumcoke. Westport Petroleum, Inc. is engaged in sales, trading and commercial and operational services tothe energy industry with respect to pipeline and cargo trading of petroleum products throughout majorinternational energy markets. These transactions by Westport Petroleum, Inc. account for a significantportion of our revenues from sales of products groupwide.
• The Foods and Retail Division deals in grain, coffee, foods materials and other foods products. Thisdivision has a subsidiary, United Grain Corp, which invests in United Harvest, LLC, a joint venture withCHS Inc. for export facility operations for wheat and barley, and also has a 20% minority interest inWILSEY FOODS INC. See also “Foods & Retail Business Unit” for business collaboration withCHS Inc. Additionally, Mitsui Foods Inc. is specialized in the import food distribution business.
• In the Consumer Service Business Division and other remaining division, MBK Real Estate LLC handlesthe development and sale of unit houses and senior housing properties in the California market, as well ascommercial properties on the West Coast of the United States. SunWize Technologies, Inc., which MitsuiU.S.A. acquired in November 2006, engages in sales and installation of solar power systems and modules.
Europe, the Middle East and Africa Segment
The Europe, the Middle East and Africa Segment is engaged in sales and intermediary service of variouscommodities and conducts related businesses led by overseas trading subsidiaries in Europe, the Middle East,Africa and CIS countries. Effective April 2007, the Europe, the Middle East and Africa Business Unit wasformed by reorganizing the former Europe Business Unit in order to cover the businesses in these regions.
Gross profit and net income for this segment for the year ended March 31, 2008 were ¥26.8 billion or 2.7%and ¥5.0 billion or 1.2% of our consolidated totals, respectively.
As of March 31, 2008, this segment consisted of 15 trading subsidiaries, including Mitsui & Co. EuropeHoldings PLC, Mitsui & Co. Europe PLC and Mitsui & Co. Deutschland GmbH, 4 subsidiaries and 5 associatedcompanies.
Mitsui & Co. Europe PLC, our wholly-owned subsidiary with its head office in London, manages theoverall business activities in Europe, the Middle East, Africa and CIS countries through 14 overseas tradingsubsidiaries and other branch offices and liaison offices. Mitsui & Co. Europe PLC collaborates with oursubsidiaries and associated companies of other operating segments.
51
Recently, the major parts of business in this segment have been sales and intermediary service of steelproducts, chemicals and machinery. For example, this segment provided assistance services for SCM of steelproducts procured by Norsk Hydro ASA. In the chemical business, this segment has been engaged in sales andintermediary service of various chemical products and materials supported by our global network andrelationship with large scale manufacturers including Bayer Aktiengesellschaft.
Over the years, in Central and Eastern Europe, we have established trading subsidiaries and representativeoffices to expand business opportunities in the region, and have continuously participated in joint ventures,mainly with Japanese manufacturers. In connection with the enlargement of European Union, Japaneseautomobile, electric and chemical manufacturers are rushing to set up operations in the region. We arecollaborating with them by taking advantage of our existing business bases.
In the Middle East we have established trading subsidiaries Mitsui & Co., Middle East Ltd. (United ArabEmirates), Mitsui and Co. (Middle East) B.S.C.(c) (Bahrain), Mitsui and Co., Iran Ltd. (Iran) and Mitsui and Co.Kuwait W.L.L. (Kuwait). Mitsui & Co., Middle East Ltd. owns offices in United Arab Emirates, Qatar andOman. Mitsui has several representative offices in the Middle East countries including Saudi Arabia. Thesetrading subsidiaries and offices in the Middle East collaborate with the Head Office primarily in the field energydevelopment and production and projects of petrochemical plants and power plants.
Asia Pacific Segment
In order to develop new business opportunities emerging with the development of network economies basedaround China, the ASEAN countries and India, we introduced an Asian Regional Managing Directorship system.Broad authority and responsibility to manage our businesses throughout non-Japan Asia is delegated to theRegional Managing Director, Asia starting in the year ended March 31, 2006. Effective April 2006, following theintroduction of our regional business unit system, the Asia Business Unit was formed and consists of the tradingsubsidiaries, branches and liaison offices in this region. The Chief Operating Officer of this business unit hasbeen delegated authority of operation within this region. The Asia Pacific Segment is engaged in sales andintermediary service of various commodities and conducts related businesses led by overseas trading subsidiariesin Asia and Oceania countries. Effective April 2007, the Asia Pacific Business Unit was formed by reorganizingthe former Asia Business Unit and consolidating subsidiaries in Oceania region.
Gross profit and net income for this segment for the year ended March 31, 2008 were ¥33.1 billion or 3.3%and ¥22.5 billion or 5.5% of our consolidated totals, respectively.
As of March 31, 2008, this segment consisted of 21 trading subsidiaries, including Mitsui & Co. (AsiaPacific) Pte. Ltd., Mitsui & Co. (Hong Kong) Ltd., Mitsui & Co., (China) Ltd., Mitsui & Co., (Thailand) Ltd.,Mitsui & Co. (Australia) Ltd., 5 subsidiaries and 7 associated companies.
China
China has been a focus of recent global attention, with 11.9% and 11.6% growth in gross domestic productin 2007 and 2006, respectively, as a result of its accession to the WTO and a growing reputation as an efficientand cost effective manufacturer of goods. We have been increasing our operations in, and shifting corporateresources to, Greater China, which includes mainland China, Hong Kong and Taiwan, in order to expand andstrengthen our business operations involving products such as automobiles, consumer products, IT, electronics,energy and metals, while reinforcing our transportation and logistics services.
Our presence in China is comprised of ten local trading subsidiaries, including Mitsui & Co., (China) Ltd.,an investing company in Beijing, Mitsui & Co. (Hong Kong) Ltd. and six trading subsidiaries in China’s bondedareas including Mitsui & Co. (Shanghai) Ltd. In addition, we have established representative offices in 12 citiesin China.
In September 2005, Mitsui received approval from the Chinese Ministry of Commerce to establish threewholly owned trading companies, permitting us to conduct import and export and wholesale trade domestically
52

within China, which would enable us to trade in a broader range of products, including value added services infinance and logistics. Thus, Mitsui & Co. (China) Trading Ltd. and Mitsui & Co. (Guangdong) Ltd. wereestablished in 2005 and started operations.
Mitsui & Co., (China) Ltd. has made investments jointly with the business units of the Head Office incritical joint ventures in China. Among others, we place a high priority on establishment of logistics networkwithin China. For example:
• In March 2003, we entered into a comprehensive strategic alliance with China Postal Logistics Co., Ltd.Through this alliance, we are in a position to utilize the facilities and distribution networks of China’spostal service, the China State Post Bureau.
• Mitsui International Logistics and Trade (Suzhou) Co., Ltd., in which Mitsui & Co., (China) Ltd. has aminority share, has the right to conduct import and export under our own name outside a bonded area.
ASEAN Region
In the ASEAN region, overseas offices including Kuala Lumpur and Manila branches, trading subsidiariesincluding Mitsui & Co. (Asia Pacific) Pte. Ltd., Mitsui & Co., (Thailand) Ltd., Mitsiam International Ltd.(Thailand) and PT Mitsui Indonesia (Indonesia), and associated companies jointly collaborate with the HeadOffice and engage in various business activities involving, among other things, chemical and metal products andindustrial type projects. With the Head Office, these branches and trading subsidiaries jointly establish varioussubsidiaries and participate in joint ventures formed with the third parties.
In December 2006, we obtained a special approval from the Vietnamese government to establish tradingsubsidiaries, and Mitsui & Co. Vietnam Ltd. started operations in April 2007.
Southwest Asia
Our operations in India were traditionally handled by branch offices in New Delhi, Calcutta, Madras andBombay and were concentrated primarily in exporting commodities, such as iron ore, finished iron and steelproducts, textiles, and marine products, to Japan and other areas of the world. However, with the increasingderegulation of the Indian economy, in March 2003 we established Mitsui & Co., India Pvt. Ltd. ThroughMitsui & Co., India Pvt. Ltd., we expect not only to engage in import and export-related transactions but also topursue investment opportunities in domestic distribution channels.
Oceania
In Australia, Mitsui & Co. (Australia) Ltd. is active in the development of minerals such as iron ore andcoal, energy and agricultural exports in collaboration with corresponding operating segments, mainly in the HeadOffice. As described in the Mineral & Metal Resources Segment and the Energy Segment above, Australia is acritical geographic area in our corporate strategy. Mitsui & Co. (Australia) Ltd. participates in Mitsui Iron OreDevelopment Pty. Ltd. (Australia) and Mitsui Coal Holdings Pty. Ltd. (Australia) with equity shares of 20% and30%, respectively.
All Other Segment
The operations of the All Other Segment include financing services, office services and other services toexternal customers, and/or to us and associated companies.
Gross profit and net loss for this segment for the year ended March 31, 2008 were ¥5.5 billion or 0.5% andminus ¥7.1 billion or minus 1.7% of our consolidated totals, respectively.
The All Other Segment has 11 subsidiaries and 1 associated company. The activities of major subsidiaries inthis segment are as follows:
• Mitsui & Co. Financial Services Ltd. is engaged in financial services such as commercial loan and cashmanagement services, mainly provided to domestic subsidiaries and associated companies.
53

• Mitsui & Co., Asia Investment Ltd. (Singapore) is engaged in-house financial services in the South EastAsian region.
Principal Markets
We are involved in the worldwide trading of various commodities. See “Item 5. A. Operating Results—Revenues” for further details of our revenues by commodity type for the years ended March 31, 2008, 2007 and2006.
In Billions of Yen
Years Ended March 31,
2008 2007 2006
Revenues(1)
Distribution by Commodity:Iron and Steel . . . . . . . . . . . . . . . . . . . . . . . . . . . . . . . . . . . . . . . . . . . . . ¥ 801.3 ¥ 566.9 ¥ 481.2Non-Ferrous Metals . . . . . . . . . . . . . . . . . . . . . . . . . . . . . . . . . . . . . . . . . 79.7 99.9 102.2Machinery . . . . . . . . . . . . . . . . . . . . . . . . . . . . . . . . . . . . . . . . . . . . . . . . 478.2 428.6 350.7Electronics & Information . . . . . . . . . . . . . . . . . . . . . . . . . . . . . . . . . . . . 182.3 178.8 160.8Chemicals . . . . . . . . . . . . . . . . . . . . . . . . . . . . . . . . . . . . . . . . . . . . . . . . 1,318.6 1,146.6 886.7Energy . . . . . . . . . . . . . . . . . . . . . . . . . . . . . . . . . . . . . . . . . . . . . . . . . . . 2,017.7 1,633.3 1,360.5Foods . . . . . . . . . . . . . . . . . . . . . . . . . . . . . . . . . . . . . . . . . . . . . . . . . . . . 572.6 467.0 424.6Textiles . . . . . . . . . . . . . . . . . . . . . . . . . . . . . . . . . . . . . . . . . . . . . . . . . . 41.3 39.8 36.4General Merchandise . . . . . . . . . . . . . . . . . . . . . . . . . . . . . . . . . . . . . . . . 40.5 50.3 61.6Property and Service Business . . . . . . . . . . . . . . . . . . . . . . . . . . . . . . . . 206.7 182.4 162.8
Consolidated Total . . . . . . . . . . . . . . . . . . . . . . . . . . . . . . . . . . . . . . . . . . . . . ¥5,738.9 ¥4,793.6 ¥4,027.5
Notes:(1) In accordance with SFAS No. 144, revenues from discontinued operations are eliminated from each product
amount and “Consolidated Total.” The figures for the years ended March 31, 2007 and 2006 have beenreclassified to conform to the current year presentation.
The following table shows our total trading transactions in each of our major markets for the years endedMarch 31, 2008, 2007 and 2006.(1)(2)(3)
In Billions of Yen
Years Ended March 31,
2008 2007 2006
Japan . . . . . . . . . . . . . . . . . . . . . . . . . . . . . . . . . . . . . . . . . . . . . . . . . . . . . . . . ¥ 9,285.9 ¥ 8,903.1 ¥ 8,521.7United States . . . . . . . . . . . . . . . . . . . . . . . . . . . . . . . . . . . . . . . . . . . . . . . . . . 1,323.8 1,159.1 1,245.1China . . . . . . . . . . . . . . . . . . . . . . . . . . . . . . . . . . . . . . . . . . . . . . . . . . . . . . . . 1,119.1 885.3 867.1All Other . . . . . . . . . . . . . . . . . . . . . . . . . . . . . . . . . . . . . . . . . . . . . . . . . . . . . 5,280.3 4,324.1 4,162.6
Consolidated Total . . . . . . . . . . . . . . . . . . . . . . . . . . . . . . . . . . . . . . . . . . . . . ¥17,009.1 ¥15,271.6 ¥14,796.5
Notes:(1) Total trading transactions is a voluntary disclosure as permitted by Financial Accounting Standards Board
Emerging Issues Task Force Issue No. 99-19, “Reporting Revenue Gross as a Principal versus Net as anAgent,” and represents the gross transaction volume or the nominal aggregate value of the sales contracts inwhich we act as principal and transactions in which we serve as agent. Total trading transactions is not meantto represent sales or revenues in accordance with U.S. GAAP. Total trading transactions should not beconstrued as equivalent to, or a substitute or proxy for, revenues, or as an indicator of our operatingperformance, liquidity or cash flows generated by operating, investing or financing activities. A substantial partof total trading transactions represents transactions in which title to and payment for the goods pass through us
54
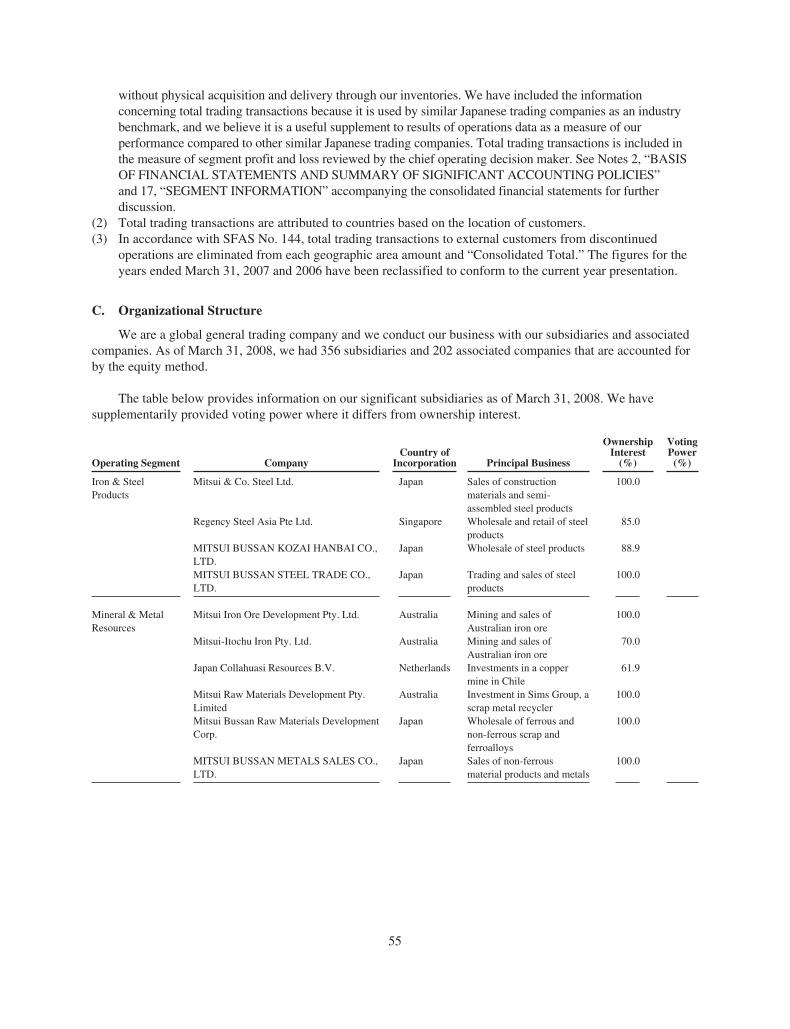
without physical acquisition and delivery through our inventories. We have included the informationconcerning total trading transactions because it is used by similar Japanese trading companies as an industrybenchmark, and we believe it is a useful supplement to results of operations data as a measure of ourperformance compared to other similar Japanese trading companies. Total trading transactions is included inthe measure of segment profit and loss reviewed by the chief operating decision maker. See Notes 2, “BASISOF FINANCIAL STATEMENTS AND SUMMARY OF SIGNIFICANT ACCOUNTING POLICIES”and 17, “SEGMENT INFORMATION” accompanying the consolidated financial statements for furtherdiscussion.
(2) Total trading transactions are attributed to countries based on the location of customers.(3) In accordance with SFAS No. 144, total trading transactions to external customers from discontinued
operations are eliminated from each geographic area amount and “Consolidated Total.” The figures for theyears ended March 31, 2007 and 2006 have been reclassified to conform to the current year presentation.
C. Organizational Structure
We are a global general trading company and we conduct our business with our subsidiaries and associatedcompanies. As of March 31, 2008, we had 356 subsidiaries and 202 associated companies that are accounted forby the equity method.
The table below provides information on our significant subsidiaries as of March 31, 2008. We havesupplementarily provided voting power where it differs from ownership interest.
Operating Segment CompanyCountry of
Incorporation Principal Business
OwnershipInterest
(%)
VotingPower
(%)
Iron & SteelProducts
Mitsui & Co. Steel Ltd. Japan Sales of constructionmaterials and semi-assembled steel products
100.0
Regency Steel Asia Pte Ltd. Singapore Wholesale and retail of steelproducts
85.0
MITSUI BUSSAN KOZAI HANBAI CO.,LTD.
Japan Wholesale of steel products 88.9
MITSUI BUSSAN STEEL TRADE CO.,LTD.
Japan Trading and sales of steelproducts
100.0
Mineral & MetalResources
Mitsui Iron Ore Development Pty. Ltd. Australia Mining and sales ofAustralian iron ore
100.0
Mitsui-Itochu Iron Pty. Ltd. Australia Mining and sales ofAustralian iron ore
70.0
Japan Collahuasi Resources B.V. Netherlands Investments in a coppermine in Chile
61.9
Mitsui Raw Materials Development Pty.Limited
Australia Investment in Sims Group, ascrap metal recycler
100.0
Mitsui Bussan Raw Materials DevelopmentCorp.
Japan Wholesale of ferrous andnon-ferrous scrap andferroalloys
100.0
MITSUI BUSSAN METALS SALES CO.,LTD.
Japan Sales of non-ferrousmaterial products and metals
100.0
55

Operating Segment CompanyCountry of
Incorporation Principal Business
OwnershipInterest
(%)
VotingPower
(%)
Machinery &InfrastructureProjects
MBK Project Holdings Ltd. Japan Investments inmanufacturers of plant-related materials andequipment
100.0
Mitsui & Co. Plant Systems, Ltd. Japan Sales of various plants,electric power facilities andtransportations
100.0
Mitsui Power Ventures Limited United Kingdom Investments in powergeneration business
100.0
Mitsui Rail Capital Holdings, Inc. United States Freightcar leasing andmanagement in NorthAmerica
100.0
Mitsui Rail Capital Participacoes Ltda. Brazil Freightcar leasing andmanagement in Brazil
100.0
Mitsui Rail Capital Europe B.V. Netherlands Locomotive leasing andmanagement in Europe
100.0
MRCE Dispolok GmbH Germany Locomotive leasing andmanagement in Europe
100.0
MITSUI GAS E ENERGIA DO BRASILLTDA.
Brazil Investments in gasdistribution companies
100.0
MIT POWER CANADA LP INC. Canada Investment in GreenfieldPower Generation Project inOntario
100.0
Toyota Chile S.A. Chile Import and sales ofautomobiles and auto partsin Chile
100.0
PT. Bussan Auto Finance Indonesia Motorcycle retail finance 90.0Mitsui Automotive Europe B.V. Netherlands Investments in automotive-
related companies andtrading of automobiles
100.0
MMK CO., LTD. Japan Sales of machine tools andinjection molding machine
100.0
Ellison Technologies Inc. United States Sales of machine tools 71.0Clio Marine Inc. Liberia Shipping business 100.0Lepta Shipping Co., Ltd. Liberia Shipping business 100.0Mitsui Bussan Aerospace Co., Ltd. Japan Import and sales of
helicopters and defense andaerospace products
100.0
Chemical P.T. Kaltim Pasifik Amoniak Indonesia Production and sales ofanhydrous ammonia
75.0
Japan-Arabia Methanol Company Ltd. Japan Investments in methanolproducing business in SaudiArabia and sales of products
55.0
MITSUI BUSSAN SOLVENT &COATING CO., LTD.
Japan Sales and trading of solventsand coating materials
100.0
Mitsui AgriScience International SA/NV Belgium Investments in cropprotection businesses inEurope
100.0
Mitsui Bussan Agro Business Co., Ltd. Japan Development and sales offertilizers and agriculturalproducts
100.0
Fertilizantes Mitsui S.A. Industria eComercio
Brazil Production and sales offertilizers
100.0
DAIICHI TANKER CO., LTD. Japan Operation of chemicaltankers
100.0
Mitsui Bussan Plastics Co., Ltd. Japan Wholesale of plastic rawmaterials and products
100.0
Nippon Trading Co., Ltd. Japan Sales of plastics andchemicals
100.0
SALT ASIA HOLDINGS PTY. LTD Australia Holdings company ofOnslow Salt Pty. Ltd.
94.2
Mitsui Bussan Frontier Co., Ltd. Japan Export and SCM servicesfor electronic parts
100.0
56

Operating Segment CompanyCountry of
Incorporation Principal Business
OwnershipInterest
(%)
VotingPower
(%)
Energy Mitsui E&P Australia Pty Limited Australia Exploration, developmentand production of oil andnatural gas
100.0
Mittwell Energy Resources Pty., Ltd. Australia Sales of crude oil andcondensate
100.0
Mitsui E&P Middle East B.V. Netherlands Exploration, developmentand production of oil andnatural gas in Oman
80.6 100.0
Mitsui Oil Exploration Co., Ltd. Japan Exploration, developmentand sales of crude oil andnatural gas
51.5 51.0
MitEnergy Upstream LLC United States Exploration, developmentand production of oil andnatural gas
85.4 100.0
Mitsui Gas Development Qatar B.V. Netherlands Development andproduction of natural gasand condensate
100.0
Mitsui LNG Nederland B.V. Netherlands Investments in Qatar LNGproject
100.0
Mitsui & Co. (E&P) B.V. Netherlands Exploration, production andinvestments in oil andnatural gas
100.0
Mitsui E&P (USA) LLC United States Investment in MitEnergyUpstream LLC
100.0
Mitsui Sakhalin Holdings B.V. Netherlands Investments in SakhalinEnergy InvestmentCompany Ltd.
100.0
Endeavour Resources Limited United Kingdom Investments in JapanAustralia LNG (MIMI) Pty.Ltd.
100.0
Mitsui Coal Holdings Pty. Ltd. Australia Investments in Australiancoal business
100.0
Mitsui Oil Co., Ltd. Japan Sales of petroleum productsin Japan
89.9
Mitsui Liquefied Gas Co., Ltd. Japan Sales of liquefied petroleumgas in Japan
100.0
Kokusai Oil & Chemical Co., Ltd. Japan Sales of petroleum productsin Japan
100.0
Foods & Retail WILSEY FOODS, INC. United States Investments in processed oilfood company
90.0
MITSUI FOODS CO., LTD. Japan Wholesale of foods andbeverages
99.9
Mitsui Norin Co., Ltd. Japan Manufacture and sales offood products
51.9 87.6
DAI-ICHI BROILER CO., LTD. Japan Production, processing andsales of broilers
72.3
VENDOR SERVICE CO., LTD. Japan Procurement and demandchain planning andmanagement of foodmaterials
100.0
MCM FOODS B.V. Netherlands Import and sales of cannedfood products and groceries
100.0
57

Operating Segment CompanyCountry of
Incorporation Principal Business
OwnershipInterest
(%)
VotingPower
(%)
ConsumerService & IT
Mitsui Bussan Inter-Fashion Ltd. Japan Planning and managementof production anddistribution of apparel
100.0
Kids Station Inc. Japan Broadcasting of TVprograms for children
67.0
BUSSAN REAL ESTATE Co., LTD. Japan Real estate sales, leasingand management
100.0
MBK Real Estate Europe Limited United Kingdom Real estate-related business 100.0Telepark Corp. Japan Sales and distribution of
mobile phones and agencyfor telecommunicationservices
50.8
Mitsui Knowledge Industry Co., Ltd. Japan Planning, development andsales of information andcommunication systems
58.5 58.4
J-SCube Inc. Japan Outsourcing services fordata entry and other back-office tasks
100.0
Mitsui Electronics Inc. Japan Sales of electronics deviceand equipment
100.0
Logistics &Financial Markets
Mitsui & Co. Energy Risk ManagementLtd.
United Kingdom Trading of energyderivatives
100.0
Mitsui & Co. Precious Metals, Inc. United States Trading of precious metals 100.0Mitsui Bussan Precious Metals(Hong Kong) Limited
Hong Kong,China
Trading of precious metals 100.0
Mitsui Bussan Logistics Holdings Ltd. Japan Investments in domesticwarehousing businesses
99.8
Mitsuibussan Insurance Co., Ltd. Japan Property and casualtyinsurance consignment andagency services
100.0
TRI-NET (JAPAN) INC. Japan International integratedtransportation services
100.0
TRI-NET LOGISTICS (ASIA) PTE LTD Singapore International integratedtransportation services
100.0
Americas Mitsui & Co. (U.S.A.), Inc. United States Trading 100.0Mitsui & Co. (Canada) Ltd. Canada Trading 100.0Mitsui Brasileira Importacao eExportacao S.A.
Brazil Trading 100.0
Steel Technologies Inc. United States Steel processing 100.0Champions Pipe & Supply, Inc. United States Sales of steel pipes 94.0Intercontinental Terminals CompanyLLC
United States Chemical Tank Leasing 100.0
Novus International, Inc. United States Manufacture and sales offeed additives
65.0
CornerStone Research & Development,Inc.
United States Processing and packaging ofhealthcare foods andsupplements
100.0
Westport Petroleum, Inc. United States International trading ofpetroleum products andcrude oil
100.0
United Grain Corp. United States Grain merchandising 100.0MBK Real Estate LLC United States Real estate-related business 100.0AFC HoldCo, LLC United States Investment in auto finance
companies87.5
58

Operating Segment CompanyCountry of
Incorporation Principal Business
OwnershipInterest
(%)
VotingPower
(%)
Europe, the MiddleEast and Africa
Mitsui & Co. Europe Holdings PLC United Kingdom Management of business inEurope and Africa
100.0
Mitsui & Co. Europe PLC United Kingdom Trading 100.0Mitsui & Co. Deutschland GmbH Germany Trading 100.0Mitsui & Co. Benelux S.A./N.V. Belgium Trading 100.0Mitsui & Co. France S.A.S. France Trading 100.0Mitsui & Co. Italia S.p.A. Italy Trading 100.0Mitsui & Co., Middle East Ltd. United Arab
EmiratesTrading 100.0
Asia Pacific Mitsui & Co. (Asia Pacific) Pte. Ltd. Singapore Trading 100.0Mitsui & Co. (Hong Kong) Ltd. Hong Kong,
ChinaTrading 100.0
Mitsui & Co. (China) Ltd. China Management of business inChina
100.0
Mitsui & Co. (China) Trading Ltd. China Trading 100.0Mitsui & Co. (Shanghai) Ltd. China Trading 100.0Mitsui & Co. (Taiwan) Ltd. Taiwan Trading 100.0Mitsui & Co. Korea Ltd. Republic of
KoreaTrading 100.0
Mitsui & Co. (Thailand) Ltd. Thailand Trading 100.0Mitsiam International Ltd. Thailand Trading 51.2 55.0Mitsui & Co. (Australia) Ltd. Australia Trading 100.0
All Other Mitsui & Co. Financial Services Ltd. Japan Financial services 100.0Mitsui & Co. Financial Services (Europe)B.V.
Netherlands Financial services 100.0
Mitsui & Co. Financial Services (Asia)Ltd.
Singapore Financial services 100.0
(1) Mitsui & Co. Steel Ltd. changed its name from Mitsui Bussan Construction Materials Co., Ltd. in October 2007.(2) Mitsui Bussan Raw Materials Development Corp. merged MITSUI BUSSAN METALS SALES CO., LTD. in April 2008 and changed
its name to Mitsui Bussan Metals Co., Ltd.(3) Mitsui & Co. Plant Systems, Ltd. changed its name from Mitsui & Co. Project Corp. in April 2007.(4) MMK CO., LTD. changed its name to Mitsui Bussan Machine Tec Co., Ltd. in April 2008.(5) Nippon Trading Co., Ltd. merged Mitsui Bussan Plastics Co., Ltd. and Mitsui Bussan Plastics Kansai Co., Ltd. in April 2008 and
changed its name to Mitsui Bussan Plastics Trade Co., Ltd.(6) DAI-ICHI BROILER CO., LTD. changed its name to PRI Foods Co., Ltd. in April 2008.(7) Mitsui Knowledge Industry Co., Ltd. and NextCom K.K. merged in April 2007.(8) J-SCube Inc. was established upon reorganization of TOYO Officemation Inc. in July 2007.(9) Mitsui & Co. Europe Holdings PLC changed its name from Mitsui & Co. Europe PLC in May 2007.(10) Mitsui & Co. Europe PLC changed its name from Mitsui & Co. UK PLC in May 2007.
59

D. Property, Plants and Equipment.
The following table provides a list of our principal property, plants and equipment as of March 31, 2008.
(Sft: Square feet, MT: Metric Ton)
Property, Plant and Equipment Description(Holder or Lessee Other than Mitsui) Location
Size or AnnualProductionCapacity Use of property
In Japan:
Mitsuibussan Building . . . . . . . . . . . . . . . . . . . . . Tokyo 1,321,572 Sft Office use (CorporateHeadquarters)
Osaka Mitsuibussan Building . . . . . . . . . . . . . . . . Osaka 450,306 Sft Office use
Nagoya Mitsuibussan Building . . . . . . . . . . . . . . . Nagoya 152,067 Sft Office use
Hibiya Central Building . . . . . . . . . . . . . . . . . . . . Tokyo 504,419 Sft Office building for lease
Bussan Building Annex . . . . . . . . . . . . . . . . . . . . Tokyo 204,275 Sft Office building for lease
Company Housing & Dormitory . . . . . . . . . . . . . Chiba 130,010 Sft Employees’ residential facility
Human Resource Development Center . . . . . . . . . Shizuoka 83,863 Sft Training facility
Land and equipment (Sintsuda Corporation) . . . . Yokohama 197,324 Sft Coil center
Land and equipment (Mitsui Liquefied Gas Co.,Ltd.) . . . . . . . . . . . . . . . . . . . . . . . . . . . . . . . . . . Ishikawa 852,072 Sft Liquefied petroleum gas terminal
Land (MITSUI FOODS CO., LTD.) . . . . . . . . . . Saitama 71,171 Sft Distribution center
Land and equipment (DAI-ICHI BROILER CO.,LTD.) . . . . . . . . . . . . . . . . . . . . . . . . . . . . . . . . Aomori 46,102 Sft Broiler processing factory
Land and equipment (Mitsui Norin Co., Ltd.) . . . Yamanashi 339,871 Sft Tea leaf processing factory
Land and equipment (San-ei Sucrochemical Co.,Ltd.) . . . . . . . . . . . . . . . . . . . . . . . . . . . . . . . . . . Aichi 817,433 Sft Dextrose manufacturing factory
Wakamatsu Building & Shinsuna BaysideBuilding (Bussan Real Estate Co., Ltd.) . . . . . . Tokyo 172,406 Sft Office building for lease
Higashi Nakano Office Building (MitsuiKnowledge Industry Co., Ltd.) . . . . . . . . . . . . . Tokyo 36,317 Sft Office use
Land (Mitsui Bussan Logistics Holdings Ltd.) . . . Chiba 649,753 Sft Logistics center
Overseas:
Office space (Mitsui & Co. (U.S.A.), Inc.) . . . . . . United States 155,530 Sft Office space leased from others
Office building (Mitsui & Co. UK PLC) . . . . . . . United Kingdom 64,369 Sft Office use
Equipment (Mitsui Iron Ore Development Pty.Ltd.) . . . . . . . . . . . . . . . . . . . . . . . . . . . . . . . . . . Australia(1) 22,706,000 Mt Mining equipment for iron ore
Equipment (Mitsui-Itochu Iron Pty. Ltd.) . . . . . . . Australia(1) 2,997,000 Mt Mining equipment for iron ore
Land and plants (P.T. Kaltim PasifikAmoniak) . . . . . . . . . . . . . . . . . . . . . . . . . . . . . Indonesia 579,397 Sft Ammonia manufacturing plant
Equipment (Mitsui Coal Holdings Pty. Ltd.) . . . . Australia(1) 5,936,000 Mt Mining equipment for coal
Office building (MBK Real Estate EuropeLimited) . . . . . . . . . . . . . . . . . . . . . . . . . . . . . . . United Kingdom 75,486 Sft Office building for lease
Land and equipment (Steel Technologies Inc.) . . United States 228,901 Sft Coil center
Chemical tank yard (Intercontinental TerminalsCompany LLC) . . . . . . . . . . . . . . . . . . . . . . . . . United States 11,495,355 Sft Chemical tank
Senior service apartment (MBK Real Estate,Ltd.) . . . . . . . . . . . . . . . . . . . . . . . . . . . . . . . . . . United States 146,628 Sft Leasing asset
Land and plants (Novus International, Inc.) . . . . . United States 658,187 Sft Methionine production facility
(1) Information on our mining activities related to Mitsui Iron Ore Development Pty. Ltd., Mitsui-Itochu Iron Pty. Ltd. andMitsui Coal Holdings Pty. Ltd. that are located in Australia is shown in “Mineral & Metal Resources Segment” of “Item4.B. Business Overview” and “Mining Activities” below.
60

In addition to the above, our major assets leased to others as of March 31, 2008 were as below:
• Clio Marine Inc. (Liberia), Lepta Shipping Co., Ltd. (Liberia) and LPG Transport Service Ltd.(Bermuda) own ocean vessels leased to foreign and domestic shipping companies whose combined bookvalue amounts to ¥31 billion; and
• Mitsui Rail Capital Holdings Inc. (United States) and Mitsui Rail Capital Europe B.V. (Netherlands)own rolling stock mainly leased to railway companies in the United States and European countriesamounting to ¥65 billion as book value.
For information on oil and gas producing activities, see “Supplementary Information on Oil and GasProducing Activities (Unaudited)” to the consolidated financial statements included elsewhere in this annualreport.
A portion of the land, buildings and equipment owned by us is subject to mortgages or other liens. As ofMarch 31, 2008, the aggregate amount of such mortgages or other liens was ¥34 billion. We know of no materialdefect in our title to any of the properties nor of any material adverse claim with respect to them, either pendingor contemplated.
We consider our offices and other facilities to be well maintained and believe that our plant capacity isadequate for our current requirements. For the information on plans to construct, expand or improve facilities, inparticular those related to mineral resource projects and oil and gas projects, see relevant descriptions in “Item4.A. History and Development of the Company—Capital Expenditures,” “Mineral & Metal Resources Segment”and “Energy Segment” of “Item 4.B. Business Overview” and “Mining Activities” below in this section.
We do not believe there are any material environmental issues that would affect the utilization of our assets.
61

Mining Activities
Information regarding our mining activities is provided below.
IRON ORE
Name of Joint VentureEntity by which Mitsui Participates in the Mining Activity and its Ownership InterestArea of Mining Operation (Region, State, Country)
Name of Mines(1) Location
Type ofMineral
Resources(2)Fe Basis
(%)Means of Accessto the Property Title/Lease
Type ofMine Power Source
Robe River Iron AssociatesMitsui Iron Ore Development Pty. Ltd. (33%)Pilbara Region, Western Australia, Australia
Mesa J(3) Robe Valley, northof the town ofPannawonica
Pisolite 57.2 Railway and port(owned by RobeRiver Iron Associatesand operated byPilbara Iron Pty Ltd.)
Agreements forlife of mine withGovernment ofWesternAustralia
Open pit Supplied throughthe integratedHamersley andRobe powernetwork operatedby Pilbara Iron
West Angelas(3) Approximately100 km west of thetown of Newman
MarraMamba
61.8 Same as above Same as above Open pit Same as above
Name of Mines(2) Location
Type ofMineral
Resources(3)Fe Basis
(%)Means of Accessto the Property Title/Lease
Type ofMine Power Source
Mt. Newman Joint VentureMitsui Itochu Iron Pty. Ltd. (10%) (Mitsui share of Mitsui Itochu Iron Pty. Ltd. is 70%)Pilbara Region, Western Australia, Australia
Mt. Whaleback Near the town ofNewman, 426 kmsouth of PortHedland
BrockmanMarraMamba
62.662.2
Railway (owned andoperated by Mt.Newman JointVenture) and port inPort Hedland (ownedand operated by Mt.Newman JointVenture)
Mineral leasegranted in 1967underthe Iron Ore(Mt. Newman)Agreement Act1964 scheduledto expire in 2009with rights forsuccessiverenewals for21 years
Open cut Sourced fromAlinta Dewap viaCompany-ownedpowerlines
Yandi Joint VentureMitsui Iron Ore Development Pty. Ltd. (7%)Pilbara Region, Western Australia, Australia
Marillana Creek 92 km north ofNewman, 310 kmsouth of PortHedland
ChannelIron Deposit
57.5 Rail spur (owned byYandi Joint Venture)connected to themain Newman/Hedland line (ownedand operated by Mt.Newmani JointVenture) and port inPort Hedland (ownedand operated by Mt.Newman JointVenture)
Mining leasegranted in 1991under the IronOre (MarillanaCreek)Agreement Act1991 scheduledto expire in 2012with the right toextend foradditional42 years
Open cut Sourced fromAlinta Dewap viaCompany-ownedpowerlines
62

Name of Mines(2) Location
Type ofMineral
Resources(3)Fe Basis
(%)Means of Accessto the Property Title/Lease
Type ofMine Power Source
Mt. Goldsworthy Joint VentureMitsui Iron Ore Development Pty. Ltd. (7%)Pilbara Region, Western Australia, Australia
Northern(Yarrie)(Nimingarra)
210 km east of PortHedland
Nimingarra 59.9 Railway (owned andoperated by Mt.Goldsworthy JointVenture) and theNelson Pointshipping facilities atPort Hedland (ownedand operated by Mt.Newman JointVenture)
Four mineralleases under theIron Ore (Mt.Goldsworthy)Agreement Act1964 and the IronOre(Goldsworthy—Nimingarra)Agreement Act1972, which haveexpiry datesbetween 2007and 2014 withrights tosuccessiverenewals of 21years.
Open cut Sourced fromAlinta Dewap
Area C 120 km northwest ofNewman, 37 kmsouthwest of Yandi
MarraMamba
61.9 Rail spur (owned byGoldsworthy JointVenture) connectingto the Yandi spur line(owned by YandiJoint Venture) andthen onto the mainNewman/ Hedlandline (owned andoperated by Mt.Newman JointVenture) and theFinucane Islandshipping facilities atPort Hedland (ownedand operated byGoldsworthy JointVenture)
Same as above Open cut Sourced fromNewman Power
(1) “Name of Mines” indicates the names of principal producing mines.(2) “Pisolite”, “Marra Mamba”, “Brockman”, “Channel Iron Deposit” and “Nimingarra” refer to the types of iron ore that are found in the
Pilbara region of Western Australia.(3) The percentage figures of “Fe Basis” of Mesa J and West Angelas represent the figures corresponding to mines, excluding the figures
corresponding to stockpile components.
63
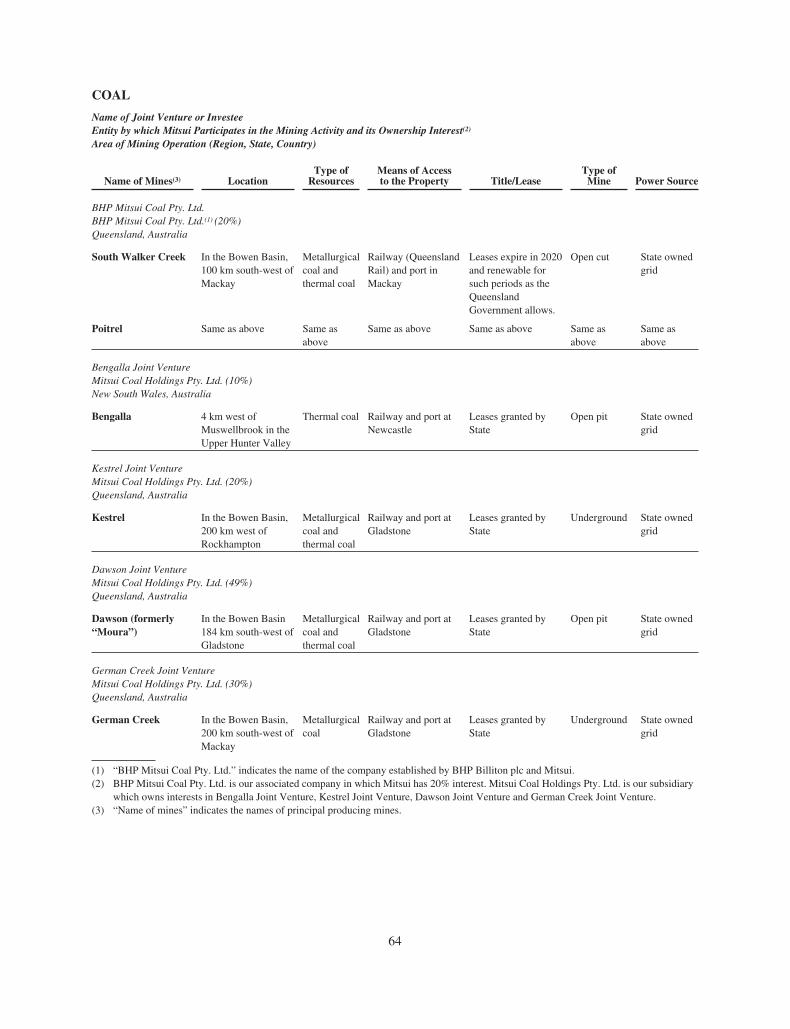
COAL
Name of Joint Venture or InvesteeEntity by which Mitsui Participates in the Mining Activity and its Ownership Interest(2)
Area of Mining Operation (Region, State, Country)
Name of Mines(3) LocationType of
ResourcesMeans of Accessto the Property Title/Lease
Type ofMine Power Source
BHP Mitsui Coal Pty. Ltd.BHP Mitsui Coal Pty. Ltd.(1) (20%)Queensland, Australia
South Walker Creek In the Bowen Basin,100 km south-west ofMackay
Metallurgicalcoal andthermal coal
Railway (QueenslandRail) and port inMackay
Leases expire in 2020and renewable forsuch periods as theQueenslandGovernment allows.
Open cut State ownedgrid
Poitrel Same as above Same asabove
Same as above Same as above Same asabove
Same asabove
Bengalla Joint VentureMitsui Coal Holdings Pty. Ltd. (10%)New South Wales, Australia
Bengalla 4 km west ofMuswellbrook in theUpper Hunter Valley
Thermal coal Railway and port atNewcastle
Leases granted byState
Open pit State ownedgrid
Kestrel Joint VentureMitsui Coal Holdings Pty. Ltd. (20%)Queensland, Australia
Kestrel In the Bowen Basin,200 km west ofRockhampton
Metallurgicalcoal andthermal coal
Railway and port atGladstone
Leases granted byState
Underground State ownedgrid
Dawson Joint VentureMitsui Coal Holdings Pty. Ltd. (49%)Queensland, Australia
Dawson (formerly“Moura”)
In the Bowen Basin184 km south-west ofGladstone
Metallurgicalcoal andthermal coal
Railway and port atGladstone
Leases granted byState
Open pit State ownedgrid
German Creek Joint VentureMitsui Coal Holdings Pty. Ltd. (30%)Queensland, Australia
German Creek In the Bowen Basin,200 km south-west ofMackay
Metallurgicalcoal
Railway and port atGladstone
Leases granted byState
Underground State ownedgrid
(1) “BHP Mitsui Coal Pty. Ltd.” indicates the name of the company established by BHP Billiton plc and Mitsui.(2) BHP Mitsui Coal Pty. Ltd. is our associated company in which Mitsui has 20% interest. Mitsui Coal Holdings Pty. Ltd. is our subsidiary
which owns interests in Bengalla Joint Venture, Kestrel Joint Venture, Dawson Joint Venture and German Creek Joint Venture.(3) “Name of mines” indicates the names of principal producing mines.
64

A brief history and the present condition of each of the above-mentioned mines, including the current stateof development, if applicable, are provided below.
IRON ORE
Name of Joint VentureEntity by which Mitsui Participates in the Mining Activity and its Ownership InterestArea of Mining Operation (Region, State, Country)
Robe River Iron AssociatesMitsui Iron Ore Development Pty. Ltd. (33%)Pilbara Region, Western Australia, Australia
Mesa J The development of the Robe River project began in 1962(*) near Pannawonica. The Robe River project wascommissioned and the first shipment was made in 1972. Iron ore reserves at the Mesa J production Baseprovide the cornerstone of Pannawonica’s sinter fines and lump output. Development of Mesa J began in1992, and all mine administration, workshops, warehousing and other support facilities were integrated therein 1994. The mine produces Rove River fines and lump, which are pisolitic iron ore products. Process Plant 1was commissioned in 1999 and Process Plant 2 in 2001. The plant processes clay-contaminated pisolite,sub-grade material which was once discarded, to reduce contaminants and retain on-specification ore. InDecember 2007, the joint venture decided to develop Mesa A / Warramboo mine which will have a full scalecapacity of 25 million tons per annum and is expected to start production in 2010. The total capital cost willbe estimated at US$901 million. The total mine life of Mesa A is expected to be 11 years. With this addition,total production of Robe Valley pisolite ore will be maintained at 32 million tons per annum.
West Angelas The development of West Angelas began in 1998. Mining of ore commenced in March 2002. The WestAngelas deposits contain Marra Mamba type iron ore with higher iron content than Robe River’s Mesa Jmine. The West Angelas operation is comprised of an open pit mine, a crushing and screening oreprocessing plant producing lump and sinter fines iron ore, as well as stockpiling, reclaiming and train-loading facilities. Further expansion of the West Angelas mine was completed ahead of schedule in October2005. This US$105 million project took the mine’s production capacity to 25 million tons per year. RobeRiver Iron Associates uses a dedicated rail system, operated by Pilbara Iron, to transport ore from its minesto the company’s deepwater port facilities at Cape Lambert. Also, a US$200 million rail expansion projectto duplicate almost 100 kilometers of track and associated interconnection and infrastructure to increase thecapacity of the Pilbara Iron main line completed in the first quarter of 2006. In January 2007, a furtherexpansion plan was decided to increase port capacity at Cape Lambert from nameplate capacity of 55 to 80million tones per year by the end of 2008. Completion of the expansion is scheduled for the fourth quarterof 2008 and the total cost of the capital is estimated approximately US$860 million.
(*) The Robe River project was originally started by Cleveland Cliffs Iron Company, an iron and steel producer in the United States. Sincethen, there were major changes in ownership before Rio Tinto took a 53% stake in Robe River Iron Associates in 2000.
Mt. Newman Joint VentureMitsui Itochu Iron Pty. Ltd. (10%) (Mitsui share of Mitsui Itochu Iron Pty. Ltd. is 70%)Pilbara Region, Western Australia, Australia
Mt. Whaleback The joint venture began production in 1969 at the Mt. Whaleback ore body. Today, production continues tobe sourced from the major Mt. Whaleback ore body and is complemented by production from other orebodies, namely Orebody 18, 23, 25, 29 and 30 and Jimblebar, which we are involved in through theWheelarra arrangement with BHP Iron Ore (Jimblebar) Pty Ltd, Itochu Minerals & Energy Australia Pty Ltd,and 4 Chinese steel companies.
The facilities at Mt. Whaleback include primary and secondary crushing plants with a nominal capacity of35 million tons of product per year, a heavy media beneficiation plant with an annual capacity of 8 milliontons and a train-loading facility. An additional primary and secondary crushing plant is present at Orebody 25with a nominal capacity of 8 million tons of product per year.
65

Yandi Joint VentureMitsui Iron Ore Development Pty. Ltd. (7%)Pilbara Region, Western Australia, Australia
Marillana Creek Development of the ore body began in 1991 with a capacity of 10 million tons per annum and the project’sfirst shipment of iron ore was in March 1992. Capacity was progressively expanded between 1994 and 2003and the current capacity is 42 million tons per annum. Two processing plants and a primary crusher andoverland conveyor are used to crush and screen the Yandi ore and deliver it to one of two train loadingfacilities.
Mt. Goldsworthy Joint VentureMitsui Iron Ore Development Pty. Ltd. (7%)Pilbara Region, Western Australia, Australia
Northern(Yarrie)(Nimingarra)
Mt. Goldsworthy was commissioned in 1966 in the North Area. The original Goldsworthy mine was closedin 1982 and mining operations ceased at Shay Gap mine in 1993. Since then, mining has continued from theadjacent Nimingarra and Yarrie, 30 kilometers to the south-east. Two primary crushers exist, one at Yarrieand the other at Nimingarra. The ore is crushed and then railed to Port Hedland.
Area C In October 2003, the joint venture opened the new Area C mine located 120 kilometers north-west ofNewman, which produces a Marra Mamba ore deposit, which is sold under the trademark MAC. Allproduction from the Mt. Goldsworthy Northern (Yarrie and Nimingarra) is transported on a separaterailway to Port Hedland. Ore from Area C is transported via a 39 kilometer new section of railway to theYandi mine which then connects to the Newman main line to Port Hedland.
Development projects at jointventures with BHP BillitonLtd.
The three joint ventures, namely, Mt. Newman joint venture, Yandi joint venture and Mt. Goldsworthy jointventure have been planning for staged expansions of supply capacity. As a step, in October 2005 theyapproved an expansion plan to add 20 million tons per annum to their capacity, upgrading combinedcapacity to 129 million tons per annum by 2007. The capital expenditure for the expansion work totaledA$2.2 billion (Mitsui’s share was approximately A$150 million). The expansion focused mainly on theArea C mine and encompassed expansions of rail systems and the loading port. In addition, in March 2007,the joint ventures approved to increase annual production capacity to 155 million tons per annum by 2010.The capital expenditure for the expansion will total approximately A$2.7 billion. The expansion includesdevelopment of a new crushing and screening plant, as well as additional stockyard, car dumping and trainloading facilities at Mt. Whaleback. Furthermore, in February 2008, the joint venture agreed to approveUS$1,094 million of capital investment representing pre approval of expenditure involving the duplicationof the railway track between the Yandi mine and Port Hedland, and the expansion of Port Hedland, inparallel with current construction, with the aim being to increase annual production capacity to 200 milliontons per annum by 2011.
66

COAL
Name of Joint Venture or InvesteeEntity by which Mitsui Participates in the Mining Activity and its Ownership InterestArea of Mining Operation (Region, State, Country)
BHP Mitsui Coal Pty. Ltd.BHP Mitsui Coal Pty. Ltd. (20%)Queensland, Australia
South Walker Creek The joint venture commissioned Riverside in 1983, and its reserves were depleted in March 2005. SouthWalker Creek became operational in 1998. It produces pulverized coal injection fuel and minor quantitiesof by- product energy coal. South Walker Creek has a production capacity of four million tons per year.Exploration has increased the reserve base in the past year. BHP Mitsui Coal holds undeveloped leases inthe Bowen Basin.
Poitrel The mine was commissioned during the December 2006 quarter. The mine has a production capacity of 3.0million tons per annual of metallurgical and PCI coals.
Bengalla Joint VentureMitsui Coal Holdings Pty. Ltd. (10%)New South Wales, Australia
Bengalla Development consent was granted in 1996 and production commenced in 1999. Coal & Allied, Rio Tinto’ssubsidiary in Australia, acquired its interest in Bengalla in 2001. Its coal preparation plant has beendesigned to allow the mine to produce low ash thermal coal for export. Production in 2007 was 5.2 milliontons of thermal coal.
Kestrel Joint VentureMitsui Coal Holdings Pty. Ltd. (20%)Queensland, Australia
Kestrel The Kestrel Coal mine, previously known as Gordonstone Mine, commenced operation in 1992. Coal isextracted by underground mining. The mine has two longwall units that are operated alternately tominimize downtime and ensure seamless production and reliability. The Kestrel Preparation Plant has beendesigned to allow the mine to produce low ash coking coal and high energy thermal coal. Production in2007 was 3.6 million tons saleable high quality coking coal and export thermal coal. In January 2008, jointventure approved development of the new mining area for extend the operation period of Kestrel JointVenture as the existing mining area is expected to be exhausted in 2014. Construction of this project willstart within 2008 upon obtaining the government’s approvals and the total capital expenditure will beA$1,443 million. The operation is expected to commence in 2012 and the project estimates a maximum 6.5million tons per annum coal production with 20-year operation.
Dawson Joint VentureMitsui Coal Holdings Pty. Ltd. (49%)Queensland, Australia
Dawson(formerly “Moura”)
Dawson Joint Venture was originally called Moura Joint Venture. The Moura Mine commenced operationin 1961. Since 1994, all production at Moura has been from its surface operation. Production tonnage hasbeen increasing steadily throughout the years. After a few changes of ownership, Anglo Coal acquired a51% share in 2002. In September 2003, the adjacent Theodore deposit was developed which furtherexpanded its capacity. Anglo Coal Australia and Mitsui Coal Holdings intend to recapitalize their existingoperations at the Moura mine and to establish two additional operations on adjacent tenures. The new andexpanded operations are known as the Dawson Complex. Moura Joint Venture has already changed itsname to Dawson Joint Venture. The joint venture’s capital expenditure was estimated in excess ofA$1 billion. Expansion work of the Dawson complex was completed in the year ended March 31, 2008,aiming to boost annual coal production from the present capacity of 6.5 million tons per annum to12.7 million tons of metallurgical and thermal coals.
German Creek Joint VentureMitsui Coal Holdings Pty. Ltd. (30%)Queensland, Australia
German Creek Open pit mining commenced in 1981. Underground mining in the Central Colliery area started in 1984, whileunderground mining in the Southern Colliery area began in 1988. Grasstree is a new underground minewhich commenced production in 2006 and produces hard coking coal for our export markets. In addition, thejoint venture has started the development of Lake Lindsay mine, a new open cut mine adjacent to GermanCreek mine, with estimated ultimate completion during 2008, to increase the aggregate annual productionfrom 6 to 10 million tons per annum and to extend the total joint venture’s mine life by about 11 years.
67

Production Tonnage
IRON ORE
Production tonnage figures in the table below represent those of marketable products as tonnage afteraccounting for extraction and beneficiation losses.
In Thousands of Tons
Year Ended March 31,
2008 2007 2006
Joint Venture or Investee andName of Mines
Mitsui’s Subsidiaryor
Associated Company LocationTotal
ProductionMitsui’sShare
TotalProduction
Mitsui’sShare
TotalProduction
Mitsui’sShare
Robe River Iron Associates Mitsui Iron OreDevelopment Pty.Ltd.
PilbaraRegion,WesternAustralia
Pannawonica . . . . . . . . . . . . 26,132 8,624 28,960 9,557 30,129 9943
West Angelas . . . . . . . . . . . . 26,756 8,829 24,866 8,206 21,149 6,979
Mt. Newman Joint Venture Mitsui Itochu IronPty. Ltd.
PilbaraRegion,WesternAustralia
Mt. Whaleback(1) . . . . . . . . . 42,808 2,997 39,828 2,788 36,021 2,521
Yandi Joint Venture Mitsui Iron OreDevelopment Pty.Ltd.
PilbaraRegion,WesternAustralia
Marillana Creek . . . . . . . . . . 46,253 3,238 40,872 2,861 40,335 2,823
Mt. Goldsworthy Joint Venture Mitsui Iron OreDevelopment Pty.Ltd.
PilbaraRegion,WesternAustralia
Northern . . . . . . . . . . . . . . . .(Yarrie)(Nimingarra)
1,041 73 3,341 234 7,089 496
Area C . . . . . . . . . . . . . . . . . . 27,744 1,942 24,011 1,681 20,471 1,433
Sesa Goa Limited(2) Sesa Goa Limited India
Codli, Sonshi . . . . . . . . . . . . Goa — — 4,125 2,104 3,998 2,039
Chitradurga, Hospet . . . . . . Karnataka — — 1,433 736 1,578 805
TOTAL 170,734 25,703 167,446 28,167 160,770 27,039
(1) “Name of Mines” indicates the names of principal producing mines.(2) We sold our whole stake in Sesa Goa Limited in April 2007.
68

COAL
Production tonnage figures in the table below represent those of marketable products as tonnage afteraccounting for extraction and beneficiation losses.
In Thousands of Tons
Year Ended March 31,
2008 2007 2006
Joint Venture or Investee andName of Mines
Mitsui’s Subsidiaryor
Associated Company LocationTotal
ProductionMitsui’sShare
TotalProduction
Mitsui’sShare
TotalProduction
Mitsui’sShare
BHP Mitsui Coal Pty. Ltd. BHP Mitsui CoalPty. Ltd.
Queensland,Australia
Riverside . . . . . . . . . . . . . . — — — — 2,384 477South Walker Creek . . . . 3,422 684 3,049 610 3,273 655Poitrel . . . . . . . . . . . . . . . . 1,438 288 373 75 — —
Bengalla Joint Venture Mitsui Coal HoldingsPty. Ltd.
New SouthWales,Australia
5,155 516 5,544 554 5,965 596
Kestrel Joint Venture Mitsui Coal HoldingsPty. Ltd.
Queensland,Australia
3,621 724 3,592 718 3,720 744
Dawson Joint Venture(formerly “Moura JointVenture”)
Mitsui Coal HoldingsPty. Ltd.
Queensland,Australia
5,984 2,932 6,903 3,382 6,200 3,038
German Creek Joint Venture Mitsui Coal HoldingsPty. Ltd.
Queensland,Australia
5,880 1,764 4,522 1,357 5,086 1,526
TOTAL 25,500 6,908 23,983 6,696 26,628 7,036
Reserve Tonnage
IRON ORE
Reserves of iron ore classified according to operator are presented in the tables below.
Operator: Rio Tinto Ltd.(1)(2)
Reserves as disclosed by Rio Tinto Ltd. consist of proved and probable reserves.
In Millions of Tons
Year Ended December 31,
2007 2006 2005
Joint Venture or Investee andName of Mines
Mitsui’s Subsidiaryor
Associated Company LocationTotal
ReserveMitsui’sShare
TotalReserve
Mitsui’sShare
TotalReserve
Mitsui’sShare
Robe River Iron Associates Mitsui Iron OreDevelopmentPty. Ltd.
PilbaraRegion,WesternAustralia
Pannawonica(3) . . . . . . . . . . . . . . . . . . . . 304 100 345 114 303 100West Angelas(3) . . . . . . . . . . . . . . . . . . . 391 129 408 135 394 130
(1) Iron ore reserves are shown as recoverable reserves of saleable product after accounting for all mining and processing losses. Millrecoveries are not shown.
(2) Reserves of Robe River Iron Associates indicate reserves as of the end of December 2007, 2006 and 2005.(3) Stockpile components of reserves are included.
69

Operator: BHP Billiton Ltd.(1)(2)(3)
Reserve amounts of Mt. Newman, Yandi and Mt. Goldsworthy consist of proved and probable reserves.
In Millions of Tons
Year Ended June 30,
2007 2006 2005
Joint Venture or Investee andName of Mines
Mitsui’s Subsidiaryor
Associated Company LocationTotal
ReserveMitsui’sShare
TotalReserve
Mitsui’sShare
TotalReserve
Mitsui’sShare
Mt. Newman Joint Venture Mitsui Itochu IronPty. Ltd.
PilbaraRegion,WesternAustralia
Mt. Whaleback(4) . . . . . . . . . . . . . . . . . . 847 59 799 56 836 59
Yandi Joint Venture Mitsui Iron OreDevelopmentPty. Ltd.
PilbaraRegion,WesternAustralia
Marillana Creek . . . . . . . . . . . . . . . . . . . 913 64 848 59 860 60
Mt. Goldsworthy Joint Venture Mitsui Iron OreDevelopmentPty. Ltd.
PilbaraRegion,WesternAustralia
Northern . . . . . . . . . . . . . . . . . . . . . . . . .(Yarrie)(Nimingarra)
3 0 7 0 14 1
Area C . . . . . . . . . . . . . . . . . . . . . . . . . . . 418 29 442 31 474 33
(1) Metallurgical recoveries for the operations are 100% except for Mt. Newman Joint Venture for which metallurgical recovery is 92%.(2) For Mt. Newman, Mt. Goldsworthy and Yandi joint ventures tonnages represent wet tons based on the following moisture contents:
BKM - 3%, MM - 4%, CID - 8%, NIM - 3.5%. Iron ore is marketed as Lump (direct blast furnace feed) and Fines (sinter plant feed).(3) The reserves are divided into joint ventures and material types that reflect the various products produced. The West Australian ore types
are classified as per the host Archaean or Proterozoic banded iron formations. Ore types are BKM – Brockman, MM – Marra Mamba,NIM – Nimingarra, CID – Channel Iron Deposit.
(4) Mining dilution and mining recovery (in general around 95%) has been taken into account in the estimation of reserves.(5) Changes to the reserves as of 2007 compared to 2006 are due to mining depletion, new models and/or reclassification for the Mt.
Newman JV Whaleback, OB24 Far West, OB25 Pit 3 and OB18 deposits; Yandi JV Central 2 and 5, Eastern 1, 3, 5 and 6 deposits; AreaC E and F Deposits.
(6) Cut-off grades used to estimate reserves: Mt. Newman 50–62%Fe for BKM, 60%Fe for MM; Mt. Goldsworthy 58%Fe for NIM, 57%Fefor MM; Yandi 56%Fe for CID.
(7) Reserves provided in the table above indicate reserves as of the end of June 2007, 2006 and 2005.(8) “Name of Mines” indicates the names of principal producing mines.
70

COAL
In the table below, coal reserves are shown as marketable reserves, which are tonnage after accounting forextraction and processing and preparation losses.
In Millions of Tons
Joint Venture or Investee andName of Mines
Mitsui’sSubsidiary
orAssociatedCompany
Year Ended March 31,
2008 2007 2006
Operator LocationTotal
ReserveMitsui’sShare
TotalReserve
Mitsui’sShare
TotalReserve
Mitsui’sShare
BHP Mitsui Coal Pty. Ltd.(1) BHP Billiton Ltd. BHP MitsuiCoal Pty. Ltd.
Queensland,Australia
South Walker Creek . . . 35 7 34 7 45 9Poitrel . . . . . . . . . . . . . . . 51 10 — — — —
Bengalla Joint Venture(2) . . . . Rio Tinto Ltd. Mitsui CoalHoldings Pty.Ltd.
New SouthWales,Australia
137 14 150 15 155 16
Kestrel Joint Venture(2) . . . . . Rio Tinto Ltd. Mitsui CoalHoldings Pty.Ltd.
Queensland,Australia
136 27 112 22 116 23
Dawson Joint Venture(2) . . . . .(formerly Moura JointVenture)
Anglo American Mitsui CoalHoldings Pty.Ltd.
Queensland,Australia
281 138 288 141 298 146
German Creek JointVenture(2) . . . . . . . . . . . . . . . . .(including Lake LindsayMine)
Anglo American Mitsui CoalHoldings Pty.Ltd.
Queensland,Australia
140 42 168 50 177 53
TOTAL 780 238 752 235 791 247
(1) Reserves of BHP Mitsui Coal Pty. Ltd. indicates reserves as of the end of June 2007, 2006 and 2005, respectively. 2008 reserves meansreserves as of the end of June 2007. Poitrel mine commenced production in November 2006.
(2) Reserves of Bengalla Joint Venture, Kestrel Joint Venture, Dawson Joint Venture and German Creek Joint Venture indicate reserves asof the end of December 2007, 2006 and 2005, respectively. 2008 reserves mean reserves as of the end of December 2007.
We hold a 15% profit share in Valepar S.A., which held a 32.5% profit share of the common stock andpreferred stock of Companhia Vale do Rio Doce (“Vale”) as of December 31, 2007. Accordingly, 4.9%(32.5% x 15%) of Vale’s production and reserve amounts are indirectly attributable to us. The following tableprovides iron ore production and reserve amounts for Vale, and Mitsui’s share of the production and reserveamounts of Vale.
Production Tonnage (for the year ended December 31)
Millions of Tons
2007 2006 2005
Total Production Mitsui’s Share Total Production Mitsui’s Share Total Production Mitsui’s Share
295.9 14.4 264.2 12.9 233.9 11.9
Proven and Probable Reserves (as of December 31)
Millions of Tons
2007 2006 2005
Total Reserve Mitsui’s Share Total Reserve Mitsui’s Share Total Reserve Mitsui’s Share
7,267.8 353.9 7,619.3 371.0 7,981.8 407.7
71

Oil and Gas Producing Activities
The following table shows crude oil, condensate, natural gas liquids and natural gas production from ourreserves for the three fiscal years indicated:
Production Information
Millions of Barrels Billions of Cubic Feet
Crude Oil, Condensate andNatural Gas Liquids(1) Natural Gas(1)(3)
Consolidated CompaniesAssociatedCompanies
Worldwide
Consolidated CompaniesAssociatedCompanies
WorldwideYear EndedMarch 31,
OceaniaandAsia
MiddleEast Others Oceania Others
OceaniaandAsia
MiddleEast Others Oceania Others
2008 . . . . . . . . . 16 3 2 5 1 27 107 6 5 44 3 1652007 . . . . . . . . . 11 3 1 6 4 25 96 6 3 45 6 1562006 . . . . . . . . . 1 3 — 5 5 14 2 6 — 57 39 104
The following tables show proved reserves and proved developed reserves of crude oil, condensate, naturalgas liquids and natural gas as of the ending date of three fiscal years indicated:
Proved Reserve Information:
Proved Reserves
Millions of Barrels Billions of Cubic Feet
Crude Oil, Condensate andNatural Gas Liquids(1) Natural Gas(1)(3)
Consolidated CompaniesAssociatedCompanies
Worldwide
Consolidated CompaniesAssociatedCompanies
WorldwideAs of March 31,
OceaniaandAsia
MiddleEast Others Oceania Others
OceaniaandAsia
MiddleEast Others Oceania Others
2008 . . . . . . . . . 74(4) 18 14 35 4(5) 145 664(4) 32 31 722 189(5) 1,6382007 . . . . . . . . . 72(4) 23 15 37 91 238 344(4) 31 38 740 1,668 2,8212006 . . . . . . . . . 55 23 — 39 104 221 80 40 — 801 1,789 2,710
Proved Developed Reserves(2)
Millions of Barrels Billions of Cubic Feet
Crude Oil, Condensate andNatural Gas Liquids(1) Natural Gas(1)(3)
Consolidated CompaniesAssociatedCompanies
Worldwide
Consolidated CompaniesAssociatedCompanies
WorldwideAs of March 31,
OceaniaandAsia
MiddleEast Others Oceania Others
OceaniaandAsia
MiddleEast Others Oceania Others
2008 . . . . . . . . . 55(4) 14 11 20 3 102 322(4) 15 21 454 182 9942007 . . . . . . . . . 46(4) 18 11 21 24 120 299(4) 19 24 385 11 7382006 . . . . . . . . . 7 18 — 13 25 63 56 39 — 263 67 425
(1) 1 barrel of crude oil = 5,800 cubic feet of natural gas(2) The proportion of Proved Developed Reserves to Proved Developed and Undeveloped Reserves was about 34 percent as of March 31,
2007 and relatively low. The expected costs to develop these undeveloped reserves were estimated to be ¥502 billion in total as ofMarch 31, 2007. The proportion of Proved Developed Reserves to Proved Developed and Undeveloped Reserves was about 64 percentas of March 31, 2008 and the expected costs to develop these undeveloped reserves are estimated to be ¥248 billion in total as ofMarch 31, 2008. This large proportion change is mainly due to the reduction of Mitsui’s interest in Sakhalin II project.
(3) The proved gas reserves are restricted to those volumes that are related to firm sales commitments.
72

(4) Includes total proved reserves attributable to Mitsui Oil Exploration Co., Ltd. of 19 million and 37 million barrels of Crude oil, Condensateand Natural Gas Liquids and 265 billions and 636 billions of cubic feet of Natural Gas as of March 2007 and 2008, as well as proveddeveloped reserves of 18 million and 18 million barrels of Crude oil, Condensate and Natural Gas Liquids and 227 billions and 294 billionsof cubic feet of Natural Gas in March 2007 and 2008, respectively, in which there were a 49.7 percent and a 48.5 percent minority interest.
(5) Includes decreases of 96 million barrels in sales of Crude oil, Condensate and Natural Gas Liquids and 1,658 billions of cubic feet insales of Natural Gas in place, which were mainly related to the reduction of Mitsui’s interest in Sakhalin II project.
Information on our oil and gas producing activities is shown in the “Supplemental Information on Oil andGas Producing Activities (Unaudited)” to the consolidated financial statements included elsewhere in this annualreport. Also see “Operating and Financial Review and Prospects—Operating Results by Operating Segment—Energy Segment.”
Item 4A. Unresolved Staff Comments
We are a large accelerated filer as defined in Rule 12b-2 under the Securities Exchange Act of 1934. Thereare no written comments which have been provided by the staff of the Securities and Exchange Commissionregarding our periodic reports under that Act not less than 180 days before the end of the fiscal year endedMarch 31, 2008 and which remain unresolved as of the date of the filing of this Form 20-F with the Commissionand which we believe are material.
Item 5. Operating and Financial Review and Prospects
A. Operating Results
You should read the following discussion and analysis of our financial condition and results of operationstogether with “Selected Financial Data” and our consolidated financial statements that appear elsewhere in thisannual report. Please note that you should be aware that this discussion and analysis contains forward-lookingstatements that involve risks, uncertainties and assumptions. Our actual results may differ materially from thoseanticipated in these forward-looking statements.
As used in this Operating and Financial Review and Prospects, “Mitsui” is used to refer to Mitsui & Co.,Ltd. (Mitsui Bussan Kabushiki Kaisha), and “we,” “us,” and “our” are used to indicate Mitsui & Co., Ltd. and itssubsidiaries, unless otherwise indicated.
In the Consolidated Financial Statements and accompanying Notes to Consolidated Financial Statements,the “Company” is used to refer to Mitsui & Co., Ltd., and the “companies” is used to refer to Mitsui & Co., Ltd.and its subsidiaries, unless otherwise indicated.
All references to “Note” throughout the Operating and Financial Review and Prospects relate to the Notes toConsolidated Financial Statements contained elsewhere in this Annual Report.
Throughout the Operating and Financial Review and Prospects, we describe the domicile of our subsidiariesand associated companies in parentheses following names of those companies. For example, Mitsui Iron OreDevelopment, Pty. Ltd. (Australia) means that the company’s name is Mitsui Iron Ore Development, Pty. Ltd.and that it is domiciled in Australia.
Operations of a subsidiary that has either been disposed of or is classified as held for sale have beenaccounted for as discontinued operations under accounting principles generally accepted in the United States ofAmerica (“U.S. GAAP”). This means that income statement and cash flow information is reclassified for pastyears to separate the discontinued operations from our continuing operations. This presentation is required byU.S. GAAP and facilitates historical and future trend analysis of our continuing operations.
Key Performance Measures under Management’s Discussion
Although our operating results and financial condition are influenced by various factors, managementbelieves that as of the end of the fiscal year under review the following indicators can be usefully employed todiscuss trends in our performance and financial condition.
73
Gross profit, operating income* and equity in earnings of associated companies
We undertake worldwide business activities, involving diversified risk-return profiles, ranging fromintermediary services as agent to development and production activities of mineral resources and energy. In thiscontext, changes in the amounts of gross profit, operating income and equity in earnings of associated companiesby operating segment reflect the overall progress of our business, and greatly affect the amount of net income inthe Statements of Consolidated Income. For further information, refer to the table of “Operating SegmentInformation” and subsequent discussions in “Operating Results by Operating Segment” in this Operating andFinancial Review and Prospects.
Trends in the price of and supply-demand for mineral resources and energy
In recent years, we have observed a rapid growth in the operating results from our mineral resources andenergy producing activities; and, the significance of these operations to our overall operating results has increaseddramatically. These results have been brought on by rising prices as well as increased production, reflecting globallytightened supply-demand balance and increased prices of mineral resources and energy that have been driven byexpanding demand from emerging countries, particularly China. Furthermore, management recognize that for sometime to come such global supply-demand balance and price fluctuations of mineral resources and energy willcontinuously have a material impact, positive or negative, on our operating results, financial condition and business.For further information regarding trends and prospects in this field, refer to the sections relating to the Mineral &Metal Resources Segment and the Energy Segment in “Operating Results by Operating Segment.”
Investment plans and cash flow from investing activities; and financial leverage
Consistent with our Medium-Term Management Outlook announced in May 2006, we have established agroup-wide strategic business portfolio, by leveraging proactive investment activities in the four business areasof Mineral Resources and Energy Area; Global Marketing Networks Area, including steel products, chemicalsand machinery; Infrastructure Area, including power generation; and Consumer Services Area, includingoutsourcing services and content businesses. In parallel, management monitors the progress of investment plansquarterly and addresses divestitures of existing assets in order to maintain an optimum portfolio structure andalso to generate additional cash flows as a source for the above-mentioned investments. Mitsui is monitoring andmanaging a group-wide financial leverage seeking to secure an efficient return on equity as well as maintainingand improving credit ratings and financial stability in order to secure necessary capital resources for investmentsas well as to refinance our interest bearing debt. For further information regarding details of expenditures and ourfinancial policy, refer to “Liquidity and Capital Resources.”
Results of Operations
Summary of Operations for the Years Ended March 31, 2008 and 2007
Principal developments in the economic environment that influenced our operations during the years endedMarch 31, 2008 and 2007 included the following:
Operating Environment for the Year Ended March 31, 2008
The global economy continued to expand vigorously supported by generally sound fundamentals and strongmomentum in the Asian economy, led by China, and resilient activities in Europe and Japan, despite increasinguncertainty about the outlook of the United States with concerns that financial market strains could deepen andtrigger a more pronounced economic slowdown.
* Operating Income
Operating income is included in the measure of segment performance reviewed by the chief operating decisionmaker. Operating income is comprised of our (a) gross profit, (b) selling, general and administrative expensesand (c) provision for doubtful receivables, as presented in the Statements of Consolidated Income.
74

Continued run-up of prices of internationally traded commodities such as metals and crude oil, as well ascontinued strong growth of domestic demand in emerging countries, including BRICs, for capital investment andconsumption were the two major factors influencing the operating results and businesses of Mitsui and itssubsidiaries. These factors particularly boosted operating results of our mineral resources and energy relatedactivities and supported steady business performance in steel products, machinery & infrastructure andchemicals.
On a regional basis, the business sentiment in the United States, which enjoyed moderate growth during thefirst half of the year as a result of healthy consumer spending, reflecting robust performance in the businesssector and growth in real disposable income, deteriorated significantly in the second half, reflecting financialstress which erupted in August 2007 as the subprime mortgage market was derailed, leading to tightening ofcredit conditions, considerable deceleration of consumer spending due to sharp increases in the prices of crudeoil and food products, as well as softening of the labor market. The European economy slowed down moderatelyas construction investments peaked out in the region. In Japan, exports of automotive, steel and chemicalproducts to emerging economies drove a high level of industrial production. On the other hand, uncertaintiesincreased in the corporate and household sectors reflecting a decline in construction investments caused byrevision of the Japanese building standards regulation as well as rising prices of material costs and consumergoods including foodstuffs.
Looking into financial and foreign exchange markets, the Federal Reserve Board of the United States(“FRB”) implemented a series of interest rate cuts to try to stabilize the financial market. In foreign exchangemarkets, the U.S. dollar continued to depreciate against most major currencies, and fell below ¥100/ U.S. dollarin March 2008, the lowest value in 13 years. Furthermore, stock markets worldwide saw falling share prices inthe latter half of the fiscal year.
Operating Environment for the Year Ended March 31, 2007
During the year ended March 31, 2007, the global economy overall continued its steady expansion. In theUnited States, corporate profits remained robust and consumer spending continued to increase due to favorableemployment and wage conditions, and despite an easing in housing investment, which had been overheating, theeconomy performed steadily overall. In Asia, sustained high growth in China has continued, driven by furtherincreases in capital investments within the region and exports to other regions. In Europe, the economydemonstrated a clear recovery trend, as illustrated by the growth of exports in Germany and other factors.
This broad-based expansion of the global economy underpinned strong international commodities markets.Prices of crude oil, mineral resources, non-ferrous metals and other commodities reached record-high levels inthe summer, and despite falling thereafter, remained at high levels.
The global trend towards steadily higher interest rates continued. In the United States, the FRB, which hadcontinued to raise interest rates progressively since June 2004, maintained a constant rate beginning in June2006. In Europe, the European Central Bank continued to raise interest rates since 2005.
The Japanese economy continued its solid recovery. Exports continued to increase, bolstered by globaleconomic expansion and the weakening yen. Strong corporate sector results led to high growth in capitalinvestment, while improvements in employment and wages led to firmer consumer spending. The Bank of Japandecided to terminate its zero interest rate policy in July 2006, and raised the policy interest rate in February 2007,reflecting the robust recovery of the economy and consumer prices turning positive. In foreign exchange rates,the yen continued to weaken, particularly against the Euro, against which the yen recorded its lowest level sincethe introduction of the Euro in 1999.
75

Overview of the Financial Results for the Year Ended March 31, 2008
• Operating results
— We recorded consolidated net income of ¥410.1 billion for the year ended March 31, 2008, asignificant increase of ¥108.6 billion, or 36.0 %, from ¥301.5 billion for the year ended March 31,2007. In regards to the individual segments, the Mineral & Metal Resources and the Energybusinesses made outstanding performances with increases of ¥78.7 billion and ¥48.4 billion,respectively, reflecting substantial one-off gains on divestitures such as Sesa Goa Limited in Indiaand Sakhalin II in Russia as well as increases in energy equity production and mineral resourceprices. The Iron & Steel Products, the Chemicals and the Machinery and Infrastructure Projectsbusinesses continued to post robust results, and the Foods & Retail business, which had recordedsignificant impairment losses in the previous years, improved its performance by ¥22.8 billion withrestructuring efforts paying off.
— The Americas recorded a downturn by ¥12.6 billion from write downs on inventories in theresidential home businesses and a slowdown in its businesses in the United States, triggered by thesubprime mortgage issues. In addition, several business units at the headquarters of Mitsui,including the Automotive and the Financial Markets businesses, recorded write downs on domesticlisted securities.
• Financial condition
Total assets as of March 31, 2008 were ¥9.7 trillion, a decrease of ¥0.1 trillion from ¥9.8 trillion as ofMarch 31, 2007. Despite active investing activities mainly at the Machinery & Infrastructure Projects,the Mineral & Metal Resources, the Energy and the Americas segments combined total of investmentsand plants, property and equipment (“PPE”) decreased by ¥0.2 trillion due to:
— a partial divestiture of our stake in the Sakhalin II project by ¥0.2 trillion; and
— the impact from a decline in the domestic stock market and appreciation of the Japanese yen againstthe U.S. dollar, which resulted in net ¥0.2 trillion decrease in combined sum of unrealized holdinggains and losses on available-for-sale securities and foreign currency translation adjustments inaccumulated other comprehensive income (loss).
As of March 31, 2008, shareholders’ equity was ¥2.2 trillion as a result of current year earnings, and NetDebt-to-Equity Ratio (“Net DER”)(*) was 1.27 times, 0.20 times lower than that of March 31, 2007.Return on Equity (“ROE”) during the period on an annualized basis is computed as 19.1%.
• Cash flows
Net cash provided by operating activities for the year ended March 31, 2008 was ¥415.8 billion, anincrease of ¥176.5 billion from the year ended March 31, 2007, reflecting steady growth in operatingincome. Net cash used by investing activities was ¥104.8 billion, reflecting the above-mentioned newinvestments and expansion projects largely offset by the material divestitures of interests in Sakhalin II,Sesa Goa, and other assets.
Overview of the Financial Results for the Year Ended March 31, 2007
• Operating results
— For the year ended March 31, 2007, we recorded consolidated net income of ¥301.5 billion, anincrease of ¥99.1 billion, or 49.0%, from ¥202.4 billion for the year ended March 31, 2006. Mostoperating segments except for the Foods & Retail Segment recorded improved operating results,benefiting from a favorable economic environment.
(*) Net DER is comprised of “net interest bearing debt” divided by shareholders’ equity. See “Liquidity andCapital Resources—Use of Non-GAAP Financial Measures.”
76

— Gross profit and equity in earnings of associated companies increased by ¥81.7 billion, or 10.4%;and ¥58.9 billion, or 62.5%, respectively, reflecting favorable commodity prices including mineralresources and energy. On the other hand, Mitsui Norin Co., Ltd. (Japan) recorded impairment losseson goodwill and intangible assets. In addition, interest expenses increased from increasing interestbearing debt mainly associated with the investment in the Sakhalin II project as well as a rising U.S.dollar interest rate.
• Financial condition
Total assets as of March 31, 2007 increased to ¥9.8 trillion, an increase of ¥1.2 trillion over March 31,2006 due mainly to investments in energy, mineral resources and infrastructure businesses as well as anincrease in trade receivables. Shareholders’ equity as of March 31, 2007 was ¥2.1 trillion as a result ofincreased retained earnings.
• Cash flows
Net cash provided by operating activities for the year ended March 31, 2007 was ¥239.3 billion, anincrease of ¥92.9 billion from the year ended March 31, 2006 reflecting the steady growth of operatingincome. Net cash used in investing activities was ¥418.0 billion, attributable to investments mainly inthe energy, machinery and infrastructure projects, and in the mineral resources businesses.
Impact of Foreign Currency Exchange Fluctuation on Operating Results for 2008
Total sum of net income for the year ended March 31, 2008 reported by overseas subsidiaries and associatedcompanies reached ¥306.9 billion, compared to ¥252.4 billion for the year ended March 31, 2007. Thesecompanies principally use U.S. dollars, Australian dollars and Brazilian real as functional currency in theirreporting.
The average U.S. dollar–Japanese yen exchange rate during the year ended March 31, 2008 was¥113.80 = U.S.$1, representing Japanese yen appreciation of ¥3.16, or 2.7%, compared to the average rate duringthe year ended March 31, 2007 of ¥116.96 = U.S.$1. As of March 31, 2008, the U.S. dollar–Japanese yenexchange rate was ¥100.19 = U.S.$1.
During the course of preparing our business plan for the year ending March 31, 2009, we constructed asimplified estimation for the impact of foreign currency exchange fluctuations on net income for the year endingMarch 2009 as follows:
a) Japanese yen denominated impact against the U.S. dollar, Australian dollar and Brazilian Real
We aggregated a total forecast net income in the business plans of these companies covering the yearending March 2009 according to their functional currencies. Firstly, we aggregated the Australiandollar and Brazilian real denominated forecast net income of those companies using two currencies asfunctional currency, and secondly we aggregated the rest of the net income at overseas subsidiaries andassociated companies as US dollar equivalent amount. We conducted a sensitivity analysis on foreigncurrency fluctuation towards 3 categories of aggregated net income.
Based on such analysis, we reached a conclusion that yen appreciation by ¥1 against U.S.$1, Australian$1 and Brazilian 1 Real would result in a net effect of reducing income by approximately ¥1.1 billion,¥1.8 billion and ¥0.9 billion, respectively.
b) Impact between U.S. dollar denominated contract amounts and revenues denominated in Australiandollar, Brazilian Real
The sum of net income from those companies using Australian dollar and Brazilian Real as functionalcurrency is becoming significant, reflecting increasing income in mineral resources and energyproducing operations. Net income of those mineral resources and energy producing companies are
77

impacted by the currency fluctuation between the U.S. dollar as a contractual currency of salescontracts and the two currencies as functional currency, affecting their Australian dollar or Brazilianreal denominated revenues.
Discussion and Analysis of Operating Results for the Years Ended March 31, 2008 and 2007
Revenues
In accordance with U.S. GAAP, revenues are reported based on the gross amount billed to a customer or onthe net amount retained (that is, the amount billed to a customer less the amount paid to a supplier) in thefollowing manner.
• Revenues are reported based on gross amounts for transactions where we have the related risks andrewards of ownership such as transactions mainly where we are the primary obligor in the arrangementand/or assume general inventory risk without any significant mitigation of our risk level.
• Revenues are reported based on net amounts where we assume a low degree of related risks andrewards, effectively acting as an agent for the applicable products or services. A typical example ofreporting revenues based on net amounts is a transaction where we receive a commission or fee at afixed rate based on transaction volume or amount.
We classified our revenues into sales of products, sales of services and other sales with the correspondingcosts of revenues.
The table below provides these three categories of revenues by products in “PRODUCT INFORMATION”in Note 17, “SEGMENT INFORMATION.”(*)
Billions of Yen
Years Ended March 31,
2008 2007 Change
Sales ofProducts
Sales ofServices
OtherSales Total
Sales ofProducts
Sales ofServices
OtherSales Total
Sales ofProducts
Sales ofServices
OtherSales Total
Iron and Steel . . . . . . . . . . . ¥ 730.4 ¥ 70.6 ¥ 0.3 ¥ 801.3 ¥ 495.2 ¥ 71.5 ¥ 0.2 ¥ 566.9 ¥235.2 ¥ (0.9) ¥ 0.1 ¥234.4Non-Ferrous Metals . . . . . . 56.8 9.3 13.6 79.7 71.2 9.0 19.7 99.9 (14.4) 0.3 (6.1) (20.2)Machinery . . . . . . . . . . . . . 276.0 123.6 78.6 478.2 253.1 106.0 69.5 428.6 22.9 17.6 9.1 49.6Electronics &
Information . . . . . . . . . . 77.4 100.8 4.1 182.3 74.4 104.4 0.0 178.8 3.0 (3.6) 4.1 3.5Chemicals . . . . . . . . . . . . . . 1,207.5 104.2 6.9 1,318.6 1,038.9 98.4 9.3 1,146.6 168.6 5.8 (2.4) 172.0Energy . . . . . . . . . . . . . . . . 1,992.1 6.9 18.7 2,017.7 1,617.7 7.1 8.5 1,633.3 374.4 (0.2) 10.2 384.4Foods . . . . . . . . . . . . . . . . . 533.2 38.3 1.1 572.6 417.2 49.3 0.5 467.0 116.0 (11.0) 0.6 105.6Textiles . . . . . . . . . . . . . . . . 14.7 19.5 4.0 38.2 17.1 21.2 1.5 39.8 (2.4) (1.7) 2.5 (1.6)General Merchandise . . . . 33.8 6.7 0.0 40.5 42.3 8.0 0.0 50.3 (8.5) (1.3) 0.0 (9.8)Property and Service
Business . . . . . . . . . . . . . 87.9 73.8 48.1 209.8 63.3 81.1 38.0 182.4 24.6 (7.3) 10.1 27.4
Consolidated Total . . . . . . . ¥5,009.8 ¥553.7 ¥175.4 ¥5,738.9 ¥4,090.4 ¥556.0 ¥147.2 ¥4,793.6 ¥919.4 ¥ (2.3) ¥28.2 ¥945.3
(*) Revenues reported in “PRODUCT INFORMATION” are classified by similarity of products as required byU.S. GAAP, and are not intended to represent classification by operating segment. As an example, revenuesof “Chemicals” in “PRODUCT INFORMATION” include not only those reported in the Chemical Segmentbut also Chemical revenues reported in other operating segments such as the Americas Segment. Todifferentiate between classification by product and classification by operating segment, classification byproduct is italicized in this “Revenues” section and “Gross profit classified by category of revenues” in thenext “Gross Profit” section.
78

Billions of Yen
Years Ended March 31,
2007 2006 Change
Sales ofProducts
Sales ofServices
OtherSales Total
Sales ofProducts
Sales ofServices
OtherSales Total
Sales ofProducts
Sales ofServices
OtherSales Total
Iron and Steel . . . . . . . . . ¥ 495.2 ¥ 71.5 ¥ 0.2 ¥ 566.9 ¥ 412.1 ¥ 68.8 ¥ 0.3 ¥ 481.2 ¥ 83.1 ¥ 2.7 ¥ (0.1) ¥ 85.7Non-Ferrous Metals . . . . 71.2 9.0 19.7 99.9 77.7 9.2 15.3 102.2 (6.5) (0.2) 4.4 (2.3)Machinery . . . . . . . . . . . . 253.1 106.0 69.5 428.6 206.3 97.6 46.8 350.7 46.8 8.4 22.7 77.9Electronics &
Information . . . . . . . . . 74.4 104.4 0.0 178.8 73.8 86.9 0.1 160.8 0.6 17.5 (0.1) 18.0Chemicals . . . . . . . . . . . . 1,038.9 98.4 9.3 1,146.6 785.9 93.3 7.5 886.7 253.0 5.1 1.8 259.9Energy . . . . . . . . . . . . . . . 1,617.7 7.1 8.5 1,633.3 1,331.8 7.7 21.0 1,360.5 285.9 (0.6) (12.5) 272.8Foods . . . . . . . . . . . . . . . 417.2 49.3 0.5 467.0 377.8 47.2 (0.4) 424.6 39.4 2.1 0.9 42.4Textiles . . . . . . . . . . . . . . 17.1 21.2 1.5 39.8 18.5 16.8 1.1 36.4 (1.4) 4.4 0.4 3.4General Merchandise . . . 42.3 8.0 0.0 50.3 52.6 9.0 0.0 61.6 (10.3) (1.0) 0.0 (11.3)Property and Service
Business . . . . . . . . . . . 63.3 81.1 38.0 182.4 61.1 74.4 27.3 162.8 2.2 6.7 10.7 19.6
Consolidated Total . . . . . ¥4,090.4 ¥556.0 ¥147.2 ¥4,793.6 ¥3,397.6 ¥510.9 ¥119.0 ¥4,027.5 ¥692.8 ¥45.1 ¥ 28.2 ¥766.1
Sales of Products
Sales of products include the following four types of transactions:
• the sale of products as a principal in the transactions, such as crude oil and petroleum products,petrochemical products and steel products;
• the sale of manufactured products at our manufacturing subsidiaries such as feed additives by NovusInternational, Inc. (United States) and tea leaves by Mitsui Norin Co., Ltd. (Japan);
• the sale of natural resources from iron ore and coal mining activities and oil and gas producingactivities; and
• the development and sale of real estate.
Comparison between the years ended March 31, 2008 and 2007
For the year ended March 31, 2008, revenues from the sales of products were ¥5,009.8 billion, an increaseof ¥919.4 billion, or 22.5%, from ¥4,090.4 billion for the year ended March 31, 2007. Major factors by productwere as follows:
• Revenues from Energy were ¥1,992.1 billion, an increase of ¥374.4 billion from ¥1,617.7 billion for theyear ended March 31, 2007. Crude oil and petroleum products sales in international markets anddomestic petroleum products and liquefied petroleum gas sales comprised the major part of the revenuesfrom Energy. Revenues from sales of petroleum products increased at Westport Petroleum, Inc. (UnitedStates) by ¥187.7 billion. There was a new contribution of ¥79.3 billion from Mitsui Oil ExplorationCo., Ltd. (Japan)(*) which was newly consolidated as a subsidiary during the fourth quarter of the yearended March 31, 2007. Regarding price trends of oil and gas for the year ended March 31, 2008, refer tothe discussion under “Energy Segment” of “Operating Results by Operating Segment.”
• Revenues from Iron and Steel were ¥730.4 billion, an increase of ¥235.2 billion from ¥495.2 billion forthe year ended March 31, 2007. The increase was attributable to rising prices in iron ore and steel scrapas well as robust steel products sales, particularly in Asia. Also there was a new contribution from SteelTechnologies, Inc. (United States) of ¥119.9 billion following our acquisition in June 2007. Regardingprice trends of iron ore for the year ended March 31, 2008, please refer to the discussion under“Mineral & Metal resources Segment” of “Operating Results by Operating Segment.”
(*) In March 2007, Mitsui acquired a 3% stake in Mitsui Oil Exploration Co., Ltd., formerly an associatedcompany, increasing its voting interest in Mitsui Oil Exploration Co., Ltd. to 50.3% and re-classifyingMitsui Oil Exploration Co., Ltd. as a subsidiary of Mitsui.
79

• Revenues from Chemicals were ¥1,207.5 billion, an increase of ¥168.6 billion from ¥1,038.9 billion forthe year ended March 31, 2007, primarily due to increased sales of basic petrochemicals and petrochemicalintermediates of ¥118.3 billion at Mitsui, reflecting higher prices of those products as a result of risingcrude oil prices.
• Revenues from Foods were ¥533.2 billion, an increase of ¥116.0 billion from ¥417.2 billion for the yearended March 31, 2007, mainly due to increases of ¥74.1 billion in Mitsui’s sales of grain and feedstuff,reflecting increased corn and soybean prices and active commodity markets.
Comparison between the years ended March 31, 2007 and 2006
For the year ended March 31, 2007, revenues from the sales of products were ¥4,090.4 billion, an increaseof ¥692.8 billion, or 20.4%, from ¥3,397.6 billion for the year ended March 31, 2006. Major factors by productwere as follows:
• Revenues from Energy were ¥1,617.7 billion, an increase of ¥285.9 billion from ¥1,331.8 billion for theyear ended March 31, 2006. Crude oil and petroleum products sales increased by ¥98.6 billion and ¥53.7billion at Mitsui Oil (Asia) Hong Kong. Ltd. (Hong Kong, China) and Westport Petroleum, Inc.,respectively. Domestic petroleum products and liquefied petroleum gas sales also increased by acombined sum of ¥109.4 billion at Mitsui Oil Co., Ltd. and Mitsui Liquefied Gas Co., Ltd. (Japan).
• Revenues from Chemicals were ¥1,038.9 billion, an increase of ¥253.0 billion from ¥785.9 billion forthe year ended March 31, 2006, primarily reflecting increases in Mitsui’s sales of basic petrochemicalsand synthetic fiber intermediates due to higher prices for these petrochemical products reflecting highercrude oil prices.
• Revenues from Iron and Steel were ¥495.2 billion, an increase of ¥83.1 billion from ¥412.1 billion forthe year ended March 31, 2006. Revenues increased at Mitsui and Mitsui Steel Holdings Inc. (UnitedStates) reflecting favorable markets in steel products. Mitsui Iron Ore Development Pty. Ltd. (Australia)recorded higher revenues reflecting the rise in iron ore prices.
Sales of Services
Sales of services include the revenues from trading margins (for our intermediary service) and commissions.For example:
• As the most typical case of our services, for back-to-back sales and purchase transactions of products,we record the net amount of sale and purchase prices (namely, margin for our intermediary service) asrevenues.
• We provide various services such as logistics and warehouse services, information and communicationservices and technical support. We also facilitate arrangement of the contracts between manufacturersand customers and deliveries of the products between suppliers and customers. In these cases, the billedamounts for these services are recognized as revenues.
Comparison between the years ended March 31, 2008 and 2007
For the year ended March 31, 2008, revenues from the sales of services were ¥553.7 billion, a decrease of¥2.3 billion from ¥556.0 billion for the year ended March 31, 2007. While Machinery increased by ¥17.6 to¥123.6 billion from ¥106.0 billion for the year ended March 31, 2007, Foods decreased by ¥11.0 billion to ¥38.3billion from ¥49.3 billion for the year ended March 31, 2007 and Property and Service Business decreased by¥7.3 billion to ¥73.8 billion from ¥81.1 billion for the year ended March 31, 2007.
Comparison between the years ended March 31, 2007 and 2006
For the year ended March 31, 2007, revenues from the sales of services were ¥556.0 billion, an increase of¥45.1 billion from ¥510.9 billion for the year ended March 31, 2006. Electronics & Information increased by¥17.5 billion to ¥104.4 billion from ¥86.9 billion for the year ended March 31, 2006. Machinery increased by¥8.4 billion to ¥106.0 billion from ¥97.6 billion for the year ended March 31, 2006.
80

Other Sales
Other sales principally include the revenues from:
• derivative commodity instruments and derivative financial instruments held for trading purposes (byproduct category mainly in Energy and Non Ferrous Metals);
• the revenues from leasing activities of real estate, rolling stock, ocean transport vessels, aircraft andmachinery equipment (by product category mainly in Property and Service Business and Machinery); and
• the revenues from external consumer financing (by product category mainly in Machinery).
Comparison between the years ended March 31, 2008 and 2007
For the year ended March 31, 2008, revenues from other sales were ¥175.4 billion, an increase of ¥28.2 billionfrom ¥147.2 billion for the year ended March 31, 2007, which was primarily attributable to the following factors:
• Derivative trading revenues were ¥36.7 billion, an increase of ¥3.6 billion from the ¥33.1 billion for theyear ended March 31, 2007. The increase was mainly attributable to a reversal effect from naphthatrading loss for the year ended March 31, 2007 at Mitsui Oil (Asia) Pte. Ltd. (Singapore), however, theimprovement was partly offset by a decrease in commodity derivatives trading revenues for the yearended March 31, 2008.
• Leasing revenues were ¥90.3 billion, an increase of ¥7.5 billion from the ¥82.8 billion for the yearended March 31, 2007 due to a full-year contribution from a rolling stock leasing subsidiary MRCEDispolok Gmbh (Germany) which was acquired in October 2006.
• P.T. Bussan Auto Finance (Indonesia) increased its revenue by ¥4.9 billion reflecting strong businessperformance in the motorcycle retail finance industry in Indonesia.
Comparison between the years ended March 31, 2007 and 2006
For the year ended March 31, 2007, revenues from other sales were ¥147.2 billion, an increase of ¥28.2 billionfrom ¥119.0 billion for the year ended March 31, 2006, which was primarily attributable to the following factors:
• Leasing revenues were ¥82.8 billion, an increase of ¥22.0 billion from ¥60.8 billion for the year endedMarch 31, 2006, which was attributable to the expanded rolling stock leasing businesses at Mitsui RailCapital Participacoes Ltda. (Brazil) and Mitsui Rail Capital Holdings, Inc. (United States) as well as theacquisition of MRCE Dispolok GmbH and increases in the real estate leasing businesses in Japan and abroad.
• Derivative trading revenues were ¥33.1 billion, a decrease of ¥6.6 billion from ¥39.7 billion for the yearended March 31, 2006. The principal reason for this decrease was naphtha trading losses at Mitsui Oil(Asia) Pte. Ltd. for the year ended March 31, 2007.
• P.T. Bussan Auto Finance increased its revenue from other sales by ¥8.3 billion over the year endedMarch 31, 2006, reflecting expansion of motorcycle retail finance in Indonesia.
Gross Profit
Gross Profit Classified by Category of Revenues
Billions of Yen
Years Ended March 31, Change between2008 and 2007
Change between2007 and 20062008 2007 2006
GrossProfit
GPRatio
GrossProfit
GPRatio
GrossProfit
GPRatio
GrossProfit
GPRatio
GrossProfit
GPRatio
Gross Profit from Sales of Products . . . . . . . . . . . ¥497.3 9.9% ¥393.6 9.6% ¥337.9 9.9% ¥103.7 0.3% ¥55.7 (0.3)%Gross Profit from Sales of Services . . . . . . . . . . . 397.6 71.8% 397.5 71.5 380.6 74.5% 0.1 0.3% 16.9 (3.0)%Gross Profit from Other Sales . . . . . . . . . . . . . . . . 93.2 53.1% 75.2 51.1 66.1 55.5% 18.0 2.0% 9.1 (4.4)%
Total . . . . . . . . . . . . . . . . . . . . . . . . . . . . . . . . . . . ¥988.1 17.2% ¥866.3 18.1% ¥784.6 19.5% ¥121.8 (0.9)% ¥81.7 (1.4)%
81

Comparison between the years ended March 31, 2008 and 2007
For the year ended March 31, 2008, gross profit was ¥988.1 billion, an increase of ¥121.8 billion, or 14.1%,from ¥866.3 billion for the year ended March 31, 2007. The Gross Profit ratio (“GP ratio”), or ratio of grossprofit divided by revenues, for the year ended March 31, 2008 was 17.2%, a decrease of 0.9 percentage pointscompared to the year ended March 31, 2007.
For the year ended March 31, 2008, gross profit from sales of products was ¥497.3 billion, an increase of¥103.7 billion from ¥393.6 billion for the year ended March 31, 2007. Gross profit from Energy was ¥218.7billion, a significant increase of ¥91.1 billion from ¥127.6 billion for the year ended March 31, 2007, due to fullyear contributions of Mitsui Oil Exploration Co., Ltd. by ¥58.7 billion which was newly consolidated as asubsidiary during the 4th quarter of the year ended March 31, 2007, and Mitsui E&P Australia Pty Limited whichcommenced a commercial production of the Enfield oil field by ¥26.4 billion. Mitsui E&P Middle East B.V.(Netherlands) and Mittwell Energy Resources Pty. Ltd. (Australia) recorded increases reflecting higher oil prices.On the other hand, Westport Petroleum, Inc. (United States) recorded a ¥12.4 billion decrease from sales ofpetroleum products.
The GP ratio from sales of products for the year ended March 31, 2008 was 9.9%, an improvement of 0.3percentage points compared to the year ended March 31, 2007. This 0.3 percentage point improvement wasattributable to the higher growth in gross profit (26.3% increase) than growth in revenues (22.5% increase),particularly in oil and gas producing activities of Energy reflecting the rising sales prices.
For the year ended March 31, 2008, gross profit from sales of services was ¥397.6 billion, an increase of¥0.1 billion from ¥397.5 billion for the year ended March 31, 2007. As illustrated by the table in “threecategories of revenues by products”—“Sales of Services”, increases in revenues from sales of services ofMachinery were largely offset by decreases in those of Electronics & Information and Foods.
The GP ratio from sales of services for the year ended March 31, 2008 was 71.8%, an increase of 0.3percentage points compared to the year ended March 31, 2007.
For the year ended March 31, 2008, gross profit from other sales was ¥93.2 billion, an increase of ¥18.0billion from ¥75.2 billion for the year ended March 31, 2007. The major reasons were the same as described in“Revenues—Other Sales” above.
While GP ratio in all the three categories of revenue increased, the overall GP ratio decreased by 0.9%. Thisis due to the change in the sales mix wherein the percentage of sales from services, which has considerablyhigher GP ratio as compared to products and others, has reduced from 45.8% in 2007 to 40.2% in 2008.
Comparison between the years ended March 31, 2007 and 2006
For the year ended March 31, 2007, gross profit was ¥866.3 billion, an increase of ¥81.7 billion, or 10.4%,from ¥784.6 billion for the year ended March 31, 2006. The GP ratio for the year ended March 31, 2007 was18.1%, a decrease of 1.4 percentage points compared to the year ended March 31, 2006.
For the year ended March 31, 2007, gross profit from sales of products was ¥393.6 billion, an increase of ¥55.7billion from ¥337.9 billion for the year ended March 31, 2006. The major factors in this category are as follows:
• Gross profit from Energy was ¥127.6 billion, an increase of ¥40.8 billion from ¥86.8 billion for the yearended March 31, 2006. As a result of consolidation of Mitsui Oil Exploration Co., Ltd. as a subsidiary inthe fourth quarter of the year ended March 31, 2007, it newly reported a ¥15.0 billion gross profit andMitsui E&P Australia Pty Limited also reported gross profit of ¥13.9 billion following the start up ofcommercial production at the Enfield oil project. Mitsui E&P Middle East B.V., which is engaged inproduction of crude oil in Oman, recorded an increase reflecting higher oil prices. Westport Petroleum,Inc. recorded a ¥4.9 billion increase in gross profit from sales of petroleum products.
82

• Gross profit from Iron and Steel was ¥97.9 billion, an increase of ¥7.7 billion from ¥90.2 billion for theyear ended March 31, 2006. Mitsui Iron Ore Development Pty. Ltd. and Mitsui Itochu Iron Pty. Ltd.(Australia) recorded increases in gross profit by ¥13.6 billion and ¥3.6 billion, respectively, due to risingiron ore prices.
The GP ratio from sales of products for the year ended March 31, 2007 was 9.6%, a decline of 0.3percentage points compared to the year ended March 31, 2006, reflecting relatively lower growth of gross profit(16.5% increase) than that of revenues (20.4% increase). This is a typical trend seen in Energy and Chemicalswhere higher revenues do not necessarily result in increases in gross profit.
For the year ended March 31, 2007, gross profit from sales of services was ¥397.5 billion, an increase of¥16.9 billion from ¥380.6 billion for the year ended March 31, 2006. A ¥6.7 billion increase was seen primarilyin Chemicals. Increased revenues from sales of services of Electronics & Information were largely offset byincreases in the related costs of those revenues, where the typical case was J-SCube INC (Japan) which providesservices of design, operation and maintenance of information systems.
The GP ratio from sales of services for the year ended March 31, 2007 was 71.5%, a decrease of 3.0percentage points compared to the year ended March 31, 2006. This decrease was mainly because operations suchas logistics services and information system services, which reported the gross billed amounts as revenues, andwhose GP ratios were therefore less than 100% (because of the accompanying cost of revenues), recorded relativelyhigher increases in revenues, compared to operations such as intermediary services where the net amount of salesand purchase prices in back-to-back transactions were reported as revenues with GP ratios of 100%.
For the year ended March 31, 2007, gross profit from other sales was ¥75.2 billion, an increase of ¥9.1billion from ¥66.1 billion for the year ended March 31, 2006. The major reasons were the same as described in“Revenues—Other Sales” above.
Gross Profit Classified by Operating Segment
For detailed discussion, see “Operating Results by Operating Segment.” A summary of the increase in grossprofit classified by operating segment is provided below.
Comparison between the years ended March 31, 2008 and 2007
For the year ended March 31, 2008 consolidated total gross profit was ¥988.1 billion, an increase of ¥121.8billion, or 14.1%, from ¥866.3 billion for the year ended March 31, 2007 as a result of the following:
• The Energy Segment recorded an increase of ¥95.4 billion compared to the year ended March 31, 2007,making up 78% of the consolidated total increase, mainly attributable to contributions from Mitsui OilExploration Co., Ltd. and the Enfield oil field. These contributions were partly offset by a decline ingross profit at Mitsui Coal Holdings Pty. Ltd. (Australia) reflecting a lower coal price, the Australiandollar appreciation against the U.S. dollar and a cost increase related to various operational troubles atits mining expansion project.
• The Machinery & Infrastructure Projects Segment recorded an increase of ¥26.1 billion from the yearended March 31, 2007, primarily reflecting solid performance at a motorcycle retail finance subsidiary,P.T.Bussan Auto Finance, and other automotive subsidiaries, ocean vessels and rolling stock leasingsubsidiaries as well as contribution from a newly acquired machine tools sales subsidiary EllisonTechnologies Inc. (United States). Similarly, the Chemical Segment and the Iron & Steel productsSegment reported increases of ¥7.2 billion reflecting favorable methanol and ammonia marketconditions and ¥3.6 billion reflecting firm results in steel tubular products for energy sector as well asconstruction material and tubular products to Asian market, respectively.
83

• The Mineral & Metal Resources Segment recorded a decrease of ¥15.2 billion from the year endedMarch 31, 2007, mainly due to divestiture of Sesa Goa Limited (India)(*). This negative impact waspartly offset by an increase of gross profit at Mitsui Iron Ore Development Pty. Ltd. and Mitsui ItochuIron Pty. Ltd. reflecting higher prices of iron ore.
• The Consumer Service & IT Segment and the Americas Segment recorded decreases from the yearended March 31, 2007. The decrease at the Consumer Service & IT Segment was attributable tobusiness reorganization through withdrawals from or divestitures of mainly domestic businesses. In theAmericas Segment for the year ended March 31, 2008, MBK Real Estate LLC. (United States), whichengages in the development and sale of residential homes in the West Coast market, recorded a sharpfall in sales and a loss from write-downs on inventories reflecting deterioration in the residential markettriggered by the subprime mortgage problems of the United States. Moreover, Westport Petroleum Inc.decreased its profit from oil products trading and so did steel products subsidiaries engaged in the steelproducts business mainly in oil tubular products reflecting lower margins.
Comparison between the years ended March 31, 2007 and 2006
For the year ended March 31, 2007, all the operating segments except for All Other recorded increases ingross profit.
• The Mineral & Metal Resources Segment and Energy Segment recorded ¥22.5 billion and ¥16.9 billionincreases, respectively. Mitsui Iron Ore Development Pty. Ltd. and Mitsui Itochu Iron Pty. Ltd. reportedincreases reflecting higher prices of iron ore. The Energy Segment’s increase was primarily attributableto the start-up of commercial production at the Enfield oil project and the consolidation of Mitsui OilExploration Co., Ltd. as a subsidiary, which was partly offset by a decline at Mitsui Coal Holdings Pty.Ltd. Reflecting a decline in coal prices.
• The Machinery & Infrastructure Projects Segment recorded an increase, primarily reflecting expansionof operations of overseas automotive-related subsidiaries. Business transactions at the Iron & SteelProducts Segment and the Chemical Segment continued to show good performance in general.
• The Logistics & Financial Markets Segment and the Americas Segment recorded strong results intrading operations in various commodities such as petroleum products trading at Westport Petroleum,Inc..
84
(*) As a result of Mitsui’s divestiture of Sesa Goa, the operating results of Sesa Goa for the year endedMarch 31, 2008 and 2007 are presented as income from discontinued operations (after income tax effect inour statements of consolidated income). However, in this “Gross Profit Classified by Operating Segment”,operating results of the company are presented and discussed according to line items of the consolidatedstatements of income.

• In the Foods & Retail Segment and the Consumer Service & IT Segment, performance varied byproducts and services. Domestic apparel businesses and Mitsui Norin Co., Ltd. showed disappointingperformance, while real estate businesses performed well, especially overseas.
Selling, General and Administrative Expenses
Selling, General and Administrative Expenses Classified by Category of Expenses
Comparison between the years ended March 31, 2008 and 2007
Selling, general and administrative expenses for the year ended March 31, 2008 were ¥605.2 billion, anincrease of ¥33.6 billion or 5.9% from ¥571.6 billion for the year ended March 31, 2007.
The table below provides a breakdown of selling, general and administrative expenses used for our internalreview for the years ended March 31, 2008, 2007 and 2006.
Billions of Yen
Years Ended March 31, Change(2008–2007)
Change(2007–2006)2008 2007 2006
Personnel . . . . . . . . . . . . . . . . . . . . . . . . . . . . . . . . . . . . . . . . ¥294.5 ¥283.3 ¥271.3 ¥11.2 ¥12.0Welfare . . . . . . . . . . . . . . . . . . . . . . . . . . . . . . . . . . . . . . . . . 12.2 10.3 9.4 1.9 0.9Travel . . . . . . . . . . . . . . . . . . . . . . . . . . . . . . . . . . . . . . . . . . 35.1 32.0 28.5 3.1 3.5Entertainment . . . . . . . . . . . . . . . . . . . . . . . . . . . . . . . . . . . . 10.8 10.5 9.8 0.3 0.7Communication . . . . . . . . . . . . . . . . . . . . . . . . . . . . . . . . . . . 48.5 43.9 41.7 4.6 2.2Others . . . . . . . . . . . . . . . . . . . . . . . . . . . . . . . . . . . . . . . . . . 204.1 191.6 177.9 12.5 13.7
Total . . . . . . . . . . . . . . . . . . . . . . . . . . . . . . . . . . . . . . . . . . . ¥605.2 ¥571.6 ¥538.6 ¥33.6 ¥33.0
• Personnel expenses were ¥294.5 billion for the year ended March 31, 2008, an increase of ¥11.2 billionfrom the year ended March 31, 2007. This was mainly attributable to acquisitions of subsidiaries such asEllison Technologies Inc. (United States) in the Machinery & Infrastructure Projects Segment, MitsuiOil Exploration Co., Ltd. in the Energy Segment and Steel Technologies, Inc. in the Americas segment.
• Other remaining items in selling, general and administrative expenses increased showing similarpatterns as personnel expenses.
Comparison between the years ended March 31, 2007 and 2006
Selling, general and administrative expenses for the year ended March 31, 2007 were ¥571.6 billion, anincrease of ¥33.0 billion, or 6.1%, from ¥538.6 billion for the year ended March 31, 2006.
• Personnel expenses were ¥283.3 billion for the year ended March 31, 2007, an increase of ¥12.0 billionfrom the year ended March 31, 2006, primarily reflecting expanded operations of subsidiaries. Thoseoperations include the automotive related businesses such as P.T. Bussan Auto Finance and constructionmachinery related businesses such as Road Machinery, LLC (United States) in the Machinery &Infrastructure Projects Segment, and the domestic information and telecommunication businesses suchas J-SCube INC (Japan) and Telepark Corp. (Japan) in the Consumer Service & IT Segment. Also,performance linked bonuses to traders increased at Westport Petroleum, Inc.
• Other remaining items in selling, general and administrative expenses increased showing similarpatterns as personnel expenses.
85

Selling, General and Administrative Expenses Classified by Operating Segment
The table below provides selling, general and administrative expenses for the years ended March 31, 2008,2007 and 2006 by operating segment.
Billions of Yen
Years Ended March 31, Change(2008–2007)
Change(2007–2006)2008 2007 2006
Iron & Steel Products . . . . . . . . . . . . . . . . . . . . . . . . . . . . . . ¥ 35.7 ¥ 33.1 ¥ 30.4 ¥ 2.6 ¥ 2.7Mineral & Metal Resources . . . . . . . . . . . . . . . . . . . . . . . . . 16.6 19.8 21.3 (3.2) (1.5)Machinery & Infrastructure Projects . . . . . . . . . . . . . . . . . . . 94.8 79.9 66.9 14.9 13.0Chemical . . . . . . . . . . . . . . . . . . . . . . . . . . . . . . . . . . . . . . . . 64.6 65.3 64.8 (0.7) 0.5Energy . . . . . . . . . . . . . . . . . . . . . . . . . . . . . . . . . . . . . . . . . . 46.2 38.3 38.0 7.9 0.3Foods & Retail . . . . . . . . . . . . . . . . . . . . . . . . . . . . . . . . . . . 65.1 69.6 70.1 (4.5) (0.5)Consumer Service & IT . . . . . . . . . . . . . . . . . . . . . . . . . . . . 98.4 109.4 102.7 (11.0) 6.7Logistics & Financial Markets . . . . . . . . . . . . . . . . . . . . . . . 32.9 35.9 33.3 (3.0) 2.6Americas . . . . . . . . . . . . . . . . . . . . . . . . . . . . . . . . . . . . . . . . 51.3 43.2 40.6 8.1 2.6Europe, the Middle East and Africa . . . . . . . . . . . . . . . . . . . 24.9 22.4 19.5 2.5 2.9Asia Pacific . . . . . . . . . . . . . . . . . . . . . . . . . . . . . . . . . . . . . . 25.3 21.2 17.8 4.1 3.4
Total . . . . . . . . . . . . . . . . . . . . . . . . . . . . . . . . . . . . . . . . . . . 555.8 538.1 505.4 17.7 32.7
All Other . . . . . . . . . . . . . . . . . . . . . . . . . . . . . . . . . . . . . . . . 7.2 8.5 11.0 (1.3) (2.5)Adjustments and Eliminations . . . . . . . . . . . . . . . . . . . . . . . 42.2 25.0 22.2 17.2 2.8
Consolidated Total . . . . . . . . . . . . . . . . . . . . . . . . . . . . . . . . ¥605.2 ¥571.6 ¥538.6 ¥ 33.6 ¥33.0
Comparison between the years ended March 31, 2008 and 2007
As illustrated by the above table, selling, general and administrative expenses increased mainly at segmentssuch as the Machinery & Infrastructure, the Americas and the Energy by ¥14.9 billion, ¥8.1 billion and ¥7.9billion, respectively. This was mainly attributable to acquisitions of subsidiaries such as Ellison TechnologiesInc. in the Machinery & Infrastructure Projects Segment, Mitsui Oil Exploration Co., Ltd. in the Energy Segmentand Steel Technologies, Inc. in the Americas segment. On the other hand, expenses at the Consumer Service &IT Segment and the Foods & Retail Segment decreased as a result of business reorganizations including exit anddisposal of domestic businesses.
With regard to the Energy Segment and the Mineral & Metal Resources Segment, they have relatively smallnumbers of employees and little correlation between gross profit and selling, general and administrative expensescompared to other operating segments such as the Machinery & Infrastructure Projects Segment and theConsumer Service & IT Segment. See “Item 6.D. Employees” for further details of numbers of employees.
Comparison between the years ended March 31, 2007 and 2006
Selling, general and administrative expenses for the year ended March 31, 2007 increased in theMachinery & Infrastructure Projects Segment and the Consumer Service & IT Segment by ¥13.0 billion and ¥6.7billion, respectively. On the other hand, the Energy Segment and the Mineral & Metal Resources Segment, whichreported major increases in gross profit for the year ended March 31, 2007, recorded a ¥0.3 billion increase and a¥1.5 billion decrease, respectively.
As discussed in “Comparison between the years ended March 31, 2008 and 2007” above, there is littlecorrelation between gross profit and selling, general and administrative expenses in the Energy Segment and theMineral & Metal Resources Segment.
86

Provision for Doubtful Receivables
Comparison between the years ended March 31, 2008 and 2007
Provision for doubtful receivables for the year ended March 31, 2008 was ¥8.1 billion, a decrease of ¥3.8billion, or 31.9%, from ¥11.9 billion for the year ended March 31, 2007. Provisions for the year ended March 31,2008 consisted of a number of individually small receivables. For the year ended March 31, 2007, major factorswere a new provision for an overseas oil exploration company, an increase in the provision for motorcycle retailfinance at P.T. Bussan Auto Finance reflecting its expanding operations and an increase in the provision atFertilizantes Mitsui S.A. Industria e Comercio (Brazil).
Comparison between the years ended March 31, 2007 and 2006
Provision for doubtful receivables for the year ended March 31, 2007 was ¥11.9 billion, a ¥13.7 billion increasein expense from ¥1.8 billion income for the year ended March 31, 2006. The ¥1.8 billion income for the year endedMarch 31, 2006 was attributable to the collection of debts which had been written off as uncollectible in the past.
Interest Income and Interest Expense
Comparison between the years ended March 31, 2008 and 2007
Interest income for the year ended March 31, 2008 was ¥57.3 billion, an increase of ¥7.5 billion, or 15.1%,from ¥49.8 billion for the year ended March 31, 2008. Interest expense was ¥106.2 billion, an increase of ¥13.7billion, or 14.8%, from ¥92.5 billion for the year ended March 31, 2007. As a result, interest expense, net ofinterest income, was ¥48.9 billion, an increase of ¥6.2 billion, or 14.5%, from ¥42.7 billion for the year endedMarch 31, 2007. A breakdown of the principal changes for the year ended March 31, 2008 is as follows:
• Interest expense for the Sakhalin II project declined by ¥7.2 billion as a result of the transfer of our 50%stake in the project and subsequent decrease in related interest bearing debt.
• Mitsui recorded a ¥5.5 billion increase reflecting higher Japanese yen interest rates.
• Reflecting increased interest bearing debt used to fund various investments, interest expense at overseassubsidiaries increased by ¥6.6 billion, out of which a ¥5.6 billion increase was attributable to theAmericas Segment.
In general, interest income tends to show similar patterns of fluctuations as interest expense. We provideloans and deferred payment facility, which generate interest income, by funding our borrowings from financialinstitutions. Usually, both interest expense and interest income have the same interest rate type, floating or fixed.Accordingly, most fluctuations in interest income are offset by corresponding fluctuations in interest expense.
With respect to interest rate swaps employed to manage interest rate risk exposure, see “Item 5.B. Liquidityand Capital Resources—Funding Sources.”
Interest rate trends for the year ended March 31, 2008 regarding the Japanese yen and the U.S. dollar, inwhich we have borrowings, were as follows:
• The Bank of Japan raised the policy interest rate in February 2007 but kept policy interest rates on holdthereafter. Reflecting steady growth of the Japanese economy in the first half of the year market interestrate ( the average of the month-end Japanese yen three-month London Interbank Offered Rate(“LIBOR”)) for the year ended March 31, 2008 rose to 0.87% from 0.45% for the year ended March 31,2007. On the other hand, the average yield rate on 10-year Japanese Government Bonds was 1.59% forthe year ended March 31, 2008, down from 1.75% during the year ended March 31, 2007.
• The FRB raised the Federal Funds target rate to 5.25% in June 2006 and kept the rate level thereafter.However, it gradually lowered the rate from September 2007 in response to a concern about economic
87

slowdown triggered by the sub-prime mortgage crisis, to 2.25% in March 2008, showing its attitude toprovide an actual money rate of zero. The FRB then lowered the rate to 2.0% in April 2008. The averageof the month-end U.S. dollar three-month LIBOR during the year ended March 31, 2008 was 4.66%, downfrom the average of 5.35% during the year ended March 31, 2007. For information regarding developmentof our investment plans and financial policies, refer to “B. Liquidity and Capital Resources.”
Comparison between the years ended March 31, 2007 and 2006
Interest income for the year ended March 31, 2007 was ¥49.8 billion, an increase of ¥12.2 billion, or 32.4%,from ¥37.6 billion for the year ended March 31, 2006. Interest expense was ¥92.5 billion, an increase of ¥33.7billion, or 57.3%, from ¥58.8 billion for the year ended March 31, 2006. As a result, interest expense, net ofinterest income, was ¥42.7 billion, an increase of ¥21.5 billion, or 101.4%, from ¥21.2 billion for the year endedMarch 31, 2006. A breakdown of the principal changes for the year ended March 31, 2007 is as follows:
• Interest expense incurred for the Sakhalin II project increased by ¥9.0 billion due to increased interestbearing debt to fund the investments in Sakhalin Energy Investment Company Ltd. and higher U.S.dollar interest rates.
• Other than the Sakhalin II project related interest expense, Mitsui recorded an increase of ¥3.5 billion ininterest expense, reflecting increases in interest bearing debt associated with various investments.
• Reflecting higher U.S. dollar interest rates, interest expense at overseas subsidiaries increased by ¥8.3billion. In particular, the Americas Segment recorded a ¥4.8 billion increase, which was mainlyattributable to Mitsui & Co. (U.S.A.), Inc. and Westport Petroleum, Inc.
Interest rate trends for the year ended March 31, 2007 regarding the Japanese yen and the U.S. dollar, themajor currencies in which we have borrowings, were as follows:
• The Bank of Japan decided to terminate its zero interest rate policy in July 2006, and raised the policyinterest rate in February 2007. Reflecting this policy change, the average of the month-end Japanese yenthree-month LIBOR for the year ended March 31, 2007 rose to 0.45% from 0.07% for the year endedMarch 31, 2006. The average yield rate on 10-year Japanese Government Bonds was 1.75% for the yearended March 31, 2007, up from 1.44% during the year ended March 31, 2006.
• The average of the month-end U.S. dollar three-month LIBOR during the year ended March 31, 2007was 5.35%, up from the average of 4.12% during the year ended March 31, 2006, reflecting the FRB’spolicy of raising the Federal Funds target rate from 4.75% as of March 2006 to 5.25% as of June 2006and keeping the rate level thereafter.
Dividend Income
Comparison between the years ended March 31, 2008 and 2007
Dividend income for the year ended March 31, 2008 was ¥50.1 billion, an increase of ¥0.9 billion, or 1.8%,from ¥49.2 billion for the year ended March 31, 2007. Dividends from LNG projects in Abu Dhabi, Qatar andOman amounted to ¥23.4 billion, a decrease of ¥3.2 billion over the year ended March 31, 2007, which wasoffset by increased dividends from other investees including INPEX Holdings Inc. held by Mitsui OilExploration Co., Ltd.
Comparison between the years ended March 31, 2007 and 2006
Dividend income for the year ended March 31, 2007 was ¥49.2 billion, an increase of ¥19.0 billion, or62.9%, from ¥30.2 billion for the year ended March 31, 2006. Dividends from LNG projects in the Middle East,namely Abu Dhabi, Qatar and Oman, totaled ¥26.6 billion, a significant increase of ¥13.2 billion, from ¥13.4billion for the year ended March 31, 2006. The rest of the increase in dividend income was mostly comprised ofincreases in dividends from domestic listed companies.
88

Gains on Sales of Securities—Net
Comparison between the years ended March 31, 2008 and 2007
Gain on sales of securities for the year ended March 31, 2008 was ¥92.3 billion, a substantial increase of ¥33.5billion, or 57.0%, from ¥58.8 billion for the year ended March 31, 2007. Since the year ended March 31, 2007,Mitsui continuously conducted scrutiny on whole investments held by operating segments to optimize the businessportfolio. Consequently it recorded gains on the sales of shares mainly in listed companies.
• For the year ended March 31, 2008, the largest part of the gains came from the sale of a part of Mitsui’sstake in the Sakhalin II project; sales of its entire holding in Empreendimentos Brasileiros de MineraçãoS.A. (“EBM”) in Brazil; and sale of additional shares in Toho Titanium Co., Ltd. (Japan) following thesale of the previous year. In addition, the Consumer Service & IT Segment recorded gains in exchangeof shares in Mitsui Knowledge Industry Co., Ltd. (Japan) and on sales of shares in telecommunicationcompanies including two cable television providers and Jupiter Telecommunications Co., Ltd in Japan.Other operating segments also recorded gains on sales of shares of listed companies such as QuintilesTransnational Corp. in the United States and BALtrans Holdings Limited in Hong Kong, China in theLogistics & Financial Market Segment.
• For the year ended March 31, 2007, Mitsui enhanced scrutiny on the assets held by operating segmentsto optimize its business portfolio, and consequently we recorded gains on the sales of shares in listedcompanies including a ¥15.6 billion gain from Toho Titanium Co., Ltd. shares. Mitsui also record a ¥4.5billion gain on the sale of shares in Telepark Corp. (Japan), a subsidiary engaged in sales of mobiledevices and telecommunication lines.
Comparison between the years ended March 31, 2007 and 2006
The net realized gain on sales of securities for the year ended March 31, 2007 was ¥58.8 billion, an increaseof ¥21.0 billion, or 55.6% from ¥37.8 billion for the year ended March 31, 2006. The breakdown of majortransactions related to net gains on sales of securities for the year ended March 31, 2007 is discussed above.
For the year ended March 31, 2006, the Consumer Service & IT Segment recorded gains on sales of sharesin telecommunication related companies, namely, a ¥5.5 billion gain (jointly with the Americas Segment) on thesales of shares in Metro PCS in the United States, a ¥3.3 billion gain from the exchange of shares inPOWEREDCOM, Inc. for KDDI CORPORATION in Japan and a ¥2.0 billion gain on the sales of shares in P.T.Excelcomindo Pratama, Tbk. in Indonesia. The Foods & Retail Segment recorded a ¥4.2 billion gain from theexchange of shares of Seven & i Holdings Co., Ltd, one of Japan’s leading diversified retailers.
Loss on Write-Down of Securities
Comparison between the years ended March 31, 2008 and 2007
Loss on write-down of securities for the year ended March 31, 2008 was ¥36.7 billion, a large increase of¥25.0 billion, or 213.7%, from ¥11.7 billion for the year ended March 31, 2007.
For the year ended March 31, 2007 the Nikkei Stock Average hit a low of ¥14,218.60 in June 2006, reflectingappreciation of the Japanese yen and correction of global stock markets. However, such pessimistic sentiment fadedand the Nikkei Stock Average recovered to ¥17, 287.65 as of March 31, 2007. During the year ended March 31,2008, the Nikkei Stock Average recorded a high of ¥18,261.98 due to the rise of expectations for expandingJapanese corporate earnings, but retreated from highs reflecting declines in global stock prices and Japanese yenappreciation, triggered by the sub-prime mortgage crisis, and recorded ¥12,525.54 as of March 31, 2008.
• The losses for the year ended March 31, 2008 included write-downs on listed shares for ¥28.0 billion,including ¥4.5 billion for Seven & i Holdings Co., Ltd. in the Foods & Retail Segment and ¥4.5 billion forCentral Finance Co., Ltd. in the Logistics & Financial Markets Segment. Furthermore, reflecting overall
89

decline in domestic stock markets, we recorded write-down losses in the Machinery & InfrastructureSegment in ¥8.6 billion for Yamaha Motor Co., Ltd shares and in the Chemical Segment in ¥2.8 billion forKaneka Corporation shares(*).
• Losses for the year ended March 31, 2007 consisted of miscellaneous small losses, including those onlisted shares, amounting to ¥3.1 billion.
Comparison between the years ended March 31, 2007 and 2006
The loss on write-down of securities for the year ended March 31, 2007 was ¥11.7 billion, an increase of¥1.1 billion, or 10.4%, from ¥10.6 billion for the year ended March 31, 2006.
For the year ended March 31, 2006, the Japanese stock markets saw an upturn following the recovery of theJapanese economy and expanding corporate earnings with the Nikkei Stock Average at ¥17,059.66 as ofMarch 31, 2006, compared to ¥11,668.95 as of March 31, 2005. For the year ended March 31, 2007 the NikkeiStock Average recorded ¥17, 287.65 as of March 31, 2007, as discussed above. Reflecting these developments inthe stock market, the write-down of marketable securities for the year ended March 31, 2007 was ¥3.1 billion, aslight increase over ¥1.8 billion for the year ended March 31, 2006.
With respect to non-marketable securities, individual write-down losses were insignificant for the yearsended March 31, 2007 and 2006.
Gain on Disposal or Sales of Property and Equipment—Net
Comparison between the years ended March 31, 2008 and 2007
Gain on disposal or sales of property and equipment—net for the year ended March 31, 2008 was a loss of¥0.2 billion, a decrease of ¥5.5 billion, or 103.8%, from a ¥5.3 billion gain for the year ended March 31, 2007.Loss for the year ended March 31, 2008 consisted of miscellaneous small items. For the year ended March 31,2007, major gains resulted from disposal of warehouses and land at Tri-Net Logistics Management, Inc. (UnitedStates) and NST, Inc. (United States).
Comparison between the years ended March 31, 2007 and 2006
Gain on disposal or sales of property and equipment—net for the year ended March 31, 2007 was ¥5.3 billion,a decrease of ¥2.2 billion, or 29.3%, from a ¥7.5 billion gain for the year ended March 31, 2006.
For the year ended March 31, 2006, major factors included a ¥5.6 billion gain on the sale of Mitsui’scompany-owned welfare facilities and a ¥1.3 billion gain on the sale of its corporate residences and dormitories.
Impairment Loss of Long-Lived Assets
Comparison between the years ended March 31, 2008 and 2007
Impairment loss of long-lived assets for the year ended March 31, 2008 was ¥24.4 billion, an increase of¥5.0 billion, or 25.8%, from ¥19.4 billion for the year ended March 31, 2007.
(*) Mitsui’s Management principally believes that “a 50% or more decline” in fair value of a listed securityleads to the conclusion that the security has an other-than-temporary impairment. In addition, managementrecognizes that “decline by 30% or more” also leads to the same conclusion, considering the materiality ofdeclined value.
90

• For the year ended March 31, 2008, we recorded a ¥13.9 billion loss on real estate which we possess inSaito International Culture Park (“SICP”), located in the north area of Osaka Prefecture(*). Other majorlosses were those related to impairment on power producing equipment at GTF Green Power Co., Ltd.(Japan), a domestic power producing operation, and on Mitsui’s corporate residences and dormitories.
• For the year ended March 31, 2007, the subsidiaries in the Foods & Retail Segment recorded majorimpairment losses, namely, a ¥12.1 billion loss on intangible assets at Mitsui Norin Co., Ltd. (Japan) due todeterioration of the operating environment and a ¥2.2 billion loss at MITSUI FOODS CO., LTD. (Japan) onreal estate and facilities which were idle as a result of the reorganization of distribution bases.
For more information on impairment losses on long-lived assets, see Note 10, “IMPAIRMENT LOSS OFLONG-LIVED ASSETS,” and on our reevaluation and restructuring of subsidiaries, see Note 24, “EXIT ORDISPOSAL ACTIVITIES.” As of March 31, 2008, we did not identify any material assets analyzed forimpairment for which an impairment charge has not yet been recorded. Also see the relevant discussion asdescribed later on the impairment loss at Mitsui Norin Co., Ltd. in “Operating Results by Operating Segment—Foods & Retail Segment” in this item.
Comparison between the years ended March 31, 2007 and 2006
The impairment loss on long-lived assets for the year ended March 31, 2007 was ¥19.4 billion, an increaseof ¥3.6 billion or 22.8%, from ¥15.8 billion for the year ended March 31, 2006. The main elements ofimpairment losses for the year ended March 31, 2007 are discussed above and those for the year ended March 31,2006 were as follows:
• MITSUI FOODS CO., LTD. recorded a total of ¥6.0 billion impairment loss on land and facilities as aresult of reorganization of the distribution bases.
• Mitsui and domestic subsidiaries recorded a total of ¥2.8 billion in impairment losses on land fordevelopment and land for lease.
• NST, Inc. (United States) reported a ¥1.6 billion impairment loss on plant facilities.
Impairment Loss of Goodwill
Comparison between the years ended March 31, 2008 and 2007
Impairment loss of Goodwill for the year ended March 31, 2008 was ¥2.0 billion, a decrease of ¥14.5 billion,or 87.9%, from ¥16.5 billion for the year ended March 31, 2007. Details of impairment losses are as below:
• Mitsui Knowledge Industry Co., Ltd. (Japan) and NextCom K.K. (Japan), both of which weresubsidiaries and listed on the second section of the Tokyo Stock Exchange, were merged in April, 2007.At the merger, a ¥2.5 billion gain from the exchange of shares was recognized. For the year endedMarch 31, 2008, Mitsui Knowledge Industry Co., Ltd. (Japan) reported a ¥2.0 billion impairment losson its goodwill, reflecting a decline in its share price.
• For the year ended March 31, 2007, Mitsui Norin Co., Ltd. reported a ¥16.5 billion impairment loss onall of its goodwill, using a discounted future cash flow method based on its internal operating budget forevaluation of fair value of its goodwill. After reporting this significant impairment loss, Mitsui NorinCo., Ltd. recorded net income of ¥0.3 billion for the year ended March 31, 2008, a marginal incomewhich the management had expected considering continuously strict business conditions.
(*) In March 2008, Urban Renaissance Agency (“URA”), an implementing body of land readjustment of SICP,announced that it would be difficult for URA to execute the project as the implementing body considering aconclusion on the project provided by the special appraisal and monitoring committee, and suggested that theproject plan should be fundamentally revised. As a result of the URA’s announcement, uncertainty about theprogress and profitability of the land readjustment project in SICP has increased and Mitsui recognized a ¥13.9billion impairment loss on land, by re-examining future value based on the current prices in the nearby block.
91

The carrying amounts of goodwill as of Mar 31, 2008, 2007 and 2006 were ¥52.5 billion, ¥37.2 billion and ¥30.6billion, respectively. Since the majority of the increase during the period belongs to the Americas Segment, especiallysubsidiaries in the United States. See Note 12, “GOODWILL AND OTHER INTANGIBLE ASSETS.” As of the dateof this annual report, management pays closer attention to the operating results and business of the subsidiaries in theUnited States in monitoring the possibility of occurrence of goodwill impairment of our overall subsidiaries,considering the deterioration in the United States economy triggered by the subprime mortgage issue.
Comparison between the years ended March 31, 2007 and 2006
Impairment loss of goodwill for the year ended March 31, 2007 was mentioned as above and there were noimpairment losses for the year ended March 31, 2006.
Compensation and Other Charges Related to DPF Incident
In November 2004, Mitsui discovered that false data for diesel particulate filters (“DPF”s) manufactured byMitsui’s subsidiary, PUREarth Incorporated (Japan), and sold by Mitsui had been produced and submitted toauthorities. These filters were subsidized by the Tokyo Metropolitan Government and seven other prefectural andmunicipal governments, as well as the Ministry of Land, Infrastructure and Transport, the Ministry of theEnvironment, and related industry associations. Mitsui had sold approximately 21,500 units of the product.
Mitsui carried out a three-part user response plan involving: (1) the free replacement of DPFs, (2) thereimbursement of the amount paid for purchasing Mitsui’s DPFs in exchange for their redemption and (3) asupport program for the purchase of alternative vehicles, as well as redemption of DPFs.
For the year ended March 31, 2005, Mitsui recorded ¥36.0 billion as compensation and other charges relatedto DPF incident, consisting of a user response charge of approximately ¥28.0 billion and subsidy compensationof approximately ¥8.0 billion.
For the year ended March 31, 2006, Mitsui recorded an additional user response charge of ¥9.0 billion,re-estimating expected costs in each user response plan reflecting changes in the requirement of each respective user.
Mitsui completed the redemption of DPFs for the year ended March 31, 2007, and consequently Mitsuirecorded a credit to income of ¥3.9 billion as a result of the reversal of the accrued cost for compensation andother charges.
For more information, see Note 21, “COMPENSATION AND OTHER CHARGES RELATED TO DPFINCIDENT.”
Other Expense—Net
Comparison between the years ended March 31, 2008 and 2007
Other expense—net for the year ended March 31, 2008 was a ¥3.0 billion expense, an increase of ¥2.5billion, or 500.0%, from a loss of ¥0.5 billion in expenses for the year ended March 31, 2007. A majorcomponent of other expenses—net for the year ended March 31, 2008 was exploration expenses, mainly at MitsuiE&P Australia Pty Limited (Australia). For the year ended March 31, 2007, restructuring-related charges werereported mainly by MITSUI FOODS CO., LTD. (Japan) and Hokushuren Company Limited (Japan).
For more information on other expense—net, see Note 19, “OTHER EXPENSE (INCOME)—NET,” and onour restructuring activities, see Note 24, “EXIT OR DISPOSAL ACTIVITIES.”
Comparison between the years ended March 31, 2007 and 2006
For the year ended March 31, 2007, Other expense—net was a ¥0.5 billion expense, a ¥2.5 billiondeterioration from ¥2.0 billion in income for the year ended March 31, 2006.
For the year ended March 31, 2006, Other expenses—net consisted of individually small items.
92

Income Taxes
Comparison between the years ended March 31, 2008 and 2007
For the year ended March 31, 2008, income taxes were ¥171.2 billion, an increase of ¥25.9 billion, or17.8%, from ¥145.3 billion for the year ended March 31, 2007, reflecting increases in income from continuingoperations before income taxes, minority interests and equity in earnings. The effective tax rate was 42.6%, adecrease of 4.4 percentage points from 47.0% for the year ended March 31, 2007. The decrease was seen in theeffect of taxation on dividends, application of lower income tax rates to certain taxable income at overseassubsidiaries and changes in valuation allowance, which was partly offset by a higher income tax rate on certainnatural resources extracting activities including those in Australia, Thailand and Oman. For further information,see Note 20, “INCOME TAXES.”
Comparison between the years ended March 31, 2007 and 2006
For the year ended March 31, 2007, income taxes were ¥145.3 billion, an increase of ¥11.2 billion, or 8.4%,from ¥134.1 billion for the year ended March 31, 2006, reflecting increases in income from continuing operationsbefore income taxes, minority interests and equity in earnings. The effective tax rate was 47.0%, a decrease of 2.9percentage points from 49.9% for the year ended March 31, 2006. The decline was primarily attributable to theeffect of taxation on dividends to 4.0 percentage points for the year ended March 31, 2007 from 10.8 percentagepoints for the year ended March 31, 2006, which was partly offset by an increase in valuation allowances for theyear ended March 31, 2007, particularly the allowance established at Mitsui Norin Co., Ltd.
Transfer price taxation issue with North West Shelf LNG Project
Mitsui was audited by the Tokyo Regional Taxation Bureau with regard to transfer pricing on the LNGProject in Western Australia for the six fiscal years from the year ended March 31, 2000 to the year endedMarch 31, 2005. At the end of 2007 and 2006, Mitsui received notices of tax assessment from the TokyoRegional Taxation Bureau for the years ended March 31, 2001 and 2000. Based on the notices of assessment, thetaxable incomes were corrected by ¥8.2 billion and ¥4.9 billion, and the additional tax liabilities for income taxeswere ¥3.7 billion and ¥2.4 billion, respectively. Mitsui has paid the additional taxes, but, it disagrees with theassessment and registered its protest in August 2006. In addition, it lodged an application in November 2006 forthe mutual agreement procedure pursuant to a provision in the tax treaty between Japan and Australia in order tosettle the double taxation.
Mitsui believes that the amount of the correction for the years ended March 31, 2001 and 2000 and the taxliabilities for the years ended March 31, 2002 or later, arising from the final correction, if any, will be affected bythe result of the mutual agreement procedure, which is still pending. The effect of this matter was recorded inaccordance with FIN No.48 in the consolidated financial statements for the year ended March 31, 2008.
93

It is reasonably possible that the situation of the mutual agreement procedure may change within the next 12months, and the change could decrease the unrecognized tax benefits in an amount ranging from ¥0 million to¥5.6 billion based on current estimates.
As of March 31, 2008, the earliest tax years that remain subject to examination by major tax jurisdictions inwhich the companies operate are the year ended March 31, 2000 for Japan; the year ended March 31, 2003 forthe United States; and the year ended March 31, 2000 for Australia.
Minority Interests in Earnings of Subsidiaries
Comparison between the years ended March 31, 2008 and 2007
Minority interests in earnings of subsidiaries for the year ended March 31, 2008 were ¥46.0 billion, a largeincrease of ¥28.1 billion, or 157.0%, from ¥17.9 billion for the year ended March 31, 2007. Minority interests inearnings of subsidiaries increased due to the following factors:
• The Energy Segment recorded minority interests in earnings of ¥20.6 billion and 1.7 billion for the yearsended March 31, 2008 and 2007, most of which related to Mitsui Oil Exploration Co., Ltd. (Japan) (witha minority interest of 48.5%), which became a subsidiary as a result of the acquisition of additionalvoting shares in Mitsui Oil Exploration Co., Ltd. (Japan) during the fourth quarter of the year endedMarch 31, 2007.
• In the Foods & Retail Segment, for the year ended March 31, 2007 Mitsui Norin Co., Ltd. (Japan) (witha minority interest of 48.1%) recorded a loss from continuing operations before minority interests andequity in earnings, reflecting significant impairment losses on long-lived assets and goodwill,contributing ¥8.3 billion in minority interests in income for the year ended March 31, 2007. For the yearended March 31, 2008, its operating results recovered to a marginally positive amount of income andzero minority interest is recorded.
• The Mineral & Metal Resources Segment recorded minority interests in earnings of ¥7.2 billion and¥7.3 billion for the years ended March 31, 2008 and 2007, in Japan Collahuasi Resources B.V.(Netherlands) (with a minority interest of 38.1%), which owns an interest in a copper mine joint venture,Compania Minera Dona Ines de Collahuasi SCM (Chile).
Comparison between the years ended March 31, 2007 and 2006
For the year ended March 31, 2007, minority interests in earnings of subsidiaries were ¥17.9 billion, anincrease of ¥4.2 billion, or 30.7%, from ¥13.7 billion for the year ended March 31, 2006. Major factors areprovided below.
• For the year ended March 31, 2007, the Mineral & Metal Resources Segment recorded ¥7.3 billion inminority interests in earnings, up from ¥1.4 billion for the year ended March 31, 2006. Japan CollahuasiResources B.V. (Netherlands) (with a minority interest of 38.1%), which owns an interest in a coppermine joint venture, Compania Minera Dona Ines de Collahuasi SCM (Chile), recorded increases inminority interests in earnings, reflecting higher copper prices.
• The Energy Segment and the Chemical Segment also reported increases in minority interests inearnings, mainly attributable to Mitsui Oil Exploration Co., Ltd., which was newly consolidated as asubsidiary in the fourth quarter of the year ended March 31, 2007, and Japan-Arabia Methanol Co., Ltd.,which recorded an increase in earnings supported by a favorable market environment.
• For the year ended March 31, 2007, in the Foods & Retail Segment, Mitsui Norin Co., Ltd. (with aminority interest of 48.1%) recorded ¥8.3 billion in minority interest in income for the year endedMarch 31, 2007 compared to a ¥0.2 billion loss for the year ended March 31, 2006.
94

Equity in Earnings of Associated Companies—Net (After Income Tax Effect)
Comparison between the years ended March 31, 2008 and 2007
Equity in earnings of associated companies—net (after income tax effect) for the year ended March 31, 2008was ¥154.3 billion, a slight increase of ¥1.2 billion, or 0.8%, from ¥153.1 billion for the year ended March 31,2007. Major factors for improved earnings are as follows. (See “Operating Results by Operating Segment” fordetailed discussion.):
• For the year ended March 31, 2008, the Mineral & Metal Resources Segment reported ¥71.2 billionequity in earnings, an increase of ¥10.9 billion, from ¥60.3 billion for the year ended March 31, 2007.Earnings increased at Valepar S.A. (Brazil)(*1) due to strong operating results of Companhia Vale do RioDoce in Brazil (“Vale”) reflecting higher iron prices and contributions from Inco Limited (currentlyVale Inco Limited) following the acquisition by Vale during the fourth quarter of the year endedMarch 31, 2007.
• For the year ended March 31, 2008, the Energy Segment reported ¥36.8 billion equity in earnings, adecrease of ¥7.6 billion, from ¥44.4 billion for the year ended March 31, 2007. Operating results ofMitsui Oil Exploration Co., Ltd. were reported as earnings of an associated company up to the thirdquarter of the year ended March 31, 2007. However upon Mitsui’s acquisition of the additional votingshares in the fourth quarter of the year ended March 31, 2007, its operating results are now reportedwithin line items of the consolidated statement of income for the year ended March 31, 2008. On theother hand, a LNG and oil development associated company, Japan Australia LNG (MIMI) Pty. Ltd.(Australia), recorded a slight increase in earnings.
• For the year ended March 31, 2008, the Machinery & Infrastructure Projects Segment reported a ¥20.3billion equity in earnings, a decrease of ¥1.1 billion, from ¥21.4 billion for the year ended March 31,2007. This segment recorded a loss reflecting an other-than-temporary decline in share price of ASAHITEC CORPORATION (Japan), a manufacturer of ductile iron cast parts and aluminum forged parts. Inaddition, IPM Eagle LLP (United Kingdom) and others recorded a total of ¥5.8 billion mark-to-marketevaluation loss on long-term swap agreements at their overseas power operations for the year endedMarch 31, 2008(*2), while Brazilian gas distribution associated companies reported improved earnings.
• Other operating segments also recorded improvement in general, mainly in the Consumer Service & ITSegment.
Comparison between the years ended March 31, 2007 and 2006
For the year ended March 31, 2007, equity in earnings of associated companies—net (after income taxeffect) was ¥153.1 billion, a significant increase of ¥58.9 billion, or 62.5%, from ¥94.2 billion for the year endedMarch 31, 2006.
• For the year ended March 31, 2007, the Mineral & Metal Resources Segment reported ¥60.3 billionequity in earnings, a significant increase of ¥32.3 billion, from ¥28.0 billion for the year endedMarch 31, 2006. This is attributable to Compania Minera Dona Ines de Collahuasi SCM reflectinghigher copper prices, and Valepar S.A. and Robe River Mining Company Pty. Ltd. (Australia) reflectinghigher iron ore prices.
(*1) Valepar S.A. is a controlling shareholder of Vale, Companhia Vale do Rio Doce, a mineral resourcescompany in Brazil, previously abbreviated as “CVRD”.
(*2) An Australian power producing operation of IPM Eagle had concluded a long term power price swapcontract, corresponding to a power supply contract until 2016. Reflecting fluctuations in the Australian openelectricity market, it recognizes mark-to-market evaluation profit and loss. See also “Machinery &Infrastructure Projects Segment” of “Operating Results by Operating Segment” for further information.
95

• The Energy Segment reported ¥44.4 billion equity in earnings, an increase of ¥9.8 billion from ¥34.6billion for the year ended March 31, 2006. Earnings increased at Japan Australia LNG (MIMI) Pty, Ltd.and at Mitsui Oil Exploration Co., Ltd..
• Other operating segments also recorded improvement in general, mainly in the Machinery &Infrastructure Projects Segment and the Consumer Service & IT Segment.
Income (Loss) from Discontinued Operations—Net (After Income Tax Effect)
Comparison between the years ended March 31, 2008 and 2007
Income from discontinued operations—net (after income tax effect) for the year ended March 31, 2008 was¥71.0 billion, a significant increase of ¥68.6 billion, or 2,858.3%, from ¥2.4 billion for the year ended March 31,2007. Major components of discontinued operations for the year ended March 31, 2008 and 2007 were asfollows:
• For the year ended March 31, 2008, we divested our entire stake in Sesa Goa Limited (India) andrecorded a ¥55.2 billion gain in income in line with an on-going optimization initiative of the businessportfolio in our worldwide iron ore mining operations. For the year ended March 31, 2007, Sesa GoaLimited reported ¥1.4 billion in net income.
• We divested our entire oil and gas producing interest in Wandoo Petroleum Pty Limited (Australia) andrecorded a ¥9.6 billion gain in income. For the year ended March 31, 2007, Wandoo Petroleum PtyLimited reported ¥0.2 billion in net income.
• For the year ended March 31, 2008, we liquidated an aircraft leasing company of Tombo Aviation(United States) after divesting all its aircraft and recorded ¥4.4 billion in income, while it reported ¥0.3billion in income for the year ended March 31, 2007.
• For the year ended March 31, 2008, Mitsui Bussan House-Techno, Inc., which discontinued housingbusiness during the year ended March 31, 2007, recorded a ¥0.2 billion gain in income. For the yearended March 31, 2008, Mitsui Bussan House-Techno recorded ¥1.1 billion in net loss.
Mitsui Bussan House Techno recorded estimated cost of ¥5.3 billion to meet future requirements forproducts warranties and maintenance Services for the year ended March 31, 2007. For further information aboutthe products warranties, refer to Note 22, “CONTINGENT LIABILITIES”. Except Mitsui Bussan House-Technothere is no significant contingent liability from the discontinued operations.
For additional information about our discontinued operations, see Note 4, “DISCONTINUEDOPERATIONS.”
Comparison between the years ended March 31, 2007 and 2006
For the year ended March 31, 2007, income from discontinued operations—net (after income tax effect) was¥2.4 billion, a ¥15.1 billion improvement from a loss of ¥12.7 billion for the year ended March 31, 2006.
• The primary component of discontinued operations for the year ended March 31, 2007 was Mitalco Inc.(United States) owned jointly by the Mineral & Metal Resources Segment and the Americas Segment.Mitalco Inc. held a 32% stake in two aluminum smelting facilities in the United States and had mainlybeen engaged in manufacturing and the sale of aluminum. Because of the declining profitabilityresulting from the deterioration in the terms of the power purchase contract during the course of renewalnegotiations, we divested our entire stake in both facilities. The income (loss) from the discontinuedoperation of Mitalco Inc. for the years ended March 31, 2007 and 2006 were ¥3.1 billion in income anda ¥14.5 billion loss, respectively.
• The primary component of discontinued operations for the year ended March 31, 2006 was ArcadiaPetroleum Ltd. (United Kingdom), a crude oil trading subsidiary reported in the Energy Segment andthe Europe, the Middle East and Africa Segment. While Arcadia Petroleum Ltd. had been trading
96

physical crude oil as well as future oil and oil derivatives, its expanding activity under booming oilprices exposed us to larger risks, such as market risk, and would have required us to invest in additionaloperating resources. As a result of an overall review of the business model of Arcadia Petroleum Ltd.and our business portfolio, we decided to sell all the shares of Arcadia Petroleum Ltd. to a new owner.We divested all shares during the year ended March 31, 2006. The income from discontinued operationof Arcadia Petroleum Ltd. was minimal for the year ended March 31, 2006.
Operating Results by Operating Segment
The business units of Mitsui’s Head Office, which are organized based on “products and services,” planoverall and worldwide strategies for their products and services and conduct their worldwide operations. Thebusiness units also collaborate with overseas branches and overseas trading subsidiaries in planning andexecuting their strategies for products and regions. The overseas branches and overseas trading subsidiaries areseparate operating units, which are delegated responsibility for the business of their regions as the centers of eachparticular regional strategy and operate diversified businesses together with their subsidiaries and associatedcompanies in collaboration with the business units. Therefore, our operating segments consist of product-focusedoperating segments comprised of the business units of the Head Office and region-focused operating segmentscomprised of overseas branches and overseas trading subsidiaries.
Our operating segments have been aggregated based on the nature of the products and other criteria intoeight product-focused reportable operating segments and three region-focused reportable operating segments,totaling eleven reportable operating segments.
Based on the reorganization effective April 1, 2007, the operating segment is changed as below. Theoperating segment information for the year ended March 31, 2007 and 2006 has been restated to conform to thecurrent year presentation.
• “Iron & Steel Raw Materials and Non-Ferrous Metals” changed its name to “Mineral & MetalResources” and coal and nuclear fuel businesses previously included in “Iron & Steel Raw Materialsand Non-Ferrous Metals”, were transferred to “Energy.”
• The former “Lifestyle, Consumer Service and Information, Electronics & Telecommunication” changedits name to “Consumer Service & IT” to reflect the change of the composition of the reportablesegment.
• The former “Asia” changed its name to “Asia Pacific”, newly including subsidiaries in the Oceaniaregion which were formerly included in “Other Overseas Areas.”
• The former “Europe” changed its name to “Europe, the Middle East and Africa”, newly includingsubsidiaries in the Middle East, Africa and Russia which were formerly included in “Other Overseas Areas.”
97

Our operating segment information for gross profit, operating income (loss), equity in earnings (losses) ofassociated companies and net income (loss) for the years ended March 31, 2008, 2007 and 2006 is as follows:
Operating Segment Information
Gross Profit
Billions of Yen
Years Ended March 31, Change(2008–2007)
Change(2007–2006)2008 2007 2006
Iron & Steel Products . . . . . . . . . . . . . . . . . . . . . . . . . . . . . . ¥ 61.3 ¥ 57.7 ¥ 54.4 ¥ 3.6 ¥ 3.3Mineral & Metal Resources . . . . . . . . . . . . . . . . . . . . . . . . . 95.8 111.0 88.5 (15.2) 22.5Machinery & Infrastructure Projects . . . . . . . . . . . . . . . . . . . 134.1 108.0 90.6 26.1 17.4Chemical . . . . . . . . . . . . . . . . . . . . . . . . . . . . . . . . . . . . . . . . 110.3 103.1 97.8 7.2 5.3Energy . . . . . . . . . . . . . . . . . . . . . . . . . . . . . . . . . . . . . . . . . . 219.3 123.9 107.0 95.4 16.9Foods & Retail . . . . . . . . . . . . . . . . . . . . . . . . . . . . . . . . . . . 81.2 81.3 79.9 (0.1) 1.4Consumer Service & IT . . . . . . . . . . . . . . . . . . . . . . . . . . . . 116.7 130.0 128.4 (13.3) 1.6Logistics & Financial Markets . . . . . . . . . . . . . . . . . . . . . . . 55.1 60.5 51.4 (5.4) 9.1Americas . . . . . . . . . . . . . . . . . . . . . . . . . . . . . . . . . . . . . . . . 54.0 64.7 61.6 (10.7) 3.1Europe, the Middle East and Africa . . . . . . . . . . . . . . . . . . . 26.8 25.4 24.3 1.4 1.1Asia Pacific . . . . . . . . . . . . . . . . . . . . . . . . . . . . . . . . . . . . . . 33.1 30.7 30.4 2.4 0.3
Total . . . . . . . . . . . . . . . . . . . . . . . . . . . . . . . . . . . . . . . . . . . 987.7 896.3 814.3 91.4 82.0
All Other . . . . . . . . . . . . . . . . . . . . . . . . . . . . . . . . . . . . . . . . 5.5 4.3 7.1 1.2 (2.8)Adjustments and Eliminations . . . . . . . . . . . . . . . . . . . . . . . (5.1) (34.3) (36.8) 29.2 2.5
Consolidated Total . . . . . . . . . . . . . . . . . . . . . . . . . . . . . . . . ¥988.1 ¥866.3 ¥784.6 ¥121.8 ¥81.7
98

Operating Income (Loss)
Billions of Yen
Years Ended March 31, Change(2008–2007)
Change(2007–2006)2008 2007 2006
Iron & Steel Products . . . . . . . . . . . . . . . . . . . . . . . . . . . . . ¥ 25.6 ¥ 25.6 ¥ 26.5 ¥ 0.0 ¥ (0.9)Mineral & Metal Resources . . . . . . . . . . . . . . . . . . . . . . . . . 79.0 91.3 68.5 (12.3) 22.8Machinery & Infrastructure Projects . . . . . . . . . . . . . . . . . . 32.0 20.9 21.7 11.1 (0.8)Chemical . . . . . . . . . . . . . . . . . . . . . . . . . . . . . . . . . . . . . . . 46.2 35.3 34.0 10.9 1.3Energy . . . . . . . . . . . . . . . . . . . . . . . . . . . . . . . . . . . . . . . . . 172.4 81.3 70.7 91.1 10.6Foods & Retail . . . . . . . . . . . . . . . . . . . . . . . . . . . . . . . . . . . 16.6 10.9 9.2 5.7 1.7Consumer Service & IT . . . . . . . . . . . . . . . . . . . . . . . . . . . . 18.9 20.3 25.0 (1.4) (4.7)Logistics & Financial Markets . . . . . . . . . . . . . . . . . . . . . . 20.9 24.2 17.6 (3.3) 6.6Americas . . . . . . . . . . . . . . . . . . . . . . . . . . . . . . . . . . . . . . . 2.0 21.4 21.7 (19.4) (0.3)Europe, the Middle East and Africa . . . . . . . . . . . . . . . . . . 1.8 3.0 4.7 (1.2) (1.7)Asia Pacific . . . . . . . . . . . . . . . . . . . . . . . . . . . . . . . . . . . . . 7.6 9.5 11.2 (1.9) (1.7)
Total . . . . . . . . . . . . . . . . . . . . . . . . . . . . . . . . . . . . . . . . . . . 423.0 343.7 310.8 79.3 32.9
All Other . . . . . . . . . . . . . . . . . . . . . . . . . . . . . . . . . . . . . . . (1.4) (4.4) (3.2) 3.0 (1.2)Adjustments and Eliminations . . . . . . . . . . . . . . . . . . . . . . . (46.8) (56.5) (59.9) 9.7 3.4
Consolidated Total . . . . . . . . . . . . . . . . . . . . . . . . . . . . . . . . ¥374.8 ¥282.8 ¥247.7 ¥ 92.0 ¥35.1
Operating Income (Loss)
Operating income (loss) is included in the measure of segment performance reviewed by the chief operatingdecision maker. Operating income (loss) reflects our (a) gross profit, (b) selling, general and administrativeexpenses and (c) provision for doubtful receivables, as presented in the Statements of Consolidated Income.
Equity in Earnings (Losses) of Associated Companies
Billions of Yen
Years Ended March 31, Change(2008–2007)
Change(2007–2006)2008 2007 2006
Iron & Steel Products . . . . . . . . . . . . . . . . . . . . . . . . . . . . . . ¥ 4.9 ¥ 3.1 ¥ 2.9 ¥ 1.8 ¥ 0.2Mineral & Metal Resources . . . . . . . . . . . . . . . . . . . . . . . . . . 71.2 60.3 28.0 10.9 32.3Machinery & Infrastructure Projects . . . . . . . . . . . . . . . . . . . 20.3 21.4 14.6 (1.1) 6.8Chemical . . . . . . . . . . . . . . . . . . . . . . . . . . . . . . . . . . . . . . . . 5.8 4.9 3.2 0.9 1.7Energy . . . . . . . . . . . . . . . . . . . . . . . . . . . . . . . . . . . . . . . . . . 36.8 44.4 34.6 (7.6) 9.8Foods & Retail . . . . . . . . . . . . . . . . . . . . . . . . . . . . . . . . . . . . 3.1 3.8 3.5 (0.7) 0.3Consumer Service & IT . . . . . . . . . . . . . . . . . . . . . . . . . . . . . 8.2 8.7 3.5 (0.5) 5.2Logistics & Financial Markets . . . . . . . . . . . . . . . . . . . . . . . (1.8) 2.0 3.9 (3.8) (1.9)Americas . . . . . . . . . . . . . . . . . . . . . . . . . . . . . . . . . . . . . . . . 5.0 3.8 2.1 1.2 1.7Europe, the Middle East and Africa . . . . . . . . . . . . . . . . . . . 0.3 0.3 (0.2) 0.0 0.5Asia Pacific . . . . . . . . . . . . . . . . . . . . . . . . . . . . . . . . . . . . . . 1.1 0.7 0.8 0.4 (0.1)
Total . . . . . . . . . . . . . . . . . . . . . . . . . . . . . . . . . . . . . . . . . . . . 154.9 153.4 96.9 1.5 56.5
All Other . . . . . . . . . . . . . . . . . . . . . . . . . . . . . . . . . . . . . . . . 0.1 0.1 0.3 0.0 (0.2)Adjustments and Eliminations . . . . . . . . . . . . . . . . . . . . . . . . (0.7) (0.4) (3.0) (0.3) 2.6
Consolidated Total . . . . . . . . . . . . . . . . . . . . . . . . . . . . . . . . . ¥154.3 ¥153.1 ¥94.2 ¥ 1.2 ¥58.9
99

Net Income (Loss)
Billions of Yen
Years Ended March 31, Change(2008–2007)
Change(2007–2006)2008 2007 2006
Iron & Steel Products . . . . . . . . . . . . . . . . . . . . . . . . . . . . . . ¥ 20.3 ¥ 20.6 ¥ 19.3 ¥ (0.3) ¥ 1.3Mineral & Metal Resources . . . . . . . . . . . . . . . . . . . . . . . . . 177.0 98.3 44.8 78.7 53.5Machinery & Infrastructure Projects . . . . . . . . . . . . . . . . . . . 35.0 33.6 30.6 1.4 3.0Chemical . . . . . . . . . . . . . . . . . . . . . . . . . . . . . . . . . . . . . . . . 18.4 19.3 12.1 (0.9) 7.2Energy . . . . . . . . . . . . . . . . . . . . . . . . . . . . . . . . . . . . . . . . . . 124.1 75.7 50.8 48.4 24.9Foods & Retail . . . . . . . . . . . . . . . . . . . . . . . . . . . . . . . . . . . 10.5 (12.3) (3.2) 22.8 (9.1)Consumer Service & IT . . . . . . . . . . . . . . . . . . . . . . . . . . . . 12.0 16.6 17.5 (4.6) (0.9)Logistics & Financial Markets . . . . . . . . . . . . . . . . . . . . . . . 7.5 14.6 13.4 (7.1) 1.2Americas . . . . . . . . . . . . . . . . . . . . . . . . . . . . . . . . . . . . . . . . 4.3 16.9 12.7 (12.6) 4.2Europe, the Middle East and Africa . . . . . . . . . . . . . . . . . . . 5.0 4.1 5.0 0.9 (0.9)Asia Pacific . . . . . . . . . . . . . . . . . . . . . . . . . . . . . . . . . . . . . . 22.5 22.0 22.8 0.5 (0.8)
Total . . . . . . . . . . . . . . . . . . . . . . . . . . . . . . . . . . . . . . . . . . . 436.6 309.4 225.8 127.2 83.6
All Other . . . . . . . . . . . . . . . . . . . . . . . . . . . . . . . . . . . . . . . . (7.1) 5.8 11.8 (12.9) (6.0)Adjustments and Eliminations . . . . . . . . . . . . . . . . . . . . . . . (19.4) (13.7) (35.2) (5.7) 21.5
Consolidated Total . . . . . . . . . . . . . . . . . . . . . . . . . . . . . . . . ¥410.1 ¥301.5 ¥202.4 ¥108.6 ¥99.1
Iron & Steel Products Segment
Billions of Yen
Years Ended March 31, Change(2008–2007)
Change(2007–2006)2008 2007 2006
Gross Profit . . . . . . . . . . . . . . . . . . . . . . . . . . . . . . . . . . . . . . . . . ¥61.3 ¥57.7 ¥54.4 ¥ 3.6 ¥ 3.3Operating Income . . . . . . . . . . . . . . . . . . . . . . . . . . . . . . . . . . . . 25.6 25.6 26.5 0.0 (0.9)Equity in Earnings of Associated Companies . . . . . . . . . . . . . . . 4.9 3.1 2.9 1.8 0.2Net Income . . . . . . . . . . . . . . . . . . . . . . . . . . . . . . . . . . . . . . . . . 20.3 20.6 19.3 (0.3) 1.3
100
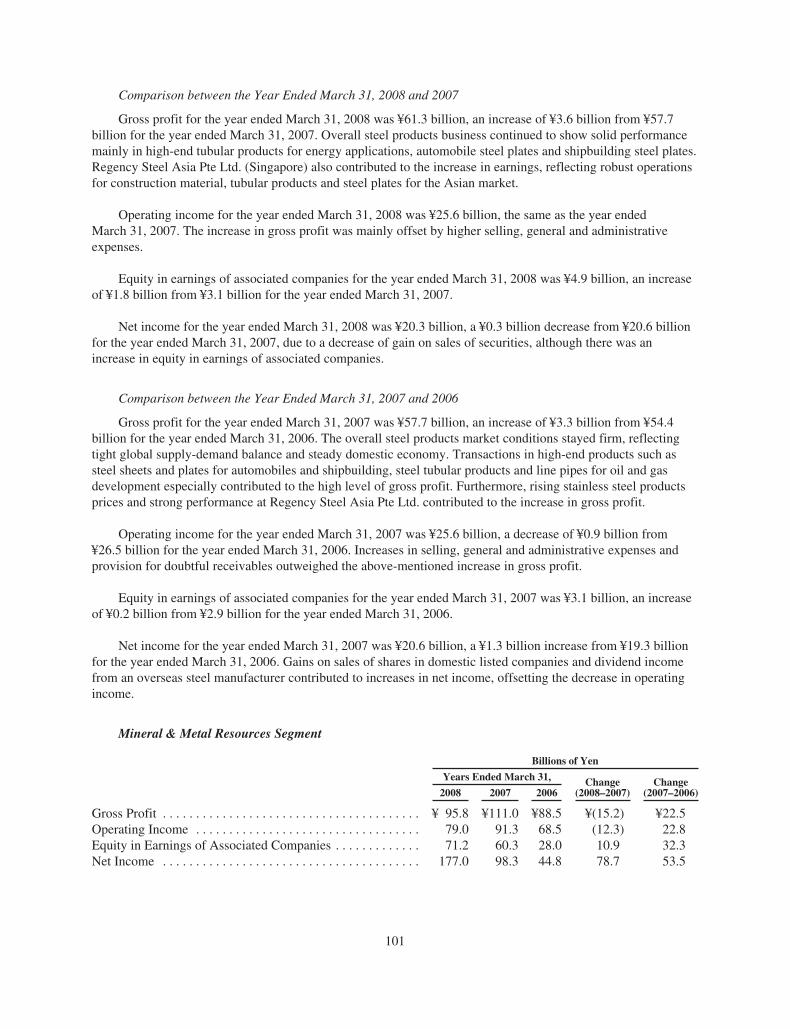
Comparison between the Year Ended March 31, 2008 and 2007
Gross profit for the year ended March 31, 2008 was ¥61.3 billion, an increase of ¥3.6 billion from ¥57.7billion for the year ended March 31, 2007. Overall steel products business continued to show solid performancemainly in high-end tubular products for energy applications, automobile steel plates and shipbuilding steel plates.Regency Steel Asia Pte Ltd. (Singapore) also contributed to the increase in earnings, reflecting robust operationsfor construction material, tubular products and steel plates for the Asian market.
Operating income for the year ended March 31, 2008 was ¥25.6 billion, the same as the year endedMarch 31, 2007. The increase in gross profit was mainly offset by higher selling, general and administrativeexpenses.
Equity in earnings of associated companies for the year ended March 31, 2008 was ¥4.9 billion, an increaseof ¥1.8 billion from ¥3.1 billion for the year ended March 31, 2007.
Net income for the year ended March 31, 2008 was ¥20.3 billion, a ¥0.3 billion decrease from ¥20.6 billionfor the year ended March 31, 2007, due to a decrease of gain on sales of securities, although there was anincrease in equity in earnings of associated companies.
Comparison between the Year Ended March 31, 2007 and 2006
Gross profit for the year ended March 31, 2007 was ¥57.7 billion, an increase of ¥3.3 billion from ¥54.4billion for the year ended March 31, 2006. The overall steel products market conditions stayed firm, reflectingtight global supply-demand balance and steady domestic economy. Transactions in high-end products such assteel sheets and plates for automobiles and shipbuilding, steel tubular products and line pipes for oil and gasdevelopment especially contributed to the high level of gross profit. Furthermore, rising stainless steel productsprices and strong performance at Regency Steel Asia Pte Ltd. contributed to the increase in gross profit.
Operating income for the year ended March 31, 2007 was ¥25.6 billion, a decrease of ¥0.9 billion from¥26.5 billion for the year ended March 31, 2006. Increases in selling, general and administrative expenses andprovision for doubtful receivables outweighed the above-mentioned increase in gross profit.
Equity in earnings of associated companies for the year ended March 31, 2007 was ¥3.1 billion, an increaseof ¥0.2 billion from ¥2.9 billion for the year ended March 31, 2006.
Net income for the year ended March 31, 2007 was ¥20.6 billion, a ¥1.3 billion increase from ¥19.3 billionfor the year ended March 31, 2006. Gains on sales of shares in domestic listed companies and dividend incomefrom an overseas steel manufacturer contributed to increases in net income, offsetting the decrease in operatingincome.
Mineral & Metal Resources Segment
Billions of Yen
Years Ended March 31, Change(2008–2007)
Change(2007–2006)2008 2007 2006
Gross Profit . . . . . . . . . . . . . . . . . . . . . . . . . . . . . . . . . . . . . . . ¥ 95.8 ¥111.0 ¥88.5 ¥(15.2) ¥22.5Operating Income . . . . . . . . . . . . . . . . . . . . . . . . . . . . . . . . . . 79.0 91.3 68.5 (12.3) 22.8Equity in Earnings of Associated Companies . . . . . . . . . . . . . 71.2 60.3 28.0 10.9 32.3Net Income . . . . . . . . . . . . . . . . . . . . . . . . . . . . . . . . . . . . . . . 177.0 98.3 44.8 78.7 53.5
101

Comparison between the Years Ended March 31, 2008 and 2007
Gross profit for the year ended March 31, 2008 was ¥95.8 billion, a decrease of ¥15.2 billion from ¥111.0billion for the year ended March 31, 2007 as a result of the following:
• The divestiture in April 2007 of our entire holding in Sesa Goa Limited, formerly our iron oresubsidiary, which resulted in a decrease of this segment’s gross profit by ¥27.2 billion(*), the amountwhich Sesa Goa Limited contributed for the year ended March 31, 2007.
• The International Iron and Steel Institute reported in May 2008 that global crude steel output for 2007(calendar year) maintained a high level of 1,344 million metric tons, following 1,250 million metric tonsfor 2006. Reflecting tight supply-demand balance in Asia, especially in China, iron ore prices for theyear ending March 31, 2008 increased by 9.5 % from the year ended March 31, 2007. Consequently,gross profit at Mitsui Iron Ore Development Pty. Ltd. (Australia) and Mitsui Itochu Iron Pty. Ltd.(Australia) increased by ¥8.7 billion and ¥4.3 billion, respectively. At Mitsui Iron Ore Development Pty.Ltd. and Mitsui Itochu Iron Pty. Ltd., shipments (on our equity production basis, preliminary figures)stayed at almost the same levels of 22.6 million tons and 3.1 million tons respectively for the year endedMarch 31, 2008, from 22.8 million tons and 2.9 million tons respectively for the year ended March 31,2007.
Operating income for the year ended March 31, 2008 was ¥79.0 billion, a decrease of ¥12.3 billion from¥91.3 billion for the year ended March 31, 2007, due to the above-mentioned decrease in gross profit. There wasa marginal improvement in selling, general administrative expenses as a result of the divestiture of Sesa GoaLimited.
Equity in earnings of associated companies for the year ended March 31, 2008 was ¥71.2 billion, anincrease of ¥10.9 billion from ¥60.3 billion for the year ended March 31, 2007. Major factors contributing to theincrease were as follows:
• Valepar S.A. (Brazil) posted a net income of ¥34.1 billion, an increase by ¥9.1 billion from ¥25.0 billionincluding a ¥5.6 billion one-time gain on issuance of stock by Vale in exchange for Caemi Mineraçã o eMetalurgia S.A stock in the year ended March 31, 2007. This increase is due to strong operating results ofVale reflecting higher iron prices and contributions from newly acquired Inco Limited (currently Vale IncoLimited) following the acquisition by Vale during the fourth quarter of the year ended March 31, 2007.
• Earnings of Compania Minera Dona Ines de Collahuasi SCM (Chile) was a net income of ¥18.9 billion,a decrease of ¥0.3 billion from the year ended March 31, 2007. The LME copper price for 2007(calendar year) was U.S.$7,126 per ton on average compared to U.S.$6,731 per ton for 2006 (calendaryear).
• Sims Group Limited (Australia), a metal recycler, added a new contribution in earnings of ¥1.9 billionfor the year ended March 31, 2008.
Net income for the year ended March 31, 2008 was ¥177.0 billion, a significant increase of ¥78.7 billionfrom ¥98.3 billion for the year ended March 31, 2007. Besides the above-mentioned factors, there weresignificant gains from divestitures for the year ended March 31, 2008 and 2007 as follows:
• For the year ended March 31, 2008, this segment recorded a ¥93.9 billion gain on the sale of its wholestake in Sesa Goa Limited(*). In addition, it also recorded a ¥12.4 billion gain on the sale of shares inEmpreendimentos Brasileiros de Mineração S.A.
(*) In the consolidated statements of income, net income of Sesa Goa for the years ended March 31, 2008, 2007and 2006 are presented as income from discontinued operations (after income tax effect). However, in this“Operating Results by Operating Segment”, operating results of Sesa Goa have been included in andpresented as continuing operation.
102

• For the years ended March 31, 2008 and 2007, this segment recorded ¥14.2 billion and ¥9.4 billiongains on the sale of shares in Toho Titanium Co., Ltd. (Japan), respectively.
Comparison between the Years Ended March 31, 2007 and 2006
Gross profit for the year ended March 31, 2007 was ¥111.0 billion, an increase of ¥22.5 billion from ¥88.5billion for the year ended March 31, 2006.
The International Iron and Steel Institute reported in May 2007 that global crude steel output for 2006(calendar year) maintained a high level of 1,244 million metric tons, following 1,142 million metric tons for2005. Iron ore prices for the year ended March 31, 2007 rose by 19% from the year ended March 31, 2006,resulting in increases in gross profit at Mitsui Iron Ore Development Pty. Ltd., and Mitsui Itochu Iron Pty. Ltd.by ¥13.7 billion, and ¥3.6 billion, respectively. At Mitsui Iron Ore Development Pty. Ltd. and Mitsui Itochu IronPty. Ltd., shipments (on our equity production basis) increased slightly to 21.9 million tons and 2.9 million tons,respectively, for the year ended March 31, 2007 from 21.8 million tons and 2.5 million tons, respectively, for theyear ended March 31, 2006.
Operating income for the year ended March 31, 2007 was ¥9l.3 billion, an increase of ¥22.8 billion from¥68.5 billion for the year ended March 31, 2006.
Equity in earnings of associated companies for the year ended March 31, 2007 was ¥60.3 billion, a significantincrease of ¥32.3 billion from ¥28.0 billion for the year ended March 31, 2006. Major factors were as follows:
• Supported by higher market prices of their mining products, our equity in earnings of Valepar S.A. was¥25.0 billion, including a ¥5.6 billion gain on issuance of stock by Vale in exchange for CaemiMineração e Metalurgia S.A stock, which was a ¥10.4 billion increase from the year ended March 31,2006.
• Robe River Mining Company Pty. Ltd. (Australia), an iron ore mining company, recorded earnings of¥12.3 billion, an increase of ¥3.3 billion from the year ended March 31, 2006.
• Compania Minera Dona Ines de Collahuasi SCM recorded earnings of ¥19.2 billion, an increase of¥15.5 billion from the year ended March 31, 2006, due to the rise in copper prices as well as a tax effecton its retained earnings for the additional Chilean tax charged to dividend recipients which took place inthe year ended March 31, 2006. The LME copper price for 2006 (calendar year) was U.S.$6,731 per tonon average, a significant increase from U.S.$3,684 per ton for 2005 (calendar year).
Net income for the year ended March 31, 2007 was ¥98.3 billion, a ¥53.5 billion increase from ¥44.8 billionfor the year ended March 31, 2006. In addition to improvements in operating income and equity in earnings ofassociated companies, the following components contributed to this increase:
• This segment recorded a ¥14.2 billion gain on the sale of shares in Toho Titanium Co., Ltd. for the yearended March 31, 2007.
• For the year ended March 31, 2006, an aluminum smelting subsidiary, Mitalco Inc. (United States),recorded an ¥11.8 billion impairment loss on plant facilities and ¥11.5 billion in other expensesincluding impairment on goodwill. However, it recorded a gain on the sale of its stake in aluminumsmelters for the year ended March 31, 2007.
103

Short- and Long-Term Outlook on Prices and Supply-Demand Balance for Iron Ore, and Our EquityProduction
Short-Term Pricing and Supply-Demand Balance
The iron ore production joint venture businesses in Australia and other regions in which we participate withmajor overseas mineral resources companies conclude supply contracts with Japanese steel manufacturers andmajor clients in other countries every year. Based on such contracts, sales prices are reviewed and renegotiatedeach fiscal year. (Unit prices for iron ore from each mine in production also reflect the difference of respectivegrades and types.)
Annual prices of iron ore for the year ending March 31, 2009 have risen sharply after long negotiationsbetween major mining houses and worldwide major users. Price negotiation on Brazilian iron ore was firstlysettled in February 2008, resulting in a 65% price increase for a certain ore type over the annual prices for theyear ended March 31, 2008. Later on, in June and July 2008, Australian lump ore and fine ore prices were fixed,reflecting increase of 96.5% and 79.88%, respectively over the annual prices for the year ended March 31, 2008.FOB prices of Brazilian iron ore and Australian iron ore had been the same level as a customary practice in thisindustry up to the year ended March 31, 2008. However, Australian iron ore producers insisted that differentprice be applied, reflecting ocean freight difference between Australia and Brazil to major steel makingcountries, China and Japan.
Fluctuations in iron ore prices directly affect revenues from the equity-based production at our iron oresubsidiaries and associated companies. For the year ending March 31, 2009, we estimate that the impact on netincome from a change of U.S.$1 per ton in iron ore price would be approximately ¥2.6 billion.
For the year ended March 31, 2008, the equity-based shipments of our overseas subsidiaries and associatedcompanies amounted to approximately 40 million tons of iron ore. The above-mentioned effect is calculatedbased on the assumptions of an estimated increase in production in line with our holdings after the year endedMarch 31, 2008, and a specific range of foreign exchange rates for the Japanese yen, U.S. dollar, Australiandollar and Brazilian real.
Efforts are being undertaken at each mine to expand production and shipments, but production costs areincreasing amid a global trend of rising material and equipment costs as well as utility costs. In natural resourceproducing countries such as Australia and Brazil, there is a general trend toward currency appreciation in linewith the growing export of those products, resulting in a negative impact on the revenues of our overseassubsidiaries and associated companies.
Middle- and Long-Term Price Outlook and Supply-Demand Balance and Trends in Our Equity Production
In order to respond to tightening supply-demand balance, major iron ore producers are investing to increaseproduction capacity. As of March 31, 2008, noteworthy developments in iron ore projects in which we holdstakes are as follows: (Unless otherwise noted, production amounts represent a 100% basis.)
• Our iron ore mining joint ventures led by the BHP Billiton group have completed expanding to raise thecombined iron ore production capacity to 129 million tons per annum from 118 million tons. Inaddition, the joint venture members have further agreed to an expansion plan to increase annualproduction capacity to 155 million tons and to start production by 2010. Furthermore, joint venturemembers have agreed to approve capital investment representing pre-approval of expenditures involvingthe expansion of railway and ports in parallel with current construction, with the aim being to increaseannual production capacity to 200 million tons by 2011.
• In the iron ore mining joint venture led by Rio Tinto group, participants have agreed to a plan toincrease port capacity at Cape Lambert in the Pilbara region of Western Australia from nameplatecapacity of 55 to 80 million tons per annum by the end of 2008 and construction is ongoing.
104

Furthermore, the joint venture decided to develop the Mesa A / Warramboo mine in the Pilbara regionof Western Australia. The new mine will have a full scale capacity of 25 million tons per annum and isexpected to start production in 2010. The total mine life of Mesa A is expected to be 11 years. With thisaddition, total production of Robe Valley pisolite ore will be maintained at 32 million tons per annum.
Including those we are participating in, most of the iron ore mining projects have plans for expanding theirproduction capacity. As there are too many uncertainties including demand from China and other emergingcountries, it is difficult for our management to draw up definitive forecasts on supply-demand balance and pricesat this point in time.
Machinery & Infrastructure Projects Segment
Billions of Yen
Years Ended March 31, Change(2008–2007)
Change(2007–2006)2008 2007 2006
Gross Profit . . . . . . . . . . . . . . . . . . . . . . . . . . . . . . . . . . . . . . . ¥134.1 ¥108.0 ¥90.6 ¥26.1 ¥17.4Operating Income . . . . . . . . . . . . . . . . . . . . . . . . . . . . . . . . . . 32.0 20.9 21.7 11.1 (0.8)Equity in Earnings of Associated Companies . . . . . . . . . . . . . 20.3 21.4 14.6 (1.1) 6.8Net Income . . . . . . . . . . . . . . . . . . . . . . . . . . . . . . . . . . . . . . . 35.0 33.6 30.6 1.4 3.0
Comparison between the Years Ended March 31, 2008 and 2007
Gross profit for the year ended March 31, 2008 was ¥134.1 billion, an increase of ¥26.1 billion from ¥108.0billion for the year ended March 31, 2007.
• Overseas automotive-related subsidiaries continued to post solid performance, particularly themotorcycle retail finance company P.T. Bussan Auto Finance (Indonesia) reported higher gross profit,along with an automobile sales dealer company in Russia and other areas. In addition, there werecontributions from a newly acquired machine tools subsidiary, Ellison Technologies Inc. (UnitedStates).
• Ocean vessels and marine project businesses showed overall strong performance through marketingnewly built and second hand vessels, operating and chartering vessels and energy related businesses,supported by continued strong demand.
• Gross profit increased due to expanding operations at the two rolling stock leasing subsidiaries inEurope and plant businesses including power generation businesses.
Operating income for the year ended March 31, 2008 was ¥32.0 billion, an increase of ¥11.1 billion from¥20.9 billion for the year ended March 31, 2007. The increase is primarily attributable to the improvement ingross profit in ocean vessels and marine project businesses and infrastructure projects businesses. Operatingincome of automotive and machine tools related subsidiaries slightly increased, as increases in their gross profitwas mostly offset by increases in selling, general and administrative expenses and provision for doubtfulreceivables.
Equity in earnings of associated companies for the year ended March 31, 2008 was ¥20.3 billion, a decreaseof ¥1.1 billion from ¥21.4 billion for the year ended March 31, 2007.
• Overseas power producing businesses such as IPM Eagle LLP (United Kingdom) and P.T. PaitonEnergy (Indonesia) reported equity in earnings of ¥4.1 billion in total, a decrease of ¥5.4 billion from¥9.5 billion earnings for the year ended March 31, 2007. The decrease is due to a ¥5.8 billionmark-to-market evaluation losses for the year ended March 31, 2008 which were recorded mainly byIPM Eagle on long-term swap contracts, among others in its Australian power producing operations.
105

• This segment recorded a ¥4.4 billion equity in loss reflecting an other-than-temporary decline in shareprice of ASAHI TEC CORPORATION (Japan)(*1), a manufacturer of ductile iron cast parts andaluminum forged parts.
• The other associated companies reported improved earnings in general, such as the gas distributioncompanies in Brazil and the automotive and construction machinery related businesses.
Net income for the year ended March 31, 2008 was ¥35.0 billion, an increase of ¥1.4 billion from ¥33.6billion for the year ended March 31, 2007. In addition to the above-mentioned factors, for the year endedMarch 31, 2008, this segment recorded:
• gains on sales of aircraft which were previously leased to others at Tombo Aviation, Inc. (UnitedStates)(*2); and
• a ¥8.6 billion loss on the write down of shares in Yamaha Motors Co., Ltd., reflecting an other-than-temporary decline in its market price(*3).
Comparison between the Years Ended March 31, 2007 and 2006
Gross profit for the year ended March 31, 2007 was ¥108.0 billion, an increase of ¥17.4 billion from ¥90.6billion for the year ended March 31, 2006.
• In machinery business fields, improvement in gross profit was primarily attributable to a motorcycleretail finance company, P.T. Bussan Auto Finance, and automotive-related subsidiaries in the Americasand Europe and overseas construction machinery subsidiaries, as well as ocean vessels and marineproject businesses.
• In infrastructure projects business fields, gross profit slightly increased due to expanding operations ofrolling stock leasing subsidiaries in Europe and the Americas, while there were decreases in executedand completed amounts of various overseas construction projects including power plant projects.
Operating income for the year ended March 31, 2007 was ¥20.9 billion, a decrease of ¥0.8 billion from¥21.7 billion for the year ended March 31, 2006. The decrease is primarily attributable to the decrease in grossprofit related to overseas plant project businesses and a new provision for doubtful receivables for an overseascustomer. Operating income of subsidiaries in the machinery business and rolling stock leasing subsidiariesimproved slightly. However, the growth in gross profit was largely offset by the increases in selling, general andadministrative expenses and provision for doubtful receivables especially to automotive related customers.
(*1) Regarding investment in associated companies listed on Japanese and/or overseas stock exchanges, whenwe observe an other-than-temporary decline including the case that its book value exceeds the market value,we recognize a balance between the book value and market value as loss in account title of equity in loss ofassociated companies. The market price of ASAHI TECH Corporation (listed on the first section of theTokyo Stock Exchange) declined significantly from the end of 2006 to the middle of 2007. For the yearended March 31, 2008, we concluded it was an other-than-temporary decline in fair value loss in the accounttitle of equity in earnings/losses of associated companies.
(*2) In the consolidated statements of income, net income of Tombo Aviation, Inc. for the years ended March 31,2008 and 2007 are presented as income from discontinued operations (after income tax effect). However, inthis “Operating Results by Operating Segment”, operating results of the company are presented anddiscussed according to line items of the consolidated statements of income.
(*3) Mitsui’s Management principally recognizes that a 50% or more decline in fair value of a security from costleads to the conclusion that the security has an other-than-temporary impairment. In addition, managementrecognizes an other-than-temporary impairment in case of a 30% or more and less than 50% decline,considering the materiality of declined value. The closing share price of Yamaha Motor Co., Ltd. at the TokyoStock Exchange was ¥1,834 leading to a more than 30% decline from the cost. As of the end of June 2008, itsclosing share price at the Tokyo Stock Exchange was ¥1,987, which was slightly less than a 30% decline.
106

Equity in earnings of associated companies for the year ended March 31, 2007 was ¥21.4 billion, anincrease of ¥6.8 billion from ¥14.6 billion for the year ended March 31, 2006. Equity in earnings of overseaspower producing businesses recorded an increase of ¥3.9 billion from the year ended March 31, 2006, which wasmainly attributable to a strong performance by IPM Eagle LLP including contribution from the Saltend PowerPlant acquired in the third quarter of the year ended March 31, 2006 and P.T. Paiton Energy. In addition, a newlyacquired gas distribution business in Brazil contributed, and overseas associated companies engaged inautomotive related business and construction machinery business performed strongly as well.
Net income for the year ended March 31, 2007 was ¥33.6 billion, an increase of ¥3.0 billion from ¥30.6billion for the year ended March 31, 2006, principally due to the increase in equity in earnings, while partlyoffset by increased interest expense.
Chemical Segment
Billions of Yen
Years Ended March 31, Change(2008–2007)
Change(2007–2006)2008 2007 2006
Gross Profit . . . . . . . . . . . . . . . . . . . . . . . . . . . . . . . . . . . . . . . ¥110.3 ¥103.1 ¥97.8 ¥ 7.2 ¥5.3Operating Income . . . . . . . . . . . . . . . . . . . . . . . . . . . . . . . . . . 46.2 35.3 34.0 10.9 1.3Equity in Earnings of Associated Companies . . . . . . . . . . . . . 5.8 4.9 3.2 0.9 1.7Net Income (Loss) . . . . . . . . . . . . . . . . . . . . . . . . . . . . . . . . . . 18.4 19.3 12.1 (0.9) 7.2
Comparison between the Years Ended March 31, 2008 and 2007
Gross profit for the year ended March 31, 2008 was ¥110.3 billion, an increase of ¥7.2 billion from ¥103.1billion for the year ended March 31, 2007. The principal developments in this segment were as follows:
• Gross profit continued to stay at high levels, reflecting a solid performance mainly in ammonia andmethanol; however, the basic petrochemicals business recorded a decrease in gross profit due to a sharpdecrease in margins following a rapid increase in prices of crude oil and naphtha.
• Gross profit increased at Novus International, Inc. (United States), a feed additive manufacturingsubsidiary, due to improvement in both sales volume and margin. Business expansions of agriculturalchemicals in Europe also contributed to achieving improved gross profit.
• The sulphur business improved its performance, substantially supported by a globally strong demand foragriculture products. Performance of inorganic chemicals and plastics including IT related parts andcomponents remained solid, reflecting a strong demand particularly in Asia.
Operating income for the year ended March 31, 2008 was ¥46.2 billion, an increase of ¥10.9 billion from¥35.3 billion for the year ended March 31, 2007. The improvement was primary attributable to the increase ingross profit, and also to the one-time expense from the increase in provision for doubtful receivables atFertilizantes Mitsui S.A. Industria e Comercio (Brazil) for the year ended March 31, 2007.
Equity in earnings of associated companies for the year ended March 31, 2008 was ¥5.8 billion, an increaseof ¥0.9 billion from ¥4.9 billion for the year ended March 31, 2007.
Net income for the year ended March 31, 2008 was ¥18.4 billion, a decrease of ¥0.9 billion from ¥19.3billion for the year ended March 31, 2007. Besides the above-mentioned improvements for the year endedMarch 31, 2008, this segment recorded the following:
• For the year ended March 31, 2007, this segment recorded a credit to income of ¥3.9 billion as a resultof the reversal of the accrued cost which had been set up based on estimated cost for compensation and
107

other charges related to the DPF incident during past years as a result of completion of the redemptionof the relevant DPFs. For more information, see Note 21, “COMPENSATION AND OTHERCHARGES RELATED TO DPF INCIDENT.”
• This segment recorded a gain on the sale of shares in Toho Titanium Co., Ltd., for the years endedMarch 31, 2008 and March 31, 2007.
• For the year ended March 31, 2008, this segment recorded a ¥4.7 billion loss on the write down ofshares mainly in Kaneka Corporation, reflecting other-than-temporary decline in their market prices.
Comparison between the Years Ended March 31, 2007 and 2006
For the year ended March 31, 2007, gross profit was ¥103.1 billion, an increase of ¥5.3 billion from ¥97.8billion for the year ended March 31, 2006. The principal developments in this segment were as follows:
• In basic petrochemicals fields ranging from basic materials to mid-stream intermediate products, grossprofit slightly decreased in aggregate. This segment experienced decline in profit from olefin businessunder tight supply-demand balance due to significant inflation in material cost, and ammonia businessdue to reduced trading volume, while profit from methanol, styrene and paraxylene businesses increasedsupported by tight market conditions.
• The liquid crystal related module business continued to be robust and so was plastics including ITrelated parts and components, and inorganic mineral and raw materials such as salt, titanium oxide andsulfur, reflecting strong demand of those materials especially in Asia.
• Gross profit increased by ¥4.0 billion at Novus International, Inc., whose profit margin recovered due toimprovement in market prices as well as reduced pressure from raw materials prices coupled withreversal effects of the losses associated with hurricane Katrina, which hit the United States during theyear ended March 31, 2006.
Operating income for the year ended March 31, 2007 was ¥35.3 billion, an increase of ¥1.3 billion from¥34.0 billion for the year ended March 31, 2006. The improvement in gross profit was partly offset by increasesin selling, general and administrative expenses and the provision for doubtful receivables including that ofFertilizantes Mitsui S.A. Industria e Comercio.
Equity in earnings of associated companies for the year ended March 31, 2007 was ¥4.9 billion, an increaseof ¥1.7 billion from ¥3.2 billion for the year ended March 31, 2006, mainly due to the contribution ofInternational Methanol Company (Saudi Arabia), a methanol manufacturer, supported by a favorable marketenvironment.
Net income for the year ended March 31, 2007 was ¥19.3 billion, an increase of ¥7.2 billion from ¥12.1billion for the year ended March 31, 2006. In addition to the increases in operating income and equity in earningsof associated companies, Mitsui recorded a credit to income of ¥3.9 billion as a result of the reversal of theaccrued cost related to the DPF incident during past years as a result of completion of redemption of the relevantDPFs. Mitsui recorded a ¥9.0 billion user response charge for the year ended March 31, 2006.
Energy Segment
Billions of Yen
Years Ended March 31, Change(2008–2007)
Change(2007–2006)2008 2007 2006
Gross Profit . . . . . . . . . . . . . . . . . . . . . . . . . . . . . . . . . . . . . . ¥219.3 ¥123.9 ¥107.0 ¥95.4 ¥16.9Operating Income . . . . . . . . . . . . . . . . . . . . . . . . . . . . . . . . . 172.4 81.3 70.7 91.1 10.6Equity in Earnings of Associated Companies . . . . . . . . . . . . 36.8 44.4 34.6 (7.6) 9.8Net Income . . . . . . . . . . . . . . . . . . . . . . . . . . . . . . . . . . . . . . 124.1 75.7 50.8 48.4 24.9
108

Comparison between the Years Ended March 31, 2008 and 2007
After reaching U.S.$72 per barrel in September 2006, Japan Crude Cocktail (“JCC”) dropped to U.S.$55 perbarrel in February 2007. It then bounced back sharply and reached U.S.$95.4 per barrel in March 2008. Onaverage, crude oil prices continued to rise, reflecting strong demand supported by global expansion, geopoliticaluncertainty surrounding supply from the Middle East and other oil producing regions, and an influx ofspeculative money into the futures markets. Average JCC for the year ended March 31, 2008 was U.S.$78.71 perbarrel compared to U.S.$ 63.50 per barrel for the year ended March 31, 2007. Average JCC for calendar year2007 was U.S.$69.41 compared to U.S.$ 63.94 for calendar year 2006.
We have found that the JCC price trend is generally reflected in the net income of our overseas oil and gasproducing subsidiaries and associated companies in this segment within a zero to 6 month time lag. Consideringthese time lags, Mitsui periodically calculates the weighted average JCC price applied to operating results ofthose oil and gas producing subsidiaries and associated companies for internal reviewing purposes. Suchweighted average JCC prices for internal reviewing purposes for the year ended March 31, 2008 and 2007 wereU.S.$71 per barrel and U.S.$64 per barrel, respectively.
Gross profit for the year ended March 31, 2008 was ¥219.3 billion, a significant increase of ¥95.4 billionfrom ¥123.9 billion for the year ended March 31, 2007 primarily due to the following factors:
• As a result of Mitsui’s acquisition of additional voting shares in Mitsui Oil Exploration Co., Ltd. (Japan)during the 4th quarter of the year ended March 31, 2007, Mitsui Oil Exploration Co., Ltd., formerly anassociated company, became a subsidiary with Mitsui’s 50.3% voting interest (51.03% as of March 31,2008). There was a new contribution to gross profit from Mitsui Oil Exploration Co., Ltd. of ¥58.4billion coming from this acquisition of shares. There were also new contributions of ¥23.9 billion byMitsui E&P Australia Pty Limited (Australia) due to the start of oil production at the Enfield oil field inJuly 2006 as well as the Tui oil filed in July 2007. Moreover, Mittwell Energy Resources Pty. Ltd.(Australia) reported an ¥8.6 billion increase, reflecting increased shipment of condensate and higherprices; and Mitsui E&P Middle East B.V. (Netherlands) operating in Oman reported an increase of ¥5.6billion, reflecting increased prices.
• The price for representative Australian hard coking coal for the year ending March 31, 2008 declined byapproximately 15.5% to U.S.$92 per ton FOB. At the same time soft coking coal prices rose in generalby 9%. For the year ended March 31, 2008, gross profit at Mitsui Coal Holdings Pty. Ltd. (Australia)decreased significantly by ¥11.9 billion, reflecting lower coal prices, appreciation of the Australiandollar against the U.S. dollar, delay of expansion projects and other operational troubles including heavyrainfall. Although the expansion plan in the Dawson mine has been completed, shipments by MitsuiCoal Holdings Pty. Ltd. for the year ended March 31, 2008 were approximately 7.9 million tons, a slightincrease from 6.8 million tons for the year ended March 31, 2007 due to the above-mentioned operationtroubles. As of April 2008, the operational trouble at the Dawson mine had been remedied in generaland it is currently concentrating on stabilizing production.
• There were ¥9.6 billion naphtha trading losses at Mitsui Oil (Asia) Pte. Ltd. (Singapore) for the yearended March 31, 2007.
• In domestic sales operations, Mitsui Liquefied Gas Co., Ltd. (Japan) recorded a ¥3.3 billion increase,reflecting higher sales prices; however, Mitsui Oil Co., Ltd. (Japan) reported a decrease due to reducedmargins related to a sharp increase in crude oil prices.
Operating income for the year ended March 31, 2008 was ¥172.4 billion, an increase of ¥91.1 billion from¥81.3 billion for the year ended March 31, 2007. The increase in gross profit was partly offset by increasedselling, general and administrative expenses, particularly at Mitsui Oil Exploration Co., Ltd..
Equity in earnings of associated companies for the year ended March 31, 2008 was ¥36.8 billion, a decreaseof ¥7.6 billion from ¥44.4 billion for the year ended March 31, 2007. Japan Australia LNG (MIMI) Pty. Ltd.
109

(Australia), which is engaged in natural gas, crude oil and condensate exploration, development and marketing inWestern Australia, recorded a slight increase in earnings. Mitsui Oil Exploration Co., Ltd., as an associatedcompany up to the third quarter of the year ended March 31, 2007, reported ¥8.4 billion equity in earnings for theyear ended March 31, 2007, but has been consolidated for the year ended March 31, 2008.
Net income for the year ended March 31, 2008 was ¥124.1 billion, a significant increase of ¥48.4 billionfrom ¥75.7 billion for the year ended March 31, 2007. Besides the above-mentioned developments, the followingfactors contributed to this increase:
• This segment divested 50% of its shares in Sakhalin Energy Investment Company Ltd. (Bermuda) andrecorded relevant gains on sale of the shares for the year ended March 31, 2008.
• This segment recorded a ¥20.2 billion gain (pre-tax) on the sale of its entire oil and gas producing interestsin Wandoo Petroleum Pty. Ltd. (Mitsui’s profit share 71.7%) for the year ended March 31, 2008(*1).
• Dividends from LNG projects in Abu Dhabi, Qatar and Oman were ¥23.4 billion, a decrease of ¥3.2billion over the year ended March 31, 2007.
• This segment reported an impairment loss on power producing equipment at GTF Green Power Co.,Ltd. (Japan), a domestic power producing operation, for the year ended March 31, 2008.
• Minority interests in earnings of subsidiaries increased by ¥18.9 billion (in expense) related toconsolidation of Mitsui Oil Exploration Co., Ltd. by Mitsui in the fourth quarter of the year endedMarch 31, 2007.
• Mitsui E&P Australia Pty Limited (Australia) recorded a Petroleum Resource Rent tax (“PRRT”) of¥9.5 billion for the year ended March 31, 2008(*2).
Comparison between the Years Ended March 31, 2007 and 2006
For the year ended March 31, 2007, the crude oil market remained volatile with the average price of JCCreaching a high of U.S.$72.06 per barrel in September 2006, and then dropping back to U.S.$55.08 per barrel inFebruary 2007. On average, crude oil prices continued to rise reflecting increased demand along with theexpansion of the global economy, geopolitical uncertainty surrounding supply from the Middle East and other oilproducing regions, and an influx of speculative money into the futures markets. Average JCC for the year endedMarch 31, 2007 rose to U.S.$63.58 per barrel from U.S.$55.80 per barrel for the year ended March 31, 2006.Average JCC for calendar year 2006 was U.S.$64.08 compared to U.S.$51.11 for calendar year 2005.
(*1) In the consolidated statements of income, net income of the assets of Wandoo Petroleum Pty. Ltd. for theyear ended March 31, 2008, 2007 and 2006 is presented as income from discontinued operations (afterincome tax effect).
(*2) PRRT applies to all petroleum projects in Australian offshore areas (or Commonwealth adjacent areas),other than production licenses derived from the North West Shelf exploration permits. (Japan AustraliaLNG (MIMI) Pty. Ltd. participates in the North West Shelf LNG project.) Therefore, Mitsui E&P AustraliaPty Limited, our oil and gas exploration and production subsidiary in Australia, is subject to this tax. PRRTis assessed as follows:
• PRRT is levied on the taxable profits of a petroleum project at a rate of 40%. The taxable profit of aproject is the excess of assessable receipts over operating expenditures; and exploration anddevelopment expenditures. Exploration and development expenditures are deductible on an accrualbasis, including the period when these expenditures are capitalized on the balance sheets.
• All undeducted expenditures are eligible for compounding. The expenditures can be compoundedannually at set rates (Australian long term bond yields and specified spreads), and the compoundedamount is deducted against assessable receipts in future years.
• PRRT is deductible for Australian income tax computation.
110

Mitsui periodically calculates the weighted average JCC price applied to operating results of oil and gasproducing subsidiaries and associated companies for internal reviewing purposes. Such weighted average JCCprices for internal reviewing purposes for the year ended March 31, 2007 and 2006 were U.S.$64 per barrel andU.S.$50 per barrel, respectively.
Gross profit for the year ended March 31, 2007 was ¥123.9 billion, an increase of ¥16.9 billion from ¥107.0billion for the year ended March 31, 2006 primarily due to the following:
• There were new contributions of ¥16.4 billion by Mitsui E&P Australia Pty Limited due to the start-upof oil production at the Enfield oil field in July 2006 and ¥2.1 billion by MitEnergy Upstream LLC(United States) which acquired oil and gas interests in the Gulf of Mexico from Pogo ProducingCompany. Rising crude oil prices resulted in an increase in gross profit of overseas subsidiaries engagedin the development and production of oil and gas, including a ¥5.3 billion increase at Mitsui E&PMiddle East B.V. operating in Oman.
• As a result of Mitsui’s acquisition of additional voting shares in Mitsui Oil Exploration Co., Ltd. duringthe fourth quarter of this fiscal year, it became a subsidiary in which Mitsui has a 50.3% voting interest.There was a new ¥15.1 billion contribution from Mitsui Oil Exploration Co., Ltd.
• In November 2006, it was found that one of the traders at Mitsui Oil (Asia) Pte. Ltd. (Singapore) hadincurred, but concealed by deceptively reporting, significant unrealized losses on physical and futuretrading of naphtha. Primarily because accumulated losses realized through orderly liquidation of therelevant transactions amounted to ¥9.6 billion, gross profit at Mitsui Oil (Asia) Pte. Ltd. declined by¥10.1 billion from the year ended March 31, 2006. Total contribution of oil products trading in thissegment, with the exception of Mitsui Oil (Asia) Pte. Ltd., for the year ended March 31, 2007 wasalmost at the same level as the year ended March 31, 2006.
• Mitsui Oil Co., Ltd. recorded an increase of ¥3.0 billion due to its success in raising the sales prices ofproducts and subsequent decline in costs reflecting the fall in crude oil prices after summer 2006. On theother hand, Mitsui Liquefied Gas Co., Ltd. (Japan) recorded decreases in gross profit of ¥2.2 billionaffected by reduced margin of its products.
• The price for representative Australian metallurgical coal for the year ending March 31, 2007 decreasedby approximately 10%. In addition, pressure from surging material and fuel costs resulted in an ¥11.0billion decline in gross profit at Mitsui Coal Holdings Pty. Ltd. from the year ended March 31, 2006.Prices for representative Australian metallurgical coal declined to U.S.$110 per ton/FOB for the yearended March 31, 2007 from U.S.$125 per ton/FOB for the year ended March 31, 2006. Shipments byMitsui Coal Holdings Pty. Ltd. increased to 6.7 million tons for the year ended March 31, 2007 from5.9 million tons for the year ended March 31, 2006 due to improvement of a delay in stripping workcaused by a labor and material shortage.
Operating income for the year ended March 31, 2007 was ¥81.3 billion, an increase of ¥10.6 billion from¥70.7 billion for the year ended March 31, 2006. The increase in gross profit was partly offset by a provision fordoubtful receivables for an overseas oil exploration company.
Reflecting higher crude oil prices, equity in earnings of associated companies for the year ended March 31,2007 was ¥44.4 billion, an increase of ¥9.8 billion from ¥34.6 billion for the year ended March 31, 2006. Theincrease was mainly attributable to Japan Australia LNG (MIMI) Pty. Ltd., which is involved in natural gas,crude oil and condensate exploration, development and marketing in Western Australia. In addition, Mitsui OilExploration Co., Ltd. recorded earnings of ¥8.4 billion, an increase of ¥2.5 billion from the year ended March 31,2006, despite being classified as an associated company for only nine months up to the third quarter for this fiscalyear.
111

Net income for the year ended March 31, 2007 was ¥75.7 billion, a significant increase of ¥24.9 billion from¥50.8 billion for the year ended March 31, 2006. Other than the increases in operating income and equity inearnings, there were the following factors:
• Interest expense related to the Sakhalin II project increased by ¥9.0 billion as a result of an increase ininterest bearing debt which was used to fund the increasing investments in Sakhalin Energy InvestmentCompany Ltd. and an increase in the U.S. dollar interest rates.
• Dividends from LNG projects in Abu Dhabi, Qatar and Oman were ¥26.6 billion, an increase of ¥13.2billion over the year ended March 31, 2006.
• This segment significantly increased repatriation of undistributed earnings from overseas subsidiariesand associated companies for the year ended March 31, 2006. The increased dividends received fromthose overseas entities resulted in a significant increase in Japanese income tax expenses in this segmentfor the year ended March 31, 2006.
Short- and Long-Term Outlook on Prices and Supply-Demand Balance for oil and gas, and Our EquityProduction
Short-Term Pricing and Supply-Demand Balance
A survey conducted by the International Energy Agency (May 2008) indicated that world crude oil demandin 2007 was 85.7 million barrels per day, with an estimated demand for 2008 of 86.8 million barrels per day. Asof May 2008, general observations on short-term supply-demand balance of crude oil by agencies andcorporations in this industry suggest that:
• In the latter half of the year ended March 31, 2008, there were considerable inflows of money intocommodity markets, reflecting U.S. dollar depreciation led by a credit crunch and the FRB’s policyinterest rate cuts, which resulted in continued run-up of crude oil price. The United States and otherleading industrialized countries repeatedly called to Organization of the Petroleum Exporting Countries(“OPEC”) for production increases. However, OPEC has been inclined to maintain its officialproduction ceilings, concerned about a drop in demand related to potential economic slowdown.
• Recently, pricing in the crude oil market has been strongly influenced by the financial sector. Crude oilprice is more influenced than before by the market participants’ trading behaviors and theircircumstances, such as position closing before and after holidays and fund management, particularlytowards the fiscal year end, as well as the continuously significant factors of supply-demand balance,geopolitical uncertainties, accidental events such as hurricane damage and troubles at refineries andother oil related facilities.
Our production amount for the year ended March 31, 2008 was 55 million barrels, an increase of 3 millionbarrels from the year ended March 31, 2007 (gas is converted to barrels of oil at the ratio of 5,800 cubic feet ofnatural gas to 1 barrel of crude oil), as presented in Table 4, Proved Reserve Quantity Information ofSupplemental Information on Oil and Gas Producing Activities (Unaudited). We expect that our productionamount for the year ending March 31, 2009 will be almost the same level as the year ended March 31, 2008 orwill increase slightly, considering contributions from the Vincent oil field project (located adjacent to the Enfieldoil field) which is planned to start up production by September 2008 and the Tui crude oil field (New Zealand)which commenced production in July 2007, while a work over program at the Enfield oil field will partly offsetthose increasing factors. For further information about the work over program, refer to “Item 4.B. BusinessOverview—Energy Segment”.
The commercial production from the Enfield Oil Field started in July 2006. In October 2006, one of themajor production wells was shut-in due to unexpected sand production and early water breakthrough. Weconducted drilling of additional wells and work-over of existing wells, which returned to production inSeptember 2007. Following the completion of the work-over, the average production rate during 2007 was
112

approximately 47,000 barrels per day. However, due to sand production at two other major oil wells observedsince December 2007, the average production rate during the first quarter of 2008 was below 29,000 barrels perday. The joint venture was conducting work-over of those wells as of June 2008.
For the year ending March 31, 2009, a change of U.S.$1 per barrel in crude oil prices is expected to have aneffect of ¥2.0 billion on net income as a result of changes in revenues of our oil and gas related subsidiaries andassociated companies. Similar to the discussion regarding iron and steel raw materials, actual results ofoperations are also influenced by production costs, trends in foreign exchange rates and other factors surroundingthose subsidiaries and associated companies.
Middle- and Long-Term Price Outlook and Supply-Demand Balance and Trends in Our Equity Production
The middle- and long-term trends in supply-demand balance and prices of crude oil are subject to far greaterlevels of uncertainty than trends in the short-term, and it is therefore difficult for management to make adefinitive forecast. On the other hand, with respect to LNG, we are focusing on the changes in market structurethat are currently taking place, and acting accordingly as follows:
• In the past, the market has grown supported mainly by long-term purchase contracts by power and gascompanies operating in Japan and the Far East. Expansion of incumbent projects and green fieldprojects coming on stream will increase the volume of supply to the market, while demand, which hastraditionally centered around the Far East, will be joined by growing demand from Europe and theUnited States, while huge markets in China and India will emerge. Therefore, globalization both interms of supply-demand is expected to progress. In addition, as the opportunity for supply-demandadjustments in these markets increases, LNG is expected to become a more marketable commodity.
• Long-term purchase contracts with Japanese companies in many projects are expected to come due forrenewal around 2010, and more flexible terms reflecting the above-mentioned supply-demand balancetrends will be requested from the buyers. In evaluating the opportunities for the expansion of incumbentprojects or participation in green field projects, we are putting an emphasis on securing stable supply aswell as diversifying our source of supply to enhance flexibility.
Short- and Long-Term Outlook on Prices and Supply-Demand Balance for coal, and Our EquityProduction
Short-Term Pricing and Supply-Demand Balance
The same as the iron ore business, coal (metallurgical coal) production joint venture businesses in Australiaand other regions in which we participate with major overseas mineral resources companies conclude supplycontracts with Japanese steel manufacturers and major clients in other countries every year. Based on suchcontracts, sales prices are reviewed and renegotiated each fiscal year. For the year ending March 31, 2009, theannual prices of coal have risen sharply due to strong demand by emerging countries, especially China. (Unitprices for coal from each mine in production also reflect the difference of respective grades and types.)
Up to the date of this annual report, we have observed that an indicative price for representative Australianpremium hard coking coal, a type of metallurgical coal, rose to around U.S.$300 per ton/FOB for the year endingMarch 31, 2009. Generally, metallurgical coal prices rose approximately 200% from the year ended March 31,2008. Also, some contracts indicate that the price for thermal coal rose to around U.S.$125 per ton /FOB for theyear ending March 31, 2009. At the same time, in general, thermal coal prices have risen approximately 100% upfrom the year ended March 31, 2008.
Fluctuations in iron ore prices directly affect revenues from the equity-based production at our coalsubsidiaries and associated companies. For the year ending March 31, 2009, we calculate that an estimatedimpact on net income from a change of U.S.$1 per ton in coal price would be approximately ¥0.6 billion.
113

For the year ended March 31, 2008, the equity-based shipments of our overseas subsidiaries and associatedcompanies amounted to approximately 8 million tons of coal. For the year ending March 31, 2009, we expect thatthe equity-based shipments of our overseas subsidiaries and associated companies will amount to approximately9 million tons of coal. The above is calculated based on the assumptions of an estimated increase in production inline with our holdings after the year ended March 31, 2008, and a specific range of foreign exchange rates for theJapanese yen, the U.S. dollar and the Australian dollar.
With respect to coal mining joint ventures promoted with the Anglo American group, expansion work on theDawson complex was completed by the year ended March 31, 2008, aiming to boost annual coal production fromthe present capacity of 6.5 million tons per annum to 12.7 million tons. We operate the mine putting priority onestablishing stable production capability and reaching planned production capacity within the year endingMarch 31, 2009.
Efforts are being undertaken at each mine to expand production and shipments, but production costs areincreasing amid a global trend of rising material and equipment costs as well as utility costs. The Australiandollar appreciation against the U.S. dollar may have a negative impact on the revenues of our coal miningsubsidiaries and associated companies.
Middle- and Long-Term Price Outlook and Supply-Demand Balance and Trends in Our Equity Production
In order to respond to tightening supply-demand balance, major coal producers are investing to increaseproduction capacity. With respect to coal mining joint ventures with the Rio Tinto group, we approved thedevelopment of the new mining area owned by Kestrel Joint Venture in Queensland, Australia. This project willextend the operation period of Kestrel Joint Venture by developing the new mining area, as the existing miningareas are expected to be exhausted in 2014. Construction of this project will start within 2008 upon obtaining thegovernment’s approvals. The operation is expected to commence in 2012. The project estimates a maximum6.5 million tons per annum coal production and 20-year operation.
Including those we are participating in, most of the coal mining projects have plans for expanding theirproduction capacity. As there are too many uncertainties, including demand from China and other emergingcountries, it is difficult for our management to draw up definitive forecasts on supply-demand balance and pricesat this point in time.
Foods & Retail Segment
Billions of Yen
Years Ended March 31, Change(2008–2007)
Change(2007–2006)2008 2007 2006
Gross Profit . . . . . . . . . . . . . . . . . . . . . . . . . . . . . . . . . . . . . . . . ¥81.2 ¥ 81.3 ¥79.9 ¥ (0.1) ¥ 1.4Operating Income . . . . . . . . . . . . . . . . . . . . . . . . . . . . . . . . . . . 16.6 10.9 9.2 5.7 1.7Equity in Earnings of Associated Companies . . . . . . . . . . . . . . 3.1 3.8 3.5 (0.7) 0.3Net Income (Loss) . . . . . . . . . . . . . . . . . . . . . . . . . . . . . . . . . . . 10.5 (12.3) (3.2) 22.8 (9.1)
Comparison between the Years Ended March 31, 2008 and 2007
Gross profit for the year ended March 31, 2008 was ¥81.2 billion, a decrease of ¥0.1 billion from ¥81.3billion for the year ended March 31, 2007. Food raw material business transactions showed solid performance,partly reflecting a run-up in prices. At the same time, this segment has been taking various cost reductioninitiatives in the competitive, domestic food distribution and retail operations.
• In October 2007, this business unit transferred 70% of its shares of Hokushuren Co., Ltd. (Japan),formerly a foods and liquor wholesale subsidiary, to KOKUBU, an unrelated entity, following thetransfer of MITSUI FOODS CO., LTD.’s business in the Hokkaido area (excluding Seven & i Holdings
114

Co., Ltd.-related businesses) to Hokushuren Co., Ltd. As a result, gross profit of Hokushuren CompanyLimited decreased by ¥2.9 billion. Gross profit of MITSUI FOODS CO., LTD. decreased by ¥1.1billion, primarily reflecting the reorganization of domestic distribution centers and exiting fromunprofitable businesses.
• There was an increased gross profit in the feed grain businesses, mainly in corn due to increased pricesand trading transactions for the year ended March 31, 2008.
• Gross profit of Mitsui Norin Co., Ltd. (Japan) decreased slightly by ¥0.1 billion due to fiercecompetition mainly in the tea leaves business and rising material costs.
Operating income for the year ended March 31, 2008 was ¥16.6 billion, an increase of ¥5.7 billion from¥10.9 billion for the year ended March 31, 2007. MITSUI FOODS CO., LTD. and Mitsui Norin Co., Ltd.succeeded in decreasing general, selling and administrative expenses, which resulted in a substantialimprovement in their operating income, although their gross profit declined marginally due to less salestransactions as a result of exiting from unprofitable businesses.
Equity in earnings of associated companies for the year ended March 31, 2008 was ¥3.1 billion, a ¥0.7billion decrease from ¥3.8 billion for the year ended March 31, 2007.
Net income for the year ended March 31, 2008 was ¥10.5 billion, a significant improvement of ¥22.8 billionfrom ¥12.3 billion net loss for the year ended March 31, 2007. In addition to the above-mentioned development,major factors were as follows:
• For the year ended March 31, 2007, Mitsui Norin Co., Ltd. recorded impairment losses on intangibleassets and goodwill of ¥12.1 billion and ¥16.5 billion, respectively, and moreover established avaluation allowance for deferred tax assets. At the same time, a ¥8.3 billion minority interest in incomefrom these losses was also recorded. For the year ended March 31, 2008, its operating results recoveredto a marginally positive amount of income and zero minority interest is recorded.
• For the year ended March 31, 2008, Mitsui recognized a ¥4.5 billion loss on the write-down of theshares of Seven & i Holdings Co., Ltd., following a decline in its share price.
The major component of impairment losses for the year ended March 31, 2007 was a loss on intangibleassets at Mitsui Norin Co., Ltd. (Japan) due to deterioration of operating environment, such as intensifyingcompetition in both beverage and beverage materials. Mitsui Norin Co., Ltd. used a discounted cash flow methodbased on its internal budget for evaluation of fair value of the intangible assets, and used its weighted averagecapital cost for the discount rate in evaluating fair values of intangible assets. Following recognition of theimpairment losses (including the loss on its goodwill), the book values of fixed assets and intangible assets as ofMarch 31, 2008 and 2007 were ¥9.5 billion and ¥10.0 billion, respectively. While there may be fluctuations fromfuture developments in the market management expects that Mitsui Norin Co., Ltd. will continue to recordpositive, but not substantial, net income considering its market and its competitive position in the beverageindustry. Mitsui Norin Co., Ltd. recorded net income of ¥0.3 billion for the year ended March 31, 2008, amarginal income but reasonable level considering strict business conditions. Management also believes that theestimation and assumption for this impairment loss has been specific to Mitsui Norin Co., Ltd., and does notexpect such estimation and assumption to have a material impact on our future consolidated operating resultsexcluding Mitsui Norin Co., Ltd. For more information, see “Critical Accounting Policies and Estimates.”
Comparison between the Years Ended March 31, 2007 and 2006
Gross profit for the year ended March 31, 2007 was ¥81.3 billion, an increase of ¥1.4 billion from ¥79.9billion for the year ended March 31, 2006. The major factors were as follows:
• Gross profit of MITSUI FOODS CO., LTD. decreased by ¥1.1 billion, primarily reflecting thetermination of business relations with The Daiei, Inc, a Japanese national retailer.
115

• Gross profit of Mitsui Norin Co., Ltd. decreased by ¥2.9 billion due to poor performance in beverageand beverage materials businesses and divestiture of non-core businesses.
• Gross profit of Hokushuren Company Limited increased by ¥3.1 billion. There was a full yearcontribution from Hokushuren Company Limited which was acquired in the second quarter of the yearended March 31, 2006.
Operating income for the year ended March 31, 2007 was ¥10.9 billion, an increase of ¥1.7 billion from¥9.2 billion for the year ended March 31, 2006. In addition to improvement in gross profit, there was a reductionin selling, general and administrative expenses. Among others, a ¥3.2 billion reduction was reported by MITSUIFOODS CO., LTD. reflecting decreased personnel expenses and depreciation costs.
Equity in earnings of associated companies for the year ended March 31, 2007 was ¥3.8 billion, a ¥0.3billion increase from ¥3.5 billion for the year ended March 31, 2006.
The segment recorded net loss of ¥12.3 billion for the year ended March 31, 2007, a ¥9.1 billiondeterioration from ¥3.2 billion net loss for the year ended March 31, 2006. The decline for the year endedMarch 31, 2007 was attributable to the following factors:
• Mitsui Norin Co., Ltd. recorded impairment losses on intangible assets and goodwill of ¥12.1 billionand ¥16.5 billion, respectively, and moreover established valuation allowance for deferred tax assets. Atthe same time, an ¥8.3 billion minority interest in these losses was also recorded.
• For the year ended March 31, 2006, MITSUI FOODS CO., LTD. recorded ¥6.0 billion impairmentlosses on land and distribution facilities which became idle as a result of the reorganization ofdistribution bases. For the year ended March 31, 2007, it reported further ¥2.2 billion impairment lossesof long-lived assets and ¥1.4 billion other expenses incurred from its business reorganization. Inaddition Hokushuren Company Limited reported the sum of ¥1.4 billion impairment loss of long-livedassets and other expenses.
Consumer Service & IT Segment
Billions of Yen
Years Ended March 31, Change(2008–2007)
Change(2007–2006)2008 2007 2006
Gross Profit . . . . . . . . . . . . . . . . . . . . . . . . . . . . . . . . . . . . . . ¥116.7 ¥130.0 ¥128.4 ¥(13.3) ¥ 1.6Operating Income . . . . . . . . . . . . . . . . . . . . . . . . . . . . . . . . . 18.9 20.3 25.0 (1.4) (4.7)Equity in Earnings (Losses) of Associated Companies . . . . 8.2 8.7 3.5 (0.5) 5.2Net Income . . . . . . . . . . . . . . . . . . . . . . . . . . . . . . . . . . . . . . 12.0 16.6 17.5 (4.6) (0.9)
Comparison between the Years Ended March 31, 2008 and 2007
Gross profit for the year ended March 31, 2008 was ¥116.7 billion, a decrease of ¥13.3 billion from ¥130.0billion for the year ended March 31, 2007. The primary cause of the decrease is related to business reorganizationincluding withdrawals from or divestitures of existing businesses; for example, the housing business of MitsuiBussan House-Techno, Inc. (Japan)(*), Mitsui Bussan Forestry Co., Ltd. (Japan), two cable television providersand certain textile and general merchandise businesses. In addition, IT related businesses mainly in the systemintegration sector reported a marginal decline, while real estate businesses in Japan and Europe showed steadyperformance.
(*) In the consolidated statements of income, net income of Mitsui Bussan House-Techno, Inc. (Japan) for theyears ended March 31, 2008 and 2007 is presented as income from discontinued operations (after incometax effect). However, in this “Operating Results by Operating Segment”, operating results of the companyare presented and discussed according to line items of the consolidated statements of income.
116

Operating income for the year ended March 31, 2008 was ¥18.9 billion, a decrease of ¥1.4 billion from¥20.3 billion for the year ended March 31, 2007. The improvements in selling, general and administrativeexpenses, primarily at Mitsui Bussan House-Techno, Inc. offset most of the decline in gross profit.
Equity in earnings of associated companies for the year ended March 31, 2008 was ¥8.2 billion, a decreaseof ¥0.5 billion from ¥8.7 billion for the year ended March 31, 2007.
Net income for the year ended March 31, 2008 was ¥12.0 billion, a decrease of ¥4.6 billion from ¥16.6 billionfor the year ended March 31, 2007. Major reasons other than the above-mentioned factors were as follows:
• For the year ended March 31, 2007, Mitsui Bussan House-Techno, Inc., which discontinued housingbusiness during the year ended March 31, 2007, recorded estimated costs of ¥5.3 billion to meet futurerequirements for product warranties and maintenance services. At the same time, it recorded a reversalof the valuation allowance for deferred tax assets on its retained loss.
• For the year ended March 31, 2008, there were gains on sales of shares of Jupiter TelecommunicationsCo., Ltd. of ¥1.8 billion and those of two cable television providers of ¥2.8 billion. In addition, inconjunction with the merger of NextCom K.K. and Mitsui Knowledge Industry Co., Ltd., this segmentrecorded a ¥2.5 billion gain from the exchange of shares of these subsidiaries with minority interests.For the year ended March 31, 2007, this segment recorded a ¥4.5 billion gain on the sale of shares inTelepark Corp. (Japan).
Comparison between the Years Ended March 31, 2007 and 2006
Gross profit for the year ended March 31, 2007 was ¥130.0 billion, an increase of ¥1.6 billion from ¥128.4billion for the year ended March 31, 2006. In the lifestyle business fields, the brand apparel business showeddisappointing results. On the other hand, in consumer service business fields, gross profit increased in theoverseas real estate businesses. In IT related business fields, gross profit slightly increased mainly due to increaseof mobile phone sales at Telepark Corp. and expansion of outsourcing business at J-SCube INC (Japan).
Operating income for the year ended March 31, 2007 was ¥20.3 billion, a decrease of ¥4.7 billion from¥25.0 billion for the year ended March 31, 2006. The improvement in gross profit was outweighed by increasesin selling, general and administrative expenses primarily at IT related business operations.
Equity in earnings of associated companies for the year ended March 31, 2007 was ¥8.7 billion, an increaseof ¥5.2 billion from ¥3.5 billion for the year ended March 31, 2006. A television shopping service company,QVC JAPAN, INC. (Japan), continued solid performance and a mobile phone sales company, BrightstarLogistics Pty. (Australia), also contributed to this improvement.
Net income for the year ended March 31, 2007 was ¥16.6 billion, a decrease of ¥0.9 billion from ¥17.5 billionfor the year ended March 31, 2006. Major reasons other than the above-mentioned factors were as follows:
• Mitsui Bussan House-Techno, Inc., which discontinued housing business during the year endedMarch 31, 2007, recorded estimated costs of ¥5.3 billion to meet future requirement for productwarranties and maintenance services. At the same time, it recorded reversal of valuation allowance fordeferred tax assets on its retained loss.
• There was a ¥6.1 billion reduction in gain on sales of securities. For the year ended March 31, 2006,there were gains on sales of shares in Metro PCS, Inc. in the United States, KDDI CORPORATION inJapan and PT Excelcomindo Pratama, Tbk in Indonesia amounting to ¥3.5 billion, ¥3.3 billion and ¥2.0billion, respectively. For the year ended March 31, 2007, this segment recorded a ¥4.5 billion gain onthe sale of shares in Telepark Corp.
• For the year ended March 31, 2006, Mitsui received a ¥2.0 billion dividend from an investmentcompany related to gains on the sales of interests in telecommunication companies in Africa.
117

Logistics & Financial Markets Segment
Billions of Yen
Years Ended March 31, Change(2008–2007)
Change(2007–2006)2008 2007 2006
Gross Profit . . . . . . . . . . . . . . . . . . . . . . . . . . . . . . . . . . . . . . . . . ¥55.1 ¥60.5 ¥51.4 ¥(5.4) ¥ 9.1Operating Income . . . . . . . . . . . . . . . . . . . . . . . . . . . . . . . . . . . . 20.9 24.2 17.6 (3.3) 6.6Equity in Earnings of Associated Companies . . . . . . . . . . . . . . . (1.8) 2.0 3.9 (3.8) (1.9)Net Income . . . . . . . . . . . . . . . . . . . . . . . . . . . . . . . . . . . . . . . . . 7.5 14.6 13.4 (7.1) 1.2
Comparison between the Years Ended March 31, 2008 and 2007
Gross profit was ¥55.1 billion, a decrease of ¥5.4 billion from ¥60.5 billion for the year ended March 31,2007. Gross profit decreased at Mitsui & Co. Energy Risk Management Ltd. (United Kingdom), reflecting lowertrading margins due to a significant reduction of volatility in the market. In addition, divestiture of Mitsui BussanFutures Ltd. (Japan) resulted in further deterioration of gross profit.
Reflecting the decrease in gross profit, operating income for the year ended March 31, 2008 decreased to¥20.9 billion, a decrease of ¥3.3 billion from ¥24.2 billion for the year ended March 31, 2007.
For the year ended March 31, 2008, this segment reported a ¥1.8 billion equity in net losses of associatedcompanies, a ¥3.8 billion deterioration from ¥2.0 billion in earnings for the year ended March 31, 2007. Thedecline was attributable to the loss on investment in ASAHI TEC Corporation (Japan) jointly held with theMachinery & Infrastructure Project Segment, and investment in the partnership NPF-Harmony (Japan). MitsuiLeasing & Development, Ltd. (Japan) reported a decline caused from increased provision for doubtfulreceivables.
Accordingly, net income for the year ended March 31, 2008 was ¥7.5 billion, a decrease of ¥7.1 billion from¥14.6 billion for the year ended March 31, 2007. In addition to the above-mentioned negative factors, thissegment recorded a ¥4.5 billion loss on the write-down on shares of Central Finance Co., Ltd. for the year endedMarch 31, 2008 while it recorded a ¥4.4 billion increase in gains on sales of securities including QuintilesTransnational Corp. (United States) for ¥3.8 billion and BALtrans Holdings Limited (Hong Kong) for ¥3.2billion.
Comparison between the Years Ended March 31, 2007 and 2006
For the year ended March 31, 2007, gross profit was ¥60.5 billion, an increase of ¥9.1 billion from ¥51.4billion for the year ended March 31, 2006. Mitsui, Mitsui Bussan Commodities Ltd. (United Kingdom) andMitsui & Co. Energy Risk Management Ltd. showed strong performance seizing opportunities under volatilemarket conditions. Furthermore there was a new contribution from a newly acquired domestic warehouse subsidiaryfor the year ended March 31, 2007.
Operating income for the year ended March 31, 2007 was ¥24.2 billion, an increase of ¥6.6 billion from¥17.6 billion for the year ended March 31, 2006. The above-mentioned increase in gross profit was partly offsetby increased selling, general and administrative expenses mainly at logistics related operations.
Equity in earnings of associated companies for the year ended March 31, 2007 was ¥2.0 billion, a ¥1.9billion decrease from ¥3.9 billion for the year ended March 31, 2006. The equity in earnings consists ofmiscellaneous small amounts.
There was a loss on write-down of securities for the year ended March 31, 2007. As a result, net income forthe year ended March 31, 2007 was ¥14.6 billion, an increase of only ¥1.2 billion from ¥13.4 billion.
118

Americas Segment
Billions of Yen
Years Ended March 31, Change(2008–2007)
Change(2007–2006)2008 2007 2006
Gross Profit . . . . . . . . . . . . . . . . . . . . . . . . . . . . . . . . . . . . . . . . . ¥54.0 ¥64.7 ¥61.6 ¥(10.7) ¥ 3.1Operating Income . . . . . . . . . . . . . . . . . . . . . . . . . . . . . . . . . . . . 2.0 21.4 21.7 (19.4) (0.3)Equity in Earnings of Associated Companies . . . . . . . . . . . . . . . 5.0 3.8 2.1 1.2 1.7Net Income . . . . . . . . . . . . . . . . . . . . . . . . . . . . . . . . . . . . . . . . . 4.3 16.9 12.7 (12.6) 4.2
Comparison between the Years Ended March 31, 2008 and 2007
Gross profit for the year ended March 31, 2008 was ¥54.0 billion, a decrease of ¥10.7 billion from ¥64.7billion for the year ended March 31, 2007.
• For the year ended March 31, 2008, MBK Real Estate LLC. (United States), which engages in thedevelopment and sale of residential homes in the West Coast market, recorded both decreased sales anda ¥9.6 billion loss on the write-down of inventories based on the discount cash flow method applyingthe latest market values reflecting directly as a result of the deterioration in the residential market. Afterthe write-down, the book value of inventories at MBK Real Estate LLC. was reduced to approximately¥20.4 billion.
• Westport Petroleum Inc. (United States) reported a ¥11.7 billion decrease in earnings due to a negativereversal effect from the high performance in oil product trading for the year ended March 31, 2007.
• Steel products businesses at the former Mitsui Steel Holdings, Inc. (United States) and other subsidiariesrecorded a ¥3.8 billion decline due to a decreased margin from oil well tubular and other steel products.
• Mitsui & Co. (U.S.A.), Inc. also recorded a ¥4.0 billion decline, reflecting an overall slowdown in theUnited States economy.
• There were contributions from newly acquired subsidiaries, particularly Steel Technologies, Inc.(United States) of ¥6.1 billion for the year ended March 31, 2008. Newly acquired SunWizeTechnologies, Inc. (United States) also contributed to the increase.
This segment recorded a ¥2.0 billion operating income for the year ended March 31, 2008, a deterioration of¥19.4 billion from ¥21.4 billion for the year ended March 31, 2007. Steel products subsidiaries and WestportPetroleum Inc. recorded decreases in selling, general and administrative expenses, which partly offsetdeterioration in gross profit. The contributions to gross profit from newly acquired subsidiaries were mostlyoffset by their selling, general and administrative expenses.
Equity in earnings of associated companies for the year ended March 31, 2008 was ¥5.0 billion, a ¥1.2billion increase from ¥3.8 billion for the year ended March 31, 2007 led by United Harvest, LLC (United States)which enjoyed strong performance from the wheat export operation facility business.
Net income for the year ended March 31, 2008 was ¥4.3 billion, a significant decrease of ¥12.6 billion from¥16.9 billion for the year ended March 31, 2007. In addition to the above-mentioned, there were the followingfactors:
• Interest expenses increased by ¥5.6 billion at Mitsui & Co. (U.S.A.), Inc. and its subsidiaries, resultingfrom increased interest bearing debt.
• For the year ended March 31, 2007, there were ¥3.7 billion in gains on sales of warehouses and realestate by Tri-Net Logistics Management, Inc. (United States) and a chemical subsidiary, Nst, Inc.(United States).
119

Comparison between the Years Ended March 31, 2007 and 2006
Gross profit for the year ended March 31, 2007 was ¥64.7 billion, an increase of ¥3.1 billion from ¥61.6billion for the year ended March 31, 2006. An oil products trading subsidiary, Westport Petroleum, Inc., recordedan increase of ¥4.3 billion while Portac, Inc. (United States), a lumber and lumber products producing subsidiary,recorded a ¥1.1 billion decrease.
Operating income for the year ended March 31, 2007 was ¥21.4 billion, a decrease of ¥0.3 billion from¥21.7 billion for the year ended March 31, 2006, reflecting increased selling, general and administrative expensesincluding higher trader bonuses at Westport Petroleum, Inc. and an increase in provision for doubtful receivables.
Equity in earnings of associated companies for the year ended March 31, 2007 was ¥3.8 billion, a ¥1.7billion increase from ¥2.1 billion for the year ended March 31, 2006.
Net income for the year ended March 31, 2007 was ¥16.9 billion, an increase of ¥4.2 billion from ¥12.7billion for the year ended March 31, 2006. The major factors other than above are as below:
• For the year ended March 31, 2007, there was a ¥3.7 billion gain on sales of warehouse and lands byTri-Net Logistics Management, Inc. and a chemical subsidiary, Nst, Inc..
• Interest expenses increased by ¥4.8 billion at Mitsui & Co. (U.S.A.), Inc. and its subsidiaries resultingfrom a rise in U.S. dollar interest rates.
• Mitsui & Co. (U.S.A.), Inc. had a 20% minority interest in Mitalco Inc. (United States) and shared thenet losses of the subsidiary for the year ended March 31, 2006 with the Mineral& Metal ResourcesSegment which held 80% interest.
Europe, the Middle East and Africa Segment
Billions of Yen
Years Ended March 31, Change(2008–2007)
Change(2007–2006)2008 2007 2006
Gross Profit . . . . . . . . . . . . . . . . . . . . . . . . . . . . . . . . . . . . . . . . . ¥26.8 ¥25.4 ¥24.3 ¥ 1.4 ¥ 1.1Operating Income . . . . . . . . . . . . . . . . . . . . . . . . . . . . . . . . . . . . 1.8 3.0 4.7 (1.2) (1.7)Equity in Earnings (Losses) of Associated Companies . . . . . . . 0.3 0.3 (0.2) 0.0 0.5Net Income . . . . . . . . . . . . . . . . . . . . . . . . . . . . . . . . . . . . . . . . . 5.0 4.1 5.0 0.9 (0.9)
Comparison between the Years Ended March 31, 2008 and 2007
Gross profit for the year ended March 31, 2008 was ¥26.8 billion, an increase of ¥1.4 billion from ¥25.4billion for the year ended March 31, 2007, reflecting solid performance of the energy, machinery andinfrastructure project businesses in this segment.
Operating income for the year ended March 31, 2008 was ¥1.8 billion, a ¥1.2 billion decline from ¥3.0billion for the year ended March 31, 2007, reflecting increased selling, general and administrative expenses,mainly in personnel expenses.
Net income for the year ended March 31, 2008 was ¥5.0 billion, an increase of ¥0.9 billion from ¥4.1 billionfor the year ended March 31, 2007. Increases in the segment’s minority interest in subsidiaries in the fields ofautomotive business and real estate contributed to this improvement.
Comparison between the Years Ended March 31, 2007 and 2006
Gross profit for the year ended March 31, 2007 was ¥25.4 billion, an increase of ¥1.1 billion from ¥24.3billion for the year ended March 31, 2006, reflecting good performance of organic chemicals businesses.
120

Operating income for the year ended March 31, 2007 was ¥3.0 billion, a ¥1.7 billion decrease from ¥4.7billion for the year ended March 31, 2006, reflecting an increase mainly in personnel expenses.
Net income for the year ended March 31, 2007 was ¥4.1 billion, a decrease of ¥0.9 billion from ¥5.0 billionfor the year ended March 31, 2006.
Asia Pacific Segment
Billions of Yen
Years Ended March 31, Change(2008–2007)
Change(2007–2006)2008 2007 2006
Gross Profit . . . . . . . . . . . . . . . . . . . . . . . . . . . . . . . . . . . . . . . . . ¥33.1 ¥30.7 ¥30.4 ¥ 2.4 ¥ 0.3Operating Income . . . . . . . . . . . . . . . . . . . . . . . . . . . . . . . . . . . . 7.6 9.5 11.2 (1.9) (1.7)Equity in Earnings of Associated Companies . . . . . . . . . . . . . . . 1.1 0.7 0.8 0.4 (0.1)Net Income . . . . . . . . . . . . . . . . . . . . . . . . . . . . . . . . . . . . . . . . . 22.5 22.0 22.8 0.5 (0.8)
Comparison between the Years Ended March 31, 2008 and 2007
Gross profit for the year ended March 31, 2008 was ¥33.1 billion, an increase of ¥2.4 billion from ¥30.7billion for the year ended March 31, 2007. Steel products and chemicals exhibited strong performance.
Operating income for the year ended March 31, 2008 was ¥7.6 billion, a decrease of ¥1.9 billion from ¥9.5billion for the year ended March 31, 2007. This decrease reflects increases in personnel expenses.
Net income for the year ended March 31, 2008 was ¥22.5 billion, an increase of ¥0.5 billion from ¥22.0billion for the year ended March 31, 2007. Income related to minority interests held by this segment in MitsuiIron Ore Development Pty. Ltd. and Wandoo Petroleum Pty. Ltd. increased, while it decreased in Mitsui CoalHoldings Pty. Ltd. (Australia) for the year ended March 31, 2008.
Comparison between the Years Ended March 31, 2007 and 2006
Gross profit for the year ended March 31, 2007 was ¥30.7 billion, an increase of ¥0.3 billion from ¥30.4billion for the year ended March 31, 2006. Organic chemicals transactions showed strong performance.
Operating income for the year ended March 31, 2007 was ¥9.5 billion, a decrease of ¥1.7 billion from ¥11.2billion for the year ended March 31, 2006, reflecting an increase mainly in personnel expenses.
Net income for the year ended March 31, 2007 was ¥22.0 billion, a decrease of ¥0.8 billion from ¥22.8billion for the year ended March 31, 2006.
All Other
Billions of Yen
Years Ended March 31, Change(2008–2007)
Change(2007–2006)2008 2007 2006
Gross Profit . . . . . . . . . . . . . . . . . . . . . . . . . . . . . . . . . . . . . . . . . . ¥ 5.5 ¥ 4.3 ¥ 7.1 ¥ 1.2 ¥(2.8)Operating Loss . . . . . . . . . . . . . . . . . . . . . . . . . . . . . . . . . . . . . . . (1.4) (4.4) (3.2) 3.0 (1.2)Equity in Earnings of Associated Companies . . . . . . . . . . . . . . . 0.1 0.1 0.3 0.0 (0.2)Net Income . . . . . . . . . . . . . . . . . . . . . . . . . . . . . . . . . . . . . . . . . . (7.1) 5.8 11.8 (12.9) (6.0)
Comparison between the Years Ended March 31, 2008 and 2007
The activities of this segment include financing services, office services and other services to externalcustomers, and/or to us, and associated companies.
121

Gross profit in this segment for the year ended March 31, 2008 was ¥5.5 billion, an increase of ¥1.2 billionfrom ¥4.3 billion for the year ended March 31, 2007. Operating loss for the year ended March 31, 2008 was ¥1.4billion, an improvement of ¥3.0 billion from a ¥4.4 billion loss for the year ended March 31, 2007
Net loss for the year ended March 31, 2008 was ¥7.1 billion, a deterioration of ¥12.9 billion from ¥5.8billion of net income for the year ended March 31, 2007. For the year ended March 31, 2008, we recorded a¥13.9 billion impairment loss on real estate which we possess in Saito International Culture Park, located in thenorth area of Osaka Prefecture.
Comparison between the Years Ended March 31, 2007 and 2006
The activities of this segment include financing services, office services and other services to externalcustomers, and/or to us, and associated companies.
Gross profit in this segment for the year ended March 31, 2007 was ¥4.3 billion, a decrease of ¥2.8 billionfrom ¥7.1 billion for the year ended March 31, 2006. Operating loss for the year ended March 31, 2007 was ¥4.4billion, a deterioration of ¥1.2 billion from a ¥3.2 billion loss for the year ended March 31, 2006. This wasprimarily attributable to Mitsui Bussan Trade Services Ltd. (Japan), which offers business process outsourcingservices to Mitsui.
Net income for the year ended March 31, 2007 was ¥5.8 billion, a decrease of ¥6.0 billion from ¥11.8billion for the year ended March 31, 2006, primarily attributable to the sales of Mitsui’s corporate welfarefacilities recorded in the year ended March 31, 2006.
Inflation
Management believes that inflation did not have a significant effect on our reported results of operations.
Critical Accounting Policies and Estimates
Accounting policies and estimates are considered to be critical if they are important to our financialcondition and results of operations and involve estimates that require management’s subjective or significantjudgment about the effect of matters that are inherently uncertain.
The preparation of the consolidated financial statements in conformity with U.S. GAAP requiresmanagement to make estimates and assumptions that affect the carrying values of assets and liabilities and thedisclosure of contingent assets and liabilities at the date of the consolidated financial statements and the reportedamounts of revenues and expenses during the reporting period.
The following items require significant management judgments and estimates.
Impairment of Long-Lived Assets
The amount of impairment losses of long-lived assets, other than goodwill and intangible assets not subjectto amortization, for the years ended March 31, 2008 and 2007 and the balance of the long-lived assets, net ofaccumulated depreciation and amortization, as of the end of March 31, 2008 and 2007 were as follows:
Billions of Yen
As of March 31,
2008 2007
Long-lived assets . . . . . . . . . . . . . . . . . . . . . . . . . . . . . . . . . . . . . . . . . . . . . . . . . . . . . . . . . . . ¥1,264.9 ¥1,304.5Impairment loss . . . . . . . . . . . . . . . . . . . . . . . . . . . . . . . . . . . . . . . . . . . . . . . . . . . . . . . . . . . . 24.4 17.6
122

Impairment losses of long-lived assets have had a material impact on our net income for recent years. Theselosses were mainly due to the declining profitability resulting from deterioration of business environment and thereorganization of business structure and distribution bases owned by our subsidiaries.
Our long-lived assets to be held and used or to be disposed of other than by sale are reviewed forimpairment whenever events or changes in circumstances indicate that the carrying amount of an asset may notbe recoverable.
This review for impairment is performed by comparing the carrying amount of the asset with the aggregateamount of the estimated undiscounted future cash flows (“impairment analysis”). Cash flow projections used inour impairment analysis and fair value calculations are based on the business plan authorized by our managementor, if this is not available, on the operating plan reflecting the most recent condition of the long-lived asset. Inthese plans, for example, we assume:
• that the most recent selling prices of the real estate in the surrounding areas will continue for areasonable period in the future; and
• that the estimate of the sales prices of the products from facilities and equipment for the certain futureperiod is based on the average price of the equivalent length of period in the past or on the analysts’reports.
As for the discount rate used in fair value calculations, when expected variations of cash flows are notconsidered in the cash flow estimate, a discount rate which includes the risk factor for the cash flow deviation isused. For example:
• Assumptions that marketplace participants would use in their estimates of fair value are incorporated inthe discount rate when such information is available; or
• When such information is not available, an expected internal rate of return (“IRR”) used formanagement purposes or a weighted average cost of capital (“WACC”) of a company that owns thelong-lived asset, whichever is higher, is also considered for the discounted cash flow calculation.
Factors to be considered when estimating future cash flows and determining discount rates vary for eachlong-lived asset because of the difference in nature of the assets and in operating circumstances, such as location,owner, operator, profitability and other factors.
Also see the relevant discussion on the impairment loss at Mitsui Norin Co., Ltd. in “Operating Results byOperating Segment—Foods & Retail Segment” in this item.
Impairment of Marketable Investment Securities
Impairments of equity investments for recent fiscal years have had a significant impact on our income. Thefollowing table shows the carrying amounts of marketable and non-marketable equity securities as of March 31,2008, 2007 and 2006 and the impairment loss for the years ended March 31, 2008, 2007 and 2006.
Billions of Yen
Year ended March 31,
2008 2007 2006
Carryingamount
Impairmentloss
Carryingamount
Impairmentloss
Carryingamount
Impairmentloss
Marketable equity securities . . . . . . . . . . . ¥ 652.0 ¥28.1 ¥ 861.5 ¥ 3.1 ¥591.2 ¥ 1.8Non-marketable equity securities . . . . . . . 557.6 8.7 316.2 8.6 249.0 8.9
Total . . . . . . . . . . . . . . . . . . . . . . . . . . . . . ¥1,209.6 ¥36.8 ¥1,177.7 ¥11.7 ¥840.2 ¥10.7
Management principally believes that a 50% or more decline in fair value of a security leads to theconclusion that the security has an other-than-temporary impairment. In addition, if the decline is less than 50%,various factors, such as the extent to which the cost exceeds the market value, the duration of the market decline,
123

our intention and ability to hold the investment until its market price recovery, decline by 30% or more with themateriality of declined value and the financial conditions of the investee, are considered in concluding if thedecline is temporary or not.
Management believes that the criteria for evaluating the significance of the decline in fair value arereasonable. The aggregate unrealized loss amount of the marketable securities that have been in continuousunrealized loss position for less than one year and had severity of decline of fair value below cost was ¥19.6billion. But, considering the combination of length of time that fair values have been below cost, the extent ofdecline and the financial condition of the investees, we expect that their fair values will recover above their costswhile we hold these investments.
Tax Asset Valuation at subsidiaries and associated companies
Establishing a valuation allowance for deferred tax assets, pursuant to evaluation on its realizability, has hada significant impact on our income. The following table shows the deferred tax assets and valuation allowancefor deferred tax assets and valuation allowance as of March 31, 2008 and 2007.
Billions of Yen
As of March 31,
2008 2007
Total deferred tax assets . . . . . . . . . . . . . . . . . . . . . . . . . . . . . . . . . . . . . . . . . . . . . . . . . . . . . . . . ¥199.7 ¥196.6Valuation allowance . . . . . . . . . . . . . . . . . . . . . . . . . . . . . . . . . . . . . . . . . . . . . . . . . . . . . . . . . . . (79.8) (80.3)
Deferred tax assets—net . . . . . . . . . . . . . . . . . . . . . . . . . . . . . . . . . . . . . . . . . . . . . . . . . . . . . . . . ¥119.9 ¥116.3
For the purpose of evaluation of realizability of deferred tax assets at subsidiaries and associated companies,we classify them into five categories in the light of criteria including stability of operating results, analysis offuture deductible temporary differences and taxable income, and status of tax loss carryforwards. According tothe categories, the valuation allowance for the deferred tax assets is established for the amount that is notexpected to be realized.
• On the occurrence of temporary difference, we establish a deferred tax asset; and, at the same time weevaluate when those deferred tax assets will be realized in future. Particularly, when we establish adeferred tax asset in relation to a write-down loss of securities or impairment loss on long-lived assetsand we have no specific schedule of sale or disposal of those assets, we establish a valuation allowancefor the deferred tax asset because we view the deferred tax amount as not realizable.
• We evaluate realizablitiy of deferred tax assets on the future deductible temporary difference and taxloss carryforwards at subsidiaries and associated companies. Among others, no deferred tax assets aredetermined to be realizable, if those subsidiaries and associated companies recorded a significantamount of tax loss carryforwards for each of the past three years and are expected to record a significanttax loss in the current year as well, considering all our past experiences in determining realizability ofdeferred tax assets.
Mitsui determines the realizability of deferred tax assets at subsidiaries and associated companies based onall available evidence, both positive and negative, including all currently available information regarding taxdeductibility on future years and ability to generate sufficient taxable income prior to the expiration of the losscarryforward pursuant to the relevant tax laws and regulations. Management believes it is more likely than notthat all of those deferred tax assets, net of valuation allowance, will be realized. However, the amount ofrealizable net deferred tax assets may change in the near term if estimates of future taxable income during thecarryforward period are changed or if statutory tax rates are changed.
124

Reserve estimates for oil and gas producing and mining activities
Reserves are estimates of the amount of product that can be economically and legally extracted from thecompany’s interests in properties. In order to calculate reserves, estimates and assumptions are required about arange of geological, technical and economic factors, including quantities, grades, production techniques,recovery rates, production costs, transport costs, commodity demand, commodity prices and exchange rates.Because the economic assumptions used to estimate reserves change from period to period, and becauseadditional geological data is generated during the course of operations, estimates of reserves may change fromperiod to period. Changes in reported reserves may affect the company’s financial results and financial positionin a number of ways, including the following:
• Asset carrying values may be affected due to changes in estimated future cash flows.
• Depreciation and amortisation charged in the income statement may change where such charges aredetermined by the units of production basis, or where the useful economic lives of assets change.
• Decommissioning, site restoration and environmental provisions may change where changes inestimated reserves affect expectations about the timing or cost of these activities.
Pension Benefit Costs
Employee pension benefit costs and obligations are dependent on various assumptions, including discount,retirement, and mortality rates, which are based on current statistical data, as well as the expected long-term rateof return on plan assets and other factors. In accordance with U.S. GAAP, the difference between actual resultsand the assumptions is accumulated and amortized to expenses over future periods and, therefore, generallyaffects the recognized costs in future periods. Management believes that the assumptions used are appropriate;however, differences in actual experience or changes in assumptions may affect our future pension costs andobligations.
We determine the discount rates each year as of the measurement date, based on a review of interest ratesassociated with long-term Japanese government bonds or high-quality fixed-income corporate bonds. Thediscount rates determined on each measurement date are used to calculate the benefit obligation as of that date,and are also used to calculate the net periodic pension costs for the upcoming plan year.
Mitsui determines the expected long-term rate of return on plan assets based on the weighted-average rate ofreturn computed by using the expected long-term rate of return on each asset class, which is derived from anextensive study conducted by investment advisors and actuaries on a periodic basis, and the target allocations foreach asset class. The study includes a review of anticipated future performance with market analysis of individualasset classes, and also gives appropriate consideration to actual historical returns achieved by the plans. Thesubsidiaries determine the expected long-term rates of return on plan assets mainly based on the expectations forfuture returns by investment advisors and actuaries.
The following table illustrates the sensitivity to changes in certain assumptions for Mitsui’s pension plans:
Billions of Yen
Impact of change inassumption on NPPCfor the year ending
March 31, 2009
Impact of change inassumption on PBO
as ofMarch 31, 2008
50 basis point decrease in discount rate . . . . . . . . . . . . . . . . . . . . . . . . . . . . . . ¥ 2.0 ¥ 15.550 basis point increase in discount rate . . . . . . . . . . . . . . . . . . . . . . . . . . . . . . (1.6) (14.5)50 basis point decrease in expected long-term rate of return on
plan assets . . . . . . . . . . . . . . . . . . . . . . . . . . . . . . . . . . . . . . . . . . . . . . . . . . 1.2 —50 basis point increase in expected long-term rate of return on plan assets . . (1.2) —
See Note 14, “PENSION COSTS AND SEVERANCE INDEMNITIES,” for further discussion about theestimates and assumptions on PBO and NPPC.
125

New Accounting Standards
Accounting for certain hybrid financial instruments
During the year ended March 31, 2008, the companies adopted SFAS No. 155, “Accounting for CertainHybrid Financial Instruments—an amendment of FASB Statements No. 133 and 140.”
One of the amendments to SFAS No. 133 and SFAS No. 140 is that SFAS No. 155 permits an entity to electfair value remeasurement for any hybrid financial instrument in its entirety with changes in fair value recognizedin earnings, in which the hybrid financial instrument contains an embedded derivative that otherwise wouldrequire bifurcation.
The effect of adoption of this statement on the companies’ financial position and results of operations wasimmaterial.
Accounting for servicing of financial assets
During the year ended March 31, 2008, the companies adopted SFAS No. 156, “Accounting for Servicing ofFinancial Assets—an amendment of FASB Statement No. 140.”
SFAS No. 156 requires all separately recognized servicing assets and servicing liabilities to be initiallymeasured at fair value, if practicable, and permits an entity to choose either the amortization method or the fairvalue measurement method for subsequent measurement of each class of separately recognized servicing assetsand servicing liabilities.
The effect of adoption of this statement on the companies’ financial position and results of operations wasimmaterial.
Accounting for uncertainty in income taxes
On April 1, 2007, the companies adopted FIN No. 48, “Accounting for Uncertainty in Income Taxes—aninterpretation of FASB Statement No. 109.”
FIN No. 48 clarifies the accounting for uncertainty in income taxes recognized in financial statements inaccordance with SFAS No. 109, “Accounting for Income Taxes,” and prescribes a recognition threshold andmeasurement attribute for the financial statement recognition and measurement of all tax positions accounted forin accordance with SFAS No. 109.
The cumulative effect of adoption of this interpretation is disclosed in the Statements of ConsolidatedShareholders’ Equity as a decrease of ¥5,113 million in the opening balance of unappropriated retained earnings.See also Note 20, “INCOME TAXES,” for the effect of adoption of this interpretation.
Employers’ accounting for defined benefit pension and other postretirement plans
In September 2006, the FASB issued SFAS No. 158, “Employers’ Accounting for Defined Benefit Pensionand Other Postretirement Plans—an amendment of FASB Statements No. 87, 88, 106 and 132(R).”
SFAS No. 158 requires the recognition of the overfunded or underfunded status of a defined benefit pensionplan as an asset or a liability in the statement of financial position and the recognition of changes in that fundedstatus in comprehensive income in the year in which the changes occur. SFAS No. 158 also requires an entity tomeasure the funded status of a plan as of the date of an entity’s year-end statement of financial position, withlimited exceptions.
During the year ended March 31, 2007, we adopted the recognition and related disclosure provisions of thisstatement. See Note 14, “PENSION COSTS AND SEVERANCE INDEMNITIES,” for the effect of adoption ofthese provisions.
126

The measurement date provisions are effective for fiscal years ending after December 15, 2008. The effectof adoption of these provisions on our financial position and results of operations will be immaterial.
Fair value measurements
In September 2006, the FASB issued SFAS No. 157, “Fair Value Measurements.”
SFAS No.157 defines fair value, establishes a framework for measuring fair value, and expands disclosuresabout fair value measurements.
SFAS No. 157 was planned to be effective for financial statements issued for fiscal years beginning afterNovember 15, 2007 and interim periods within those fiscal years. However, in February 2008, the FASB issuedFASB Staff Position (“FSP”) No. FAS 157-2, which delayed the effective date to fiscal years beginning afterNovember 15, 2008 and interim periods within those fiscal years for nonfinancial assets and nonfinancialliabilities, except for items that are recognized or disclosed at fair value in the financial statements on a recurringbasis. The effect of adoption of this statement on our financial position and results of operations will beimmaterial.
Fair value option
In February 2007, the FASB issued SFAS No. 159, “The Fair Value Option for Financial Assets andFinancial Liabilities—including an amendment of FASB Statement No. 115.”
SFAS No. 159 permits an entity to choose, at specified election dates, to measure eligible financial assetsand liabilities at fair value. An entity will report unrealized gains and losses on items for which the fair valueoption has been elected in earnings.
SFAS No. 159 is effective as of the beginning of an entity’s first fiscal year that begins after November 15,2007. The effect of adoption of this statement on our financial position and results of operations will beimmaterial.
Offsetting of amounts related to certain contracts
In April 2007, the FASB issued FSP No. FIN 39-1, “Amendment of FASB Interpretation No. 39.”
FSP No. FIN 39-1 amends FIN No. 39, “Offsetting of Amounts Related to Certain Contracts—aninterpretation of APB Opinion No. 10 and FASB Statement No. 105,” to permit a reporting entity to offset fairvalue amounts recognized for the right to reclaim cash collateral (a receivable) or the obligation to return cashcollateral (a payable) against fair value amounts recognized for derivative instruments executed with the samecounterparty under the same master netting arrangement.
FSP No. FIN 39-1 is effective for fiscal years beginning after November 15, 2007. The effect of adoption ofthis staff position on our financial position and results of operations will be immaterial.
Scope of audit and accounting guide for investment companies
In June 2007, the American Institute of Certified Public Accountants (“AICPA”) issued the Statement ofPosition (“SOP”) 07-1, “Clarification of the Scope of the Audit and Accounting Guide Investment Companiesand Accounting by Parent Companies and Equity Method Investors for Investments in Investment Companies.”
SOP 07-1 provides guidance for determining whether an entity is within the scope of the AICPA Audit andAccounting Guide Investment Companies. For those entities that are investment companies under this statement,SOP 07-1 requires that the investment company accounting should be retained by a parent company in
127

consolidation or by an equity method investor. In addition, SOP 07-1 includes certain disclosure requirements forparent companies and equity method investors in investment companies that retain investment companyaccounting in the parent company’s consolidated financial statements or the financial statements of an equitymethod investor.
SOP 07-1 was planned to be effective for fiscal years beginning on or after December 15, 2007, however, inFebruary 2008, the FASB issued FSP No. SOP 07-1-1, which delayed indefinitely the effective date of thisstatement. The effect of adoption of this statement on our financial position and results of operations is notcurrently known and cannot be reasonably estimated until further analysis is completed.
Business combinations
In December 2007, the FASB issued SFAS No. 141 (revised 2007), “Business Combinations”(“SFAS No. 141R”).
SFAS No. 141R establishes principles and requirements for how an acquirer recognizes and measures in itsfinancial statements the identifiable assets acquired, the liabilities assumed, any noncontrolling interest in theacquiree and the goodwill acquired in the business combination or a gain from a bargain purchase. SFAS No. 141Ralso requires disclosures to enable users of the financial statements to evaluate the nature and financial effects of thebusiness combination.
SFAS No. 141R is applied prospectively to business combinations for which the acquisition date is on orafter the beginning of the first annual reporting period beginning on or after December 15, 2008. The effect ofadoption of this statement on our financial position and results of operations is not currently known and cannotbe reasonably estimated until further analysis is completed.
Noncontrolling interests in consolidated financial statements
In December 2007, the FASB issued SFAS No. 160, “Noncontrolling Interests in Consolidated FinancialStatements—an amendment of ARB No. 51.”
SFAS No. 160 establishes accounting and reporting standards for the noncontrolling interest in a subsidiaryand for the deconsolidation of a subsidiary.
SFAS No. 160 is effective for fiscal years beginning on or after December 15, 2008 and interim periodswithin those fiscal years. The effect of adoption of this statement on our financial position and results ofoperations is not currently known and cannot be reasonably estimated until further analysis is completed.
Disclosures about derivative instruments and hedging activities
In March 2008, the FASB issued SFAS No. 161, “Disclosures about Derivative Instruments and HedgingActivities—an amendment of FASB Statement No. 133.”
SFAS No. 161 amends and expands the disclosure requirements of SFAS No. 133 to provide users offinancial statements with an enhanced understanding of how and why an entity uses derivative instruments, howderivative instruments and related hedged items are accounted for under SFAS No. 133 and its relatedinterpretations, and how derivative instruments and related hedged items affect an entity’s financial position,financial performance, and cash flows.
SFAS No. 161 is effective for financial statements issued for fiscal years and interim periods beginning afterNovember 15, 2008. The effect of adoption of this statement on our financial position and results of operationswill be immaterial.
128

B. Liquidity and Capital Resources
Use of Non-GAAP Financial Measures
Non-GAAP financial measures are defined in the SEC regulations as financial measures that either excludeor include amounts that are not excluded from or included in the most directly comparable measure calculatedand presented in accordance with GAAP.
Net Debt-to-Equity Ratio
We refer to “Net Debt-to-Equity Ratio” (“Net DER”) in this Liquidity and Capital Resources and elsewherein this annual report. Net DER is comprised of “net interest bearing debt” divided by shareholders’ equity.
“Net interest bearing debt” is defined as interest bearing debt, defined below, less cash and cash equivalentsand time deposits. Our interest bearing debt primarily consists of long-term debt. As discussed in “Funding andTreasury Policies and Objectives,” to flexibly meet capital requirements and to prepare for future debt-servicerequirements in case of unforeseen deteriorations in financial markets, currently we hold a relatively high level ofcash and cash equivalents reflecting the current financial market conditions and future capital requirements.Under this policy, Net DER is a useful internal measure for our management to review the balance between:
• our capacity to meet debt repayments; and
• leverage to improve return on equity in our capital structure.
This calculation does not recognize the fact that cash and cash equivalents and time deposits may not becompletely available for debt repayments because some amount of cash and cash equivalents and time depositsmay be required for operational needs including contractual obligations or capital expenditures.
“Net interest bearing debt” and “Net DER” are presented in the table below.
Billions of Yen
As of March 31,
2008 2007
Short-term debt . . . . . . . . . . . . . . . . . . . . . . . . . . . . . . . . . . . . . . . . . . . . . . . . . . . . . . . . . . . . ¥ 464.6 ¥ 658.7Long-term debt . . . . . . . . . . . . . . . . . . . . . . . . . . . . . . . . . . . . . . . . . . . . . . . . . . . . . . . . . . . . 3,221.0 3,259.4
Interest bearing debt . . . . . . . . . . . . . . . . . . . . . . . . . . . . . . . . . . . . . . . . . . . . . . . . . . . . . . . . 3,685.6 3,918.1Less cash and cash equivalents and time deposits . . . . . . . . . . . . . . . . . . . . . . . . . . . . . . . . . (911.6) (806.6)Net interest bearing debt . . . . . . . . . . . . . . . . . . . . . . . . . . . . . . . . . . . . . . . . . . . . . . . . . . . . . ¥2,774.0 ¥3,111.5
Shareholders’ equity . . . . . . . . . . . . . . . . . . . . . . . . . . . . . . . . . . . . . . . . . . . . . . . . . . . . . . . . ¥2,183.7 ¥2,110.3
Net DER (times) . . . . . . . . . . . . . . . . . . . . . . . . . . . . . . . . . . . . . . . . . . . . . . . . . . . . . . . . . . . 1.27 1.47
The most directly comparable GAAP measure is considered to be “Debt-to-Equity Ratio” (“DER”).However, this ratio measures gross debt relative to equity, and does not measure changes in cash position.
DER (times) . . . . . . . . . . . . . . . . . . . . . . . . . . . . . . . . . . . . . . . . . . . . . . . . . . . . . . . . . . . . . . . 1.69 1.86(defined as interest bearing debt divided by shareholders’ equity)
Free Cash Flow
We define “free cash flow” as the sum of net cash provided /(used) by operating activities and net cashprovided/(used) in investing activities. Management believes that such indicator is useful to investors, to measureavailable net cash for investment in strategic opportunities and/or debt repayment, or the extent of reliance onborrowing to procure funds for strategic investments. Free cash flow does not represent the residual cash flowavailable for discretionary expenditures.
129

The following table shows a reconciliation of net cash provided by operating activities to free cash flow.
Billions of Yen
Years Ended March 31,
2008 2007 2006
Net cash provided by operating activities . . . . . . . . . . . . . . . . . . . . . . . . . . . . . . . . . ¥ 415.8 ¥ 239.3 ¥ 146.4Net cash used in investing activities . . . . . . . . . . . . . . . . . . . . . . . . . . . . . . . . . . . . . (104.8) (418.0) (347.3)
Free cash flow . . . . . . . . . . . . . . . . . . . . . . . . . . . . . . . . . . . . . . . . . . . . . . . . . . . . . . ¥ 311.0 ¥(178.7) ¥(200.9)
Finance and Liquidity Management
Funding and Treasury Policies and Objectives
Our basic funding policy is to secure stable sources of funds to maintain adequate liquidity and financing tosatisfy capital requirements for our operations and to maintain the strength of our balance sheet. In order to achieveour objectives, our principal strategy is to obtain long-term funds (those with maturities of around 10 years) fromfinancial institutions, including insurance companies and banks, and through the issuance of corporate bonds. Inaddition, we utilize financing programs provided by government financing agencies for various projects to obtainlong-term financing. Another strategy is to maintain sufficient liquidity to flexibly meet capital requirements and toprepare for future debt-service requirements in case of unforeseen deteriorations in financial markets. We hold cashand cash equivalents as liquidity sources, which consist mainly of highly-liquid and highly-rated short-termfinancial instruments and deposits. We aim to maintain the proper level of cash and cash equivalents, reflecting thecurrent financial market conditions and future capital requirements.
In principle, wholly owned domestic subsidiaries do not individually raise their funds in financial markets orborrow from banks, but instead use a cash management service provided by Mitsui & Co. Financial Services Ltd.(Japan), our financing subsidiary. The same policy and practices have been extended to wholly owned overseassubsidiaries through our regional financing subsidiaries, which centralizes the fund raising function and promotesefficient use of funds. Approximately 83% of total interest bearing debt as of March 31, 2008 was raised byMitsui and the above-mentioned financing subsidiaries as in-house banking bases.
Funding Sources
We borrow funds based on our longstanding relations with financial institutions in Japan and overseas,borrow from government financing agencies, and also utilize project financing. In addition to these fundingsources, Mitsui maintains a ¥200 billion debt shelf-registration and a ¥2,400 billion commercial paper program inJapan. Similarly, Mitsui & Co. (U.S.A.), Inc., Mitsui & Co. Financial Services (Europe) B.V., Mitsui & Co.Financial Services (Asia) Ltd. and Mitsui & Co., Ltd. have arranged a joint Euro medium-term note (“MTN”)program of U.S.$5 billion. Mitsui guarantees notes issued by these overseas subsidiaries. For raising short-termfunds, Mitsui & Co. (U.S.A.), Inc. has a U.S.$1.5 billion U.S. domestic commercial paper program, and we havemade arrangements for commercial paper programs in some other overseas markets.
Unused lines of credit, for short-term financing outside of Japan, aggregated ¥598.5 billion at March 31,2008. Certain overseas subsidiaries compensate banks for these facilities in the form of commitment fees, whichwere not material in each of the past three years.
As of March 31, 2008, long-term debt accounted for approximately 87% of total debt, reflecting a decreasein short term debt from the prior year end, which we regard as a satisfactory level from the viewpoint of ourfinancial policies. There were three bond issues that raised ¥35.0 billion in total (with maturity of 15–20 years)under the shelf-registration in Japan during the year ended March 31, 2008.
Approximately 73% of the total of short-term and long-term debt as of March 31, 2008 was denominated inJapanese yen and the rest was primarily denominated in U.S. dollars. We employ certain derivative financial
130

instruments, which include interest rate swaps, currency swaps and foreign exchange forward contracts, tomanage financial exposures resulting from our financing activities. Currency swap agreements and foreignexchange forward contracts are used to manage risks associated with the fluctuations in foreign exchange rates.The principal financial derivative instruments that are employed to manage interest rate risk exposure are interestrate swap agreements. A large part of such agreements are used for fair value hedging of fixed rate interestbearing debt, including fixed interest rate borrowing, bonds and notes, converting into floating interest ratesbased on the three-month or six-month LIBOR. The interest rates on approximately 67% of Mitsui’s long-termdebt, other than borrowings for certain projects, were floating after taking into account interest rate swaparrangements as of March 31, 2008.
See Note 25, “DERIVATIVE INSTRUMENTS AND HEDGING ACTIVITIES,” for further description ofour risk management policies.
Credit Ratings
To facilitate access to funds from capital markets, Mitsui and certain of our overseas trading or financingsubsidiaries have obtained ratings for their commercial paper (short-term debt) and long-term unsecured seniordebt and/or long-term corporate credit from Rating and Investment Information, Inc. (“R&I”), Moody’s InvestorsService, Inc. (“Moody’s”) and Standard and Poor’s Services (“S&P”). Medium-term note program rating has alsobeen given for the above-mentioned MTN program by R&I and Moody’s. The ratings as of June 2008 were asfollows:
R&I Moody’s S&P
Commercial Paper rating . . . . . . . . . . . . . . . . . . . . . . . . . . . . . . . . . . . . . . . . . . . . . . . . . . . . a-1+ P-1 A-1
Long-term corporate credit rating . . . . . . . . . . . . . . . . . . . . . . . . . . . . . . . . . . . . . . . . . . . . . AA- – A+
Long-term unsecured senior debt rating . . . . . . . . . . . . . . . . . . . . . . . . . . . . . . . . . . . . . . . . AA- A2* –
Medium-term note program rating . . . . . . . . . . . . . . . . . . . . . . . . . . . . . . . . . . . . . . . . . . . . AA- A2 –
* Rating for long-term unsecured notes issued under the MTN program
S&P in March 2008 raised our long-term credit rating to “A+” from “A”. S&P cited the following factorsfor the change in ratings:
• Improving balance between our risk assets and risk buffer; and
• Enhancement of our risk management system.
In addition, R&I in May 2008 revised to positive from stable its outlook on the long-term corporate creditrating. Mitsui intends to maintain and improve its current credit ratings by enhancing its earnings and riskmanagement.
Credit ratings are an assessment by the rating agencies of the credit risks associated with us and are basedon information provided by us and other sources that the rating agencies consider reliable. Lower ratingsgenerally result in higher borrowing costs and reduced access to capital markets. Credit ratings do not constitutea recommendation to buy, sell or hold securities and are subject to change or withdrawal by each of the ratingagencies at any time. As rating agencies may have different criteria in evaluating the risk associated with acompany, you should evaluate each rating independently of other ratings. Ratings may be changed withoutpre-notice at any time.
Liquidity Management
For the interest rate structure and the maturity profile of our outstanding debt, see Note 13, “SHORT-TERMAND LONG-TERM DEBT.”
131

(*1) Financial services from and to Mitsui and its subsidiaries referred to in “Funding and Treasury Policies andObjectives” and “Liquidity Management” above are provided by the All Other Segment. Acquisitions of andproceeds from sales of available-for-sale securities as investing activities in the Statements of ConsolidatedCash Flows are mostly conducted by the All Other Segment which includes the units in charge of corporatefinancing and liquidity management as discussed in “Funding Sources.”
Cash and cash equivalents were ¥899.3 billion, ¥800.0 billion and ¥697.1 billion as of March 31, 2008, 2007and 2006, respectively.
As of March 31, 2008, net interest bearing debt (interest bearing debt less cash and cash equivalents andtime deposits) was ¥2,774.0 billion, a decrease of ¥337.5 billion from ¥3,111.5 billion as of March 31, 2007. NetDER improved from 1.47 as of March 31, 2007 to 1.27 as of March 31, 2008.
The ratio of current assets to current liabilities as of March 31, 2008 was 145.0%, up by 11.8 percentagepoints from 133.2% as of March 31, 2007.
As of March 31, 2008, we had given guarantees for obligations of various third parties and associatedcompanies. These guarantees are not expected to require substantial use of our capital resources. We have nothad any material payment requirements resulting from these guarantees for the past three years. For details onguarantees issued by us, see Note 22, “CONTINGENT LIABILITIES.”
With the exception of project financing and non-recourse financing, it is our policy not to concludeagreements for important financial transactions with financial institutions that contain additional debt restrictionclauses that could cause acceleration of our obligations, including debt incurrence restrictions, negative pledges,restrictions on dividend payments and various financial ratio limits, and there are no material financial covenantsin the agreements undertaken.
Assuming that our subsidiaries have sufficient distributable net assets or retained earnings as provided underthe local laws of the relevant jurisdictions, there are no material contractual or legal restrictions on the ability ofour subsidiaries to transfer funds to us in the form of dividends, loans or advances. There are no materialeconomic restrictions on payments of dividends, loans or advances to us by our subsidiaries other than generalwithholding or other taxes calculated at the rates determined by the local tax laws of the relevant jurisdictions.
We held ¥899.3 billion of cash and cash equivalents as of March 31, 2008 in comparison to ¥138.4 billionof current maturities of outstanding debt including commercial paper, MTNs and bonds. Of the cash and cashequivalents, approximately 55% was held by Mitsui and approximately 97% was denominated in Japanese yen.We believe that we maintain sufficient liquidity to satisfy our working capital and debt-service requirements forthe foreseeable future through existing cash and cash equivalents and time deposits, the sales of certain assets inparallel with outside borrowings from financial institutions, as well as, the issuance of bonds and notes.
We plan to contribute ¥4.8 billion to our defined-benefit pension plans for the year ending March 31, 2009.This cash requirement will be managed under our funding policy mentioned above.
Investment Plans and Financial Policies of the Medium-Term Management Outlook
For the year ended March 31, 2008, Mitsui introduced a new monitoring system linked closely toconsolidated cash flow statements (namely, the combined total of investing cash flows of operating segmentsother than the All Other Segment(*1) and Adjustments and Eliminations) to incorporate not only the large-scaleinvestments but also small- to middle-sized investments, loans and leases.
With this new monitoring method, in April 2007, we set up an outlook for our investments and loans to be¥800 billion for the single year ended March 31, 2008, and consequently during this fiscal year, we executed new
132

investments and loans of approximately ¥710 billion. Concurrently, we focused on divestitures of outstandinginvestments and fixed assets and collected approximately ¥610 billion, including large scale divestitures of our50% stake in Sakhalin II and entire stake in Sesa Goa.
As a result, investing cash flow for the year ended March 31, 2008 was net outflows of ¥104.8 billion(*2) andfree cash flow during the fiscal year was net inflows of ¥311.0 billion, a positive free cash flow after our longlasting proactive investment activities during the 5 years.
As of the issuing date of this annual report, we forecast total investing cash outflows for the year endingMarch 31, 2009 to be approximately ¥700 billion, which includes investments in mineral resources and energybusinesses of ¥350 billion mainly in response to demand for expansion of existing projects. And in non mineralresources and energy business fields, we also forecast a total of ¥350 billion, aiming at enhancement of ourbusiness bases under Medium-Term Management Outlook. At the same time, we forecast a total of ¥270 billionin divestitures during the period.
Our Medium-term Management Outlook originally positioned turnaround to positive free cash flow for theyear ending March 31, 2009 as a key milestone event. Except for the two large scale divestitures of Sesa Goa andSakhalin II, we evaluated the free cash flow for the year ended March 31, 2008 as virtually break-even. For theyear ending March 31, 2009, we expect the free cash flow as break-even or marginal net inflows. Compared tothe assumptions in the Medium-term Management Outlook, there have been certain delays in operations at themajor projects such as Sakhalin II, the Enfield oil field and the Dawson coal mine, which can be regarded asmajor reasons for a delay in achieving a stable positive free cash flow trend.
In our business plan covering the year ending March 31, 2009, we intend to maintain the current dividendpay-out ratio of 20% on consolidated net income, after company wide examination of the above-mentionedinvestment plan through establishing the business plan.
We forecast that total interest bearing debt as of March 31, 2009 will remain at the same level as March 31,2008. We also forecast a slightly lower Net DER than 1.27 times as of March 31, 2008
We will procure funds for refinance by direct financing from capital markets and fund raising—includingproject finance—from the private sector and government financing agencies, especially paying attention to thetrend of Japanese yen interest rate. Many of the projects in the investment plan involve bidding. The outcome ofbidding will have an effect on our actual cash flows and financial condition for the year ending March 31, 2009.
Assets, Liabilities and Shareholders’ Equity
Total assets as of March 31, 2008 were ¥9,690.9 billion, a decrease of ¥122.4 billion from ¥9,813.3 billion,as of March 31, 2007.
Current assets as of March 31, 2008 were ¥5,211.1 billion, an increase of ¥137.3 billion from ¥5,073.8billion as of March 31, 2007, mainly attributable to increases in cash and cash equivalents in Mitsui, andderivative assets reflecting higher commodity prices.
Total current liabilities as of March 31, 2008 were ¥3,594.6 billion, a decrease of ¥215.6 billion from¥3,810.2 billion as of March 31, 2007 led by decreases by the sum of ¥289.4 billion in short term debt and incurrent maturities of long-term debt at both overseas financial subsidiaries and Mitsui, which was offset byincreases in derivative liabilities related to the above-mentioned derivative assets and accrued expenses forincome tax of Mitsui.
As a result, working capital, or current assets minus current liabilities, as of March 31, 2008 was ¥1,616.5billion, resulting in an increase of ¥352.9 billion from ¥1,263.6 billion as of March 31, 2007.
(*2) See “Cash Flows from Investing Activities” of “Cash Flows” for the breakdown by operating segment.
133

The sum of “investments and non-current receivables”, “property and equipment—at cost”, “intangibleassets, less accumulated amortization”, “deferred tax assets-non-current” and “other assets” as of March 31, 2008totaled ¥4,479.8 billion, a ¥259.7 billion decrease from ¥4,739.5 billion as of March 31, 2007, mainly due to thefollowing factors:
• Total investments and non-current receivables as of March 31, 2008 were ¥3,237.3 billion, a ¥254.7billion decrease from ¥3,492.0 billion as of March 31, 2007. Within this category, investments in andadvances to associated companies as of March 31, 2008 were ¥1,333.0 billion, a ¥254.6 billion decreasefrom ¥1,587.6 billion as of March 31, 2007. As of March 31, 2007, investment for the Sakhalin IIproject amounting to ¥417.2 billion was recorded in this account. As a result of a 50% divestiture inApril 2007, the remaining balance was transferred to the account “other investments”. Besides this largescale divestiture, major expenditures were:
— investment in Sims Group Limited, an Australian metal recycler, for ¥70.7 billion and investment inErdos Electrical Power & Metallurgical Co., Ltd., a conglomerate in the Inner MongoliaAutonomous Region of China engaged in power generation, coal mining and ferrous alloyproduction, for ¥16.4 billion in the Mineral & Metal Resources Segment; and
— additional investment to combine United Kingdom power generating assets with InternationalPower plc for ¥24.5 billion in the Machinery & Infrastructure Projects Segment.
In addition to the above-mentioned increases, there were increases which do not involve cash outflows such as:
— increases in equity in earnings (before tax effect) of ¥110.2 billion (net of ¥99.8 billion dividendsreceived from associated companies); and
— a ¥85.8 billion net deterioration in foreign exchange translation cumulative adjustments.
134

The following table shows the details of investments in and advances to associated companies as ofMarch 31, 2008 and 2007 by operating segment.
Billions of Yen
As of March 31,
Change2008 2007
Iron & Steel Products . . . . . . . . . . . . . . . . . . . . . . . . . . . . . . . . . . . . . . . . . . . . . . . ¥ 25.6 ¥ 22.0 ¥ 3.6Mineral & Metal Resources . . . . . . . . . . . . . . . . . . . . . . . . . . . . . . . . . . . . . . . . . . 388.8 264.4 124.4Machinery & Infrastructure Projects . . . . . . . . . . . . . . . . . . . . . . . . . . . . . . . . . . . 375.0 383.3 (8.3)Chemical . . . . . . . . . . . . . . . . . . . . . . . . . . . . . . . . . . . . . . . . . . . . . . . . . . . . . . . . . 42.9 46.2 (3.3)Energy . . . . . . . . . . . . . . . . . . . . . . . . . . . . . . . . . . . . . . . . . . . . . . . . . . . . . . . . . . . 154.0 558.7 (404.7)Foods & Retail . . . . . . . . . . . . . . . . . . . . . . . . . . . . . . . . . . . . . . . . . . . . . . . . . . . . 63.1 57.0 6.1Consumer Service & IT . . . . . . . . . . . . . . . . . . . . . . . . . . . . . . . . . . . . . . . . . . . . . 123.0 112.7 10.3Logistics & Financial Markets . . . . . . . . . . . . . . . . . . . . . . . . . . . . . . . . . . . . . . . . 29.1 33.9 (4.8)Americas . . . . . . . . . . . . . . . . . . . . . . . . . . . . . . . . . . . . . . . . . . . . . . . . . . . . . . . . . 36.6 39.0 (2.4)Europe, the Middle East and Africa . . . . . . . . . . . . . . . . . . . . . . . . . . . . . . . . . . . . 25.5 14.9 10.6Asia Pacific . . . . . . . . . . . . . . . . . . . . . . . . . . . . . . . . . . . . . . . . . . . . . . . . . . . . . . . 53.5 44.1 9.4
Total . . . . . . . . . . . . . . . . . . . . . . . . . . . . . . . . . . . . . . . . . . . . . . . . . . . . . . . . . . . . 1.317.1 1,576.2 (259.1)
All Other . . . . . . . . . . . . . . . . . . . . . . . . . . . . . . . . . . . . . . . . . . . . . . . . . . . . . . . . . 3.2 10.5 (7.3)Adjustments and Eliminations . . . . . . . . . . . . . . . . . . . . . . . . . . . . . . . . . . . . . . . . 12.7 0.9 11.8
Consolidated Total . . . . . . . . . . . . . . . . . . . . . . . . . . . . . . . . . . . . . . . . . . . . . . . . . ¥1,333.0 ¥1,587.6 ¥(254.6)
• Other investments were ¥1,281.5 billion, a ¥42.6 billion increase from ¥1,238.9 billion as of March 31,2007. Major factors were as follows:
— There were acquisitions of preferred stock in Japan Airlines Co., Ltd. for ¥20.0 billion, shares inYamaha Motor Co., Ltd. for ¥15.7 billion (net of loss on write-down) and shares and bonds ofCentral Finance Co., Ltd. for ¥14.9 billion (net of loss on write-down).
— As discussed in investments in and advances to associated companies above, investment in theSakhalin II project for ¥218.5 billion was recorded in this account, as a result of a 50% divestiture ofour stake in April 2007 and the investments thereafter in response to expenditures for developmentwork.
135

— Net total of unrealized holding gains and losses on available-for-sale securities decreased by ¥201.4billion, with the fall of prices of shares of companies such as Toho Titanium Co., Ltd., Nippon SteelCorporation, Seven & i Holdings Co., Ltd., Mitsui Chemicals, Inc., Mitsui Engineering &Shipbuilding Co., Ltd. and Tokyo Broadcasting System, Incorporated, reflecting a decline in thestock market towards March 31, 2008.
• Property leased to others—at cost as of March 31, 2008 was ¥184.4 billion, a decrease of ¥74.8 billionfrom ¥259.2 billion as of March 31, 2007, mainly due to sales of commercial real estate in Europe androlling stock for lease.
• Property and equipment—at cost as of March 31, 2008 was ¥1,016.3 billion, an increase of ¥28.0 billionfrom ¥988.3 billion as of March 31, 2007. Major components were as follows:
— Iron ore mining projects in Australia for ¥14.8 billion, including negative effect from foreignexchange translation of ¥4.3 billion in the Mineral & Metal Resources Segment;
— Coal mining projects in Australia for ¥17.3 billion, including negative effect from foreign exchangetranslation of ¥6.6 billion in the Energy Segment;
— Enfield and Vincent oil field in Australia, Tui oil field in New Zealand, oil and gas projects inOman, and oil and gas projects offshore in the Gulf of Mexico as well as oil and gas projects byMitsui Oil Exploration Co., Ltd., resulting in a marginal increase by ¥0.5 billion, including negativeeffect from foreign exchange translation of ¥33.4 billion due to Japanese Yen appreciation andamortization of mineral rights in the Energy Segment; and
— Property and equipment of Steel Technologies Inc. for ¥26.2 billion as a result of the acquisition ofthe company during the period ended March 31, 2008 in the Americas Segment.
On the other hand, the property and equipment of Sesa Goa Limited for ¥13.2 billion decreased as aresult of the divestiture in the Mineral & Metal Resources Segment.
The following table shows the details of property leased to others—at cost and property and equipment—atcost as of March 31, 2008 and 2007 by operating segment.
Billions of Yen
As of March 31,
2008 2007 Change
Iron & Steel Products . . . . . . . . . . . . . . . . . . . . . . . . . . . . . . . . . . . . . . . . . . . . . . . . ¥ 23.3 ¥ 22.9 ¥ 0.4Mineral & Metal Resources . . . . . . . . . . . . . . . . . . . . . . . . . . . . . . . . . . . . . . . . . . . 96.8 95.3 1.5Machinery & Infrastructure Projects . . . . . . . . . . . . . . . . . . . . . . . . . . . . . . . . . . . . 125.3 142.2 (16.9)Chemical . . . . . . . . . . . . . . . . . . . . . . . . . . . . . . . . . . . . . . . . . . . . . . . . . . . . . . . . . . 59.1 71.9 (12.8)Energy . . . . . . . . . . . . . . . . . . . . . . . . . . . . . . . . . . . . . . . . . . . . . . . . . . . . . . . . . . . . 460.2 471.2 (11.0)Foods & Retail . . . . . . . . . . . . . . . . . . . . . . . . . . . . . . . . . . . . . . . . . . . . . . . . . . . . . 63.8 62.5 1.3Consumer Service & IT . . . . . . . . . . . . . . . . . . . . . . . . . . . . . . . . . . . . . . . . . . . . . . 69.3 103.2 (33.9)Logistics & Financial Markets . . . . . . . . . . . . . . . . . . . . . . . . . . . . . . . . . . . . . . . . . 57.6 60.7 (3.1)Americas . . . . . . . . . . . . . . . . . . . . . . . . . . . . . . . . . . . . . . . . . . . . . . . . . . . . . . . . . . 82.4 40.4 42.0Europe, the Middle East and Africa . . . . . . . . . . . . . . . . . . . . . . . . . . . . . . . . . . . . . 10.7 11.7 (1.0)Asia Pacific . . . . . . . . . . . . . . . . . . . . . . . . . . . . . . . . . . . . . . . . . . . . . . . . . . . . . . . . 5.6 6.4 (0.8)
Total . . . . . . . . . . . . . . . . . . . . . . . . . . . . . . . . . . . . . . . . . . . . . . . . . . . . . . . . . . . . . 1,054.1 1,088.4 (34.3)
All Other . . . . . . . . . . . . . . . . . . . . . . . . . . . . . . . . . . . . . . . . . . . . . . . . . . . . . . . . . . 10.2 25.8 (15.6)Adjustments and Eliminations . . . . . . . . . . . . . . . . . . . . . . . . . . . . . . . . . . . . . . . . . 136.5 133.3 3.2
Consolidated Total . . . . . . . . . . . . . . . . . . . . . . . . . . . . . . . . . . . . . . . . . . . . . . . . . . ¥1,200.8 ¥1,247.5 ¥(46.7)
136

Long-term debt, less current maturities as of March 31, 2008 was ¥2,944.4 billion, an increase of ¥56.9billion from ¥2,887.5 billion as of March 31, 2007 mainly due to an increase in borrowings from financialinstitutions associated with funding for various investments at Mitsui & Co. (U.S.A.), Inc., Mitsui & Co.(Australia), Ltd., and Mitsui.
Shareholders’ equity as of March 31, 2008 was ¥2,183.7 billion, an increase of ¥73.4 billion from ¥2,110.3billion as of March 31, 2007, primarily due to the increase in retained earnings by ¥332.9 billion, conversion ofbonds by ¥28.7 billion, net deterioration in foreign currency translation adjustments by ¥125.8 billion (whichinclude translation adjustments regarding the U.S. Dollar by ¥102.6 billion and Australian Dollar by ¥19.3billion, respectively); and a net decline in total of unrealized holding gains by ¥118.5 billion.
Cash Flows
Billions of Yen
Years Ended March 31,
2008 2007 2006
Net cash provided by operating activities . . . . . . . . . . . . . . . . . . . . . . . . . . . . . . . . . ¥ 415.8 ¥ 239.3 ¥ 146.4Net cash used in investing activities . . . . . . . . . . . . . . . . . . . . . . . . . . . . . . . . . . . . . (104.8) (418.0) (347.3)Net cash (used in) provided by financing activities . . . . . . . . . . . . . . . . . . . . . . . . . . (185.1) 272.3 92.3Effect of exchange rate changes on cash and cash equivalents . . . . . . . . . . . . . . . . . (26.7) 9.4 13.9
Net increase (decrease) in cash and cash equivalents . . . . . . . . . . . . . . . . . . . . . . . . ¥ 99.2 ¥ 103.0 ¥ (94.7)
Cash Flows during the Year Ended March 31, 2008
Cash Flows from Operating Activities
Net cash provided by operating activities for the year ended March 31, 2008 was ¥415.8 billion, an increaseof ¥176.5 billion from ¥239.3 billion for the year ended March 31, 2007. Major components were:
• operating income which increased steadily in general mainly at the Energy Segment, the Machinery &Infrastructure Projects Segment and other segments;
• dividends received totaling ¥149.4 billion from associated companies as well as investees other thanassociated companies, among others from our mineral resources and energy related associatedcompanies such as Japan Australia LNG (MIMI) Pty. Ltd. (Australia), Valepar S.A. (Brazil), and otherMiddle Eastern LNG companies; and
137

• payments of ¥184.3 billion for corporate income taxes.
Compared to the year ended March 31, 2007, net cash for the year ended March 31, 2008 provided byoperating activities increased by ¥176.5 billion. In addition to the above-mentioned components, the increase wasalso attributable to positive impact from the collection of trade receivables as well as changes in other operatingassets and liabilities.
Cash Flows from Investing Activities
The following table shows net cash provided by (used in) investing activities for the years ended March 31,2008 and 2007 by operating segment.
Billions of Yen
Year EndedMarch 31, 2008
Year EndedMarch 31, 2007
Iron & Steel Products . . . . . . . . . . . . . . . . . . . . . . . . . . . . . . . . . . . . . . . . . . . . . . . . ¥ (3.2) ¥ (10.3)Mineral & Metal Resources . . . . . . . . . . . . . . . . . . . . . . . . . . . . . . . . . . . . . . . . . . . (3.5) 5.1Machinery & Infrastructure Projects . . . . . . . . . . . . . . . . . . . . . . . . . . . . . . . . . . . . (87.3) (166.8)Chemical . . . . . . . . . . . . . . . . . . . . . . . . . . . . . . . . . . . . . . . . . . . . . . . . . . . . . . . . . . (17.0) (21.2)Energy . . . . . . . . . . . . . . . . . . . . . . . . . . . . . . . . . . . . . . . . . . . . . . . . . . . . . . . . . . . . 118.3 (211.6)Foods & Retail . . . . . . . . . . . . . . . . . . . . . . . . . . . . . . . . . . . . . . . . . . . . . . . . . . . . . (14.7) 5.8Consumer Service & IT . . . . . . . . . . . . . . . . . . . . . . . . . . . . . . . . . . . . . . . . . . . . . . 23.7 (58.7)Logistics & Financial Markets . . . . . . . . . . . . . . . . . . . . . . . . . . . . . . . . . . . . . . . . . (0.7) 0.4Americas . . . . . . . . . . . . . . . . . . . . . . . . . . . . . . . . . . . . . . . . . . . . . . . . . . . . . . . . . . (99.5) (26.6)Europe, the Middle East and Africa . . . . . . . . . . . . . . . . . . . . . . . . . . . . . . . . . . . . . (8.3) (4.6)Asia Pacific(*) . . . . . . . . . . . . . . . . . . . . . . . . . . . . . . . . . . . . . . . . . . . . . . . . . . . . . . (73.7) (15.7)
Total . . . . . . . . . . . . . . . . . . . . . . . . . . . . . . . . . . . . . . . . . . . . . . . . . . . . . . . . . . . . . (165.9) (504.2)
All Other and Adjustments and Eliminations(*) . . . . . . . . . . . . . . . . . . . . . . . . . . . . 61.1 86.2
Consolidated Total . . . . . . . . . . . . . . . . . . . . . . . . . . . . . . . . . . . . . . . . . . . . . . . . . . ¥(104.8) ¥(418.0)
(*) The figures of operating segments from Iron & Steel Products to Asia Pacific include the inter-segmenttransactions, for example, increases in long-term loan receivables disbursed to other operating segments. Atthe same time, the amounts of such inter-segment transactions are eliminated in Eliminations. Amongothers, for the year ended March 31, 2008, the Asia Pacific Segment recorded net increases in loans to 2subsidiaries owned by Mineral & Metal Resources Segment and the Energy Segment, amounting to ¥58.8billion.
Net cash used in investing activities for the year ended March 31, 2008 was a net outflow of ¥104.8 billion,a ¥313.2 billion decrease from ¥418.0 billion in net outflows for the year ended March 31, 2007.
• A total of ¥206.9 billion was paid out for investments in and advances to associated companies, andproceeds of ¥309.6 billion were collected from sales of investments in and advances to associatedcompanies. As a result, net cash inflows were ¥102.7 billion. The principal factor of the inflows was a¥226.4 billion (equivalent to the proceeds of US$1,862.5 million) proceed from the 50% divestiture ofour stake in Sakhalin II project. On the other hand, major components of expenditures were:
— investments in Sims Group Limited, an Australian metal recycler, for ¥70.6 billion and ErdosElectrical Power & Metallurgical Co., Ltd., a conglomerate in the Inner Mongolia AutonomousRegion of China engaged in power generation, coal mining and ferrous alloy production, for ¥16.4billion in the Mineral & Metal Resources Segment;
— additional investment to combine United Kingdom power generating assets with InternationalPower plc for ¥22.2 billion in the Machinery & Infrastructure Projects Segment; and
138

— additional investment in the Tangguh LNG project for ¥7.8 billion in the Energy Segment.
• A total of ¥282.1 billion was paid out for property leased to others and property and equipment; andproceeds of ¥115.8 billion were provided form sales of property leased to others and property andequipment. As a result, net cash outflows were ¥166.2 billion. Major purchases of equipment included:
— acquisition of property and equipment for the oil and gas projects of the Enfield and Vincent oilfield in Australia, Tui oil field in New Zealand, oil and gas projects in Oman, and oil and gasprojects offshore in the Gulf of Mexico as well as oil and gas projects by Mitsui Oil ExplorationCo., Ltd. in total for ¥80.3 billion; and for the coal mining projects in Australia for ¥35.3 billion inthe Energy Segment; and
— acquisition of property and equipment for the iron ore mining projects in Australia for ¥26.3 billionin the Mineral & Metal Resources Segment.
Major divestitures of assets included:
— sales of whole oil and gas producing interests at Wandoo Petroleum Pty Limited (Australia)amounting to ¥35.0 billion in the Energy Segment; and
— net proceeds from the sales of the rolling stock for lease amounted to ¥11.0 billion (net of additionsof those assets) at rolling stock leasing subsidiaries in the Machinery & Infrastructure ProjectsSegment.
• A total of ¥194.2 billion was paid out for acquisitions of available-for-sale and other investments, whileproceeds of ¥107.4 billion were received from sales of those securities. As a result, net cash outflowswere ¥86.8 billion. For the year ended March 31, 2008, cash outflows and inflows in connection withdebt securities for the purpose of corporate fund management were marginal compared to the past fiscalyears. Major transactions for expenditure included:
— additional investment in Sakhalin Energy Investment for ¥45.7 billion in the Energy Segment;
— purchases of shares in Yamaha Motor Co., Ltd. for ¥24.3 billion (except for loss on write-down) andpreferred stock in Japan Airlines Co., Ltd. for ¥20.0 billion in the Machinery & InfrastructureProjects Segment
— shares and bonds of Central Finance Co., Ltd. for ¥19.4 billion (except for loss on write-down) inthe Logistics & Financial Markets Segment.
On the other hand, we obtained cash through the sales of shares in Empreendimentos Brasileiros deMineração S.A. for ¥13.8 billion and in Toho Titanium Co., Ltd. for ¥11.2 billion in the Mineral &Metal Resources Segment.
• A total of ¥52.2 billion was used for acquisitions of subsidiaries (net of cash held by the acquiredsubsidiary), including the acquisition of Steel Technologies Inc. for ¥45.0 billion in the AmericasSegment. On the other hand, a total of ¥106.3 billion was provided from sales of subsidiaries (net ofcash held by the divested subsidiary), including the sale of Sesa Goa for ¥92.8 billion in the Mineral &Metal Resources Segment.
139

Compared to the year ended March 31, 2007, cash flows used in investing activities for the year endedMarch 31, 2008 decreased significantly by ¥313.2 billion. Major reasons for the improvement were proceeds fromthe divestitures of Sakhalin Energy Investment Company Ltd. and Sesa Goa for the year ended March 31, 2008.
Cash Flows from Financing Activities
Net cash used in financing activities for the year ended March 31, 2008 was ¥185.1 billion. Major factorswere as below:
• Net cash outflows from short-term debt amounted to ¥148.8 billion mainly due to increased repaymentof short-term debt at overseas financial subsidiaries. Proceeds from long-term debt were ¥37.4 billion(net of repayments of long-term debt).
• Dividends paid by Mitsui totaled ¥72.1 billion.
Compared to the year ended March 31, 2007, net cash raised by financing activities for the year endedMarch 31, 2008 decreased by ¥457.4 billion, reflecting decreases in net cash from both short term and long termdebt from the year ended March 31, 2007. See also “Funding Sources” above, for details of our fund procurementfor the year ended March 31, 2008.
Cash Flows during the Year Ended March 31, 2007
Cash Flows from Operating Activities
Net cash provided by operating activities for the year ended March 31, 2007 was ¥239.3 billion. Majorcomponents were:
• Operating income which increased steadily in the Mineral & Metal Resources Segment, the EnergySegment, the Machinery & Infrastructure Projects Segment and other segments;
• Dividends received totaling ¥160.1 billion from our mineral resources and energy related associatedcompanies such as Japan Australia LNG (MIMI) Pty. Ltd. (Australia), Valepar S.A. (Brazil), and otherMiddle Eastern LNG companies, as well as our investments in third parties; and
• Payments of ¥99.1 billion for corporate income taxes.
In addition, during the year ended March 31, 2007, the changes in operating assets and liabilities, especiallya significant increase in trade receivables gave a negative impact of ¥133.3 billion on cash flows from operatingactivities in the Statements of Consolidated Cash Flows. Refer to the relevant discussion in “Assets, Liabilitiesand Shareholders’ Equity.”
140

Net cash provided by operating activities increased by ¥92.9 billion for the year ended March 31, 2007 fromthe year ended March 31, 2006. The reasons for this increase were operating income which increased mainly inthe Mineral & Metal Resources Segment and the Energy Segment as well as increased dividend income.
Cash Flows from Investing Activities
Net cash used in investing activities for the year ended March 31, 2007 was ¥418.0 billion. The principaldetails are as follows:
• A total of ¥222.4 billion was paid out for investments in and advances to associated companies, andproceeds of ¥34.3 billion were collected from sales of investments in and collection of advances toassociated companies. As a result, net cash outflows were ¥188.1 billion. The major factors are asbelow:
— Investment in preferred stock of Sakhalin Energy Investment Company Ltd. (Bermuda) for ¥107.8billion in the Energy Segment; and
— Expenditure for Greenfield Energy Center LP (Canada) for ¥11.4 billion, acquisition of shares inAsahi Tec Corporation (Japan) for ¥11.8 billion, acquisition of gas distribution operations in Brazilfor ¥10.3 billion and acquisition of shares in Toyo Engineering Corporation (Japan) for ¥10.3 billionin the Machinery & Infrastructure Projects Segment.
As a major sale of investment, Mitsui obtained ¥16.5 billion through the sale of shares in Toho TitaniumCo., Ltd. (Japan).
• A total of ¥327.4 billion was paid for additions to property leased to others and property and equipment,and proceeds of ¥52.8 billion was provided from sales of property leased to others and property andequipment. As a result, net cash outflows were ¥274.6 billion. The major factors are as below:
— Payment of ¥53.8 billion for the acquisition of the oil and gas project in the offshore Gulf of Mexico;and payment in total of ¥36.8 billion for the acquisition of property and equipment for the oil and gasprojects of the Enfield and Vincent oil field in Australia, Tui oil field in New Zealand and oil andgas project in Oman in the Energy Segment;
— Payment of ¥57.8 billion for the acquisition of property and equipment for the iron ore and coalmining projects in Australia in the Mineral & Metal Resources Segment; and
— Payment in total of ¥71.0 billion for additions to and proceeds of ¥18.7 billion in total from sales ofrolling stock for lease in the Machinery & Infrastructure Projects Segment.
• A total of ¥236.8 billion was used for the acquisition of available-for-sale and held-to-maturitysecurities and other investments, and proceeds of ¥227.6 billion were received from sales of securities.As a result, net cash outflows were ¥9.2 billion. Cash outflows and inflows in connection with debtsecurities include payment of ¥84.1 billion for acquisition and proceeds of ¥125.0 billion from sales andredemption for the purpose of corporate fund management. Other major factors were:
— acquisition of shares of Recruit Co., Ltd. for ¥27.0 billion in the Lifestyle, Consumer Service andInformation, Electronics & Telecommunication Segment; and
— investment in the partnership which owns Skylark Co., Ltd. for ¥10.0 billion in the Logistics &Financial Markets Segment.
• A total of ¥11.5 billion, net of cash acquired, was used for acquisitions of subsidiaries. Major factorsinclude acquisitions of a rolling stock leasing company, Siemens Dispolok GmbH (Germany), and a gasdistribution company, Gas Participacoes Ltda. (Brazil), in the Machinery & Infrastructure ProjectsSegment, and a salt field development company, Salt Asia Holdings Pty. Ltd. (Australia), in theChemical Segment. On the other hand, there was a ¥37.3 billion positive effect, net of cash used in theacquisition, resulting from the acquisition of Mitsui Oil Exploration Co., Ltd.
141

Cash flows used in investing activities for the year ended March 31, 2007 increased by ¥70.7 billion fromthe year ended March 31, 2006. Major factors in investing cash flows for the year ended March 31, 2006included an investment of ¥83.5 billion in the preferred stock of Sakhalin Energy Investment Company Ltd.(Bermuda), ¥50.0 billion in shares of Seven & i Holdings Co., Ltd. and ¥35.8 billion in iron ore and coal miningprojects in Australia.
Cash Flows from Financing Activities
Net cash provided by financing activities for the year ended March 31, 2007 was ¥272.3 billion. Majorfactors were as below:
• Net cash inflows from short-term debt amounted to ¥70.8 billion due to increase of short-term debt atoverseas financial subsidiaries. Net of proceeds from and repayments of long-term debt were ¥239.1billion. Mitsui increased long-term corporate bonds and borrowings from financial institutions inresponse to the above-mentioned investing activities.
• Dividend paid by Mitsui totaled ¥53.4 billion.
Net cash provided by financing activities for the year ended March 31, 2007 increased by ¥180.0 billionfrom the year ended March 31, 2006. We procured higher levels of short-term and long-term funds for the yearended March 31, 2007, whereas Mitsui raised ¥203.8 billion (net of stock issuance costs before taxes) from thepublic offering of 130 million shares in February 2006 and the third party allotment of 9.75 million shares inMarch 2006 for the year ended March 31, 2006. Refer to Funding Sources above, for details of our fundprocurement for the year ended March 31, 2007.
C. Research & Development
For the year ended March 31, 2008, research and development (“R&D”) expenses for the various R&Dactivities underway totaled ¥4.0 billion, which included ¥2.2 billion in the Chemical Segment related tonanotechnology, biotechnology and life science and ¥1.0 billion in the Foods & Retail Segment.
Management recognizes that individual R&D activity will not have a significant impact on our futureoperating results.
For the years ended March 31, 2007 and 2006, R&D expenses were ¥3.9 billion and ¥5.1 billion,respectively, including ¥2.3 billion and ¥3.4 billion expenditure by the Chemical Segment, respectively.
D. Trend Information
See relevant discussion elsewhere in this item.
E. Off-Balance Sheet Arrangements
We use off-balance sheet arrangements in the ordinary course of business to further our trading, fund-raisingand other activities. Categories of off-balance sheet arrangements are as follows:
Guarantees
The following tables summarize our guarantees as of March 31, 2008 and 2007.
The maximum potential amount of future payments represents the amount without consideration of possiblerecoveries under recourse provision or from collateral held or pledged that we could be obliged to pay if therewere defaults by guaranteed parties or there were changes in an underlying which would cause triggering events
142

under market value guarantees and indemnification contracts. Such amounts bear no relationship to theanticipated losses on these guarantees and indemnifications, and they greatly exceed anticipated losses.Estimated proceeds from collateral and recourse represent the anticipated values of assets we could liquidate orreceive from other parties to offset our payments under guarantees. The carrying amounts of liabilities recordedon the Consolidated Balance Sheets reflect our best estimate of future payments we may incur as part of fulfillingour guarantee obligations.
Billions of Yen
As of March 31, 2008:
Maximumpotential amount of
future payments
Recourseprovisions/collateral
Carryingamount ofliabilities
Financial Guarantees . . . . . . . . . . . . . . . . . . . . . . . . . . . . . . . . . . . . . . . . ¥216 ¥20 ¥ 3Performance Guarantees . . . . . . . . . . . . . . . . . . . . . . . . . . . . . . . . . . . . . . 20 5 1Market Value Guarantees . . . . . . . . . . . . . . . . . . . . . . . . . . . . . . . . . . . . . 67 43 —
Billions of Yen
As of March 31, 2007:
Maximumpotential amount of
future payments
Recourseprovisions/collateral
Carryingamount ofliabilities
Financial Guarantees . . . . . . . . . . . . . . . . . . . . . . . . . . . . . . . . . . . . . . . . ¥213 ¥26 ¥ 5Performance Guarantees . . . . . . . . . . . . . . . . . . . . . . . . . . . . . . . . . . . . . . 25 5 0Market Value Guarantees . . . . . . . . . . . . . . . . . . . . . . . . . . . . . . . . . . . . . 58 42 —
In the furtherance of our trading activities, it is a customary practice for us to guarantee, severally or jointlywith others, indebtedness of certain of our customers and suppliers and of certain associated companies as well asto guarantee the performance of contracts by such entities.
As lessees in operating lease contracts, certain subsidiaries have issued residual value guarantees of leasedocean transport vessels, and on the date of expiration of operating lease contracts, such subsidiaries will eitherpurchase the leased assets at a fixed price or will be responsible for making up any shortfall between the actualsales price and the guaranteed value. In accordance with FASB Interpretation No. 46, “Consolidation of VariableInterest Entities (revised December 2003)-an Interpretation of ARB No. 51” on December 31, 2003, weconsolidated ¥12.2 billion and ¥20.3 billion of total assets related to certain ocean transport vessels entities atMarch 31, 2008 and 2007, respectively. This information is provided in Note 23, “VARIABLE INTERESTENTITIES.”
Sales of Trade Receivables
At March 31, 2008 and 2007, the outstanding amounts of off-balance sheet arrangements in which certaintrade receivables are sold to third parties were immaterial.
Variable Interest Entities
We are involved with and have significant variable interests in a number of variable interest entities(“VIEs”) that are not consolidated because we are not the primary beneficiary, but in which we have significantvariable interests. These VIEs mainly engage in leasing and financing activities. Further information is providedin Note 23, “VARIABLE INTEREST ENTITIES.”
Commitments on Deferred Payments
We had no financing commitments at March 31, 2008. We had financing commitments totaling ¥2.3 billionat March 31, 2007, principally for financing, on a deferred-payment basis, the cost of ocean transport vessels andequipment to be purchased by our customers.
143

F. Tabular Disclosure of Contractual Obligations
The following table provides our contractual obligations as of March 31, 2008 and payment due by periodof these contractual obligations:
Billions of Yen
Payment Due by Period
Contractual ObligationsBalance as of
March 31, 2008March2009
March2011
March2013
AfterMarch 2013
Long-Term Debt(1) . . . . . . . . . . . . . . . . . . . . . . . . . . . . . . ¥3,171 ¥ 268 ¥ 672 ¥ 624 ¥1,607Capital Lease Obligations(2) . . . . . . . . . . . . . . . . . . . . . . . 36 7 14 7 8Operating Leases(3) . . . . . . . . . . . . . . . . . . . . . . . . . . . . . . 153 32 48 30 43Purchase Obligations(4) . . . . . . . . . . . . . . . . . . . . . . . . . . . 5,262 1,095 1,661 947 1,559
Total . . . . . . . . . . . . . . . . . . . . . . . . . . . . . . . . . . . . . ¥8,622 ¥1,402 ¥2,395 ¥1,608 ¥3,217
(1) The amounts of “Long-Term Debt” include bank borrowings, bonds and long-term trade payables,excluding the effect of the SFAS No. 133 fair value adjustment and capital lease obligations (present valueof net minimum lease payments).
(2) “Capital Lease Obligations” represents the schedule of payments for future minimum lease payments.(3) “Operating Leases” represents the schedule of payments for future minimum rentals. Minimum rental
payments have not been reduced by minimum sublease rentals of ¥48.1 billion due in the future undernoncancelable subleases.
(4) “Purchase Obligations” represents the schedule of payments for long-term purchase obligations, net ofadvance payments of ¥141 billion made to suppliers as of March 31, 2008
For additional information regarding long-term debt, capital lease obligations and operating leases, seeNote 13, “SHORT-TERM AND LONG-TERM DEBT,” and Note 8, “LEASES,” respectively.
In addition to the above, we plan to contribute ¥4.8 billion to our defined benefit pension plans for the yearending March 31, 2009.
The table above excludes estimated interest payments on debt and estimated payments under interest swap.Total cash paid for interest during the year ended March 31, 2008 was ¥110.0 billion.
The table above also excludes unrecognized tax benefits of ¥8.3 billion. Unrecognized tax benefits classifiedas current liabilities are merely ¥0.3 billion. The timing of future cash outflows associated with unrecognized taxbenefits classified as non current liabilities is highly uncertain.
We conclude various long-term purchase contracts of commodities, principally ocean transport vessels, oilproducts, chemical materials, metals and machinery and equipment, either at fixed prices or at basic purchaseprices adjustable to the market. In general, our customers, primarily large Japanese industrial companies andshipping firms, are also parties to the contracts or by separate agreements and are committed to purchase theitems from us. Therefore, management does not recognize that these long-term purchase contracts could haveseriously adverse effects on our future liquidity. As of March 31, 2008, outstanding balances of purchasecontracts which have unconditional payment conditions are insignificant.
Item 6. Directors, Senior Management and Employees.
A. Directors and Senior Management.
We are managed by a Board of Directors and Executive Officers. As of June 24, 2008, we have thirteenDirectors and forty-two Executive Officers including eight who are also Directors. In accordance with Mitsui’sArticles of Incorporation, each Director was elected for a term of one year. Each Executive Officer has beenappointed by the Board of Directors.
144

The Board of Directors is our decision-making body. The Board of Directors determines our basicguidelines and policies by establishing our corporate strategy, reviewing our business plans, and supervising andmonitoring the activities of our Executive Officers.
The Executive Officers are responsible for the execution of our corporate activities. They must follow andenforce the general guidelines and policies established by the Board of Directors and Mitsui’s Articles ofIncorporation.
As of June 24, 2008, Mitsui’s Executive Officers consisted of one President, six Executive Vice Presidents,one Senior Executive Managing Officer, thirteen Executive Managing Officers and twenty-one Managing Officers.
The execution of the Directors’ functions (including their functions to supervise and monitor the activitiesof the Executive Officers) is audited by Corporate Auditors. Each Corporate Auditor is elected by shareholders ofMitsui at a general meeting of shareholders. As of June 24, 2008, we have seven Corporate Auditors. Inperforming their auditing activities, they act independently of each other while they are constituted, and actthrough the Board of Corporate Auditors, as the Corporate Law of Japan requires.
Directors, Corporate Auditors and Executive Officers
Our Directors, Corporate Auditors and Executive Officers as of June 24, 2008 were:
Directors
Name Position
Nobuo Ohashi . . . . . . . . . . . . . . . . . . Chairman and DirectorShoei Utsuda . . . . . . . . . . . . . . . . . . . Representative DirectorToshihiro Soejima . . . . . . . . . . . . . . . Representative DirectorMotokazu Yoshida . . . . . . . . . . . . . . Representative DirectorKen Abe . . . . . . . . . . . . . . . . . . . . . . Representative DirectorYoshiyuki Izawa . . . . . . . . . . . . . . . . Representative DirectorJunichi Matsumoto . . . . . . . . . . . . . . Representative DirectorMasami Iijima . . . . . . . . . . . . . . . . . . Representative DirectorSeiichi Tanaka . . . . . . . . . . . . . . . . . . Representative DirectorAkishige Okada(1) . . . . . . . . . . . . . . . DirectorNobuko Matsubara(1) . . . . . . . . . . . . . DirectorIkujiro Nonaka(1) . . . . . . . . . . . . . . . . DirectorHiroshi Hirabayashi(1) . . . . . . . . . . . . Director
(1) Mr. Akishige Okada, Ms. Nobuko Matsubara, Mr. Ikujiro Nonaka and Mr. Hiroshi Hirabayashi are externaldirectors. See “Item 6.C. Board Practices.”
Corporate Auditors
Name Position
Tasuku Kondo(2) . . . . . . . . . . . . . . . . Corporate AuditorSatoru Miura(2) . . . . . . . . . . . . . . . . . Corporate AuditorMotonori Murakami(2) . . . . . . . . . . . Corporate AuditorKo Matsukata(3) . . . . . . . . . . . . . . . . . Corporate AuditorHideharu Kadowaki(3) . . . . . . . . . . . Corporate AuditorNaoto Nakamura(3) . . . . . . . . . . . . . . Corporate AuditorKunihiro Matsuo(3) . . . . . . . . . . . . . . Corporate Auditor
(2) Mr. Tasuku Kondo, Mr. Satoru Miura and Mr. Motonori Murakami are full-time Corporate Auditors.(3) Mr. Ko Matsukata, Mr. Hideharu Kadowaki, Mr. Naoto Nakamura and Mr. Kunihiro Matsuo are external
Corporate Auditors. See “Item 6.C. Board Practices.”
145

Executive Officers
Name Title and Principal Position
Shoei Utsuda . . . . . . . . . . . . . . . . . . . President and Chief Executive Officer; Chairman of Internal ControlsCommittee
Yasunori Yokote . . . . . . . . . . . . . . . . Executive Vice President; Chief Operating Officer of Americas BusinessUnit
Toshihiro Soejima . . . . . . . . . . . . . . . Executive Vice President; Motor Vehicles Business Unit; Marine &Aerospace Business Unit; First Consumer Service Business Unit; SecondConsumer Service Business Unit; IT Business Unit
Motokazu Yoshida . . . . . . . . . . . . . . Executive Vice President; Chief Information Officer; Corporate StaffDivision (Information Strategic Planning Division, Corporate Planning &Strategy Division, Corporate Communication Division, CSR PromotionDivision); New Business Promotion; Environmental Matters; Chairmanof CSR Promotion Committee
Ken Abe . . . . . . . . . . . . . . . . . . . . . . Executive Vice President; Iron & Steel Products Business Unit;Infrastructure Projects Business Unit; Financial Markets Business Unit;Transportation Logistics Business Unit; Director of Mitsui & Co.(U.S.A), Inc.
Yoshiyuki Izawa . . . . . . . . . . . . . . . . Executive Vice President; First Chemicals Business Unit; SecondChemicals Business Unit; Foods & Retail Business Unit; DomesticOffices and Branches; Director of Mitsui & Co. Europe Holdings PLC;Chairman of Portfolio Management Committee
Junichi Matsumoto . . . . . . . . . . . . . . Executive Vice President; Chief Financial Officer; Chief ComplianceOfficer; Corporate Staff Division (Investor Relations Division,Investment Administration Division, First Business Process ControlDivision, Second Business Process Control Division, Third BusinessProcess Control Division, Accounting Division, Finance Division, CreditRisk Management Division, Market Risk Management Division,Financial Planning Division); Chairman of Compliance Committee;Chairman of Disclosure Committee
Toshimasa Furukawa . . . . . . . . . . . . Senior Executive Managing Officer; Chief Operating Officer of AsiaPacific Business Unit
Masami Iijima . . . . . . . . . . . . . . . . . . Executive Managing Officer; Mineral & Metal Resources Business Unit;Energy Business Unit I; Energy Business Unit II
Seiichi Tanaka . . . . . . . . . . . . . . . . . . Executive Managing Officer; Chief Privacy Officer; Corporate StaffDivision (Secretariat, Corporate Auditor Division, Human Resources &General Affairs Division, Legal Division, Logistics ManagementDivision); Business Continuity Plan Management; Director of Mitsui &Co. (Asia Pacific) Pte. Ltd.
Shinjiro Ogawa . . . . . . . . . . . . . . . . . Executive Managing Officer; Chief Representative of Mitsui & Co., Ltd.in China
Jitsuro Terashima . . . . . . . . . . . . . . . Executive Managing Officer; President & CEO of Mitsui GlobalStrategic Studies Institute
Koji Nakamura . . . . . . . . . . . . . . . . . Executive Managing Officer; General Manager of Osaka Office
Kenichi Yamamoto . . . . . . . . . . . . . . Executive Managing Officer; Chief Operating Officer of First ConsumerService Business Unit
Toshio Awata . . . . . . . . . . . . . . . . . . Executive Managing Officer; General Manager of Nagoya Office
Kiyotaka Watanabe . . . . . . . . . . . . . . Executive Managing Officer; General Manager of Kyushu Office
Masaaki Fujita . . . . . . . . . . . . . . . . . . Executive Managing Officer; Chief Operating Officer of Foods & RetailBusiness Unit
146

Name Title and Principal Position
Junichi Mizonoue . . . . . . . . . . . . . . . Executive Managing Officer; Chief Operating Officer of SecondChemicals Business Unit
Takao Omae . . . . . . . . . . . . . . . . . . . Executive Managing Officer; Chief Operating Officer of InfrastructureProjects Business Unit
Norinao Iio . . . . . . . . . . . . . . . . . . . . Executive Managing Officer; Chief Operating Officer of EMEA (Europe,the Middle East and Africa) Business Unit
Hideyo Hayakawa . . . . . . . . . . . . . . . Executive Managing Officer; General Manager of Internal AuditingDivision
Masaaki Murakami . . . . . . . . . . . . . . Managing Officer; President of Mitsui & Co. Korea Ltd.
Osamu Koyama . . . . . . . . . . . . . . . . . Managing Officer; Deputy Chief Operating Officer of Americas BusinessUnit
Terukazu Okahashi . . . . . . . . . . . . . . Managing Officer; Deputy General Manager of Osaka Office
Osamu Takahashi . . . . . . . . . . . . . . . Managing Officer; Chief Operating Officer of IT Business Unit
Shigeru Hanagata . . . . . . . . . . . . . . . Managing Officer; Chief Operating Officer of Motor Vehicles BusinessUnit
Masayoshi Komai . . . . . . . . . . . . . . . Managing Officer; Chief Operating Officer of Marine & AerospaceBusiness Unit
Katsumi Ogawa . . . . . . . . . . . . . . . . . Managing Officer; Chief Operating Officer of Financial MarketsBusiness Unit
Akio Yamamoto . . . . . . . . . . . . . . . . Managing Officer; President of Mitsui & Co. (Thailand) Ltd.
Yoshinori Setoyama . . . . . . . . . . . . . Managing Officer; Chief Operating Officer of First Chemicals BusinessUnit
Noriaki Sakamoto . . . . . . . . . . . . . . . Managing Officer; President of Mitsui & Co. (Canada) Ltd.
Masahiko Okamura . . . . . . . . . . . . . . Managing Officer; Chief Operating Officer of Second Consumer ServiceBusiness Unit
Fuminobu Kawashima . . . . . . . . . . . Managing Officer; Chief Operating Officer of Energy Business Unit I
Masaaki Iida . . . . . . . . . . . . . . . . . . . Managing Officer; Chief Operating Officer of Transportation LogisticsBusiness Unit
Joji Okada . . . . . . . . . . . . . . . . . . . . . Managing Officer; General Manager of Accounting Division
Takashi Fukunaga . . . . . . . . . . . . . . . Managing Officer; Deputy Operating Officer of EMEA (Europe, theMiddle East and Africa) Business Unit
Takashi Yamauchi . . . . . . . . . . . . . . Managing Officer; Chief Operating Officer of Iron & Steel ProductsBusiness Unit
Shuji Nakura . . . . . . . . . . . . . . . . . . . Managing Officer; General Manager of Investment AdministrationDivision
Mitsuhiko Kawai . . . . . . . . . . . . . . . . Managing Officer; Chief Operating Officer of Energy Business Unit II
Daisuke Saiga . . . . . . . . . . . . . . . . . . Managing Officer; General Manager of Human Resources & GeneralAffairs Division
Masayuki Kinoshita . . . . . . . . . . . . . Managing Officer; Chief Operating Officer of Mineral & MetalResources Business Unit
Atsushi Ooi . . . . . . . . . . . . . . . . . . . . Managing Officer; Chairman & Managing Director of Mitsui & Co.(Australia) Ltd.
147

The date of birth, the current position and the prior positions of our Directors and Corporate Auditors isprovided below.
DirectorsName Nobuo OhashiDate of Birth September 13, 1938Current Position Chairman and Director (since April 1, 2004)Prior Positions • 1994 A member of Board of Directors (Director, General Manager of Seoul
Branch)• 1997 Representative Director, Executive Managing Director, Chief Operating
Officer of Foods Unit• 1999 Representative Director, Senior Executive Managing Director, General
Manager of Corporate Planning Division• 2000 Representative Director, Executive Vice President• 2002/4 Representative Director, Executive Vice President, Group President of
Consumer Products & Services Group• 2002/10 Representative Director, Chairman and Executive Director
Name Shoei UtsudaDate of Birth February 12, 1943Current Position Representative Director, President and Chief Executive Officer (since October 1, 2002)Prior Positions •1997 A member of Board of Directors (Director, General Manager of
Machinery, Information Industries Administrative Division)•2000 Representative Director, Executive Managing Director, General Manager
of Corporate Planning Division•2002/4 Representative Director, Senior Executive Managing Officer, Chief
Strategic Officer (Responsible for Administrative Division), ChiefOperating Officer of Business Process Re-Engineering Project
Name Toshihiro SoejimaDate of Birth November 10, 1946Current Position Representative Director, Executive Vice President (since June 22, 2007)Prior Positions • 2001 A member of Board of Directors (Director, Chief Operating Officer of
Electronics Device Business Unit)• 2002 Director, Senior Managing Officer, Chief Operating Officer of
Electronics Device Business Unit, Machinery, Electronics & InformationGroup
• 2003 Senior Managing Officer, General Manager of Corporate Planning &Strategy Division
• 2004 Executive Managing Officer, Executive Chief Representative ofMitsui & Co., Ltd. in China
• 2005 Senior Executive Managing Officer, Executive Chief Representative ofMitsui & Co., Ltd. in China
• 2007/4 Executive Vice President
148

Name Motokazu YoshidaDate of Birth January 7, 1948Current Position Representative Director, Executive Vice President, Chief Information Officer, Chairman
of CSR Promotion Committee (since April 1, 2008)Prior Positions • 2001 A member of Board of Directors (Director, Chief Operating Officer of
Motor Vehicles, Marine & Aerospace Business Unit)• 2002 Director, Senior Managing Officer, Chief Operating Officer of Motor
Vehicles, Marine & Aerospace Business Unit, Machinery, Electronics &Information Group
• 2003 Executive Managing Officer, Chief Operating Officer of Motor Vehicles,Marine & Aerospace Business Unit
• 2005/4 Executive Managing Officer, Chairman for the Americas• 2005/10 Senior Executive Managing Officer and Chairman for the Americas• 2007/4 Senior Executive Managing Officer, Chief Information Officer, Chief
Operating Officer of Business Process Re-Engineering Project• 2007/6 Representative Director, Senior Executive Managing Officer, Chief
Information Officer, Chief Operating Officer of Business Process Re-Engineering Project
Name Ken AbeDate of Birth September 19, 1947Current Position Representative Director, Executive Vice President, Director of Mitsui & Co. (U.S.A),
Inc. (since June 24, 2008)Prior Positions • 2002 Managing Officer, General Manager of Metals Administrative Division
• 2003 Managing Officer, Chief Operating Officer of Iron & Steel RawMaterials Unit
• 2004 Executive Managing Officer, Chief Operating Officer of Iron & SteelRaw Materials and Non-Ferrous Metals Business Unit
• 2006 Senior Executive Managing Officer, Chief Operating Officer of EuropeBusiness Unit
• 2007 Senior Executive Managing Officer, Chief Operating Officer of Europe,the Middle East and Africa Business Unit
• 2008/4 Executive Vice President, Director of Mitsui & Co. (U.S.A), Inc.
Name Yoshiyuki IzawaDate of Birth February 10, 1948Current Position Representative Director, Executive Vice President, Director of Mitsui & Co. Europe
Holdings PLC (since April 1, 2008)Prior Positions • 2000 A member of Board of Directors (Director, Chief Operating Officer of
Information Business Unit)• 2002 Director, Senior Managing Officer, Chief Operating Officer of
Information Business Unit, Machinery, Electronics & Information Group• 2004 Executive Managing Officer, General Manager of Osaka Office• 2007/4 Senior Executive Managing Officer, Director of Mitsui & Co. Europe
PLC• 2007/6 Representative Director; Senior Executive Managing Officer, Director of
Mitsui & Co. Europe Holdings PLC
149

Name Junichi MatsumotoDate of Birth September 25, 1947Current Position Representative Director, Executive Vice President, Chief Financial Officer, Chief
Compliance Officer (since April 1, 2008)Prior Positions • 2002 Managing Officer, General Manager of Corporate Planning Division
• 2003 Managing Officer, Deputy Chief Representative of Mitsui & Co., Ltd. inChina
• 2004 Managing Officer, Chief Operating Officer of Transportation LogisticsBusiness Unit
• 2005 Executive Managing Officer, Chief Operating Officer of TransportationLogistics Business Unit
• 2007/4 Senior Executive Managing Officer, Chief Compliance Officer, ChiefPrivacy Officer
• 2007/6 Representative Director; Senior Executive Managing Officer, ChiefCompliance Officer, Chief Privacy Officer
Name Masami IijimaDate of Birth September 23, 1950Current Position Representative Director, Executive Managing Officer (since June 24, 2008)Prior Positions • 2006 Managing Officer, Chief Operating Officer of Iron & Steel Raw
Materials and Non-Ferrous Metals Business Unit• 2007 Managing Officer, Chief Operating Officer of Mineral & Metal
Resources Business Unit• 2008/4 Executive Managing Officer
Name Seiichi TanakaDate of Birth January 12, 1953Current Position Representative Director, Executive Managing Officer, Chief Privacy Officer, Director
of Mitsui & Co. (Asia Pacific) Pte. Ltd. (since June 24, 2008)Prior Positions • 2006 Managing Officer, General Manager of Human Resources & General
Affairs Division• 2008/4 Executive Managing Officer, Chief Privacy Officer, Director of Mitsui &
Co. (Asia Pacific) Pte. Ltd.
Name Akishige OkadaDate of Birth April 9, 1938Current Position Director (since June 27, 2003)Principal Positions at Business Organizations Outside Mitsui
Director, Daicel Chemical Industries, Ltd.Corporate Auditor, Hotel Okura Co., Ltd.Corporate Auditor, Toyota Motor CorporationCorporate Auditor, Mitsui Fudosan Co., Ltd.
Prior Positions • 1991 Director, The Mitsui Taiyo Kobe Bank, Ltd.• 1995 Managing Director, The Sakura Bank, Ltd.• 1996 Senior Managing Director, The Sakura Bank, Ltd.• 1997 President, The Sakura Bank, Ltd.• 1999 President and Managing Director, The Sakura Bank, Ltd.• 2001 Chairman of the Board, Sumitomo Mitsui Banking Corporation• 2002 Chairman of the Board, Sumitomo Mitsui Financial Group, Inc.• 2003 Chairman of the Board, Sumitomo Mitsui Banking Corporation• 2005 Advisor, Sumitomo Mitsui Banking Corporation
150

Name Nobuko MatsubaraDate of Birth January 9, 1941Current Position Director (since June 23, 2006)Principal Positions at Business Organizations Outside Mitsui
Director, Daiwa Securities Group Inc.Prior Positions • 1987 Director of International Labor Division, Minister’s Secretariat, the
Ministry of Labor• 1991 Director-General of Women’s Bureau, the Ministry of Labor• 1997 Vice Minister of the Ministry of Labor• 1999 President of Japan Association for Employment of Persons with
Disabilities• 2002/9 Ambassador Extraordinary and Plenipotentiary of Japan to Italy• 2002/11 Ambassador Extraordinary and Plenipotentiary of Japan to Albania, to
San Marino and to Malta• 2006/1 Advisor to Japan Institute of Workers’ Evolution• 2006/7 Chairman of Japan Institute of Workers’ Evolution
Name Ikujiro NonakaDate of Birth May 10, 1935Current Position Director (since June 22, 2007)Principal Positions at Business Organizations Outside Mitsui
Director, Fujitsu LimitedDirector, Eisai Co., LimitedDirector, Seven & i Holdings Co., Ltd.
Prior Positions • 1977 Professor, Management Faculty, Nanzan University• 1979 Professor, National Defense Academy of Japan• 1982 Professor, Institute of Business Research, Hitotsubashi University• 1995 Professor, Graduate School of Knowledge Science, JAIST• 1997 Xerox Distinguished Professor in Knowledge, Walter A, Haas School of
Business, University of California, Berkeley• 2000 Professor, Graduate School of International Corporate Strategy,
Hitotsubashi University• 2006 Professor Emeritus, Hitotsubashi University• 2007 First Distinguished Drucker Scholar in Residence, Drucker School of
Claremont Graduate University
Name Hiroshi HirabayashiDate of Birth May 5, 1940Current Position Director (since June 22, 2007)Principal Positions at Business Organizations Outside Mitsui
Director, TOSHIBA CORPORATIONPrior Positions • 1988 Director, Management and Coordination Division, Minister’s Secretariat,
the Ministry of Foreign Affairs• 1990 Minister, Japanese Embassy in the U.S.A• 1992 Envoy, Japanese Embassy in the U.S.A• 1993 Director-General, Economic Cooperation Bureau, the Ministry of
Foreign Affairs• 1995 Chief Cabinet Councilor’s Office on External Affairs, Cabinet Secretariat• 1997 Secretary-General, Indo-China Refugees Measures Coordination
Conference• 1998 Ambassador Extraordinary and Plenipotentiary to India and Bhutan• 2002 Ambassador Extraordinary and Plenipotentiary to France and Andorra• 2003 Ambassador Extraordinary and Plenipotentiary to Djibouti• 2006 Ambassador in charge of Inspection, the Ministry of Foreign Affairs• 2007/3 Councilor, The Japan Forum on International Relations, Inc.• 2007/6 President, The Japan-India Association• 2008/4 Visiting Professor, Waseda University, Graduate School of Asia-Pacific
Studies
151
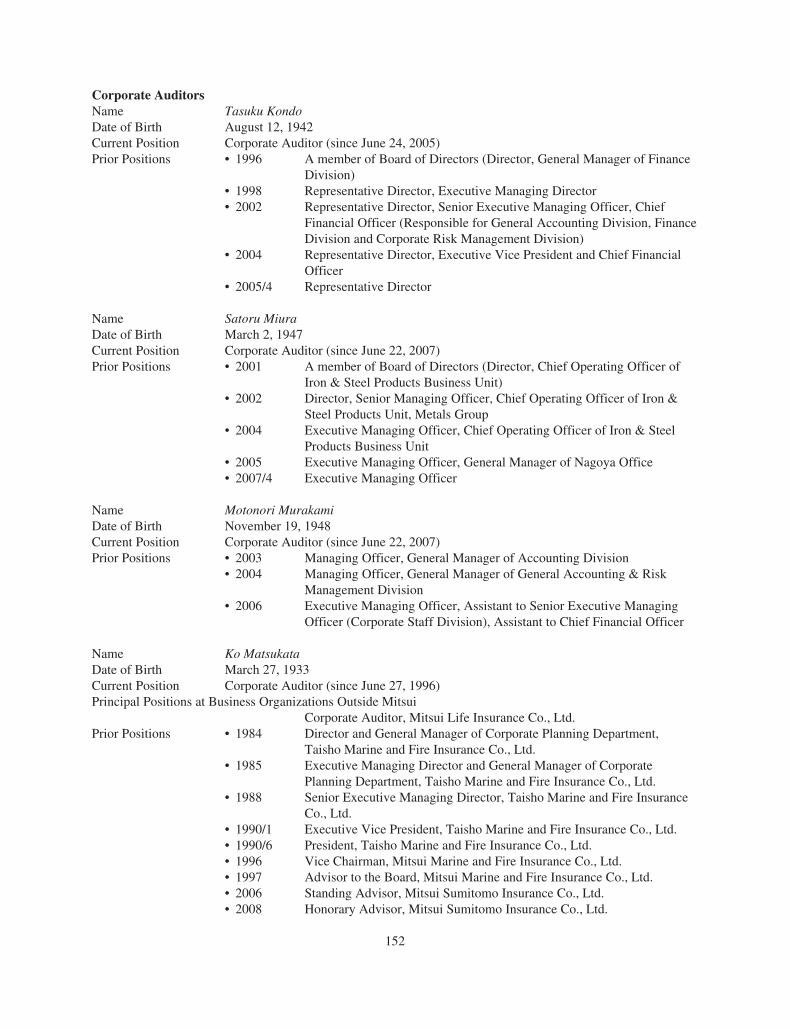
Corporate AuditorsName Tasuku KondoDate of Birth August 12, 1942Current Position Corporate Auditor (since June 24, 2005)Prior Positions • 1996 A member of Board of Directors (Director, General Manager of Finance
Division)• 1998 Representative Director, Executive Managing Director• 2002 Representative Director, Senior Executive Managing Officer, Chief
Financial Officer (Responsible for General Accounting Division, FinanceDivision and Corporate Risk Management Division)
• 2004 Representative Director, Executive Vice President and Chief FinancialOfficer
• 2005/4 Representative Director
Name Satoru MiuraDate of Birth March 2, 1947Current Position Corporate Auditor (since June 22, 2007)Prior Positions • 2001 A member of Board of Directors (Director, Chief Operating Officer of
Iron & Steel Products Business Unit)• 2002 Director, Senior Managing Officer, Chief Operating Officer of Iron &
Steel Products Unit, Metals Group• 2004 Executive Managing Officer, Chief Operating Officer of Iron & Steel
Products Business Unit• 2005 Executive Managing Officer, General Manager of Nagoya Office• 2007/4 Executive Managing Officer
Name Motonori MurakamiDate of Birth November 19, 1948Current Position Corporate Auditor (since June 22, 2007)Prior Positions • 2003 Managing Officer, General Manager of Accounting Division
• 2004 Managing Officer, General Manager of General Accounting & RiskManagement Division
• 2006 Executive Managing Officer, Assistant to Senior Executive ManagingOfficer (Corporate Staff Division), Assistant to Chief Financial Officer
Name Ko MatsukataDate of Birth March 27, 1933Current Position Corporate Auditor (since June 27, 1996)Principal Positions at Business Organizations Outside Mitsui
Corporate Auditor, Mitsui Life Insurance Co., Ltd.Prior Positions • 1984 Director and General Manager of Corporate Planning Department,
Taisho Marine and Fire Insurance Co., Ltd.• 1985 Executive Managing Director and General Manager of Corporate
Planning Department, Taisho Marine and Fire Insurance Co., Ltd.• 1988 Senior Executive Managing Director, Taisho Marine and Fire Insurance
Co., Ltd.• 1990/1 Executive Vice President, Taisho Marine and Fire Insurance Co., Ltd.• 1990/6 President, Taisho Marine and Fire Insurance Co., Ltd.• 1996 Vice Chairman, Mitsui Marine and Fire Insurance Co., Ltd.• 1997 Advisor to the Board, Mitsui Marine and Fire Insurance Co., Ltd.• 2006 Standing Advisor, Mitsui Sumitomo Insurance Co., Ltd.• 2008 Honorary Advisor, Mitsui Sumitomo Insurance Co., Ltd.
152

Name Hideharu KadowakiDate of Birth June 20, 1944Current Position Corporate Auditor (since June 24, 2004)Principal Positions at Business Organizations Outside Mitsui
Corporate Auditor, Mitsui Chemicals, Inc.Prior Positions • 1996 Director, The Sakura Bank Ltd.
• 1998 Managing Director, The Sakura Bank Ltd.• 1999 Managing Director & Executive Managing Officer, The Sakura Bank
Ltd.• 2000 Senior Managing Director and Senior Executive Managing Officer, The
Sakura Bank Ltd.• 2001 Senior Managing Director and Senior Executive Managing Officer, The
Sumitomo Mitsui Banking Corporation• 2002 Senior Managing Director, Sumitomo Mitsui Financial Group, Inc.• 2003 Deputy President, Sumitomo Mitsui Financial Group, Inc.• 2004 Chairman of the Institute, The Japan Research Institute, Limited
Name Naoto NakamuraDate of Birth January 25, 1960Current Position Corporate Auditor (since June 23, 2006)Principal Positions at Business Organizations Outside Mitsui
Corporate Auditor, Asahi Breweries, Ltd.Prior Positions • 1985/4 Admitted to the member of Second Tokyo Bar Association
• 1985/4 Joined Mori Sogo Law Office• 1998 Founded HIBIYA PARK LAW OFFICES and became a partner• 2003/2 Founded Law Firm of Naoto Nakamura (currently Law Firm of
Nakamura, Tsunoda & Matsumoto) and became a partner
Name Kunihiro MatsuoDate of Birth September 13, 1942Current Position Corporate Auditor (since June 24, 2008)Principal Positions at Business Organizations Outside Mitsui
Director, Asahi Glass Co., Ltd.Corporate Auditor, Toyota Motor Corporation
Prior Positions • 1968 Appointment as Public Prosecutor• 1999 Vice Minister of Justice• 2004 Attorney General• 2006 Admission as Attorney at Law
There is no family relationship between any Directors, Corporate Auditors, Executive Officers and anyother persons named above. There is no arrangement or understanding between any of the above and any otherperson pursuant to which they were selected as a Director, a Corporate Auditor or a member of the seniormanagement.
153

B. Compensation.
The aggregate amount of compensation and benefits in kind paid to Directors, Corporate Auditors andExecutive Officers during the year ended March 31, 2008 was ¥4,545 million. A breakdown is provided asbelow.
Directors and Corporate Auditors
The remuneration of Directors and Corporate Auditors totaling ¥1,240 million during the year endedMarch 31, 2008 was as follows.
Number of recipients
Total remuneration paidrelating to the year ended
March 31, 2008
Directors . . . . . . . . . . . . . . . . . . . . . . . . . . . . . . . . . . . . . . . . . . . . . . . 13 ¥1,053 millionCorporate Auditors . . . . . . . . . . . . . . . . . . . . . . . . . . . . . . . . . . . . . . . 7 ¥ 187 million
External Directors and External Corporate Auditors (included inthe above amounts) . . . . . . . . . . . . . . . . . . . . . . . . . . . . . . . . . . . . . 8 ¥ 86 million
Total . . . . . . . . . . . . . . . . . . . . . . . . . . . . . . . . . . . . . . . . . . . . . . . . . . . 20 ¥1,240 million
Notes:i) Limits on remuneration of Directors and Corporate Auditors have been determined by General Meeting of
Shareholders resolutions as follows: for Directors, there is a total limit of ¥70 million per month (byresolution of June 22, 2007); for Corporate Auditors, there is a total limit of ¥20 million per month (byresolution of June 22, 2007).
ii) The above amounts include ¥410 million in bonuses for Directors (excluding external Directors), which wasdetermined by the following system.
Total bonuses for Directors (excluding External Directors) are calculated as the lesser of consolidated netincome x 0.1% and ¥500 million, which is payable to each director in proportionate allocation according topoints given to each Director’s position. The Remuneration Committee reviewed the formula and reported to theBoard of Directors in advance of the Board of Directors’ decision to establish the formula.
Executive Officers
The remuneration of Executive Officers (excluding Executive Officers who are also Directors) totaled¥2,524 million during the year ended March 31, 2008, comprised of ¥997 million in bonuses and ¥1,527 millionin monthly remunerations. The Remuneration Committee also reviews and reports to the Board of Directors onappropriateness of remuneration system and compensation levels for Executive Officers.
Pension Plans and Retirement Allowances
In addition, the aggregate amount of benefits from Directors’ and Corporate Auditors’ Pension Plans andretirement allowances for retiring Directors and Corporate Auditors—accrued prior to the abolition of theretirement allowance system—paid during the year ended March 31, 2008 was ¥781 million.
Our retirement allowance system for Directors and Corporate Auditors was abolished pursuant to aresolution of the Board of Directors in February 2004. Up to this resolution, in accordance with customaryJapanese business practices, a retiring Director or Corporate Auditor was entitled to receive a retirementallowance, which was subject to approval by shareholders at a general meeting of shareholders. The amount ofthe retirement allowance generally reflected the number of years of service, rank at the time of retirement andspecial contributions to our performance. After the abolition of the retirement allowance system, retirementallowances are not paid except for those accrued prior to the abolition.
The aggregate amount set aside by us to provide pension benefits to Directors and Corporate Auditors was¥3,125 million as of March 31, 2008.
154

Mitsui has no stock option plans for Mitsui’s Directors and Senior Management as of June 24, 2008.
C. Board Practices.
The information in “Item 6.A. Directors and Senior Management” is incorporated into this section byreference.
None of our Directors have entered into any service contracts with us providing for benefits upontermination of his or her employment.
The Corporate Law of Japan allows a company to adopt the “Committee System” as the framework forcorporate governance. We have decided, however, to maintain the corporate auditor system because we believethat our Corporate Auditors, of whom three are full-time and four are external Auditors as of March 31, 2008 andwhose functions are legally defined and reinforced, provide adequate auditing functions. Furthermore, internalDirectors are familiar with our business operations and can therefore contribute to effective management.Although we retained the corporate auditor system, we have decided to adopt certain aspects of the CommitteeSystem and have established three committees (the Governance Committee, the Nomination Committee, and theRemuneration Committee) to provide advice to the Board of Directors. In addition, other measures have beentaken, such as shortening the term of Directors and Executive Officers from two years to one year, eliminatingthe retirement allowance, and increasing the number of external Directors.
Functions and Composition of three committees
The functions and composition of three committees are provided as below.
Governance Committee
Assignment : To study the state and direction of Mitsui’s corporate governance
Composition : Chairman (committee chair, Nobuo Ohashi), President (Shoei Utsuda), External Directors 2(Nobuko Matsubara, Ikujiro Nonaka), internal Directors 3 (Motokazu Yoshida, JunichiroMatsumoto, Seiichi Tanaka), External Corporate Auditor 1 (Ko Matsukata)
Nomination Committee
Assignment : To establish the selection standards and processes used in nominating directors and executiveofficers as well as evaluating director nomination proposals
Composition : President (committee chair, Shoei Utsuda), External Directors 2 (Akishige Okada, HiroshiHirabayashi), internal Directors 2 (Motokazu Yoshida, Seiichi Tanaka)
Remuneration Committee
Assignment : To study the system and decision-making process related to remuneration and bonuses fordirectors and executive officers while evaluating remuneration proposals for them
Composition : External Director (committee chair, Akishige Okada), President (Shoei Utsuda), internalDirectors 2 (Junichi Matsumoto, Seiichi Tanaka)
155

Our Directors and Corporate Auditors are elected at the general meeting of shareholders. In accordance withour Articles of Incorporation, the normal term of office for our Directors is one year(1) and for our CorporateAuditors is four years. However, they may both serve any number of consecutive terms. The following tableshows our Directors’, Corporate Auditors’ and Executive Officers’ terms of office and their shareholdings as ofMarch 31, 2008.
Length of TimeServed in Office
(From Appointmentto June 2008)(1)
Shareholdings as ofMarch 31, 2008
Director:Nobuo Ohashi . . . . . . . . . . . . . . . . . . . . . . . . . . . . . . . . . . . . . . . . . . . . . . 14 years 76,081Shoei Utsuda . . . . . . . . . . . . . . . . . . . . . . . . . . . . . . . . . . . . . . . . . . . . . . . 11 years 55,016Toshihiro Soejima . . . . . . . . . . . . . . . . . . . . . . . . . . . . . . . . . . . . . . . . . . . 2 years 18,574Motokazu Yoshida . . . . . . . . . . . . . . . . . . . . . . . . . . . . . . . . . . . . . . . . . . 2 years 14,968Ken Abe . . . . . . . . . . . . . . . . . . . . . . . . . . . . . . . . . . . . . . . . . . . . . . . . . . Less than 1 year 27,627Yoshiyuki Izawa . . . . . . . . . . . . . . . . . . . . . . . . . . . . . . . . . . . . . . . . . . . . 3 years 15,424Junichi Matsumoto . . . . . . . . . . . . . . . . . . . . . . . . . . . . . . . . . . . . . . . . . . 1 year 18,298Masami Iijima . . . . . . . . . . . . . . . . . . . . . . . . . . . . . . . . . . . . . . . . . . . . . . Less than 1 year 11,031Seiichi Tanaka . . . . . . . . . . . . . . . . . . . . . . . . . . . . . . . . . . . . . . . . . . . . . . Less than 1 year 2,828Akishige Okada(2) . . . . . . . . . . . . . . . . . . . . . . . . . . . . . . . . . . . . . . . . . . . 5 years 1,847Nobuko Matsubara(2) . . . . . . . . . . . . . . . . . . . . . . . . . . . . . . . . . . . . . . . . . 2 years 960Ikujiro Nonaka(2) . . . . . . . . . . . . . . . . . . . . . . . . . . . . . . . . . . . . . . . . . . . . 1 year 2,181Hiroshi Hirabayashi(2) . . . . . . . . . . . . . . . . . . . . . . . . . . . . . . . . . . . . . . . . 1 year 739
Note (1) At Mitsui’s ordinary general meeting of shareholders held on June 24, 2004, an amendment to theArticles of Incorporation was resolved whereby the normal term of office for Directors has beenchanged from two years to one year.
Note (2) Mr. Akishige Okada, Ms. Nobuko Matsubara, Mr. Ikujiro Nonaka and Mr. Hiroshi Hirabayashi areexternal Directors.
Date of Expiration ofCurrent Term of Office
Length of TimeServed in Office
(From Appointmentto June 2008)
Shareholdings as ofMarch 31, 2008
Corporate Auditor:Tasuku Kondo . . . . . . . . . . . . . . . . . . . . . . . . . . . . June 2009 3 years 24,094Satoru Miura . . . . . . . . . . . . . . . . . . . . . . . . . . . . . June 2011 1 year 15,376Motonori Murakami . . . . . . . . . . . . . . . . . . . . . . . June 2011 1 year 22,961Ko Matsukata(3) . . . . . . . . . . . . . . . . . . . . . . . . . . . June 2009 12 years 15,635Hideharu Kadowaki(3) . . . . . . . . . . . . . . . . . . . . . . June 2012 4 years 5,956Naoto Nakamura(3) . . . . . . . . . . . . . . . . . . . . . . . . June 2010 2 years 0Kunihiro Matsuo(3) . . . . . . . . . . . . . . . . . . . . . . . . June 2012 Less than 1 year 0
Note (3) Mr. Ko Matsukata, Mr. Hideharu Kadowaki, Mr. Naoto Nakamura and Mr. Kunihiro Matsuo areexternal Corporate Auditors.
156

Length of TimeServed in Office
(From Appointmentto June 2008)(4)
Shareholdings as ofMarch 31, 2008
Executive Officer (excluding Executive Officers who are also aDirector):Yasunori Yokote . . . . . . . . . . . . . . . . . . . . . . . . . . . . . . . . . . . . . . . . . . . . 8 years 24,033Toshimasa Furukawa . . . . . . . . . . . . . . . . . . . . . . . . . . . . . . . . . . . . . . . . 6 years 15,743Shinjiro Ogawa . . . . . . . . . . . . . . . . . . . . . . . . . . . . . . . . . . . . . . . . . . . . . 6 years 16,637Jitsuro Terashima . . . . . . . . . . . . . . . . . . . . . . . . . . . . . . . . . . . . . . . . . . . 5 years 25,326Koji Nakamura . . . . . . . . . . . . . . . . . . . . . . . . . . . . . . . . . . . . . . . . . . . . . 4 years 12,902Kenichi Yamamoto . . . . . . . . . . . . . . . . . . . . . . . . . . . . . . . . . . . . . . . . . . 4 years 13,269Toshio Awata . . . . . . . . . . . . . . . . . . . . . . . . . . . . . . . . . . . . . . . . . . . . . . 4 years 9,972Kiyotaka Watanabe . . . . . . . . . . . . . . . . . . . . . . . . . . . . . . . . . . . . . . . . . . 3 years 7,039Masaaki Fujita . . . . . . . . . . . . . . . . . . . . . . . . . . . . . . . . . . . . . . . . . . . . . . 3 years 5,582Junichi Mizonoue . . . . . . . . . . . . . . . . . . . . . . . . . . . . . . . . . . . . . . . . . . . 3 years 5,478Takao Omae . . . . . . . . . . . . . . . . . . . . . . . . . . . . . . . . . . . . . . . . . . . . . . . 3 years 10,281Norinao Iio . . . . . . . . . . . . . . . . . . . . . . . . . . . . . . . . . . . . . . . . . . . . . . . . 3 years 5,797Hideyo Hayakawa . . . . . . . . . . . . . . . . . . . . . . . . . . . . . . . . . . . . . . . . . . . 2 years 2,828Masaaki Murakami . . . . . . . . . . . . . . . . . . . . . . . . . . . . . . . . . . . . . . . . . . 4 years 19,172Osamu Koyama . . . . . . . . . . . . . . . . . . . . . . . . . . . . . . . . . . . . . . . . . . . . . 3 years 3,055Terukazu Okahashi . . . . . . . . . . . . . . . . . . . . . . . . . . . . . . . . . . . . . . . . . . 2 years 10,136Osamu Takahashi . . . . . . . . . . . . . . . . . . . . . . . . . . . . . . . . . . . . . . . . . . . 2 years 6,973Shigeru Hanagata . . . . . . . . . . . . . . . . . . . . . . . . . . . . . . . . . . . . . . . . . . . 2 years 10,828Masayoshi Komai . . . . . . . . . . . . . . . . . . . . . . . . . . . . . . . . . . . . . . . . . . . 1 year 4,396Katsumi Ogawa . . . . . . . . . . . . . . . . . . . . . . . . . . . . . . . . . . . . . . . . . . . . . 1 year 1,396Akio Yamamoto . . . . . . . . . . . . . . . . . . . . . . . . . . . . . . . . . . . . . . . . . . . . 1 year 3,094Yoshinori Setoyama . . . . . . . . . . . . . . . . . . . . . . . . . . . . . . . . . . . . . . . . . 1 year 13,496Noriaki Sakamoto . . . . . . . . . . . . . . . . . . . . . . . . . . . . . . . . . . . . . . . . . . . 1 year 1,496Masahiko Okamura . . . . . . . . . . . . . . . . . . . . . . . . . . . . . . . . . . . . . . . . . . 1 year 4,640Fuminobu Kawashima . . . . . . . . . . . . . . . . . . . . . . . . . . . . . . . . . . . . . . . 1 year 10,396Masaaki Iida . . . . . . . . . . . . . . . . . . . . . . . . . . . . . . . . . . . . . . . . . . . . . . . 1 year 3,396Joji Okada . . . . . . . . . . . . . . . . . . . . . . . . . . . . . . . . . . . . . . . . . . . . . . . . . Less than 1 year 8,202Takashi Fukunaga . . . . . . . . . . . . . . . . . . . . . . . . . . . . . . . . . . . . . . . . . . . Less than 1 year 97Takashi Yamauchi . . . . . . . . . . . . . . . . . . . . . . . . . . . . . . . . . . . . . . . . . . . Less than 1 year 1,103Shuji Nakura . . . . . . . . . . . . . . . . . . . . . . . . . . . . . . . . . . . . . . . . . . . . . . . Less than 1 year 1,097Mitsuhiko Kawai . . . . . . . . . . . . . . . . . . . . . . . . . . . . . . . . . . . . . . . . . . . . Less than 1 year 8,178Daisuke Saiga . . . . . . . . . . . . . . . . . . . . . . . . . . . . . . . . . . . . . . . . . . . . . . Less than 1 year 97Masayuki Kinoshita . . . . . . . . . . . . . . . . . . . . . . . . . . . . . . . . . . . . . . . . . Less than 1 year 1,138Atsushi Oi . . . . . . . . . . . . . . . . . . . . . . . . . . . . . . . . . . . . . . . . . . . . . . . . . Less than 1 year 103
Total Shareholdings by Directors, Corporate Auditors, and ExecutiveOfficers . . . . . . . . . . . . . . . . . . . . . . . . . . . . . . . . . . . . . . . . . . . . . . . . . . . 596,972
Note (4) The rules of Executive Officers provide for the term of the Executive Officers as one year startingApril 1 and ending March 31.
Mitsui’s Articles of Incorporation provide that the Board of Directors shall elect from among its membersRepresentative Directors, one of whom shall be the President. Under the Corporate Law of Japan, each of theRepresentative Directors has statutory authority and power to represent and act on behalf of the company in allrespects.
Under the Corporate Law of Japan, at least half of the Corporate Auditors should be persons who have notat any time been a director, executive officer, manager or employee of a company or any of its subsidiaries priorto his or her election as a Corporate Auditor. Each Corporate Auditor has a statutory duty to examine financialstatements, in collaboration with independent auditors, and business reports and also to supervise theadministration of the company’s affairs by Directors. Corporate Auditors are required to participate in meetingsof the Board of Directors but are not entitled to vote.
157

The Board of Corporate Auditors is comprised of all Corporate Auditors. The Board of Corporate Auditorshas a statutory duty to prepare its audit report each year. Each Corporate Auditor has the right to write his or herindividual opinion in the audit report if his or her opinion is different from the opinion expressed in the auditreport of the Board of Corporate Auditors. The Board of Corporate Auditors is empowered to establish auditprinciples, methods of examination by the Corporate Auditors of the company’s affairs and financial position andother matters concerning the performance of the Corporate Auditors’ duties. The Corporate Auditors may not atthe same time be directors, managers or employees of the company or any of its subsidiaries.
Exemption from Certain Corporate Governance Requirements of NASDAQ.
Nasdaq Marketplace Rule 4350(a)(1) provides that a foreign private issuer may follow its home countrypractice in lieu of the requirements of Rule 4350, provided that such foreign private issuer discloses in its annualreports filed with the Securities and Exchange Commission or on its website each requirement of Rule 4350 thatit does not follow and describes the home country practice followed by the issuer in lieu of such requirements.Such requirements of Rule 4350 and the relevant home country practices we follow are described below:
• Nasdaq Marketplace Rule 4350(b) requires that we make available to shareholders copies of our annualreport containing our audited financial statements by mail or by posting on or through our website. Inaccordance with the Corporate Law of Japan, we hold an annual meeting of shareholders within threemonths after the end of each fiscal year. Also, in accordance with the Corporate Law of Japan, wedistribute to shareholders, prior to the annual meeting of shareholders, copies of a report of businessoperations, together with our audited consolidated and unconsolidated financial statements prepared inaccordance with U.S. GAAP and Japanese GAAP, respectively, in Japanese. Concurrently with suchdistribution, we distribute our audited consolidated and unconsolidated financial statements prepared inaccordance with U.S. GAAP and Japanese GAAP, respectively, in English to the depository for theADSs, and instruct the depository to distribute the same to the registered ADS holders in a timelymanner. The English version contains a statement that, upon request by an interested party, we willprovide the party with a copy of our annual report on Form 20-F free of charge. As a reporting companyunder the Securities Exchange Act of 1934, we are required to prepare financial statements inaccordance with U.S. GAAP for inclusion in our annual report on Form 20-F, which must be filedwithin six months after the end of each fiscal year.
• Nasdaq Marketplace Rule 4350(c)(1) requires that a majority of the board of directors of each issuer beindependent directors as defined in Rule 4200, and Rule 4350(c)(2) requires that independent directorsof each issuer have regularly scheduled meetings at which only independent directors are present. ForJapanese companies, including us, which employ a corporate governance system based on a board ofcorporate auditors, the Corporate Law of Japan has no independence requirement with respect todirectors. The task of overseeing management and accounting firms is assigned to the corporateauditors, who are separate from the company’s management. Japanese companies, including us, whichemploy a corporate governance system based on a board of corporate auditors, are required to have atleast 50% “external” corporate auditor who must meet additional independence requirements under theCorporate Law of Japan. An external corporate auditor is defined in the Corporate Law of Japan as acorporate auditor who has not served as a director, executive officer, manager or any other employee ofthe company or any of its subsidiaries at any time prior to the appointment. Currently, we have fourexternal Corporate Auditors. Our Board of Corporate Auditors, which, as explained below, performsfunctions similar to those of an audit committee, has regularly scheduled meetings at which onlyCorporate Auditors are present.
• Nasdaq Marketplace Rule 4350(d)(2) requires that each issuer have and will continue to have an auditcommittee of at least three members, each of whom (1) is independent as defined underRule 4200(a)(15), (2) meets the requirements of Rule 10A-3(b)(1) under the Securities Exchange Act of1934, (3) has not participated in the preparation of the financial statements of the issuer or any currentsubsidiary thereof at any time during the past three years, and (4) is able to read and understand
158

fundamental financial statements, including a company’s balance sheet, income statement and cash flowstatement, as required by Rule 4350(d)(2). Nasdaq Marketplace Rule 4350(d)(1) requires that eachissuer have adopted a formal written audit committee charter specifying the items enumerated in thatrule and that its audit committee have reviewed and reassessed the adequacy of the charter on an annualbasis. Under the Corporate Law of Japan, we are not required to establish or maintain such an auditcommittee. The Corporate Law of Japan has no independence requirement with respect to directors of“large” companies (defined under the Corporate Law of Japan as joint stock corporations with statedcapital of ¥500 million or more or with total liabilities equal to or exceeding ¥20 billion), includingMitsui, that employ a corporate governance system based on a board of corporate auditors. In manysuch “large” companies, functions similar to those of such an audit committee are performed by itsboard of corporate auditors. We have established such a Board of Corporate Auditors, each of whomdoes not concurrently serve as a director, manager or any other employee of the company or any of itssubsidiaries. Under the Corporate Law of Japan, corporate auditors are elected at a general meeting ofshareholders and are under a statutory duty to review the administration of the affairs of Mitsui by itsDirectors and to examine financial statements and other documents and reports of Mitsui. Japanesecompanies, including us, which employ a corporate governance system based on a board of corporateauditors, are required to have at least 50% “external” corporate auditors, who must meet additionalindependence requirements under the Corporate Law of Japan. An external corporate auditor is definedin the Corporate Law of Japan as a corporate auditor who had not served as a director, executive officer,manager or any other employee of the company or any of its subsidiaries at any time prior to theappointment. Currently, we have seven Corporate Auditors, four of whom are external CorporateAuditors who meet these additional requirements. Mitsui’s Board of Corporate Auditors has adopted itsown code of auditing standards setting forth the scope of its responsibilities and the manner in which itcarries out such responsibilities, and certain other matters.
• Nasdaq Marketplace Rule 4350(c)(3) requires that compensation of the chief executive officer of eachissuer be determined, or recommended to its board of directors for determination, either by (i) a majorityof its independent directors or (ii) a compensation committee comprised solely of independent directors,and that compensation of all other executive officers be determined, or recommended to the board ofdirectors for determination, either by (i) a majority of the independent directors or (ii) a compensationcommittee comprised solely of independent directors. As explained above, we are not required to haveindependent directors. With regard to director compensation (excluding bonuses, etc.), the CorporateLaw of Japan requires the board of directors to pass a board resolution proposing director compensationto be submitted for approval at a general meeting of shareholders. Within the upper limit approved at thegeneral meeting of shareholders, the board of directors may determine the amount of compensation foreach director. The board of directors, by resolution of the board of directors, may delegate such decisionto the chief executive officer or other persons authorized by the board of directors. As for Mitsui, theupper limit of compensation for its Directors approved by the general meeting of shareholders is70 million yen per month and the Board of Directors has determined to delegate to the Chief ExecutiveOfficer the decision-making authority as to the amount of compensation for each Director within suchlimit. In addition to regular compensation, the aggregate amount of bonuses and other financial benefitspayable to Directors as consideration for the performance of their duties is also subject to approval byshareholders at a general meeting of shareholders under the Corporate Law of Japan. With regard toemployee (including officer) compensation, an approval at the general meeting of shareholders is notrequired under the Corporate Law of Japan. Therefore, the board of directors has the authority todetermine matters relating to employee compensation. The board of directors, by resolution of the boardof directors, may delegate employee compensation matters to the chief executive officer or otherpersons authorized by the board of directors. As for Mitsui, its Board of Directors has duly resolvedRegulations for Executive Officers, which provide that Executive Officers who are also Directors of theCompany shall not be paid any compensation in their capacities as Executive Officers and that thecompensation of the Executive Officers who are not Directors of the Company shall be decided by theBoard of Directors, or decided by the Chief Executive Officer or other Officers authorized by the Board
159

of Directors. Mitsui determines compensation of its Chief Executive Officer and other Officers inaccordance with the aforementioned procedures. Corporate auditors do not have any specific duties withrespect to compensation of the chief executive officer and other executive officers under the CorporateLaw of Japan. However, the duties of corporate auditors include a general duty to audit the affairs of thecompany to ensure that the business is being operated in accordance with applicable law and its charter.If the corporate auditors conclude, in connection with the performance of those duties, that thecompensation of directors violated applicable law or the company’s charter, the corporate auditors arerequired to report their conclusion to the general meeting of shareholders and may bring a lawsuitagainst the responsible directors.
• Nasdaq Marketplace Rule 4350(c)(4) requires that director nominees be selected or recommended forthe board of directors’ selection either by (i) a majority of the independent directors or (ii) a nominationcommittee comprised solely of independent directors. Also, Nasdaq Marketplace Rule 4350(c)(4)(B)requires that each issuer have adopted a formal written charter or board resolution, as applicable,addressing the nominations process and such related matters as may be required under the U.S. federalsecurities laws. As explained above, we are not required to have independent directors. Under theCorporate Law of Japan, a director may be nominated by (i) a resolution of the board of directors or(ii) a shareholder owning one percent or more of the outstanding shares of a company or 300 or moreshares of the company for at least 6 months. Approval by a majority of the shareholders in attendance ata general meeting of shareholders is required to elect a director. There is no specific requirement that acompany adopt a written charter or board resolution addressing the nominations process, nor is itcustomary to do so. As for Mitsui, nominations of Directors of Mitsui are approved at a meeting of theNomination Committee, a non-statutory committee established as an advisory board to the Board ofDirectors, prior to being submitted to a general meeting of shareholders. Corporate auditors do not haveany specific duties with respect to nomination of directors under the Corporate Law of Japan. However,the duties of corporate auditors include a general duty to audit the affairs of the company to ensure thatthe business is being operated in accordance with applicable law and its charter. If the corporate auditorsconclude, in connection with the performance of those duties, that the nomination of directors violatedapplicable law or the company’s charter, the corporate auditors are required to report their conclusion tothe general meeting of shareholders and may bring a lawsuit against the responsible directors.
• Nasdaq Marketplace Rule 4350(f) requires that there be a provision in the by-laws for a quorum for anymeeting of the holders of common stock and that such quorum be not less than 33 1/3% of theoutstanding shares of the common voting stock. In accordance with the Corporate Law of Japan,however, under our Articles of Incorporation no quorum is required for the adoption of resolutions at ageneral meeting of shareholders, except for (i) the election of Directors and Corporate Auditors forwhich the quorum shall not be less than one-third of the total voting rights and (ii) resolutions for otherspecified issues required by the Corporate Law of Japan (the “special shareholders’ resolutions”), whichinclude an amendment to the Articles of Incorporation, a reduction of stated capital, the removal of aCorporate Auditor, dissolution, merger or consolidation requiring shareholders resolution, the transfer ofthe whole or an important part of the business, the taking over of the whole of the business of any othercorporation requiring shareholders’ resolutions, share exchange or share transfer requiring shareholdersresolution for the purpose of establishing 100% parent-subsidiary relationships, splitting of thecorporation into two or more corporations requiring shareholders’ resolution, any offering of new sharesat a “specially favorable” price (or any offering of the rights to subscribe for, or acquire its shares at a“specially favorable” conditions) to any persons other than shareholders, for which the quorum shall beat least one-third of the total voting rights and the approval of the holders of at least two-thirds of thevoting rights represented at the meeting is required. This approach is consistent with generally acceptedbusiness practices of publicly-held companies in Japan.
• Nasdaq Marketplace Rule 4350(g) provides that each issuer solicit proxies and provide proxy statementsfor all meetings of shareholders and provide copies of such proxy solicitation to Nasdaq. Currently aJapanese company whose shares are listed on the securities exchanges defined in the Financial
160

Instruments and Exchange Law, including us, may, but is not required to, solicit proxies for meetings ofshareholders. If such a Japanese company solicits proxies for a meeting of shareholders, it is required toprovide proxy statements and documents for reference as provided for in the Financial Instruments andExchange Law and provide copies of such proxy statements and documents for reference to the KantoLocal Finance Bureau.
• Nasdaq Marketplace Rule 4350(h) provides that each issuer conduct appropriate review and oversight ofall related party transactions for potential conflict of interest situations on an ongoing basis by theissuer’s audit committee or another independent body of the board of directors. Following therequirements of the Corporate Law of Japan, we require a Director to obtain the approval of our Boardof Directors in order for such Director to enter into such transactions.
• Nasdaq Marketplace Rule 4350(i)(1) requires that shareholder approval be obtained for the issuance ofthe issuer’s stock in certain conditions or certain specified transactions described therein. The CorporateLaw of Japan requires us to seek shareholder approval of various matters, and in certain instances thespecial shareholders’ resolutions as described above are required for approval. In addition, while theCorporate Law of Japan permits, in certain instances, the issuance of equity securities withoutshareholder approval, the Corporate Law of Japan also contains provisions requiring the timelydissemination of information relating to such issuance, allowing for opportunities for shareholders tovoice their concern with such issuance, and mandating the election of corporate auditors whosefiduciary duty is to, among other things, oversee on behalf of the shareholders actions by the board ofdirectors relating to such issuance.
The rights of ADS holders, including their rights relating to corporate governance practices, are provided inthe deposit agreement.
Limitation of Liabilities of Directors and Corporate Auditors
The Articles of Incorporation of Mitsui provide that Mitsui may, by resolution of the Board of Directors,exempt the Directors and Corporate Auditors from their liabilities to the extent as permitted by the CorporateLaw of Japan. The Articles of Incorporation of Mitsui also provide that Mitsui may conclude a contract withexternal Directors and external Corporate Auditors to limit the liability of such Directors and Corporate Auditorsto the extent as permitted by the Corporate Law of Japan. In accordance with such provision of the Articles ofIncorporation, Mitsui has concluded with external Directors (Mr. Akishige Okada, Ms. Nobuko Matsubara,Mr. Ikujiro Nonaka and Mr. Hiroshi Hirabayashi) and external Corporate Auditors (Mr. Ko Matsukata,Mr. Hideharu Kadowaki, Mr. Naoto Nakamura and Mr. Kunihiro Matsuo), respectively, contracts to limit theirliability to the extent permitted by the Corporate Law of Japan.
D. Employees
As of March 31, 2008, 2007 and 2006, we had 42,621, 41,761 and 40,993 employees, respectively. Theaverage number of temporary employees during the year ended March 31, 2008 was 18,376.
Effective April 1, 2007, we changed our reportable operating segments as follows:
• We transferred coal mining, nuclear fuel and other businesses which were formerly included in “Iron &Steel Raw Materials and Non-Ferrous Metals” to “Energy.” “Iron & Steel Raw Materials andNon-Ferrous Metals” was renamed and presented as “Mineral & Metal Resources.”
• The former “Lifestyle, Consumer Service and Information, Electronics & Telecommunication.” wasrenamed and presented as “Consumer Service & IT.”
• Subsidiaries in Oceania which were formerly included in “Other Overseas Areas” were integrated to“Asia” and presented as “Asia Pacific.” Also, subsidiaries in the Middle East, Africa and Russia whichwere formerly included in “Other Overseas Areas” were combined with “Europe” and presented as“Europe, the Middle East and Africa.”
161

For more information, see Note 17, “Segment Information,” to our consolidated financial statements.
The following tables provide the numbers of employees by operating segment as of the years endedMarch 31, 2008, 2007 and 2006. It is not practicable to restate the numbers as of March 31, 2007 and 2006 toconform to the current year presentation.
Year ended March 31,
2008
Operating Segment:Iron & Steel Products . . . . . . . . . . . . . . . . . . . . . . . . . . . . . . . . . . . . . . . . . . . . . . . . . . . . . . . . 2,255Mineral & Metal Resources . . . . . . . . . . . . . . . . . . . . . . . . . . . . . . . . . . . . . . . . . . . . . . . . . . . 757Machinery & Infrastructure Projects . . . . . . . . . . . . . . . . . . . . . . . . . . . . . . . . . . . . . . . . . . . . 13,177Chemical . . . . . . . . . . . . . . . . . . . . . . . . . . . . . . . . . . . . . . . . . . . . . . . . . . . . . . . . . . . . . . . . . . 3,489Energy . . . . . . . . . . . . . . . . . . . . . . . . . . . . . . . . . . . . . . . . . . . . . . . . . . . . . . . . . . . . . . . . . . . . 1,633Foods & Retail . . . . . . . . . . . . . . . . . . . . . . . . . . . . . . . . . . . . . . . . . . . . . . . . . . . . . . . . . . . . . 6,008Consumer Service & IT . . . . . . . . . . . . . . . . . . . . . . . . . . . . . . . . . . . . . . . . . . . . . . . . . . . . . . 4,540Logistics & Financial Markets . . . . . . . . . . . . . . . . . . . . . . . . . . . . . . . . . . . . . . . . . . . . . . . . . 1,177Americas . . . . . . . . . . . . . . . . . . . . . . . . . . . . . . . . . . . . . . . . . . . . . . . . . . . . . . . . . . . . . . . . . . 4,297Europe, the Middle East and Africa . . . . . . . . . . . . . . . . . . . . . . . . . . . . . . . . . . . . . . . . . . . . . 1,299Asia Pacific . . . . . . . . . . . . . . . . . . . . . . . . . . . . . . . . . . . . . . . . . . . . . . . . . . . . . . . . . . . . . . . . 2,196All Other . . . . . . . . . . . . . . . . . . . . . . . . . . . . . . . . . . . . . . . . . . . . . . . . . . . . . . . . . . . . . . . . . . 1,793
Total . . . . . . . . . . . . . . . . . . . . . . . . . . . . . . . . . . . . . . . . . . . . . . . . . . . . . . . . . . . . . . . . . . . . . 42,621
Year ended March 31,
2007 2006
Operating Segment:Iron & Steel Products . . . . . . . . . . . . . . . . . . . . . . . . . . . . . . . . . . . . . . . . . . . . . . . . . . . . . . . . 2,270 2,044Iron & Steel Raw Materials and Non-Ferrous Metals . . . . . . . . . . . . . . . . . . . . . . . . . . . . . . . 2,425 2,504Machinery & Infrastructure Projects . . . . . . . . . . . . . . . . . . . . . . . . . . . . . . . . . . . . . . . . . . . . 10,859 9,338Chemical . . . . . . . . . . . . . . . . . . . . . . . . . . . . . . . . . . . . . . . . . . . . . . . . . . . . . . . . . . . . . . . . . . 3,731 3,735Energy . . . . . . . . . . . . . . . . . . . . . . . . . . . . . . . . . . . . . . . . . . . . . . . . . . . . . . . . . . . . . . . . . . . . 1,516 1,384Foods & Retail . . . . . . . . . . . . . . . . . . . . . . . . . . . . . . . . . . . . . . . . . . . . . . . . . . . . . . . . . . . . . 6,575 6,555Lifestyle, Consumer Services and Information, Electronics & Telecommunication . . . . . . . . 5,481 5,607Logistics & Financial Markets . . . . . . . . . . . . . . . . . . . . . . . . . . . . . . . . . . . . . . . . . . . . . . . . . 1,284 1,239Americas . . . . . . . . . . . . . . . . . . . . . . . . . . . . . . . . . . . . . . . . . . . . . . . . . . . . . . . . . . . . . . . . . . 2,316 2,888Europe . . . . . . . . . . . . . . . . . . . . . . . . . . . . . . . . . . . . . . . . . . . . . . . . . . . . . . . . . . . . . . . . . . . . 1,081 1,078Asia . . . . . . . . . . . . . . . . . . . . . . . . . . . . . . . . . . . . . . . . . . . . . . . . . . . . . . . . . . . . . . . . . . . . . . 1,969 2,102Other Overseas Areas . . . . . . . . . . . . . . . . . . . . . . . . . . . . . . . . . . . . . . . . . . . . . . . . . . . . . . . . 503 535All Other . . . . . . . . . . . . . . . . . . . . . . . . . . . . . . . . . . . . . . . . . . . . . . . . . . . . . . . . . . . . . . . . . . 1,751 1,984
Total . . . . . . . . . . . . . . . . . . . . . . . . . . . . . . . . . . . . . . . . . . . . . . . . . . . . . . . . . . . . . . . . . . . . . 41,761 40,993
We consider relations between management and our labor unions to be good.
E. Share Ownership.
Directors, Corporate Auditors and Executive Officers
As of March 31, 2008, the members of Mitsui’s Board of Directors, Corporate Auditors and ExecutiveOfficers held as a group, 596,972 shares of our common stock, representing 0.033% of the shares outstanding.This number of shares included 49,155 shares held by Mitsui Executives’ Shareholding Association.
None of Mitsui’s Directors, Corporate Auditors nor Executive Officers is the beneficial owner of more than1% of Mitsui’s common stock. The number of shares held by Mitsui’s Directors, Corporate Auditors andExecutive Officers, on an individual basis, is provided in “Item 6.C. Board Practices,” and is incorporated hereinby reference.
162

In July, 2006, a new management shareholding scheme was introduced, whereby each of Mitsui’s Directors(excluding external Directors) and Executive Officers are required to purchase Mitsui’s shares through MitsuiExecutives’ Shareholding Association. Mitsui’s Directors (excluding external Directors) and Executive Officerspurchase Mitsui’s shares in an amount equivalent to 10% of his or her salary, which amount is deducted from hisor her salary for the purchases through said Mitsui Executives’ Shareholding Association.
Employees Shareholding Association
Mitsui operates an Employees’ Shareholding Association which, as of March 31, 2008, had 3,417 employeemember participants.
Employee members declare monthly the amount to be deducted from his or her salary to be used to purchaseshares of common stock of Mitsui through the Employees’ Shareholding Association. Employee membersreceive from Mitsui a monthly subsidy equivalent to 10% of the declared amount, enabling them to purchaseshares equivalent to 110% of the declared amount. Employee members are entitled to dividends which areapplied towards the purchase of additional shares through the Employees’ Shareholding Association. Employeemembers are able to sell part of their shares that have been reserved for them under the Employees’ ShareholdingAssociation’s plan, in multiples of 1,000 shares, once every month. As of March 31, 2008, the total amount ofshares having voting rights owned by the Employees’ Shareholding Association was 10,297,673, representing0.57% of the total shares issued and outstanding.
Mitsui does not have any other arrangements for its employees that involve the issue or grant of options,shares or securities of Mitsui.
Item 7. Major Shareholders and Related Party Transactions.
A. Major Shareholders.
As of March 31, 2008, there were 1,820,183,809 shares of our common stock issued (including3,543,891 shares of treasury stock), of which 17,626,180 shares were in the form of ADSs, representing 0.97% ofour then outstanding common stock, and 284,271,239 shares, representing 15.65% of our then outstandingcommon stock, were held of record in the form of common stock by residents in the United States. The numberof registered ADS holders was 39, and the number of registered holders of shares of common stock in the UnitedStates was 211.
The following table shows our major shareholders as of March 31, 2008, including shareholders who ownedless than 5% of our then outstanding common stock, disclosed under the Financial Instruments and ExchangeLaw of Japan.
ShareholdersThousands of Shares ofCommon Stock Owned
Percentage ofCommon Stock Issued(*)
The Master Trust Bank of Japan, Ltd. (trust account) . . . . . . . . . . . . 180,697 9.92%Japan Trustee Services Bank, Ltd. (trust account) . . . . . . . . . . . . . . . 130,503 7.16%State Street Bank and Trust Company . . . . . . . . . . . . . . . . . . . . . . . . 53,271 2.92%Sumitomo Mitsui Banking Corporation . . . . . . . . . . . . . . . . . . . . . . . 38,500 2.11%Mitsui Life Insurance Company Limited . . . . . . . . . . . . . . . . . . . . . . 37,630 2.06%Nippon Life Insurance Company . . . . . . . . . . . . . . . . . . . . . . . . . . . . 35,070 1.92%The Chuo Mitsui Trust and Banking Company, Limited . . . . . . . . . . 30,799 1.69%The Bank of Tokyo-Mitsubishi UFJ, Ltd. . . . . . . . . . . . . . . . . . . . . . 30,375 1.66%State Street Bank and Trust Company 505103 . . . . . . . . . . . . . . . . . 30,044 1.65%The Chase Manhattan Bank N.A. London Secs Lending Omnibus
Account . . . . . . . . . . . . . . . . . . . . . . . . . . . . . . . . . . . . . . . . . . . . . 25,723 1.41%
(*) The figures are rounded down to two decimal places.
163

Under the Financial Instruments and Exchange Law of Japan, any person that becomes a holder (togetherwith its related persons) of more than 5% of the total issued voting shares of a company listed on any Japanesestock exchange (including ADSs representing such shares) must file a report with the Director of the relevantLocal Finance Bureau and send a copy of such report to the company. A similar report must also be filed if thepercentage holding of a holder of more than 5% of the total issued voting shares of a company increases ordecreases by 1% or more.
Based on such reports we have received, we are aware that each of the following persons, together with itsaffiliates, was the beneficial owner of our common stock in the amounts and as of the dates shown in thefollowing tables:
Schroder Investment Management (Japan) Ltd.
Ownership as ofShares of
Common Stock Owned(*1)Percentage of
Common Stock Issued(*2)
September 30, 2005 . . . . . . . . . . . . . . . . . . . . . . . . . . . . . . . . . . . . 98,021,300 6.19March 31, 2006 . . . . . . . . . . . . . . . . . . . . . . . . . . . . . . . . . . . . . . . 76,106,300 4.41
Barclays Global Investors Japan Trust & Banking Co., Ltd.
Ownership as ofShares of
Common Stock Owned(*1)Percentage of
Common Stock Issued(*2)
June 30, 2005 . . . . . . . . . . . . . . . . . . . . . . . . . . . . . . . . . . . . . . . . . 73,848,516 4.66%August 30, 2005 . . . . . . . . . . . . . . . . . . . . . . . . . . . . . . . . . . . . . . . 79,629,817 5.03September 9, 2005 . . . . . . . . . . . . . . . . . . . . . . . . . . . . . . . . . . . . . 72,230,817 4.56September 26, 2005 . . . . . . . . . . . . . . . . . . . . . . . . . . . . . . . . . . . . 79,727,817 5.03October 31, 2005 . . . . . . . . . . . . . . . . . . . . . . . . . . . . . . . . . . . . . . 82,041,817 5.17December 6, 2005 . . . . . . . . . . . . . . . . . . . . . . . . . . . . . . . . . . . . . 63,299,817 4.00
Fidelity Investments Japan Limited
Ownership as ofShares of
Common Stock Owned(*1)Percentage of
Common Stock Issued(*2)
December 31, 2005 . . . . . . . . . . . . . . . . . . . . . . . . . . . . . . . . . . . . 85,569,000 5.40%February 15, 2007 . . . . . . . . . . . . . . . . . . . . . . . . . . . . . . . . . . . . . 72,786,000 4.22May 31, 2007 . . . . . . . . . . . . . . . . . . . . . . . . . . . . . . . . . . . . . . . . . 90,801,000 5.08March 31, 2008 . . . . . . . . . . . . . . . . . . . . . . . . . . . . . . . . . . . . . . . 69,399,760 3.82
JPMorgan Trust Bank Limited
Ownership as ofShares of
Common Stock Owned(*1)Percentage of
Common Stock Issued(*2)
March 31, 2006 . . . . . . . . . . . . . . . . . . . . . . . . . . . . . . . . . . . . . . . 88,102,243 5.11%September 30, 2006 . . . . . . . . . . . . . . . . . . . . . . . . . . . . . . . . . . . . 60,525,493 3.51
AllianceBernstein Japan Ltd.
Ownership as ofShares of
Common Stock Owned(*1)Percentage of
Common Stock Issued(*2)
May 31, 2006 . . . . . . . . . . . . . . . . . . . . . . . . . . . . . . . . . . . . . . . . . 91,095,320 5.28%February 29, 2008 . . . . . . . . . . . . . . . . . . . . . . . . . . . . . . . . . . . . . 116,987,615 6.44
164

Nomura Securities Co., Ltd.
Ownership as ofShares of
Common Stock Owned(*1)Percentage of
Common Stock Issued(*2)
August 31, 2006 . . . . . . . . . . . . . . . . . . . . . . . . . . . . . . . . . . . . . . . 97,028,174 5.55%January 15, 2007 . . . . . . . . . . . . . . . . . . . . . . . . . . . . . . . . . . . . . . 72,867,946 4.20
Mitsubishi UFJ Financial Group, Inc.
Ownership as ofShares of
Common Stock Owned(*1)Percentage of
Common Stock Issued(*2)
January 29, 2007 . . . . . . . . . . . . . . . . . . . . . . . . . . . . . . . . . . . . . . 86,629,949 5.02%October 8, 2007 . . . . . . . . . . . . . . . . . . . . . . . . . . . . . . . . . . . . . . . 147,839,726 8.16
(*1) The numbers of shares of common stock owned include those of convertible bonds owned that arecalculated on a fully diluted basis.
(*2) The percentage figures are calculated as of the dates shown in the table. Percentage figures as of March 31,2008, after the issuance of 130 million shares through the public offering in February 2006 and 9.75 millionshares through the third party allotment in March 2006, are not necessarily available from theaforementioned reports.
The voting rights of our major shareholders do not differ from the voting rights of other shareholders.
To our knowledge, we are not directly or indirectly owned or controlled by any other corporations, by anyforeign government or by any other natural or legal persons severally or jointly.
We know of no arrangements which may, at a subsequent date, result in a change in control of Mitsui.
B. Related Party Transactions
When conducting our business operations throughout the world, we form alliances with leading partnercompanies in Japan and overseas, including manufacturers and companies in the field of natural resources, suchas energy and ferrous materials. In addition to investing in, or providing loans to, associated companies where weare a minority shareholder, we conduct selling and purchasing transactions of various products on a recurringbasis with such associated companies.
Our principal associated companies include Valepar S.A. (18.24%), Japan Australia LNG (MIMI) Pty. Ltd.(50.00%), Sims Group Limited (16.00%), P.T. Paiton Energy (36.32%), IPM (UK) Power Holdings (25.00%),and Penske Automotive Group, Inc. (The Company changed its name from United Auto Group, Inc. on July 2,2007.)(16.32%), among others.
The following table shows information regarding account balances and transactions with associatedcompanies:
Billions of Yen
As of March 31, 2008
Accounts receivable, trade . . . . . . . . . . . . . . . . . . . . . . . . . . . . . . . . . . . . . . . . . . . . . . . . . . . . . ¥229Advances to associated companies . . . . . . . . . . . . . . . . . . . . . . . . . . . . . . . . . . . . . . . . . . . . . . 138Accounts payable, trade . . . . . . . . . . . . . . . . . . . . . . . . . . . . . . . . . . . . . . . . . . . . . . . . . . . . . . . 69
Dividends received from associated companies for the year ended March 31, 2008 amounted to ¥99 billion.
See Note 6, “INVESTMENTS IN AND ADVANCES TO ASSOCIATED COMPANIES” to ourconsolidated financial statements.
165

Prices applied in transactions with associated companies are computed in the same way that such priceswould be calculated in transactions with unrelated third parties. In addition, when associated companies arecounterparties in transactions with us and we conduct such business under long-term procurement and/or salescontracts, in general, we conclude a corresponding sales contract with the purchasers (unrelated parties) of goodsprocured by us and/or with suppliers (unrelated parties) of the goods we sell to associated companies. Regardingany other commitments related to transactions with associated companies, we do not normally assume risk inexcess of its percentage of share ownership in an associated company.
In furtherance of their trading activities, it is customary practice for us to loan or guarantee, severally andjointly with others, indebtedness of certain customers and suppliers and of certain associated companies as wellas to guarantee the performance of contracts by such entities. At March 31, 2008, the aggregate amount of loans(including ¥73 billion guarantees) relating to associated companies was ¥209 billion. The largest amountoutstanding as of March 31, 2008 was a ¥23 billion loan with interest to P&M Drilling International B.V., whichengages in capital lease operation in Netherlands. The loan was mainly from Mitsui. Other major loans toassociated companies are related to the power plant project and the capital lease operation of ships.
In the ordinary course of our business, we have entered into transactions with various organizations withwhich certain of our Directors and Senior Management are associated, but no material transactions have beenentered into for the three-year period ended March 31, 2008.
As of March 31, 2008, no person was the beneficial owner of more than 10% of our common stock.
C. Interests of Experts and Counsel.
Not applicable.
Item 8. Financial Information.
A. Consolidated Statements and Other Financial Information.
Consolidated Financial Statements
The audited consolidated financial statements required by this item are included elsewhere in this annualreport.
Export Sales
The total amount of revenues from export transactions for the year ended March 31, 2008 was ¥456 billion,or 8% of total revenue of ¥5,739 billion.
Legal Proceedings
Various claims and legal actions are pending against us in respect of contractual obligations and othermatters arising out of the conduct of our business. Appropriate provision has been recorded for the estimated losson claims and legal actions. In the opinion of management, any liability will not materially affect ourconsolidated financial position, results of operations, or cash flows.
Dividend Policy
We have set the target dividend payout ratio at 20% of consolidated net income, and by growing profits wewill aim to progressively and sustainably increase dividend payments. Such payments will, however, be subjectto our future earnings, financial condition, approval at the shareholders’ meeting (in the case of year-enddividends) and other factors, including statutory and other restrictions with respect to the payment of dividends.
166

B. Significant Changes
Except as disclosed in this annual report, there has not been any significant change since the date of thelatest annual financial statements included elsewhere in this annual report.
Item 9. The Offer and Listing.
A. Offer and Listing Details.
The primary market for Mitsui’s common stock is the Tokyo Stock Exchange, or TSE. Mitsui’s commonstock is traded on the First Section of the TSE and is also listed on four other stock exchanges in Japan (Osaka,Nagoya, Fukuoka and Sapporo Stock Exchanges).
Mitsui’s American Depository Shares (“ADSs”), each representing 20 shares of common stock, are tradedon the NASDAQ Global Select Market under the symbol MITSY. American Depository Receipts (“ADRs”),each evidencing one or more ADSs, were originally issued pursuant to a Deposit Agreement in May 1963, asamended from time to time, that we entered into with Citibank N.A. of New York as Depositary and the holdersof the ADRs.
The following table provides the reported high and low closing sales prices of our common stock on theTSE and the reported high and low closing bid price quotations per ADS for the period indicated:
TSE NASDAQ
Price per Share ofCommon Stock
(Yen)Price per ADS(U.S. dollars)(1)
High Low High Low
Year ended March 31:2004 . . . . . . . . . . . . . . . . . . . . . . . . . . . . . . . . . . . . . . . . . . . . . . . . . . . ¥ 946 ¥ 541 $181.50 $ 90.902005 . . . . . . . . . . . . . . . . . . . . . . . . . . . . . . . . . . . . . . . . . . . . . . . . . . . 1,074 773 206.20 137.502006 . . . . . . . . . . . . . . . . . . . . . . . . . . . . . . . . . . . . . . . . . . . . . . . . . . . 1,731 908 292.66 171.502007 . . . . . . . . . . . . . . . . . . . . . . . . . . . . . . . . . . . . . . . . . . . . . . . . . . . 2,315 1,427 382.21 245.002008 . . . . . . . . . . . . . . . . . . . . . . . . . . . . . . . . . . . . . . . . . . . . . . . . . . . 3,080 1,704 538.92 336.25
Year ended March 31, 2007:First quarter . . . . . . . . . . . . . . . . . . . . . . . . . . . . . . . . . . . . . . . . . . . . . ¥1,824 ¥1,427 $326.00 $249.42Second quarter . . . . . . . . . . . . . . . . . . . . . . . . . . . . . . . . . . . . . . . . . . . 1,750 1,445 304.00 249.46Third quarter . . . . . . . . . . . . . . . . . . . . . . . . . . . . . . . . . . . . . . . . . . . . 1,788 1,430 301.90 245.00Fourth quarter . . . . . . . . . . . . . . . . . . . . . . . . . . . . . . . . . . . . . . . . . . . 2,315 1,671 382.21 281.44
Year ended March 31, 2008:First quarter . . . . . . . . . . . . . . . . . . . . . . . . . . . . . . . . . . . . . . . . . . . . . ¥2,595 ¥2,040 $416.60 $347.21Second quarter . . . . . . . . . . . . . . . . . . . . . . . . . . . . . . . . . . . . . . . . . . . 2,880 2,005 501.67 371.60Third quarter . . . . . . . . . . . . . . . . . . . . . . . . . . . . . . . . . . . . . . . . . . . . 3,080 2,270 538.92 395.02Fourth quarter . . . . . . . . . . . . . . . . . . . . . . . . . . . . . . . . . . . . . . . . . . . 2,405 1,704 463.97 336.25
Year ending March 31, 2009:First quarter . . . . . . . . . . . . . . . . . . . . . . . . . . . . . . . . . . . . . . . . . . . . . ¥2,750 ¥2,040 $526.70 $400.04
Month of:February 2008 . . . . . . . . . . . . . . . . . . . . . . . . . . . . . . . . . . . . . . . . . . . ¥2,405 ¥2,020 $454.54 $380.00March 2008 . . . . . . . . . . . . . . . . . . . . . . . . . . . . . . . . . . . . . . . . . . . . . 2,395 1,926 463.97 384.26April 2008 . . . . . . . . . . . . . . . . . . . . . . . . . . . . . . . . . . . . . . . . . . . . . . 2,595 2,040 506.05 400.04May 2008 . . . . . . . . . . . . . . . . . . . . . . . . . . . . . . . . . . . . . . . . . . . . . . . 2,750 2,390 526.70 457.82June 2008 . . . . . . . . . . . . . . . . . . . . . . . . . . . . . . . . . . . . . . . . . . . . . . . 2,605 2,290 496.00 421.07July 2008 . . . . . . . . . . . . . . . . . . . . . . . . . . . . . . . . . . . . . . . . . . . . . . . 2,425 2,035 454.20 387.78
(1) All fractional figures of the prices per ADS are rounded to the nearest two decimal points.
167

Share prices on Japanese stock exchanges are determined on a real-time basis by the equilibrium betweenbids and offers. These exchanges set daily price limits, which limit the maximum range of fluctuation within asingle trading day. Daily price limits are set according to the previous day’s closing price or special quote.Although transactions may continue at the upward or downward limit price if the limit price is reached on aparticular trading day, no transactions may take place outside these limits. Consequently, an investor wishing tosell at a price above or below the relevant daily limit may not be able to sell his shares at such price on aparticular trading day, or at all.
On July 31, 2008, the closing sales price per share of our common stock on the TSE was ¥2,235, and theclosing sales price per ADS on the NASDAQ Global Select Market was U.S.$415.99.
B. Plan of Distribution.
Not applicable.
C. Markets.
See “Item 9.A. Offer and Listing Details.”
D. Selling Shareholders.
Not applicable.
E. Dilution.
Not applicable.
F. Expenses of the Issue.
Not applicable.
Item 10. Additional Information.
A. Share Capital.
Not applicable.
B. Memorandum and Articles of Association.
General
Set forth below is information relating to the organization and common stock of Mitsui, including briefsummaries of the relevant provisions of Mitsui’s Articles of Incorporation and Share Handling Regulationsadopted by Mitsui’s Board of Directors, as currently in effect, and of the Corporate Law of Japan and relatedlegislation.
With the revision of the Corporate Law of Japan and related legislation on May 1, 2006, the relevantprovisions of Mitsui’s Articles of Incorporation and Share Handling Regulations were, among other things,amended as follows:
(1) Article 16 of Mitsui’s Articles of Incorporation provides that Mitsui may, in convening GeneralMeetings of Shareholders, post on Internet information required to be recorded or indicated inreference documents for General Meetings of Shareholders, business reports, financial statements andconsolidated financial statements in accordance with the provisions of laws and regulations. Suchposting of information may be deemed to constitute provision of such information to shareholders;
168

(2) Article 18 of Mitsui’s Articles of Incorporation provides that a shareholder may exercise his/her votingrights by proxy who shall be one shareholder of Mitsui with voting rights;
(3) Article 24 of Mitsui’s Articles of Incorporation enables the Board of Directors to simplify theresolution process by providing that Mitsui shall deem a resolution of the Board of Directors to havebeen adopted if all the Directors agree in writing or electromagnetic record thereto and otherrequirements provided for in the Corporate Law of Japan are satisfied; and
(4) Article 32 of Mitsui’s Articles of Incorporation enables Mitsui to enter into agreements to limit theliability of its external Corporate Auditors so that Mitsui may engage suitable personnel who are ableto fulfill their expected roles as external Corporate Auditors.
Organization
Mitsui is a corporation (kabushiki kaisha) incorporated in Japan under the Corporate Law of Japan. It isregistered in the Commercial Register (shogyo tokibo) maintained by the Tokyo Legal Affairs Bureau and severalother registry offices of the Ministry of Justice.
Objects and Purposes
Article 2 of Mitsui’s Articles of Incorporation provides that our objects are to engage in the followingbusiness:
1. Foreign trade, purchases and sales, wholesale, agency and brokerage business relating to the followingcommodities:
(1) Ferrous and non-ferrous metals and their raw materials, manufactured goods, and minerals.
(2) Coal, petroleum, natural gas and other fuels and their by-products.
(3) All kinds of machines, appliances (including measuring instruments and medical apparatus) andequipment including manufacturing equipment, communications equipment and antipollutionequipment, rolling stock and vehicles, ships and boats, aerospace equipment and aircraft, and partsfor the foregoing.
(4) All kinds of chemical products, salt, fertilizers, high-pressure gas, explosives, pharmaceuticals(including medicines, non-medicinal drugs, medicine for veterinary use, narcotics, poisons andstimulants), radio isotopes, cosmetics, and raw materials for the foregoing.
(5) Cereals, sugar, oils and fats, feeds and their raw materials; livestock, agricultural, dairy andmarine products, processed foods, alcoholic beverages and other foodstuffs and drinks.
(6) All kinds of textile products and their raw materials.
(7) All kinds of fur products and raw fur.
(8) Lumber, cement, other building materials and housing-related equipment.
(9) Rubber, pulp, paper and their manufactured goods; tobacco, cigars, cigarettes and sundry goods.
(10) Industrial water and drinking water.
2. Exploration, development, manufacturing, processing, scrapping and recycling business relating to theabove-mentioned items.
3. Acquisition, planning, preservation, utilization and disposition of copyright, patents and otherintellectual property rights, know-how, systems technology and other software, including acting as anintermediary in such transactions.
4. Information processing and supply, telecommunications, broadcasting, advertising, publishing, printingand translation businesses, and the production and sale of audio and visual copyright products.
169

5. Forestry, sawmilling and lumber processing businesses.
6. Chattel leasing business.
7. Secondhand goods business.
8. Transportation and transportation agency, land transportation, marine transportation business, porttransportation, freight forwarding, customs brokerage, shipping agency and warehousing businesses.
9. Intermediary business for non-life insurance, insurance under the Automobile Liability Law, lifeinsurance sales and overseas non-life reinsurance business.
10. Construction sub-contracting, building design and supervision and management of various constructionworks.
11. Acquisition, disposition, leasing, other utilization and development of real estate and acting as anintermediary in such transactions.
12. Supply and development of hot springs.
13. Surveying and research relating to land, sea and sky.
14. Investing in, purchasing, selling and brokering negotiable instruments, etc.
15. Lending money, guaranteeing and assuming debts, sale and purchase of various receivables, foreignexchange transactions and conducting any other financing business.
16. Operation and management of medical facilities, day-care facilities, sports facilities, restaurants, andhotel and travel businesses.
17. Planning, administration and implementation of various events.
18. Temporary personnel placement, employment agency, and personnel education, guidance and trainingto develop appropriate job skills and qualifications.
19. Maintenance and management of real estate.
20. Investment, commodities investments sales and advisory services, securities investment advisoryservices, trustee services, sale of beneficial interests in trusts, investment trust management servicesand asset management services for investment corporations.
21. Generation, supply, and sale and purchase of electricity.
22. Administrative agency services for management, labour and accounting work.
23. Buying, selling, and derivative transactions for greenhouse gas emission rights and related intermediaryservices.
24. Agency and intermediary services for credit card applications.
25. Consultancy business relating to the foregoing items.
26. Other lines of business relating to any of the foregoing items.
Directors
There is no provision in our Articles of Incorporation as to a Director’s power to vote on a proposal,arrangement or contract in which a Director is materially interested, but, under the Corporate Law of Japan, adirector is required to refrain from voting on such matters when passing a resolution of the board of directors.
The Corporate Law of Japan provides that compensation for directors is determined at a general meeting ofshareholders of a company. Within the upper limit approved by the general meeting of shareholders, the board ofdirectors will determine the amount of compensation for each director. The board of directors may, by itsresolution, leave such decision to the discretion of the company’s chief executive officer.
170
The Corporate Law of Japan provides that the incurrence by a company of a significant loan from a thirdparty should be approved by the company’s board of directors. Our Regulations of the Board of Directors haveadopted this policy.
There is no mandatory retirement age for our Directors under the Corporate Law of Japan or our Articles ofIncorporation.
There is no requirement concerning the number of shares one individual must hold in order to qualify him orher as a Director of Mitsui under the Corporate Law of Japan or our Articles of Incorporation.
Common Stock
Authorized capital
Article 6 of the Mitsui’s Articles of Incorporation provides that the total number of shares that can be issuedby Mitsui is two billion five hundred million (2,500,000,000).
Under Mitsui’s Articles of Incorporation, currently in effect, only shares of common stock are issuable and1,820,183,809 shares of common stock (including treasury stock of 3,543,891 shares) were issued, fully paid asof March 31, 2008.
Dividends
Dividends on our shares are generally distributed in proportion to the number of shares owned by eachshareholder.
In Japan, the ex-dividend date and the record date for any dividend precede the date of determination of theamount of the dividend to be paid. Generally, the ex-dividend date is three business days prior to the record date.
Under the Corporate Law of Japan, we are permitted to make distributions of surpluses to our shareholdersany number of times per fiscal year pursuant to resolutions of our general meeting of shareholders, subject tocertain limitations described below. Distributions of surpluses are required, in principle, to be authorized by aresolution of the general meeting of shareholders. In an exception to the above rule, we are permitted to makedistributions of surpluses in cash to our shareholders by board resolution once per fiscal year if our Articles ofIncorporation so provide. Currently, our Articles of Incorporation so provide.
Distributions of surpluses may be made in cash or in-kind in proportion to the number of shares held byeach shareholder. If a distribution of surpluses is to be made in-kind, we may, pursuant to a general meeting ofshareholders’ resolution, or as the case may be, a board resolution, grant our shareholders a right to require us tomake the distribution in cash instead of in kind. If no such right is granted, the relevant distribution must beapproved by a special resolution of a general meeting of shareholders. Currently, we do not have any concreteplan to make a distribution of surpluses in kind.
Under the Corporate Law of Japan, when we make a distribution of surpluses, we must set aside in ouradditional paid-in capital or legal reserves an amount equal to at least one-tenth of the amount of surpluses sodistributed, unless the sum of our additional paid-in capital and legal reserves is one-quarter or more of our statedcapital. Under the Corporate Law of Japan, we may distribute any dividends up to the amount of the excess of theaggregate of (a) and (b) below, less the aggregate of (c) through (f) below, on an unconsolidated basis, as of theeffective date of such distribution (the “Distributable Amount”), if our net assets are not less than ¥3,000,000:
(a) the amount of surpluses, as described below;
(b) in the event that extraordinary financial statements as of, or for a period from the beginning of thebusiness year to, the specified date are approved, the aggregate amount of (i) the aggregate amount of(x) the net income for such period described in the profit and loss statement included in the
171

extraordinary financial statements and (y) the amount of payment made to fulfill certain obligations asprovided for by an ordinance of the Ministry of Justice, and (ii) the amount of consideration that wereceived for the treasury stock that we disposed of during such period;
(c) the book value of our treasury stock;
(d) in the event that we disposed of treasury stock after the end of the previous business year, the amountof consideration that we received for such treasury stock;
(e) in the event of that which is described in (b) in this paragraph, the absolute difference between zero andthe amount of net loss for such period described in the profit and loss statement included in theextraordinary financial statements; and
(f) the aggregate amount of accounts as provided for by an ordinance of the Ministry of Justice.
For the purposes of this section, the amount of surpluses is the excess of the aggregate of I. through IV.below, less the aggregate of V. through VII. below, on an unconsolidated basis:
I. the total amount of (x) assets and (y) the book value of treasury stock, less the total amount of(i) liabilities, (ii) stated capital, (iii) additional paid-in capital, (iv) legal reserve and (v) certain otheramounts set forth in an ordinance of the Ministry of Justice;
II. in the event that we disposed of treasury stock after the end of the previous business year, thedifference between the book value of such treasury stock and the consideration that we received forsuch treasury stock;
III. in the event that we reduced our stated capital after the end of the previous business year, the amount ofsuch reduction less the portion thereof that has been transferred to additional paid-in capital and/or thelegal reserve (if any);
IV. in the event that additional paid-in capital and/or legal reserves were reduced after the end of theprevious business year, the amount of such reduction less the portion thereof that has been transferredto stated capital (if any);
V. in the event that we canceled treasury stock after the end of the previous business year, the book valueof such treasury stock;
VI. in the event that we distributed dividends after the end of the previous business year, the aggregate ofthe following amounts:
a. the aggregate amount of the book value of the distributed assets, excluding the book value of suchassets that would be distributed to shareholders for their exercise of the right to receive dividendsin cash instead of dividends in kind;
b. the aggregate amount of cash distributed to shareholders who exercised the right to receivedividends in cash instead of dividends in kind; and
c. the aggregate amount of cash paid to shareholders holding fewer shares that was required in orderto receive dividends in kind;
VII. the aggregate amounts of a. through c. below, less d. below:
a. in the event that the amount of surpluses was reduced and transferred to additional paid-in capital,the legal reserve and/or stated capital after the end of the previous business year, the amount soreduced;
b. in the event that we distributed dividends after the end of the previous business year, the amountset aside in our reserve;
172

c. in the event that we disposed of treasury stock in the process of (x) a merger in which we acquiredall rights and obligations of a company, (y) a corporate split in which we acquired all or a part ofthe rights and obligations of a split company or (z) a share exchange in which we acquired allshares of a company after the end of the previous business year, the difference between the bookvalue of such treasury stock and the consideration that we received for such treasury stock; and
d. in the event that we made (x) a merger in which we acquired all rights and obligations of acompany, (y) a corporate split in which we acquired all or a part of the rights and obligations of asplit company or (z) a share exchange in which we acquired all shares of a company after the endof the previous business year, the aggregate amount of (i) the amount of our additional paid-incapital after such merger, corporate split or share exchange, less the amount of our additionalpaid-in capital before such merger, corporate split or share exchange, and (ii) the amount of ourlegal reserve after such merger, corporate split or share exchange, less the amount of our legalreserve after such merger, corporate split or share exchange.
Under the Corporate Law of Japan, we are permitted to prepare non-consolidated extraordinary financialstatements consisting of a balance sheet as of any date subsequent to the end of the previous business year and anincome statement for the period from the first day of the current business year to the date of such balance sheet.If we prepare such extraordinary financial statements, special provisions may apply to the calculation ofdistributable amounts.
We plan to make distributions of surpluses twice per fiscal year, if possible. The record date for annualdividends is March 31 and the record date for interim dividends is September 30.
Under the Articles of Incorporation, Mitsui is not obliged to pay any interest on interim dividends paid incash which are left unclaimed for a period of three years after the date on which they first became payable.
Shareholders’ Meetings
Mitsui normally holds its ordinary general meeting of shareholders in June of each year in Tokyo, Japan. Inaddition, Mitsui may hold an extraordinary general meeting of shareholders whenever necessary by giving atleast two weeks advance notice to shareholders.
Under the Corporate Law of Japan and related regulations, notice of a general meeting of shareholderssetting forth the date, time, place, purpose thereof etc and providing a summary of the matters to be acted upon,must be mailed to each shareholder having voting rights (or, in the case of a non-resident shareholder, to his orher resident proxy or mailing address in Japan) at least two weeks prior to the date set for the meeting. Therecord date for any ordinary general meeting of shareholders of Mitsui is March 31.
Any shareholder or group of shareholders holding at least 3% of the total outstanding voting rights, for acontinuous period of six months or longer, may require the convocation of a general meeting of shareholders fora particular purpose. Unless such a general meeting of shareholders is convened promptly or a convocation noticeof a meeting which is to be held not later than eight weeks from the day such demand is dispatched, the requiringshareholders may, upon obtaining court approval, convene such shareholders’ meeting.
Any shareholder or group of shareholders holding at least 300 voting rights, or 1% of the total outstandingvoting rights, for a continuous period of six months or longer, may propose a matter to be considered at a generalmeeting of shareholders by making such request to a director at least eight weeks prior to the date set for suchmeeting.
To attend a shareholders’ meeting in person or by proxy, shareholders must provide proof of identity uponrequest. Shareholders may be represented by proxies in writing appointed for the meeting. Proxy must be oneshareholder of Mitsui with voting rights. A Director appointed by the Board of Directors acts as the chairman at ameeting of shareholders.
173

Voting rights
A shareholder is entitled to one vote per unit subject to the limitations on voting rights set forth in thefollowing paragraph and “‘Unit’ share system—Voting rights under the unit share system” below. Except asotherwise provided by law or by the Articles of Incorporation, a resolution can be adopted at a general meeting ofshareholders by a majority of the voting rights represented at the meeting. The Corporate Law of Japan andMitsui’s Articles of Incorporation provide, however, that the quorum for the election of Directors and CorporateAuditors shall not be less than one-third of the total voting rights. Mitsui’s shareholders are not entitled tocumulative voting in the election of Directors. A corporate shareholder, 25% or more of whose outstandingshares are directly or indirectly owned by Mitsui, may not exercise its voting rights with respect to shares ofMitsui that it owns. Shareholders may exercise their voting rights through proxies, provided that the proxies arealso Mitsui’s shareholders holding voting rights. Mitsui’s shareholders also may cast their votes in writing orelectronically.
Under the Corporate Law of Japan and our Articles of Incorporation, certain corporate actions must beapproved by “special shareholders’ resolutions” of our meeting of shareholders, for which the quorum isone-third of the total number of shares having voting rights and the approval of the holders of two-thirds of ourshares having voting rights represented at the meeting is required. Examples of corporate actions that requirespecial shareholders’ resolutions are:
• any amendment to our Articles of Incorporation (except for amendments that may be authorized solelyby the Board of Directors under the Corporate Law of Japan);
• a reduction of capital, except for a reduction of capital for the purpose of replenishing capitaldeficiencies;
• a distribution by us of surpluses in-kind, if we do not grant shareholders the right to require us to effectthe distribution in cash, instead of in-kind;
• a dissolution, merger or consolidation, subject to a certain exception under which a shareholders’resolution is not required;
• the transfer of the whole or an important part of the business, except for the transfer of an important partof the business in which the book value of transferred assets does not exceed 20% of that of thecompany’s total assets;
• the taking over of the whole of the business of any other corporation;
• a share exchange or share transfer for the purpose of establishing a 100% parent-subsidiary relationship,subject to a certain exception under which a shareholders’ resolution is not required;
• a corporate split, subject to a certain exception under which a shareholders’ resolution is not required;
• the offering of new shares at a “specially favorable” price and any offering of stock acquisition rights orbonds with stock acquisition rights at a “specially favorable” price or in a “specially favorable”condition to any persons other than shareholders; and
• any purchase of the company’s own shares from a certain person.
Liquidation rights
In the event of Mitsui’s liquidation, the assets remaining after payment of all debts and liquidation expensesand taxes will be distributed among shareholders in proportion to the respective number of shares of commonstock held.
174

Record date
March 31 is the record date for Mitsui’s year-end dividends. The shareholders and beneficial shareholderswho are registered as the holders of the number of shares constituting 1 unit or more whole units in Mitsui’sregister of shareholders and/or beneficial shareholders at the end of each March 31 are also entitled to exerciseshareholders’ voting rights at the ordinary general meeting of shareholders with respect to the fiscal year endingon such March 31. September 30 is the record date for interim dividends.
Mitsui’s shares generally go ex-dividend or ex-rights on Japanese stock exchanges on the third business dayprior to a record date (or if the record date is not a business day, the fourth business day prior thereto), for thepurpose of dividends or rights offerings.
Repurchase by Mitsui of its Common Stock
Under the Corporate Law of Japan and the Mitsui’s Articles of Incorporation, Mitsui may acquire its ownshares (i) from a specific shareholder other than any of its subsidiaries (pursuant to a special resolution of ageneral meeting of shareholders), (ii) from any of its subsidiaries (pursuant to a resolution of the Board ofDirectors), or (iii) by way of purchase on any Japanese stock exchange on which Mitsui’s shares are listed or byway of tender offer (as long as its non-consolidated annual financial statements and certain documents for the lastbusiness year fairly present its asset and profit or loss status, as required by ordinances of the Ministry of Justice)(in either case pursuant to an ordinary resolution of a general meeting of shareholders or a resolution of theBoard of Directors). In the case of (i) above, any other shareholder may make a request to Mitsui that such othershareholder be included as a seller in the proposed purchase, provided that no such right will be available if thepurchase price or any other consideration to be received by the relevant specific shareholder will not exceed thelast trading price of the shares on the relevant stock exchange on the day immediately preceding the date onwhich the resolution mentioned in (i) above was adopted (or, if there is no trading in the shares on the stockexchange or if the stock exchange is not open on such day, the price at which the shares are first traded on suchstock exchange thereafter). The total amount of the purchase price of Mitsui’s own shares may not exceed theDistributable Amount, as described in the “Dividends” above.
Mitsui may also acquire its own shares in response to a shareholder’s request for purchase of his or hershares representing less than 1 unit. See “‘Unit’ share system—Repurchase by Mitsui of shares constituting lessthan a full unit” below.
Transfer of shares
Under the Corporate Law of Japan, the transfer of shares of a company which issues share certificates iseffected by delivery of share certificates but, in order to assert shareholders’ rights against a company, thetransferee must have its name and address registered on a company’s register of shareholders. For this purpose,Mitsui’s shareholders are required to file their names, addresses and seals with The Chuo Mitsui Trust andBanking Company, Limited, which is the manager of Mitsui’s register of shareholders. Foreign shareholders mayfile specimen signatures in lieu of seals. Non-resident shareholders are required to appoint a standing proxy inJapan or designate a mailing address in Japan.
The central clearing system of share certificates under the Law Concerning Central Clearing of Share Certificatesand Other Securities in Japan applies to Mitsui’s shares. Pursuant to this system, a holder of shares is able to choose, athis/her discretion, to participate in this system and all certificates of the shares elected to be put into this system aredeposited with the Japan Securities Depository Center, Inc. (“JASDEC”) (through a participating institution having aclearing account with JASDEC, if the holder is not such a participating institution) and all such shares are registered inthe name of JASDEC, on Mitsui’s register of shareholders. Each participating shareholder (“beneficial shareholder”)will, in turn, be registered in the register of Mitsui’s beneficial shareholders, and be treated in the same way asshareholders registered on Mitsui’s register of shareholders. In connection with the transfer of shares held under thissystem, entry of the share transfer in the register maintained by JASDEC for participating institutions shall have thesame effect as delivery of share certificates.
175
A law to establish a new central clearing system for shares of listed companies and to eliminate the issuanceand use of certificates for such shares was promulgated in June 2004 and the relevant part of the law will comeinto effect within five years of the date of the promulgation. Currently, the effective date has not yet beendetermined but is expected to be January 5, 2009. On the effective date, a new central clearing system will beestablished and the shares of all Japanese companies listed on any Japanese stock exchange, including Mitsui’sshares, will be subject to the new central clearing system. On the same day, Mitsui will be deemed to become acompany which shall not issue share certificates for its shares and all existing share certificates will become nulland void. Thereafter, the transfer of such shares will be effected through entry in the records maintained underthe new central clearing system. Only shares deposited with JASDEC will be immediately transferable under thenew central clearing system. Upon the effective date, any requirement, reference and discussion relating to sharecertificates included in this section “Transfer of shares” will not be applicable.
“Unit” share system
Pursuant to the Corporate Law of Japan, Mitsui has adopted 1,000 shares (50 ADSs) as 1 unit of shares.This unit share system is called “tangen-kabu-system.”
Any amendment to the Articles of Incorporation reducing the number of shares constituting a unit oreliminating the provisions for units of shares may be made by a resolution of the Board of Directors rather thanby special shareholders’ resolutions. The number of shares constituting 1 unit cannot exceed 1,000.
Voting rights under the unit share system
Under the unit share system, shareholders shall have one voting right for each unit of shares that they hold.Any number of shares less than a full unit will carry no voting rights.
Share certificates for less than a unit of shares
Under its Articles of Incorporation, except as otherwise provided in the Share Handling Regulations, Mitsuiwill not issue share certificates for less than one unit of shares. Thus, unless Mitsui’s Board of Directors passes aresolution to eliminate the provisions for units of shares from the Articles of Incorporation or the shareholdersamend the Articles of Incorporation by special shareholders resolutions to eliminate the provision fornon-issuance of share certificates for less than one unit of shares, a share certificate for any number of shares lessthan a full unit will in general not be issued. As the transfer of shares normally requires the delivery of sharecertificates, any fraction of one unit for which no share certificates are issued is not transferable.
Repurchase by Mitsui of shares constituting less than a full unit
A holder of shares constituting less than one unit may require Mitsui to purchase such shares at their marketvalue.
Increase in purchase of the shares to make one unit
Under the Articles of Incorporation, any shareholder who holds shares less than one unit may request Mitsuito sell such number of shares owned by Mitsui as are necessary to make one unit by adding the number of sharesowned by such shareholder in accordance with the Share Handling Regulations and the Corporate Law of Japan.
Effect of the unit share system on holders of ADSs
A holder who owns ADSs evidencing less than 1,000 common shares will indirectly own less than onewhole unit. Although, as discussed above, under the unit share system holders of less than one unit have the rightto require Mitsui to purchase their shares or sell such number of shares owned by Mitsui as are necessary to make
176

one unit by adding the number of their shares, holders of ADSs that represent other than integral multiples ofwhole units are unable to withdraw the underlying shares representing less than one unit and, therefore, areunable, as a practical matter, to exercise the rights to require Mitsui to purchase nor sell such underlying shares,unless Mitsui’s Articles of Incorporation are amended to eliminate the provision not to issue share certificates forthe number of shares less than one whole unit. As a result, access to the Japanese markets by holders of ADSsthrough the withdrawal mechanism will not be available for dispositions of shares in lots less than one unit. Theunit share system does not affect the transferability of ADSs, which may be transferred in lots of any size.
Reporting of Substantial Shareholdings
The Financial Instruments and Exchange Law of Japan and its related regulations require any person whohas become, beneficially and solely or jointly, a holder of more than 5% of the total issued shares of a companylisted on any Japanese stock exchange or whose shares are traded on an over-the-counter market in Japan, to filea report concerning such shareholdings with the director of the relevant Local Finance Bureau of the Ministry ofFinance within five business days. With certain exceptions, a similar report must also be made in respect of anysubsequent change of 1% or more in any such holding or of any change in material matters set out in anypreviously-filed reports. For this purpose, shares issuable or transferable to such person upon exercise ofexchangeable securities, conversion of convertible securities or exercise of warrants or stock acquisition rights(including those incorporated in bonds with share subscription rights) are taken into account in determining boththe number of shares held by such holder and the issuer’s total issued share capital. Copies of each report mustalso be furnished to the issuer of the shares and to all Japanese stock exchanges on which the shares are listed or,in the case of shares traded over-the-counter, to the Japan Securities Dealers Association.
Exercise of Voting Rights
Except for the general limitation under Japanese anti trust and anti monopoly regulations against the holdingof shares of a Japanese corporation which leads or may lead to a restraint of trade or monopoly, and except forgeneral limitations under the Corporate Law of Japan or Mitsui’s Articles of Incorporation on the rights ofshareholders applicable regardless of residence or nationality, there is no limitation under Japanese laws andregulations applicable to Mitsui or under its Articles of Incorporation on the rights of non-resident or foreignshareholders to hold or exercise voting rights on the shares of common stock of Mitsui.
Change in Control
There is no provision in Mitsui’s Articles of Incorporation that would have an effect of delaying, deferringor preventing a change in control of Mitsui and that would operate only with respect to merger, consolidation,acquisition or corporate restructuring involving Mitsui.
Daily Price Fluctuation Limits under Japanese Stock Exchange Rules
Share prices on Japanese stock exchanges are determined on a real-time basis by the equilibrium betweenbids and offers. These exchanges are order-driven markets without specialists or market makers to guide priceformation. To prevent excessive volatility, these exchanges set daily upward and downward price fluctuationlimits for each share, based on the previous day’s closing price. Although transactions may continue at theupward or downward limit price if the limit price is reached on a particular trading day, no transactions may takeplace outside these limits. Consequently, an investor wishing to sell at a price above or below the relevant dailylimit may not be able to sell his or her shares at such price on a particular trading day, or at all.
177

On July 31, 2008, the closing price of our shares on the Tokyo Stock Exchange was ¥2,235 per share. Thefollowing table shows the respective daily price limit for a stock on the Tokyo Stock Exchange with a closingprice per share corresponding to four ranges. Other daily price limits would apply if our per share price moved toother ranges.
Selected Daily Price Limits
Previous Day’s Closing Price or Special Quote Maximum Daily Price Movement
Greater or equal to . . . . . . . . . . . . . . . . ¥1,000 Less than ¥1,500 200Greater or equal to . . . . . . . . . . . . . . . . 1,500 Less than 2,000 300Greater or equal to . . . . . . . . . . . . . . . . 2,000 Less than 3,000 400Greater or equal to . . . . . . . . . . . . . . . . 3,000 Less than 5,000 500
For a history of the trading price of our shares on the Tokyo Stock Exchange, see “Item 9.A. Offer andListing Details” of this annual report.
C. Material Contracts.
We have not been a party to any material contract, other than contracts entered into in the ordinary course ofbusiness, within past two years immediately preceding the date of this report.
D. Exchange Controls.
Foreign Exchange Regulations
The Foreign Exchange and Foreign Trade Law of Japan, as currently in effect, and the cabinet orders andministerial ordinances thereunder (the “Foreign Exchange Regulations”) govern certain matters relating to theacquisition and holding of the shares or the ADSs, by “Non-Residents of Japan” and by “Foreign Investors” ashereinafter defined.
“Non-Residents of Japan” are defined as individuals who are not resident in Japan and corporations whoseprincipal offices are located outside Japan. Branches and other offices of Japanese corporations located outsideJapan are regarded as Non-Residents of Japan, and branches and other offices located within Japan of foreigncorporations are regarded as residents of Japan. “Foreign Investors” are defined to be (i) individuals not residentin Japan, (ii) corporations which are organized under the laws of foreign countries or whose principal offices arelocated outside Japan, and (iii) other corporations of which (a) 50% or more of the shares are held directly orindirectly by (i) or (ii) above, (b) a majority of officers consists of Non-Residents of Japan or (c) a majority ofofficers having the power of representation consists of Non-Residents of Japan.
Acquisition of Shares
In general, acquisition of shares of stock of a Japanese company listed on any Japanese stock exchange ortraded in any over-the-counter market in Japan (“Listed Shares”) by a Non-Resident of Japan from a resident ofJapan is not subject to any prior filing requirements except as described below. However, the Minister of FinanceJapan (the “MOF”) and other Ministers having jurisdiction over the business of the subject company (together,the “Ministers”) may require a prior approval for any such acquisition in certain exceptional circumstances. Theresident of Japan who transferred the shares of a Japanese company to a Non-Resident of Japan must file a reportconcerning such transfer with the MOF within 20 days after the transfer unless such transfer is made through abank, securities company or financial futures trader licensed under the relevant Japanese law or consideration ofsuch transfer is ¥100 million or less.
178

If the number of Listed Shares to be acquired, or the number of Listed Shares that will be held as a result ofsuch acquisition, by a Foreign Investor (whether from a resident of Japan, another Foreign Investor or from orthrough security companies) is 10% or more of the total outstanding shares of the subject company, the ForeignInvestor must file a post facto report with the Ministers within 15 days of the date of acquisition. In certainexceptional cases, a prior notification is required in respect of such an acquisition.
Acquisition of Shares upon Exercise of Subscription Rights Attached to Bonds
The acquisition by a Non-Resident of Japan of shares upon exercise of his or her rights under the bonds withrights for subscription of new shares offered overseas is exempted from the notification and reportingrequirements described under this “Item 10.D. Exchange Controls—Acquisition of Shares” above.
ADRs
The deposit of the shares by a Non-Resident of Japan, the issuance of the ADRs, in exchange therefore andthe withdrawal of the underlying shares upon surrender of the ADRs are not subject to any formalities referred tounder “Acquisition of Shares” above, except where as a result of such deposit (or withdrawal) the aggregatenumber of shares held by the depositary (or its nominee) or the holder surrendering the ADRs, as the case maybe, would be certain percentage of the total outstanding shares, in which event the relevant report is required asoutlined under “Item 10. B. Memorandum and Articles of Association—Reporting of Substantial Shareholdings”and/or under this “Item 10.D. Exchange Controls—Acquisition of Shares.”
Dividends and Proceeds of Sales
Dividends paid on, and the proceeds of sales in Japan of the shares held by Non-Residents of Japan may beconvertible into any foreign currency and repatriated abroad with no limit on the amount under the ForeignExchange Regulations currently in effect. The acquisition of the shares by Non-Residents of Japan by way ofstock splits is not subject to any of the aforesaid notification and confirmation requirements.
E. Taxation.
Japanese Taxation
The following is a summary of the principal Japanese national tax consequences to owners of our shares orADSs who are non-resident individuals or non-Japanese corporations without a permanent establishment in Japanto which income from our shares is attributable. The tax treatment is subject to possible changes in the applicableJapanese laws or double taxation conventions occurring after that date. This summary is not exhaustive of allpossible tax considerations that may apply to a particular investor. Investors are encouraged to consult their owntax advisers as to:
• the overall tax consequences of the acquisition, ownership and disposition of shares or ADSs, includingspecifically the tax consequences under Japanese law;
• the laws of the jurisdiction of which they are resident; and
• any tax treaty between Japan and their country of residence.
Generally, a non-resident holder of shares or ADSs is subject to Japanese withholding tax on dividends paidby us. In the absence of any applicable tax treaty, convention or agreement reducing the maximum rate ofwithholding tax, the rate of Japanese withholding tax applicable to dividends paid by us to non-resident holders is7% for dividends to be paid on or before March 31, 2009, and 15% thereafter, except for dividends paid to anyindividual shareholder who holds 5% or more of the issued shares of Mitsui. Japan has income tax treaties,conventions or agreements whereby the maximum withholding tax rate for dividend payment is set at, in mostcases, 15% for portfolio investors, with, among other countries, Australia, Belgium, Canada, Denmark, Finland,
179
Germany, Ireland, Italy, Luxembourg, The Netherlands, New Zealand, Norway, Singapore, Spain, Sweden andSwitzerland. Japan’s income tax treaties with the United Kingdom and France set the maximum withholding rateat 10%. Under the U.S.-Japan tax treaty (the “Treaty”), the maximum withholding rate on dividends for portfolioinvestors is 10%, if (i) they do not have a permanent establishment in Japan, and (ii) the shares on ADSs withrespect to which such dividends are paid are not effectively connected with such permanent establishment, and(iii) they are qualified U.S. residents eligible for benefits under the Treaty. Under the Treaty, withholding tax ondividends for pension funds which are qualified U.S. residents eligible for benefits under the Treaty is exemptfrom Japanese taxation by way of withholding or otherwise, unless such dividends are derived from the carryingon of a business, directly or indirectly, by such pension funds. Japanese tax law provides in general that if theJapanese statutory rate is lower than the maximum rate applicable under tax treaties, conventions or agreements,the Japanese statutory rate shall be applicable.
Stock splits are not subject to Japanese income or corporate tax. A capitalization of capital surplus is notsubject to Japanese income or corporate tax.
Non-resident holders who are entitled to a reduced rate of Japanese withholding tax on payments ofdividends on the shares by us are required to submit an Application Form for the Income Tax Conventionregarding Relief from Japanese Income Tax on Dividends in advance through us to the relevant tax authoritybefore the payment of dividends. A standing proxy for non-resident holders may provide the application. Withrespect to ADSs, this reduced rate is applicable if the depositary or its agent submits two Application Forms forIncome Tax Convention (one prior to payment of dividends, the other within eight months after our fiscal year-end). To claim this reduced rate, a non-resident holder of ADSs will be required to file proof of taxpayer status,required by the depositary. Non-resident holders who do not submit an application in advance will generally beentitled to claim a refund from the relevant Japanese tax authority of withholding taxes withheld in excess of therate of an applicable tax treaty.
Gains derived from the sale outside Japan of Mitsui’s shares or the ADSs by Non-Residents of Japan,including non-Japanese corporations, will not be subject to Japanese taxes on income. Gains derived from thesale in Japan of Mitsui’s shares or the ADSs by a Non-Resident of Japan or a non-Japanese corporation nothaving a permanent establishment in Japan to which such income is attributable are, in general, not subject toJapanese income or corporate tax.
Japanese inheritance and gift taxes, at progressive rates, may be payable by an individual who acquires the sharesor the ADSs as a legatee, heir or donee.
United States Taxation
General
This discussion of certain U.S. federal tax consequences only applies to U.S. holders (as defined below)who hold our ADSs or common shares as capital assets for tax purposes and are not members of a special class ofholders subject to special rules, including: dealers in securities; traders in securities who elect to use amark-to-market method of accounting for their securities holdings; tax-exempt organizations; insurancecompanies; persons liable for alternative minimum tax; persons who actually or constructively own 10% or moreof Mitsui voting stock; persons who hold shares or ADSs as part of a hedging or straddle or conversiontransaction; or persons whose functional currency is not the U.S. dollar. A U.S. holder is a beneficial owner ofshares or ADSs that is: a citizen or resident of the United States; a domestic corporation; an estate whose incomeis subject to U.S. federal income tax regardless of its source; or a trust, if a U.S. court can exercise primarysupervision over the trust’s administration and one or more U.S. persons are authorized to control all substantialdecisions of the trust.
This section is based on the Internal Revenue Code of 1986, as amended, its legislative history, existing andproposed regulations, published rulings and court decisions. These laws are subject to change, possibly on aretroactive basis. In addition, this section is based in part upon the assumption that each obligation in the depositagreement and any related agreement will be performed in accordance with its terms.
180

Moreover, the effect of any applicable U.S. state or local tax laws is not discussed in this annual report.
In general, and taking into account earlier assumptions, for U.S. federal income tax purposes, if a personholds ADRs evidencing ADSs, that person will be treated as the owner of the underlying shares represented bythose ADSs. Exchanges of common shares for ADRs, and ADRs for ordinary shares, will generally not besubject to U.S. federal income tax.
Each holder should consult its own tax advisor regarding the United States federal, state and local and other taxconsequences of owning and disposing of common shares and ADSs in its particular circumstances. In particular, eachholder should confirm its status as a person eligible for benefits under the Treaty with its advisor and should discussany possible consequences of failing to qualify as a person eligible for benefits under the Treaty.
If a partnership holds the common shares or ADSs, the U.S. federal income tax treatment of a partner willgenerally depend on the status of the partner and the tax treatment of the partnership. A partner in a partnershipholding the common shares or ADSs should consult its tax advisor with regard to the US federal income taxtreatment of an investment in the common shares or ADSs.
Taxation of Dividends
Subject to the passive foreign investment company (“PFIC”) rules discussed below, the gross amount of anydividend paid to a U.S. holder by Mitsui out of its current or accumulated earnings and profits (as determined forU.S. federal income tax purposes) is subject to United States federal income taxation. For noncorporateU.S. holders, dividends paid in taxable years beginning before January 1, 2011 that constitute qualified dividendincome will be taxable at a maximum tax rate of 15% provided that shares or ADSs were held for more than60 days during the 121-day period beginning 60 days before the ex-dividend date and other holding periodrequirements are met. Dividends Mitsui pays with respect to its shares or ADSs generally will be qualifieddividend income. Dividends are taxable to U.S. holders when they, in the case of shares, or the depositary, in thecase of ADSs, receive them, either actually or constructively. The dividend will not be eligible for the dividends-received deduction generally allowed to U.S. corporations in respect of dividends received from otherU.S. corporations. Any distribution in excess of current and accumulated earnings and profits (as determined forU.S. federal income tax purposes) will be treated as a non-taxable return of capital to the extent of a holder’sbasis in the ADSs or common shares and thereafter as capital gain.
A U.S. holder must include any foreign tax withheld from the dividend payment in his or her gross amounteven though the U.S. holder did not in fact receive it. The amount of the dividend distribution that a U.S. holdermust include in his or her income will be the U.S. dollar value of the Japanese yen payments made, determined atthe spot Japanese yen/ U.S. dollar rate on the date such dividend distribution is includible in such holder’sincome, regardless of whether the payment is in fact converted into U.S. dollars. Generally, any gain or lossresulting from currency exchange fluctuations during the period from the date a holder includes the dividendpayment in income to the date such payment is converted into U.S. dollars will be treated as ordinary income orloss and will not be eligible for the special tax rate applicable to qualified dividend income. Such gain or loss willgenerally be income or loss from sources within the United States for foreign tax credit limitation purposes.
Dividends will be income from sources outside the United States, but dividends paid in taxable yearsbeginning before January 1, 2007 generally will be “passive” or “financial services” income, and dividends paidin taxable years beginning after December 31, 2006 will, depending on the U.S. holder’s circumstances, be“passive” or “general” income which, in either case, is treated separately from other types of income for purposesof computing the foreign tax credit allowable to the U.S. holder. No U.S. foreign tax credit will be allowed toU.S. holders of common shares or ADSs in respect of any personal property or similar tax imposed by Japan (orany taxing authority thereof or therein). Subject to certain limitations, the Japanese tax withheld and paid over toJapan will be creditable or deductible against your United States federal income tax liability. Special rules applyin determining the foreign tax credit limitation with respect to dividends that are subject to the maximum 15%tax rate. U.S. holders should consult their own tax advisors concerning the implications of U.S. foreign tax creditrules in light of their particular circumstances.
181

Taxation of Capital Gains
Subject to the PFIC rules discussed below, a U.S. holder who sells or otherwise disposes of common sharesor ADSs will recognize gain or loss for U.S. federal income tax purposes in an amount equal to the differencebetween the U.S. dollar value of the amount realized and his or her tax basis (determined in U.S. dollars) in suchshares or ADSs. Capital gain of a noncorporate U.S. holder that is recognized in taxable years beginning beforeJanuary 1, 2011 is generally taxed at a maximum rate of 15% where the holder has a holding period greater thanone year. The gain or loss will generally be income or loss from sources within the U.S. for foreign tax creditlimitation purposes.
PFIC Rules
Mitsui does not believe that the common shares or ADSs will be treated as stock of a PFIC for United Statesfederal income tax purposes, but this conclusion is a factual determination that is made annually and thus issubject to change. If Mitsui were treated as a PFIC, unless a U.S. holder elected to be taxed annually on amark-to-market basis with respect to the common shares or ADSs, gain realized on the sale or other dispositionof the shares or ADSs would in general not be treated as capital gain. Instead a U.S. holder would be treated as ifhe or she had realized such gain and certain “excess distributions” ratably over the holding period for the sharesor ADSs and would be taxed at the highest tax rate in effect for each such year to which the gain was allocated,together with an interest charge in respect of the tax attributable to each such year. With certain exceptions, thecommon shares or ADSs will be treated as stock in a PFIC if Mitsui were a PFIC at any time during the U.S.holder’s holding period in the common shares or ADSs. In addition, dividends received from Mitsui would not beeligible for the special tax rates applicable to qualified dividend income if Mitsui were a PFIC either in thetaxable year of the distribution or the preceding taxable year, but instead would be taxable at rates applicable toordinary income.
F. Dividends and Paying Agents.
Not applicable.
G. Statement by Experts.
Not applicable.
H. Documents on Display.
We are subject to the informational requirements of the Securities Exchange Act of 1934 and, in accordancetherewith, we file annual reports on Form 20-F within six months of our fiscal year-end and furnish other reports andinformation on Form 6-K with the Securities and Exchange Commission. These reports and other information can beinspected at the public reference room at the Securities and Exchange Commission at 100 F Street, N.E.,Washington, D.C. 20549. You can also obtain copies of such material by mail from the public reference room of theSecurities and Exchange Commission at prescribed fees. You may obtain information on the operation of the Securitiesand Exchange Commission public reference room by calling the Securities and Exchange Commission in the UnitedStates at 1-800-SEC-0330. You can also access to the documents filed via the Electronic Data Gathering, Analysis andRetrieval, or EDGAR, system on the website of the Securities and Exchange Commission (http://www.sec.gov).
I. Subsidiary Information.
Not applicable.
182

Item 11. Quantitative and Qualitative Disclosures about Market Risk.
Our business transactions are exposed to various aspects of market risks in interest rates, foreign currencyexchange rates, commodity prices and equity prices. Particularly, Mitsui and certain subsidiaries are engaged intrading activities which include mainly active and repeated selling and buying transactions of derivative financialand commodity instruments. In order to control exposures to those risks, we set position limits and loss limits(trading limits) both for trading activities and non-trading activities.
Monitoring Market Risks at Our Organization
We have market risk management policies and procedures at several levels throughout our organization. ChiefOperating Officer of each operating segment has the primary responsibility for setting the trading limits, controllingand managing market risk within the trading limits. Each operating segment must maintain a framework which alsocovers its major subsidiaries for measuring portfolio risk within its risk limits. The transactions are recorded byindependent monitoring sections.
The Market Risk Management Division within our headquarters monitors the company-wide process of riskmanagement and compliance with trading limits set for operating segments. The Market Risk ManagementDivision also provides general supervision over the market risk management process for operating segments.
The Market Risk Management Division periodically reports the market risk positions to Chief FinancialOfficer which includes analyses on Value-at-Risk (“VaR”) amounts for specified market risk positions. Forderivative financial and commodity instruments entered into as trading activities including swap transactions,forward contracts, futures and other instruments, it measures VaR amounts on a daily basis and conducts back-testing to verify effectiveness of its VaR calculation models by comparing assumptions and estimations withactual results periodically.
VaR Analysis at Mitsui
VaR is a statistical measure of the potential change in market value of portfolios resulting from adversemarket movements in underlying risk factors, over a defined period, within a certain confidence level. AtMarch 31, 2008 and 2007, we calculated VaR using the following assumption and parameters:
• holding period of one day with respect to the interest rate, foreign currency exchange rate andcommodity price risks (with some exceptions to certain commodity price risks where in case VaRs infive days are used); and
• a variance-covariance method, a historical simulation approach and/or Monte Carlo simulation with aconfidence level of 95% or higher.
As VaR is an estimation based on past market data regarding changes in market risk factors, our actualresults may differ materially from the calculations. Moreover, the sum of the VaRs of each risk category does notrepresent VaR of our combined portfolio, since market risk factors such as interest rates and currency exchangerates are partially correlated and a change in market value affected by certain risk factor may offset effects ofother risk factors.
VaRs for Trading Activities
The following table sets forth the year end, high, low, and average VaR figures of trading portfolios whichare mainly corresponding to interest rate risk, foreign exchange rate risk and commodity price risk for the yearsended March 31, 2008 and 2007. Each category represents principally the following transactions:
• interest rate sensitive financial (derivative and non-derivative) instrument trading conducted by theFinancial Markets Business Unit(i);
• foreign exchange trading (forwards, swaps, options and non-deliverable forwards) conducted by theFinancial Markets Business Unit(ii); and
183

• commodity derivative trading, such as futures, forwards, swaps and options related to energy productsincluding crude oil and oil products; precious metals and base metals including gold, silver, platinum,palladium, copper, lead, nickel and aluminum; and agricultural products including wheat, coffee and soybeans; and weather derivative trading conducted by the Financial Markets Business Unit and otherbusiness units(iii).
Millions of Yen
Years Ended March 31,
2008 2007
Year End High Low Average Year End High Low Average
Interest rate risk . . . . . . . . . . . . . . . . . . ¥ 0 ¥ 25 ¥ 0 ¥ 8 ¥ 55 ¥ 128 ¥ 1 ¥ 60Foreign currency exchange rate risk . . 77 77 6 37 52 244 26 103Commodity price risk . . . . . . . . . . . . . . 1,914 2,762 1,914 2,505 2,582 3,327 2,427 2,790
(i) (ii) In our organization most of the limits related to interest rate and foreign exchange for trading purpose hadbeen delegated to the Financial Markets Business Unit. Since January 2008, the relevant departmentshave been transferred to the Finance Division in the All Other Segment. Those limits approved for otheroperating segments are immaterial.
(iii) In the Americas Segment, Westport Petroleum, Inc. (United States) has considerable limits and positionsin oil products.
VaRs for Non-Trading Activities
In this item, “Non-Trading” represents contractual business transactions other than “trading activities” asdiscussed above. The following table sets forth the year-end, high, low and average VaR figures of interest raterisk, foreign currency exchange rate risk and commodity price risk for non-trading activities for the years endedMarch 31, 2008 and 2007.
With regard to these risks, the Market Risk Management Division obtains monthly reports of positions for“Non-Trading Activities” as well as for “Trading Activities” discussed above from all the operating segments,and also reports those risk positions including the VaR analysis results to Chief Financial Officer.
• Interest rate risk in this paragraph only represents the net risk exposure to rising interest rates at the HeadOffice of Mitsui for short and long term finance and liquidity management purpose. See “Item 5. B.LIQUIDITY AND CAPITAL RESOURCES”—“Finance and Liquidity Management.” This net riskposition is monitored through an asset-liability management approach, categorizing assets and liabilities byattributes of sensitivity to interest rate fluctuations.
• Foreign exchange rate risk consists of the net risk position of transactions denominated in foreigncurrencies, mainly in U.S. dollars and Australian dollars, which include paying and receivingtransactions in commercial contracts, long-term financing transactions, identifiable commitments andforecasted transactions, taking into consideration the effect of hedging transactions such as forwardcontracts and currency options.
• Commodity price risk consists of the net balance of commodity positions and commodity derivativeinstruments utilized to hedge the commodity price risk associated with non-derivative commoditypositions such as physical commodity inventories and firm commitments in precious metals and basemetals; energy products; and agricultural products.
Millions of Yen
Years Ended March 31,
2008 2007
Year End High Low Average Year End High Low Average
Interest rate risk . . . . . . . . . . . . . . . . . . ¥ 469 ¥ 677 ¥347 ¥ 515 ¥ 627 ¥1,128 ¥627 ¥ 838Foreign currency exchange rate risk . . 2,804 3,292 423 1,366 1,381 1,381 202 751Commodity price risk . . . . . . . . . . . . . 380 717 380 545 939 1,807 939 1,354
184

Market Risk Positions from Non-Trading Activities
We have disclosed non-trading market risk exposures in terms of VaR as shown above. However, werecognize that market risk exposures in terms of outstanding positions will be more useful for investors asfundamental information.
“Non-Trading” represents business transactions other than “trading activities” as discussed above. Thefollowing tables set forth the positions of interest rate risk, foreign currency exchange rate risk and commodityprice risk for non-trading purposes for the year ended March 31, 2008.
Interest rate risk
We are exposed to interest rate risk on our interest bearing debt, which primarily consists of borrowings andbonds denominated in Japanese yen and U.S. dollars. We have entered into interest rate derivative transactionsprimarily to hedge the exposure we hold on these financial instruments. Our interest rate derivatives transactionsmainly consist of interest rate swaps and currency swaps to convert fixed rate exposures to floating rateexposures. The table below illustrates the structure of interest types (floating/fixed) of our interest bearing debt asof March 31, 2008 that was derived from fund raising activities, taking into consideration the effect of hedgingtransactions by these financial derivatives. See also “Item 5. B. LIQUIDITY AND CAPITAL RESOURCES”—“Finance and Liquidity Management.”
Billions of Yen
March 31, 2008
Name of currencies Floating Rate Fixed Rate
Japanese Yen . . . . . . . . . . . . . . . . . . . . . . . . . . . . . . . . . . . . . . . . . . . . . . . . . . . . . 1,632.2 844.8U.S. Dollar . . . . . . . . . . . . . . . . . . . . . . . . . . . . . . . . . . . . . . . . . . . . . . . . . . . . . . 779.2 221.3Others . . . . . . . . . . . . . . . . . . . . . . . . . . . . . . . . . . . . . . . . . . . . . . . . . . . . . . . . . . 82.7 62.1
Total . . . . . . . . . . . . . . . . . . . . . . . . . . . . . . . . . . . . . . . . . . . . . . . . . . . . . . . . . . . 2,494.1 1,128.2
Foreign currency exchange rate risk
We are exposed to foreign currency exchange rate risk on the net risk position of transactions denominatedin foreign currencies, mainly in U.S. dollars and Australian dollars, which include paying and receivingtransactions in commercial contracts, long-term financing transactions, identifiable commitments and forecastedtransactions, taking into consideration the effect of hedging transactions such as forward contracts and currencyoptions. The table below sets forth information on our foreign exchange positions as mentioned above againstJapanese Yen as of March 31, 2008.
Billions of Yen
March 31, 2008
Name of currencies Long Short Net
U.S. Dollar . . . . . . . . . . . . . . . . . . . . . . . . . . . . . . . . . . . . . . . . . . . . . . . . . . . . . . . . 85.8 234.0 (148.2)Australian Dollar . . . . . . . . . . . . . . . . . . . . . . . . . . . . . . . . . . . . . . . . . . . . . . . . . . . 201.7 38.1 163.6Others . . . . . . . . . . . . . . . . . . . . . . . . . . . . . . . . . . . . . . . . . . . . . . . . . . . . . . . . . . . . 26.6 16.2 10.4
Total . . . . . . . . . . . . . . . . . . . . . . . . . . . . . . . . . . . . . . . . . . . . . . . . . . . . . . . . . . . . . 314.1 288.3 25.8
Commodity price risk
The table below sets forth information on our commodity forward and future positions as of March 31,2008, classified by products of precious metals and base metals; energy products; and agricultural products. Eachfigure represents the magnitude of outstanding balances of commodity forward contracts and futures utilized to
185

hedge or mitigate the commodity price risk associated with non-derivative commodity positions such as physicalinventories and firm commitments. Those figures, therefore, do not include those non-derivative commoditypositions.
Billions of Yen
March 31, 2008
Name of commodities Long Short Net
Non-ferrous metals(1) . . . . . . . . . . . . . . . . . . . . . . . . . . . . . . . . . . . . . . . . . . . . . . . . 246.0 264.8 (18.8)Petroleum (Energy)(2) . . . . . . . . . . . . . . . . . . . . . . . . . . . . . . . . . . . . . . . . . . . . . . . . 152.5 170.3 (17.8)Foodstuff . . . . . . . . . . . . . . . . . . . . . . . . . . . . . . . . . . . . . . . . . . . . . . . . . . . . . . . . . . 12.0 20.6 (8.6)
Total . . . . . . . . . . . . . . . . . . . . . . . . . . . . . . . . . . . . . . . . . . . . . . . . . . . . . . . . . . . . . 410.5 455.7 (45.2)
(1) Non-ferrous metals include precious metals (gold, silver and platinum, among others) and base metals(copper, aluminium and nickel, among others).
(2) Petroleum (Energy) includes crude oil, oil products, LPG etc.
Equity Price Risk
We hold stocks issued by, amongst others, our customers and suppliers as marketable securities, intendingto strengthen ties with them. The fair value and unrealized holding net gains (losses) on marketable equitysecurities by industry at March 31, 2008 and 2007 were as follows:
Billions of Yen
March 31, 2008 March 31, 2007
Fair Value
UnrealizedHolding
Net Gains (Losses) Fair Value
UnrealizedHolding
Net Gains
Manufacturing . . . . . . . . . . . . . . . . . . . . . . . . . . . . . . . . . . . . ¥425.7 ¥179.3 ¥409.8 ¥232.1Commercial, finance and real estate . . . . . . . . . . . . . . . . . . . 70.9 (15.7) 135.3 41.9Transport and telecommunication . . . . . . . . . . . . . . . . . . . . . 36.7 16.9 56.4 29.2Energy, service and others . . . . . . . . . . . . . . . . . . . . . . . . . . . 118.7 83.8 260.0 162.3
Total . . . . . . . . . . . . . . . . . . . . . . . . . . . . . . . . . . . . . . . . . . . . ¥652.0 ¥264.3 ¥861.5 ¥465.5
For the year ended March 31, 2008, the general decrease in unrealized holding gains and fair valuecompared to the year ended March 31, 2007 was mainly due to the overall stagnation of Japanese stock prices.Unrealized holding net “loss” of Commercial, finance and real estate was especially due to the sank of real estatesector. For the details, see “Item 5. B. LIQUIDITY AND CAPITAL RESOURCES”—”Assets, Liabilities andShareholders’ Equity.”
Maturities and fair values of debt securities classified as available-for-sale and held-to-maturity atMarch 31, 2008 were as follows:
Billions of Yen
Available-for-sale Held-to-maturity
AmortizedCost
AggregateFair Value
Amortizedcost
AggregateFair Value
Contractual maturities:Within 1 year . . . . . . . . . . . . . . . . . . . . . . . . . . . . . . . . . . . . . . . . ¥38.2 ¥38.2 ¥0.1 ¥0.1After 1 year through 5 years . . . . . . . . . . . . . . . . . . . . . . . . . . . . . 17.4 17.4 2.6 2.6After 5 years through 10 years . . . . . . . . . . . . . . . . . . . . . . . . . . . 2.5 2.5 0.0 0.0After 10 years . . . . . . . . . . . . . . . . . . . . . . . . . . . . . . . . . . . . . . . . 0.0 0.0 0.0 0.0
Total . . . . . . . . . . . . . . . . . . . . . . . . . . . . . . . . . . . . . . . . . . . . . ¥58.1 ¥58.1 ¥2.7 ¥2.7
The actual maturities may differ from the contractual maturities shown above because certain issuers mayhave the right to redeem debt securities before their maturity.
Item 12. Description of Securities Other than Equity Securities.
Not applicable.
186

PART II
Item 13. Defaults, Dividend Arrearages and Delinquencies.
None.
Item 14. Material Modifications to the Rights of Security Holders and Use of Proceeds.
None.
Item 15. Controls and Procedures.
(a) Disclosure Controls and Procedures
Mitsui’s management, with the participation of its principal executive and principal financial officers, hasperformed an evaluation of the effectiveness of disclosure controls and procedures (as defined by Rule 13a-15(e)under the U.S. Securities Exchange Act of 1934) as of the end of the period covered by this report. Based uponthat evaluation, Mitsui’s principal executive and principal financial officers concluded that the disclosurecontrols and procedures were effective as of the end of the period covered by this report.
(b) Management’s Annual Report on Internal Control over Financial Reporting
Mitsui’s management is responsible for establishing and maintaining adequate internal control overfinancial reporting (as defined by Rule 13a-15(f) under the U.S. Securities Exchange Act of 1934). Mitsui’sinternal control system is designed to provide reasonable assurance to Mitsui’s management and board ofdirectors regarding the preparation and fair presentation of published financial statements.
All internal control systems, no matter how well designed, have inherent limitations. Therefore, even thosesystems determined to be effective can provide only reasonable assurance with respect to financial statementpreparation and presentation.
Mitsui’s management assessed the effectiveness of Mitsui’s internal control over financial reporting as ofMarch 31, 2008. In making this assessment, it used the criteria set forth by the Committee of SponsoringOrganizations of the Treadway Commission (COSO) in Internal Control—Integrated Framework. Based onMitsui’s assessment, Mitsui’s management concluded that, as of March 31, 2008, Mitsui’s internal control overfinancial reporting was effective.
Mitsui’s management excluded the following companies, which Mitsui acquired in purchase businesscombinations during the fiscal year ended March 31, 2008, from its assessment of effectiveness of internalcontrols over financial reporting as of March 31, 2008.
Company Acquisition Date
Steel Technologies Inc. . . . . . . . . . . . . . . . . . . . . . . . . . . . . . . . . . . . . . . . . . . . . . . . . . . . . . . . . . . June 1, 2007
Mitsui Raw Materials Development Pty. Limited . . . . . . . . . . . . . . . . . . . . . . . . . . . . . . . . . . . . . . June 5, 2007
The above companies in the aggregate represented approximately 0.3 percent and 1.6 percent, respectively,of Mitsui’s consolidated net and total assets as of, and 2.1 percent and 0.3 percent, respectively, of Mitsui’sconsolidated revenue and net income for the year ended March 31, 2008.
Mitsui’s management also excluded from its assessment of internal control over financial reporting as ofMarch 31, 2008 the following unincorporated joint ventures (J/V), which were accounted for via proportionateconsolidation in accordance with Emerging Issues Task Force Issue No.00-1 in Mitsui’s consolidated financialstatements for the fiscal year ended March 31, 2008. Mitsui has been unable to assess the effectiveness ofinternal controls at these entities due to the fact that Mitsui does not have the ability to dictate or modify thecontrols of these entities and does not have the ability, in practice, to assess, those controls.
187

J/V Mitsui’s Ownership
Block 9 J/V . . . . . . . . . . . . . . . . . . . . . . . . . . . . . . . . . . . . . . . . . . . . . . . . . . . . . . . . . . . . . . . . . . 35%Capricorn Coal Development J/V . . . . . . . . . . . . . . . . . . . . . . . . . . . . . . . . . . . . . . . . . . . . . . . . 30%Block 10, 11, 12, 13, 10A/11A J/V . . . . . . . . . . . . . . . . . . . . . . . . . . . . . . . . . . . . . . . . . . . . . . . 20-40%Dawson J/V . . . . . . . . . . . . . . . . . . . . . . . . . . . . . . . . . . . . . . . . . . . . . . . . . . . . . . . . . . . . . . . . . 49%Main Pass Block 61 J/V . . . . . . . . . . . . . . . . . . . . . . . . . . . . . . . . . . . . . . . . . . . . . . . . . . . . . . . . 50%Robe River Iron Associates J/V . . . . . . . . . . . . . . . . . . . . . . . . . . . . . . . . . . . . . . . . . . . . . . . . . . 33%WA-28-L J/V . . . . . . . . . . . . . . . . . . . . . . . . . . . . . . . . . . . . . . . . . . . . . . . . . . . . . . . . . . . . . . . . 40%
The above unincorporated joint ventures in the aggregate represented approximately 3.7 percent,respectively, of Mitsui’s consolidated total assets as of, and 1.5 percent of Mitsui’s consolidated revenue for theyear ended March 31, 2008.
Deloitte Touche Tohmatsu, an independent registered public accounting firm, has issued an attestation reporton Mitsui’s internal control over financial reporting. Their report appears on page F-3 of this annual report.
(c) Change in Internal Control over Financial Reporting
There was no change in Mitsui’s internal control over financial reporting that occurred during the fiscal yearended March 31, 2008 that has materially affected, or is reasonably likely to materially affect, Mitsui’s internalcontrol over financial reporting.
Item 16A. Audit Committee Financial Expert.
Our Board of Corporate Auditors has determined that Tasuku Kondo, Motonori Murakami and HideharuKadowaki qualify as an “audit committee financial expert” as defined in this Item 16A serving on our Board ofCorporate Auditors. Mr. Kadowaki is an external Corporate Auditor, meeting the additional independencerequirements under the Corporate Law of Japan.
Mr. Kondo joined Mitsui in 1965. Since then he had always worked in the field of accounting or financingand was appointed as Director and General Manager of Finance Division in 1996 and as Representative Directorand Chief Financial Officer in 2001 before having been elected as one of our Corporate Auditors at the ordinarygeneral meeting of shareholders held in June 2005.
Mr. Murakami joined Mitsui in 1971. Since then he had always worked in the field of accounting and wasappointed as General Manager of the General Accounting Division in 2000 and as Executive Managing Officer,Assistant to Senior Executive Managing Officer (Corporate Staff Division) in 2006, before having been electedas one of our Corporate Auditors at the ordinary general meeting of shareholders held in June 2007.
Mr. Kadowaki was elected as one of our Corporate Auditors at the ordinary general meeting of shareholders(first elected in June 2004 and re-elected in June 2008). His main career has been in the field of financial riskmanagement at Mitsui Bank, Sakura Bank, Sumitomo Mitsui Banking Corporation, and Sumitomo MitsuiFinancial Group, Inc. His final position in the bank was an executive vice president who, while overseeing theentire operation of the bank, was responsible for risk management and internal auditing.
Item 16B. Code of Ethics.
Mitsui maintains Business Conduct Guidelines for Employees and Officers, applicable to all employees andofficers. The Business Conduct Guidelines set forth provisions relating to compliance with applicable laws andregulations, honest and ethical conduct including the handling of conflicts of interest.
In addition, Mitsui adopted a Code of Ethics as a supplement to the Business Conduct Guidelines. The Codeof Ethics applies to Mitsui’s financial professionals including our principal executive officer, principal financialofficer, principal accounting officer and persons performing similar functions.
188

Both the Business Conduct Guidelines for Employees and Officers and the Code of Ethics are filed asexhibits to this annual report.
Item 16C. Principal Accountant Fees and Services.
Deloitte Touche Tohmatsu, a Japanese member firm of Deloitte Touche Tohmatsu (a Swiss Verein), hasbeen our principal accountant for SEC reporting purposes.
The table below shows aggregate fees billed for each of the last two fiscal years for professional servicesrendered to Mitsui and its subsidiaries by Deloitte Touche Tohmatsu and other member firms of Deloitte ToucheTohmatsu (a Swiss Verein).
Millions of Yen
Year Ended March 31,
2008 2007
Audit fees(1) . . . . . . . . . . . . . . . . . . . . . . . . . . . . . . . . . . . . . . . . . . . . . . . . . . . . . . . . . . . . . . . ¥3,445 ¥2,874Audit-related fees(2) . . . . . . . . . . . . . . . . . . . . . . . . . . . . . . . . . . . . . . . . . . . . . . . . . . . . . . . . . 118 288Tax fees(3) . . . . . . . . . . . . . . . . . . . . . . . . . . . . . . . . . . . . . . . . . . . . . . . . . . . . . . . . . . . . . . . . . 495 398All other fees(4) . . . . . . . . . . . . . . . . . . . . . . . . . . . . . . . . . . . . . . . . . . . . . . . . . . . . . . . . . . . . . 44 52
Total . . . . . . . . . . . . . . . . . . . . . . . . . . . . . . . . . . . . . . . . . . . . . . . . . . . . . . . . . . . . . . . . . . . . . ¥4,102 ¥3,612
(1) Audit fees are fees billed for professional services rendered by the principal accountant for the audit of ourannual financial statements, the audit of our internal control over financial reporting and services that areprovided by the accountant in connection with statutory and regulatory filings or engagements.
(2) Audit-related fees are fees billed for assurance and related services that are reasonably related to theperformance of the audit or review of our financial statements, such as due diligence services in connectionwith potential business acquisitions, that are not reported in audit fees.
(3) Tax fees are fees billed for professional services rendered by the principal accountant for tax compliance,tax advice and tax planning.
(4) All other fees are fees billed for services provided by the principal accountant, other than services reportedin audit fees, audit-related fees and tax fees, such as advisory services for risk management and regulatorymatters.
Beginning with the year ended March 31, 2004, the first fiscal year of application of paragraph (c)(7) ofRule 2-01 of Regulation S-X, our Board of Corporate Auditors has adopted pre-approval policies and proceduresrequiring pre-approval by the Board of Corporate Auditors for all audit and non-audit services provided by theprincipal accountant.
We have our principal policy that the audit services for Mitsui and its subsidiaries are to be rendered by theprincipal accountant, namely Deloitte Touche Tohmatsu, and other member firms of Deloitte Touche Tohmatsu(a Swiss Verein) while all non-audit services are to be rendered by the accounting firms not belonging to thegroup of Deloitte Touche Tohmatsu with some specific exceptions. Among those exceptions are certain taxservices, certain due diligence services for acquisition, etc. which would not be considered to impair theindependence of our principal accountant.
The pre-approval procedures are as follows: (i) any audit or non-audit services, for which estimated total feeshall exceed 10 Million Yen may be pre-approved by the Board of Corporate Auditors; (ii) any audit or non-auditservices, for which estimated total fee shall not exceed 10 Million Yen may be pre-approved by two of full-timeCorporate Auditors, provided that such pre-approval must be reported at the next proceeding full Board of theCorporate Auditors; and (iii) certain categories of non-audit services prescribed in the pre-approval policies andprocedures may be pre-approved comprehensively on an annual basis provided that the estimated total feesshould be specified in the relevant application and that the actual services provided shall be periodically reportedto the Board of Corporate Auditors.
189

All of the services provided by the principal accountant for the years ended March 31, 2008 and 2007 wereapproved by two of the full-time Corporate Auditors or the Board of Corporate Auditors pursuant to the pre-approval policies and procedures described above, and none of such services were approved pursuant to theprocedures described in Rule 2-01(c)(7)(i)(C) of Regulation S-X, which waives the general requirement for pre-approval in certain circumstances.
Item 16D. Exemptions from the Listing Standards for Audit Committees.
With respect to the requirements of Rule 10A-3 under the Securities Exchange Act of 1934 relating to listedcompany audit committees, which apply to us through Nasdaq Marketplace Rules 4350(d)(3) and 4350(d)(2)(A)(ii),we rely on an exemption provided by paragraph (c)(3) of Rule 10A-3 available to foreign private issuers withboards of corporate auditors meeting certain requirements. For a Nasdaq-listed Japanese company with a board ofcorporate auditors, the requirements for relying on paragraph (c)(3) of Rule 10A-3 are as follows:
• The board of corporate auditors must be established, and its members must be selected, pursuant toJapanese law expressly requiring such a board for Japanese companies that elect to have a corporategovernance system with corporate auditors,
• Japanese law must and does require the board of corporate auditors to be separate from the board ofdirectors,
• None of the members of the board of corporate auditors may be elected by management, and none of thelisted company’s executive officers may be a member of the board of corporate auditors,
• Japanese law must and does set forth standards for the independence of the members of the board ofcorporate auditors from the listed company or its management, and
• The board of corporate auditors, in accordance with Japanese law or the registrant’s governingdocuments, must be responsible, to the extent permitted by Japanese law, for the appointment, retentionand oversight of the work of any registered public accounting firm engaged (including, to the extentpermitted by Japanese law, the resolution of disagreements between management and the auditorregarding financial reporting) for the purpose of preparing or issuing an audit report or performing otheraudit, review or attest services for the listed company, including its principal accountant which audits itsconsolidated financial statements included in its annual reports on Form 20-F.
To the extent permitted by Japanese law:
• The board of corporate auditors must establish procedures for (i) the receipt, retention and treatment ofcomplaints received by us regarding accounting, internal accounting controls, or auditing matters, and(ii) the confidential, anonymous submission by our employees of concerns regarding questionableaccounting or auditing matters,
• The board of corporate auditors must have the authority to engage independent counsel and otheradvisers, as it determines necessary to carry out its duties, and
• The listed company must provide for appropriate funding, as determined by its board of corporateauditors, for payment of (i) compensation to any registered public accounting firm engaged for thepurpose of preparing or issuing an audit report or performing other audit, review or attest services for us,(ii) compensation to any advisers employed by the board of corporate auditors, and (iii) ordinaryadministrative expenses of the board of corporate auditors that are necessary or appropriate in carryingout its duties.
190

In our assessment, our Board of Corporate Auditors, which meets the requirements for reliance on theexemption in paragraph (c)(3) of Rule 10A-3 described above, is not materially less effective than an auditcommittee meeting all the requirements of paragraph (b) of Rule 10A-3 (without relying on any exemptionprovided by that Rule) at acting independently of management and performing the functions of an auditcommittee as contemplated therein.
Item 16E. Purchases of Equity Securities by the Issuer and Affiliated Purchasers.
The following table sets forth Mitsui’s purchases of its common stock during the fiscal year endedMarch 31, 2008:
Period
(a)Total
Number ofShares
Purchased*
(b)Average
Price Paidper Share
(Yen)
(c)Total
Number ofShares
Purchased asPart of
PubliclyAnnounced
Plans orPrograms
(d)MaximumNumber of
Sharesthat
May Yet BePurchased
Underthe Plans orPrograms
April 1, 2007—April 30, 2007 . . . . . . . . . . . . . . . . . . . . . . . . . 60,001 ¥2,133.65 N/A N/AMay 1, 2007—May 31, 2007 . . . . . . . . . . . . . . . . . . . . . . . . . . 61,197 2,297.13 N/A N/AJune 1, 2007—June 30, 2007 . . . . . . . . . . . . . . . . . . . . . . . . . . 62,514 2,479.27 N/A N/AJuly 1, 2007—July 31, 2007 . . . . . . . . . . . . . . . . . . . . . . . . . . . 171,453 2,679.24 N/A N/AAugust 1, 2007—August 31, 2007 . . . . . . . . . . . . . . . . . . . . . . 45,514 2,475.87 N/A N/ASeptember 1, 2007—September 30, 2007 . . . . . . . . . . . . . . . . 26,585 2,425.49 N/A N/AOctober 1, 2007—October 31, 2007 . . . . . . . . . . . . . . . . . . . . . 78,867 2,872.76 N/A N/ANovember 1, 2007—November 30, 2007 . . . . . . . . . . . . . . . . . 67,752 2,713.20 N/A N/ADecember 1, 2007—December 31, 2007 . . . . . . . . . . . . . . . . . 53,455 2,359.64 N/A N/AJanuary 1, 2008—January 31, 2008 . . . . . . . . . . . . . . . . . . . . . 28,264 2,241.02 N/A N/AFebruary 1, 2008—February 28, 2008 . . . . . . . . . . . . . . . . . . . 20,978 2,198.00 N/A N/AMarch 1, 2008—March 31, 2008 . . . . . . . . . . . . . . . . . . . . . . . 23,204 2,187.92 N/A N/A
Total . . . . . . . . . . . . . . . . . . . . . . . . . . . . . . . . . . . . . . . . . . . . . 699,784 2,510.58 N/A N/A
* Under the Corporate Law of Japan, a holder of shares constituting less than one full unit may require Mitsuito purchase such shares at their market value (See “Memorandum and Articles of Association—’Unit’ sharesystem—Repurchase by Mitsui of shares constituting less than a full unit” in “Item 10. AdditionalInformation”). During the year ended March 31, 2008, Mitsui purchased 676,584 shares for a total purchaseprice of 1,696,821,714 yen upon such requests from holders of shares constituting less than one full unit.
** Under the Corporate Law of Japan, a holder of shares may require Mitsui to purchase such shares at theirmarket value upon Mitsui’s acquisition of a company through exchange of shares. During the year endedMarch 31, 2008, Mitsui purchased 23,200 shares for a total purchase price of 60,041,600 yen upon such arequest from a holder of shares upon Mitsui’s acquisition of Nippon Trading Co., Ltd. through exchange ofshares.
191

PART III
Item 17. Financial Statements.
Not applicable.
Item 18. Financial Statements.
The information required by this item has been provided elsewhere in this annual report.
Item 19. Exhibits.
Exhibits
ExhibitNumber Document
1.1* The Articles of Incorporation of Mitsui & Co., Ltd., as of June 23, 2006 (English-languagetranslation).
1.2* The Share Handling Regulation of Mitsui & Co., Ltd., as amended on June 23, 2006 (English-language translation).
1.3* The Rules of the Board of Directors of Mitsui & Co., Ltd., as amended on June 23, 2006 (English-language translation).
1.4* The Rules of the Board of Corporate Auditors of Mitsui & Co., Ltd., as amended on July 31, 2006(English-language translation).
2.1** Deposit Agreement, dated October 1, 1982 among Mitsui & Co., Ltd., Citibank, N.A., and holders ofADRs and European Depositary Receipts.
8.1 List of Subsidiaries of Mitsui & Co., Ltd.
11.1 Code of Ethics for Senior Financial Officers and Professionals.
11.2 Business Conduct Guidelines for Employees and Officers of Mitsui & Co., Ltd.
12.1 Certification of the principal executive officer of Mitsui & Co., Ltd. required by Rule 13a-14(a).
12.2 Certification of the principal financial officer of Mitsui & Co., Ltd. required by Rule 13a-14(a).
13.1 Certification required by Rule 13a-14(b) and Section 1350 of Chapter 63 of Title 18 of the UnitedStates Code.
* Incorporated by reference to the corresponding exhibit to our annual report on Form 20-F (File No. 0-9929)filed on September 27, 2006.
** Incorporated by reference to the corresponding exhibit to our annual report on Form 20-F (File No. 0-9929)filed on September 27, 2002.
We have not included as exhibits certain instruments with respect to our long-term debt, the amount of debtauthorized under each of which does not exceed 10% of our total assets, and we agree to furnish a copy of anysuch instruments to the Securities and Exchange Commission upon request.
192

MITSUI & CO., LTD. (MITSUI BUSSAN KABUSHIKI KAISHA) AND SUBSIDIARIES
INDEX TO CONSOLIDATED FINANCIAL STATEMENTS AND SCHEDULES
The audited consolidated financial statements of Mitsui & Co., Ltd. (Mitsui Bussan Kabushiki Kaisha) andsubsidiaries, together with the report of Deloitte Touche Tohmatsu as of March 31, 2008 and 2007, and for theyears ended March 31, 2008, 2007 and 2006, filed as part of this annual reports are as follows:
Page
Report of Independent Registered Public Accounting Firm . . . . . . . . . . . . . . . . . . . . . . . . . . . . . . . . . . . . . . F-2Consolidated Balance Sheets as of March 31, 2008 and 2007 . . . . . . . . . . . . . . . . . . . . . . . . . . . . . . . . . . . . F-5Statements of Consolidated Income for the Years Ended March 31, 2008, 2007 and 2006 . . . . . . . . . . . . . . F-7Statements of Consolidated Shareholders’ Equity for the Years Ended March 31, 2008, 2007 and 2006 . . . F-8Statements of Consolidated Cash Flows for the Years Ended March 31, 2008, 2007 and 2006 . . . . . . . . . . F-9Notes to Consolidated Financial Statements . . . . . . . . . . . . . . . . . . . . . . . . . . . . . . . . . . . . . . . . . . . . . . . . . . F-10Supplemental Information on Oil and Gas Producing Activities (Unaudited) . . . . . . . . . . . . . . . . . . . . . . . . F-83
Supplemental Information:
Schedules for the Years Ended March 31, 2008, 2007 and 2006:
(Schedules are omitted because of the absence of the conditions under which they are required or becausethe required information is included in the consolidated financial statements or notes thereto.)
Financial statements of majority-owned subsidiaries of the registrant not consolidated and of 50% or lessowned persons accounted for by the equity method have been omitted because Mitsui & Co., Ltd.’s proportionateshare of the income from continuing operations before income taxes, and total assets of each such company isless than 20% of the respective consolidated amounts, and the investment in and advances to each company isless than 20% of consolidated total assets.
F-1

Report of Independent Registered Public Accounting Firm
To the Board of Directors and Shareholders ofMitsui & Co., Ltd. (Mitsui Bussan Kabushiki Kaisha)Tokyo, Japan:
We have audited the accompanying consolidated balance sheets of Mitsui & Co., Ltd. (Mitsui BussanKabushiki Kaisha) and subsidiaries (the “Company”) as of March 31, 2008 and 2007, and the related statementsof consolidated income, consolidated shareholders’ equity, and consolidated cash flows for each of the threeyears in the period ended March 31, 2008 (all expressed in Japanese yen). These financial statements are theresponsibility of the Company’s management. Our responsibility is to express an opinion on these financialstatements based on our audits.
We conducted our audits in accordance with the standards of the Public Company Accounting OversightBoard (United States). Those standards require that we plan and perform the audit to obtain reasonable assuranceabout whether the financial statements are free of material misstatement. An audit includes examining, on a testbasis, evidence supporting the amounts and disclosures in the financial statements. An audit also includesassessing the accounting principles used and significant estimates made by management, as well as evaluatingthe overall financial statement presentation. We believe that our audits provide a reasonable basis for ouropinion.
In our opinion, such consolidated financial statements present fairly, in all material respects, the financialposition of Mitsui & Co., Ltd. and subsidiaries as of March 31, 2008 and 2007, and the results of their operationsand their cash flows for each of the three years in the period ended March 31, 2008, in conformity withaccounting principles generally accepted in the United States of America.
As discussed in Note 2 to the consolidated financial statements, effective April 1, 2007, the Companychanged its method of accounting for uncertainty in income taxes to conform to Financial Accounting StandardsBoard Interpretation No. 48, “Accounting for Uncertainty in Income Taxes—an interpretation of FASBStatement No. 109.”
We have also audited, in accordance with the standards of the Public Company Accounting Oversight Board(United States), the Company’s internal control over financial reporting as of March 31, 2008, based on thecriteria established in Internal Control—Integrated Framework issued by the Committee of SponsoringOrganizations of the Treadway Commission and our report dated June 24, 2008 expressed an unqualified opinionon the Company’s internal control over financial reporting.
Our audits also comprehended the translation of Japanese yen amounts into U.S. dollar amounts and, in ouropinion, such translation has been made in conformity with the basis stated in Note 2. Such U.S. dollar amountsare presented solely for the convenience of readers outside Japan.
/s/ DELOITTE TOUCHE TOHMATSUTokyo, Japan
June 24, 2008
F-2

Report of Independent Registered Public Accounting Firm
To the Board of Directors and Shareholders ofMitsui & Co., Ltd. (Mitsui Bussan Kabushiki Kaisha)Tokyo, Japan:
We have audited the internal control over financial reporting of Mitsui & Co., Ltd. (Mitsui BussanKabushiki Kaisha) and subsidiaries (the “Company”) as of March 31, 2008, based on criteria established inInternal Control—Integrated Framework issued by the Committee of Sponsoring Organizations of the TreadwayCommission. As described in “Management’s Annual Report on Internal Control over Financial Reporting”appearing under Item 15(b), management excluded from its assessment the internal control over financialreporting at Steel Technologies Inc. and Mitsui Raw Materials Development Pty. Limited (collectively the“Acquired Entities”), which were acquired on June 1, 2007, and June 5, 2007, respectively, and whose financialstatements constitute 0.3% and 1.6 % of net and total assets, respectively, 2.1 % of revenues, and 0.3 % of netincome of the consolidated financial statement amounts as of and for the year ended March 31, 2008. Also asdescribed in “Management’s Annual Report on Internal Control over Financial Reporting” appearing underItem 15(b), management excluded from its assessment the internal control over financial reporting at theunincorporated joint ventures (J/V), which were accounted for via proportionate consolidation in accordance withEmerging Issues Task Force Issue No. 00-1 because the Company does not have the ability to dictate or modifythe controls at these entities and does not have the ability to assess, in practice, the controls at these entities.Block 9 J/V (35%), Capricorn Coal Development J/V (30%), Block 10, 11, 12, 13, 10A/11A J/V (20-40%),Dawson J/V (49%), Main Pass Block 61 J/V (50%), Robe River Iron Associates J/V (33%) and WA-28-L J/V(40%) (collectively the “Unincorporated J/Vs”), constitute 3.7 % of total assets and 1.5 % of revenues of theconsolidated financial statement amounts as of and for the year ended March 31, 2008. Accordingly, our auditdid not include the internal control over financial reporting at the Acquired Entities or the Unincorporated J/Vs.The Company’s management is responsible for maintaining effective internal control over financial reporting andfor its assessment of the effectiveness of internal control over financial reporting, included in the accompanying“Management’s Annual Report on Internal Control over Financial Reporting” appearing under Item 15(b). Ourresponsibility is to express an opinion on the Company’s internal control over financial reporting based on ouraudit.
We conducted our audit in accordance with the standards of the Public Company Accounting OversightBoard (United States). Those standards require that we plan and perform the audit to obtain reasonable assuranceabout whether effective internal control over financial reporting was maintained in all material respects. Ouraudit included obtaining an understanding of internal control over financial reporting, assessing the risk that amaterial weakness exists, testing and evaluating the design and operating effectiveness of internal control basedon the assessed risk, and performing such other procedures as we considered necessary in the circumstances. Webelieve that our audit provides a reasonable basis for our opinion.
A company’s internal control over financial reporting is a process designed by, or under the supervision of,the company’s principal executive and principal financial officers, or persons performing similar functions, andeffected by the company’s board of directors, management, and other personnel to provide reasonable assuranceregarding the reliability of financial reporting and the preparation of financial statements for external purposes inaccordance with accounting principles generally accepted in the United States of America. A company’s internalcontrol over financial reporting includes those policies and procedures that (1) pertain to the maintenance ofrecords that, in reasonable detail, accurately and fairly reflect the transactions and dispositions of the assets of thecompany; (2) provide reasonable assurance that transactions are recorded as necessary to permit preparation offinancial statements in accordance with accounting principles generally accepted in the United States of America,and that receipts and expenditures of the company are being made only in accordance with authorizations ofmanagement and directors of the company; and (3) provide reasonable assurance regarding prevention or timelydetection of unauthorized acquisition, use, or disposition of the company’s assets that could have a materialeffect on the financial statements.
F-3

Because of the inherent limitations of internal control over financial reporting, including the possibility ofcollusion or improper management override of controls, material misstatements due to error or fraud may not beprevented or detected on a timely basis. Also, projections of any evaluation of the effectiveness of the internalcontrol over financial reporting to future periods are subject to the risk that the controls may become inadequatebecause of changes in conditions, or that the degree of compliance with the policies or procedures maydeteriorate.
In our opinion, the Company maintained, in all material respects, effective internal control over financialreporting as of March 31, 2008, based on the criteria established in Internal Control-Integrated Frameworkissued by the Committee of Sponsoring Organizations of the Treadway Commission.
We have also audited, in accordance with the standards of the Public Company Accounting Oversight Board(United States), the consolidated financial statements as of and for the year ended March 31, 2008 of theCompany and our report dated June 24, 2008 expressed an unqualified opinion on those financial statements andincluded an explanatory paragraph relating to the Company’s adoption of Financial Accounting Standards BoardInterpretation No. 48, “Accounting for Uncertainty in Income Taxes—an interpretation of FASB StatementNo. 109” effective April 1, 2007.
/s/ DELOITTE TOUCHE TOHMATSUTokyo, Japan
June 24, 2008
F-4

Consolidated Balance Sheets
Mitsui & Co., Ltd. and subsidiariesMarch 31, 2008 and 2007
Millions of Yen
Millions ofU.S. Dollars
(Note 2)
2008 2007 2008
ASSETSCurrent Assets:Cash and cash equivalents (Notes 2 and 5) . . . . . . . . . . . . . . . . . . . . . . . . . ¥ 899,264 ¥ 800,032 $ 8,993Time deposits . . . . . . . . . . . . . . . . . . . . . . . . . . . . . . . . . . . . . . . . . . . . . . . 12,302 6,591 123Marketable securities (Notes 2 and 5) . . . . . . . . . . . . . . . . . . . . . . . . . . . . 7,114 11,670 71Trade receivables (Note 9):
Notes and loans, less unearned interest . . . . . . . . . . . . . . . . . . . . . . . 424,406 475,271 4,244Accounts (Note 8) . . . . . . . . . . . . . . . . . . . . . . . . . . . . . . . . . . . . . . . . 2,125,640 2,199,614 21,257Associated companies . . . . . . . . . . . . . . . . . . . . . . . . . . . . . . . . . . . . . 228,831 240,950 2,288Allowance for doubtful receivables (Notes 2 and 7) . . . . . . . . . . . . . (23,289) (29,824) (233)
Inventories (Notes 2, 9 and 23) . . . . . . . . . . . . . . . . . . . . . . . . . . . . . . . . . . 739,721 696,470 7,397Advance payments to suppliers . . . . . . . . . . . . . . . . . . . . . . . . . . . . . . . . . 95,188 96,702 952Deferred tax assets—current (Notes 2 and 20) . . . . . . . . . . . . . . . . . . . . . . 37,766 21,175 378Derivative assets (Note 2) . . . . . . . . . . . . . . . . . . . . . . . . . . . . . . . . . . . . . . 391,333 254,319 3,913Other current assets . . . . . . . . . . . . . . . . . . . . . . . . . . . . . . . . . . . . . . . . . . . 272,838 300,806 2,728
Total current assets . . . . . . . . . . . . . . . . . . . . . . . . . . . . . . . . . . . 5,211,114 5,073,776 52,111
Investments and Non-current Receivables (Notes 2 and 9):Investments in and advances to associated companies
(Notes 6 and 17) . . . . . . . . . . . . . . . . . . . . . . . . . . . . . . . . . . . . . . . . . . . 1,333,042 1,587,571 13,330Other investments (Note 5) . . . . . . . . . . . . . . . . . . . . . . . . . . . . . . . . . . . . . 1,281,476 1,238,853 12,815Non-current receivables, less unearned interest (Note 8) . . . . . . . . . . . . . . 497,265 476,107 4,973Allowance for doubtful receivables (Notes 7 and 8) . . . . . . . . . . . . . . . . . (58,957) (69,775) (590)Property leased to others—at cost, less accumulated depreciation
(Notes 8 and 23) . . . . . . . . . . . . . . . . . . . . . . . . . . . . . . . . . . . . . . . . . . . 184,447 259,240 1,845
Total investments and non-current receivables . . . . . . . . . . . . . 3,237,273 3,491,996 32,373
Property and Equipment—at Cost (Notes 2, 8, 9 and 10):Land, land improvements and timberlands . . . . . . . . . . . . . . . . . . . . . . . . . 188,848 191,537 1,888Buildings, including leasehold improvements . . . . . . . . . . . . . . . . . . . . . . 385,104 379,814 3,851Equipment and fixtures . . . . . . . . . . . . . . . . . . . . . . . . . . . . . . . . . . . . . . . . 815,202 790,510 8,152Mineral rights . . . . . . . . . . . . . . . . . . . . . . . . . . . . . . . . . . . . . . . . . . . . . . . 146,120 151,752 1,461Vessels . . . . . . . . . . . . . . . . . . . . . . . . . . . . . . . . . . . . . . . . . . . . . . . . . . . . 33,789 33,666 338Projects in progress . . . . . . . . . . . . . . . . . . . . . . . . . . . . . . . . . . . . . . . . . . . 176,987 130,529 1,770
Total . . . . . . . . . . . . . . . . . . . . . . . . . . . . . . . . . . . . . . . . . . . . . . . . . . 1,746,050 1,677,808 17,460Accumulated depreciation . . . . . . . . . . . . . . . . . . . . . . . . . . . . . . . . . . . . . (729,715) (689,508) (7,297)
Net property and equipment . . . . . . . . . . . . . . . . . . . . . . . . . . . . 1,016,335 988,300 10,163
Intangible Assets, less Accumulated Amortization (Notes 2, 3, 12and 14) . . . . . . . . . . . . . . . . . . . . . . . . . . . . . . . . . . . . . . . . . . . . . . . . . . 128,504 104,445 1,285
Deferred Tax Assets—Non-current (Notes 2 and 20) . . . . . . . . . . . . . . 20,574 21,800 206
Other Assets (Note 14) . . . . . . . . . . . . . . . . . . . . . . . . . . . . . . . . . . . . . . . 77,079 132,995 771
Total . . . . . . . . . . . . . . . . . . . . . . . . . . . . . . . . . . . . . . . . . . . . . . ¥9,690,879 ¥9,813,312 $96,909
See notes to consolidated financial statements.
F-5

Consolidated Balance Sheets—(Continued)
Mitsui & Co., Ltd. and subsidiariesMarch 31, 2008 and 2007
Millions of Yen
Millions ofU.S. Dollars
(Note 2)
2008 2007 2008
LIABILITIES AND SHAREHOLDERS’ EQUITYCurrent Liabilities:Short-term debt (Notes 9 and 13) . . . . . . . . . . . . . . . . . . . . . . . . . . . . . . . . ¥ 464,547 ¥ 658,747 $ 4,646Current maturities of long-term debt (Notes 8, 9 and 13) . . . . . . . . . . . . . 276,620 371,865 2,766Trade payables:
Notes and acceptances . . . . . . . . . . . . . . . . . . . . . . . . . . . . . . . . . . . . 79,414 98,199 794Accounts . . . . . . . . . . . . . . . . . . . . . . . . . . . . . . . . . . . . . . . . . . . . . . . 1,888,911 1,966,800 18,889Associated companies . . . . . . . . . . . . . . . . . . . . . . . . . . . . . . . . . . . . . 69,476 64,730 695
Accrued expenses:Income taxes (Notes 2 and 20) . . . . . . . . . . . . . . . . . . . . . . . . . . . . . . 127,411 85,692 1,274Interest . . . . . . . . . . . . . . . . . . . . . . . . . . . . . . . . . . . . . . . . . . . . . . . . 21,924 25,324 219Other . . . . . . . . . . . . . . . . . . . . . . . . . . . . . . . . . . . . . . . . . . . . . . . . . . 85,526 84,625 855
Advances from customers . . . . . . . . . . . . . . . . . . . . . . . . . . . . . . . . . . . . . . 113,939 113,586 1,139Derivative liabilities (Note 2) . . . . . . . . . . . . . . . . . . . . . . . . . . . . . . . . . . . 279,696 198,735 2,797Other current liabilities (Notes 2, 20 and 22) . . . . . . . . . . . . . . . . . . . . . . . 187,149 141,899 1,872
Total current liabilities . . . . . . . . . . . . . . . . . . . . . . . . . . . . . . . . 3,594,613 3,810,202 35,946
Long-term Debt, less Current Maturities (Notes 8, 9, 11 and 13) . . . . 2,944,383 2,887,528 29,444
Accrued Pension Costs and Liability for Severance Indemnities(Notes 2 and 14) . . . . . . . . . . . . . . . . . . . . . . . . . . . . . . . . . . . . . . . . . . . 32,754 33,209 327
Deferred Tax Liabilities—Non-current (Notes 2 and 20) . . . . . . . . . . . 387,337 450,181 3,873Other Long-term Liabilities (Notes 2 and 22) . . . . . . . . . . . . . . . . . . . . . 304,156 283,226 3,042
Contingent Liabilities (Notes 9 and 22)Minority Interests . . . . . . . . . . . . . . . . . . . . . . . . . . . . . . . . . . . . . . . . . . . 243,976 238,687 2,440
Shareholders’ Equity (Note 15):Common stock—no par value
Authorized, 2,500,000,000 shares;Issued, 1,820,183,809 shares in 2008
and 1,787,538,428 shares in 2007 . . . . . . . . . . . . . . . . . . . . . . . . . . 337,544 323,213 3,375Capital surplus . . . . . . . . . . . . . . . . . . . . . . . . . . . . . . . . . . . . . . . . . . . . . . 432,245 417,900 4,323Retained earnings:
Appropriated for legal reserve . . . . . . . . . . . . . . . . . . . . . . . . . . . . . . 47,463 39,670 475Unappropriated (Notes 6, 13, 20 and 28) . . . . . . . . . . . . . . . . . . . . . . 1,397,313 1,072,234 13,973
Accumulated other comprehensive income (loss) (Note 2):Unrealized holding gains and losses on available-for-sale securities
(Note 5) . . . . . . . . . . . . . . . . . . . . . . . . . . . . . . . . . . . . . . . . . . . . . . 140,446 258,922 1,405Foreign currency translation adjustments . . . . . . . . . . . . . . . . . . . . . . (135,196) (9,409) (1,352)Defined benefit pension plans (Note 14) . . . . . . . . . . . . . . . . . . . . . . (32,160) 2,287 (322)Net unrealized gains and losses on derivatives (Note 25) . . . . . . . . . 1,135 8,930 11
Total accumulated other comprehensive (loss) income . . . . . . . . . . . (25,775) 260,730 (258)
Treasury stock, at cost: 3,543,891 shares in 2008and 2,911,367 shares in 2007 . . . . . . . . . . . . . . . . . . . . . . . . . . . . . . . . . (5,130) (3,468) (51)
Total shareholders’ equity . . . . . . . . . . . . . . . . . . . . . . . . . . . . . 2,183,660 2,110,279 21,837
Total . . . . . . . . . . . . . . . . . . . . . . . . . . . . . . . . . . . . . . . . . . . . . . ¥9,690,879 ¥9,813,312 $96,909
F-6

Statements of Consolidated Income
Mitsui & Co., Ltd. and subsidiariesYears Ended March 31, 2008, 2007 and 2006
Millions of Yen
Millions ofU.S. Dollars
(Note 2)
2008 2007 2006 2008
Revenues (Notes 2, 6, 17 and 18):Sales of products (Note 25) . . . . . . . . . . . . . . . . . . . . . . . . . . . . . . . . . . . . . . . . . . . . ¥5,009,773 ¥4,090,447 ¥3,397,590 $50,098Sales of services . . . . . . . . . . . . . . . . . . . . . . . . . . . . . . . . . . . . . . . . . . . . . . . . . . . . . 553,742 556,014 510,890 5,537Other sales (Note 8) . . . . . . . . . . . . . . . . . . . . . . . . . . . . . . . . . . . . . . . . . . . . . . . . . . 175,363 147,136 119,036 1,754
Total revenues . . . . . . . . . . . . . . . . . . . . . . . . . . . . . . . . . . . . . . . . . . . . . . 5,738,878 4,793,597 4,027,516 57,389Total Trading Transactions (Notes 2 and 17):2008, ¥17,009,056 million—$170,091 million;2007, ¥15,271,649 million;2006, ¥14,796,535 million
Cost of Revenues (Notes 2, 6 and 18):Cost of products sold (Note 25) . . . . . . . . . . . . . . . . . . . . . . . . . . . . . . . . . . . . . . . . . 4,512,491 3,696,859 3,059,671 45,125Cost of services sold . . . . . . . . . . . . . . . . . . . . . . . . . . . . . . . . . . . . . . . . . . . . . . . . . . 156,187 158,543 130,339 1,562Cost of other sales (Note 8) . . . . . . . . . . . . . . . . . . . . . . . . . . . . . . . . . . . . . . . . . . . . 82,123 71,904 52,942 821
Total cost of revenues . . . . . . . . . . . . . . . . . . . . . . . . . . . . . . . . . . . . . . . . . 4,750,801 3,927,306 3,242,952 47,508
Gross Profit . . . . . . . . . . . . . . . . . . . . . . . . . . . . . . . . . . . . . . . . . . . . . . . . . . . . . . . . 988,077 866,291 784,564 9,881
Other Expenses (Income):Selling, general and administrative (Notes 2, 8, 12, 14, 18 and 24) . . . . . . . . . . . . . . 605,176 571,617 538,598 6,052Provision for doubtful receivables (Notes 2 and 7) . . . . . . . . . . . . . . . . . . . . . . . . . . 8,073 11,873 (1,757) 81Interest income (Notes 2 and 25) . . . . . . . . . . . . . . . . . . . . . . . . . . . . . . . . . . . . . . . . (57,268) (49,847) (37,607) (573)Interest expense (Notes 2 and 25) . . . . . . . . . . . . . . . . . . . . . . . . . . . . . . . . . . . . . . . 106,213 92,501 58,798 1,062Dividend income . . . . . . . . . . . . . . . . . . . . . . . . . . . . . . . . . . . . . . . . . . . . . . . . . . . . (50,115) (49,188) (30,196) (501)Gain on sales of securities—net (Notes 2 and 5) . . . . . . . . . . . . . . . . . . . . . . . . . . . . (92,307) (58,800) (37,819) (923)Loss on write-down of securities (Notes 2 and 5) . . . . . . . . . . . . . . . . . . . . . . . . . . . 36,715 11,687 10,530 367Loss (gain) on disposal or sales of property and equipment—net (Note 24) . . . . . . . 228 (5,283) (7,478) 2Impairment loss of long-lived assets (Notes 2, 10, 12 and 24) . . . . . . . . . . . . . . . . . 24,393 19,427 15,820 244Impairment loss of goodwill (Notes 2 and 12) . . . . . . . . . . . . . . . . . . . . . . . . . . . . . . 2,004 16,528 — 20Compensation and other charges related to DPF incident (Note 21) . . . . . . . . . . . . . — (3,864) 9,000 —Other expense (income)—net (Notes 18, 19, 22 and 24) . . . . . . . . . . . . . . . . . . . . . . 2,961 466 (1,998) 30
Total other expenses . . . . . . . . . . . . . . . . . . . . . . . . . . . . . . . . . . . . . . . . . . 586,073 557,117 515,891 5,861
Income from Continuing Operations before Income Taxes, Minority Interestsand Equity in Earnings (Note 20) . . . . . . . . . . . . . . . . . . . . . . . . . . . . . . . . . . . . 402,004 309,174 268,673 4,020
Income Taxes (Notes 2 and 20):Current . . . . . . . . . . . . . . . . . . . . . . . . . . . . . . . . . . . . . . . . . . . . . . . . . . . . . . . . . . . . 173,275 134,340 98,631 1,732Deferred . . . . . . . . . . . . . . . . . . . . . . . . . . . . . . . . . . . . . . . . . . . . . . . . . . . . . . . . . . . (2,038) 10,928 35,447 (20)
Total . . . . . . . . . . . . . . . . . . . . . . . . . . . . . . . . . . . . . . . . . . . . . . . . . . . . . . 171,237 145,268 134,078 1,712
Income from Continuing Operations before Minority Interests and Equity inEarnings . . . . . . . . . . . . . . . . . . . . . . . . . . . . . . . . . . . . . . . . . . . . . . . . . . . . . . . . 230,767 163,906 134,595 2,308
Minority Interests in Earnings of Subsidiaries . . . . . . . . . . . . . . . . . . . . . . . . . . . (45,958) (17,874) (13,710) (460)Equity in Earnings of Associated Companies—Net
(After Income Tax Effect) (Notes 2, 6 and 20) . . . . . . . . . . . . . . . . . . . . . . . . . . 154,268 153,094 94,182 1,543
Income from Continuing Operations . . . . . . . . . . . . . . . . . . . . . . . . . . . . . . . . . . . 339,077 299,126 215,067 3,391Income (Loss) from Discontinued Operations—Net
(After Income Tax Effect) (Notes 4, 20 and 24) . . . . . . . . . . . . . . . . . . . . . . . . . 70,984 2,376 (12,658) 710
Net Income . . . . . . . . . . . . . . . . . . . . . . . . . . . . . . . . . . . . . . . . . . . . . . . . . . . . . . . . ¥ 410,061 ¥ 301,502 ¥ 202,409 $ 4,101
YenU.S. Dollars
(Note 2)
Net Income per Share (Notes 2 and 16):Basic:
Continuing operations . . . . . . . . . . . . . . . . . . . . . . . . . . . . . . . . . . . . . . . . . . . . ¥ 187.87 ¥ 172.88 ¥ 134.16 $ 1.88Discontinued operations . . . . . . . . . . . . . . . . . . . . . . . . . . . . . . . . . . . . . . . . . . . 39.33 1.38 (7.90) 0.39
Total . . . . . . . . . . . . . . . . . . . . . . . . . . . . . . . . . . . . . . . . . . . . . . . . . . . . . . ¥ 227.20 ¥ 174.26 ¥ 126.26 $ 2.27
Diluted:Continuing operations . . . . . . . . . . . . . . . . . . . . . . . . . . . . . . . . . . . . . . . . . . . . ¥ 185.91 ¥ 164.02 ¥ 126.26 $ 1.86Discontinued operations . . . . . . . . . . . . . . . . . . . . . . . . . . . . . . . . . . . . . . . . . . . 38.91 1.30 (7.41) 0.39
Total . . . . . . . . . . . . . . . . . . . . . . . . . . . . . . . . . . . . . . . . . . . . . . . . . . . . . . ¥ 224.82 ¥ 165.32 ¥ 118.85 $ 2.25
See notes to consolidated financial statements.
F-7

Statements of Consolidated Shareholders’ Equity
Mitsui & Co., Ltd. and subsidiariesYears Ended March 31, 2008, 2007 and 2006
Millions of Yen
Millions ofU.S. Dollars
(Note 2)
2008 2007 2006 2008
Common Stock (Note 15):Balance at beginning of year
Shares issued: 2008—1,787,538,428 shares; 2007—1,725,018,515 shares; 2006—1,583,687,322 shares . . . ¥ 323,213 ¥ 295,766 ¥192,493 $ 3,232Issuance of common stock
Shares issued: 2008—0 share; 2007—0 share; 2006—139,750,000 shares . . . . . . . . . . . . . . . . . . . . . . . . . . . — — 102,576 —Common stock issued upon conversion of bonds
Shares issued: 2008—32,645,381 shares; 2007—62,519,913 shares; 2006—1,581,193 shares . . . . . . . . . . . . 14,331 27,447 697 143
Balance at end of yearShares issued: 2008—1,820,183,809 shares; 2007—1,787,538,428 shares; 2006—1,725,018,515 shares . . . ¥ 337,544 ¥ 323,213 ¥295,766 $ 3,375
Capital Surplus (Note 15):Balance at beginning of year . . . . . . . . . . . . . . . . . . . . . . . . . . . . . . . . . . . . . . . . . . . . . . . . . . . . . . . . . . . . . . . . . ¥ 417,900 ¥ 390,488 ¥288,048 $ 4,179Issuance of common stock . . . . . . . . . . . . . . . . . . . . . . . . . . . . . . . . . . . . . . . . . . . . . . . . . . . . . . . . . . . . . . . . . . . — — 101,733 —Conversion of bonds . . . . . . . . . . . . . . . . . . . . . . . . . . . . . . . . . . . . . . . . . . . . . . . . . . . . . . . . . . . . . . . . . . . . . . . . 14,285 27,359 695 143Gain on sales of treasury stock . . . . . . . . . . . . . . . . . . . . . . . . . . . . . . . . . . . . . . . . . . . . . . . . . . . . . . . . . . . . . . . . 60 53 12 0
Balance at end of year . . . . . . . . . . . . . . . . . . . . . . . . . . . . . . . . . . . . . . . . . . . . . . . . . . . . . . . . . . . . . . . . . . . . . . . ¥ 432,245 ¥ 417,900 ¥390,488 $ 4,322
Retained Earnings (Note 15):Appropriated for Legal Reserve:Balance at beginning of year . . . . . . . . . . . . . . . . . . . . . . . . . . . . . . . . . . . . . . . . . . . . . . . . . . . . . . . . . . . . . . . ¥ 39,670 ¥ 38,508 ¥ 37,018 $ 397Transfer from unappropriated retained earnings . . . . . . . . . . . . . . . . . . . . . . . . . . . . . . . . . . . . . . . . . . . . . . . . 7,793 1,162 1,490 78
Balance at end of year . . . . . . . . . . . . . . . . . . . . . . . . . . . . . . . . . . . . . . . . . . . . . . . . . . . . . . . . . . . . . . . . . . . . . ¥ 47,463 ¥ 39,670 ¥ 38,508 $ 475
Unappropriated (Notes 6, 13, 20 and 28):Balance at beginning of year . . . . . . . . . . . . . . . . . . . . . . . . . . . . . . . . . . . . . . . . . . . . . . . . . . . . . . . . . . . . . . . ¥1,072,234 ¥ 825,306 ¥656,032 $10,722Cumulative effect of a change in accounting principle—initial application of FIN No. 48 (Notes 2 and 20) . . . (5,113) — — (51)Net income . . . . . . . . . . . . . . . . . . . . . . . . . . . . . . . . . . . . . . . . . . . . . . . . . . . . . . . . . . . . . . . . . . . . . . . . . . . . . 410,061 301,502 202,409 4,101Cash dividends paid (annual rate per share: 2008, ¥40.0—40.0 ¢; 2007, ¥31.0; 2006, ¥20.0) . . . . . . . . . . . . . (72,076) (53,412) (31,645) (721)Transfer to retained earnings appropriated for legal reserve . . . . . . . . . . . . . . . . . . . . . . . . . . . . . . . . . . . . . . . (7,793) (1,162) (1,490) (78)
Balance at end of year . . . . . . . . . . . . . . . . . . . . . . . . . . . . . . . . . . . . . . . . . . . . . . . . . . . . . . . . . . . . . . . . . . . . . ¥1,397,313 ¥1,072,234 ¥825,306 $13,973
Accumulated Other Comprehensive Income (Loss) (After Income Tax Effect) (Notes 2, 15 and 20):Balance at beginning of year . . . . . . . . . . . . . . . . . . . . . . . . . . . . . . . . . . . . . . . . . . . . . . . . . . . . . . . . . . . . . . . . . ¥ 260,730 ¥ 129,842 ¥ (49,551) $ 2,607Unrealized holding gains and losses on available-for-sale securities (Note 5) . . . . . . . . . . . . . . . . . . . . . . . . . . . (118,476) 42,823 115,920 (1,185)Foreign currency translation adjustments . . . . . . . . . . . . . . . . . . . . . . . . . . . . . . . . . . . . . . . . . . . . . . . . . . . . . . . . (125,787) 73,870 59,508 (1,258)Minimum pension liability adjustment . . . . . . . . . . . . . . . . . . . . . . . . . . . . . . . . . . . . . . . . . . . . . . . . . . . . . . . . . . — 1,058 274 —Defined benefit pension plans (Note 14):
Net prior service credit . . . . . . . . . . . . . . . . . . . . . . . . . . . . . . . . . . . . . . . . . . . . . . . . . . . . . . . . . . . . . . . . . . . . 474 — — 5Net actuarial loss . . . . . . . . . . . . . . . . . . . . . . . . . . . . . . . . . . . . . . . . . . . . . . . . . . . . . . . . . . . . . . . . . . . . . . . . . (34,921) — — (349)
Adjustment to initially apply SFAS No. 158 (Note 14) . . . . . . . . . . . . . . . . . . . . . . . . . . . . . . . . . . . . . . . . . . . . . — 6,646 — —Net unrealized gains and losses on derivatives (Note 25) . . . . . . . . . . . . . . . . . . . . . . . . . . . . . . . . . . . . . . . . . . . (7,795) 6,491 3,691 (78)
Balance at end of year . . . . . . . . . . . . . . . . . . . . . . . . . . . . . . . . . . . . . . . . . . . . . . . . . . . . . . . . . . . . . . . . . . . . . . . ¥ (25,775) ¥ 260,730 ¥129,842 $ (258)
Treasury Stock, at Cost (Note 15):Balance at beginning of year
Shares in treasury: 2008—2,911,367 shares; 2007—2,064,447 shares; 2006—1,476,692 shares . . . . . . . . . . ¥ (3,468) ¥ (2,003) ¥ (1,212) $ (35)Purchase of treasury stock
Shares purchased: 2008—699,909 shares; 2007—1,045,979 shares; 2006—663,661 shares . . . . . . . . . . . . . . (1,757) (1,633) (862) (17)Sales of treasury stock
Shares sold: 2008—67,385 shares; 2007—199,059 shares; 2006—75,906 shares . . . . . . . . . . . . . . . . . . . . . . 95 168 71 1
Balance at end of yearShares in treasury: 2008—3,543,891 shares; 2007—2,911,367 shares; 2006—2,064,447 shares . . . . . . . . . . ¥ (5,130) ¥ (3,468) ¥ (2,003) $ (51)
Summary of Changes in Equity from Nonowner Sources (Comprehensive Income (Loss)) (Notes 2, 15 and 20):Net income . . . . . . . . . . . . . . . . . . . . . . . . . . . . . . . . . . . . . . . . . . . . . . . . . . . . . . . . . . . . . . . . . . . . . . . . . . . . . . . ¥ 410,061 ¥ 301,502 ¥202,409 $ 4,101
Other comprehensive income (loss) (after income tax effect):Unrealized holding gains and losses on available-for-sale securities (Note 5) . . . . . . . . . . . . . . . . . . . . . . . . . (118,476) 42,823 115,920 (1,185)Foreign currency translation adjustments . . . . . . . . . . . . . . . . . . . . . . . . . . . . . . . . . . . . . . . . . . . . . . . . . . . . . . (125,787) 73,870 59,508 (1,258)Minimum pension liability adjustment . . . . . . . . . . . . . . . . . . . . . . . . . . . . . . . . . . . . . . . . . . . . . . . . . . . . . . . . — 1,058 274 —Defined benefit pension plans (Note 14):
Net prior service credit . . . . . . . . . . . . . . . . . . . . . . . . . . . . . . . . . . . . . . . . . . . . . . . . . . . . . . . . . . . . . . . . . . 474 — — 5Net actuarial loss . . . . . . . . . . . . . . . . . . . . . . . . . . . . . . . . . . . . . . . . . . . . . . . . . . . . . . . . . . . . . . . . . . . . . . . (34,921) — — (349)
Net unrealized gains and losses on derivatives (Note 25) . . . . . . . . . . . . . . . . . . . . . . . . . . . . . . . . . . . . . . . . . (7,795) 6,491 3,691 (78)
Changes in equity from nonowner sources . . . . . . . . . . . . . . . . . . . . . . . . . . . . . . . . . . . . . . . . . . . . . . . . . . . . . . . ¥ 123,556 ¥ 425,744 ¥381,802 $ 1, 236
See notes to consolidated financial statements.
F-8

Statements of Consolidated Cash Flows
Mitsui & Co., Ltd. and subsidiariesYears Ended March 31, 2008, 2007 and 2006
Millions of Yen
Millions ofU.S. Dollars
(Note 2)
2008 2007 2006 2008
Operating Activities (Note 27):Net income . . . . . . . . . . . . . . . . . . . . . . . . . . . . . . . . . . . . . . . . . . . . . . . . . . . . . . . . . . . ¥ 410,061 ¥ 301,502 ¥ 202,409 $ 4,101Adjustments to reconcile net income to net cash provided by operating activities:
(Income) loss from discontinued operations—net (after income tax effect) . . . . . . (70,984) (2,376) 12,658 (710)Depreciation and amortization . . . . . . . . . . . . . . . . . . . . . . . . . . . . . . . . . . . . . . . . 139,328 87,945 67,777 1,393Pension and severance costs, less payments . . . . . . . . . . . . . . . . . . . . . . . . . . . . . . (2,422) (8,091) 4,585 (24)Provision for doubtful receivables . . . . . . . . . . . . . . . . . . . . . . . . . . . . . . . . . . . . . . 8,073 11,873 (1,757) 81Gain on sales of securities—net . . . . . . . . . . . . . . . . . . . . . . . . . . . . . . . . . . . . . . . (92,307) (58,800) (37,819) (923)Loss on write-down of securities . . . . . . . . . . . . . . . . . . . . . . . . . . . . . . . . . . . . . . . 36,715 11,687 10,530 367Loss (gain) on disposal or sales of property and equipment—net . . . . . . . . . . . . . 228 (5,283) (7,478) 2Impairment loss of long-lived assets . . . . . . . . . . . . . . . . . . . . . . . . . . . . . . . . . . . . 24,393 19,427 15,820 244Impairment loss of goodwill . . . . . . . . . . . . . . . . . . . . . . . . . . . . . . . . . . . . . . . . . . 2,004 16,528 — 20Deferred income taxes . . . . . . . . . . . . . . . . . . . . . . . . . . . . . . . . . . . . . . . . . . . . . . . (2,038) 10,928 35,447 (20)Minority interests in earnings of subsidiaries . . . . . . . . . . . . . . . . . . . . . . . . . . . . . 45,958 17,874 13,710 460Equity in earnings of associated companies, less dividends received . . . . . . . . . . . (55,016) (43,022) (30,585) (550)Changes in operating assets and liabilities:
Decrease (increase) in trade receivables . . . . . . . . . . . . . . . . . . . . . . . . . . . . . 77,800 (315,964) (165,872) 778(Increase) decrease in inventories . . . . . . . . . . . . . . . . . . . . . . . . . . . . . . . . . . (75,375) 8,164 (64,849) (755)(Decrease) increase in trade payables . . . . . . . . . . . . . . . . . . . . . . . . . . . . . . . (41,009) 124,505 81,876 (410)Increase in advance payments to suppliers . . . . . . . . . . . . . . . . . . . . . . . . . . . (35,730) (37,842) (8,212) (357)Increase in advances from customers . . . . . . . . . . . . . . . . . . . . . . . . . . . . . . . 51,717 43,538 5,918 517Increase in accrued expenses . . . . . . . . . . . . . . . . . . . . . . . . . . . . . . . . . . . . . . 3,862 29,353 9,880 38Other—net . . . . . . . . . . . . . . . . . . . . . . . . . . . . . . . . . . . . . . . . . . . . . . . . . . . . (5,736) 14,976 (8,271) (57)
Net cash (used in) provided by operating activities of discontinued operations . . . (3,731) 12,353 10,629 (37)
Net cash provided by operating activities . . . . . . . . . . . . . . . . . . . . . . . . . . . . 415,791 239,275 146,396 4,158
Investing Activities (Note 27):Net (increase) decrease in time deposits . . . . . . . . . . . . . . . . . . . . . . . . . . . . . . . . . . . . . (6,609) 29,367 (3,186) (66)Investments in and advances to associated companies . . . . . . . . . . . . . . . . . . . . . . . . . . (206,866) (222,438) (175,774) (2,069)Sales of investments in and collection of advances to associated companies . . . . . . . . . 309,625 34,314 37,574 3,096Acquisitions of available-for-sale securities . . . . . . . . . . . . . . . . . . . . . . . . . . . . . . . . . . (62,641) (135,117) (121,173) (626)Proceeds from sales of available-for-sale securities . . . . . . . . . . . . . . . . . . . . . . . . . . . . 45,650 60,651 36,741 457Proceeds from maturities of available-for-sale securities . . . . . . . . . . . . . . . . . . . . . . . . 4,509 106,687 52,604 45Acquisitions of held-to-maturity debt securities . . . . . . . . . . . . . . . . . . . . . . . . . . . . . . . — — (1,675) —Proceeds from maturities of held-to-maturity debt securities . . . . . . . . . . . . . . . . . . . . . 6,196 1,509 1,690 62Acquisitions of other investments . . . . . . . . . . . . . . . . . . . . . . . . . . . . . . . . . . . . . . . . . . (131,539) (101,696) (67,425) (1,315)Proceeds from sales of other investments . . . . . . . . . . . . . . . . . . . . . . . . . . . . . . . . . . . . 51,042 53,329 48,136 510Increase in long-term loan receivables . . . . . . . . . . . . . . . . . . . . . . . . . . . . . . . . . . . . . . (88,040) (75,230) (46,974) (880)Collection of long-term loan receivables . . . . . . . . . . . . . . . . . . . . . . . . . . . . . . . . . . . . 86,020 111,251 65,226 860Additions to property leased to others and property and equipment . . . . . . . . . . . . . . . . (282,061) (327,356) (247,054) (2,821)Proceeds from sales of property leased to others and property and equipment . . . . . . . 115,833 52,741 73,958 1,158Acquisitions of subsidiaries, net of cash acquired . . . . . . . . . . . . . . . . . . . . . . . . . . . . . . (52,216) (11,474) — (522)Proceeds from sales of subsidiaries, net of cash held by subsidiaries . . . . . . . . . . . . . . . 106,319 5,434 — 1,063
Net cash used in investing activities . . . . . . . . . . . . . . . . . . . . . . . . . . . . . . . . (104,778) (418,028) (347,332) (1,048)
Financing Activities (Note 27):Net (decrease) increase in short-term debt . . . . . . . . . . . . . . . . . . . . . . . . . . . . . . . . . . . (148,848) 70,820 (89,419) (1,488)Proceeds from long-term debt . . . . . . . . . . . . . . . . . . . . . . . . . . . . . . . . . . . . . . . . . . . . . 551,247 673,730 449,204 5,512Repayments of long-term debt . . . . . . . . . . . . . . . . . . . . . . . . . . . . . . . . . . . . . . . . . . . . (513,851) (434,600) (438,822) (5,138)Proceeds from issuance of common stock . . . . . . . . . . . . . . . . . . . . . . . . . . . . . . . . . . . . — — 203,766 —Capital contribution from minority interests . . . . . . . . . . . . . . . . . . . . . . . . . . . . . . . . . . — 17,095 — —Purchases of treasury stock—net . . . . . . . . . . . . . . . . . . . . . . . . . . . . . . . . . . . . . . . . . . . (1,601) (1,344) (815) (16)Payments of cash dividends . . . . . . . . . . . . . . . . . . . . . . . . . . . . . . . . . . . . . . . . . . . . . . . (72,076) (53,412) (31,645) (721)
Net cash (used in) provided by financing activities . . . . . . . . . . . . . . . . . . . . (185,129) 272,289 92,269 (1,851)
Effect of Exchange Rate Changes on Cash and Cash Equivalents . . . . . . . . . . . . . . (26,652) 9,431 13,922 (266)
Net Increase (Decrease) in Cash and Cash Equivalents . . . . . . . . . . . . . . . . . . . . . . 99,232 102,967 (94,745) 993Cash and Cash Equivalents at Beginning of Year . . . . . . . . . . . . . . . . . . . . . . . . . . . 800,032 697,065 791,810 8,000
Cash and Cash Equivalents at End of Year . . . . . . . . . . . . . . . . . . . . . . . . . . . . . . . . ¥ 899,264 ¥ 800,032 ¥ 697,065 $ 8,993
See notes to consolidated financial statements.
F-9

Notes to Consolidated Financial Statements
Mitsui & Co., Ltd. and subsidiaries
1. NATURE OF OPERATIONS
Mitsui & Co., Ltd. (Mitsui Bussan Kabushiki Kaisha) and subsidiaries (collectively, the “companies”), assogo shosha or general trading companies, are engaged in business activities, such as trading in variouscommodities, financing for customers and suppliers relating to such trading activities worldwide, and organizingand coordinating industrial projects through their worldwide business networks.
The companies conduct sales, export, import, offshore trades and manufacture of products in the areas of“Iron & Steel Products,” “Mineral & Metal Resources,” “Machinery & Infrastructure Projects,” “Chemical,”“Energy,” “Foods & Retail,” and “Consumer Service & IT,” while providing general services for retailing,information and communications, technical support, transportation and logistics and financing.
Further, the companies are also engaged in development of natural resources such as oil and gas, and ironand steel raw materials.
In addition to the above, the companies are engaged in strategic business investments in new areas such asinformation technology, biotechnology and nanotechnology.
2. BASIS OF FINANCIAL STATEMENTS AND SUMMARY OF SIGNIFICANT ACCOUNTINGPOLICIES
I. BASIS OF FINANCIAL STATEMENTS
The accompanying consolidated financial statements are stated in Japanese yen, the currency of the countryin which Mitsui & Co., Ltd. (the “Company”) is incorporated and principally operates. The translation ofJapanese yen amounts into U.S. dollar amounts for the year ended March 31, 2008 is included solely for theconvenience of readers outside Japan and has been made at the rate of ¥100=U.S. $1, the approximate rate ofexchange at March 31, 2008. The translation should not be construed as a representation that the Japanese yenamounts could be converted into U.S. dollars at the above or any other rate.
The accompanying consolidated financial statements have been prepared on the basis of accountingprinciples generally accepted in the United States of America (“U.S. GAAP”). Effect has been given in theconsolidated financial statements to adjustments which have not been entered in the companies’ general books ofaccount maintained principally in accordance with accounting practices prevailing in the countries ofincorporation. Major adjustments include those relating to accounting for derivative instruments and hedgingactivities, recognition of expected losses on purchase and sale commitments, accounting for certain investmentsincluding non-monetary exchange of investments, accounting for warrants, accounting for pension costs andseverance indemnities, recognition of installment sales on the accrual basis of accounting, accounting forbusiness combinations, accounting for goodwill and other intangible assets, accounting for asset retirementobligations, accounting for consolidation of variable interest entities, accounting for leasing, accounting for stockissuance costs and accounting for uncertainty in income taxes.
Total trading transactions, as presented in the accompanying Statements of Consolidated Income, are avoluntary disclosure as permitted by Financial Accounting Standards Board (“FASB”) Emerging Issues TaskForce Issue (“EITF”) No. 99-19, “Reporting Revenue Gross as a Principal versus Net as an Agent,” and representthe gross transaction volume or the aggregate nominal value of the sales contracts in which the companies act asprincipal and transactions in which the companies serve as agent. Total trading transactions should not beconstrued as equivalent to, or a substitute or a proxy for, revenues, or as an indicator of the companies’ operatingperformance, liquidity or cash flows generated by operating, investing or financing activities. The companieshave included the gross transaction volume information because similar Japanese trading companies have
F-10

Notes to Consolidated Financial Statements—(Continued)
Mitsui & Co., Ltd. and subsidiaries
generally used it as an industry benchmark. As such, management believes that total trading transactions are auseful supplement to the results of operations information for users of the consolidated financial statements.
II. SUMMARY OF SIGNIFICANT ACCOUNTING POLICIES
Consolidation
The consolidated financial statements include the accounts of the Company, its majority-owned domesticand foreign subsidiaries, the variable interest entities (“VIEs”) where the Company or one of its subsidiaries is aprimary beneficiary, and its proportionate shares of the assets, liabilities, revenues and expenses of certain of itsoil and gas producing, and mining unincorporated joint ventures in which the companies own an undividedinterest in the assets, and pursuant to the joint venture agreements, are severally liable for their share of eachliability. The VIEs are defined by FASB Interpretation (“FIN”) No. 46, “Consolidation of Variable InterestEntities (revised December 2003)—an Interpretation of ARB No. 51” (“FIN No. 46R”). The unincorporated jointventures proportionately consolidated in accordance with EITF No. 00-1, “Investor Balance Sheet and IncomeStatement Display under the Equity Method for Investments in Certain Partnerships and Other Ventures,” by thecompanies include but are not limited to Main Pass Block 61 J/V (50%), WA-28-L J/V (40%), Block 9 J/V(35%), Robe River Iron Associates J/V (33%), Capricorn Coal Development J/V (30%), Dawson J/V (49%) andBlock 10, 11, 12, 13, 10A/11A J/V (20%-40%).
The difference between the cost of investments in VIEs which are not a business and the equity in the fairvalue of the net assets at the dates of acquisition is accounted for as an extraordinary gain or loss while the excessof the cost of investments in other subsidiaries that meet the definition of a business over the equity in the fairvalue of the net assets at the dates of acquisition is accounted for as goodwill.
Certain subsidiaries with a fiscal year-end on or after December 31, but prior to the parent company’s fiscalyear-end of March 31, are included on the basis of the subsidiaries’ respective fiscal year-ends.
Foreign currency translation
Foreign currency financial statements have been translated in accordance with Statement of FinancialAccounting Standards (“SFAS”) No. 52, “Foreign Currency Translation.” Pursuant to this statement, the assetsand liabilities of foreign subsidiaries and associated companies are translated into Japanese yen at the respectiveyear-end exchange rates. All income and expense accounts are translated at average rates of exchange. Theresulting translation adjustments are included in accumulated other comprehensive income (loss).
Monetary assets and liabilities denominated in foreign currencies are translated into Japanese yen atyear-end exchange rates with the resulting gains and losses recognized in earnings.
Cash equivalents
Cash equivalents are defined as short-term (original maturities of three months or less), highly liquidinvestments which are readily convertible into cash and have no significant risk of change in value includingcertificates of deposit, time deposits, financing bills and commercial papers with original maturities of threemonths or less.
Allowance for doubtful receivables
In accordance with SFAS No. 114, “Accounting by Creditors for Impairment of a Loan—an amendment ofFASB Statements No. 5 and 15,” as amended by SFAS No. 118, “Accounting by Creditors for Impairment of a
F-11

Notes to Consolidated Financial Statements—(Continued)
Mitsui & Co., Ltd. and subsidiaries
Loan—Income Recognition and Disclosures—an amendment of FASB Statement No. 114,” an impairment lossfor a specific loan deemed to be impaired is measured based on the present value of expected cash flowsdiscounted at the loan’s original effective interest rate or the fair value of the collateral if the loan is collateraldependent.
An allowance for doubtful receivables is recorded for all receivables not subject to the accountingrequirement of SFAS No. 114 based primarily upon the companies’ credit loss experiences and an evaluation ofpotential losses in the receivables.
Inventories
Inventories, consisting mainly of commodities and materials for resale, are stated at the lower of cost,principally on the specific-identification basis, or market.
Derivative instruments and hedging activities
In accordance with SFAS No. 133, “Accounting for Derivative Instruments and Hedging Activities,” asamended by SFAS No. 138, “Accounting for Certain Derivative Instruments and Certain Hedging Activities—anamendment of FASB Statement No. 133,” and SFAS No. 149, “Amendment of Statement 133 on DerivativeInstruments and Hedging Activities,” all derivative instruments are recognized and measured at fair value aseither assets or liabilities in the Consolidated Balance Sheets. The accounting for changes in the fair valuedepends on the intended use of the derivative instruments and their resulting hedge designation.
The companies enter into derivative commodity instruments, such as future, forward, option and swapcontracts, as a means of hedging the exposure to changes in the fair value of inventories and unrecognized firmcommitments and the exposure to variability in the expected future cash flows from forecasted transactions,principally for non-ferrous metals, crude oil and agricultural products.
Changes in the fair value of derivative commodity instruments, designated and effective as fair valuehedges, are recognized in sales of products or cost of products sold as offsets to changes in the fair value of thehedged items. Changes in the fair value of derivative commodity instruments, designated and effective as cashflow hedges, are initially recorded as other comprehensive income and reclassified into earnings as sales ofproducts or cost of products sold when the hedged transactions affect earnings. Changes in the fair value of theineffective portion are recognized in sales of products or cost of products sold immediately.
Changes in the fair value of derivative commodity instruments, for which hedge requirements are not metunder SFAS No. 133, are currently recognized in sales of products or cost of products sold without any offsettingchanges in the fair value of the hedged items.
The Company and certain subsidiaries also enter into agreements for derivative commodity instruments as apart of their trading activities. These derivative instruments are marked to market and gains or losses resultingfrom these contracts are reported in other sales.
Changes in the fair value of all open positions of precious metals traded in terminal (future) markets arerecognized in other sales in order to reflect the fair value of commodity trading transactions consisting ofinventories, unrecognized firm commitments and derivative commodity instruments as a whole.
The companies enter into derivative financial instruments such as interest rate swap agreements, foreignexchange forward contracts, currency swap agreements, and interest rate and currency swap agreements as ameans of hedging their interest rate and foreign exchange exposure.
F-12

Notes to Consolidated Financial Statements—(Continued)
Mitsui & Co., Ltd. and subsidiaries
Changes in the fair value of interest rate swap agreements, designated and effective as fair value hedges forchanges in the fair value of fixed-rate financial assets or liabilities attributable to changes in the designatedbenchmark interest rate, are recognized in interest income and expense as offsets to changes in the fair value ofhedged items. Changes in the fair value of interest rate swap agreements, designated and effective as cash flowhedges for changes in the cash flows of floating-rate financial assets or liabilities attributable to changes in thedesignated benchmark interest rate, are initially recorded in other comprehensive income and reclassified intoearnings as interest income and expense when the hedged transactions affect earnings. Changes in the fair valueof the ineffective portion are recognized in interest income and expense immediately.
Changes in the fair value of foreign exchange forward contracts and currency swap agreements, designatedand effective as cash flow hedges for changes in the cash flows of foreign-currency-denominated assets orliabilities, unrecognized firm commitments and forecasted transactions attributable to changes in the relatedforeign currency exchange rate, are initially recorded in other comprehensive income and reclassified intoearnings as foreign exchange gains or losses when the hedged transactions affect earnings. Changes in the fairvalue of the ineffective portion are recognized in foreign exchange gains or losses immediately.
Changes in the fair value of interest rate and currency swap agreements, designated and effective as fairvalue hedges or cash flow hedges for changes in the fair values or cash flows of foreign-currency-denominatedassets or liabilities attributable to changes in the designated benchmark interest rate or the related foreigncurrency exchange rate are recorded as either earnings or other comprehensive income depending on thetreatment of foreign currency hedges as fair value hedges or cash flow hedges.
Changes in the fair value of derivative financial instruments, for which hedge requirements are not metunder SFAS No. 133, are currently recognized in interest income and expense for interest rate swap agreementsand in foreign exchange gains or losses for foreign exchange forward contracts, currency swap agreements andinterest rate and currency swap agreements.
The Company and certain subsidiaries also enter into agreements for certain derivative financial instrumentsas a part of their trading activities. These derivative instruments are marked to market and the related gains orlosses are reported in other sales.
The companies use derivative instruments and non-derivative financial instruments in order to reduce theforeign currency exposure in the net investment in a foreign operation. The foreign currency transaction gains orlosses on these instruments, designated as and effective as hedging instruments, are deferred and recorded asforeign currency translation adjustments within other comprehensive income to the extent they are effective ashedge. These amounts are only recognized in income upon the complete or partial sale of the related investmentor the complete liquidation of the investment.
For the Statements of Consolidated Cash Flows, cash flows from derivative commodity instruments andderivative financial instruments that qualify for hedge accounting are included in the same category as the itemsbeing hedged.
Debt and marketable equity securities
The companies classify debt and marketable equity securities, at acquisition, into one of three categories:held-to-maturity, available-for-sale or trading under provisions of SFAS No. 115, “Accounting for CertainInvestments in Debt and Equity Securities.”
Trading securities are carried at fair value and unrealized holding gains and losses are included in earnings.
F-13

Notes to Consolidated Financial Statements—(Continued)
Mitsui & Co., Ltd. and subsidiaries
Debt securities are classified as held-to-maturity and measured at amortized cost in the ConsolidatedBalance Sheets only if the companies have the positive intent and ability to hold those securities to maturity.Premiums and discounts amortized in the period are included in interest income.
Debt and marketable equity securities other than those classified as trading or held-to-maturity securities areclassified as available-for-sale securities and carried at fair value with related unrealized holding gains and lossesreported in accumulated other comprehensive income (loss) in shareholders’ equity on a net-of-tax basis.
For other than a temporary decline in the value of debt and marketable equity securities below their cost oramortized cost, the investment is reduced to its fair value, which becomes the new cost basis of the investment.The amount of the reduction is reported as a loss for the year in which such determination is made. Variousfactors, such as the extent which the cost exceeds the market value, the duration of the market decline, thefinancial condition and near-term prospects of the issuer, and the intent and ability to retain the investment for aperiod of time sufficient to allow for any anticipated recovery in market value, are reviewed to judge whether thedecline is other than temporary.
The cost of debt and marketable securities sold is determined based on the moving-average cost method.
Non-marketable equity securities
Non-marketable equity securities are carried at cost. When other than a temporary decline in the value ofsuch securities below their cost occurs, the investment is reduced to its fair value and an impairment loss isrecognized. Various factors, such as the financial condition and near-term prospects of the issuer, are reviewed tojudge whether it is other than temporary.
The cost of non-marketable equity securities sold is determined based on the moving-average cost method.
Investments in associated companies
Investments in associated companies (20% to 50%-owned corporate investees, corporate joint ventures, andless than 20%-owned corporate investees over which the companies have the ability to exercise significantinfluence) and noncontrolling investments in general partnerships, limited partnerships and limited liabilitycompanies are accounted for under the equity method, after appropriate adjustments for intercompany profits anddividends. The differences between the cost of such investments and the companies’ equity in the underlying fairvalue of the net assets of associated companies at the dates of acquisition are recognized as equity methodgoodwill.
For other than a temporary decline in the value of investments in associated companies below the carryingamount, the investment is reduced to its fair value and an impairment loss is recognized.
Leasing
The companies are engaged in lease financing consisting of direct financing leases and leveraged leases, andin operating leases of properties. For direct financing leases, unearned income is amortized to income over thelease term at a constant periodic rate of return on the net investment. Income on leveraged leases is recognizedover the life of the lease at a constant rate of return on the positive net investment. Initial direct costs are deferredand amortized using the interest method over the lease period. Operating lease income is recognized as othersales over the term of underlying leases on a straight-line basis.
F-14

Notes to Consolidated Financial Statements—(Continued)
Mitsui & Co., Ltd. and subsidiaries
The companies are also lessees of various assets. Rental expenses on operating leases are recognized overthe respective lease terms using the straight-line method.
Property and equipment
Property and equipment are stated at cost.
Depreciation of property and equipment (including property leased to others) is computed principally underthe declining-balance method for assets located in Japan and under the straight-line method for assets locatedoutside Japan, using rates based upon the estimated useful lives of the related property and equipment. Theestimated useful lives for buildings, equipment and fixtures, and vessels are primarily 8 to 65 years, 2 to 30years, and 8 to 18 years, respectively. Mineral rights are amortized over their respective estimated useful lives,which are 7 to 20 years, using the straight-line method or the unit-of-production method.
Leasehold improvements are amortized over the lesser of the useful life of the improvement or the term ofthe underlying lease.
Significant renewals and additions are capitalized at cost. Maintenance and repairs, and minor renewals andbetterments are charged to expense as incurred.
Impairment of long-lived assets
In accordance with SFAS No. 144, “Accounting for the Impairment or Disposal of Long-Lived Assets,”long-lived assets to be held and used or to be disposed of other than by sale are reviewed, by using undiscountedfuture cash flows, for impairment whenever events or changes in circumstances indicate that the carrying amountof the assets may not be recoverable. If the sum of the expected future cash flows is less than the carrying amountof the asset, an impairment loss is recognized. Such impairment loss is measured as the amount by which thecarrying amount of the asset exceeds its fair value. Long-lived assets to be disposed of by sale are reported at thelower of carrying amount or fair value less cost to sell.
Business combinations
In accordance with SFAS No. 141, “Business Combinations,” the purchase method of accounting is used forall business combinations. The companies separately recognize and report acquired intangible assets as goodwillor other intangible assets. Any excess of fair value of acquired net assets over cost arising from a businesscombination is allocated as a pro rata reduction of the amounts that otherwise would have been assigned tocertain acquired assets and the remaining excess is immediately recognized as an extraordinary gain.
Goodwill and other intangible assets
In accordance with SFAS No. 142, “Goodwill and Other Intangible Assets,” goodwill is not amortized buttested for impairment annually or more frequently if impairment indicators arise. Identifiable intangible assetswith a finite useful life are amortized over their respective estimated useful lives and reviewed for impairment inaccordance with SFAS No. 144. Any identifiable intangible asset determined to have an indefinite useful life isnot amortized, but instead tested for impairment in accordance with SFAS No. 142 until its useful life isdetermined to be no longer indefinite.
Equity method goodwill is reviewed for impairment as a part of other than a temporary decline in the valueof investments in associated companies below the carrying amount in accordance with Accounting PrinciplesBoard (“APB”) Opinion No. 18, “The Equity Method of Accounting for Investments in Common Stock.”
F-15

Notes to Consolidated Financial Statements—(Continued)
Mitsui & Co., Ltd. and subsidiaries
Intangible assets subject to amortization consist primarily of software, customer relationships, trademarksand patents which are amortized over their respective estimated useful lives using the straight-line method. Theestimated useful lives for software, customer relationships, trademarks and patents are 3 to 5 years, 10 to 25years, 5 to 10 years and 5 to 10 years, respectively. Intangible assets not subject to amortization mainly consist ofland rights and trademarks.
Oil and gas producing activities
Oil and gas exploration and development costs are accounted for using the successful efforts method ofaccounting. The costs of acquiring properties, costs of drilling and equipping exploratory wells, and costs ofdevelopment wells and related plant and equipment are capitalized, and amortized using the unit-of-productionmethod. Exploratory well costs are expensed, if economically recoverable reserves are not found. Otherexploration costs, such as geological and geophysical costs, are expensed as incurred.
In accordance with SFAS No. 144, proved properties are reviewed for impairment whenever events orchanges in circumstances indicate that the carrying value may not be recoverable. If the proved properties aredetermined to be impaired, an impairment loss is recognized based on the fair value. Unproven properties areassessed annually for impairment in accordance with the guidance in SFAS No. 19, “Financial Accounting andReporting by Oil and Gas Producing Companies,” with any impairment charged to expense. The companies’policy is to consider the unproved properties not impaired if the estimated reserves of those properties can beestablished to be economically viable. Economically viable means that they may be developed in such a way thatit is probable that over their project lives they will generate, at a minimum, zero net cash flow on anundiscounted pre-tax basis, based on current prices. For the purpose of this test, the current price is the price atthe end of the period for which the review is conducted for the reserves concerned.
Mining operations
Mining exploration costs are expensed as incurred until the mining project has been established ascommercially viable by a final feasibility study. Once established as commercially viable, costs are capitalized asdevelopment costs and are amortized using the unit-of-production method or straight-line method based on theproven and probable reserves.
In open pit mining operations, it is necessary to remove overburden and other waste materials to accessmineral deposits. The costs of removing waste materials are referred to as “stripping costs.” During thedevelopment of a mine, before production commences, such costs are generally capitalized as part of thedevelopment costs. Removal of waste materials continues during the production stage of the mine. Such post-production stripping costs are variable production costs to be considered a component of mineral inventory costsand are recognized as a component of costs of products sold in the same period as the related revenues from thesales of the minerals. Depending on the configuration of the mineral deposits, the post-production stripping costscould lead to a lower of cost or market inventory adjustment.
Asset retirement obligations
In accordance with SFAS No. 143, “Accounting for Asset Retirement Obligations,” the companies recordthe fair value of a liability for an asset retirement obligation in the period in which it is incurred. When theliability is initially recorded, the companies capitalize the related cost by increasing the carrying amount of thelong-lived asset. Over time, the liability is accreted to its present value each period, and the capitalized cost isdepreciated over the useful life of the related asset.
F-16

Notes to Consolidated Financial Statements—(Continued)
Mitsui & Co., Ltd. and subsidiaries
Pension and severance indemnities plans
The companies have pension plans and/or severance indemnities plans covering substantially all employeesother than directors. The costs of the pension plans and severance indemnities plans are accrued based onamounts determined using actuarial methods, in accordance with SFAS No. 87, “Employers’ Accounting forPensions,” and SFAS No. 158, “Employers’ Accounting for Defined Benefit Pension and Other PostretirementPlans—an amendment of FASB statements No. 87, 88, 106, and 132(R).”
Guarantees
In accordance with FIN No. 45, “Guarantor’s Accounting and Disclosure Requirements for Guarantees,Including Indirect Guarantees of Indebtedness of Others—an Interpretation of FASB Statements No. 5, 57 and107 and rescission of FASB Interpretation No. 34,” the companies recognize, at the inception of a guarantee, aliability for the fair value of the obligation undertaken for the guarantee.
Revenue recognition
The companies recognize revenues when they are realized or realizable and earned. Revenues are realized orrealizable and earned when the companies have persuasive evidence of an arrangement, the goods have beendelivered or the services have been rendered to the customer, the sales price is fixed or determinable andcollectibility is reasonably assured. In addition to this general policy, the following are specific revenuerecognition policies:
Sales of products
Sales of products include the sales of various products as a principal in the transactions, the manufacture andsale of a wide variety of products such as metals, chemicals, foods and general consumer merchandise, thedevelopment of natural resources such as coal, iron ore, oil and gas, and the development and sale of real estate.The companies recognize those revenues at the time the delivery conditions agreed with customers are met.These conditions are usually considered to have been met when the goods are received by the customer, the titleto the warehouse receipts is transferred, or the implementation testing is duly completed.
For long-term construction contracts such as railroad projects, depending on the nature of the contract,revenues are accounted for by the percentage-of-completion method if estimates of costs to complete and extentof progress toward completion of long-term contracts are reasonably dependable, otherwise the companies usethe completed contract method.
The Company and certain subsidiaries enter into buy/sell arrangements, mainly relating to transactions ofcrude oil and petroleum products. Under buy/sell arrangements, which are entered into primarily to optimizesupply or demand requirements, the Company and certain subsidiaries agree to buy (sell) a specific quality andquantity of commodities to be delivered at a specific location and/or time while agreeing to sell (buy) the samequality and quantity of the commodities at a different location and/or time to the same counterparty. The buy/sellarrangements are reported on a net basis in the Statements of Consolidated Income.
Sales of services
Sales of services include the revenues from trading margins and commissions related to various tradingtransactions in which the companies act as a principal or an agent. Specifically, the companies charge acommission for the performance of various services such as logistic and warehouse services, information and
F-17

Notes to Consolidated Financial Statements—(Continued)
Mitsui & Co., Ltd. and subsidiaries
communication services, and technical support. For some back-to-back sales and purchase transactions ofproducts, the companies act as a principal and record the net amount of sales and purchase prices as revenues.The companies also facilitate conclusion of the contracts between manufacturers and customers and deliveries forthe products between suppliers and customers. Revenues from service related businesses are recorded asrevenues when the contracted services are rendered to third-party customers pursuant to the agreements.
Other sales
Other sales principally include the revenues from leasing activities of real estate, rolling stock, oceantransport vessels, aircraft, equipment and others, the revenues from derivative commodity instruments andderivative financial instruments held for trading purposes, and the revenues from external consumer financing.See accounting policies for leasing and derivative instruments and hedging activities for the revenue recognitionpolicies regarding leasing and derivative transactions, respectively.
Research and development expenses
Research and development costs are charged to expenses when incurred.
Advertising expenses
Advertising costs are charged to expenses when incurred.
Issuance of stock by subsidiaries and associated companies
A subsidiary or an associated company may issue its shares to third parties at amounts per share in excess ofor less than the Company’s average per share carrying value. With respect to such transactions, the resultinggains or losses arising from the change in equity interest are recorded in income for the year in which such sharesare issued.
Income taxes
Income tax expense is based on reported earnings before income taxes. Deferred income taxes reflect theimpact of temporary differences between assets and liabilities recognized for financial reporting purposes andsuch amounts recognized for tax purposes and tax loss carryforwards. These deferred taxes are measured usingthe currently enacted tax rates in effect for the year in which the temporary differences or tax loss carryforwardsare expected to reverse. Valuation allowances are established when it is more likely than not that some or all ofthe deferred tax assets will not be realized.
In accordance with FIN No. 48, “Accounting for Uncertainty in Income Taxes—an interpretation of FASBStatement No. 109,” the companies recognize and measure uncertainty in income taxes. Interests and penaltiesincurred in relation to income taxes are reported in current income taxes in the Statements of ConsolidatedIncome.
Net income per share
Basic net income per share is computed by dividing net income by the weighted-average number ofcommon shares outstanding for the period. Diluted net income per share reflects the potential dilution as a resultof issuance of shares upon conversion of the companies’ convertible bonds.
F-18

Notes to Consolidated Financial Statements—(Continued)
Mitsui & Co., Ltd. and subsidiaries
III. RECLASSIFICATION
Certain reclassifications and format changes have been made to prior year amounts to conform to the currentyear presentation.
IV. NEW ACCOUNTING STANDARDS
Accounting for certain hybrid financial instruments
During the year ended March 31, 2008, the companies adopted SFAS No. 155, “Accounting for CertainHybrid Financial Instruments—an amendment of FASB Statements No. 133 and 140.”
One of the amendments to SFAS No. 133 and SFAS No. 140 is that SFAS No. 155 permits an entity to electfair value remeasurement for any hybrid financial instrument in its entirety with changes in fair value recognizedin earnings, in which the hybrid financial instrument contains an embedded derivative that otherwise wouldrequire bifurcation.
The effect of adoption of this statement on the companies’ financial position and results of operations wasimmaterial.
Accounting for servicing of financial assets
During the year ended March 31, 2008, the companies adopted SFAS No. 156, “Accounting for Servicing ofFinancial Assets—an amendment of FASB Statement No. 140.”
SFAS No. 156 requires all separately recognized servicing assets and servicing liabilities to be initiallymeasured at fair value, if practicable, and permits an entity to choose either the amortization method or the fairvalue measurement method for subsequent measurement of each class of separately recognized servicing assetsand servicing liabilities.
The effect of adoption of this statement on the companies’ financial position and results of operations wasimmaterial.
Accounting for uncertainty in income taxes
On April 1, 2007, the companies adopted FIN No. 48, “Accounting for Uncertainty in Income Taxes—aninterpretation of FASB Statement No. 109.”
FIN No. 48 clarifies the accounting for uncertainty in income taxes recognized in financial statements inaccordance with SFAS No. 109, “Accounting for Income Taxes,” and prescribes a recognition threshold andmeasurement attribute for the financial statement recognition and measurement of all tax positions accounted forin accordance with SFAS No. 109.
The cumulative effect of adoption of this interpretation is disclosed in the Statements of ConsolidatedShareholders’ Equity as a decrease of ¥5,113 million in the opening balance of unappropriated retained earnings.See also Note 20, “INCOME TAXES,” for the effect of adoption of this interpretation.
Employers’ accounting for defined benefit pension and other postretirement plans
In September 2006, the FASB issued SFAS No. 158, “Employers’ Accounting for Defined Benefit Pensionand Other Postretirement Plans—an amendment of FASB Statements No. 87, 88, 106 and 132(R).”
F-19

Notes to Consolidated Financial Statements—(Continued)
Mitsui & Co., Ltd. and subsidiaries
SFAS No. 158 requires the recognition of the overfunded or underfunded status of a defined benefit pensionplan as an asset or a liability in the statement of financial position and the recognition of changes in that fundedstatus in comprehensive income in the year in which the changes occur. SFAS No. 158 also requires an entity tomeasure the funded status of a plan as of the date of an entity’s year-end statement of financial position, withlimited exceptions.
During the year ended March 31, 2007, the companies adopted the recognition and related disclosureprovisions of this statement. See Note 14, “PENSION COSTS AND SEVERANCE INDEMNITIES,” for theeffect of adoption of these provisions.
The measurement date provisions are effective for fiscal years ending after December 15, 2008. The effectof adoption of these provisions on the companies’ financial position and results of operations will be immaterial.
Fair value measurements
In September 2006, the FASB issued SFAS No. 157, “Fair Value Measurements.”
SFAS No.157 defines fair value, establishes a framework for measuring fair value, and expands disclosuresabout fair value measurements.
SFAS No. 157 was planned to be effective for financial statements issued for fiscal years beginning afterNovember 15, 2007 and interim periods within those fiscal years. However, in February 2008, the FASB issuedFASB Staff Position (“FSP”) No. FAS 157-2, which delayed the effective date to fiscal years beginning afterNovember 15, 2008 and interim periods within those fiscal years for nonfinancial assets and nonfinancialliabilities, except for items that are recognized or disclosed at fair value in the financial statements on recurringbasis. The effect of adoption of this statement on the companies’ financial position and results of operations willbe immaterial.
Fair value option
In February 2007, the FASB issued SFAS No. 159, “The Fair Value Option for Financial Assets andFinancial Liabilities—including an amendment of FASB Statement No. 115.”
SFAS No. 159 permits an entity to choose, at specified election dates, to measure eligible financial assetsand liabilities at fair value. An entity will report unrealized gains and losses on items for which the fair valueoption has been elected in earnings.
SFAS No. 159 is effective as of the beginning of an entity’s first fiscal year that begins after November 15,2007. The effect of adoption of this statement on the companies’ financial position and results of operations willbe immaterial.
Offsetting of amounts related to certain contracts
In April 2007, the FASB issued FSP No. FIN 39-1, “Amendment of FASB Interpretation No. 39.”
FSP No. FIN 39-1 amends FIN No. 39, “Offsetting of Amounts Related to Certain Contracts—aninterpretation of APB Opinion No. 10 and FASB Statement No. 105,” to permit a reporting entity to offset fairvalue amounts recognized for the right to reclaim cash collateral (a receivable) or the obligation to return cashcollateral (a payable) against fair value amounts recognized for derivative instruments executed with the samecounterparty under the same master netting arrangement.
F-20

Notes to Consolidated Financial Statements—(Continued)
Mitsui & Co., Ltd. and subsidiaries
FSP No. FIN 39-1 is effective for fiscal years beginning after November 15, 2007. The effect of adoption ofthis staff position on the companies’ financial position and results of operations will be immaterial.
Scope of audit and accounting guide for investment companies
In June 2007, the American Institute of Certified Public Accountants (“AICPA”) issued the Statement ofPosition (“SOP”) 07-1, “Clarification of the Scope of the Audit and Accounting Guide Investment Companiesand Accounting by Parent Companies and Equity Method Investors for Investments in Investment Companies.”
SOP 07-1 provides guidance for determining whether an entity is within the scope of the AICPA Audit andAccounting Guide Investment Companies. For those entities that are investment companies under this statement,SOP 07-1 requires that the investment company accounting should be retained by a parent company inconsolidation or by an equity method investor. In addition, SOP 07-1 includes certain disclosure requirements forparent companies and equity method investors in investment companies that retain investment companyaccounting in the parent company’s consolidated financial statements or the financial statements of an equitymethod investor.
SOP 07-1 was planned to be effective for fiscal years beginning on or after December 15, 2007, however, inFebruary 2008, the FASB issued FSP No. SOP 07-1-1, which delayed indefinitely the effective date of thisstatement. The effect of adoption of this statement on the companies’ financial position and results of operationsis not currently known and cannot be reasonably estimated until further analysis is completed.
Business combinations
In December 2007, the FASB issued SFAS No. 141 (revised 2007), “Business Combinations” (“SFASNo. 141R”).
SFAS No. 141R establishes principles and requirements for how an acquirer recognizes and measures in itsfinancial statements the identifiable assets acquired, the liabilities assumed, any noncontrolling interest in theacquiree and the goodwill acquired in the business combination or a gain from a bargain purchase. SFASNo. 141R also requires disclosures to enable users of the financial statements to evaluate the nature and financialeffects of the business combination.
SFAS No. 141R is applied prospectively to business combinations for which the acquisition date is on orafter the beginning of the first annual reporting period beginning on or after December 15, 2008. The effect ofadoption of this statement on the companies’ financial position and results of operations is not currently knownand cannot be reasonably estimated until further analysis is completed.
Noncontrolling interests in consolidated financial statements
In December 2007, the FASB issued SFAS No. 160, “Noncontrolling Interests in Consolidated FinancialStatements—an amendment of ARB No. 51.”
SFAS No. 160 establishes accounting and reporting standards for the noncontrolling interest in a subsidiaryand for the deconsolidation of a subsidiary.
SFAS No. 160 is effective for fiscal years beginning on or after December 15, 2008 and interim periodswithin those fiscal years. The effect of adoption of this statement on the companies’ financial position and resultsof operations is not currently known and cannot be reasonably estimated until further analysis is completed.
F-21

Notes to Consolidated Financial Statements—(Continued)
Mitsui & Co., Ltd. and subsidiaries
Disclosures about Derivative Instruments and Hedging Activities
In March 2008, the FASB issued SFAS No. 161, “Disclosures about Derivative Instruments and HedgingActivities—an amendment of FASB Statement No. 133.”
SFAS No. 161 amends and expands the disclosure requirements of SFAS No. 133 to provide users offinancial statements with an enhanced understanding of how and why an entity uses derivative instruments, howderivative instruments and related hedged items are accounted for under SFAS No. 133 and its relatedinterpretations, and how derivative instruments and related hedged items affect an entity’s financial position,financial performance, and cash flows.
SFAS No. 161 is effective for financial statements issued for fiscal years and interim periods beginning afterNovember 15, 2008. The effect of adoption of this statement on the companies’ financial position and results ofoperations will be immaterial.
V. USE OF ESTIMATES IN THE PREPARATION OF THE CONSOLIDATED FINANCIALSTATEMENTS
The preparation of consolidated financial statements in conformity with U.S. GAAP requires managementto make estimates and assumptions that affect the reported amounts of assets and liabilities and disclosure ofcontingent assets and liabilities at the date of the consolidated financial statements and the reported amounts ofrevenues and expenses during the reporting period. Actual results could differ from those estimates.
3. BUSINESS COMBINATIONS
For the year ended March 31, 2008
The following are the primary business combinations, which were completed during the year endedMarch 31, 2008.
Steel Technologies Inc.
On February 28, 2007, Mitsui & Co. (U.S.A), Inc. (“Mitsui USA”), a wholly owned subsidiary of theCompany, agreed with Steel Technologies Inc. (“Steel Tech”) to acquire all the outstanding shares of Steel Tech.After obtaining the approval of its shareholders in a special shareholders meeting on May 30, 2007 and all thenecessary regulatory approvals, Mitsui USA closed the acquisition process on June 1, 2007. The total amountpaid for the acquisition was ¥47,946 million (U.S. $394 million). The carrying value of the companies’ equityinvestment in Mi-Tech Steel Inc. (a J/V with Steel Tech, which later merged into Steel Tech in March 2008)immediately before the acquisition was ¥3,316 million (U.S. $27 million). Steel Tech operates 25 steelprocessing facilities, including its joint venture operations, throughout the United States, Canada and Mexico,delivering processing capabilities and value-added services to customers in a variety of industries by leveragingits broad geographic network facilities.
Creation of higher value-added marketing and logistics services in the steel business is one of the companies’core strategies and the companies are actively investing resources in this area. Through this acquisition, thecompanies obtain an important business platform in North America. Using it as the base for steel product valuechain management in the United States, the companies aim to strengthen the business foundation in the steelproduct industries in the Americas segment. This acquisition is consistent with the companies’ core strategy.
The consolidated financial statements for the year ended March 31, 2008 include the operating results ofSteel Tech as a subsidiary from the closing date of the acquisition.
F-22

Notes to Consolidated Financial Statements—(Continued)
Mitsui & Co., Ltd. and subsidiaries
The purchase price was determined based on the expected future cash flows Steel Tech will generate. Theexcess of the purchase price over the fair value of net assets of Steel Tech was recorded as goodwill. The primaryfactors that contributed to the determination of the purchase price that caused the recognition of goodwill includethe following: (1) the Steel Tech’s broad geographic network facilities in North America and ability to providevalue-added services, (2) the synergies that might be achieved with the companies’ marketing and logisticsservices in the steel business.
In connection with this acquisition, ¥4,236 million, ¥1,379 million and ¥8,289 million were assigned tointangible assets subject to amortization, intangible assets not subject to amortization, and goodwill, respectively.The intangible assets subject to amortization consist primarily of customer relationship of ¥3,516 million with anamortization period of 24 years. The goodwill is non-deductible for tax purpose and has been assigned to theAmericas Segment.
The following table summarizes the estimated fair values of the assets acquired and liabilities assumed atthe date of acquisition:
Millions of Yen
Current assets . . . . . . . . . . . . . . . . . . . . . . . . . . . . . . . . . . . . . . . . . . . . . . . . . . . . . . . . . . . . . . . . . . . ¥ 52,749Property and equipment . . . . . . . . . . . . . . . . . . . . . . . . . . . . . . . . . . . . . . . . . . . . . . . . . . . . . . . . . . . 26,239Intangible assets . . . . . . . . . . . . . . . . . . . . . . . . . . . . . . . . . . . . . . . . . . . . . . . . . . . . . . . . . . . . . . . . . 13,904Investments and other assets . . . . . . . . . . . . . . . . . . . . . . . . . . . . . . . . . . . . . . . . . . . . . . . . . . . . . . . 7,960
Total assets acquired . . . . . . . . . . . . . . . . . . . . . . . . . . . . . . . . . . . . . . . . . . . . . . . . . . . . . . . . . 100,852
Current liabilities . . . . . . . . . . . . . . . . . . . . . . . . . . . . . . . . . . . . . . . . . . . . . . . . . . . . . . . . . . . . . . . . (39,766)Long-term liabilities . . . . . . . . . . . . . . . . . . . . . . . . . . . . . . . . . . . . . . . . . . . . . . . . . . . . . . . . . . . . . . (9,357)Minority interest . . . . . . . . . . . . . . . . . . . . . . . . . . . . . . . . . . . . . . . . . . . . . . . . . . . . . . . . . . . . . . . . . (467)
Total liabilities assumed and minority interest . . . . . . . . . . . . . . . . . . . . . . . . . . . . . . . . . . . . . (49,590)
Net assets acquired . . . . . . . . . . . . . . . . . . . . . . . . . . . . . . . . . . . . . . . . . . . . . . . . . . . . . . . . . . . ¥ 51,262
Pro forma results of operations for the above business combination have not been presented because theeffects were not material to the consolidated financial statements.
Affiliated Financial Corporation and BayQuest Capital Corporation
On April 27, 2007, Mitsui USA, a wholly owned subsidiary of the Company, agreed with the owner groupof Affiliated Financial Corporation and BayQuest Capital Corporation (collectively, “AFC”) to acquire 87.5% ofthe outstanding shares of AFC for ¥7,221 million (U.S. $63 million). After the closing conditions were met,Mitsui USA completed the acquisition on September 21, 2007. In the acquisition process, the owner group hadAffiliated Financial Corporation and BayQuest Capital Corporation merge into newly formed LLCs, AFC LLCand BCC LLC, respectively; then Mitsui USA, through AFC HoldCo, LLC, a newly formed holding entityowned by Mitsui USA, acquired both AFC LLC and BCC LLC in exchange for cash and 12.5% of the LLCinterest in AFC HoldCo, LLC on September 21, 2007. On the same day, BCC LLC was merged into AFC LLC,the surviving entity. After the series of transactions, Mitsui USA holds an 87.5% interest in AFC HoldCo, LLC.
AFC purchases, sells, securitizes and services retail automobile installment contracts originated byfranchised and selected independent dealers in approximately 40 states in the United States. Through its loanpurchases, AFC serves as a source of financing for more than 4,000 dealerships, providing financing toconsumers indirectly.
F-23

Notes to Consolidated Financial Statements—(Continued)
Mitsui & Co., Ltd. and subsidiaries
The companies have considerable experience in automobile-related businesses worldwide, includinglogistics, assembly, distribution, dealerships, automotive parts and retail financing. This acquisition is intended toenhance the companies’ automobile value chain in the United States and is consistent with the companies’ corestrategy.
The consolidated financial statements for the year ended March 31, 2008 include the operating results ofAFC as a subsidiary from the closing date of the acquisition.
The purchase price was determined based on the expected future cash flows AFC will generate. The excessof the purchase price over the fair value of net assets of AFC was recorded as goodwill. The primary factors thatcontributed to the determination of the purchase price that caused the recognition of goodwill were following:(1) the AFC’s network and experience in the automobile financing business in the United States, (2) thesynergies that might be achieved with the companies’ automobile value chain in the United States.
In connection with this acquisition, ¥277 million and ¥6,695 million were assigned to intangible assetssubject to amortization and goodwill, respectively. The intangible assets subject to amortization consists of anon-compete agreement with an amortization period of 8 years. The goodwill is deductible for tax purpose andhas been assigned to the Americas Segment.
The following table summarizes the estimated fair values of the assets acquired and liabilities assumed atthe date of acquisition:
Millions of Yen
Current assets . . . . . . . . . . . . . . . . . . . . . . . . . . . . . . . . . . . . . . . . . . . . . . . . . . . . . . . . . . . . . . . . . . . ¥ 3,105Property and equipment . . . . . . . . . . . . . . . . . . . . . . . . . . . . . . . . . . . . . . . . . . . . . . . . . . . . . . . . . . . 151Intangible assets . . . . . . . . . . . . . . . . . . . . . . . . . . . . . . . . . . . . . . . . . . . . . . . . . . . . . . . . . . . . . . . . . 6,972Investments and other assets . . . . . . . . . . . . . . . . . . . . . . . . . . . . . . . . . . . . . . . . . . . . . . . . . . . . . . . 6,403
Total assets acquired . . . . . . . . . . . . . . . . . . . . . . . . . . . . . . . . . . . . . . . . . . . . . . . . . . . . . . . . . 16,631
Current liabilities . . . . . . . . . . . . . . . . . . . . . . . . . . . . . . . . . . . . . . . . . . . . . . . . . . . . . . . . . . . . . . . . (2,064)Long-term liabilities . . . . . . . . . . . . . . . . . . . . . . . . . . . . . . . . . . . . . . . . . . . . . . . . . . . . . . . . . . . . . . (6,338)Minority interest . . . . . . . . . . . . . . . . . . . . . . . . . . . . . . . . . . . . . . . . . . . . . . . . . . . . . . . . . . . . . . . . . (1,008)
Total liabilities assumed and minority interest . . . . . . . . . . . . . . . . . . . . . . . . . . . . . . . . . . . . . (9,410)
Net assets acquired . . . . . . . . . . . . . . . . . . . . . . . . . . . . . . . . . . . . . . . . . . . . . . . . . . . . . . . . . . . ¥ 7,221
Pro forma results of operations for the above business combination have not been presented because theeffects were not material to the consolidated financial statements.
For the year ended March 31, 2007
The following are the primary business combinations, which were completed during the year endedMarch 31, 2007.
Gas Participacoes Ltda.
On October 31, 2005, the Company entered into a Share Purchase Agreement with Global Petroleum & GasIndustry, LLC to acquire all the outstanding shares of Gas Participacoes Ltda. (“Gaspart”) for about¥18,648 million (U.S. $159 million). After satisfying the closing conditions, the Company closed the acquisition
F-24

Notes to Consolidated Financial Statements—(Continued)
Mitsui & Co., Ltd. and subsidiaries
process on April 20, 2006. Gaspart was renamed to Mitsui Gas e Energia do Brasil on October 16, 2006. Gaspartis a holding company of six local distribution companies (“LDC”), four in northeast and two in southeast inBrazil, which have had a concession agreement with each state government to provide natural gas distribution onan exclusive basis in each state for 30 to 50 years. Gaspart’s share in each LDC is from 23.0% to 24.5% in votingshare base. Each LDC begun operations between 1992 and 1994 and mainly distributes to general industry andnatural gas stations.
In Brazil, the gas industry and civilian gas use are still immature. Therefore, growth in demand is expectedin the future. Coherent effort into gas businesses from upstream to downstream, such as entry into gas fielddevelopment projects, liquefied natural gas (“LNG”) terminal projects, pipeline projects and electricitygeneration projects, is one of the main pillars of the infrastructure area, in which the Company intends to investwith emphasis. This acquisition is consistent with the companies’ core strategy.
The consolidated financial statements for the year ended March 31, 2007 include the operating results ofGaspart as a subsidiary from the closing date of the acquisition.
The purchase price was determined based on the expected future cash flows Gaspart will generate.
The following table summarizes the estimated fair values of the assets acquired and liabilities assumed atthe date of acquisition:
Millions of Yen
Current assets . . . . . . . . . . . . . . . . . . . . . . . . . . . . . . . . . . . . . . . . . . . . . . . . . . . . . . . . . . . . . . . . . . . ¥ 1,983Investments and other assets . . . . . . . . . . . . . . . . . . . . . . . . . . . . . . . . . . . . . . . . . . . . . . . . . . . . . . . 19,638
Total assets acquired . . . . . . . . . . . . . . . . . . . . . . . . . . . . . . . . . . . . . . . . . . . . . . . . . . . . . . . . . 21,621
Current liabilities . . . . . . . . . . . . . . . . . . . . . . . . . . . . . . . . . . . . . . . . . . . . . . . . . . . . . . . . . . . . . . . . (500)Long-term liabilities . . . . . . . . . . . . . . . . . . . . . . . . . . . . . . . . . . . . . . . . . . . . . . . . . . . . . . . . . . . . . . (2,473)
Total liabilities assumed . . . . . . . . . . . . . . . . . . . . . . . . . . . . . . . . . . . . . . . . . . . . . . . . . . . . . . . (2,973)
Net assets acquired . . . . . . . . . . . . . . . . . . . . . . . . . . . . . . . . . . . . . . . . . . . . . . . . . . . . . . . . . . . ¥18,648
Pro forma results of operations for the above business combination have not been presented because theeffects were not material to the consolidated financial statements.
Salt Asia Holding Pty. Ltd.
On May 31, 2006, the Company entered into an agreement with Akzo Nobel Chemicals International BV(“Akzo Nobel”) to purchase Akzo Nobel’s investment in Salt Asia Holding Pty, Ltd. (“Salt Asia,” a 94.2%owned subsidiary of Akzo Nobel). After satisfying the closing conditions, the Company completed theacquisition process on July 31, 2006. The total amount paid for the acquisition was approximately ¥8,044 million(A$ 91 million). Salt Asia is the holding company which has 92.7% ownership of voting shares of Onslow SaltPty, Ltd. (“Onslow”), which operates a solar marine salt field in western Australia. Onslow started delivery inMay 2001 and supplies solar marine salt to the chlor-alkali industry.
The biggest application for salt from Onslow is as a raw material in the chlor-alkali industry. With rapidlyrising demand from China putting pressure on supply—demand balance, the Company intends to supply salt foruse by this industry in Asian countries including Japan. In February, 2005, the Company also acquired the parentof Shark Bay Salt Joint Venture, operating Shark Bay solar marine salt field in western Australia. On completion
F-25

Notes to Consolidated Financial Statements—(Continued)
Mitsui & Co., Ltd. and subsidiaries
of the Onslow acquisition, the Company will therefore have management control of a total annual salt productioncapacity of 3.8 million tons. The Company intends to take an efficient, unified management approach to the twosalt fields, strengthening its position as a stable, comprehensive supplier of salt to the chlor-alkali industry andfood manufacturing industry and actively developing its salt business operations.
The purchase price was determined based on the expected future cash flows Salt Asia will generate. Theconsolidated financial statements include the operating results of Salt Asia as a subsidiary from the date ofacquisition.
In connection with this acquisition, ¥1,143 million was assigned to goodwill. The goodwill isnon-deductible for tax purposes and has been assigned to the Chemical Segment.
The following table summarizes the estimated fair values of the assets acquired and liabilities assumed atthe date of acquisition:
Millions of Yen
Current assets . . . . . . . . . . . . . . . . . . . . . . . . . . . . . . . . . . . . . . . . . . . . . . . . . . . . . . . . . . . . . . . . . . . ¥ 3,183Property and equipment . . . . . . . . . . . . . . . . . . . . . . . . . . . . . . . . . . . . . . . . . . . . . . . . . . . . . . . . . . . 10,519Intangible assets . . . . . . . . . . . . . . . . . . . . . . . . . . . . . . . . . . . . . . . . . . . . . . . . . . . . . . . . . . . . . . . . . 1,143Investments and other assets . . . . . . . . . . . . . . . . . . . . . . . . . . . . . . . . . . . . . . . . . . . . . . . . . . . . . . . 654
Total assets acquired . . . . . . . . . . . . . . . . . . . . . . . . . . . . . . . . . . . . . . . . . . . . . . . . . . . . . . . . . 15,499
Current liabilities . . . . . . . . . . . . . . . . . . . . . . . . . . . . . . . . . . . . . . . . . . . . . . . . . . . . . . . . . . . . . . . . (655)Long-term liabilities . . . . . . . . . . . . . . . . . . . . . . . . . . . . . . . . . . . . . . . . . . . . . . . . . . . . . . . . . . . . . . (6,001)Minority interest . . . . . . . . . . . . . . . . . . . . . . . . . . . . . . . . . . . . . . . . . . . . . . . . . . . . . . . . . . . . . . . . . (799)
Total liabilities assumed and minority interest . . . . . . . . . . . . . . . . . . . . . . . . . . . . . . . . . . . . . (7,455)
Net assets acquired . . . . . . . . . . . . . . . . . . . . . . . . . . . . . . . . . . . . . . . . . . . . . . . . . . . . . . . . . . . ¥ 8,044
Pro forma results of operations for the above business combination have not been presented because theeffects were not material to the consolidated financial statements.
MRCE Dispolok GmbH (former Dispolok GmbH)
On September 29, 2006, the Company and Mitsui & Co. Europe Holdings Plc. (former Mitsui & Co. EuropePlc.), a wholly owned subsidiary of the Company, agreed with Siemens AG (“Siemens”) to purchase 100% of theownership interests of Siemens Dispolok GmbH (“Dispolok,” which was renamed Dispolok GmbH after theacquisition and later renamed to MRCE Dispolok GmbH in February 2008) for ¥15,630 million. The acquisitionwas completed on October 4, 2006, after obtaining the approvals of the German Federal Cartel Office. Dispolokengaged in the leasing of locomotives manufactured by Siemens and provided the maintenance services inEurope.
In Europe, the locomotive leasing market is growing rapidly under the influence of the railway liberalizationpolicy executed by the EU; and, to enter the market, the companies established Mitsui Rail Capital Europe B.V.in October 2004, and have been expanding the companies’ market share in stages. By acquiring Dispolok, thecompanies are able to expand the number of locomotive fleets owned, and complement the current portfolio oflocomotives leasing business in the functions, models and areas. The acquisition is expected to contribute to thecompanies’ business performance by maintaining the superiority as a leasing company which also providesmaintenance service for lessees. The companies positioned the infrastructure business as one of core businessfields and this acquisition is consistent with the companies’ strategy.
F-26

Notes to Consolidated Financial Statements—(Continued)
Mitsui & Co., Ltd. and subsidiaries
The consolidated financial statements for the year ended March 31, 2007 included the operating results ofDispolok from the date of acquisition.
The purchase price was determined based on the expected future cash flows Dispolok will generate. Theexcess of the purchase price over the fair value of net assets of Dispolok was recorded as goodwill. The primaryfactors that contributed to the determination of the purchase price that caused the recognition of goodwill includethe following: (1) the superiority of Dispolok’s economic scale and the facility to offer locomotives for rentalwith maintenance service, (2) the expansion of the companies’ market share, and (3) the synergies that might beachieved from regional complementation of the companies’ present locomotives and Dispolok’s ones.
In connection with this acquisition, ¥5,041 million, ¥270 million and ¥8,232 million were assigned tointangible assets subject to amortization, intangible assets not subject to amortization, and goodwill, respectively.The intangible assets subject to amortization consist primarily of customer relationship of ¥4,966 million with anamortization period of 12 years. The goodwill is not deductible for tax purpose and has been assigned to theMachinery & Infrastructure Projects Segment.
The following table summarizes the estimated fair values of the assets acquired and liabilities assumed atthe date of acquisition:
Millions of Yen
Current assets . . . . . . . . . . . . . . . . . . . . . . . . . . . . . . . . . . . . . . . . . . . . . . . . . . . . . . . . . . . . . . . . . . . ¥ 4,266Property and equipment . . . . . . . . . . . . . . . . . . . . . . . . . . . . . . . . . . . . . . . . . . . . . . . . . . . . . . . . . . . 2,408Intangible assets . . . . . . . . . . . . . . . . . . . . . . . . . . . . . . . . . . . . . . . . . . . . . . . . . . . . . . . . . . . . . . . . . 13,556
Total assets acquired . . . . . . . . . . . . . . . . . . . . . . . . . . . . . . . . . . . . . . . . . . . . . . . . . . . . . . . . . 20,230
Current liabilities . . . . . . . . . . . . . . . . . . . . . . . . . . . . . . . . . . . . . . . . . . . . . . . . . . . . . . . . . . . . . . . . (4,600)
Total liabilities assumed . . . . . . . . . . . . . . . . . . . . . . . . . . . . . . . . . . . . . . . . . . . . . . . . . . . . . . . (4,600)
Net assets acquired . . . . . . . . . . . . . . . . . . . . . . . . . . . . . . . . . . . . . . . . . . . . . . . . . . . . . . . . . . . ¥15,630
Pro forma results of operations for the above business combination have not been presented because theeffects were not material to the consolidated financial statements.
SunWize Technologies, Inc.
On October 26, 2006, SunWize Technologies, Inc., owned 20% by the Company and 80% by Mitsui USA,agreed with SunWize Technologies, LLC (“SunWize”) to take over its solar power business by acquiringsubstantially all of the assets used in the business for ¥9,887 million (U.S. $84 million). After the regulatoryreview, the acquisition was completed on November 30, 2006. SunWize is a solar technology company whichspecializes in the design and manufacture of integrated solar power systems, the development of related projectsand product distribution for the systems. SunWize offers a wide range of photovoltaic power solutions, such as asupply of preassembled parts and custom-engineered systems and manufacturing of special solar modules forbattery-operated products. SunWize provides the goods and services to manufacturing, commercial, governmentand residential customers.
The market for solar power energy in the United States is expected to increase into the foreseeable future.By acquiring SunWize’s business, the companies, which had been selling solar electric modules to customersthrough SunWize, have established a vertically integrated business structure reaching from procurement of theproducts to distribution through SunWize’s dealer network. The companies believe that the acquisition will
F-27

Notes to Consolidated Financial Statements—(Continued)
Mitsui & Co., Ltd. and subsidiaries
contribute to the companies’ performance in this developing market. This acquisition, with an established clientbase throughout the United States, is consistent with the companies’ core strategy of making strategicinvestments in consumer businesses.
The consolidated financial statements for the year ended March 31, 2007 include the operating results ofSunWize from the date of acquisition.
The purchase price was determined based on the expected future cash flows SunWize will generate. Theexcess of the purchase price over the fair value of net assets acquired was recorded as goodwill. The significantfactors that contributed to the determination of the purchase price that resulted in the recognition of goodwill aremainly due to the synergies that might be achieved from cooperation with the companies, such as productprocurement.
In connection with this acquisition, ¥1,974 million and ¥6,249 million were assigned to intangible assetssubject to amortization and goodwill, respectively. The intangible assets subject to amortization consist primarilyof customer relationship of ¥1,621 million with an amortization period of 15 years. The goodwill is deductiblefor tax purpose and has been assigned to the Americas Segment.
The following table summarizes the estimated fair values of the assets acquired and liabilities assumed atthe date of acquisition:
Millions of Yen
Current assets . . . . . . . . . . . . . . . . . . . . . . . . . . . . . . . . . . . . . . . . . . . . . . . . . . . . . . . . . . . . . . . . . . . ¥ 2,453Property and equipment . . . . . . . . . . . . . . . . . . . . . . . . . . . . . . . . . . . . . . . . . . . . . . . . . . . . . . . . . . . 308Intangible assets . . . . . . . . . . . . . . . . . . . . . . . . . . . . . . . . . . . . . . . . . . . . . . . . . . . . . . . . . . . . . . . . . 8,223
Total assets acquired . . . . . . . . . . . . . . . . . . . . . . . . . . . . . . . . . . . . . . . . . . . . . . . . . . . . . . . . . 10,984
Current liabilities . . . . . . . . . . . . . . . . . . . . . . . . . . . . . . . . . . . . . . . . . . . . . . . . . . . . . . . . . . . . . . . . (1,097)
Total liabilities assumed . . . . . . . . . . . . . . . . . . . . . . . . . . . . . . . . . . . . . . . . . . . . . . . . . . . . . . . (1,097)
Net assets acquired . . . . . . . . . . . . . . . . . . . . . . . . . . . . . . . . . . . . . . . . . . . . . . . . . . . . . . . . . . . ¥ 9,887
Pro forma results of operations for the above business combination have not been presented because theeffects were not material to the consolidated financial statements.
Mitsui Oil & Exploration Co., Ltd.
The Company acquired an additional 3.0% interest in Mitsui Oil & Exploration Co., Ltd. (“MOECO”) for¥6,240 million from Mitsui Engineering & Shipping Co., Ltd. (an unrelated party) on March 28, 2007. Thecarrying value of the Company’s equity investment in MOECO immediately before the acquisition was¥107,892 million. As a result of the Company increasing its ownership of voting shares of MOECO to 50.3%,MOECO became a subsidiary of the Company.
MOECO is actively engaged in several oil and natural gas exploration, development and production projectsin Thailand and its neighboring Southeast Asian countries as well as the Middle East. At the end of March 2007,MOECO’s share of daily production amounts to an equivalent of approximately 93,000 barrels of oil. TheCompany positions its energy business as a significant strategic business sector and continues to strengthen itsrevenue base by acquiring new oil and natural gas assets and replacing its reserves. The Company’s acquisitionof the MOECO shares is part of the Company’s corporate strategy, which enables the companies to position
F-28

Notes to Consolidated Financial Statements—(Continued)
Mitsui & Co., Ltd. and subsidiaries
MOECO as one of the core units of its energy upstream business, and to sustain its competitiveness under thecurrent fierce global competition for acquiring oil and gas upstream assets. A closer relationship with MOECOallows the Company to obtain wider variety of options for expanding its upstream business by adding theSoutheast Asia region to its current portfolio of the upstream assets in addition to Middle East, Sakhalin andOceania areas, as well as strengthening companies’ oil and gas exploration activities. This acquisition ofMOECO is consistent with the companies’ core strategy.
The purchase price was determined based on the net assets of MOECO. The consolidated financialstatements for the year ended March 31, 2007 include the operating results of MOECO as a subsidiary from thedate of acquisition.
The following table summarizes the estimated fair values of the assets acquired and liabilities assumed atthe date of acquisition:
Millions of Yen
Current assets . . . . . . . . . . . . . . . . . . . . . . . . . . . . . . . . . . . . . . . . . . . . . . . . . . . . . . . . . . . . . . . . . . . ¥ 72,677Property and equipment . . . . . . . . . . . . . . . . . . . . . . . . . . . . . . . . . . . . . . . . . . . . . . . . . . . . . . . . . . . 50,132Intangible assets . . . . . . . . . . . . . . . . . . . . . . . . . . . . . . . . . . . . . . . . . . . . . . . . . . . . . . . . . . . . . . . . . 2,587Investments and other assets . . . . . . . . . . . . . . . . . . . . . . . . . . . . . . . . . . . . . . . . . . . . . . . . . . . . . . . 250,302
Total assets acquired . . . . . . . . . . . . . . . . . . . . . . . . . . . . . . . . . . . . . . . . . . . . . . . . . . . . . . . . . 375,698
Current liabilities . . . . . . . . . . . . . . . . . . . . . . . . . . . . . . . . . . . . . . . . . . . . . . . . . . . . . . . . . . . . . . . . (53,397)Long-term liabilities . . . . . . . . . . . . . . . . . . . . . . . . . . . . . . . . . . . . . . . . . . . . . . . . . . . . . . . . . . . . . . (92,834)Minority interest . . . . . . . . . . . . . . . . . . . . . . . . . . . . . . . . . . . . . . . . . . . . . . . . . . . . . . . . . . . . . . . . . (115,335)
Total liabilities assumed and minority interest . . . . . . . . . . . . . . . . . . . . . . . . . . . . . . . . . . . . . (261,566)
Net assets acquired . . . . . . . . . . . . . . . . . . . . . . . . . . . . . . . . . . . . . . . . . . . . . . . . . . . . . . . . . . . ¥ 114,132
Pro forma results of operations for the above business combination have not been presented because theeffects were not material to the consolidated financial statements.
For the year ended March 31, 2006
The business combinations which were completed during the year ended March 31, 2006 were immaterial.
4. DISCONTINUED OPERATIONS
In accordance with SFAS No.144, the companies present the results of discontinued operations (includingoperations of a subsidiary that either has been disposed of or is classified as held for sale) as a separate line itemin the Statements of Consolidated Income under income (loss) from discontinued operations—net (after incometax effect). The figures of the Statements of Consolidated Income and the Statements of Consolidated CashFlows for the prior years related to the discontinued operations have been reclassified to conform to the currentyear presentation.
The carrying amounts of assets and liabilities of a disposal group classified as held for sale were immaterialfor the years ended March 31, 2008 and 2007.
F-29

Notes to Consolidated Financial Statements—(Continued)
Mitsui & Co., Ltd. and subsidiaries
Summarized selected financial information for the years ended March 31, 2008, 2007 and 2006 for thediscontinued operations reclassified during the year ended March 31, 2008 was as follows:
Millions of Yen
Sesa Goa
Oil and gasproducing interests
held by WandooPetroleum
Othersubsidiaries Total
Year ended March 31, 2008:Revenues . . . . . . . . . . . . . . . . . . . . . . . . . . . . . . . . . . . . . . . — ¥ 2,358 ¥ 4,407 ¥ 6,765
(Loss) income from discontinued operations beforeincome taxes . . . . . . . . . . . . . . . . . . . . . . . . . . . . . . . . . . ¥ (387) ¥ 1,421 ¥ 5,867 ¥ 6,901
Gain on disposal—net . . . . . . . . . . . . . . . . . . . . . . . . . . . . . 93,949 20,205 2,511 116,665Income tax expense . . . . . . . . . . . . . . . . . . . . . . . . . . . . . . . (38,355) (8,286) (2,172) (48,813)Minority interests in earnings of subsidiaries . . . . . . . . . . . — (3,769) — (3,769)
Income from discontinued operations—net . . . . . . . . . . . . ¥ 55,207 ¥ 9,571 ¥ 6,206 ¥ 70,984
Year ended March 31, 2007:Revenues . . . . . . . . . . . . . . . . . . . . . . . . . . . . . . . . . . . . . . . ¥ 57,104 ¥ 4,298 ¥ 25,742 ¥ 87,144
Income (loss) from discontinued operations before incometaxes . . . . . . . . . . . . . . . . . . . . . . . . . . . . . . . . . . . . . . . . . ¥ 25,279 ¥ 4,097 ¥ (6,998) ¥ 22,378
Loss on disposal—net . . . . . . . . . . . . . . . . . . . . . . . . . . . . . — — (1,401) (1,401)Income tax (expense) benefit . . . . . . . . . . . . . . . . . . . . . . . (15,728) (3,916) 5,920 (13,724)Minority interests in (earnings) losses of subsidiaries . . . . (8,186) (17) 55 (8,148)
Income (loss) from discontinued operations—net . . . . . . . ¥ 1,365 ¥ 164 ¥ (2,424) ¥ (895)
Year ended March 31, 2006:Revenues . . . . . . . . . . . . . . . . . . . . . . . . . . . . . . . . . . . . . . . ¥ 42,506 — ¥ 45,449 ¥ 87,955
Income (loss) from discontinued operations before incometaxes . . . . . . . . . . . . . . . . . . . . . . . . . . . . . . . . . . . . . . . . . ¥ 21,405 ¥ 2,030 ¥(13,714) ¥ 9,721
Income tax (expense) benefit . . . . . . . . . . . . . . . . . . . . . . . (7,067) (531) 6,659 (939)Minority interests in earnings of subsidiaries . . . . . . . . . . . (7,148) (448) (234) (7,830)
Income (loss) from discontinued operations—net . . . . . . . ¥ 7,190 ¥ 1,051 ¥ (7,289) ¥ 952
The primary discontinued operations for the year ended March 31, 2008 were as follows:
Sesa Goa
Sesa Goa Limited, a subsidiary reported in the Mineral & Metal Resources Segment, had been engaged inthe iron ore production business in India. In optimizing its business portfolio, the Company decided it best to sellthis business during the year ended March 31, 2008, and Earlyguard Limited, a wholly owned subsidiary of theCompany, sold all shares in Finsider International Company Limited, which owned 51% of the issued shares ofSesa Goa Limited.
Oil and gas producing interests held by Wandoo Petroleum
Wandoo Petroleum Pty Ltd. (“Wandoo”), a subsidiary partially reported in both the Energy and Asia PacificSegments, had been engaged in the oil and gas development and production business in Australia. After the
F-30

Notes to Consolidated Financial Statements—(Continued)
Mitsui & Co., Ltd. and subsidiaries
careful scrutiny of the current booming oil and gas prices and the production situation by the operator, theCompany decided it best to sell this business, and disposed of by sale all interests of producing assets of Wandooduring the year ended March 31, 2008.
Other subsidiaries
This category consists of some individually immaterial subsidiaries engaged in operations such as customhome sale, aircraft leasing, and lease related to Chinese trading business.
Summarized selected financial information for the years ended March 31, 2007 and 2006 for thediscontinued operations reclassified during the year ended March 31, 2007 was as follows:
Millions of Yen
Mitalco Inc.Other
subsidiaries Total
Year ended March 31, 2007:Revenues . . . . . . . . . . . . . . . . . . . . . . . . . . . . . . . . . . . . . . . . . . . . . . . . . . . . . — ¥ 15 ¥ 15
Income (loss) from discontinued operations before income taxes . . . . . . . . . . ¥ 5,337 ¥(260) ¥ 5,077(Loss) gain on disposal—net . . . . . . . . . . . . . . . . . . . . . . . . . . . . . . . . . . . . . . (77) 128 51Income tax (expense) benefit . . . . . . . . . . . . . . . . . . . . . . . . . . . . . . . . . . . . . . (2,188) 331 (1,857)
Income from discontinued operations—net . . . . . . . . . . . . . . . . . . . . . . . . . . . ¥ 3,072 ¥ 199 ¥ 3,271
Year ended March 31, 2006:Revenues . . . . . . . . . . . . . . . . . . . . . . . . . . . . . . . . . . . . . . . . . . . . . . . . . . . . . — ¥ 7 ¥ 7
Loss from discontinued operations before income taxes . . . . . . . . . . . . . . . . . ¥(24,774) ¥(369) ¥(25,143)Income tax benefit . . . . . . . . . . . . . . . . . . . . . . . . . . . . . . . . . . . . . . . . . . . . . . 10,293 9 10,302
Loss from discontinued operations—net . . . . . . . . . . . . . . . . . . . . . . . . . . . . . ¥(14,481) ¥(360) ¥(14,841)
The primary discontinued operations for the year ended March 31, 2007 were as follows:
Mitalco Inc.
Mitalco Inc., a subsidiary partially reported in both the Mineral & Metal Resources and Americas Segments,held a 32% stake in two aluminum smelting facilities in the United States and had mainly been engaged inmanufacture and sale of aluminium. Because of the declining profitability resulting from deterioration in theterms of the power purchase contract during the course of renewal negotiations, the companies disposed of bysale all stakes of both facilities during the year ended March 31, 2007.
Other subsidiaries
This category consists of some individually immaterial subsidiaries engaged in operations such asmanufacture of zinc-plate and supply chain management.
F-31

Notes to Consolidated Financial Statements—(Continued)
Mitsui & Co., Ltd. and subsidiaries
Summarized selected financial information for the years ended March 31, 2006 for the discontinuedoperations reclassified during the year ended March 31, 2006 was as follows:
Millions of Yen
ArcadiaPetroleum
Othersubsidiaries Total
Year ended March 31, 2006:Revenues . . . . . . . . . . . . . . . . . . . . . . . . . . . . . . . . . . . . . . . . . . . . . . . . . . . . . . . ¥1,013 ¥10,509 ¥11,522
(Loss) income from discontinued operations before income taxes . . . . . . . . . . . ¥ (39) ¥ 498 ¥ 459Gain on disposal—net . . . . . . . . . . . . . . . . . . . . . . . . . . . . . . . . . . . . . . . . . . . . . 46 587 633Income tax (expense) benefit . . . . . . . . . . . . . . . . . . . . . . . . . . . . . . . . . . . . . . . . (22) 161 139
(Loss) income from discontinued operations—net . . . . . . . . . . . . . . . . . . . . . . . ¥ (15) ¥ 1,246 ¥ 1,231
The primary discontinued operations for the year ended March 31, 2006 were as follows:
Arcadia Petroleum
Arcadia Petroleum, a subsidiary partially reported in both the Energy and Europe, the Middle East andAfrica Segments, had been engaged in the physical and future trading of crude oil in the United Kingdom. Due toits expanding activity under booming oil prices, the Company had been exposed to increasing risks such asmarket risk and required more management resources. As a result of the overall review of Arcadia Petroleum’sbusiness model and the Company’s management resource optimization, the Company disposed of by sale allshares of Arcadia Petroleum during the year ended March 31, 2006.
Other subsidiaries
This category consists of some individually immaterial subsidiaries engaged in operations such asmanagement of a membership golf club, general construction and construction and lease of assembly houses, andmanufacture and sale of Ethylene-Dichloride.
5. MARKETABLE SECURITIES AND OTHER INVESTMENTS
Debt and marketable equity securities
At March 31, 2008 and 2007, the fair value and gross unrealized holding gains and losses onavailable-for-sale securities and the amortized cost, fair value and gross unrealized holding gains and losses onheld-to-maturity debt securities were as follows:
Millions of Yen
Unrealized holding gains (losses)
Fair value Gains Losses Net
March 31, 2008:Available-for-sale:
Marketable equity securities . . . . . . . . . . . . . . . . . . . . . . . . . . ¥652,001 ¥283,787 ¥(19,528) ¥264,259Debt securities, consisting principally of preferred stock that
must be redeemed and convertible debt . . . . . . . . . . . . . . . . 58,111 20 (42) (22)
March 31, 2007:Available-for-sale:
Marketable equity securities . . . . . . . . . . . . . . . . . . . . . . . . . . ¥861,463 ¥466,105 ¥ (600) ¥465,505Debt securities, consisting principally of preferred stock that
must be redeemed and Japanese government bonds . . . . . . 51,176 85 (5) 80
F-32

Notes to Consolidated Financial Statements—(Continued)
Mitsui & Co., Ltd. and subsidiaries
Millions of Yen
Unrealized holding gains (losses)
Amortized Cost Fair value Gains Losses Net
March 31, 2008:Held-to-maturity debt securities, consisting principally
of preferred stock that must be redeemed . . . . . . . . . . ¥2,689 ¥2,689 ¥ 0 — ¥ 0
March 31, 2007:Held-to-maturity debt securities, consisting principally
of preferred stock that must be redeemed . . . . . . . . . . ¥9,307 ¥9,307 ¥ 0 — ¥ 0
The carrying amounts of available-for-sale securities, with original maturities of three months or less, andincluded in cash and cash equivalents in the Consolidated Balance Sheets were ¥2,017 million and¥22,936 million at March 31, 2008 and 2007, respectively.
At March 31, 2008 and 2007, the fair value and gross unrealized holding losses on available-for-salesecurities and held-to-maturity debt securities, aggregated by investment category and length of time thatindividual securities have been in continuous unrealized loss positions, were as follows:
Millions of Yen
Less than 12 months 12 months or more
Fair valueUnrealized
holding losses Fair valueUnrealized
holding losses
March 31, 2008:Available-for-sale:
Marketable equity securities . . . . . . . . . . . . . . . . . . . . . . . . . ¥105,851 ¥(19,528) — —Debt securities, consisting principally of preferred stockthat must be redeemed and convertible debt . . . . . . . . . . . . . 2,789 (42) — —
Held-to-maturity debt securities, consisting principally ofpreferred stock that must be redeemed . . . . . . . . . . . . . . . . . . . — — — —
Total . . . . . . . . . . . . . . . . . . . . . . . . . . . . . . . . . . . . . . . . ¥108,640 ¥(19,570) — —
March 31, 2007:Available-for-sale:
Marketable equity securities . . . . . . . . . . . . . . . . . . . . . . . . . ¥ 12,934 ¥ (600) — —Debt securities, consisting principally of preferred stockthat must be redeemed and Japanese government bonds . . . 4,025 (5) — —
Held-to-maturity debt securities, consisting principally ofpreferred stock that must be redeemed . . . . . . . . . . . . . . . . . . . — — — —
Total . . . . . . . . . . . . . . . . . . . . . . . . . . . . . . . . . . . . . . . . ¥ 16,959 ¥ (605) — —
The companies’ investments in available-for-sale securities in an unrealized holding loss position consistedprimarily of marketable equity securities (approximately 95 issuers) of customers in various industries. Theunrealized losses on these securities were due principally to a temporary decline in the stock market. The severityof decline in fair value less than cost was 1% to 46% and the duration of the impairment was less than ninemonths. The companies evaluated the near-term prospects of the issuer in relation to the severity and duration ofimpairment. Based on that evaluation and the companies’ ability and intent to hold these investments for areasonable period of time sufficient for a forecasted recovery of fair value, the companies did not consider theseinvestments to be other-than-temporarily impaired at March 31, 2008.
F-33

Notes to Consolidated Financial Statements—(Continued)
Mitsui & Co., Ltd. and subsidiaries
For the years ended March 31, 2008, 2007 and 2006, losses of ¥28,100 million, ¥3,062 million and¥1,775 million, respectively, were recognized on write-downs of available-for-sale securities to reflect thedecline in market value considered to be other than temporary.
The portion of net trading gains and losses for the year that relates to trading securities still held atMarch 31, 2008, 2007 and 2006 were as follows:
Millions of Yen
2008 2007 2006
Net trading gains (losses) . . . . . . . . . . . . . . . . . . . . . . . . . . . . . . . . . . . . . . . . . . . . . ¥(18) ¥0 ¥0
The proceeds from sales of available-for-sale securities and the gross realized gains and losses on thosesales for the years ended March 31, 2008, 2007 and 2006 are shown below:
Millions of Yen
2008 2007 2006
Proceeds from sales . . . . . . . . . . . . . . . . . . . . . . . . . . . . . . . . . . . . . . . . . . . . . . . . . ¥42,914 ¥63,617 ¥36,741
Gross realized gains . . . . . . . . . . . . . . . . . . . . . . . . . . . . . . . . . . . . . . . . . . . . . . . . . ¥28,776 ¥26,328 ¥21,678Gross realized losses . . . . . . . . . . . . . . . . . . . . . . . . . . . . . . . . . . . . . . . . . . . . . . . . (276) (167) (94)
Net realized gains . . . . . . . . . . . . . . . . . . . . . . . . . . . . . . . . . . . . . . . . . . . . . . . ¥28,500 ¥26,161 ¥21,584
On September 1, 2005, in connection with foundation of Seven & I Holdings Co., Ltd., the companiesexchanged shares of Seven-Eleven Japan Co., Ltd. for those of Seven & I Holdings Co., Ltd. In accordance withEITF No. 91-5, “Nonmonetary Exchange of Cost-Method Investments,” a non-cash gain of ¥4,227 million wasrecorded for the year ended March 31, 2006, and is included in gain on sales of securities—net in the Statementsof Consolidated Income. On January 1, 2006, in connection with business combination of KDDI Corp. andPOWERDCOM Inc., the Company exchanged shares of POWERDCOM Inc. for those of KDDI Corp., as anacquiring company. In accordance with EITF No. 91-5, a non-cash gain of ¥3,292 million was recorded for theyear ended March 31, 2006, and is included in gain on sales of securities—net in the Statements of ConsolidatedIncome.
Debt securities classified as available-for-sale and held-to-maturity at March 31, 2008 mature as follows:
Millions of Yen
Available-for-sale Held-to-maturity
AmortizedCost
Aggregatefair value
AmortizedCost
Aggregatefair value
Contractual maturities:Within 1 year . . . . . . . . . . . . . . . . . . . . . . . . . . . . . . . . . . . . . . . ¥38,175 ¥38,163 ¥ 45 ¥ 45After 1 year through 5 years . . . . . . . . . . . . . . . . . . . . . . . . . . . 17,457 17,447 2,634 2,634After 5 years through 10 years . . . . . . . . . . . . . . . . . . . . . . . . . . 2,500 2,500 10 10After 10 years . . . . . . . . . . . . . . . . . . . . . . . . . . . . . . . . . . . . . . . 1 1 — —
Total . . . . . . . . . . . . . . . . . . . . . . . . . . . . . . . . . . . . . . . . . . ¥58,133 ¥58,111 ¥2,689 ¥2,689
The actual maturities may differ from the contractual maturities shown above because certain issuers mayhave the right to redeem debt securities before their maturity.
F-34

Notes to Consolidated Financial Statements—(Continued)
Mitsui & Co., Ltd. and subsidiaries
Investments other than debt and marketable equity securities
Investments other than investments in debt and marketable equity securities consisted primarily ofnon-marketable equity securities and non-current time deposits and amounted to ¥607,813 million and¥384,562 million at March 31, 2008 and 2007, respectively. The estimation of the corresponding fair values atthose dates was not practicable, as the fair value for all the individual non-marketable securities held by thecompanies was not readily determinable at each balance sheet date.
Investments in non-marketable equity securities are carried at cost; however, if the fair value of aninvestment has declined and such decline is judged to be other than temporary, the investment is written down toits estimated fair value. Losses on write-downs of these investment securities recognized to reflect the declines infair value considered to be other than temporary were ¥8,719 million, ¥8,642 million and ¥8,868 million for theyears ended March 31, 2008, 2007 and 2006, respectively.
The aggregate carrying amount of the companies’ non-marketable equity securities accounted for under thecost method totaled ¥557,596 million and ¥316,216 million at March 31, 2008 and 2007, respectively.Investments with an aggregate carrying amount of ¥521,055 million at March 31, 2008 and ¥281,332 million atMarch 31, 2007, were not evaluated for impairment because the companies did not identify any events orchanges in circumstances that may have had a significant adverse effect on the fair value of those investmentsand the companies determined that it is not practicable to estimate the fair value of those investments inaccordance with SFAS No. 107, “Disclosures about Fair Value of Financial Instruments.”
6. INVESTMENTS IN AND ADVANCES TO ASSOCIATED COMPANIES
Investments in associated companies (investees owned 20% to 50%, corporate joint ventures and otherinvestees over which the companies have the ability to exercise significant influence) are accounted for under theequity method. In addition, noncontrolling investments in general partnerships, limited partnerships and limitedliability companies are also accounted for under the equity method. Such investments include, but are not limitedto, the companies’ investments in Valepar S.A. (18.24%), Japan Australia LNG (MIMI) Pty. Ltd. (50.00%), SimsGroup Limited (16.00%), P.T. Paiton Energy (36.32%), IPM(UK) Power Holdings (25.00%), and PenskeAutomotive Group, Inc. (“PAG” former United Auto Group, Inc.) (16.32%).
The investment in Valepar S.A. is accounted for under the equity method because of the Company’s abilityto exercise significant influence over operating and financial policies primarily through the board representationand power of veto over significant operating and financial decisions through the board of directors. As the soleoperating company among the shareholders, which consist primarily of pension funds and financial institutions,the Company utilizes its experience and expertise in operating businesses and substantively participates in thedecision-making processes.
The investment in Sims Group Limited is accounted for under the equity method because the Companies isthe largest and sole shareholder to have board designation right and the top up right, which enable the Companiesto increase its share in the event of dilution so that the Companies is able to retain proportionate share after thedilutive event, and the Companies has ability to exercise significant influence over operating and financialpolicies primarily through the board representation and the membership in various advisory committees to theboard, such as the Finance and Investment Committee and the Nomination Committee.
The companies are the second largest shareholder group of PAG and entered into a shareholders agreementwith the largest shareholder group owning approximately 40% of its voting shares. Based on a reciprocal votingprovision set forth in the agreement for any shareholder election of the directors of PAG, the companies and the
F-35

Notes to Consolidated Financial Statements—(Continued)
Mitsui & Co., Ltd. and subsidiaries
largest shareholder group constitute a “group” within the meaning of Section 13(d) of the Securities ExchangeAct of 1934 and jointly participate in the management of PAG. The investment in PAG is accounted for underthe equity method because of the companies’ ability to exercise significant influence over operating and financialpolicies primarily through board representation by a director and executive vice president dispatched from thecompanies. PAG is utilizing the companies’ global network to develop its business activities outside the UnitedStates and, as part of the process, the companies substantively participate in the decision-making processes.
Associated companies are engaged primarily in the development of natural resources, power generationbusinesses outside Japan and the distribution of various products. The major geographic areas of such entities arethe Americas, Europe, Asia and Oceania.
Investments in and advances to associated companies at March 31, 2008 and 2007 consisted of thefollowing:
Millions of Yen
2008 2007
Investments in capital stock . . . . . . . . . . . . . . . . . . . . . . . . . . . . . . . . . . . . . . . . . . . . . . ¥1,195,271 ¥1,457,519Advances . . . . . . . . . . . . . . . . . . . . . . . . . . . . . . . . . . . . . . . . . . . . . . . . . . . . . . . . . . . . . 137,771 130,052
Total . . . . . . . . . . . . . . . . . . . . . . . . . . . . . . . . . . . . . . . . . . . . . . . . . . . . . . . . . . . . ¥1,333,042 ¥1,587,571
The carrying value of the investments in associated companies exceeded the companies’ equity in theunderlying net assets of such associated companies by ¥221,187 million and ¥189,397 million at March 31, 2008and 2007, respectively. The excess is attributed first to certain fair value adjustments on a net-of-tax basis at thetime of the initial and subsequent investments in those companies with the remaining portion considered asequity method goodwill. The fair value adjustments are generally attributed to property and equipment whichconsist primarily of mineral rights amortized over their respective estimated useful lives, principally 8 to 42years, using either the straight-line or the unit-of-production method.
Investments in common stock of publicly traded associated companies include marketable equity securitiescarried at ¥170,212 million and ¥166,437 million at March 31, 2008 and 2007, respectively. Correspondingaggregate quoted market values were ¥187,164 million and ¥240,035 million, respectively.
Summarized financial information for associated companies at March 31, 2008 and 2007 and for the yearsended March 31, 2008, 2007 and 2006 were as follows:
Millions of Yen
2008 2007
Current assets . . . . . . . . . . . . . . . . . . . . . . . . . . . . . . . . . . . . . . . . . . . . . . . . . . . . . . . ¥ 5,282,249 ¥ 5,501,992Property and equipment—net of accumulated depreciation . . . . . . . . . . . . . . . . . . . . 9,016,080 9,511,669Other assets . . . . . . . . . . . . . . . . . . . . . . . . . . . . . . . . . . . . . . . . . . . . . . . . . . . . . . . . . 2,822,361 2,982,977
Total assets . . . . . . . . . . . . . . . . . . . . . . . . . . . . . . . . . . . . . . . . . . . . . . . . . . . . . ¥17,120,690 ¥17,996,638
Current liabilities . . . . . . . . . . . . . . . . . . . . . . . . . . . . . . . . . . . . . . . . . . . . . . . . . . . . . ¥ 4,142,275 ¥ 3,933,269Long-term liabilities . . . . . . . . . . . . . . . . . . . . . . . . . . . . . . . . . . . . . . . . . . . . . . . . . . 6,423,631 7,079,276Minority interests . . . . . . . . . . . . . . . . . . . . . . . . . . . . . . . . . . . . . . . . . . . . . . . . . . . . 2,557,145 2,033,986Shareholders’ equity . . . . . . . . . . . . . . . . . . . . . . . . . . . . . . . . . . . . . . . . . . . . . . . . . . 3,997,639 4,950,107
Total liabilities and shareholders’ equity . . . . . . . . . . . . . . . . . . . . . . . . . . . . . . ¥17,120,690 ¥17,996,638
The companies’ equity in the net assets of associated companies . . . . . . . . . . . . . . . ¥ 974,084 ¥ 1,268,122
F-36

Notes to Consolidated Financial Statements—(Continued)
Mitsui & Co., Ltd. and subsidiaries
Millions of Yen
2008 2007 2006
Revenues . . . . . . . . . . . . . . . . . . . . . . . . . . . . . . . . . . . . . . . . . . . . . . . . . ¥13,127,701 ¥9,332,451 ¥7,240,519Gross profit . . . . . . . . . . . . . . . . . . . . . . . . . . . . . . . . . . . . . . . . . . . . . . . 3,758,668 2,856,639 2,037,245Net income . . . . . . . . . . . . . . . . . . . . . . . . . . . . . . . . . . . . . . . . . . . . . . . 1,065,978 958,522 585,579
The companies’ revenues and purchases from associated companies included in cost of revenues during theyears ended March 31, 2008, 2007 and 2006 were as follows:
Millions of Yen
2008 2007 2006
Revenues . . . . . . . . . . . . . . . . . . . . . . . . . . . . . . . . . . . . . . . . . . . . . . . . . . ¥ 77,936 ¥ 108,706 ¥ 89,107Purchases . . . . . . . . . . . . . . . . . . . . . . . . . . . . . . . . . . . . . . . . . . . . . . . . . . 323,664 279,215 237,631
Dividends received from associated companies for the years ended March 31, 2008, 2007 and 2006amounted to ¥99,252 million, ¥110,072 million and ¥63,597 million, respectively.
Consolidated unappropriated retained earnings at March 31, 2008 and 2007 included the companies’ equityin net undistributed earnings of associated companies in the amount of ¥351,023 million and ¥282,756 million,respectively.
7. ALLOWANCE FOR DOUBTFUL RECEIVABLES
An analysis of the change in the allowance for doubtful receivables is as follows:
Millions of Yen
Current Non-current Total
Year ended March 31, 2008:Balance at beginning of year . . . . . . . . . . . . . . . . . . . . . . . . . . . . . . . . . . . . . . ¥ 29,824 ¥ 69,775 ¥ 99,599Credits charged off . . . . . . . . . . . . . . . . . . . . . . . . . . . . . . . . . . . . . . . . . . . . . . (10,676) (13,010) (23,686)Provision for doubtful receivables . . . . . . . . . . . . . . . . . . . . . . . . . . . . . . . . . . 4,041 4,032 8,073Others . . . . . . . . . . . . . . . . . . . . . . . . . . . . . . . . . . . . . . . . . . . . . . . . . . . . . . . . 100 (1,840) (1,740)
Balance at end of year . . . . . . . . . . . . . . . . . . . . . . . . . . . . . . . . . . . . . . . . . . . . ¥ 23,289 ¥ 58,957 ¥ 82,246
Year ended March 31, 2007:Balance at beginning of year . . . . . . . . . . . . . . . . . . . . . . . . . . . . . . . . . . . . . . ¥ 26,703 ¥ 84,513 ¥111,216Credits charged off . . . . . . . . . . . . . . . . . . . . . . . . . . . . . . . . . . . . . . . . . . . . . . (5,550) (19,546) (25,096)Provision for doubtful receivables . . . . . . . . . . . . . . . . . . . . . . . . . . . . . . . . . . 7,879 3,994 11,873Others . . . . . . . . . . . . . . . . . . . . . . . . . . . . . . . . . . . . . . . . . . . . . . . . . . . . . . . . 792 814 1,606
Balance at end of year . . . . . . . . . . . . . . . . . . . . . . . . . . . . . . . . . . . . . . . . . . . . ¥ 29,824 ¥ 69,775 ¥ 99,599
Year ended March 31, 2006:Balance at beginning of year . . . . . . . . . . . . . . . . . . . . . . . . . . . . . . . . . . . . . . ¥ 22,519 ¥100,066 ¥122,585Credits charged off . . . . . . . . . . . . . . . . . . . . . . . . . . . . . . . . . . . . . . . . . . . . . . (369) (25,045) (25,414)Provision for doubtful receivables . . . . . . . . . . . . . . . . . . . . . . . . . . . . . . . . . . 1,915 (3,672) (1,757)Others . . . . . . . . . . . . . . . . . . . . . . . . . . . . . . . . . . . . . . . . . . . . . . . . . . . . . . . . 2,638 13,164 15,802
Balance at end of year . . . . . . . . . . . . . . . . . . . . . . . . . . . . . . . . . . . . . . . . . . . . ¥ 26,703 ¥ 84,513 ¥111,216
Note: “Others” principally includes the effect of consolidation of certain subsidiaries, reclassification todiscontinued operations and the effect of changes in foreign exchange rates.
F-37

Notes to Consolidated Financial Statements—(Continued)
Mitsui & Co., Ltd. and subsidiaries
The recorded investment in impaired loans, as defined in SFAS No. 114 and amended by SFAS No. 118,and the allowance for doubtful receivables related to such loans at March 31, 2008 and 2007 were as follows:
Millions of Yen
2008 2007
Impairedloans
Allowance fordoubtful
receivablesImpaired
loans
Allowance fordoubtful
receivables
Impaired loans with an allowance for doubtful receivables . . . . . . ¥100,290 ¥55,197 ¥ 91,967 ¥72,382Impaired loans without an allowance for doubtful receivables . . . 9,291 — 9,689 —
Total . . . . . . . . . . . . . . . . . . . . . . . . . . . . . . . . . . . . . . . . . . . . ¥109,581 ¥55,197 ¥101,656 ¥72,382
The average investment in impaired loans and interest income on impaired loans for the years endedMarch 31, 2008, 2007 and 2006 were as follows:
Millions of Yen
2008 2007 2006
Average investment in impaired loans . . . . . . . . . . . . . . . . . . . . . . . . . . . . . . . . ¥105,619 ¥108,761 ¥125,795Interest income recognized on impaired loans . . . . . . . . . . . . . . . . . . . . . . . . . . 1,040 1,255 1,475
Interest income on impaired loans has been recognized mainly using the cash-basis method of accountingduring the period that the loans were impaired.
8. LEASES
Lessor
The companies lease real estate, rolling stock, ocean transport vessels, aircraft, equipment and others.
Certain leases of aircraft, rolling stock, ocean transport vessels and equipment and others are classified asdirect financing leases or leveraged leases, and the net investments are included as part of trade receivables—accounts and non-current receivables, less unearned interest in the accompanying Consolidated Balance Sheets.The companies have no general obligation for principal and interest on notes and other instruments related tothird-party participation in leveraged leases. Such notes and other instruments have not been included inliabilities but have been offset against the related lease receivables. The residual values represent the estimate ofthe values of the leased assets at the end of the lease contracts and are initially recorded based on appraisals andestimates. Realization of the residual values is dependent on the companies’ future ability to sell the relatedassets under then prevailing market conditions.
Other leases are classified as operating leases and the related assets are presented as property leased toothers—at cost, less accumulated depreciation in the accompanying Consolidated Balance Sheets.
The following comprise the components of the net investment in direct financing leases as of March 31,2008 and 2007:
Millions of Yen
2008 2007
Total minimum lease payments to be received . . . . . . . . . . . . . . . . . . . . . . . . . . . . . . . . . . . ¥116,864 ¥140,152Estimated unguaranteed residual value of leased assets . . . . . . . . . . . . . . . . . . . . . . . . . . . . 12,744 16,840Less unearned income . . . . . . . . . . . . . . . . . . . . . . . . . . . . . . . . . . . . . . . . . . . . . . . . . . . . . . (47,357) (59,316)
Net investment in direct financing leases . . . . . . . . . . . . . . . . . . . . . . . . . . . . . . . . . . . ¥ 82,251 ¥ 97,676
F-38

Notes to Consolidated Financial Statements—(Continued)
Mitsui & Co., Ltd. and subsidiaries
The following is a schedule by years of future minimum lease payments to be received from direct financingleases as of March 31, 2008:
Millions of Yen
Year ending March 31:2009 . . . . . . . . . . . . . . . . . . . . . . . . . . . . . . . . . . . . . . . . . . . . . . . . . . . . . . . . . . . . . . . . . . . . . . . . . . ¥ 13,6682010 . . . . . . . . . . . . . . . . . . . . . . . . . . . . . . . . . . . . . . . . . . . . . . . . . . . . . . . . . . . . . . . . . . . . . . . . . . 13,0412011 . . . . . . . . . . . . . . . . . . . . . . . . . . . . . . . . . . . . . . . . . . . . . . . . . . . . . . . . . . . . . . . . . . . . . . . . . . 12,9012012 . . . . . . . . . . . . . . . . . . . . . . . . . . . . . . . . . . . . . . . . . . . . . . . . . . . . . . . . . . . . . . . . . . . . . . . . . . 12,2272013 . . . . . . . . . . . . . . . . . . . . . . . . . . . . . . . . . . . . . . . . . . . . . . . . . . . . . . . . . . . . . . . . . . . . . . . . . . 12,783Thereafter . . . . . . . . . . . . . . . . . . . . . . . . . . . . . . . . . . . . . . . . . . . . . . . . . . . . . . . . . . . . . . . . . . . . . . 52,244
Total . . . . . . . . . . . . . . . . . . . . . . . . . . . . . . . . . . . . . . . . . . . . . . . . . . . . . . . . . . . . . . . . . . . . . . ¥116,864
The following represents the components of the net investment in leveraged leases as of March 31, 2008 and2007:
Millions of Yen
2008 2007
Total minimum lease payments to be received (net of principal and interest on third-partynonrecourse debt) . . . . . . . . . . . . . . . . . . . . . . . . . . . . . . . . . . . . . . . . . . . . . . . . . . . . . . . . . . ¥ 3,990 ¥ 4,703
Estimated unguaranteed residual value of leased assets . . . . . . . . . . . . . . . . . . . . . . . . . . . . . . . 4,728 5,571Less unearned income . . . . . . . . . . . . . . . . . . . . . . . . . . . . . . . . . . . . . . . . . . . . . . . . . . . . . . . . (2,076) (2,479)
Investment in leveraged leases . . . . . . . . . . . . . . . . . . . . . . . . . . . . . . . . . . . . . . . . . . . . . . . . . . 6,642 7,795Less deferred tax liabilities arising from leveraged leases . . . . . . . . . . . . . . . . . . . . . . . . . . . . . (6,979) (7,869)
Net investment in leveraged leases . . . . . . . . . . . . . . . . . . . . . . . . . . . . . . . . . . . . . . . . . . . ¥ (337) ¥ (74)
The following provides an analysis of the companies’ investment in property leased to others on operatingleases by classes as of March 31, 2008 and 2007:
Millions of Yen
2008 2007
CostAccumulateddepreciation Net Cost
Accumulateddepreciation Net
Real estate . . . . . . . . . . . . . . . . . . . . . . ¥152,437 ¥(65,140) ¥ 87,297 ¥200,699 ¥(65,422) ¥135,277Rolling stock . . . . . . . . . . . . . . . . . . . . 53,473 (3,375) 50,098 62,794 (3,016) 59,778Ocean transport vessels . . . . . . . . . . . . 40,806 (8,080) 32,726 47,665 (9,133) 38,532Aircraft . . . . . . . . . . . . . . . . . . . . . . . . — — — 6,947 (169) 6,778Equipment and others . . . . . . . . . . . . . 24,917 (10,591) 14,326 32,084 (13,209) 18,875
Total . . . . . . . . . . . . . . . . . . . . . . ¥271,633 ¥(87,186) ¥184,447 ¥350,189 ¥(90,949) ¥259,240
F-39

Notes to Consolidated Financial Statements—(Continued)
Mitsui & Co., Ltd. and subsidiaries
The following is a schedule by years of minimum future rentals on noncancelable operating leases as ofMarch 31, 2008:
Millions of Yen
Year ending March 31:2009 . . . . . . . . . . . . . . . . . . . . . . . . . . . . . . . . . . . . . . . . . . . . . . . . . . . . . . . . . . . . . . . . . . . . . . . . . . ¥11,3102010 . . . . . . . . . . . . . . . . . . . . . . . . . . . . . . . . . . . . . . . . . . . . . . . . . . . . . . . . . . . . . . . . . . . . . . . . . . 7,9822011 . . . . . . . . . . . . . . . . . . . . . . . . . . . . . . . . . . . . . . . . . . . . . . . . . . . . . . . . . . . . . . . . . . . . . . . . . . 5,8482012 . . . . . . . . . . . . . . . . . . . . . . . . . . . . . . . . . . . . . . . . . . . . . . . . . . . . . . . . . . . . . . . . . . . . . . . . . . 4,3952013 . . . . . . . . . . . . . . . . . . . . . . . . . . . . . . . . . . . . . . . . . . . . . . . . . . . . . . . . . . . . . . . . . . . . . . . . . . 3,903Thereafter . . . . . . . . . . . . . . . . . . . . . . . . . . . . . . . . . . . . . . . . . . . . . . . . . . . . . . . . . . . . . . . . . . . . . . 14,445
Total . . . . . . . . . . . . . . . . . . . . . . . . . . . . . . . . . . . . . . . . . . . . . . . . . . . . . . . . . . . . . . . . . . . . . . ¥47,883
Lessee
The companies lease equipment, real estate and others under capital leases. At March 31, 2008,approximately 50% of the capital leases are with the Company’s associated company, Mitsui Leasing &Development, Ltd.
The following provides an analysis of the companies’ leased assets recorded under capital leases by class asof March 31, 2008 and 2007:
Millions of Yen
2008 2007
CostAccumulateddepreciation Net Cost
Accumulateddepreciation Net
Equipment . . . . . . . . . . . . . . . . . . . . . . . . . . ¥25,742 ¥(11,438) ¥14,304 ¥23,468 ¥(12,522) ¥10,946Real estate . . . . . . . . . . . . . . . . . . . . . . . . . . 12,651 (2,532) 10,119 8,735 (1,111) 7,624Others . . . . . . . . . . . . . . . . . . . . . . . . . . . . . 2,643 (1,565) 1,078 3,413 (1,933) 1,480
Total . . . . . . . . . . . . . . . . . . . . . . . . . . ¥41,036 ¥(15,535) ¥25,501 ¥35,616 ¥(15,566) ¥20,050
The following is a schedule by years of future minimum lease payments under capital leases together withcomponents of the present value of the net minimum lease payments as of March 31, 2008:
Millions of Yen
Year ending March 31:2009 . . . . . . . . . . . . . . . . . . . . . . . . . . . . . . . . . . . . . . . . . . . . . . . . . . . . . . . . . . . . . . . . . . . . . . . . . . ¥ 7,0342010 . . . . . . . . . . . . . . . . . . . . . . . . . . . . . . . . . . . . . . . . . . . . . . . . . . . . . . . . . . . . . . . . . . . . . . . . . . 8,1362011 . . . . . . . . . . . . . . . . . . . . . . . . . . . . . . . . . . . . . . . . . . . . . . . . . . . . . . . . . . . . . . . . . . . . . . . . . . 5,4282012 . . . . . . . . . . . . . . . . . . . . . . . . . . . . . . . . . . . . . . . . . . . . . . . . . . . . . . . . . . . . . . . . . . . . . . . . . . 4,9582013 . . . . . . . . . . . . . . . . . . . . . . . . . . . . . . . . . . . . . . . . . . . . . . . . . . . . . . . . . . . . . . . . . . . . . . . . . . 2,255Thereafter . . . . . . . . . . . . . . . . . . . . . . . . . . . . . . . . . . . . . . . . . . . . . . . . . . . . . . . . . . . . . . . . . . . . . . 7,922
Total minimum lease payments . . . . . . . . . . . . . . . . . . . . . . . . . . . . . . . . . . . . . . . . . . . . . . . . . . . . . 35,733
Less amount representing interest . . . . . . . . . . . . . . . . . . . . . . . . . . . . . . . . . . . . . . . . . . . . . . . . . . . (4,924)
Present value of net minimum lease payments . . . . . . . . . . . . . . . . . . . . . . . . . . . . . . . . . . . . . . . . . 30,809Less current capital lease obligations . . . . . . . . . . . . . . . . . . . . . . . . . . . . . . . . . . . . . . . . . . . . . . . . . 5,996
Long-term capital lease obligations . . . . . . . . . . . . . . . . . . . . . . . . . . . . . . . . . . . . . . . . . . . . . . . . . . ¥24,813
F-40
Notes to Consolidated Financial Statements—(Continued)
Mitsui & Co., Ltd. and subsidiaries
The companies lease real estate, ocean transport vessels, rolling stock, aircraft, equipment and others underoperating leases. Most of the ocean transport vessels, aircraft and rolling stock under operating leases aresubleased to third parties.
The Company and certain subsidiaries sold real estate and others to third parties for ¥6,006 million and¥11,622 million in total during the years ended March 31, 2007 and 2006, respectively, and leased them backwith terms ranging up to 10 years. The resulting leases were classified as operating leases. There were no suchtransactions during the year ended March 31, 2008.
The following is a schedule by years of future minimum rental payments required under operating leasesthat have initial or remaining noncancelable lease terms in excess of one year as of March 31, 2008. Minimumpayments have not been reduced by minimum sublease rentals of ¥48,136 million due in the future undernoncancelable subleases:
Millions of Yen
Year ending March 31:2009 . . . . . . . . . . . . . . . . . . . . . . . . . . . . . . . . . . . . . . . . . . . . . . . . . . . . . . . . . . . . . . . . . . . . . . . . . . ¥ 32,2002010 . . . . . . . . . . . . . . . . . . . . . . . . . . . . . . . . . . . . . . . . . . . . . . . . . . . . . . . . . . . . . . . . . . . . . . . . . . 27,7132011 . . . . . . . . . . . . . . . . . . . . . . . . . . . . . . . . . . . . . . . . . . . . . . . . . . . . . . . . . . . . . . . . . . . . . . . . . . 20,5932012 . . . . . . . . . . . . . . . . . . . . . . . . . . . . . . . . . . . . . . . . . . . . . . . . . . . . . . . . . . . . . . . . . . . . . . . . . . 17,0402013 . . . . . . . . . . . . . . . . . . . . . . . . . . . . . . . . . . . . . . . . . . . . . . . . . . . . . . . . . . . . . . . . . . . . . . . . . . 12,895Thereafter . . . . . . . . . . . . . . . . . . . . . . . . . . . . . . . . . . . . . . . . . . . . . . . . . . . . . . . . . . . . . . . . . . . . . . 42,878
Total . . . . . . . . . . . . . . . . . . . . . . . . . . . . . . . . . . . . . . . . . . . . . . . . . . . . . . . . . . . . . . . . . . . . . . ¥153,319
Rental expenses incurred for operating leases for the years ended March 31, 2008, 2007 and 2006 were¥53,179 million, ¥55,769 million and ¥46,511 million, respectively. Sublease rental income for the years endedMarch 31, 2008, 2007 and 2006 were ¥23,996 million, ¥25,716 million and ¥18,422 million, respectively.
9. PLEDGED ASSETS AND FINANCIAL ASSETS ACCEPTED AS COLLATERAL
Pledged assets
At March 31, 2008 and 2007, the following assets (exclusive of assets covered by trust receipts discussedbelow) were pledged as collateral for certain liabilities of the companies:
Millions of Yen
2008 2007
Trade receivables (current and non-current) . . . . . . . . . . . . . . . . . . . . . . . . . . . . . . . . . . . . . ¥115,177 ¥136,503Inventories . . . . . . . . . . . . . . . . . . . . . . . . . . . . . . . . . . . . . . . . . . . . . . . . . . . . . . . . . . . . . . . 39,274 61,016Investments . . . . . . . . . . . . . . . . . . . . . . . . . . . . . . . . . . . . . . . . . . . . . . . . . . . . . . . . . . . . . . 71,770 108,918Property leased to others (net book value) . . . . . . . . . . . . . . . . . . . . . . . . . . . . . . . . . . . . . . 51,840 52,343Property and equipment (net book value) . . . . . . . . . . . . . . . . . . . . . . . . . . . . . . . . . . . . . . . 33,639 57,162Other . . . . . . . . . . . . . . . . . . . . . . . . . . . . . . . . . . . . . . . . . . . . . . . . . . . . . . . . . . . . . . . . . . . 1,561 14,023
Total . . . . . . . . . . . . . . . . . . . . . . . . . . . . . . . . . . . . . . . . . . . . . . . . . . . . . . . . . . . . . . . ¥313,261 ¥429,965
F-41

Notes to Consolidated Financial Statements—(Continued)
Mitsui & Co., Ltd. and subsidiaries
The distribution of such collateral among short-term debt, long-term debt, and guarantees of contracts andfinancial guarantees was as follows:
Millions of Yen
2008 2007
Short-term debt . . . . . . . . . . . . . . . . . . . . . . . . . . . . . . . . . . . . . . . . . . . . . . . . . . . . . . . . . . . ¥ 40,003 ¥104,586Long-term debt . . . . . . . . . . . . . . . . . . . . . . . . . . . . . . . . . . . . . . . . . . . . . . . . . . . . . . . . . . . 180,951 182,018Guarantees of contracts and financial guarantees . . . . . . . . . . . . . . . . . . . . . . . . . . . . . . . . . 92,307 143,361
Total . . . . . . . . . . . . . . . . . . . . . . . . . . . . . . . . . . . . . . . . . . . . . . . . . . . . . . . . . . . . . . . ¥313,261 ¥429,965
Trust receipts issued under customary import financing arrangements (short-term bank loans and bankacceptances) give banks a security interest in the merchandise imported and/or the accounts receivable resultingfrom the sale of such merchandise. Because of the companies’ large volume of import transactions, it is notpracticable to determine the total amount of assets covered by outstanding trust receipts.
In addition to the above, the Company has bank borrowings under certain provisions of loan agreementswhich require the Company, upon the request of the bank, immediately to provide collateral, which is notspecified in the loan agreements.
Financial assets accepted as collateral
At March 31, 2008 and 2007, the fair values of financial assets that the companies accepted as security fortrade receivables and that they are permitted to sell or repledge consisted of the following:
Millions of Yen
2008 2007
Bank deposits . . . . . . . . . . . . . . . . . . . . . . . . . . . . . . . . . . . . . . . . . . . . . . . . . . . . . . . . . . . . . . . . ¥1,648 ¥1,583Trade receivables—accounts . . . . . . . . . . . . . . . . . . . . . . . . . . . . . . . . . . . . . . . . . . . . . . . . . . . . . 2,209 3,046Stocks and bonds . . . . . . . . . . . . . . . . . . . . . . . . . . . . . . . . . . . . . . . . . . . . . . . . . . . . . . . . . . . . . . 5,798 8,615
Stocks and bonds of ¥593 million which were provided as collateral were repledged at March 31, 2007.There were no financial assets repledged at March 31, 2008.
There were no financial assets accepted as collateral under security repurchase agreements at March 31,2008 and 2007.
10. IMPAIRMENT LOSS OF LONG-LIVED ASSETS
The companies have recognized an impairment loss of long-lived assets in accordance with the provisions ofSFAS No. 144 during the years ended March 31, 2008, 2007 and 2006. See Note 4, “DISCONTINUEDOPERATIONS,” for the impairment loss of long-lived assets reported in discontinued operations.
The impairment loss of long-lived assets for the year ended March 31, 2008 consisted principally of landheld for development, and corporate residents and dormitories owned by the Company; power producingequipment owned by a domestic power producing subsidiary, GTF Green Power Co., Ltd. (Japan). Theimpairments for the year ended March 31, 2008 mainly related to the drastic change in the development plan,continuous fall of land prices in Japan, and declining profitability due to deterioration of operating environmentof the domestic power producing industry.
F-42

Notes to Consolidated Financial Statements—(Continued)
Mitsui & Co., Ltd. and subsidiaries
The impairment loss of long-lived assets for the year ended March 31, 2007 consisted principally ofintangible assets, such as know-how, owned by a domestic subsidiary, Mitsui Norin Co., Ltd. (Japan), which isone of the manufacturers of tea leaves in Japan; and land and buildings for certain businesses owned by adomestic subsidiary, Mitsui Foods Co., Ltd. (Japan). The impairments for the year ended March 31, 2007 mainlyrelated to declining profitability due to deterioration of operating environment such as intensifying competition inboth beverage and beverage materials, and the reorganization of business structure and distribution bases.
The impairment loss of long-lived assets for the year ended March 31, 2006 consisted principally ofproduction facilities owned by an aluminum smelting subsidiary, Mitalco Inc. (United States); land and buildingsfor certain businesses owned by domestic and foreign subsidiaries; and land held for lease owned by theCompany. The impairments for the year ended March 31, 2006 mainly related to declining profitability resultingfrom deterioration in the terms of the power purchase contract during the course of renewal negotiations, and thereorganization of business structure and distribution bases.
See Note 24, “EXIT OR DISPOSAL ACTIVITIES,” for the exit or disposal activities which resulted inrecognition of an impairment loss of long-lived assets.
Impairment loss of long-lived assets recognized by operating segment for the years ended March 31, 2008,2007 and 2006 were as follows:
Millions of Yen
2008 2007 2006
Iron & Steel Products . . . . . . . . . . . . . . . . . . . . . . . . . . . . . . . . . . . . . . . . . . . . . . . ¥ 192 ¥ 70 ¥ 1,276Mineral & Metal Resources . . . . . . . . . . . . . . . . . . . . . . . . . . . . . . . . . . . . . . . . . . 127 — 11,804Machinery & Infrastructure Projects . . . . . . . . . . . . . . . . . . . . . . . . . . . . . . . . . . . 4 602 6,725Chemical . . . . . . . . . . . . . . . . . . . . . . . . . . . . . . . . . . . . . . . . . . . . . . . . . . . . . . . . . 273 323 581Energy . . . . . . . . . . . . . . . . . . . . . . . . . . . . . . . . . . . . . . . . . . . . . . . . . . . . . . . . . . . 5,910 1,600 1,178Foods & Retail . . . . . . . . . . . . . . . . . . . . . . . . . . . . . . . . . . . . . . . . . . . . . . . . . . . . 532 13,736 6,797Consumer Service & IT . . . . . . . . . . . . . . . . . . . . . . . . . . . . . . . . . . . . . . . . . . . . . 57 335 2,068Logistics & Financial Markets . . . . . . . . . . . . . . . . . . . . . . . . . . . . . . . . . . . . . . . . 1,381 92 254Americas . . . . . . . . . . . . . . . . . . . . . . . . . . . . . . . . . . . . . . . . . . . . . . . . . . . . . . . . . — 12 1,911Europe, the Middle East and Africa . . . . . . . . . . . . . . . . . . . . . . . . . . . . . . . . . . . . 145 — 19Asia Pacific . . . . . . . . . . . . . . . . . . . . . . . . . . . . . . . . . . . . . . . . . . . . . . . . . . . . . . . — 6 13All Other . . . . . . . . . . . . . . . . . . . . . . . . . . . . . . . . . . . . . . . . . . . . . . . . . . . . . . . . . 13,929 1,046 2,818Adjustments and Eliminations . . . . . . . . . . . . . . . . . . . . . . . . . . . . . . . . . . . . . . . . 1,822 (249) (19,625)
Consolidated Total . . . . . . . . . . . . . . . . . . . . . . . . . . . . . . . . . . . . . . . . . . . . . . . . . ¥24,372 ¥17,573 ¥ 15,819
Note: “Adjustments and Eliminations” represents impairment losses related to assets not allocated to specificoperating segments. The reclassifications to income (loss) from discontinued operation-net for the yearsended March 31, 2007 and 2006 are also included in “Adjustments and Eliminations.”
The fair value of the assets is calculated based on independent appraisals, market value or discounted futurecash flows whichever management considers most appropriate.
In addition to the impairment loss of long-lived assets based on SFAS No. 144 shown in the above table, theimpairment loss of intangible assets not subject to amortization based on SFAS No. 142 was included inimpairment loss of long-lived assets in the Statements of Consolidated Income for the years ended March 31,2008, 2007 and 2006 as discussed in Note 12, “GOODWILL AND OTHER INTANGIBLE ASSETS.”
F-43

Notes to Consolidated Financial Statements—(Continued)
Mitsui & Co., Ltd. and subsidiaries
11. ASSET RETIREMENT OBLIGATIONS
The companies recognized asset retirement obligations in accordance with the provisions of SFAS No. 143.
The asset retirement obligations are principally related to the costs of dismantling and removing mining, andoil and gas production facilities owned by subsidiaries in Australia and a domestic subsidiary which has interestsin oil and gas in South East Asia, which are engaged in mining operations or oil and gas producing activities.
The changes in asset retirement obligations for the years ended March 31, 2008 and 2007 were as follows:
Millions of Yen
2008 2007
Balance at beginning of year . . . . . . . . . . . . . . . . . . . . . . . . . . . . . . . . . . . . . . . . . . . . . . . . . . . ¥42,052 ¥17,790Consolidation of a subsidiary . . . . . . . . . . . . . . . . . . . . . . . . . . . . . . . . . . . . . . . . . . . . . . . . . . — 16,814Liabilities incurred . . . . . . . . . . . . . . . . . . . . . . . . . . . . . . . . . . . . . . . . . . . . . . . . . . . . . . . . . . 4,450 7,511Liabilities settled . . . . . . . . . . . . . . . . . . . . . . . . . . . . . . . . . . . . . . . . . . . . . . . . . . . . . . . . . . . . (334) (5)Disposition of assets . . . . . . . . . . . . . . . . . . . . . . . . . . . . . . . . . . . . . . . . . . . . . . . . . . . . . . . . . (4,985) (2,691)Accretion expense . . . . . . . . . . . . . . . . . . . . . . . . . . . . . . . . . . . . . . . . . . . . . . . . . . . . . . . . . . . 2,397 1,134Foreign currency translation adjustments . . . . . . . . . . . . . . . . . . . . . . . . . . . . . . . . . . . . . . . . . (4,608) 1,499
Balance at end of year . . . . . . . . . . . . . . . . . . . . . . . . . . . . . . . . . . . . . . . . . . . . . . . . . . . . . . . . ¥38,972 ¥42,052
12. GOODWILL AND OTHER INTANGIBLE ASSETS
Intangible assets subject to amortization at March 31, 2008 and 2007 consisted of the following:
Millions of Yen
2008 2007
Gross carryingamount
Accumulatedamortization
Gross carryingamount
Accumulatedamortization
Software . . . . . . . . . . . . . . . . . . . . . . . . . . . . . . . . . . . . . ¥ 57,128 ¥29,518 ¥ 51,108 ¥27,444Customer relationships . . . . . . . . . . . . . . . . . . . . . . . . . . 16,882 3,687 14,266 2,487Trademarks . . . . . . . . . . . . . . . . . . . . . . . . . . . . . . . . . . . 11,819 8,942 11,305 8,426Patents . . . . . . . . . . . . . . . . . . . . . . . . . . . . . . . . . . . . . . 8,284 8,089 9,470 9,379Unpatented technologies . . . . . . . . . . . . . . . . . . . . . . . . 5,485 5,412 5,398 5,376Other . . . . . . . . . . . . . . . . . . . . . . . . . . . . . . . . . . . . . . . . 38,891 18,726 35,505 16,994
Total . . . . . . . . . . . . . . . . . . . . . . . . . . . . . . . . . . . . ¥138,489 ¥74,374 ¥127,052 ¥70,106
The aggregate amortization expense of intangible assets for the years ended March 31, 2008, 2007 and 2006was ¥14,474 million, ¥14,995 million and ¥15,027 million, respectively. The estimated aggregate amortizationexpense of intangible assets at March 31, 2008 for each of the next five years is as follows:
Millions of Yen
Year ending March 31:2009 . . . . . . . . . . . . . . . . . . . . . . . . . . . . . . . . . . . . . . . . . . . . . . . . . . . . . . . . . . . . . . . . . . . . . . . . . . ¥16,2422010 . . . . . . . . . . . . . . . . . . . . . . . . . . . . . . . . . . . . . . . . . . . . . . . . . . . . . . . . . . . . . . . . . . . . . . . . . . 12,2432011 . . . . . . . . . . . . . . . . . . . . . . . . . . . . . . . . . . . . . . . . . . . . . . . . . . . . . . . . . . . . . . . . . . . . . . . . . . 8,8022012 . . . . . . . . . . . . . . . . . . . . . . . . . . . . . . . . . . . . . . . . . . . . . . . . . . . . . . . . . . . . . . . . . . . . . . . . . . 6,5622013 . . . . . . . . . . . . . . . . . . . . . . . . . . . . . . . . . . . . . . . . . . . . . . . . . . . . . . . . . . . . . . . . . . . . . . . . . . 3,745
F-44

Notes to Consolidated Financial Statements—(Continued)
Mitsui & Co., Ltd. and subsidiaries
Total carrying amount of intangible assets not subject to amortization (excluding goodwill) at March 31,2008 and 2007 consisted of:
Millions of Yen
2008 2007
Land rights . . . . . . . . . . . . . . . . . . . . . . . . . . . . . . . . . . . . . . . . . . . . . . . . . . . . . . . . . . . . . . . . . ¥ 7,707 ¥ 7,257Trademarks . . . . . . . . . . . . . . . . . . . . . . . . . . . . . . . . . . . . . . . . . . . . . . . . . . . . . . . . . . . . . . . . 838 979Other . . . . . . . . . . . . . . . . . . . . . . . . . . . . . . . . . . . . . . . . . . . . . . . . . . . . . . . . . . . . . . . . . . . . . 3,356 2,016
Total . . . . . . . . . . . . . . . . . . . . . . . . . . . . . . . . . . . . . . . . . . . . . . . . . . . . . . . . . . . . . . . . . ¥11,901 ¥10,252
Intangible assets subject to amortization acquired during the year ended March 31, 2008 totaled ¥22,668million, and consisted primarily of software of ¥13,449 million and customer relationships of ¥3,646 million.The weighted average amortization periods for software and customer relationships are 5 years and 21 years,respectively. Acquisition of intangible assets not subject to amortization during the year ended March 31, 2008totaled ¥1,704 million.
Intangible assets subject to amortization acquired during the year ended March 31, 2007 totaled ¥25,852million, and consisted primarily of software of ¥8,939 million and customer relationships of ¥6,587 million. Theweighted average amortization periods for software and customer relationships are 5 years and 13 years,respectively. Acquisition of intangible assets not subject to amortization during the year ended March 31, 2007was immaterial.
The impairment losses recognized for intangible assets subject to amortization and not subject toamortization (excluding goodwill) for the year ended March 31, 2008 were immaterial.
During the year ended March 31, 2007, the companies recognized impairment losses of ¥12,247 million onintangible assets subject to amortization and not subject to amortization (excluding goodwill) which are includedin impairment loss of long-lived assets in the Statements of Consolidated Income. The impairment lossesincluded in Foods & Retail Segment consisted primarily of ¥10,301 million and ¥1,848 million on the write-down of unpatented technologies (intangibles assets subject to amortization) and trademarks, (intangible assetsnot subject to amortization) which were held by Mitsui Norin Co., Ltd., a domestic subsidiary which is engagedin manufacturing tea-related beverage materials. The impairments of unpatented technologies and trademarkswere mainly due to the decrease in the fair value resulting from the downturn in profitability according to theintensifying competition in the tea related materials industry. The fair value for the basis of determining theimpairment loss was calculated based on discounted future cash flows.
The impairment losses recognized for intangible assets subject to amortization and not subject toamortization (excluding goodwill) for the year ended March 31, 2006 were immaterial.
F-45

Notes to Consolidated Financial Statements—(Continued)
Mitsui & Co., Ltd. and subsidiaries
The changes in the carrying amount of goodwill by operating segment for the years ended March 31, 2008and 2007 were as follows:
Millions of Yen
Iron &Steel
Products
Mineral &Metal
Resources
Machinery &Infrastructure
Projects ChemicalFoods &
Retail
ConsumerService &
IT AmericasConsolidated
Total
Balance at April 1, 2006 . . . . . . . . . . . ¥705 ¥222 ¥ 1,771 ¥ 641 ¥ 17,079 ¥ 4,481 ¥ 5,692 ¥ 30,591Acquisition . . . . . . . . . . . . . . . . . . . . . . 167 — 12,193 1,143 591 2,038 6,664 22,796Impairment losses . . . . . . . . . . . . . . . . — — — — (16,528) — — (16,528)Others . . . . . . . . . . . . . . . . . . . . . . . . . . — 2 423 90 — (129) 2 388
Balance at March 31, 2007 . . . . . . . . . 872 224 14,387 1,874 1,142 6,390 12,358 37,247Acquisition . . . . . . . . . . . . . . . . . . . . . . — — 164 956 768 6,755 17,355 25,998Impairment losses . . . . . . . . . . . . . . . . — — — — — (2,004) — (2,004)Others . . . . . . . . . . . . . . . . . . . . . . . . . . — (34) (3,100) (122) (19) (2,427) (3,051) (8,753)
Balance at March 31, 2008 . . . . . . . . . ¥872 ¥190 ¥11,451 ¥2,708 ¥ 1,891 ¥ 8,714 ¥26,662 ¥ 52,488
Notes: (1) “Others” principally includes the effect of foreign currency exchange rate changes and purchase accounting adjustments.(2) The figures for the year ended March 31, 2007 have been reclassified to conform to the current year segment presentation of
the operating segment information as the composition of the reportable segment of the companies was changed.
The impairment losses included in the Consumer Service & IT Segment for the year ended March 31, 2008consisted of an impairment loss of ¥2,004 million for goodwill related to MITSUI KNOWLEDGE INDUSTRYCO., LTD. (“MKI”) which is listed on the Tokyo Stock Exchange. Because a decline in the MKI’s stock pricewas determined to represent an indicator of an impairment, its goodwill was tested for impairment. As a result,the carrying amount of MKI exceeded its fair value and the impairment loss was recognized in the amount equalto the excess of the carrying amount of goodwill over the fair value of goodwill.
The impairment losses included in the Foods & Retail Segment for the year ended March 31, 2007 consistedof an impairment loss of ¥16,528 million for goodwill related to Mitsui Norin Co., Ltd., a domestic subsidiarywhich is engaged in manufacturing tea-related beverage materials. Because the subsidiary experienced adownturn in profitability due to the intensifying competition in the tea related materials industry, the carryingamount of the subsidiary exceeded its fair value and the impairment loss was recognized in the amount equal tothe excess of the carrying amount of goodwill over the fair value of goodwill. The fair value of the subsidiary forthe basis of determining the impairment loss of goodwill was calculated based on discounted future cash flows.
The impairment losses included in the Mineral & Metal Resources Segment for the year ended March 31,2006 consisted of an impairment loss of ¥2,838 million for goodwill related to Mitalco Inc., an aluminumsmelting subsidiary in the United States. Because of the deterioration in the terms of the power purchase contractduring the course of renewal negotiations, the carrying amount of the subsidiary exceeded its fair value and theimpairment loss was recognized in the amount equal to the excess of the carrying amount of goodwill over thefair value of goodwill. This impairment loss has been reclassified to income (loss) from discontinuedoperations—net (after income tax effect) in the Statements of Consolidated Income, because this operation wasdiscontinued for the year ended March 31, 2007, as discussed in Note 4, “DISCONTINUED OPERATION.” Thefair value of the subsidiary for the basis of determining the impairment loss of goodwill was calculated based ondiscounted future cash flows.
F-46

Notes to Consolidated Financial Statements—(Continued)
Mitsui & Co., Ltd. and subsidiaries
13. SHORT-TERM AND LONG-TERM DEBT
Short-term debt at March 31, 2008 and 2007 were comprised of the following:
Millions of Yen
2008 2007
Interestrate *1
Interestrate *1
Short-term bank loans and others . . . . . . . . . . . . . . . . . . . . . . . . . . . . . . ¥367,329 4.0% ¥554,406 4.6%Commercial paper . . . . . . . . . . . . . . . . . . . . . . . . . . . . . . . . . . . . . . . . . . 86,740 2.0 93,354 3.1Notes under medium-term note programme . . . . . . . . . . . . . . . . . . . . . . 9,512 0.9 10,974 0.6
Total . . . . . . . . . . . . . . . . . . . . . . . . . . . . . . . . . . . . . . . . . . . . . . . . . 463,581 658,734SFAS No. 133 fair value adjustment *2 . . . . . . . . . . . . . . . . . . . . . . . . . 966 13
Total . . . . . . . . . . . . . . . . . . . . . . . . . . . . . . . . . . . . . . . . . . . . . . . . . ¥464,547 ¥658,747
*1 The interest rates represent weighted average rates in effect at March 31, 2008 and 2007 regardless ofborrowing currencies, though the range of the interest rates varies by borrowing currency.
*2 In accordance with the requirements of SFAS No. 133, the portion of the companies’ fixed-rate debtobligations that is designated and effective as a fair value hedge is reflected in the Consolidated BalanceSheets as an amount equal to the sum of the debt’s carrying value plus an SFAS No. 133 fair valueadjustment representing changes recorded in the fair value of the hedged debt obligations attributable tomovements in the designated benchmark interest rates and applicable foreign currency exchange ratesduring the term of the hedge.
Unused lines of credit, for short-term financing outside Japan, aggregated ¥598,492 million at March 31,2008. Certain foreign subsidiaries compensate banks for these facilities in the form of commitment fees, whichwere not material during the years ended March 31, 2008 and 2007.
F-47

Notes to Consolidated Financial Statements—(Continued)
Mitsui & Co., Ltd. and subsidiaries
Long-term debt at March 31, 2008 and 2007 consisted of the following:
Millions of Yen
2008 2007
Long-term debt with collateral (Note 9):Banks and insurance companies, maturing serially through 2016—principally
0.9% to 7.5% . . . . . . . . . . . . . . . . . . . . . . . . . . . . . . . . . . . . . . . . . . . . . . . . . . . . . . . . . . . . . . ¥ 73,431 ¥ 118,203Government-owned banks and government agencies, maturing serially through
2056—principally 0.7% to 7% . . . . . . . . . . . . . . . . . . . . . . . . . . . . . . . . . . . . . . . . . . . . . . . . 73,525 66,602Other, maturing serially through 2020—principally 2% to 6% . . . . . . . . . . . . . . . . . . . . . . . . . 4,561 5,332Japanese yen bonds (floating rate 1.3%, due 2020) . . . . . . . . . . . . . . . . . . . . . . . . . . . . . . . . . . 1,750 —
Total . . . . . . . . . . . . . . . . . . . . . . . . . . . . . . . . . . . . . . . . . . . . . . . . . . . . . . . . . . . . . . 153,267 190,137
Long-term debt without collateral:Banks and others (principally insurance companies):
Principally 0.01% to 6%, maturing serially through 2023 . . . . . . . . . . . . . . . . . . . . . . . . . 1,724,797 1,690,323Principally 0.4% to 18%, maturing serially through 2040 (payable in foreign
currencies) . . . . . . . . . . . . . . . . . . . . . . . . . . . . . . . . . . . . . . . . . . . . . . . . . . . . . . . . . . . . 559,169 545,689Bonds and notes:
Japanese yen convertible bonds (fixed rate 1.05%, due 2009) . . . . . . . . . . . . . . . . . . . . . . 7,960 36,577U.S. dollar convertible bonds (zero coupon, due 2008) . . . . . . . . . . . . . . . . . . . . . . . . . . . 1,001 1,179Japanese yen bonds with early redemption clause (fixed rate 0.7% to 1.4%, due
2013–2015) . . . . . . . . . . . . . . . . . . . . . . . . . . . . . . . . . . . . . . . . . . . . . . . . . . . . . . . . . . . 26,000 41,000Japanese yen bonds with early redemption clause (fixed and floating rate: floating rate
1.3% , due 2016) . . . . . . . . . . . . . . . . . . . . . . . . . . . . . . . . . . . . . . . . . . . . . . . . . . . . . . . 10,000 10,000Japanese yen bonds (fixed rate 0.7% to 3.2%, due 2007–2027) . . . . . . . . . . . . . . . . . . . . 320,175 295,309Japanese yen bonds (fixed and floating rate: floating rate 1.4% to 2.5%, due
2013–2024) . . . . . . . . . . . . . . . . . . . . . . . . . . . . . . . . . . . . . . . . . . . . . . . . . . . . . . . . . . . 101,500 101,500Japanese yen bonds (floating rate 1.1% to 2.1%, due 2010–2017) . . . . . . . . . . . . . . . . . . 102,000 102,000Reverse dual currency yen/U.S. dollar bonds (fixed rate 3.0% to 3.3%, due
2007–2012) . . . . . . . . . . . . . . . . . . . . . . . . . . . . . . . . . . . . . . . . . . . . . . . . . . . . . . . . . . . 10,000 30,000Notes under global medium-term note programme (fixed rate 0.9% to 4.6%, due
2007–2014) . . . . . . . . . . . . . . . . . . . . . . . . . . . . . . . . . . . . . . . . . . . . . . . . . . . . . . . . . . . 6,722 8,580Notes under euro medium-term note programme (fixed rate 0.02% to 5.8%, due
2007–2019) . . . . . . . . . . . . . . . . . . . . . . . . . . . . . . . . . . . . . . . . . . . . . . . . . . . . . . . . . . . 123,210 166,218Notes under euro medium-term note programme (floating rate 0.3% to 5.8%, due
2007–2017) . . . . . . . . . . . . . . . . . . . . . . . . . . . . . . . . . . . . . . . . . . . . . . . . . . . . . . . . . . . 14,191 17,346Notes under euro medium-term note programme (fixed and floating rate: floating rate
0.4% to 5.4%, due 2012–2024) . . . . . . . . . . . . . . . . . . . . . . . . . . . . . . . . . . . . . . . . . . . 10,502 10,577Notes under euro medium-term note programme (fixed and floating rate: fixed rate
1.4%, due 2009) . . . . . . . . . . . . . . . . . . . . . . . . . . . . . . . . . . . . . . . . . . . . . . . . . . . . . . . — 1,056Capital lease obligations (principally 0.3% to 7.3%, maturing serially through 2030) . . . . . . . 30,809 23,761
Total . . . . . . . . . . . . . . . . . . . . . . . . . . . . . . . . . . . . . . . . . . . . . . . . . . . . . . . . . . . . . . 3,048,036 3,081,115
Total . . . . . . . . . . . . . . . . . . . . . . . . . . . . . . . . . . . . . . . . . . . . . . . . . . . . . . . . . . 3,201,303 3,271,252SFAS No. 133 fair value adjustment* . . . . . . . . . . . . . . . . . . . . . . . . . . . . . . . . . . . . . . . . . . . . . . . . 19,700 (11,859)
Total . . . . . . . . . . . . . . . . . . . . . . . . . . . . . . . . . . . . . . . . . . . . . . . . . . . . . . 3,221,003 3,259,393Less current maturities . . . . . . . . . . . . . . . . . . . . . . . . . . . . . . . . . . . . . . . . . . . . . . . . . . . . . . . . . . . . 276,620 371,865
Long-term debt, less current maturities . . . . . . . . . . . . . . . . . . . . . . . . . . . . . . . . . . . . . . . . . . . . . . . ¥2,944,383 ¥2,887,528
* In accordance with the requirements of SFAS No. 133, the portion of the companies’ fixed-rate debt obligations that isdesignated and effective as a fair value hedge is reflected in the Consolidated Balance Sheets as an amount equal to the sumof the debt’s carrying value plus an SFAS No. 133 fair value adjustment representing changes recorded in the fair value ofthe hedged debt obligations attributable to movements in the designated benchmark interest rates and applicable foreigncurrency exchange rates during the term of the hedge.
F-48

Notes to Consolidated Financial Statements—(Continued)
Mitsui & Co., Ltd. and subsidiaries
The companies have entered into currency swap agreements and interest rate swap agreements in connectionwith certain bonds, notes and other long-term borrowings. The floating interest rates for interest rate swapagreements are generally based on the three-month or six-month LIBOR (London Interbank Offered Rate). Thethree-month and six-month LIBORs for U.S. dollar denominated debt as of March 31, 2008 were 2.69% and2.61%, respectively. The three-month and six-month LIBORs for U.S. dollar denominated debt as of March 31,2007 were 5.35% and 5.33%, respectively. (See Note 25, “DERIVATIVE INSTRUMENTS AND HEDGINGACTIVITIES,” and Note 26, “FINANCIAL INSTRUMENTS.”)
The 1.05% Convertible Bonds due 2009 may be converted into common stock at ¥876.60 per share, at theoption of the holder and may be redeemed at the option of the Company at specified percentages of the principal.
The indenture, under which the bonds were issued, does not require maintenance of a prescribed amount ofnet assets, a minimum debt/equity ratio or limits on the payment of cash dividends by the Company.
Substantially all short-term and long-term bank borrowings are made under agreements which, as iscustomary in Japan, provide that under certain conditions a bank may require the borrower to provide collateral(or additional collateral) or guarantors with respect to the borrowings and that the bank may treat any collateral,whether furnished as security for short-term or long-term loans or otherwise, as collateral for all indebtedness tosuch bank. Default provisions of certain loan agreements grant certain rights of possession to the lenders.
Under certain loan agreements with government-owned banks, the creditors may require the companies tosubmit proposals as to the payment of dividends and other appropriations of earnings for the creditors’ reviewand approval before presentation to the shareholders. Certain of those agreements require the borrower, upon therequest of the lender, to reduce outstanding loans before scheduled maturity dates when the lender considers thatthe companies are able to reduce such loans through increased earnings or through the proceeds from the sale ofcommon stock or bonds and notes. During the years ended March 31, 2008 and 2007, the companies did notreceive any such requests, and there is no expectation that any such requests will be made.
Maturities of long-term debt outstanding at March 31, 2008 were as follows, excluding the effect of theSFAS No. 133 fair value adjustment:
Millions of Yen
Year ending March 31:2009 . . . . . . . . . . . . . . . . . . . . . . . . . . . . . . . . . . . . . . . . . . . . . . . . . . . . . . . . . . . . . . . . . . . . . . . . . . ¥ 274,0682010 . . . . . . . . . . . . . . . . . . . . . . . . . . . . . . . . . . . . . . . . . . . . . . . . . . . . . . . . . . . . . . . . . . . . . . . . . . 384,4852011 . . . . . . . . . . . . . . . . . . . . . . . . . . . . . . . . . . . . . . . . . . . . . . . . . . . . . . . . . . . . . . . . . . . . . . . . . . 299,7952012 . . . . . . . . . . . . . . . . . . . . . . . . . . . . . . . . . . . . . . . . . . . . . . . . . . . . . . . . . . . . . . . . . . . . . . . . . . 309,2452013 . . . . . . . . . . . . . . . . . . . . . . . . . . . . . . . . . . . . . . . . . . . . . . . . . . . . . . . . . . . . . . . . . . . . . . . . . . 320,919Thereafter . . . . . . . . . . . . . . . . . . . . . . . . . . . . . . . . . . . . . . . . . . . . . . . . . . . . . . . . . . . . . . . . . . . . . . 1,612,791
Total . . . . . . . . . . . . . . . . . . . . . . . . . . . . . . . . . . . . . . . . . . . . . . . . . . . . . . . . . . . . . . . . . . . . . . ¥3,201,303
14. PENSION COSTS AND SEVERANCE INDEMNITIES
The Company and certain subsidiaries have non-contributory and contributory defined benefit pensionplans, covering substantially all employees other than directors.
The primary pension plan is the Company’s contributory Corporate Pension Fund (“CPF”) under theDefined Benefit Corporate Pension Law. The benefits from CPF are based on the length of service.
F-49

Notes to Consolidated Financial Statements—(Continued)
Mitsui & Co., Ltd. and subsidiaries
Effective April 1, 2006, the Company converted certain portions of CPF into a defined contribution plan anda cash balance plan. The cash balance plan calculates its benefits using a percentage of employees’ annual salaryand an interest crediting rate.
The Company and certain subsidiaries have unfunded severance indemnities plans. Benefits under the plansare based on the level of compensation at retirement, or earlier termination of employment, and the length ofservice.
The Company and most subsidiaries use a measurement date of March 31 for their defined benefit pensionplans.
Effective March 31, 2007, the companies adopted the recognition and related disclosure provisions of SFASNo. 158, which require the recognition of the overfunded or underfunded status of a defined benefit plan as anasset or liability in the statement of financial position and the recognition of changes in that funded status incomprehensive income in the year in which the changes occur. The following table sets forth the incrementaleffect of adoption of these provisions on the Consolidated Balance Sheets as of March 31, 2007.
Millions of Yen
Beforeadoption of
SFASNo. 158 Adjustments
Afteradoption of
SFASNo. 158
Investments in and advances to associated companies . . . . . . . . . . . . . . . . . . ¥ 0 ¥ 2,180 ¥ 2,180Intangible assets . . . . . . . . . . . . . . . . . . . . . . . . . . . . . . . . . . . . . . . . . . . . . . . 553 (553) —Other assets (prepaid pension costs) . . . . . . . . . . . . . . . . . . . . . . . . . . . . . . . . 108,027 11,138 119,165Accrued expenses—others . . . . . . . . . . . . . . . . . . . . . . . . . . . . . . . . . . . . . . . — (624) (624)Accrued pension costs and liability for severance indemnities . . . . . . . . . . . (32,733) (476) (33,209)Deferred tax assets (liabilities) . . . . . . . . . . . . . . . . . . . . . . . . . . . . . . . . . . . . 3,185 (5,019) (1,834)Accumulated other comprehensive loss (income) . . . . . . . . . . . . . . . . . . . . . 4,359 (6,646) (2,287)
F-50

Notes to Consolidated Financial Statements—(Continued)
Mitsui & Co., Ltd. and subsidiaries
Obligations and funded status
The following table sets forth the reconciliation of the companies’ benefit obligations, plan assets andfunded status of the plans:
Millions of Yen
2008 2007
Change in benefit obligation:Benefit obligation at beginning of year . . . . . . . . . . . . . . . . . . . . . . . . . . . . . . . . . . . . . ¥283,105 ¥271,966Service cost . . . . . . . . . . . . . . . . . . . . . . . . . . . . . . . . . . . . . . . . . . . . . . . . . . . . . . . . . . 10,244 10,081Interest cost . . . . . . . . . . . . . . . . . . . . . . . . . . . . . . . . . . . . . . . . . . . . . . . . . . . . . . . . . . 6,244 6,404Plan participants’ contributions . . . . . . . . . . . . . . . . . . . . . . . . . . . . . . . . . . . . . . . . . . . 430 402Plan amendments . . . . . . . . . . . . . . . . . . . . . . . . . . . . . . . . . . . . . . . . . . . . . . . . . . . . . . (832) 8,563Actuarial loss . . . . . . . . . . . . . . . . . . . . . . . . . . . . . . . . . . . . . . . . . . . . . . . . . . . . . . . . . 1,218 813Benefits paid from plan assets . . . . . . . . . . . . . . . . . . . . . . . . . . . . . . . . . . . . . . . . . . . . (12,106) (11,517)Direct benefit payments . . . . . . . . . . . . . . . . . . . . . . . . . . . . . . . . . . . . . . . . . . . . . . . . (2,442) (3,718)Settlements . . . . . . . . . . . . . . . . . . . . . . . . . . . . . . . . . . . . . . . . . . . . . . . . . . . . . . . . . . (555) (344)Acquisitions and divestitures . . . . . . . . . . . . . . . . . . . . . . . . . . . . . . . . . . . . . . . . . . . . (4,451) (1,344)Foreign currency translation adjustments . . . . . . . . . . . . . . . . . . . . . . . . . . . . . . . . . . . (2,635) 1,799
Benefit obligation at end of year . . . . . . . . . . . . . . . . . . . . . . . . . . . . . . . . . . . . . . 278,220 283,105
Change in plan assets:Fair value of plan assets at beginning of year . . . . . . . . . . . . . . . . . . . . . . . . . . . . . . . . 368,437 346,506Actual (loss) return on plan assets . . . . . . . . . . . . . . . . . . . . . . . . . . . . . . . . . . . . . . . . (48,054) 20,564Employer contribution . . . . . . . . . . . . . . . . . . . . . . . . . . . . . . . . . . . . . . . . . . . . . . . . . . 7,838 11,923Plan participants’ contributions . . . . . . . . . . . . . . . . . . . . . . . . . . . . . . . . . . . . . . . . . . . 430 402Benefits paid from plan assets . . . . . . . . . . . . . . . . . . . . . . . . . . . . . . . . . . . . . . . . . . . . (12,106) (11,517)Settlements . . . . . . . . . . . . . . . . . . . . . . . . . . . . . . . . . . . . . . . . . . . . . . . . . . . . . . . . . . (93) (229)Acquisitions and divestitures . . . . . . . . . . . . . . . . . . . . . . . . . . . . . . . . . . . . . . . . . . . . (6,196) (450)Foreign currency translation adjustments . . . . . . . . . . . . . . . . . . . . . . . . . . . . . . . . . . . (1,990) 1,238
Fair value of plan assets at end of year . . . . . . . . . . . . . . . . . . . . . . . . . . . . . . . . . 308,266 368,437
Funded status at end of year . . . . . . . . . . . . . . . . . . . . . . . . . . . . . . . . . . . . . . . . . . . . . . . . . 30,046 85,332
Amounts recognized in the Consolidated Balance Sheets consist of:Other assets (prepaid pension costs) . . . . . . . . . . . . . . . . . . . . . . . . . . . . . . . . . . . . . . . ¥ 64,015 ¥119,165Accrued expenses—others . . . . . . . . . . . . . . . . . . . . . . . . . . . . . . . . . . . . . . . . . . . . . . (1,215) (624)Accrued pension costs and liability for severance indemnities . . . . . . . . . . . . . . . . . . (32,754) (33,209)
¥ 30,046 ¥ 85,332
Amounts recognized in accumulated other comprehensive loss (income) before incometax effect consist of:
Prior service cost . . . . . . . . . . . . . . . . . . . . . . . . . . . . . . . . . . . . . . . . . . . . . . . . . . . . . . ¥ 2,288 ¥ 2,910Net actuarial loss (gain) . . . . . . . . . . . . . . . . . . . . . . . . . . . . . . . . . . . . . . . . . . . . . . . . 53,182 (4,851)
¥ 55,470 ¥ (1,941)
F-51

Notes to Consolidated Financial Statements—(Continued)
Mitsui & Co., Ltd. and subsidiaries
The prior service cost/credit is amortized over the average remaining service period of employees expectedto receive related benefits.
The amortization periods of the net actuarial gain/loss are seven years for CPF and the average remainingservice period for other defined benefit pension plans.
The accumulated benefit obligation for the companies’ defined benefit pension plans as of March 31, 2008and 2007 was ¥275,416 million and ¥280,737 million, respectively.
The aggregate projected benefit obligation and aggregate fair value of plan assets for plans with projectedbenefit obligations in excess of plan assets were ¥56,250 million and ¥22,388 million at March 31, 2008 and¥56,296 million and ¥22,941 million at March 31, 2007. The aggregate accumulated benefit obligation andaggregate fair value of plan assets for plans with accumulated benefit obligations in excess of plan assets were¥45,689 million and ¥14,018 million at March 31, 2008 and ¥54,490 million and ¥22,941 million at March 31,2007.
Components of net periodic pension costs and other amounts recognized in other comprehensive income
Net periodic pension costs of the companies’ defined benefit pension plans for the years ended March 31,2008, 2007 and 2006 and other amounts recognized in other comprehensive income for the year ended March 31,2008 included the following components:
Millions of Yen
2008 2007 2006
Service cost—benefits earned during the period . . . . . . . . . . . . . . . . . . . . . . . . . . . . . ¥ 10,244 ¥10,081 ¥10,833Interest cost on projected benefit obligation . . . . . . . . . . . . . . . . . . . . . . . . . . . . . . . . 6,244 6,404 5,935Expected return on plan assets . . . . . . . . . . . . . . . . . . . . . . . . . . . . . . . . . . . . . . . . . . . (10,227) (9,855) (8,361)Amortization of prior service cost . . . . . . . . . . . . . . . . . . . . . . . . . . . . . . . . . . . . . . . . (116) (165) (590)Amortization of net actuarial loss . . . . . . . . . . . . . . . . . . . . . . . . . . . . . . . . . . . . . . . . 679 1,200 3,585Settlement gain . . . . . . . . . . . . . . . . . . . . . . . . . . . . . . . . . . . . . . . . . . . . . . . . . . . . . . — (115) (353)
Net periodic pension costs . . . . . . . . . . . . . . . . . . . . . . . . . . . . . . . . . . . . . . . . . . ¥ 6,824 ¥ 7,550 ¥11,049
Prior service cost arising during period . . . . . . . . . . . . . . . . . . . . . . . . . . . . . . . . . . . . ¥ (832)Amortization of prior service cost . . . . . . . . . . . . . . . . . . . . . . . . . . . . . . . . . . . . . . . . 116Net actuarial loss arising during period . . . . . . . . . . . . . . . . . . . . . . . . . . . . . . . . . . . . 59,499Amortization of net actuarial loss . . . . . . . . . . . . . . . . . . . . . . . . . . . . . . . . . . . . . . . . (679)Acquisition and divestitures . . . . . . . . . . . . . . . . . . . . . . . . . . . . . . . . . . . . . . . . . . . . (393)Foreign currency translation adjustments . . . . . . . . . . . . . . . . . . . . . . . . . . . . . . . . . . (300)
Total recognized in other comprehensive income . . . . . . . . . . . . . . . . . . . . . . . . . . . . 57,411
Total recognized in net periodic pension costs and other comprehensive income . . . ¥ 64,235
The estimated prior service cost and net actuarial loss of the companies that will be amortized for the yearending March 31, 2009 are as follows:
Millions of Yen
2009
Amortization of prior service cost . . . . . . . . . . . . . . . . . . . . . . . . . . . . . . . . . . . . . . . . . . . . . . . . . . . ¥ (161)Amortization of net actuarial loss . . . . . . . . . . . . . . . . . . . . . . . . . . . . . . . . . . . . . . . . . . . . . . . . . . . 2,853
F-52

Notes to Consolidated Financial Statements—(Continued)
Mitsui & Co., Ltd. and subsidiaries
Assumptions
Weighted-average assumptions used to determine the companies’ benefit obligations as of March 31, 2008and 2007 are set forth as follows:
2008 2007
Discount rate . . . . . . . . . . . . . . . . . . . . . . . . . . . . . . . . . . . . . . . . . . . . . . . . . . . . . . . . . . . . . . . 2.5% 2.5%Rate of increase in future compensation levels . . . . . . . . . . . . . . . . . . . . . . . . . . . . . . . . . . . . . 0.8 0.8
Weighted-average assumptions used to determine the companies’ net periodic pension costs for the yearsended March 31, 2008, 2007 and 2006 are set forth as follows:
2008 2007 2006
Discount rate . . . . . . . . . . . . . . . . . . . . . . . . . . . . . . . . . . . . . . . . . . . . . . . . . . . . . . . 2.5% 2.5% 2.4%Expected long-term rate of return on plan assets . . . . . . . . . . . . . . . . . . . . . . . . . . . 2.9 2.7 2.6Rate of increase in future compensation levels . . . . . . . . . . . . . . . . . . . . . . . . . . . . 0.8 0.8 0.4
The companies determine the discount rates each year as of the measurement date, based on a review ofinterest rates associated with long-term Japanese government bonds or high-quality fixed-income corporatebonds. The discount rates determined on each measurement date are used to calculate the benefit obligation as ofthat date, and are also used to calculate the net periodic pension costs for the upcoming plan year.
The rate of increase in future compensation levels was not applied in determining the projected benefitobligation of CPF other than the cash balance plan, because the benefit formulas of these plans do not containfactors relating to compensation levels.
The Company determines the expected long-term rate of return on plan assets based on the weighted-average rate of return computed by using the expected long-term rate of return on each asset class, which isderived from an extensive study conducted by investment advisors and actuaries on a periodic basis, and thetarget allocations for each asset class. The study includes a review of anticipated future performance with marketanalysis of individual asset classes, and also gives appropriate consideration to actual historical returns achievedby the plans. The subsidiaries determine the expected long-term rates of return on plan assets mainly based onthe expectations for future returns by investment advisors and actuaries.
Plan assets
The companies’ pension plan weighted-average asset allocations based on the fair value of such assets as ofMarch 31, 2008 and 2007 are set forth as follows:
Asset category 2008 2007
Equity securities . . . . . . . . . . . . . . . . . . . . . . . . . . . . . . . . . . . . . . . . . . . . . . . . . . . . . . . . . . . . 48% 51%Debt securities . . . . . . . . . . . . . . . . . . . . . . . . . . . . . . . . . . . . . . . . . . . . . . . . . . . . . . . . . . . . . . 37 40Life insurance company general accounts . . . . . . . . . . . . . . . . . . . . . . . . . . . . . . . . . . . . . . . . . 6 3Cash and deposits . . . . . . . . . . . . . . . . . . . . . . . . . . . . . . . . . . . . . . . . . . . . . . . . . . . . . . . . . . . 3 1Other . . . . . . . . . . . . . . . . . . . . . . . . . . . . . . . . . . . . . . . . . . . . . . . . . . . . . . . . . . . . . . . . . . . . . 6 5
Total . . . . . . . . . . . . . . . . . . . . . . . . . . . . . . . . . . . . . . . . . . . . . . . . . . . . . . . . . . . . . . . . . . 100% 100%
F-53

Notes to Consolidated Financial Statements—(Continued)
Mitsui & Co., Ltd. and subsidiaries
Equity securities include securities held in the Company’s employee retirement benefit trust. The fair valueof those securities as of March 31, 2008 and 2007 are 25% and 29% of total fair value of plan assets,respectively. Life insurance company general accounts are pooled investment portfolios managed by insurancecompanies and guarantee a minimum rate of return.
The Company’s investment objective is to build high quality plan assets, and the investment policy istargeted to ensure adequate returns available to provide future payments of pension benefits and severanceindemnities. The basic strategy is diversified investment in various asset classes which have different risk returncharacteristics. The Company sometimes uses derivative instruments to hedge the exposure to changes in the fairvalue of debt and equity securities, but never uses them for speculation. The subsidiaries’ investment strategiesare mainly based on diversified investment, and are targeted to stably ensure adequate returns to provide futurepayments of pension benefits over the long term.
The companies’ weighted-average target allocation of plan assets as of March 31, 2008 was 51% equitysecurities (including securities held in the employee retirement benefit trust), 48% debt securities (including lifeinsurance company general accounts) and 1% other assets.
The fair value of equity securities of the companies and associated companies included in plan assets as ofMarch 31, 2008 and 2007 were immaterial.
Cash flows
Contributions
The companies expect to contribute ¥4,778 million to their defined benefit pension plans for the year endingMarch 31, 2009.
Estimated Future Benefit Payments
The following benefit payments, which reflect expected future service, as appropriate, are expected to be paid:
Millions of Yen
Year ending March 31:2009 . . . . . . . . . . . . . . . . . . . . . . . . . . . . . . . . . . . . . . . . . . . . . . . . . . . . . . . . . . . . . . . . . . . . . . . . . . ¥14,5082010 . . . . . . . . . . . . . . . . . . . . . . . . . . . . . . . . . . . . . . . . . . . . . . . . . . . . . . . . . . . . . . . . . . . . . . . . . . 14,3452011 . . . . . . . . . . . . . . . . . . . . . . . . . . . . . . . . . . . . . . . . . . . . . . . . . . . . . . . . . . . . . . . . . . . . . . . . . . 14,7282012 . . . . . . . . . . . . . . . . . . . . . . . . . . . . . . . . . . . . . . . . . . . . . . . . . . . . . . . . . . . . . . . . . . . . . . . . . . 15,1982013 . . . . . . . . . . . . . . . . . . . . . . . . . . . . . . . . . . . . . . . . . . . . . . . . . . . . . . . . . . . . . . . . . . . . . . . . . . 15,6342014–2018 . . . . . . . . . . . . . . . . . . . . . . . . . . . . . . . . . . . . . . . . . . . . . . . . . . . . . . . . . . . . . . . . . . . . . 78,549
In addition to the above defined benefit pension plans, the Company and certain subsidiaries have definedcontribution plans. For the year ended March 31, 2008 and 2007, the companies recorded ¥1,037 million and¥1,085 million as costs of defined contribution plans. The costs of defined contribution plans for the year endedMarch 31, 2006 were immaterial.
The Company also provides the “Early Retirement Support Plan” to eligible employees, which guarantees,prior to normal retirement age, certain supplemental payments based on preretirement compensation levels.During the years ended March 31, 2008, 2007 and 2006, the Company recorded ¥3,053 million, ¥3,368 millionand ¥5,313 million of periodic payments in excess of previous projections and projected benefits based on factorsincluding the history of benefit payments as selling, general and administrative expenses, respectively.
F-54
Notes to Consolidated Financial Statements—(Continued)
Mitsui & Co., Ltd. and subsidiaries
15. SHAREHOLDERS’ EQUITY
Effective May 1, 2006, a new corporate law of Japan (the “Corporate Law”) reformed and replaced theCommercial Code of Japan (the “Code”).
Common stock
Under the Corporate Law, certain issuances of common stock, including conversions of bonds and notes andexercises of warrants issued, are required to be credited to the common stock account for at least 50% of theamount of properties contributed by persons who become shareholders at share issue.
Capital surplus and retained earnings
The Corporate Law provides that an amount equal to 10% of distribution must be appropriated as additionalpaid-in capital or a legal reserve depending on the equity account charged upon the payment of such distributionuntil the total aggregate amount of capital surplus and legal reserve equals 25% of the common stock. TheCorporate Law also provides that common stock, capital surplus, legal reserve and unappropriated retainedearnings can be transferred among the accounts under certain conditions upon resolution of the shareholders,while it is no longer allowed to transfer a portion of retained earnings to the common stock account. Theadjustments included in the accompanying consolidated financial statements for U.S. GAAP purposes but notrecorded in the general books of account have no effect on the above transfer under the Corporate Law.Additional amounts recorded as capital surplus to conform with U.S. GAAP were ¥68,279 million atMarch 31, 2008 and primarily relate to accounting for warrants, business combinations and expenses for theissuance of common stock. When debt securities were previously issued with detachable stock purchasewarrants, the portion of the proceeds which was allocable to the warrants was credited to capital surplus underU.S. GAAP. In addition, the step acquisition of the shares held by minority shareholders of a subsidiary byselling unissued shares of the Company was accounted for by the purchase method under U.S. GAAP rather thanby the pooling of interests method which was prevailing in Japan when such business combinations occurred.
Pursuant to the resolution of the Board of Directors, the Company made free distributions of common stockin prior years. Such free distributions did not result in the transfer of retained earnings to common stock orcapital surplus. Corporations in the United States issuing shares in similar transactions would be required toaccount for them as stock dividends as of the shareholders’ record date by reducing retained earnings andincreasing appropriate capital accounts by an amount equal to the fair value of the shares issued. If such UnitedStates practice had been applied to the above free distributions of shares made on and after September 30, 1986,capital surplus at March 31, 2008 would have been increased by ¥87,860 million with a corresponding decreasein unappropriated retained earnings.
Dividends
Under the Corporate Law, the amount available for distribution is calculated as of the effective date which isdetermined by the resolution of the shareholders at the shareholders’ meeting. Such amount is calculated basedon the amount of capital surplus, exclusive of additional paid-in capital, and retained earnings, exclusive ofretained earnings appropriated for legal reserve, recorded in the general books of account in accordance withaccepted Japanese accounting practices. The adjustments included in the accompanying consolidated financialstatements for U.S. GAAP purposes but not recorded in the general books of account have no effect on thecalculation of the amount available for distribution under the Corporate Law. The amount of retained earningsavailable for dividends would amount to ¥406,285 million, if the amount were to be calculated at March 31,2008.
F-55

Notes to Consolidated Financial Statements—(Continued)
Mitsui & Co., Ltd. and subsidiaries
The Corporate Law permits to pay dividends at any time during the fiscal year in addition to the year-enddividend upon resolution of shareholders at the shareholders’ meeting. A mid-year interim dividend may be paidby resolution of the Board of Directors, subject to limitations imposed by the Corporate Law. See Note 13,“SHORT-TERM AND LONG-TERM DEBT,” for the right of certain creditors to review and approve thecompanies’ proposal for the payment of dividends.
Purchase by the Company of shares
The Corporate law permits the Company to purchase and hold its own shares. The Company is allowed todecide the number, amount and others of the shares to be acquired, not to exceed the amount available fordistribution, subject to the prior approval of the shareholders at the shareholders’ meeting. The Corporate Lawpermits the Company to purchase its own shares through market transactions or tender offer upon the approval ofthe Board of Directors, as far as it is permitted under the Articles of Incorporation, subject to limitations imposedby the Corporate Law. At the ordinary general meeting of shareholders held on June 24, 2004, it was approvedthat the Company amended the Articles of Incorporation to entitle the Board of Directors to purchase outstandingshares of the Company’s own common stock by its resolution.
The Company may dispose of them, subject to the approval of the Board of Directors, unless otherwisespecified in the Corporate Law, or as far as the Articles of Incorporation do not require a resolution of theshareholders at the shareholders’ meeting. In addition, the Corporate Law enables the Company to retire its ownshares by resolution of the Board of Directors.
The Code
Effective May 1, 2006, the Corporate Law reformed and replaced the Code, while Japanese companies weresubject to the Code until April 30, 2006. Under the Corporate Law, it is no longer allowed to transfer a portion ofretained earnings to the common stock account, while it was allowed under the Code.
Under the Corporate Law, additional paid-in capital is allowed to be transferred to common stock accountby the approval of shareholders’ meeting, on the other hand it could be transferred by the resolution of the Boardof Directors.
Under the Corporate Law, the total amount of additional paid-in capital and legal reserve may be reversedwithout limitation. Under the Code, the aggregate amount of additional paid-in capital and legal reserve thatexceeds 25% of common stock could be made available for dividends by resolution of the shareholders.
The Corporate Law permits dividends at any time during the fiscal year upon resolution at the shareholders’meeting. Under the Code, except for a mid-year interim dividend, it was permitted by approval by the ordinarygeneral meeting of shareholders held subsequent to the fiscal year.
F-56

Notes to Consolidated Financial Statements—(Continued)
Mitsui & Co., Ltd. and subsidiaries
Accumulated other comprehensive income (loss)
Changes in each component of accumulated other comprehensive income (loss) for the years endedMarch 31, 2008, 2007 and 2006 are as follows:
Millions of Yen
2008 2007 2006
Unrealized Holding Gains and Losses on Available-for-Sale Securities:Balance at beginning of year . . . . . . . . . . . . . . . . . . . . . . . . . . . . . . . . . . . . . . ¥ 258,922 ¥216,099 ¥ 100,179
Pre-tax amount of unrealized holding gains and losses onavailable-for-sale securities . . . . . . . . . . . . . . . . . . . . . . . . . . . . . . . . . (203,919) 123,931 217,516
Deferred income taxes . . . . . . . . . . . . . . . . . . . . . . . . . . . . . . . . . . . . . . . 85,601 (66,684) (90,263)
Adjustments for year (after income tax effect) . . . . . . . . . . . . . . . . . . . . (118,318) 57,247 127,253
Pre-tax amount of reclassification adjustments . . . . . . . . . . . . . . . . . . . . (504) (24,804) (20,025)Deferred income taxes . . . . . . . . . . . . . . . . . . . . . . . . . . . . . . . . . . . . . . . 346 10,380 8,692
Adjustments for year (after income tax effect) . . . . . . . . . . . . . . . . . . . . (158) (14,424) (11,333)
Balance at end of year . . . . . . . . . . . . . . . . . . . . . . . . . . . . . . . . . . . . . . . . . . . ¥ 140,446 ¥258,922 ¥ 216,099
Foreign Currency Translation Adjustments:Balance at beginning of year . . . . . . . . . . . . . . . . . . . . . . . . . . . . . . . . . . . . . . ¥ (9,409) ¥ (83,279) ¥(142,787)
Pre-tax amount of translation adjustments . . . . . . . . . . . . . . . . . . . . . . . (145,615) 81,801 72,072Deferred income taxes . . . . . . . . . . . . . . . . . . . . . . . . . . . . . . . . . . . . . . . 18,439 (9,385) (15,578)
Adjustments for year (after income tax effect) . . . . . . . . . . . . . . . . . . . . (127,176) 72,416 56,494
Pre-tax amount of reclassification adjustments . . . . . . . . . . . . . . . . . . . . 1,267 2,780 2,961Deferred income taxes . . . . . . . . . . . . . . . . . . . . . . . . . . . . . . . . . . . . . . . 122 (1,326) 53
Adjustments for year (after income tax effect) . . . . . . . . . . . . . . . . . . . . 1,389 1,454 3,014
Balance at end of year . . . . . . . . . . . . . . . . . . . . . . . . . . . . . . . . . . . . . . . . . . . ¥(135,196) ¥ (9,409) ¥ (83,279)
Minimum Pension Liability Adjustment:Balance at beginning of year . . . . . . . . . . . . . . . . . . . . . . . . . . . . . . . . . . . . . . — ¥ (5,417) ¥ (5,691)
Pre-tax amount . . . . . . . . . . . . . . . . . . . . . . . . . . . . . . . . . . . . . . . . . . . . . — 1,593 182Deferred income taxes . . . . . . . . . . . . . . . . . . . . . . . . . . . . . . . . . . . . . . . — (535) 92
Adjustments for year (after income tax effect) . . . . . . . . . . . . . . . . . . . . — 1,058 274
Pre-tax amount of adjustment to initially apply SFAS No. 158 . . . . . . . — 7,544 —Deferred income taxes . . . . . . . . . . . . . . . . . . . . . . . . . . . . . . . . . . . . . . . — (3,185) —
Adjustments for year (after income tax effect) . . . . . . . . . . . . . . . . . . . . — 4,359 —
Balance at end of year . . . . . . . . . . . . . . . . . . . . . . . . . . . . . . . . . . . . . . . . . . . — — ¥ (5,417)
Defined Benefit Pension Plans:Balance at beginning of year . . . . . . . . . . . . . . . . . . . . . . . . . . . . . . . . . . . . . . ¥ 2,287 — —
Pre-tax amount of defined benefit pension plan . . . . . . . . . . . . . . . . . . . (58,934) — —Deferred income taxes . . . . . . . . . . . . . . . . . . . . . . . . . . . . . . . . . . . . . . . 24,181 — —
Adjustments for year (after income tax effect) . . . . . . . . . . . . . . . . . . . . (34,753) — —
Pre-tax amount of reclassification adjustments . . . . . . . . . . . . . . . . . . . . 519 — —Deferred income taxes . . . . . . . . . . . . . . . . . . . . . . . . . . . . . . . . . . . . . . . (213) — —
Adjustments for year (after income tax effect) . . . . . . . . . . . . . . . . . . . . 306 — —
Pre-tax amount of adjustment to initially apply SFAS No. 158 . . . . . . . — ¥ 4,121 —Deferred income taxes . . . . . . . . . . . . . . . . . . . . . . . . . . . . . . . . . . . . . . . — (1,834) —
Adjustments for year (after income tax effect) . . . . . . . . . . . . . . . . . . . . — 2,287 —
Balance at end of year . . . . . . . . . . . . . . . . . . . . . . . . . . . . . . . . . . . . . . . . . . . ¥ (32,160) ¥ 2,287 —
F-57

Notes to Consolidated Financial Statements—(Continued)
Mitsui & Co., Ltd. and subsidiaries
Millions of Yen
2008 2007 2006
Net Unrealized Gains and Losses on Derivatives:Balance at beginning of year . . . . . . . . . . . . . . . . . . . . . . . . . . . . . . . . . . . . . . . . ¥ 8,930 ¥ 2,439 ¥ (1,252)
Pre-tax amount of net unrealized gains and losses on derivatives . . . . . . . . (3,403) 3,388 (12,580)Deferred income taxes . . . . . . . . . . . . . . . . . . . . . . . . . . . . . . . . . . . . . . . . . 13 447 5,863
Adjustments for year (after income tax effect) . . . . . . . . . . . . . . . . . . . . . . (3,390) 3,835 (6,717)
Pre-tax amount of reclassification adjustments . . . . . . . . . . . . . . . . . . . . . . (6,139) 4,289 17,538Deferred income taxes . . . . . . . . . . . . . . . . . . . . . . . . . . . . . . . . . . . . . . . . . 1,734 (1,633) (7,130)
Adjustments for year (after income tax effect) . . . . . . . . . . . . . . . . . . . . . . (4,405) 2,656 10,408
Balance at end of year . . . . . . . . . . . . . . . . . . . . . . . . . . . . . . . . . . . . . . . . . . . . . ¥ 1,135 ¥ 8,930 ¥ 2,439
Accumulated Other Comprehensive Income (Loss)—Total:Balance at beginning of year . . . . . . . . . . . . . . . . . . . . . . . . . . . . . . . . . . . . . . . . ¥ 260,730 ¥129,842 ¥ (49,551)
Pre-tax amount . . . . . . . . . . . . . . . . . . . . . . . . . . . . . . . . . . . . . . . . . . . . . . . (416,728) 192,978 277,664Deferred income taxes . . . . . . . . . . . . . . . . . . . . . . . . . . . . . . . . . . . . . . . . . 130,223 (68,736) (98,271)
Other comprehensive income (loss) for year (after income tax effect) . . . . (286,505) 124,242 179,393
Pre-tax amount of adjustment to initially apply SFAS No. 158 . . . . . . . . . . — 11,665 —Deferred income taxes . . . . . . . . . . . . . . . . . . . . . . . . . . . . . . . . . . . . . . . . . — (5,019) —
Adjustments to initially apply SFAS No. 158 (after income tax effect) . . . — 6,646 —
Balance at end of year . . . . . . . . . . . . . . . . . . . . . . . . . . . . . . . . . . . . . . . . . . . . . ¥ (25,775) ¥260,730 ¥129,842
16. NET INCOME PER SHARE
The following is a reconciliation of basic net income per share to diluted net income per share for the yearsended March 31, 2008, 2007 and 2006:
2008 2007 2006
Net income(numerator)
Shares(denominator)
Per shareamount
Net income(numerator)
Shares(denominator)
Per shareamount
Net income(numerator)
Shares(denominator)
Per shareamount
Millions ofYen
InThousands Yen
Millions ofYen
InThousands Yen
Millions ofYen
InThousands Yen
Basic Net Income per Share:Income from continuing
operations . . . . . . . . . . . . . . . ¥339,077 1,804,877 ¥187.87 ¥299,126 1,730,214 ¥172.88 ¥215,067 1,603,096 ¥134.16Income (loss) from
discontinued operations—net(after income tax effect) . . . . 70,984 1,804,877 39.33 2,376 1,730,214 1.38 (12,658) 1,603,096 (7.90)
Net income available tocommon shareholders . . . . . . 410,061 1,804,877 227.20 301,502 1,730,214 174.26 202,409 1,603,096 126.26
Effect of Dilutive Securities:Convertible bonds . . . . . . . . . . 76 19,379 413 96,004 587 104,855
Diluted Net Income perShare:
Income from continuingoperations . . . . . . . . . . . . . . . 339,153 1,824,256 185.91 299,539 1,826,218 164.02 215,654 1,707,951 126.26
Income (loss) fromdiscontinued operations—net(after income tax effect) . . . . 70,984 1,824,256 38.91 2,376 1,826,218 1.30 (12,658) 1,707,951 (7.41)
Net income available tocommon shareholders aftereffect of dilutivesecurities . . . . . . . . . . . . . . . . ¥410,137 1,824,256 ¥224.82 ¥301,915 1,826,218 ¥165.32 ¥202,996 1,707,951 ¥118.85
F-58

Notes to Consolidated Financial Statements—(Continued)
Mitsui & Co., Ltd. and subsidiaries
17. SEGMENT INFORMATION
SFAS No. 131, “Disclosures about Segments of an Enterprise and Related Information,” requires disclosureof financial and descriptive information about operating segments, which are components of an enterprise whoseoperating results are regularly reviewed by the enterprise’s chief operating decision maker in deciding aboutresources to be allocated to the segment and assessing its performance.
The business units of the companies’ Head Office, which are organized based on “products and services,”plan overall and worldwide strategies for their products and services and conduct their worldwide operations.The business units also collaborate with the regional business units in planning and executing their strategies forproducts and regions. The regional business units are delegated the business of their regions as the centers ofeach particular regional strategy and operate diversified business together with their subsidiaries and associatedcompanies in collaboration with the business units.
Therefore, the companies’ operating segments consist of product-focused operating segments comprised ofthe business units of the Head Office and region-focused operating segments comprised of the regional businessunits. The companies’ operating segments have been aggregated based on the nature of the products and othercriteria into eight product-focused reportable operating segments and three region-focused reportable operatingsegments, totaling eleven reportable operating segments.
In order to develop the strategy of the whole energy businesses and pursue the synergy among energybusinesses, the companies reviewed the “Energy” and “Iron & Steel Raw Materials and Non-Ferrous Metals”segments, and transferred coal mining, nuclear fuel and other businesses which were formerly included in“Iron & Steel Raw Materials and Non-Ferrous Metals” to “Energy.” “Iron & Steel Raw Materials andNon-Ferrous Metals” has been renamed and presented as “Mineral & Metal Resources.”
Also, positioning the consumer service businesses as one of the companies’ strengthening business area, thecompanies integrated the lifestyle businesses with the consumer service businesses in order to develop consumer-oriented businesses and strengthen related marketing and logistics business. The former “Lifestyle, ConsumerService and Information, Electronics & Telecommunication” has been renamed and presented as “ConsumerService & IT.”
In addition, the companies refined the regional business unit system and redesigned the regional businessunit system to strengthen our global strategy in the wide economic zones of Americas, Europe and Asia. Basedon this refinement, subsidiaries in Oceania which were formerly included in “Other Overseas Areas” wereintegrated to “Asia” and presented as “Asia Pacific.” Also, subsidiaries in the Middle East, Africa and Russiawhich were formerly included in “Other Overseas Areas” were combined to “Europe” and presented as “Europe,the Middle East and Africa.”
The operating segment information for the year ended March 31, 2007 and 2006 have been restated toconform to the current year presentation.
A description of reportable operating segments of the Company follows.
Iron & Steel Products manufactures, sells and trades iron & steel products in Japan and abroad.
Mineral & Metal Resources develops raw material resources of iron and non-ferrous metals in foreigncountries, and manufactures, sells and trades raw materials and metal products in Japan and abroad.
F-59

Notes to Consolidated Financial Statements—(Continued)
Mitsui & Co., Ltd. and subsidiaries
Machinery & Infrastructure Projects is engaged in the manufacture, sale and trade of machinery products,leasing, financing and promotion of certain projects such as plant constructions and infrastructure buildings inJapan and abroad.
Chemical manufactures, sells and trades chemical products in Japan and abroad.
Energy develops energy resources overseas and manufactures, sells and trades oil, gas and related productsin Japan and abroad.
Foods & Retail manufactures, sells and trades foods and provides support service to large retailers in Japanand abroad.
Consumer Service & IT manufactures, sells and trades textiles and IT products for consumer, and isengaged in consumer-related business such as media & information, outsourcing business and real estatebusiness in Japan and abroad.
Logistics & Financial Markets engages in logistics services, insurance and financial businesses in Japan andabroad.
Americas, Europe, the Middle East and Africa, and Asia Pacific trade in various commodities and conductrelated business led by overseas trading subsidiaries or offices located in each region.
F-60

Notes to Consolidated Financial Statements—(Continued)
Mitsui & Co., Ltd. and subsidiaries
The companies’ operating segment information, product information and geographic area information forthe years ended March 31, 2008, 2007 and 2006 presented in conformity with SFAS No. 131 are as follows:
OPERATING SEGMENT INFORMATION
Millions of Yen
Year endedMarch 31, 2008:
Iron &Steel
Products
Mineral &Metal
Resources
Machinery &Infrastructure
Projects Chemical EnergyFoods &
Retail
ConsumerService &
IT
Logistics &FinancialMarkets
Total trading transactions: . . . . . ¥1,495,085 ¥1,528,024 ¥2,530,804 ¥2,622,360 ¥2,644,288 ¥2,009,870 ¥1,148,823 ¥171,967
Gross profit . . . . . . . . . . . . . . . . ¥ 61,344 ¥ 95,765 ¥ 134,090 ¥ 110,261 ¥ 219,267 ¥ 81,229 ¥ 116,657 ¥ 55,142
Operating income (loss) . . . . . . ¥ 25,600 ¥ 78,970 ¥ 31,999 ¥ 46,178 ¥ 172,455 ¥ 16,584 ¥ 18,967 ¥ 20,879
Equity in earnings (losses) ofassociated companies . . . . . . ¥ 4,901 ¥ 71,216 ¥ 20,293 ¥ 5,819 ¥ 36,838 ¥ 3,092 ¥ 8,197 ¥ (1,858)
Net income (loss) . . . . . . . . . . . ¥ 20,238 ¥ 177,026 ¥ 35,000 ¥ 18,428 ¥ 124,084 ¥ 10,440 ¥ 12,037 ¥ 7,526
Total assets at March 31,2008 . . . . . . . . . . . . . . . . . . . ¥ 632,329 ¥ 916,150 ¥1,563,228 ¥ 818,680 ¥1,668,655 ¥ 675,253 ¥ 760,764 ¥797,341
Investments in and advances toassociated companies atMarch 31, 2008 . . . . . . . . . . . ¥ 25,557 ¥ 388,762 ¥ 375,005 ¥ 42,944 ¥ 153,974 ¥ 63,098 ¥ 122,976 ¥ 29,113
Depreciation andamortization . . . . . . . . . . . . . ¥ 2,125 ¥ 8,519 ¥ 10,109 ¥ 9,920 ¥ 72,987 ¥ 6,232 ¥ 6,097 ¥ 3,809
Additions to property leased toothers and property andequipment . . . . . . . . . . . . . . . ¥ 4,397 ¥ 27,927 ¥ 58,710 ¥ 8,387 ¥ 125,652 ¥ 7,442 ¥ 18,406 ¥ 2,891
Millions of Yen
Year endedMarch 31, 2008: Americas
Europe, theMiddle Eastand Africa
AsiaPacific Total All Other
Adjustmentsand
EliminationsConsolidated
Total
Total trading transactions: . . . . . . . . . . . . . . ¥1,625,587 ¥514,190 ¥721,112 ¥17,012,110 ¥ 6,758 ¥ (9,812) ¥17,009,056
Gross profit . . . . . . . . . . . . . . . . . . . . . . . . . ¥ 54,047 ¥ 26,784 ¥ 33,074 ¥ 987,660 ¥ 5,532 ¥ (5,115) ¥ 988,077
Operating income (loss) . . . . . . . . . . . . . . . . ¥ 1,981 ¥ 1,768 ¥ 7,616 ¥ 422,997 ¥ (1,375) ¥ (46,794) ¥ 374,828
Equity in earnings (losses) of associatedcompanies . . . . . . . . . . . . . . . . . . . . . . . . . ¥ 5,021 ¥ 327 ¥ 1,072 ¥ 154,918 ¥ 71 ¥ (721) ¥ 154,268
Net income (loss) . . . . . . . . . . . . . . . . . . . . . ¥ 4,283 ¥ 5,011 ¥ 22,518 ¥ 436,591 ¥ (7,101) ¥ (19,429) ¥ 410,061
Total assets at March 31, 2008 . . . . . . . . . . . ¥ 635,570 ¥205,712 ¥360,508 ¥ 9,034,190 ¥2,831,483 ¥(2,174,794) ¥ 9,690,879
Investments in and advances to associatedcompanies at March 31, 2008 . . . . . . . . . ¥ 36,654 ¥ 25,509 ¥ 53,520 ¥ 1,317,112 ¥ 3,230 ¥ 12,700 ¥ 1,333,042
Depreciation and amortization . . . . . . . . . . . ¥ 6,498 ¥ 1,174 ¥ 795 ¥ 128,265 ¥ 786 ¥ 10,277 ¥ 139,328
Additions to property leased to others andproperty and equipment . . . . . . . . . . . . . . ¥ 15,299 ¥ 1,417 ¥ 1,063 ¥ 271,591 ¥ 1,378 ¥ 9,092 ¥ 282,061
F-61

Notes to Consolidated Financial Statements—(Continued)
Mitsui & Co., Ltd. and subsidiaries
Millions of Yen
Year endedMarch 31, 2007(As restated):
Iron &Steel
Products
Mineral &Metal
Resources
Machinery &Infrastructure
Projects Chemical EnergyFoods &
Retail
ConsumerService &
IT
Logistics &FinancialMarkets
Total trading transactions: . . . . . ¥1,398,061 ¥1,469,063 ¥2,224,749 ¥2,392,268 ¥2,038,054 ¥1,917,825 ¥1,457,175 ¥180,437
Gross profit . . . . . . . . . . . . . . . . ¥ 57,766 ¥ 110,974 ¥ 108,003 ¥ 103,073 ¥ 123,871 ¥ 81,336 ¥ 129,983 ¥ 60,489
Operating income (loss) . . . . . . ¥ 25,582 ¥ 91,294 ¥ 20,861 ¥ 35,342 ¥ 81,326 ¥ 10,924 ¥ 20,344 ¥ 24,199
Equity in earnings of associatedcompanies . . . . . . . . . . . . . . . ¥ 3,121 ¥ 60,313 ¥ 21,429 ¥ 4,933 ¥ 44,394 ¥ 3,789 ¥ 8,661 ¥ 1,960
Net income (loss) . . . . . . . . . . . ¥ 20,559 ¥ 98,354 ¥ 33,557 ¥ 19,327 ¥ 75,658 ¥ (12,304) ¥ 16,605 ¥ 14,631
Total assets at March 31,2007 . . . . . . . . . . . . . . . . . . . ¥ 663,682 ¥ 912,596 ¥1,643,151 ¥ 949,091 ¥1,733,630 ¥ 696,062 ¥ 861,501 ¥681,294
Investments in and advances toassociated companies atMarch 31, 2007 . . . . . . . . . . . ¥ 22,014 ¥ 264,364 ¥ 383,233 ¥ 46,226 ¥ 558,650 ¥ 57,013 ¥ 112,686 ¥ 33,898
Depreciation andamortization . . . . . . . . . . . . . ¥ 1,826 ¥ 6,832 ¥ 8,379 ¥ 9,017 ¥ 29,644 ¥ 6,757 ¥ 7,661 ¥ 3,326
Additions to property leased toothers and property andequipment . . . . . . . . . . . . . . . ¥ 3,311 ¥ 21,357 ¥ 102,373 ¥ 12,718 ¥ 142,792 ¥ 5,455 ¥ 19,249 ¥ 6,277
Millions of Yen
Year endedMarch 31, 2007(As restated): Americas
Europe, theMiddle Eastand Africa
AsiaPacific Total All Other
Adjustmentsand
EliminationsConsolidated
Total
Total trading transactions: . . . . . . . . . . . . . . ¥1,167,527 ¥478,515 ¥623,879 ¥15,347,553 ¥ 7,250 ¥ (83,154) ¥15,271,649
Gross profit . . . . . . . . . . . . . . . . . . . . . . . . . ¥ 64,704 ¥ 25,447 ¥ 30,678 ¥ 896,324 ¥ 4,344 ¥ (34,377) ¥ 866,291
Operating income (loss) . . . . . . . . . . . . . . . . ¥ 21,348 ¥ 2,945 ¥ 9,508 ¥ 343,673 ¥ (4,353) ¥ (56,519) ¥ 282,801
Equity in earnings of associatedcompanies . . . . . . . . . . . . . . . . . . . . . . . . . ¥ 3,845 ¥ 300 ¥ 695 ¥ 153,440 ¥ 121 ¥ (467) ¥ 153,094
Net income (loss) . . . . . . . . . . . . . . . . . . . . . ¥ 16,917 ¥ 4,136 ¥ 22,001 ¥ 309,441 ¥ 5,845 ¥ (13,784) ¥ 301,502
Total assets at March 31, 2007 . . . . . . . . . . . ¥ 464,849 ¥199,122 ¥360,117 ¥ 9,165,095 ¥2,882,791 ¥(2,234,574) ¥ 9,813,312
Investments in and advances to associatedcompanies at March 31, 2007 . . . . . . . . . ¥ 39,036 ¥ 14,918 ¥ 44,120 ¥ 1,576,158 ¥ 10,456 ¥ 957 ¥ 1,587,571
Depreciation and amortization . . . . . . . . . . . ¥ 4,635 ¥ 1,023 ¥ 701 ¥ 79,801 ¥ 1,101 ¥ 7,043 ¥ 87,945
Additions to property leased to others andproperty and equipment . . . . . . . . . . . . . . ¥ 4,594 ¥ 1,151 ¥ 621 ¥ 319,898 ¥ 1,927 ¥ 5,531 ¥ 327,356
F-62

Notes to Consolidated Financial Statements—(Continued)
Mitsui & Co., Ltd. and subsidiaries
Millions of Yen
Year endedMarch 31, 2006(As restated):
Iron &Steel
Products
Mineral &Metal
Resources
Machinery &Infrastructure
Projects Chemical EnergyFoods &
Retail
ConsumerService &
IT
Logistics &FinancialMarkets
Total trading transactions: . . . . . . . . . . . ¥1,366,834 ¥1,419,314 ¥2,472,604 ¥2,087,042 ¥2,009,768 ¥1,849,850 ¥1,464,310 ¥116,178
Gross profit . . . . . . . . . . . . . . . . . . . . . . ¥ 54,386 ¥ 88,515 ¥ 90,557 ¥ 97,779 ¥ 106,991 ¥ 79,941 ¥ 128,438 ¥ 51,378
Operating income (loss) . . . . . . . . . . . . ¥ 26,459 ¥ 68,504 ¥ 21,702 ¥ 34,004 ¥ 70,736 ¥ 9,151 ¥ 24,989 ¥ 17,554
Equity in earnings (losses) ofassociated companies . . . . . . . . . . . . ¥ 2,943 ¥ 27,974 ¥ 14,571 ¥ 3,233 ¥ 34,581 ¥ 3,472 ¥ 3,485 ¥ 3,951
Net income (loss) . . . . . . . . . . . . . . . . . ¥ 19,354 ¥ 44,772 ¥ 30,581 ¥ 12,068 ¥ 50,824 ¥ (3,214)¥ 17,517 ¥ 13,384
Total assets at March 31, 2006 . . . . . . . ¥ 563,596 ¥ 704,156 ¥1,309,180 ¥ 866,796 ¥1,249,418 ¥ 721,222 ¥ 821,315 ¥750,748
Investments in and advances toassociated companies at March 31,2006 . . . . . . . . . . . . . . . . . . . . . . . . . ¥ 22,779 ¥ 223,328 ¥ 290,444 ¥ 49,456 ¥ 482,004 ¥ 54,813 ¥ 93,855 ¥ 26,010
Depreciation and amortization . . . . . . . ¥ 2,106 ¥ 6,054 ¥ 6,962 ¥ 9,490 ¥ 11,251 ¥ 8,134 ¥ 9,040 ¥ 3,333
Additions to property leased to othersand property and equipment . . . . . . . ¥ 2,614 ¥ 19,614 ¥ 84,253 ¥ 10,792 ¥ 59,301 ¥ 10,336 ¥ 37,396 ¥ 2,923
Millions of Yen
Year endedMarch 31, 2006(As restated): Americas
Europe, theMiddle Eastand Africa Asia Pacific Total All Other
Adjustmentsand
EliminationsConsolidated
Total
Total trading transactions: . . . . . . . . . . . . . . . . . ¥1,108,931 ¥440,601 ¥549,806 ¥14,885,238 ¥ 7,869 ¥ (96,572) ¥14,796,535
Gross profit . . . . . . . . . . . . . . . . . . . . . . . . . . . . ¥ 61,588 ¥ 24,276 ¥ 30,410 ¥ 814,259 ¥ 7,122 ¥ (36,817) ¥ 784,564
Operating income (loss) . . . . . . . . . . . . . . . . . . ¥ 21,723 ¥ 4,738 ¥ 11,248 ¥ 310,808 ¥ (3,208) ¥ (59,877) ¥ 247,723
Equity in earnings (losses) of associatedcompanies . . . . . . . . . . . . . . . . . . . . . . . . . . . ¥ 2,126 ¥ (174) ¥ 754 ¥ 96,916 ¥ 301 ¥ (3,035) ¥ 94,182
Net income (loss) . . . . . . . . . . . . . . . . . . . . . . . . ¥ 12,652 ¥ 5,040 ¥ 22,800 ¥ 225,778 ¥ 11,835 ¥ (35,204) ¥ 202,409
Total assets at March 31, 2006 . . . . . . . . . . . . . ¥ 455,615 ¥ 77,365 ¥240,143 ¥ 7,759,554 ¥2,749,439 ¥(1,935,415) ¥ 8,573,578
Investments in and advances to associatedcompanies at March 31, 2006 . . . . . . . . . . . . ¥ 9,714 ¥ 10,039 ¥ 23,885 ¥ 1,286,327 ¥ 12,570 ¥ 1,690 ¥ 1,300,587
Depreciation and amortization . . . . . . . . . . . . . ¥ 4,734 ¥ 946 ¥ 626 ¥ 62,676 ¥ 1,087 ¥ 4,014 ¥ 67,777
Additions to property leased to others andproperty and equipment . . . . . . . . . . . . . . . . . ¥ 9,747 ¥ 1,669 ¥ 654 ¥ 239,299 ¥ 4,561 ¥ 3,194 ¥ 247,054
Notes: (1) The figures of “Consolidated Total” for the years ended March 31, 2007 and 2006 have been reclassified to conform to thechange in current year presentation for discontinued operations in accordance with SFAS No. 144. The reclassification toincome (loss) from discontinued operations—net (after income tax effect) is included in “Adjustments and Eliminations.”
(2) “All Other” includes business activities which primarily provide services, such as financing services and operations services toexternal customers and/or to the companies and associated companies. Total assets of “All Other” at March 31, 2008, 2007and 2006 consisted primarily of cash and cash equivalents and time deposits related to financing activities, and assets ofcertain subsidiaries related to the above services.
(3) Net loss of “Adjustments and Eliminations” includes income and expense items that are not allocated to specific reportableoperating segments, such as certain expenses of the corporate departments, and eliminations of intersegment transactions.Net loss of “Adjustments and Eliminations” for the year ended March 31, 2008 includes (a) ¥23,487 million in general andadministrative expenses of the corporate departments excluding pension costs, (b) a charge of ¥2,228 million for pensionrelated items, and (c) ¥4,361 million related to tax items includes an adjustment of a difference between actual tax rate andintercompany tax rate, and so on. (all amounts are after income tax effects)Net loss of “Adjustments and Eliminations” for the year ended March 31, 2007 includes (a) ¥19,284 million in general andadministrative expenses of the corporate departments excluding pension costs, (b) a charge of ¥1,226 million for pensionrelated items, and (c) ¥3,846 million related to tax items includes an adjustment of a difference between actual tax rate andintercompany tax rate, and so on. (all amounts are after income tax effects)
F-63

Notes to Consolidated Financial Statements—(Continued)
Mitsui & Co., Ltd. and subsidiaries
Net loss of “Adjustments and Eliminations” for the year ended March 31, 2006 includes (a) ¥19,738 million in general andadministrative expenses of the corporate departments excluding pension costs, (b) a charge of ¥12,873 million for thevaluation allowance for deferred tax assets as a result of reevaluation of realizability of deferred tax assets related toimpairment of investment securities and allowance for doubtful receivables, and (c) a charge of ¥1,047 million for pensionrelated items. (all amounts are after income tax effects)
(4) Transfers between operating segments are made at cost plus a markup.(5) Operating income (loss) reflects the companies’ (a) gross profit, (b) selling, general and administrative expenses, and
(c) provision for doubtful receivables, as presented in the Statements of Consolidated Income.
PRODUCT INFORMATION
Millions of Yen
Iron andSteel
Non-FerrousMetals Machinery
Electronics &Information Chemicals Energy
Year ended March 31, 2008:Revenues . . . . . . . . . . . . . . . . . . . . ¥801,290 ¥ 79,669 ¥478,205 ¥182,258 ¥1,318,579 ¥2,017,729
Year ended March 31, 2007 :Revenues . . . . . . . . . . . . . . . . . . . . ¥566,938 ¥ 99,880 ¥428,609 ¥178,829 ¥1,146,619 ¥1,633,254
Year ended March 31, 2006 :Revenues . . . . . . . . . . . . . . . . . . . . ¥481,211 ¥102,177 ¥350,656 ¥160,835 ¥ 886,670 ¥1,360,537
Millions of Yen
Foods TextilesGeneral
Merchandise
Property andService
BusinessConsolidated
Total
Year ended March 31, 2008:Revenues . . . . . . . . . . . . . . . . . . . . . . . . . . . . . . . . ¥572,561 ¥38,169 ¥40,494 ¥209,924 ¥5,738,878
Year ended March 31, 2007 :Revenues . . . . . . . . . . . . . . . . . . . . . . . . . . . . . . . . ¥466,968 ¥39,839 ¥50,320 ¥182,341 ¥4,793,597
Year ended March 31, 2006 :Revenues . . . . . . . . . . . . . . . . . . . . . . . . . . . . . . . . ¥424,634 ¥36,447 ¥61,607 ¥162,742 ¥4,027,516
Note: In accordance with SFAS No. 144, revenues from discontinued operations are eliminated from eachproduct amount and “Consolidated Total.” The figures for the years ended March 31, 2007 and 2006 havebeen reclassified to conform to the current year presentation.
GEOGRAPHIC AREA INFORMATION
Millions of Yen
JapanUnitedStates China All Other
ConsolidatedTotal
Year ended March 31, 2008:Total trading transactions . . . . . . . . . . . . . . ¥9,285,913 ¥1,323,829 ¥1,119,083 ¥5,280,231 ¥17,009,056
Year ended March 31, 2007:Total trading transactions . . . . . . . . . . . . . . ¥8,903,099 ¥1,159,063 ¥ 885,324 ¥4,324,163 ¥15,271,649
Year ended March 31, 2006 :Total trading transactions . . . . . . . . . . . . . . ¥8,521,716 ¥1,245,168 ¥ 867,068 ¥4,162,583 ¥14,796,535
F-64

Notes to Consolidated Financial Statements—(Continued)
Mitsui & Co., Ltd. and subsidiaries
Notes: (1) Total trading transactions are attributed to countries based on the location of customers.(2) The Company provides total trading transactions instead of revenues, as certain costs related to
revenues presented net in accordance with EITF No. 99-19 are not attributed to countries based onthe location of customers.
(3) In accordance with SFAS No. 144, total trading transactions from discontinued operations areeliminated from each geographic area amount and “Consolidated Total.” The figures for the yearsended March 31, 2007 and 2006 have been reclassified to conform to the current year presentation.
Millions of Yen
Japan AustraliaUnitedStates All Other
ConsolidatedTotal
At March 31, 2008:Long-lived assets . . . . . . . . . . . . . . . . . . . . . . . . . . . . ¥489,269 ¥353,521 ¥150,517 ¥207,475 ¥1,200,782
At March 31, 2007:Long-lived assets . . . . . . . . . . . . . . . . . . . . . . . . . . . . ¥481,198 ¥339,768 ¥162,292 ¥264,282 ¥1,247,540
At March 31, 2006:Long-lived assets . . . . . . . . . . . . . . . . . . . . . . . . . . . . ¥431,155 ¥243,969 ¥103,384 ¥186,244 ¥ 964,752
There were no individual material customers with respect to revenues for the years ended March 31, 2008,2007 and 2006.
18. SUPPLEMENTAL INCOME STATEMENT INFORMATION
Supplemental information related to the Statements of Consolidated Income is as follows:
Millions of Yen
2008 2007 2006
Depreciation of property and equipment . . . . . . . . . . . . . . . . . . . . . . . . . . . . . . . . ¥125,668 ¥77,617 ¥54,802Research and development expenses . . . . . . . . . . . . . . . . . . . . . . . . . . . . . . . . . . . 3,983 3,935 5,136Advertising expenses . . . . . . . . . . . . . . . . . . . . . . . . . . . . . . . . . . . . . . . . . . . . . . . 8,353 9,892 10,029Foreign exchange gains—net . . . . . . . . . . . . . . . . . . . . . . . . . . . . . . . . . . . . . . . . . 2,887 728 2,084
19. OTHER EXPENSE (INCOME)—NET
Other expense (income)—net for the years ended March 31, 2008, 2007 and 2006 consists of the following:
Millions of Yen
2008 2007 2006
Exploration expenses . . . . . . . . . . . . . . . . . . . . . . . . . . . . . . . . . . . . . . . . . . . . . . . . . ¥10,279 ¥ 1,165 ¥ 1,990Foreign exchange losses—net . . . . . . . . . . . . . . . . . . . . . . . . . . . . . . . . . . . . . . . . . . 1,288 4,042 1,772Litigation charges . . . . . . . . . . . . . . . . . . . . . . . . . . . . . . . . . . . . . . . . . . . . . . . . . . . 664 455 69Restructuring-related charges . . . . . . . . . . . . . . . . . . . . . . . . . . . . . . . . . . . . . . . . . . — 1,939 1,404Other . . . . . . . . . . . . . . . . . . . . . . . . . . . . . . . . . . . . . . . . . . . . . . . . . . . . . . . . . . . . . (9,270) (7,135) (7,233)
Total . . . . . . . . . . . . . . . . . . . . . . . . . . . . . . . . . . . . . . . . . . . . . . . . . . . . . . . . . . ¥ 2,961 ¥ 466 ¥(1,998)
Note: In accordance with SFAS No. 144, the expense and/or income from discontinued operations, if any, iseliminated from each line item presented in the above table. The figures for the years ended March 31,2007 and 2006 have been reclassified to conform to the current year presentation.
F-65

Notes to Consolidated Financial Statements—(Continued)
Mitsui & Co., Ltd. and subsidiaries
20. INCOME TAXES
Income taxes in Japan applicable to the companies, imposed by the national, prefectural and municipalgovernments, in the aggregate resulted in normal effective statutory tax rates of approximately 41% for the yearsended March 31, 2008, 2007 and 2006. Foreign subsidiaries are subject to income taxes of the countries in whichthey operate.
A reconciliation between the normal statutory tax rate in Japan applied to income from continuingoperations and the effective income tax rate on income from continuing operations for the years ended March 31,2008, 2007 and 2006 is summarized as follows:
%
2008 2007 2006
Normal statutory tax rate in Japan applied to income from continuing operationsbefore income taxes, minority interests and equity in earnings . . . . . . . . . . . . . . 41.0% 41.0% 41.0%
Increases (decreases) in tax rate resulting from:Expenses not deductible for tax purposes and income not taxable—net . . . . . 0.3 1.4 1.2Application of lower tax rates to certain taxable income . . . . . . . . . . . . . . . . . (8.8) (6.8) (4.5)Effect of taxation on dividends . . . . . . . . . . . . . . . . . . . . . . . . . . . . . . . . . . . . . 1.1 4.0 10.8Changes in valuation allowance—net . . . . . . . . . . . . . . . . . . . . . . . . . . . . . . . . 3.2 5.0 1.0Higher tax rates for resource related taxes . . . . . . . . . . . . . . . . . . . . . . . . . . . . 6.6 1.9 0.8Other—net . . . . . . . . . . . . . . . . . . . . . . . . . . . . . . . . . . . . . . . . . . . . . . . . . . . . (0.8) 0.5 (0.4)
Effective income tax rate on income from continuing operations . . . . . . 42.6% 47.0% 49.9%
Amounts provided for income taxes for the years ended March 31, 2008, 2007 and 2006 are allocated asfollows:
Millions of Yen
2008 2007 2006
Income taxes on income from continuing operations . . . . . . . . . . . . . . . . . . . . ¥ 171,237 ¥145,268 ¥134,078Income (loss) from discontinued operations—net . . . . . . . . . . . . . . . . . . . . . . 48,813 15,581 (9,502)Equity in earnings of associated companies . . . . . . . . . . . . . . . . . . . . . . . . . . . 60,030 59,553 46,634Other comprehensive (loss) income . . . . . . . . . . . . . . . . . . . . . . . . . . . . . . . . . (130,223) 68,736 98,271Adjustment to initially apply SFAS No. 158 . . . . . . . . . . . . . . . . . . . . . . . . . . — 5,019 —
Total . . . . . . . . . . . . . . . . . . . . . . . . . . . . . . . . . . . . . . . . . . . . . . . . . . . . . ¥ 149,857 ¥294,157 ¥269,481
F-66

Notes to Consolidated Financial Statements—(Continued)
Mitsui & Co., Ltd. and subsidiaries
The tax effects of significant temporary differences and carryforwards which result in deferred tax assetsand liabilities at March 31, 2008 and 2007 are as follows:
Millions of Yen
2008 2007
Deferred Tax Assets:Accrued pension costs and liability for severance indemnities . . . . . . . . . . . . . . . . . . . . . ¥ 13,754 —Allowance for doubtful receivables . . . . . . . . . . . . . . . . . . . . . . . . . . . . . . . . . . . . . . . . . . 11,490 ¥ 24,219Estimated losses . . . . . . . . . . . . . . . . . . . . . . . . . . . . . . . . . . . . . . . . . . . . . . . . . . . . . . . . . 20,073 23,446Impairment loss of long-lived assets . . . . . . . . . . . . . . . . . . . . . . . . . . . . . . . . . . . . . . . . . 34,990 28,396Loss carryforwards of subsidiaries and associated companies . . . . . . . . . . . . . . . . . . . . . . 67,862 87,950Foreign currency translation . . . . . . . . . . . . . . . . . . . . . . . . . . . . . . . . . . . . . . . . . . . . . . . . 15,526 8,244Tax credit carryforwards . . . . . . . . . . . . . . . . . . . . . . . . . . . . . . . . . . . . . . . . . . . . . . . . . . 10,917 9,024Other . . . . . . . . . . . . . . . . . . . . . . . . . . . . . . . . . . . . . . . . . . . . . . . . . . . . . . . . . . . . . . . . . . 25,075 15,348
Total deferred tax assets . . . . . . . . . . . . . . . . . . . . . . . . . . . . . . . . . . . . . . . . . . . . . . . 199,687 196,627Valuation allowance . . . . . . . . . . . . . . . . . . . . . . . . . . . . . . . . . . . . . . . . . . . . . . . . . . (79,817) (80,345)
Deferred tax assets—net . . . . . . . . . . . . . . . . . . . . . . . . . . . . . . . . . . . . . . . . . . . . . . . 119,870 116,282
Deferred Tax Liabilities:Accrued pension costs and liability for severance indemnities . . . . . . . . . . . . . . . . . . . . . — 8,264Property . . . . . . . . . . . . . . . . . . . . . . . . . . . . . . . . . . . . . . . . . . . . . . . . . . . . . . . . . . . . . . . 113,453 108,378Investment securities . . . . . . . . . . . . . . . . . . . . . . . . . . . . . . . . . . . . . . . . . . . . . . . . . . . . . 144,966 235,162Undistributed earnings . . . . . . . . . . . . . . . . . . . . . . . . . . . . . . . . . . . . . . . . . . . . . . . . . . . . 173,504 148,009Foreign currency translation . . . . . . . . . . . . . . . . . . . . . . . . . . . . . . . . . . . . . . . . . . . . . . . . 13,240 24,519Other . . . . . . . . . . . . . . . . . . . . . . . . . . . . . . . . . . . . . . . . . . . . . . . . . . . . . . . . . . . . . . . . . . 6,973 13,792
Deferred tax liabilities . . . . . . . . . . . . . . . . . . . . . . . . . . . . . . . . . . . . . . . . . . . . . . . . 452,136 538,124
Net deferred tax liabilities . . . . . . . . . . . . . . . . . . . . . . . . . . . . . . . . . . . . . . . . . . . . . ¥(332,266) ¥(421,842)
Net deferred tax liabilities at March 31, 2008 and 2007 are included in the Consolidated Balance Sheets asfollows:
Millions of Yen
2008 2007
Current assets—Deferred tax assets—current . . . . . . . . . . . . . . . . . . . . . . . . . . . . . . . . . . ¥ 37,766 ¥ 21,175Deferred tax assets—Non-current . . . . . . . . . . . . . . . . . . . . . . . . . . . . . . . . . . . . . . . . . . . 20,574 21,800Current liabilities—Other current liabilities . . . . . . . . . . . . . . . . . . . . . . . . . . . . . . . . . . . . (3,269) (14,636)Deferred tax liabilities—Non-current . . . . . . . . . . . . . . . . . . . . . . . . . . . . . . . . . . . . . . . . . (387,337) (450,181)
Net deferred tax liabilities . . . . . . . . . . . . . . . . . . . . . . . . . . . . . . . . . . . . . . . . . . . . . ¥(332,266) ¥(421,842)
The valuation allowance is provided principally on deferred tax assets for loss carryforwards of certainsubsidiaries where it is more likely than not that a tax benefit will not be realized. During the years endedMarch 31, 2008, 2007 and 2006, the valuation allowances were decreased by ¥528 million, increased by ¥5,363million and increased by ¥30,067 million, respectively. For the years ended March 31, 2008, 2007 and 2006,adjustments of the beginning-of-the-year balance of the valuation allowances attributable to continuingoperations were ¥376 million (profit), ¥1,297 million (loss) and ¥9,528 million (profit), respectively.
F-67

Notes to Consolidated Financial Statements—(Continued)
Mitsui & Co., Ltd. and subsidiaries
The tax benefits of operating loss carryforwards attributable to continuing operations for the years endedMarch 31, 2008, 2007 and 2006 were ¥2,886 million, ¥15,669 million and ¥26,887 million, respectively.
The amounts of undistributed earnings, which have been considered to be indefinitely reinvested intoforeign subsidiaries and foreign corporate joint ventures, and for which deferred tax liabilities have not beenrecognized, were ¥623,146 million and ¥443,227 million at March 31, 2008 and 2007, respectively.Determination of the amount of unrecognized deferred income taxes with respect to these foreign earnings is notpracticable. At March 31, 2008, certain subsidiaries had aggregate operating loss carryforwards of ¥132,424million, which are available to reduce taxable income in subsequent periods. If not utilized, such losscarryforwards expire as follows:
Millions of Yen
Within 5 years . . . . . . . . . . . . . . . . . . . . . . . . . . . . . . . . . . . . . . . . . . . . . . . . . . . . . . . . . . . . . . . . . . ¥ 42,740After 5 to 10 years . . . . . . . . . . . . . . . . . . . . . . . . . . . . . . . . . . . . . . . . . . . . . . . . . . . . . . . . . . . . . . . 39,526After 10 to 15 years . . . . . . . . . . . . . . . . . . . . . . . . . . . . . . . . . . . . . . . . . . . . . . . . . . . . . . . . . . . . . . 6,678After 15 years . . . . . . . . . . . . . . . . . . . . . . . . . . . . . . . . . . . . . . . . . . . . . . . . . . . . . . . . . . . . . . . . . . . 43,480
Total . . . . . . . . . . . . . . . . . . . . . . . . . . . . . . . . . . . . . . . . . . . . . . . . . . . . . . . . . . . . . . . . . . . . . . ¥132,424
At March 31, 2008, certain subsidiaries had aggregate tax credit carryforwards of ¥ 30,149 million. If notutilized, such tax credit carryforwards expire within 3 years.
Income from continuing operations before income taxes, minority interests and equity in earnings for theyears ended March 31, 2008, 2007 and 2006 comprised the following:
Millions of Yen
The Companyand its domestic
subsidiariesForeign
subsidiaries Total
Year ended March 31, 2008 . . . . . . . . . . . . . . . . . . . . . . . . . . . . . . . . . . ¥145,369 ¥256,635 ¥402,004
Year ended March 31, 2007 . . . . . . . . . . . . . . . . . . . . . . . . . . . . . . . . . . . . ¥105,333 ¥203,841 ¥309,174
Year ended March 31, 2006 . . . . . . . . . . . . . . . . . . . . . . . . . . . . . . . . . . . . ¥100,531 ¥168,142 ¥268,673
F-68

Notes to Consolidated Financial Statements—(Continued)
Mitsui & Co., Ltd. and subsidiaries
Income taxes on income from continuing operations for the years ended March 31, 2008, 2007 and 2006comprised the following:
Millions of Yen
The Companyand its domestic
subsidiariesForeign
subsidiaries Total
Year ended March 31, 2008:Current . . . . . . . . . . . . . . . . . . . . . . . . . . . . . . . . . . . . . . . . . . . . . . . . ¥81,902 ¥ 91,373 ¥173,275Deferred . . . . . . . . . . . . . . . . . . . . . . . . . . . . . . . . . . . . . . . . . . . . . . . 2,102 (4,140) (2,038)
Total . . . . . . . . . . . . . . . . . . . . . . . . . . . . . . . . . . . . . . . . . . . . . . ¥84,004 ¥ 87,233 ¥171,237
Year ended March 31, 2007:Current . . . . . . . . . . . . . . . . . . . . . . . . . . . . . . . . . . . . . . . . . . . . . . . . ¥55,044 ¥ 79,296 ¥134,340Deferred . . . . . . . . . . . . . . . . . . . . . . . . . . . . . . . . . . . . . . . . . . . . . . . 23,943 (13,015) 10,928
Total . . . . . . . . . . . . . . . . . . . . . . . . . . . . . . . . . . . . . . . . . . . . . . ¥78,987 ¥ 66,281 ¥145,268
Year ended March 31, 2006:Current . . . . . . . . . . . . . . . . . . . . . . . . . . . . . . . . . . . . . . . . . . . . . . . . ¥38,119 ¥ 60,512 ¥ 98,631Deferred . . . . . . . . . . . . . . . . . . . . . . . . . . . . . . . . . . . . . . . . . . . . . . . 41,880 (6,433) 35,447
Total . . . . . . . . . . . . . . . . . . . . . . . . . . . . . . . . . . . . . . . . . . . . . . ¥79,999 ¥ 54,079 ¥134,078
On April 1, 2007, the companies adopted the provisions of FIN No. 48. The cumulative effect of applyingthe provisions of FIN No. 48 was recorded as a decrease of ¥5,113 million to retained earnings—unappropriatedas of April 1, 2007.
A reconciliation of the beginning and ending amount of unrecognized tax benefits is as follows:
Millions of Yen
2008
Balance at beginning of year . . . . . . . . . . . . . . . . . . . . . . . . . . . . . . . . . . . . . . . . . . . . . . . . . . . . . . . ¥ 27,425Additions for tax positions of prior years . . . . . . . . . . . . . . . . . . . . . . . . . . . . . . . . . . . . . . . . . . . . . . 55Additions for tax positions of current year . . . . . . . . . . . . . . . . . . . . . . . . . . . . . . . . . . . . . . . . . . . . . 1,597Reductions for tax positions of prior years . . . . . . . . . . . . . . . . . . . . . . . . . . . . . . . . . . . . . . . . . . . . (20,121)Reductions due to lapse of statutes of limitation . . . . . . . . . . . . . . . . . . . . . . . . . . . . . . . . . . . . . . . . (136)Foreign currency translation adjustments and others . . . . . . . . . . . . . . . . . . . . . . . . . . . . . . . . . . . . . (477)
Balance at end of year . . . . . . . . . . . . . . . . . . . . . . . . . . . . . . . . . . . . . . . . . . . . . . . . . . . . . . . . . . . . ¥ 8,343
The total amounts of unrecognized tax benefits that, if recognized, would affect the effective tax rate as ofMarch 31, 2008 was approximately ¥8,318 million.
The companies recognize interest expense and penalties accrued related to uncertain tax positions in incometaxes—current. For the year ended March 31, 2008, the companies recognized a net reduction in interest expenseand penalties of ¥1,927 million. The companies had ¥386 million for the payment of interest and penaltiesaccrued as of March 31, 2008.
The Company was audited by the Tokyo Regional Taxation Bureau with regard to a transfer price taxationin connection with the LNG Project in Western Australia for the six fiscal years from the year ended March 31,
F-69
Notes to Consolidated Financial Statements—(Continued)
Mitsui & Co., Ltd. and subsidiaries
2000 to the year ended March 31, 2005. At the end of June 2007 and 2006, the Company received notices of taxassessment from the Tokyo Regional Taxation Bureau for the years ended March, 2001 and 2000. Based on thenotices of assessment, the taxable incomes were corrected by ¥8,224 million and ¥4,863 million, and theadditional tax liabilities for income taxes were ¥3,686 million and ¥2,375 million, respectively. The Companyhas paid the additional taxes. The Company disagrees with the assessment and registered its protest in August2006, and in addition, lodged an application in November 2006 for the mutual agreement procedure pursuant to aprovision in the tax treaty between Japan and Australia in order to settle the double taxation.
The Company believes that the amount of the correction for the years ended March 2001 and 2000 and thetax liabilities for the years ended March 31, 2002 or later, arising from the final correction, if any, will beaffected by the result of the mutual agreement procedure, which is still continuing. The effect of this matter wasrecorded in accordance with FIN No. 48 in the consolidated financial statements for the year ended March 31,2008.
It is reasonably possible that the situation of mutual agreement procedure may change within the next 12months, and the change could decrease the unrecognized tax benefits in an amount ranging from ¥0 million to¥5,584 million based on current estimates.
As of March 31, 2008, the earliest tax years that remain subject to examination by major tax jurisdictions inwhich the companies operate are the year ended March 31, 2000 for Japan, the year ended March 31, 2003 forthe United States of America, and the year ended March 31, 2000 for Australia.
21. COMPENSATION AND OTHER CHARGES RELATED TO DPF INCIDENT
The Company discovered in November 2004, that false data of a performance test were produced andsubmitted to authorities for diesel particulate filters (“DPF”s) manufactured by PUREarth Incorporated, whollyowned by the Company and was dissolved during the year ended March 31, 2007. The DPFs were subsidized bythe Tokyo Metropolitan Government and seven other prefectural and municipal governments, as well as theMinistry of Land, Infrastructure, Transport and Tourism, the Ministry of the Environment, and related industryassociations. The Company sold approximately 21,500 units of the product.
The Company has carried out a three-part user response plan, that involves: (1) the free replacement ofDPFs, (2) the reimbursement of the amount paid for purchasing the Company’s DPFs upon their redemptionfollowing the scrapping or resale of vehicles, and (3) support program for the purchase of alternative vehicles.The Company has completed recall of all DPFs except ones not-listed under the compensation plan andnot-needed to recall. In addition, the Company completed the full compensation of relevant subsidies during theyear ended March 31, 2006.
The Company recorded ¥36,000 million as compensation and other charges related to DPF incident in theStatements of Consolidated Income for the year ended March 31, 2005. Subsequently, the Company reviewed theexpected costs of each user response plan based on the changes of requests from users of the Company’s DPFs,and recorded an additional user response charge of ¥9,000 million for the year ended March 31, 2006. Since therecall of DPFs was completed in the year ended March 31, 2007, the estimated amount to be paid for thecompensation and other charges was substantially fixed. Therefore, during the year ended March 31, 2007, theCompany has recorded a credit to income of ¥3,864 million as a result of the reversal of the provision made inprior years.
F-70

Notes to Consolidated Financial Statements—(Continued)
Mitsui & Co., Ltd. and subsidiaries
22. CONTINGENT LIABILITIES
I. GUARANTEES
The table below summarizes the companies’ guarantees as defined in FIN No. 45 at March 31, 2008 and 2007.The maximum potential amount of future payments represents the amounts without consideration of possiblerecoveries under recourse provisions or from collateral held or pledged that the companies could be obliged to pay ifthere were defaults by guaranteed parties or there were changes in an underlying which would cause triggeringevents under market value guarantees and indemnification contracts. Such amounts bear no relationship to theanticipated losses on these guarantees and indemnifications, and they greatly exceed anticipated losses.
Millions of Yen
Expirewithin1 year
Expireafter
1 year
Totalamount
outstanding
Recourseprovisions/collateral
Maximumpotential
amount offuture
payments
Carryingamount ofliabilities
Expire nolater than
March 31, 2008:Type of guarantees:
Financial guarantees:Guarantees for third parties . . . . . . . . . . . ¥11,028 ¥ 65,021 ¥ 76,049 ¥17,912 ¥130,378 ¥ 470 2040Guarantees for associated companies . . . 23,152 49,399 72,551 2,172 77,686 2,494 2045Guarantees to financial institutions for
employees’ housing loans . . . . . . . . . . — 7,693 7,693 — 7,693 — 2033
Total . . . . . . . . . . . . . . . . . . . . . . . . . ¥34,180 ¥122,113 ¥156,293 ¥20,084 ¥215,757 ¥2,964
Performance guarantees . . . . . . . . . . . . . . . . . ¥ 6,906 ¥ 12,951 ¥ 19,857 ¥ 5,421 ¥ 19,857 ¥ 459 2013
Market value guarantees:Obligation to repurchase bills of
exchange . . . . . . . . . . . . . . . . . . . . . . . ¥56,335 ¥ 101 ¥ 56,436 ¥42,938 ¥ 56,436 — 2010Minimum purchase price guarantees . . . . — 10,290 10,290 — 10,290 — 2014
Total . . . . . . . . . . . . . . . . . . . . . . . . . ¥56,335 ¥ 10,391 ¥ 66,726 ¥42,938 ¥ 66,726 —
Derivative instruments . . . . . . . . . . . . . . . . . . ¥53,240 ¥ 29,775 ¥ 83,015 — ¥ 83,015 ¥ 645
Millions of Yen
Expirewithin1 year
Expireafter
1 year
Totalamount
outstanding
Recourseprovisions/collateral
Maximumpotential
amount offuture
payments
Carryingamount ofliabilities
Expire nolater than
March 31, 2007:Type of guarantees:
Financial guarantees:Guarantees for third parties . . . . . . . . . . . ¥12,405 ¥ 77,761 ¥ 90,166 ¥18,688 ¥116,559 ¥4,769 2040Guarantees for associated companies . . . 24,301 42,783 67,084 6,852 86,617 668 2022Guarantees to financial institutions for
employees’ housing loans . . . . . . . . . . — 9,408 9,408 — 9,408 — 2031
Total . . . . . . . . . . . . . . . . . . . . . . . . . ¥36,706 ¥129,952 ¥166,658 ¥25,540 ¥212,584 ¥5,437
Performance guarantees . . . . . . . . . . . . . . . . . ¥ 9,533 ¥ 15,464 ¥ 24,997 ¥ 5,045 ¥ 24,997 ¥ 414 2013
Market value guarantees:Obligation to repurchase bills of
exchange . . . . . . . . . . . . . . . . . . . . . . . ¥45,468 ¥ 6,065 ¥ 51,533 ¥42,263 ¥ 51,533 — 2009Minimum purchase price guarantees . . . . — 3,506 3,506 — 3,506 — 2013Residual value guarantees of leased
assets . . . . . . . . . . . . . . . . . . . . . . . . . . — 3,195 3,195 — 3,195 — 2008
Total . . . . . . . . . . . . . . . . . . . . . . . . . ¥45,468 ¥ 12,766 ¥ 58,234 ¥42,263 ¥ 58,234 —
Derivative instruments . . . . . . . . . . . . . . . . . . ¥30,109 ¥ 10,434 ¥ 40,543 — ¥ 40,543 ¥2,396
F-71

Notes to Consolidated Financial Statements—(Continued)
Mitsui & Co., Ltd. and subsidiaries
(1) Financial guarantees
The companies provide various types of guarantees to the benefit of third parties and related partiesprincipally to enhance their credit standings, and would be required to execute payments if a guaranteed partyfailed to fulfill its obligation with respect to a borrowing or trade payable.
Categories of financial guarantees are as follows:
Guarantees for third parties
The companies guarantee, severally or jointly with others, indebtedness of certain customers and suppliersin the furtherance of their trading activities.
Guarantees for associated companies
The companies, severally or jointly with others, issue guarantees for associated companies for the purposeof furtherance of their trading activities and credit enhancement of associated companies.
Guarantees to financial institutions for employees’ housing loans
As a part of the benefits program for its employees, the Company issues guarantees to financial institutionsfor employees’ housing loans. The maximum duration of the guarantees is 26 years. The Company obtains amortgage on the employees’ assets, if necessary.
(2) Performance guarantees
Main items of performance guarantees are contractual guarantees of Toyo Engineering Corporationregarding plant construction contracts executed under the name of the guaranteed party in the Middle East andother regions. The Company has pledged bank guarantees and performance bonds to the project owners, and incase that Toyo Engineering Corporation failed to fulfill the contractual obligation, the project owners wouldexecute bank guarantees and performance bonds to claim compensation for damages.
(3) Market value guarantees
Obligation to repurchase bills of exchange
In connection with export transactions, the Company issues bills of exchange, some of which are discountedby its negotiating banks. If a customer failed to fulfill its obligation with respect to the bills, the Company wouldbe obligated to repurchase the bills based on the banking transaction agreement. The maximum potential amountof future payments is represented by the aggregate par value of the bills discounted by the banks, and therecourse provisions and collateral are represented by the amount backed by letters of credit from the issuingbanks of the customers.
Minimum purchase price guarantees
To support financing activities of a partner of the joint venture which owns interests in oil & gas producingfields, the companies have a commitment to bid a certain amount for the sale of the partner’s stock by the bankwhich provides finance for the partner if the partner defaulted. The companies provide marketing services ofaircraft for domestic and overseas airline companies, and as a part of such businesses, the companies issuemarket value guarantees of the aircraft for certain customers.
F-72

Notes to Consolidated Financial Statements—(Continued)
Mitsui & Co., Ltd. and subsidiaries
Residual value guarantees of leased assets
As lessees in operating lease contracts, certain subsidiaries have issued residual value guarantees of theleased aircraft and ocean transport vessels, and on the date of expiration of operating lease contracts, suchsubsidiaries will either purchase the leased assets at a fixed price or be responsible for making up any shortfallbetween an actual sales price and the guaranteed price.
(4) Derivative instruments
Certain derivative contracts, including written put options and credit default swaps, meet the accountingdefinition of guarantees under FIN No. 45 when it is probable that the counterparties have underlying assets orliabilities related to the derivative contracts.
The companies consider the business relationship with counterparties and other circumstances in decidingwhether it is probable that the counterparties have underlying assets or liabilities, and did not include thederivative contracts with certain financial institutions and traders.
FIN No. 45 does not require disclosure about derivative contracts if such contracts permit or require netsettlement and the companies have no basis for concluding that it is probable that the counterparties haveunderlying assets or liabilities.
The companies have written put options as a part of their various derivative transactions related to energy,non-ferrous metals, precious metals and grain. The aggregation of notional amounts computed based on the strikeprices and quantities of written options are disclosed as the total amount outstanding and the maximum potentialamount of future payments. The carrying amount of liabilities is represented by the fair value of such writtenoptions recorded in the consolidated financial statements.
The companies manage the market and credit risks on these derivative instruments by monitoring fair valuesagainst loss limits and credit lines, and generally the maximum potential amount of future payments as statedabove greatly overstates the companies’ exposure to market and credit risks.
(5) Indemnification contracts
Indemnification issued through corporate reorganization
The companies divested certain of their businesses through a sale to a third-party purchaser and a spin-off toan associated company. In connection with these transactions, the companies have provided certain indemnities.The terms and conditions of indemnifications differ by contracts. The maximum potential amount of futurepayments could not be quantified because the limits of those indemnifications are often indefinite. No liabilitieshave been recorded for such indemnifications at March 31, 2008 and 2007.
Joint obligation under membership agreement in commodity exchanges
The companies are members of major commodity exchanges in Japan and overseas. In connection withthese memberships, the companies provide guarantees to the exchanges. Under the membership agreements, if amember becomes unable to satisfy its obligations to the exchange, the other members would be required to meetsuch shortfalls apportioned among the non-defaulting members in the prescribed manner. The companies’maximum potential amount of future payments related to these joint obligations is not quantifiable and theprobability of being required to make any payments under these obligations is remote.
F-73

Notes to Consolidated Financial Statements—(Continued)
Mitsui & Co., Ltd. and subsidiaries
(6) Product warranties
Certain subsidiaries provide warranties, in relation to their sales of products, including residential housesand automobiles, for the performance of such products during specified warranty periods, and they areresponsible for mending or payments of compensation against the claims by the customers regarding defects inperformance or function. Estimated warranty costs are accrued at the time the products are sold based on thehistorical claim experiences.
During the year ended March 31, 2007, Mitsui Bussan House-Techno, Inc., a 100% subsidiary engaged inthe custom-made house building business, decided to exit from its business due to the downturn of the businessenvironment caused by declining demand. The companies appropriated the provision for the future maintenanceservice, because the companies guarantee the periodical inspection and repair service for a certain period afterthe completion.
A tabular reconciliation of changes in such liabilities for the product warranties for the years endedMarch 31, 2008, 2007 and 2006 is as follows:
Millions of Yen
2008 2007 2006
Balance at beginning of year . . . . . . . . . . . . . . . . . . . . . . . . . . . . . . . . . . . . . . . . . . . . . ¥ 8,089 ¥2,450 ¥2,531Payments made in cash or in kind . . . . . . . . . . . . . . . . . . . . . . . . . . . . . . . . . . . . . . . . (563) (775) (306)Accrual for warranties issued during the year . . . . . . . . . . . . . . . . . . . . . . . . . . . . . . . 1,772 6,754 1,020Changes in accrual related to pre-existing warranties . . . . . . . . . . . . . . . . . . . . . . . . . (1,659) (340) (795)
Balance at end of year . . . . . . . . . . . . . . . . . . . . . . . . . . . . . . . . . . . . . . . . . . . . . . . . . . ¥ 7,639 ¥8,089 ¥2,450
II. LITIGATION
Various claims and legal actions are pending against the companies in respect of contractual obligations andother matters arising out of the conduct of the companies’ business. Appropriate provision has been recorded forthe estimated loss on claims and legal actions. In the opinion of management, any additional liability will notmaterially affect the consolidated financial position, results of operations, or cash flows of the Company.
23. VARIABLE INTEREST ENTITIES
The companies are involved with VIEs which mainly engage in leasing and financing activities within theMachinery & Infrastructure Projects, Energy and Logistics & Financial Markets Segments.
The VIEs that have been consolidated by the companies in accordance with FIN No. 46R are described asfollows (excluding VIEs of which the companies also hold a majority voting interest):
As lessees in operating lease contracts concluded with lessors that have been established for those leasecontracts in Europe, certain subsidiaries have issued residual value guarantees of the leased vessels. On the dateof expiration of operating lease contracts, such subsidiaries will either purchase the leased assets at a fixed priceor be responsible for making up any shortfall between an actual sales price and the guaranteed value. The lessorsof the leased vessels are VIEs and the companies have consolidated the lessors as the primary beneficiary. Totalassets of the lessors as of March 31, 2008 and 2007 were ¥12,169 million and ¥20,258 million, respectively.
A portion of the leased assets, which are consolidated, is collateral for the VIEs’ obligations. The carryingamounts of those assets as of March 31, 2007 were ¥5,869 million and were classified as property leased toothers—at cost, less accumulated depreciation in the Consolidated Balance Sheets. There were no such assets asof March 31, 2008.
F-74

Notes to Consolidated Financial Statements—(Continued)
Mitsui & Co., Ltd. and subsidiaries
The creditors or beneficial interest holders of the consolidated VIEs do not have recourse to the generalcredit of the companies, except for the aforementioned residual value guarantees.
The companies hold beneficial interest and senior investment securities without voting rights of VIEs whoseoperations are investment management and real estate development for the year ended March 31, 2008, and holdbeneficial interest without voting rights of VIEs whose operations are investment management for the year endedMarch 31, 2007. The companies have consolidated the VIEs as the primary beneficiary. Total assets of the VIEsas of March 31, 2008 and 2007 were ¥25,555 million and ¥14,916 million, respectively.
The consolidated real estate which includes land and buildings are collateral for the VIEs’ long-term debt,and the carrying amounts as of March 31, 2008 were ¥7,203 million, and were classified as real estate for sale,included in inventories in the Consolidated Balance Sheets. There were no such assets as of March 31, 2007.
The creditors or beneficial interest holders of the consolidated VIEs do not have recourse to the generalcredit of the companies.
In addition, the VIEs that are not consolidated because the companies are not the primary beneficiary, but inwhich the companies have significant variable interests, are described as follows:
The companies are involved with and have significant variable interests in a number of VIEs that have beenestablished to finance crude oil and LNG producing plants and equipment or to finance subordinated debts byproviding guarantees or subordinated loans to the VIEs. Those VIEs provide financing for customers locatedprincipally in Latin America, Middle East and Southeast Asia in the form of leases and loans. Total assets of theVIEs as of March 31, 2008 and 2007 were ¥1,503,516 million and ¥1,417,841 million, respectively, and themaximum exposure to loss as a result of the companies’ involvement with the VIEs as of March 31, 2008 and2007 were ¥125,550 million and ¥119,434 million, respectively.
The amount of maximum exposure to loss represents a loss that the companies could incur from thevariability in value of the leased assets, from financial difficulties of the customers or from other causes withoutconsideration of possible recoveries through insurance and the like. In addition, the amount bears no relation tothe loss anticipated to be incurred from the companies’ involvement with the VIEs and is considered to exceedgreatly the anticipated loss.
24. EXIT OR DISPOSAL ACTIVITIES
The Company focuses on the maximization of its consolidated corporate value. To achieve this objective,the Company is trying to strengthen its consolidated capabilities through optimal group management. TheCompany actively restructures its businesses to make them more efficient by regularly reassessing the businessenvironment and operational objectives of each of its businesses.
In addition to these restructurings, the companies have disposed of certain long-lived assets based onreviews of whether the companies should keep holding those assets from the standpoint of profitability. For theyear ended March 31, 2008, the companies recorded impairment losses of long-lived assets of ¥1,425 million asexit or disposal costs, which are defined by SFAS No. 146, “Accounting for Costs Associated with Exit orDisposal Activities.” Of the total exit or disposal costs for the year ended March 31, 2008, ¥1,240 million wererecorded in the Logistics & Financial Markets Segment. For the year ended March 31, 2007, the companiesrecorded total exit or disposal costs defined by SFAS No. 146 of ¥7,157 million, which consisted of losses ondisposal and impairment of long-lived assets of ¥3,805 million, one-time termination benefits of ¥1,993 million,and other associated costs of ¥1,359 million. These exit or disposal costs were recorded in the Foods & Retail
F-75

Notes to Consolidated Financial Statements—(Continued)
Mitsui & Co., Ltd. and subsidiaries
Segment of ¥3,801 million, the Consumer Service & IT Segment of ¥1,763 million for the year ended March 31,2007. For the year ended March 31, 2006, the companies recorded total exit or disposal costs defined by SFASNo. 146 of ¥30,600 million, which consisted of losses on disposal and impairments of long-lived assets of¥28,337 million, one-time termination benefits of ¥1,678 million, and other associated costs of ¥585 million.These exit or disposal costs were recorded in the Mineral & Metal Resources Segment of ¥11,804 million, theMachinery & Infrastructure Projects Segment of ¥7,901 million, the Foods & Retail Segment of ¥4,955 million,the Americas Segment of ¥2,960 million, the All Other Segment of ¥1,784 million, and the Consumer Service &IT Segment of ¥1,196 million for the year ended March 31, 2006.
Exit or disposal activities for the year ended March 31, 2008 are expected to complete within the yearending March 31, 2009. Exit or disposal activities for the years ended March 31, 2007 and 2006 weresubstantially completed within the years ended March 31, 2008 and 2007, respectively. There are no endingbalances of liabilities for the exit or disposal costs at March 31, 2008, and the ending balances of liabilities forthe exit or disposal costs were immaterial at March 31, 2007 and 2006.
There were no material individual exit or disposal activities for the year ended March 31, 2008.
The primary exit or disposal activities for the year ended March 31, 2007 were as follows:
Mitsui Foods Co., Ltd., a subsidiary reported in the Foods & Retail Segment, is mainly engaged in thewholesale of food products in Japan. It restructured the domestic distribution facilities and the companiesrecorded ¥1,317 million in impairment loss of long-lived assets and other associated costs of ¥1,217 million inother expense—net in the Statements of Consolidated Income for the year ended March 31, 2007.
Hokushuren Co., Ltd., a subsidiary (an associated company from the year ended March 31, 2008) reportedin the Foods & Retail Segment, is mainly engaged in the wholesale of food products in Japan. Due torestructurings, the companies recorded ¥598 million in impairment loss of long-lived assets and other associatedcosts of ¥633 million in other expense—net in the Statements of Consolidated Income for the year endedMarch 31, 2007.
Mitsui Bussan House-Techno, Inc., a subsidiary reported in the Consumer Service & IT Segment, had beenmainly engaged in the detached custom-built house business. Due to demand decline, the Company decided toexit from this business field and recorded an impairment loss of long-lived assets of ¥199 million, a loss ondisposal or sales of property and equipment of ¥151 million and other associated costs of ¥1,413 million, all ofwhich are amounts before income tax effect, in income (loss) from discontinued operations—net (after incometax effect) in the Statements of Consolidated Income for the year ended March 31, 2007.
The primary exit or disposal activities for the year ended March 31, 2006 were as follows:
Mitalco Inc., a subsidiary reported in the Mineral & Metal Resources Segment, had been engaged inaluminum smelting in the United States. Because of the deterioration in the terms of the power purchase contractduring the course of renewal negotiations, which would have significant adverse effect on its smelting cost, thecompanies recorded an impairment loss of long-lived assets of ¥11,804 million (before income tax) in income(loss) from discontinued operations—net (after income tax effect) in the Statements of Consolidated Income forthe year ended March 31, 2006. Refer to Note 4, “DISCONTINUED OPERATIONS,” for further discussion ondiscontinued operations.
Mitsui Foods Co., Ltd., a subsidiary reported in the Foods & Retail Segment, is mainly engaged in thewholesale of food products in Japan. Due to the termination of the transactions with The Daiei Inc., it
F-76

Notes to Consolidated Financial Statements—(Continued)
Mitsui & Co., Ltd. and subsidiaries
restructured the domestic distribution facilities and recorded ¥4,096 million in impairment loss of long-livedassets and other associated costs of ¥859 million in selling, general and administrative in the Statements ofConsolidated Income for the year ended March 31, 2006.
Nst Inc., a subsidiary reported in the Americas Segment, was mainly engaged in the pet food and feedingredients businesses in the United States and United Kingdom. Due to the increased competition in theindustry, the companies decided to exit from this business field and recorded ¥1,556 million in impairment lossof long-lived assets and other associated costs of ¥1,404 million in other expense—net in the Statements ofConsolidated Income for the year ended March 31, 2006.
25. DERIVATIVE INSTRUMENTS AND HEDGING ACTIVITIES
The companies are exposed to market risks related to foreign currency exchange rates, interest rates andcommodity prices in the ordinary course of business.
In order to offset or reduce these risks, the companies use derivative instruments, such as foreign exchangeforward contracts, currency swap agreements, interest rate swap agreements, commodity future, forward, optionand swap contracts, to hedge the exposure to changes in the fair value or expected future cash flows ofrecognized assets and liabilities, unrecognized firm commitments or forecasted transactions. The companies alsouse non-derivative financial instruments, such as foreign-currency-denominated debt, to hedge the foreigncurrency exposure in the net investment in a foreign operation.
Foreign currency exchange rate risk hedging activities
The companies use derivative instruments, such as foreign exchange forward contracts, currency swapagreements and interest rate and currency swap agreements, to fix the expected future cash flows from foreign-currency-denominated receivables and payables resulting from selling and purchasing activities in currenciesother than the local currency and long-term financing transactions as part of the companies’ global operations inmany countries. The companies also use non-derivative financial instruments, such as foreign-currency-denominated debt, in order to hedge the foreign currency exposure in the net investment in a foreign operation.
Interest rate risk hedging activities
The companies use interest rate swap agreements and interest rate and currency swap agreements todiversify the sources of fund raising, reduce fund-raising costs, fix the expected future cash flows from long-termfinancial assets and liabilities with floating interest rates and reduce the exposure to changes in the fair value oflong-term financial assets and liabilities with fixed interest rates.
Commodity price risk hedging activities
The companies use derivative instruments, such as commodity future, forward, option and swap contracts,to reduce the exposure to changes in the fair value of inventories and unrecognized firm commitments and to fixthe expected future cash flows from forecasted transactions in marketable commodities, such as non-ferrousmetals, crude oil and agricultural products.
Risk management policy
The companies have strictly separated the trading sections from the sections that record the results andpositions of derivative instruments and are responsible for cash settlement and account confirmation with
F-77

Notes to Consolidated Financial Statements—(Continued)
Mitsui & Co., Ltd. and subsidiaries
counterparties. Risk management sections classify the derivative transactions into trading transactions andhedging transactions. The distinction between trading and hedging transactions is strictly managed by affirmingthe correspondence with the hedged items for transactions for hedging purposes. Furthermore, these riskmanagement sections comprehensively monitor, evaluate and analyze the positions of derivative instruments andreport the results periodically to the Company’s executive officers in charge of risk management. Based on thesereports, the executive officers assess derivative instruments and the market risks surrounding these instruments,and establish the companies’ risk management policy regarding derivative instruments.
Fair value hedges
Changes in the fair value of derivative instruments designated as hedging the exposure to changes in the fairvalue of recognized assets or liabilities or unrecognized firm commitments are recorded in earnings together withchanges in the fair value of the corresponding hedged items attributable to the hedged risks.
The net gain or loss recognized in earnings representing the amount of the hedges’ ineffectiveness and thecomponent of the derivative instruments’ gain or loss excluded from the assessment of hedge effectiveness wereimmaterial for the years ended March 31, 2008, 2007 and 2006.
The amount of net gain or loss recognized in earnings when a hedged firm commitment no longer qualifiesas a fair value hedge was immaterial for the years ended March 31, 2008, 2007 and 2006.
Cash flow hedges
Changes in the fair value of foreign exchange forward contracts, currency swap agreements and interest rateand currency swap agreements designated as hedging instruments to hedge the exposure to variability in expectedfuture cash flows of recognized assets or liabilities, unrecognized firm commitments and forecasted transactionsdenominated in foreign currencies are initially recorded as other comprehensive income to the extent they areeffective. The amounts in accumulated other comprehensive income are reclassified into earnings when earningsare affected by the hedged items.
Changes in the fair value of interest rate swap agreements designated as hedging instruments to reduce theexposure to variability in expected future cash flows of floating-rate financial assets and liabilities are initiallyrecorded as other comprehensive income to the extent they are effective. The amounts in accumulated othercomprehensive income are reclassified into earnings as interest income and expense when earnings are affectedby the hedged items.
Changes in the fair value of commodity forward and swap contracts designated as hedging instruments tohedge the exposure to variability in expected future cash flows of the marketable commodities are initiallyrecorded as other comprehensive income to the extent they are effective. The amounts in accumulated othercomprehensive income are reclassified into earnings as sales of products or cost of products sold when earningsare affected by the hedged transactions.
The ineffective portion of the hedging instruments’ gain or loss and the component of the derivativeinstruments’ gain or loss excluded from the assessment of hedge effectiveness are reported in earningsimmediately. If the hedged forecasted transaction will not occur by the end of the originally specified timeperiod, gain or loss on the hedging instrument reported in accumulated other comprehensive income isreclassified into earnings. These amounts were immaterial for the years ended March 31, 2008, 2007 and 2006.
F-78

Notes to Consolidated Financial Statements—(Continued)
Mitsui & Co., Ltd. and subsidiaries
The estimated net amount of the existing gains or losses in accumulated other comprehensive income atMarch 31, 2008 that is expected to be reclassified into earnings within the next 12 months is a net gain of ¥4,618million.
The maximum length of time over which the companies are hedging their exposure to the variability inexpected future cash flows for forecasted transactions (excluding those forecasted transactions related to thepayment of variable interest on existing financial instruments) is 27 months. Foreign exchange forward contractsare used as hedging instruments for the forecasted transactions.
Hedges of the net investment in a foreign operation
The foreign currency transaction gain or loss on the derivative instrument and the non-derivative financialinstrument that is designated as, and is effective as, hedging instruments to hedge the foreign currency exposureof a net investment in a foreign operation is recorded as foreign currency translation adjustments within othercomprehensive income to the extent it is effective as a hedge. The net amount of gains or losses included in theforeign currency translation adjustments at March 31, 2008 and 2007 were net gain of ¥25,215 million and netloss of ¥2,818 million, respectively. The net amount of gains or losses included in the foreign currencytranslation adjustments was immaterial for the year ended March 31, 2006.
Derivative instruments for trading purposes and risk management policy
The Company and certain subsidiaries use derivative instruments such as foreign exchange forwardcontracts, interest rate swap agreements and commodity future, forward, swap and option contracts for tradingpurposes. The Company’s executive officers in charge of risk management have set strict position and loss limitsfor these instruments. Independent back offices and middle offices strictly separated from trading sections (frontoffices) monitor, evaluate and analyze the position of trading transactions and market risks. Those results areperiodically reported to the executive officers. Among others, VaR (Value at Risk: Statistical measure of thepotential maximum loss in the fair value of a portfolio resulting from adverse market movements in theunderlying risk factors such as foreign currency exchange rates, interest rates and commodity prices, over adefined period, within a certain confidence level) is used to measure the market risks of derivative instrumentsfor trading purposes.
26. FINANCIAL INSTRUMENTS
FAIR VALUE OF FINANCIAL INSTRUMENTS
In accordance with the requirements of SFAS No. 107, the companies have provided the following fairvalue estimates and information about valuation methodologies.
Quoted market prices, where available, are used to estimate fair values of financial instruments. However,quoted market prices are not available for a substantial portion of the financial instruments. Accordingly, fairvalues for such financial instruments are estimated using discounted cash flow analysis or other valuationtechniques.
Current financial assets other than marketable securities and current financial liabilities
The carrying amount approximates the fair value of the majority of these instruments because of their shortmaturities.
F-79
Notes to Consolidated Financial Statements—(Continued)
Mitsui & Co., Ltd. and subsidiaries
Marketable securities and other investments
See Note 5, “MARKETABLE SECURITIES AND OTHER INVESTMENTS.”
Non-current receivables and advances to associated companies
The fair values of non-current receivables, including fixed rate, long-term loans receivable, are estimated bydiscounted cash flow analysis, using interest rates currently being offered for loans or accounts receivable withsimilar terms to borrowers or customers of similar credit quality and remaining maturities. The carrying amountsof loans with floating rates approximate the fair value.
Long-term debt
The fair values for long-term debt, except for debt with floating rates whose carrying amounts approximatefair value, are estimated by discounted cash flow analysis, using rates currently available for similar types ofborrowings with similar terms and remaining maturities.
Financial guarantees and financing commitments
The fair values of financial guarantees are estimated based on the present values of expected future cashflows, considering the remaining terms of the arrangements and the counterparties’ credit standings.
The companies have not estimated the fair values of financing commitments because management does notbelieve it is practicable to estimate the fair values due to uncertainty involved in attempting to assess thelikelihood and timing of commitments being drawn upon, coupled with the lack of an established market.However, management believes the likelihood is remote that material payments will be required under thesefinancing commitments.
Currency and interest rate swap agreements
The fair values of currency and interest rate swap agreements are estimated by discounted cash flowanalysis, using rates currently available for similar types of swap agreements at the reporting date. Currencyswap agreements include certain derivatives with both foreign exchange and interest rate exposures. Fair valuesof those agreements consist of foreign exchange and interest rate factors.
Foreign exchange forward contracts
The fair values of foreign exchange forward contracts are estimated based on market prices for contractswith similar terms.
F-80

Notes to Consolidated Financial Statements—(Continued)
Mitsui & Co., Ltd. and subsidiaries
The estimated fair values of certain financial instruments and derivative financial instruments at March 31,2008 and 2007 were as follows:
Millions of Yen
2008 2007
Carryingamount Fair value
Carryingamount Fair value
Financial Assets (other than derivative financialinstruments):
Current financial assets other than marketable securities . . ¥ 3,927,874 ¥ 3,927,874 ¥ 3,982,150 ¥ 3,982,150Non-current receivables and advances to associated
companies (less allowance for doubtful receivables) . . . . 331,741 332,499 719,369 719,701
Financial Liabilities (other than derivative financialinstruments):
Current financial liabilities . . . . . . . . . . . . . . . . . . . . . . . . . . (2,887,981) (2,887,981) (3,073,053) (3,073,053)Long-term debt (including current maturities) . . . . . . . . . . . (3,372,915) (3,432,107) (3,444,437) (3,514,347)
Derivative Financial Instruments (Assets):Interest rate swap agreements . . . . . . . . . . . . . . . . . . . . . . . 25,346 25,346 3,773 3,773Currency swap agreements . . . . . . . . . . . . . . . . . . . . . . . . . . 30,817 30,817 649 649Foreign exchange forward contracts . . . . . . . . . . . . . . . . . . 81,257 81,257 55,004 55,004
Derivative Financial Instruments (Liabilities):Interest rate swap agreements . . . . . . . . . . . . . . . . . . . . . . . (5,446) (5,446) (7,806) (7,806)Currency swap agreements . . . . . . . . . . . . . . . . . . . . . . . . . . (8,603) (8,603) (11,501) (11,501)Foreign exchange forward contracts . . . . . . . . . . . . . . . . . . (64,727) (64,727) (10,980) (10,980)
CONCENTRATION OF CREDIT RISK
The companies’ global operations include a variety of businesses with diverse customers and supplierswhich reduces concentrations of credit risks. The companies deal with selective international financialinstitutions to minimize the credit risk exposure of derivative financial instruments. Credit risk represents thelikelihood that the counterparties may be unable to meet the terms of the agreements. Management does notexpect any losses as a result of counterparty default on financial instruments. Credit risk is managed throughcredit line approval by management and by periodically monitoring the counterparties.
F-81

Notes to Consolidated Financial Statements—(Continued)
Mitsui & Co., Ltd. and subsidiaries
27. SUPPLEMENTAL CASH FLOW INFORMATION
Supplemental information related to the Statements of Consolidated Cash Flows is as follows:
Millions of Yen
2008 2007 2006
Cash paid during the year for:Interest . . . . . . . . . . . . . . . . . . . . . . . . . . . . . . . . . . . . . . . . . . . . . . . . . . . . . ¥110,013 ¥ 96,208 ¥63,492Income taxes (Note 20) . . . . . . . . . . . . . . . . . . . . . . . . . . . . . . . . . . . . . . . . 184,325 99,115 81,475
Non-cash investing and financing activities:Exchange of shares in connection with business combinations and
reorganizations involving investees:Fair market value of shares received . . . . . . . . . . . . . . . . . . . . . . . . . . 26,787 3,987 48,288Cost of shares surrendered . . . . . . . . . . . . . . . . . . . . . . . . . . . . . . . . . . 23,390 1,179 40,769
Common stock issued upon conversion of convertible bonds . . . . . . . . . . . 28,616 54,806 1,392Acquisitions of subsidiaries (Note 3): . . . . . . . . . . . . . . . . . . . . . . . . . . . . .Fair value of assets acquired . . . . . . . . . . . . . . . . . . . . . . . . . . . . . . . . . . . . 117,483 444,032 —Fair value of liabilities assumed . . . . . . . . . . . . . . . . . . . . . . . . . . . . . . . . . . 59,000 277,691 —Acquisition costs of subsidiaries . . . . . . . . . . . . . . . . . . . . . . . . . . . . . . . . . 58,483 166,341 —Non-cash acquisition cost . . . . . . . . . . . . . . . . . . . . . . . . . . . . . . . . . . . . . . . 3,316 — —Pre-acquisition carrying amount of equity method investment . . . . . . . . . . — 107,892 —Cash acquired . . . . . . . . . . . . . . . . . . . . . . . . . . . . . . . . . . . . . . . . . . . . . . . . 2,951 46,975 —Acquisitions of subsidiaries, net of cash acquired . . . . . . . . . . . . . . . . . . . . 52,216 11,474 —
28. SUBSEQUENT EVENT
On June 24, 2008, the shareholders approved the payment of a cash dividend to shareholders of record onMarch 31, 2008 of ¥23 per share or a total of ¥41,788 million at the Company’s ordinary general meeting ofshareholders.
F-82

SUPPLEMENTAL INFORMATION ON OIL AND GAS PRODUCING ACTIVITIES (UNAUDITED)
In accordance with Statement of Financial Accounting Standards (“SFAS”) No. 69, “Disclosure about Oiland Gas Producing Activities,” this section provides supplemental information on oil and gas exploration andproducing activities of the companies in five separate tables. Tables 1 through 3 provide historical costinformation pertaining to costs incurred for property acquisitions, exploration and development; capitalized cost;and results of operations. Tables 4 and 5 present information on the companies’ estimated net proved reservequantities and standardized measure of estimated discounted future net cash flows related to proved reserves. Theamounts for investments that are accounted for by the equity method are separately presented as “AssociatedCompanies,” for which the companies’ share of the investees’ information on oil and gas producing activities ispresented in the following tables. The “Consolidated Companies” column includes activities in “Oceania andAsia” (Australia, New Zealand and Thailand), “Middle East” (Qatar and Oman) and “Others” (North Americaand Africa). The “Associated Companies” column includes activities in “Oceania” (Australia) and “Others”(Sakhalin / Russia, Thailand and Indonesia). The “Associated Companies” column of the following tablesincludes information on liquefied natural gas (“LNG”) producing activities as an integral part of natural gasproducing activities. The information below reflects the change in 2008 accounting treatment of Sakhalin II(included in others) from an equity accounted investment to external.
TABLE 1. COSTS INCURRED FOR PROPERTY ACQUISITION, EXPLORATION ANDDEVELOPMENT *
Millions of Yen
Consolidated Companies Associated Companies
Oceaniaand Asia
MiddleEast Others Oceania Others Worldwide
Year Ended March 31, 2008:Acquisition of Proved Properties . . . . . . . . . . . ¥13,499 — — — ¥ 3,701 ¥ 17,200Acquisition of Unproved Properties . . . . . . . . . 846 — — — 3,039 3,885Exploration . . . . . . . . . . . . . . . . . . . . . . . . . . . . 11,464 ¥ 397 ¥ 2,895 ¥ 647 63 15,466Development . . . . . . . . . . . . . . . . . . . . . . . . . . . 58,279 6,035 473 18,127 3,090 86,004
Total Costs Incurred . . . . . . . . . . . . . . . . . . . . . ¥84,088 ¥ 6,432 ¥ 3,368 ¥18,774 ¥ 9,893 ¥122,555
Year Ended March 31, 2007:Acquisition of Proved Properties . . . . . . . . . . . ¥ 7,609 — ¥53,835 — — ¥ 61,444Acquisition of Unproved Properties . . . . . . . . . 1,204 — 27 — — 1,231Exploration . . . . . . . . . . . . . . . . . . . . . . . . . . . . 2,232 ¥ 417 797 ¥ 714 ¥ 1,187 5,347Development . . . . . . . . . . . . . . . . . . . . . . . . . . . 30,304 19,691 1,195 15,173 103,370 169,733
Total Costs Incurred . . . . . . . . . . . . . . . . . . . . . ¥41,349 ¥20,108 ¥55,854 ¥15,887 ¥104,557 ¥237,755
Year Ended March 31, 2006:Acquisition of Proved Properties . . . . . . . . . . . — — — — — —Acquisition of Unproved Properties . . . . . . . . . ¥ 888 — — — — ¥ 888Exploration . . . . . . . . . . . . . . . . . . . . . . . . . . . . 1,911 ¥ 737 — ¥ 17 ¥ 403 3,068Development . . . . . . . . . . . . . . . . . . . . . . . . . . . 28,937 3,512 — 5,504 114,257 152,210
Total Costs Incurred . . . . . . . . . . . . . . . . . . . . . ¥31,736 ¥ 4,249 — ¥ 5,521 ¥114,660 ¥156,166
* Includes costs incurred whether capitalized or expensed and capitalized asset retirement costs incurred inaccordance with SFAS No. 143 “Accounting for Asset Retirement Obligations.”
F-83

TABLE 2. CAPITALIZED COSTS RELATED TO OIL AND GAS PRODUCING ACTIVITIES
Millions of Yen
Consolidated Companies Associated Companies
Oceaniaand Asia
MiddleEast Others Oceania Others Worldwide
Year Ended March 31, 2008:Proved Properties* . . . . . . . . . . . . . . . . . . . . . ¥423,241 ¥58,240 ¥53,719 ¥182,443 ¥ 36,944 ¥ 754,587Unproved Properties . . . . . . . . . . . . . . . . . . . . 18,968 — 781 — 4,493 24,242
Gross Capitalized Properties . . . . . . . . . . . . . . 442,209 58,240 54,500 182,443 41,437 778,829Accumulated Depreciation, Depletion,
Amortization and Valuation Allowances . . 243,506 21,780 10,945 90,329 23,014 389,574
Net Capitalized Costs . . . . . . . . . . . . . . . . . . . ¥198,703 ¥36,460 ¥43,555 ¥ 92,114 ¥ 18,423 ¥ 389,255
Year Ended March 31, 2007:Proved Properties* . . . . . . . . . . . . . . . . . . . . . ¥400,053 ¥61,351 ¥60,262 ¥172,191 ¥434,247 ¥1,128,104Unproved Properties . . . . . . . . . . . . . . . . . . . . 17,673 — 924 — — 18,597
Gross Capitalized Properties . . . . . . . . . . . . . . 417,726 61,351 61,186 172,191 434,247 1,146,701Accumulated Depreciation, Depletion,
Amortization and Valuation Allowances . . 217,104 19,704 4,685 88,119 26,547 356,159
Net Capitalized Costs . . . . . . . . . . . . . . . . . . . ¥200,622 ¥41,647 ¥56,501 ¥ 84,072 ¥407,700 ¥ 790,542
Year Ended March 31, 2006:Proved Properties* . . . . . . . . . . . . . . . . . . . . . ¥ 96,328 ¥38,420 — ¥124,683 ¥417,849 ¥ 677,280Unproved Properties . . . . . . . . . . . . . . . . . . . . 30,252 — — — 2,430 32,682
Gross Capitalized Properties . . . . . . . . . . . . . . 126,580 38,420 — 124,683 420,279 709,962Accumulated Depreciation, Depletion,
Amortization and Valuation Allowances . . 14,900 13,433 — 73,594 97,485 199,412
Net Capitalized Costs . . . . . . . . . . . . . . . . . . . ¥111,680 ¥24,987 — ¥ 51,089 ¥322,794 ¥ 510,550
* Includes capitalized asset retirement costs in accordance with SFAS No. 143.
F-84

TABLE 3. RESULTS OF OPERATIONS FOR OIL AND GAS PRODUCING ACTIVITIES
The companies’ results of operations from oil and gas producing activities are shown in the following table.In accordance with SFAS No. 69, income taxes are based on statutory tax rates. Interest income and expense areexcluded from the results reported.
Millions of Yen
Consolidated Companies Associated Companies
Oceaniaand Asia
MiddleEast Others Oceania Others Worldwide
Year Ended March 31, 2008:Sales to Unaffiliated Enterprises . . . . . . . . ¥174,339 ¥ 5,002 ¥19,100 ¥59,715 ¥13,034 ¥271,190Transfers to Affiliated Enterprises . . . . . . 11,167 39,099 — 12,478 — 62,744
Total Revenues . . . . . . . . . . . . . . . . . . . . . 185,506 44,101 19,100 72,193 13,034 333,934Production Costs . . . . . . . . . . . . . . . . . . . . 17,683 4,023 6,308 22,868 4,532 55,414Exploration Expenses . . . . . . . . . . . . . . . . 10,275 257 789 638 0 11,959Depreciation, Depletion, Amortization,
Accretion and Valuation Allowances . . 55,919 5,447 8,184 5,854 3,462 78,866Income Tax Expenses . . . . . . . . . . . . . . . . 59,818 18,965 1,446 12,778 2,537 95,544
Results of Operations for Oil and GasProducing Activities . . . . . . . . . . . . . . . ¥ 41,811 ¥15,409 ¥ 2,373 ¥30,055 ¥ 2,503 ¥ 92,151
Year Ended March 31, 2007:Sales to Unaffiliated Enterprises . . . . . . . . ¥ 26,014 ¥ 4,688 ¥ 9,862 ¥57,719 ¥61,369 ¥159,652Transfers to Affiliated Enterprises . . . . . . 24,374 34,135 — 7,654 2,127 68,290
Total Revenues . . . . . . . . . . . . . . . . . . . . . 50,388 38,823 9,862 65,373 63,496 227,942Production Costs . . . . . . . . . . . . . . . . . . . . 5,463 3,409 2,863 20,116 18,444 50,295Exploration Expenses . . . . . . . . . . . . . . . . 1,031 97 395 308 2,983 4,814Depreciation, Depletion, Amortization,
Accretion and Valuation Allowances . . 11,317 6,141 4,809 3,754 9,638 35,659Income Tax Expenses . . . . . . . . . . . . . . . . 13,742 16,473 633 12,320 17,917 61,085
Results of Operations for Oil and GasProducing Activities . . . . . . . . . . . . . . . ¥ 18,835 ¥12,703 ¥ 1,162 ¥28,875 ¥14,514 ¥ 76,089
Year Ended March 31, 2006:Sales to Unaffiliated Enterprises . . . . . . . . ¥ 315 ¥ 4,107 — ¥45,534 ¥44,934 ¥ 94,890Transfers to Affiliated Enterprises . . . . . . 4,681 26,324 — 8,557 3,967 43,529
Total Revenues . . . . . . . . . . . . . . . . . . . . . 4,996 30,431 — 54,091 48,901 138,419Production Costs . . . . . . . . . . . . . . . . . . . . 2,061 2,862 — 17,295 10,229 32,447Exploration Expenses . . . . . . . . . . . . . . . . 1,911 258 — 252 403 2,824Depreciation, Depletion, Amortization,
Accretion and Valuation Allowances . . 526 3,901 — 3,837 6,913 15,177Income Tax Expenses . . . . . . . . . . . . . . . . (240) 11,969 — 9,844 15,550 37,123
Results of Operations for Oil and GasProducing Activities . . . . . . . . . . . . . . . ¥ 738 ¥11,441 — ¥22,863 ¥15,806 ¥ 50,848
F-85

TABLE 4. PROVED RESERVE QUANTITY INFORMATION
The following table describes proved oil and gas reserves and changes thereto for the years ended March 31,2008, 2007 and 2006. The definitions used herein are in accordance with SFAS No. 25, “Suspension of CertainAccounting Requirements for Oil and Gas Producing Companies.”
Proved Developed and Undeveloped Reserves:
Crude Oil, Condensate and Natural Gas Liquids*1 Natural Gas*1,*3
Millions of Barrels Billions of Cubic Feet
ConsolidatedCompanies
AssociatedCompanies
ConsolidatedCompanies
AssociatedCompanies
Oceaniaand Asia*4
MiddleEast Others Oceania Others*5 Worldwide
Oceaniaand Asia*4
MiddleEast Others Oceania Others*5 Worldwide
Reserves at April 1, 2005 . . . . . 50 24 — 28 92 194 69 75 — 771 1,393 2,308Changes Attributable to:
Revision of PreviousEstimates (includesimproved recovery) . . . . . 3 1 — 16 16 36 13 (31) — 87 (11) 58
Extensions andDiscoveries . . . . . . . . . . . 3 1 — — — 4 — 2 — — 432 434
Purchases . . . . . . . . . . . . . . . — — — — 1 1 — — — — 14 14Sales . . . . . . . . . . . . . . . . . . — — — — — — — — — — — —Production . . . . . . . . . . . . . . (1) (3) — (5) (5) (14) (2) (6) — (57) (39) (104)
Reserves at March 31, 2006 . . . 55 23 — 39 104 221 80 40 — 801 1,789 2,710Changes Attributable to:
Consolidation of asubsidiary . . . . . . . . . . . . 36 — — — (17) 19 404 — — — (191) 213
Revision of PreviousEstimates (includesimproved recovery) . . . . . (29) 1 — 4 1 (23) (78) (3) — (16) 38 (59)
Extensions andDiscoveries . . . . . . . . . . . 16 2 — — — 18 7 — 1 — — 8
Purchases . . . . . . . . . . . . . . . 5 — 16 — 7 28 27 — 40 — 38 105Sales . . . . . . . . . . . . . . . . . . — — — — — — — — — — — —Production . . . . . . . . . . . . . . (11) (3) (1) (6) (4) (25) (96) (6) (3) (45) (6) (156)
Reserves at March 31, 2007 . . . 72 23 15 37 91 238 344 31 38 740 1,668 2,821Changes Attributable to:
Revision of PreviousEstimates (includesimproved recovery) . . . . . 29 (3) 1 2 (1) 28 449 1 (2) 2 (17) 433
Extensions andDiscoveries . . . . . . . . . . . — 1 — 1 — 2 — 6 — 24 — 30
Purchases . . . . . . . . . . . . . . . — — — — — — — — — — 177 177Sales . . . . . . . . . . . . . . . . . . (11) — — — (85) (96) (22) — — — (1,636) (1,658)Production . . . . . . . . . . . . . . (16) (3) (2) (5) (1) (27) (107) (6) (5) (44) (3) (165)
Reserves at March 31, 2008 . . . 74 18 14 35 4 145 664 32 31 722 189 1,638Proved Developed Reserves*2:Reserves at April 1, 2005 . . . . . . 6 24 — 14 18 62 — 75 — 356 82 513Reserves at March 31, 2006 . . . . 7 18 — 13 25 63 56 39 — 263 67 425Reserves at March 31, 2007 . . . . 46 18 11 21 24 120 299 19 24 385 11 738
Reserves at March 31, 2008 . . . 55 14 11 20 3 102 322 15 21 454 182 994
*1 1 barrel of crude oil = 5,800 cubic feet of natural gas*2 The proportion of Proved Developed Reserves to Proved Developed and Undeveloped Reserves was about 34 percent as of March 31,
2007 and relatively low. The expected costs to develop these undeveloped reserves were estimated to be ¥501,900 million in total as ofMarch 31, 2007, which was included in “Future Development Cost” in Table 5. The proportion of Proved Developed Reserves to ProvedDeveloped and Undeveloped Reserves is about 64 percent as of March 31, 2008 and the expected costs to develop these undevelopedreserves are estimated to be ¥248,020 million in total as of March 31, 2008. This large proportion change is mainly due to the reductionof Mitsui’s interest in Sakhalin II project.
*3 The proved gas reserves are restricted to those volumes that are related to firm sales commitments.*4 Includes total proved reserves attributable to Mitsui Oil Exploration Co., Ltd. of 19 million and 37 million barrels of Crude oil,
Condensate and Natural Gas Liquids and 265 billions and 636 billions of cubic feet of Natural Gas in March 2007 and 2008, as well asproved developed reserves of 18 million and 18 million barrels of Crude oil, Condensate and Natural Gas Liquids and 227 billions and294 billions of cubic feet of Natural Gas in March 2007 and 2008, respectively, in which there is a 49.7 percent and 48.5 percentminority interest.
*5 The decrease of 96 million barrels in sales of Crude oil, Condensate and Natural Gas Liquids and 1,658 billions of cubic feet in sales ofNatural Gas in place was mainly related to the reduction of Mitsui’s interest in Sakhalin II project.
F-86

TABLE 5. STANDARDIZED MEASURE OF DISCOUNTED FUTURE NET CASH FLOWSRELATED TO PROVED OIL AND GAS RESERVES
The standardized measure of discounted future cash flows, related to the preceding proved oil and gasreserves, is calculated in accordance with SFAS No. 69. Estimated future cash inflows from production arecomputed by applying year-end prices to year-end quantities of estimated net proved reserves. Futuredevelopment and production costs are those estimated future expenditures necessary to develop and produceyear-end estimated proved reserves based on year-end cost indices, assuming continuation of year-end economicconditions. Estimated future income taxes are calculated by applying appropriate year-end statutory tax rates.Discounted future net cash flows are calculated using a discount factor of 10 percent. The information provideddoes not represent management’s estimate of the companies’ expected future cash flows or value of proved oiland gas reserves. Estimates of proved reserve quantities shall change over time as new information becomesavailable. Moreover, probable and possible reserves, which may become proved in the future, are excluded fromthe calculations. The arbitrary valuation prescribed under SFAS No. 69 requires assumptions as to the timing offuture development and production costs. The calculations are made as of each fiscal year-end and should not berelied upon as an indication of the companies’ future cash flows or value of their oil and gas reserves.
1) Standardized Measure of Discounted Future Net Cash Flows
Millions of Yen
Consolidated Companies Associated Companies
Oceaniaand Asia*
MiddleEast Others Oceania Others Worldwide
At March 31, 2008:Future Cash Inflows from Production . . . . . . . . . . . . . . . . . . . . . ¥ 996,390 ¥ 281,462 ¥148,446 ¥ 943,422 ¥ 77,112 ¥2,446,832Future Production Costs . . . . . . . . . . . . . . . . . . . . . . . . . . . . . . . . (178,842) (18,490) (30,657) (138,031) (8,216) (374,236)Future Development Costs . . . . . . . . . . . . . . . . . . . . . . . . . . . . . . (175,889) (13,685) (16,160) (102,207) (6,290) (314,231)Future Income Taxes . . . . . . . . . . . . . . . . . . . . . . . . . . . . . . . . . . (337,761) (135,034) (22,523) (221,343) (29,743) (746,404)
Undiscounted Future Net Cash Flows . . . . . . . . . . . . . . . . . . . . . 303,898 114,253 79,106 481,841 32,862 1,011,96110% Annual Discount for Timing of Estimated Cash Flows . . . (41,257) (37,930) (18,577) (225,345) (4,297) (327,406)
Standardized Measure of Discounted Future Net Cash Flows . . ¥ 262,641 ¥ 76,323 ¥ 60,529 ¥ 256,496 ¥ 28,566 ¥ 684,555
At March 31, 2007:Future Cash Inflows from Production . . . . . . . . . . . . . . . . . . . . . ¥ 605,040 ¥ 256,299 ¥126,713 ¥ 756,082 ¥1,525,078 ¥3,269,212Future Production Costs . . . . . . . . . . . . . . . . . . . . . . . . . . . . . . . . (171,335) (21,705) (19,409) (118,426) (380,078) (710,953)Future Development Costs . . . . . . . . . . . . . . . . . . . . . . . . . . . . . . (133,323) (19,418) (22,099) (84,309) (286,254) (545,403)Future Income Taxes . . . . . . . . . . . . . . . . . . . . . . . . . . . . . . . . . . (101,264) (115,547) (12,990) (176,844) (153,647) (560,292)
Undiscounted Future Net Cash Flows . . . . . . . . . . . . . . . . . . . . . 199,118 99,629 72,215 376,503 705,099 1,452,56410% Annual Discount for Timing of Estimated Cash Flows . . . (40,074) (34,671) (18,229) (178,396) (431,453) (702,823)
Standardized Measure of Discounted Future Net Cash Flows . . ¥ 159,044 ¥ 64,958 ¥ 53,986 ¥ 198,107 ¥ 273,646 ¥ 749,741
At March 31, 2006:Future Cash Inflows from Production . . . . . . . . . . . . . . . . . . . . . ¥ 342,585 ¥ 228,044 — ¥ 672,116 ¥1,644,418 ¥2,887,163Future Production Costs . . . . . . . . . . . . . . . . . . . . . . . . . . . . . . . . (124,615) (26,924) — (205,686) (369,594) (726,819)Future Development Costs . . . . . . . . . . . . . . . . . . . . . . . . . . . . . . (27,206) (7,291) — (114,152) (437,194) (585,843)Future Income Taxes . . . . . . . . . . . . . . . . . . . . . . . . . . . . . . . . . . (25,763) (104,206) — (115,459) (202,793) (448,221)
Undiscounted Future Net Cash Flows . . . . . . . . . . . . . . . . . . . . . 165,001 89,623 — 236,819 634,837 1,126,28010% Annual Discount for Timing of Estimated Cash Flows . . . (46,925) (32,936) — (135,169) (463,532) (678,562)
Standardized Measure of Discounted Future Net Cash Flows . . ¥ 118,076 ¥ 56,687 — ¥ 101,650 ¥ 171,305 ¥ 447,718
* Includes discounted future net cash flows attributable to Mitsui Oil Exploration Co., Ltd. of ¥61,214 million and ¥168,868 million inMarch 2007 and 2008 respectively, in which there is a 49.7 percent and 48.5 percent minority interest.
F-87

2) Details of Changes for the Year
Millions of Yen
Consolidated Companies Associated Companies Worldwide
2008 2007 2006 2008 2007 2006 2008 2007 2006
Present Value at April 1 . . . . . . . . . . . . ¥ 277,988 ¥174,763 ¥ 93,288 ¥ 471,753 ¥272,955 ¥138,993 ¥ 749,741 ¥ 447,718 ¥ 232,281
Consolidation of a subsidiary . . . . . . . . — 24,213 — — (11,464) — — 12,749 —Sales/Transfers of Oil and Gas
Produced, Net of ProductionCosts . . . . . . . . . . . . . . . . . . . . . . . . . (220,695) (87,338) (30,504) (57,826) (90,309) (75,468) (278,521) (177,647) (105,972)
Development Costs Incurred . . . . . . . . 67,381 51,190 31,993 21,217 118,543 119,761 88,598 169,733 151,754Purchases of Reserves in Place . . . . . . . — 74,203 — 6,065 15,286 1,633 6,065 89,489 1,633Extensions and Discoveries . . . . . . . . . 14,075 22,012 5,734 13,636 — 87,361 27,711 22,012 93,095Sales of Reserves . . . . . . . . . . . . . . . . . (44,026) 24 — (267,723) — — (311,749) 24 —Net Changes in Prices, Developmentand Production Cost . . . . . . . . . . . . . . . 383,154 91,332 51,594 77,619 84,037 (57,345) 460,773 175,369 (5,751)Revisions of Previous Quantity
Estimates*1 . . . . . . . . . . . . . . . . . . . . 175,921 (91,821) (11,786) 10,074 51,275 49,653 185,995 (40,546) 37,867Accretion of Discount . . . . . . . . . . . . . . 27,799 17,476 9,329 47,175 27,296 13,899 74,974 44,772 23,228Net Changes in Income Taxes . . . . . . . (135,031) 18,381 4,698 (36,286) (51,066) (23,129) (171,317) (32,685) (18,431)Others*2 . . . . . . . . . . . . . . . . . . . . . . . . (147,073) (16,447) 20,417 (642) 55,200 17,597 (147,715) 38,753 38,014
Net Changes for the Year . . . . . . . . . . . 121,505 103,225 81,475 (186,691) 198,798 133,962 (65,186) 302,023 215,437
Present Value at March 31 . . . . . . . . . . ¥ 399,493 ¥277,988 ¥174,763 ¥ 285,062 ¥471,753 ¥272,955 ¥ 684,555 ¥ 749,741 ¥ 447,718
*1 Includes amounts resulting from changes in the timing of production.*2 Main portion of “Others” is foreign currency translation adjustments and increase of royalty due to revision of previous reserves.
F-88

SIGNATURE
Pursuant to the requirements of Section 12 of the Securities Exchange Act of 1934, the registrant herebycertifies that it meets all of the requirements for filing on Form 20-F and that it has duly caused and authorizedthe undersigned to sign this annual report on its behalf.
MITSUI & CO., LTD.(Registrant)
Date: August 4, 2008 by /s/ JUNICHI MATSUMOTO
Junichi MatsumotoExecutive Vice President and
Chief Financial Officer


![Manharlal Trikamdas Mody and another v Sumikin Bussan International (HK) Limited · Manharlal Trikamdas Mody and another v Sumikin Bussan International (HK) Limited [2014] SGHC 123](https://static.fdocuments.us/doc/165x107/610123a66221331abe326e51/manharlal-trikamdas-mody-and-another-v-sumikin-bussan-international-hk-limited.jpg)