Mitigation strategies : temporary grasslands, intensive fertilisation · PDF...
33
Mitigation strategies : temporary grasslands, intensive fertilisation (eg. timing, quantity) and irrigation Katja Klumpp Animal Change training 12-01-2015 Dakar INRA, Grassland Ecosystem Research, Clermont-Ferrand, France
Transcript of Mitigation strategies : temporary grasslands, intensive fertilisation · PDF...
Mitigation strategies : temporarygrasslands, intensive fertilisation (eg.
timing, quantity) and irrigation Katja Klumpp
Animal Change training 12-01-2015 Dakar
INRA, Grassland Ecosystem Research, Clermont-Ferrand, France

2
Mitigation & Adaptation
N2O - Nitrous oxyde•Nitrous oxide in the atmosphere has risen by more than 16 percent since 1750.
Principale source :‐ Fabrication d’engrais azotés en agriculture.‐ Fertilisation azotee

EU‐27 emissions in
2008 (kg N per ha of agricultural land
per year).
Velthof et al 2014

4(Davidson, 1991; Granli & Bøckman, 1994; Wrage et al. 2001, Lehuger, 2009)
Principale source :‐ chaîne de réactions réalisées par la micro‐flore du sol, la dénitrification

5
The role of N2O in the nitrogen cyclePrecipitation & dry deposition
Mineral N fertiliser
Organic residue
Atmosphere
Vegetation
Atmospheric N2
N fixation
Ammonium Nitrite Nitrate
Groundwater, river, lakes
Soil ho
rizon
s
Nitrification
Organic Matter (R‐NH2)
Clay Minerals
Ammoniaixation
Dissolved organic N
N2O
N2
Nitrate, N2O, N2
NH3
NO N2O
NON2O
N2N2O
Plant consumption

6
Spatial variability of grasslands• Hot spots of N2O due to
– N-application from animals – Botanical composition – Soil parameters
• Inter-annual (climate)

7
Facteurs physiques du sol: Saturation en eau de la porosité du sol , température Oxygénation du sol Teneur en nitrate et en ammonium Teneur en N minéralisable et C organique métabolisable pH de la solution du sol
Facteur d’émission (EF) après d’apport d’unengrais N en fonction de la température du solet la saturation en eau de la porosité du sol(WFPS). (Flechard et al., 2007)
Facteur d’émission (EF) = émissions N20/ apport N
Facteurs de contrôle les émissions de N2O
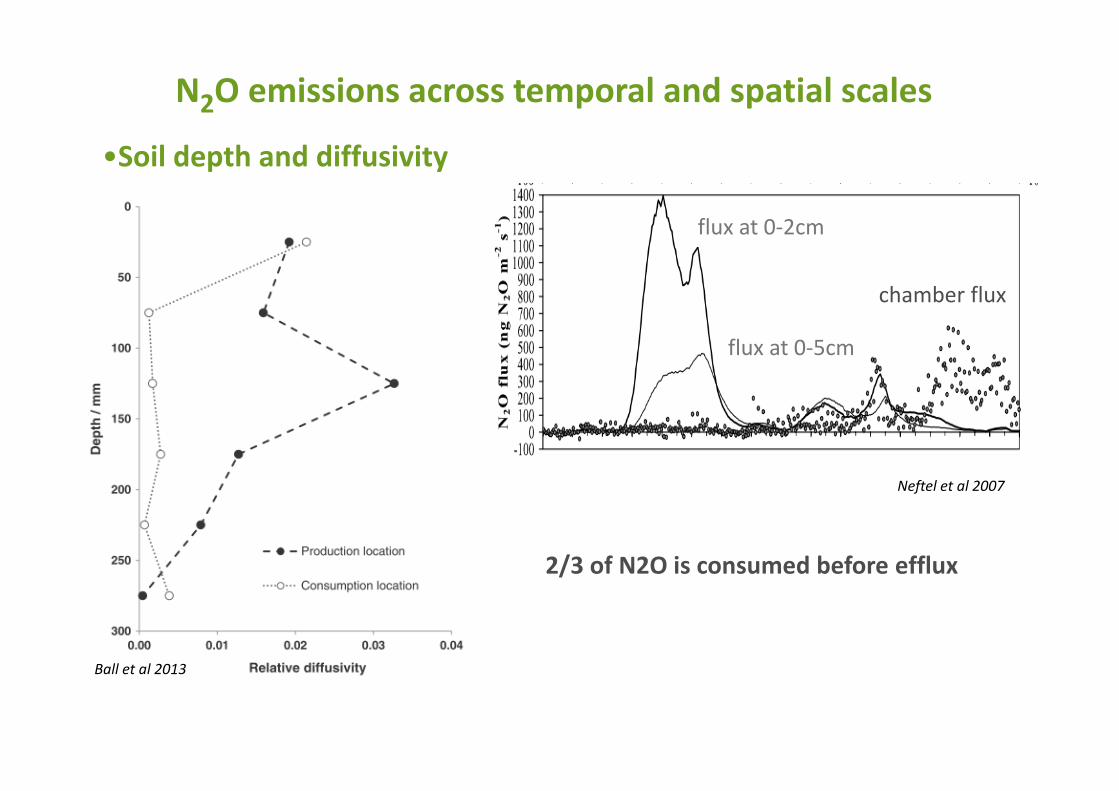
N2O emissions across temporal and spatial scales
flux at 0‐2cm
flux at 0‐5cm
chamber flux
Neftel et al 2007
•Soil depth and diffusivity
2/3 of N2O is consumed before efflux
Ball et al 2013
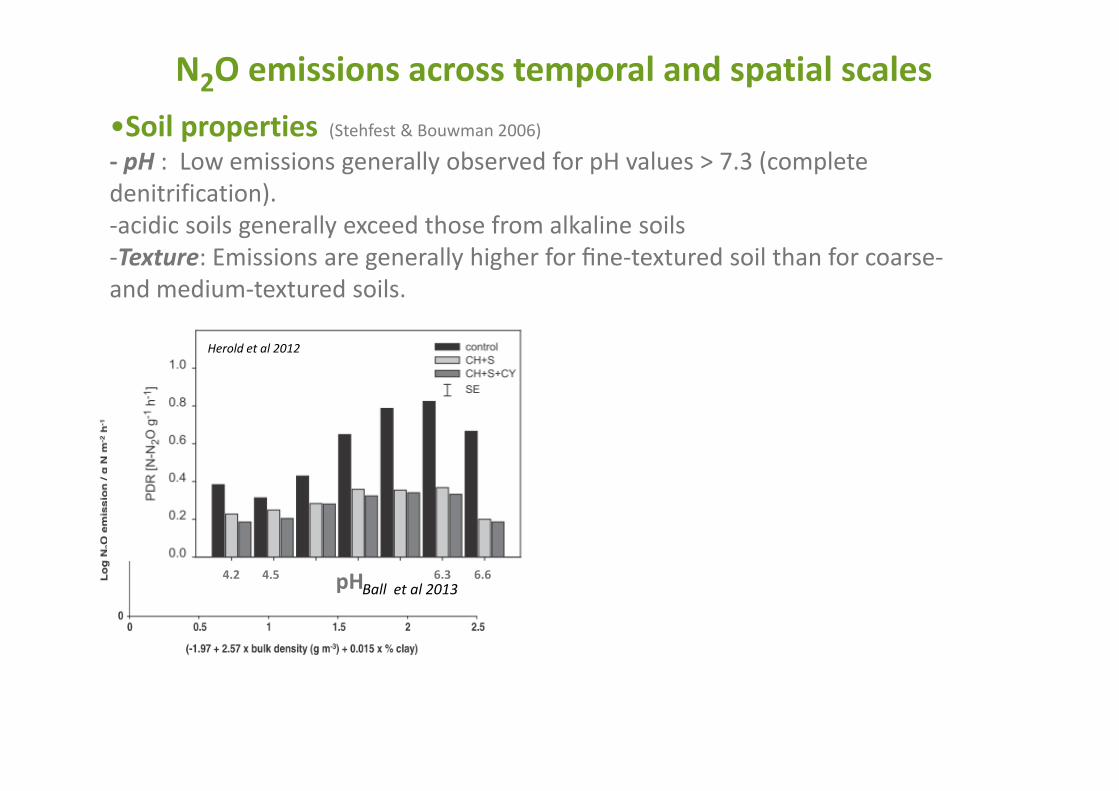
•Soil properties (Stehfest & Bouwman 2006)
‐ pH : Low emissions generally observed for pH values > 7.3 (complete denitrification). ‐acidic soils generally exceed those from alkaline soils‐Texture: Emissions are generally higher for fine‐textured soil than for coarse‐and medium‐textured soils.
Bulk density, texture
Ball et al 2013
N2O emissions across temporal and spatial scales
Herold et al 2012
pH4.2 6.66.34.5

Grassland
DOY
140 150 160 170 180 190 200 210
%15
N2O
em
issi
on
01020304050
Wat
er fi
lled
pore
spa
ce(%
)
0
20
40
60
80
N2O
em
issi
on (m
g N
m-2
d-1
)
0
1
2
3
4
5
6
N2O high cloverN2O low clover
**
*
*
*
•species identity: LegumesLegumes content may partly explain N2O emissions
Klumpp et al 2011
N2O emissions across temporal and spatial scales
Emissions are more attributable to the N release from root exudates and decomposition of N rich residues rather than from BNF per se.
(Rochette et al 2005, meta‐analyse, Stehfest&Bouwman 2006)
Cut+fert

11
Contrôle des émissions de N2O par dénitrification
(Rochette, 2011)

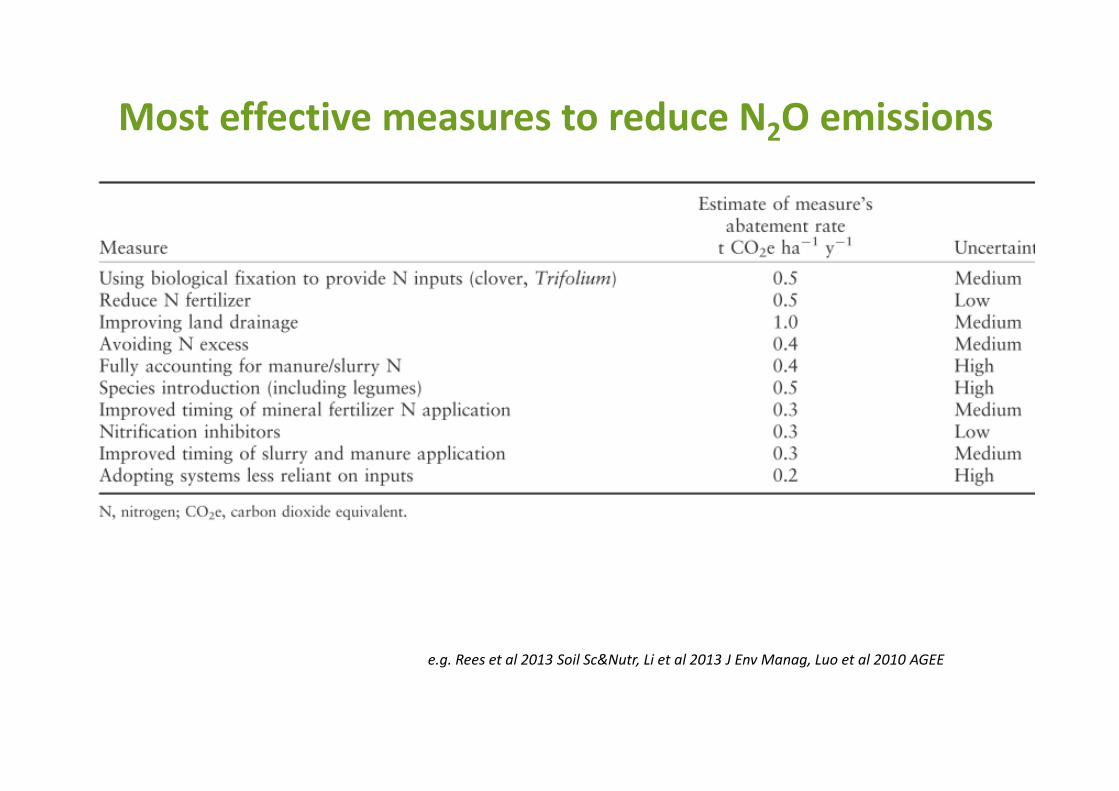
•Reducing grazing time is an effective option to reduce N2O losses (Schils et al 2012, Luo et al 2010, deKlein et la 2006).
e.g. Rees et al 2013 Soil Sc&Nutr, Li et al 2013 J Env Manag, Luo et al 2010 AGEE
Grasslands: Grazing vs cutting
N2O emissions and management
•True for unfavorable soil and climate conditions (i.e. humid soil)

Rafique et al 2012
grazing grazing mowingmowing
Nfert Nfert NfertUrea
N2O emissions are difficult to ascribe to grazing‐urine events as other variables favouring emissions often coincident (e.g. Tsoil, WFPS, Nfert).
Grasslands: Grazing vs cutting
N2O emissions and management

•Soil tillage
Ball et al 2013
N2O emissions and management
Luo et al 2010
• N2O emissions does not necessarily increased in anaerobic soils because of possible N2O consumption and microbial adaptation. •Soil matrix potential, volumetric water content, relative diffusivity, air permeability play a role

VanKessel et la 2013
N2O emissions and management
239 case studies using direct comparisons: In contrast to earlier studies, averaged across all comparisons, NT/RT
did not alter N2O emissions compared with CT
•Soil tillage

•Fertilisation techniques: nitrification inhibitors
Akiyama et al 2010 GCB
N2O emissions and management
(NIs), polymer‐coated fertilizers (PCFs), and urease inhibitors (UIs)]
Large differences in inhibitor efficiency depending on: ‐ inhibitor type (e.g. low for UI)‐ crop type‐ soil
Relative emission
Relative emission
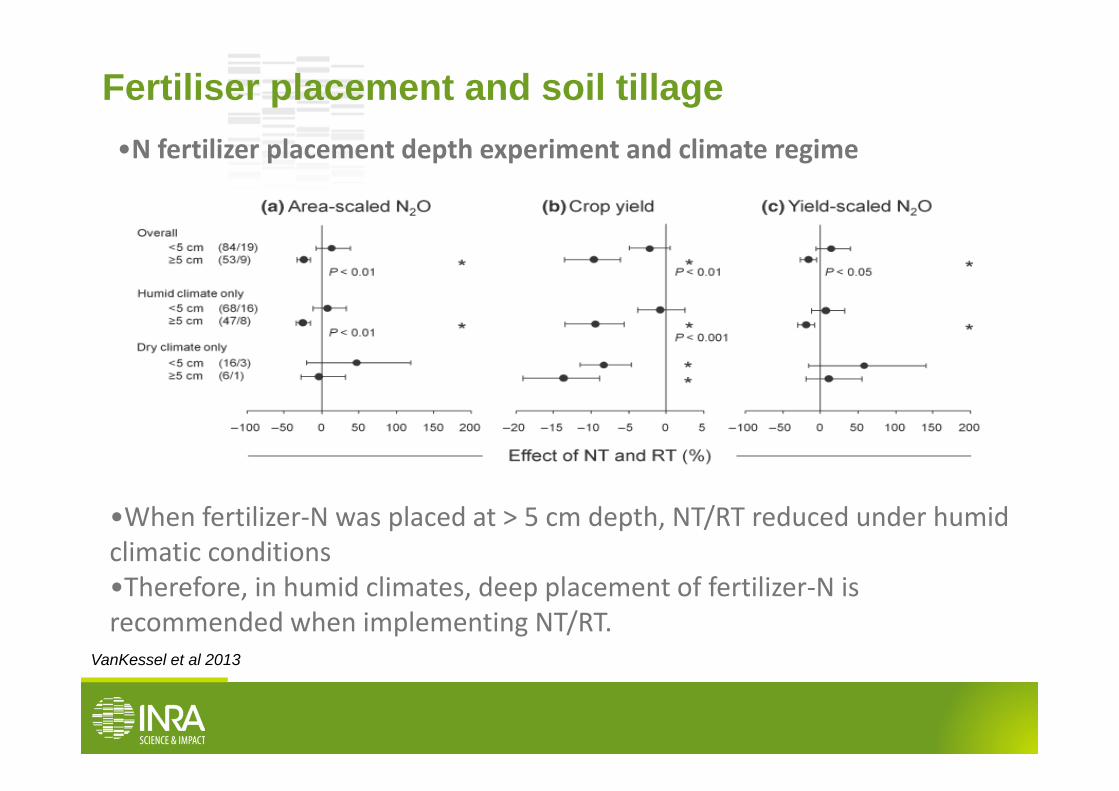
Fertiliser placement and soil tillage
VanKessel et al 2013
•N fertilizer placement depth experiment and climate regime
•When fertilizer‐N was placed at > 5 cm depth, NT/RT reduced under humid climatic conditions•Therefore, in humid climates, deep placement of fertilizer‐N is recommended when implementing NT/RT.
e.g. Rees et al 2013 Soil Sc&Nutr, Li et al 2013 J Env Manag, Luo et al 2010 AGEE
Most effective measures to reduce N2O emissions

20
• Direct seeding
• superficial tillage
• Cover crops and catch crops
• Life span of temporay sown grasslands
• use crops with high residues
• grass buffer strips
• hedges
Mitigation options linked to soil tillage and cropping systems

21
French study : The potential of agricultural practices to increase C storage in agricultural soils

French study : The potential of agricultural practices to increase C storage in agricultural soils
practices decreasing soilmineralisation rates practices increasing plant biomass input to soilpractices doing both
Selected measures:‐ Reduction in tillage‐ Introduction of cover crops‐ Expanding agroforestry and hedges‐ Grassland managementAdditional C storage /ha.yr

Additional C storage /yr
Pellerin, S.et al. 2013. How can French agriculture contribute to reducing greenhouse gasemissions? Abatement potential and cost of ten technical measures. Summary of the studyreport, INRA (France).
For some mitigation option, due to the low area concernedby the options, only low additional C could be stored
Taking into account the concerned area

Outline
Grassland management to mitigate climate change

FCH4FCO2
Flessivage
Stockage net de carbone
Fproduction animale
Example for C balance and GHG
FN2O
Grassland management to mitigate climate change
GreenGrass (2003 – 2005) Sur 9 sites prairial
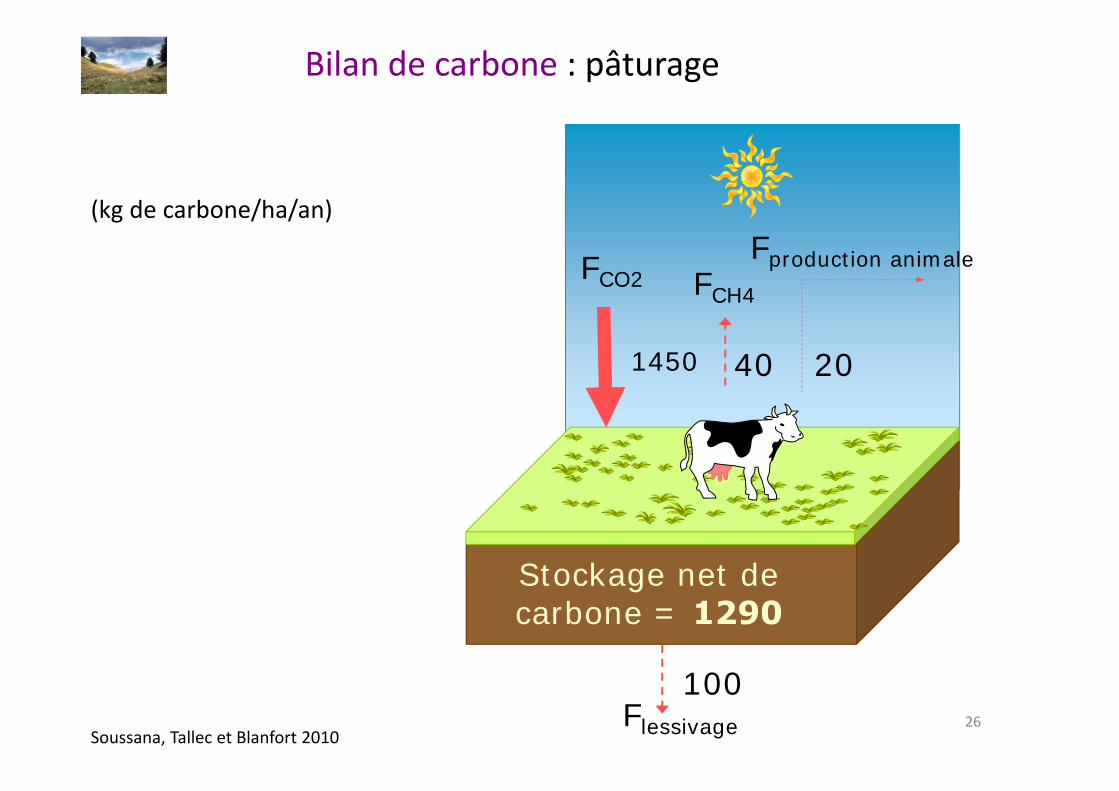
26Soussana, Tallec et Blanfort 2010
FCH4FCO2
Flessivage
Stockage net de carbone = 1290
Fproduction animale
1450 40
100
20
(kg de carbone/ha/an)
Bilan de carbone : pâturage

27
Bilan de carbone : fauche
Stockage net de carbone = 710 SNC @ étable = 270
SNC TOTAL = 980
A l’étable
FCO2@étable
FCH4@étable
Fproduction animale@étable
Fperte C labile
Feffluents
FCH4-effluents
340
Ffumier
Flessivage
100
FCO2
3700
Soussana, Tallec et Blanfort 2009
(kg de carbone/ha/an)
1910
130
60
510
1130
10
Stockage net de carbone = 270
Frécolte
3230
28
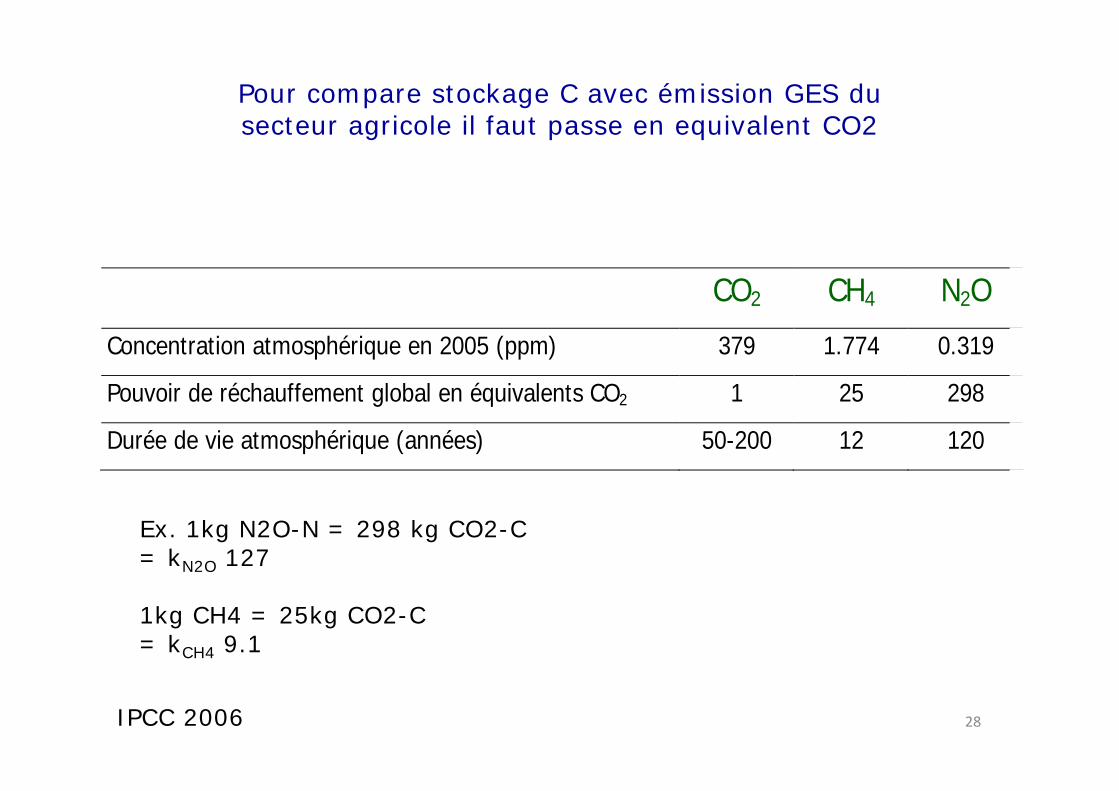
CO2 CH4 N2O
Concentration atmosphérique en 2005 (ppm) 379 1.774 0.319
Pouvoir de réchauffement global en équivalents CO2 1 25 298
Durée de vie atmosphérique (années) 50-200 12 120
Pour compare stockage C avec émission GES du secteur agricole il faut passe en equivalent CO2
IPCC 2006
Ex. 1kg N2O-N = 298 kg CO2-C = kN2O 127
1kg CH4 = 25kg CO2-C= kCH4 9.1

29
Bilan de GES sur la parcelle (en CO2eq)
Soussana, Tallec and Blanfort 2010
Le type de gestion a un impact sur le bilan de GESPâture semble le meilleur moyen de gestion pour améliorer le bilan GES, en
réduisant les émissions de GES, et en stockant plus de carbone Ces hypothèses sont à confirmer sur d’autres sites
Gestion StockageNetCarbonSNC
Emission CH4 Emission N2O Σ emission (CH4, N2O)
Bilan GES
parcelle
étable Total parcelle étable parcelle étable parcelle +étable
Paturage 4710 0 4710 1450 0 220 0 1670 3040
Fauche 2600 900 3590 0 4470 300 230 5000 -1410
kg CO2eq ha‐1 an‐1
source
puits
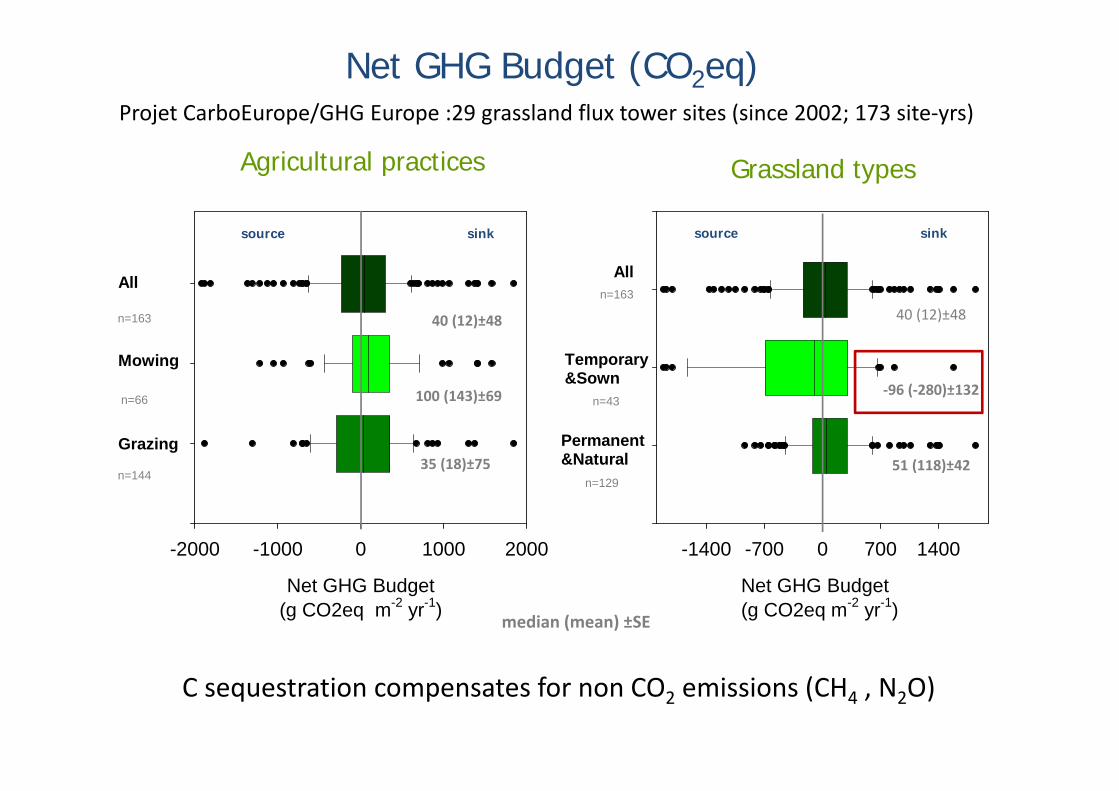
Net GHG Budget (CO2eq)
Net GHG Budget (g CO2eq m-2 yr-1)
-2000 -1000 0 1000 2000
Grazing
Mowing
All
40 (12)±48
100 (143)±69
35 (18)±75
n=163
n=66
n=144
Agricultural practices
sinksource
Net GHG Budget (g CO2eq m-2 yr-1)
-1400 -700 0 700 1400
Permanent&Natural
Temporary&Sown
Alln=163
n=129
n=43‐96 (‐280)±132
51 (118)±42
40 (12)±48
Grassland types
sinksource
median (mean) ±SE
C sequestration compensates for non CO2 emissions (CH4 , N2O)
Projet CarboEurope/GHG Europe :29 grassland flux tower sites (since 2002; 173 site‐yrs)

Critical management leading to zero C storage (GHG budget becomes a source)
Trade offs between production and environmental outputs
• TO1, betwen maximising C harvest (grazing and cutting) for animal
production and maximising C return to soil
• TO2, between maximising forage quality to increase digestibility and
reduce enteric CH4 and minimise root and shoot litter
decomposability (i.e. increase in mean residence time of SOC)
• TO3, between maximising animal stocking density and minimising
enteric CH4, Urin N2O and NO3leaching
Soussana & LeMaire 2014 AGEE
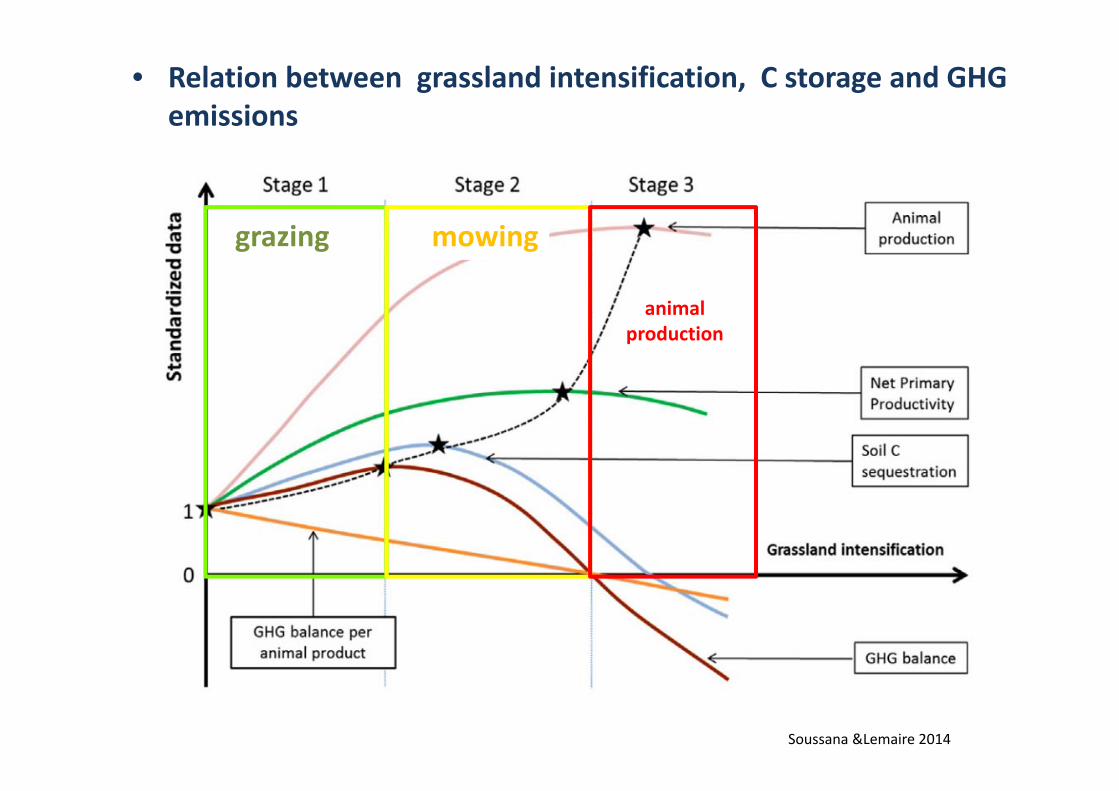
• Relation between grassland intensification, C storage and GHG emissions
Soussana &Lemaire 2014
grazing mowing
animal production

Thank you