Mitigation Actions in China: Measurement, Reporting …pdf.wri.org/working_papers/china_mrv.pdf ·...
26
Mitigation Actions in China: Measurement, Reporting and Verification FEI TENG, YU WANG, ALUN GU AND RUINA XU Institute Of Energy, Environment And Economy, Tsinghua University HILARY MCMAHON, DEBORAH SELIGSOHN World Resources Institute On Behalf Of E3G (ird Generation Environmentalism) TABLE OF CONTENTS INTRODUCTION ............................................................ SECTION I: MRV as an Element of a Global Climate Change Agreement ......... SECTION II: A Framework for Climate Change Policies in China ............... SECTION III: A Review of Policy Implementation and Measurement Structures Across Sectors ....................................... SECTION IV: Linking MRV on the Ground to the Global Climate Agreement ...... CONCLUSION ............................................................... 4 6 16 23 25 26 WORKING PAPER WORLD RESOURCES INSTITUTE • 10 G STREET, NE • WASHINGTON, DC 20002 • TEL: 202-729-7600 • FAX: 202-729-7610 • WWW.WRI.ORG June 2009 This paper seeks to facilitate progress on the provisions in the BAP by examining how Chinese climate change policy and the implementation of these policies is monitored at the domestic level and may offer insights to the international community as they consider an international structure for measuring, reporting and verifying developing country actions. China provides a rich set of examples of such policies due to its active efforts to cut its growth in energy use and reducing its dependence on fossil fuels. The paper therefore looks at mitigation policies and measures in China across a variety of sectors and at policies and measures that employ both qualitative and quantitative measurement systems. World Resources Institute Working Papers contain preliminary re- search, analysis, findings and recommendations. They are circu- lated without a full peer review to stimulate timely discussion and to influence ongoing debate on emerging issues. Most working papers are eventually published in another form and their content may be revised.
Transcript of Mitigation Actions in China: Measurement, Reporting …pdf.wri.org/working_papers/china_mrv.pdf ·...

Mitigation Actions in China: Measurement, Reporting and Verifi cation
FEI TENG, YU WANG, ALUN GU AND RUINA XUInstitute Of Energy, Environment And Economy, Tsinghua University
HILARY MCMAHON, DEBORAH SELIGSOHNWorld Resources Institute
On Behalf Of E3G (Th ird Generation Environmentalism)
TABLE OF CONTENTS
INTRODUCTION . . . . . . . . . . . . . . . . . . . . . . . . . . . . . . . . . . . . . . . . . . . . . . . . . . . . . . . . . . . .
SECTION I: MRV as an Element of a Global Climate Change Agreement . . . . . . . . .
SECTION II: A Framework for Climate Change Policies in China . . . . . . . . . . . . . . .
SECTION III: A Review of Policy Implementation and Measurement
Structures Across Sectors . . . . . . . . . . . . . . . . . . . . . . . . . . . . . . . . . . . . . . .
SECTION IV: Linking MRV on the Ground to the Global Climate Agreement . . . . . .
CONCLUSION . . . . . . . . . . . . . . . . . . . . . . . . . . . . . . . . . . . . . . . . . . . . . . . . . . . . . . . . . . . . . . .
4
6
16
23
25
26
W O R K I N G P A P E R
WORLD RESOURCES INSTITUTE • 10 G STREET, NE • WASHINGTON, DC 20002 • TEL: 202-729-7600 • FAX: 202-729-7610 • WWW.WRI.ORG
June 2009
This paper seeks to facilitate progress on the provisions
in the BAP by examining how Chinese climate change
policy and the implementation of these policies is
monitored at the domestic level and may offer insights
to the international community as they consider an
international structure for measuring, reporting and
verifying developing country actions. China provides a
rich set of examples of such policies due to its active
efforts to cut its growth in energy use and reducing its
dependence on fossil fuels. The paper therefore looks
at mitigation policies and measures in China across
a variety of sectors and at policies and measures that
employ both qualitative and quantitative measurement
systems.
World Resources Institute Working Papers contain preliminary re-search, analysis, fi ndings and recommendations. They are circu-lated without a full peer review to stimulate timely discussion and to infl uence ongoing debate on emerging issues. Most working papers are eventually published in another form and their content may be revised.

2 WORLD RESOURCES INSTITUTE WORKING PAPER
AEEI Annual Energy Effi ciency ImprovementAQSIQ General Administration of Quality Supervision, Inspection and Quarantine of the People’s Republic of ChinaBAP Bali Action PlanCAAC Civil Aviation Administration of China CCTDA China Coal Trade & Development AssociationCNCA Certifi cation and Accreditation Administration of the People’s Republic of ChinaCNCCP China’s National Climate Change ProgrammeCNIS China National Institute of StandardizationECPGD Energy Conservation Power Generation DispatchMEP Ministry of Environmental Protection MOF Ministry of Finance MLR Ministry of Land and Resources MOHURD Ministry of Housing and Urban-Rural Development of the People’s Republic of ChinaMOS Ministry of SupervisionMOST Ministry of Science and TechnologyMOU Memorandum of UnderstandingMRV Measurable, Reportable and Verifi ableMWR Ministry of Water ResourcesNBSC National Bureau of Statistics of ChinaNAMAs Nationally Appropriate Mitigation ActionsNDRC Th e National Development and Reform CommissionSERC State Electricity Regulatory CommissionSAC National Standardization Administration Committee of ChinaSASAC State-owned Assets Supervision and Administration Commission of the State CouncilSD-PAMs Sustainable Development Policies and MeasuresSEPA State Environmental Protection Agency (old name for MEP)SIIC Shanghai Industrial Investment Corporate
GLOSSARY OF ACRONYMS

MITIGATION ACTIONS IN CHINA: MEASUREMENT, REPORTING AND VERIFICATION 3
Th e Bali Action Plan, adopted by the Conference of the Parties to the United Nations Framework Convention on Climate Change in 2007, off ers an opportunity to create a new space for enhanced mitigation action in developing countries through Nationally Ap-propriate Mitigation Actions (NAMAs). Th e benefi t of NAMAs is the focus on national priorities and national circumstances, and the opportunities to garner support for these actions at the international level.
It is therefore worth assessing examples of national policies and mea-sures that can be measured, reported and verifi ed (MRV), as called for under the Bali Action Plan . Examining how countries them-selves currently undertake domestic mitigation policies and mea-sures, and monitor the programs for progress, could provide some useful lessons for the international MRV structure. China provides a rich set of examples of such policies due to its active eff orts to cut its growth in energy use and reducing its dependence on fossil fuels.
Th is working paper seeks to facilitate progress on the provisions in the Bali Action Plan by examining how Chinese climate change policy and the implementation of these policies is monitored at the domestic level and may off er insights to the international commu-nity. It aims to help policy-makers, UNFCCC negotiators and civil society groups navigate the variety of NAMAs and MRV relevant structures in China, and to demonstrate the linkages between provi-sions and processes on the ground and the high level
discussions under the UNFCCC. To do this, the paper looks at mitigation policies and measures in China across a variety of sectors and at policies and measures that employ both qualitative and quan-titative measurement systems.
Th is paper seeks to answer several pertinent questions including:
Does the use of a wide range of metrics, across a variety of sec-tors lend itself to MRV?How can the diversity of national priorities, policies and cir-cumstances be accommodated in a centralized MRV system? How can capacity be built around methodologies to better measure GHG reductions?How can the international systems best integrate the variety of reporting and verifi cation procedures that already exist on the ground?Where verifi cation processes do not exist, how should an MRV system go about fi lling this gap?What type of MRV system would be most eff ective at linking actions to support and how?
By understanding national MRV related systems, the international community can gain a head start on identifying opportunities and risks associated with the creation of an MRV system that contributes to the global goal of mitigation of greenhouse gases and sustainable development.
•
•
•
•
•
•
EXECUTIVE SUMMARYA review of mitigation actions in China - measurement, reporting and verifi cation related provisions

4 WORLD RESOURCES INSTITUTE WORKING PAPER
Th e Bali Action Plan (BAP) (United Nations, 2007), adopted by the Conference of the Parties to the United Nations Framework Convention on Climate Change (UNFCCC) in 2007, calls for “measurable, reportable and verifi able” (MRV) policies and measures to mitigate greenhouse gas (GHG) emissions in developing countries. Th ese “Nationally Appropriate Mitigation Actions” (NAMAs) are to be supported by parties through fi nancing, technology and capacity building. Th e BAP provisions off er an opportunity to consider the types of policies and measures that best suit individual countries’ circumstances, in light of these countries development challenges, institutional strengths and approaches to mitigation.
In considering how such a tailored approach to individual country actions would work under a global agreement, it is worth assessing examples of countries policies and measures that can be measured, reported and verifi ed (“MRVed” in the UNFCCC vernacular) and examining how countries themselves currently undertake eff orts to diversify their fuel mix. China provides a rich set of examples of such policies due to its active and varied policy eff orts to cut its growth in energy use and its dependence on fossil fuels. Although many of these policies are new or only reaching the implementation stage, there are others that already have MRV structures associated with them. Th ese policies and measures cover a range of sectors and are grouped under a set of national goals. Th e aim of this report is to profi le a number of policies across a variety of sectors to draw some lessons on MRV for the current negotiations under the UNFCCC.
Guide to this PaperTh is paper begins with an introduction to the concept of MRV. Th e following section looks broadly at the current framework for climate change policies and measures in China. Th is section also looks at the quantitative targets that exist, procedures for the gathering of energy data, and the more qualitative targets employed. Th e third section aims to highlight the specifi c structures that exist in sectors to support the process of measurement and reporting, and in some cases verifi cation of policies and measures. Th e last section looks at lessons and refl ections for the international climate community based on our review of measurement, reporting and verifi cation structures in China, Th ese lessons are limited by the availability of data and due to the fact that many of the structures that pertain to MRV are relatively new and untested. Th is section does however make the link between the essential questions that need to be answered at the international level and the reality on the ground in China.
Th roughout the paper there are tables of NAMAs which summarize the various potential NAMAs that have been reviewed as part of this research, the scope, the metrics associated with the policy or measure and the system of measure, reporting or verifi cation associated with it.
INTRODUCTION

MITIGATION ACTIONS IN CHINA: MEASUREMENT, REPORTING AND VERIFICATION 5
SECTION I. MRV AS AN ELEMENT OF A GLOBAL CLIMATE CHANGE AGREEMENTArticle 3.1 of the UNFCCC states: “Th e Parties should protect the climate system for the benefi t of present and future generations of humankind, on the basis of equity and in accordance with their common but diff erentiated responsibilities and respective capabilities. Accordingly, the developed country Parties should take the lead in combating climate change and the adverse eff ects thereof” (United Nations, 1992). Th is principle recognizes that an equitable and eff ective global agreement depends on a set of variables that diff er among countries, based on factors such as their contribution to climate change and their ability to commit fi nancial resources towards a solution. Under the Kyoto Protocol (United Nations, 1997), this principle has manifested itself in the distinction between Annex I countries (consisting of most of the OECD and eastern European countries), which have legally binding emission limits, and non-Annex I countries, which have non-binding responsibilities. Th e BAP builds upon this formulation, but also creates a new space for developing countries to commit to enhanced actions in return for enhanced support.
Th e BAP provisions acknowledge that developing countries are already making eff orts to reduce emissions and move towards a low carbon pathway. China is a good example: it has an ambitious set of policies and measures, which are discussed in detail in the next section. Th e BAP also creates a new space for developing countries to receive support for such actions. It stipulates that these countries will be provided with technology, fi nance, and capacity-building support for NAMAs. Th e BAP therefore broadens participation in GHG mitigation from previous agreements, while maintaining important distinctions between developed and developing countries. A policy framework that maintains this distinction and recognizes actions in both developing and developed countries will be an essential part of achieving a global climate agreement.
Th e phrase “measurable, reportable, and verifi able” was critical to the agreement of the BAP, and the way in which the concept of MRV is refl ected in the post-2012 agreement will have signifi cant implications for the eff ectiveness of that agreement for stakeholders in both developing and developed countries (Ellis and Larsen, 2008). Th is paper will highlight current measurement, reporting and verifi cation structures in China, which currently support the measurement of progress towards the fulfi llment of China’s plans and programs, that might be applicable in a post-2012 structure for MRV. It will not, however, make any specifi c proposals for negotiators; it only seeks to inform international discussion on how MRV could be applied in practice, and therefore what provisions might be required in a UNFCCC climate agreement.
Although the BAP does not precisely defi ne Nationally Appropriate Mitigation Actions (NAMAs), the term suggests that NAMAs will derive from national policies instituted domestically. Submissions from Parties to the UNFCCC suggest that these NAMAs should integrate two goals: changing a country’s economic development path to be more sustainable and contributing to greenhouse gas (GHG) mitigation. Other submissions suggest that NAMAs should respect the development right of developing countries and should be guided by their existing development plans or strategies (Winkler, 2008). NAMAs can achieve the goal of GHG mitigation through policies and measures that have either a direct or an indirect impact on emissions reduction. International support in fi nance, technology and capacity building could enhance the eff ectiveness of NAMAs if confi gured correctly.
Given the country-specifi c nature of these NAMAs, it is instructive to look at the way relevant policies are shaped and implemented today. In the remainder of this report we will look in detail at the case of China.
Th e BAP calls for “enhanced national/international action on mitigation of climate change, including consideration of:
(ii) “Nationally appropriate mitigation actions by developing country Parties in the context of sustainable development, supported and enabled by technology, fi nancing and capacity-building, in a measurable, reportable and verifi able manner.”
Text from the Bali Action Plan

6 WORLD RESOURCES INSTITUTE WORKING PAPER
Measurement, Reporting and Verifi cation in ChinaTh e national climate change goals for China are outlined both in China’s Five-Year Plan framework and in its specifi c climate change policy – the National Climate Change Program (National Development and Reform Committee, 2007c), released in June 2007. As detailed below, both the national program itself and the various sector-specifi c programs within it have metrics associated with them, as well as reporting and in some cases verifi cation procedures. Th e extent to which all of these provisions have been implemented diff ers, as many of these reporting and other systems are new, and are therefore largely untested. In general, our review of China’s mitigation policies and measures fi nds that China has programs with targets attached that have supportive policies and measures and that these policies and measures are diverse in terms of their mitigation impact. Further our review fi nds that not all policies have stated metrics associated with them, in cases where they do exist, the set of metrics are both quantitative and qualitative in nature, and are both outcomes-based and process-based.
In many cases, China has provisions for reporting; however, these diff er greatly by policy and program. In addition to reporting, China also has verifi cation procedures, some of which involve cross-checking data, but most of which involve spot-check inspection systems. As these systems were introduced recently in most cases it is not yet possible to test the quality of the systems or the data they produce. Furthermore, it should be noted that some policy review and data collection processes are centralized, others are decentralized, leading to a very diverse MRV system for climate related policies and measures.
SECTION II: A FRAMEWORK FOR CLIMATE CHANGE POLICIES IN CHINAChina’s Five-Year Plans are a series of comprehensive national planning documents that guide economic and social development. A Five-Year Plan is approved by the National People’s Congress and provides general guidance for development by setting integrated goals for all government organizations every fi ve years. Under the general Five-Year Plan, diff erent sectors also prepare sectoral Five-Year Plans, including those for renewable energy development and sector-specifi c energy conservation plans. In 2006, the National People’s Congress approved its 11th Five-Year Plan for the years 2006 through 2010 (Government of China, 2006).
In June 2007, the National Development and Reform Committee (NDRC) published China’s National Climate Change Program (CNCCP) (National Development and Reform Committee, 2007c). Th is was the fi rst time the Chinese government had synthesized its climate strategies at the national level. In October 2008, the government of China published a white paper on climate change (Government of China, 2008). China’s national-level mitigation actions can be identifi ed from the Five-Year Plans the CNCCP and the white paper. Under the terms of the BAP, these mitigation actions could be considered “nationally appropriate” since they are identifi ed by the Chinese government, take into account the priorities of the host country, with a focus on development, and off er signifi cant mitigation benefi ts.
TABLE 1.. MRV Metrics and Mechanisms in China’s Five-Year Plan
NAMA Scope Metric Reporting Mechanism Verifi cation Mechanism Time FrameFive-Year Plan National
comprehensive planning docu-ment
Qualitative evalu-ation of policyimplementation
Annual work report by premier and by each ministry
Monitored and verifi ed by stand-ing committee of National People’s Congress
New targets set every fi ve years

MITIGATION ACTIONS IN CHINA: MEASUREMENT, REPORTING AND VERIFICATION 7
Figure 1 and Table 1 illustrates how policy set in the Five-Year Plan is translated into specifi c programs at the national, provincial and local level. While these goals may be quite specifi c in terms of a percentage target for reforestation or energy intensity or an immunization rate, the Five-Year Plan does not set out detailed implementation measures. Rather, the goals are set by the National People’s Congress, which approves the Plan, and then it is up to the State Council and the Ministries to formulate the actual programs for implementation.
TABLE 2. Major Climate-Related Targets in the 11th Five-Year Plan
Indicators Status In 2005
Target for 2010
Achieve-ment in 20081
Economic Structure
Share of service industry’s contribution to GDP
40.3% 43.3% 40.1%
Urbanization rate 43% 47% 45.7%R&D as a percent-age of GDP
1.3% 2% 1.52%
Emission Related
Energy intensity (energy consumption per unit of GDP)
20% reduction
from 2005 levels
10.08%
Rate of compre-hensive use of solid industrial waste
55.8% 60%
Forest coverage as a percent of total land cover
18.2% 20%
1Data in year 2008 come from annual statistics communiqué published by NBS and annual “Report of the work of government” delivered by Premier Minister. Data for forest coverage and waste recycle rate are not available from these sources.
Source: Government of China, 2006
5-Year Plan
Energy and Environmental Policy (Energy Con-servation and Pollution Abatement)National Climate Change Program
National Level Programs (such as 1000 Enterprises, Priority Dispatch, Industry Specifi c Effi ciency Standards, Renewable
Energy Programs)
Programs
• Set by State Council• Implemented by the ministries
• Set by State Council• Approved by the National
• Administered by the ministries and delegated to provinces and delegated to provinces and industries
• Administered at the provincial, local and industry level
FIGURE 1: Hierarchy of Plans and Supportive NAMAs in
Source: Tsinghua University

8 WORLD RESOURCES INSTITUTE WORKING PAPER
QUANTITATIVE TARGETS IN NATIONAL MITIGATION POLICIESNational policy on energy conservation and climate change plays an important role in overall national strategy. Th e 11th Five-Year Plan sets 22 quantitative targets in four categories: economic growth, economic structure, environment and resources, and public services. Th ese are quantifi able national development or economic growth metrics; examples of these targets are shown in Table 2.
In June 2007, the government of China published China’s National Climate Change Program (CNCCP). Below are listed the CNCCP’s major quantifi ed objectives related to climate to be achieved by 2010, including the ambitious target of reducing the nation’s energy intensity by 20 percent:
Reduce national energy intensity (energy consumption per unit of GDP ) by 20 percent from 2005 levels and decrease emissions of the main pollutants by 10 percent from 2005 levels. Th e energy intensity per unit of GDP was 1.22tce/10,000 RMB in 2005 and China’s goal is to reduce it to less than 1tce/10,000 RMB by 2010 (National Development and Reform Committee, 2007b). Th is energy saving target is a core target in several national Five-Year Plans and the CNCCP. In addition to setting reduction targets, a package of supportive policies and measures was also introduced and implemented to achieve this goal. Th e details of how the government will measure, report and verify these targets will be discussed later in this section, and are outlined in Figure 2.Increase the use of alternative energy to 10 percent of primary energy consumption by 2010. China plans to achieve this target by developing renewable energy (including large-scale hydropower), boosting the construction of renewable power plants (wind, biomass and solar), and accelerating the development and utilization of biogas and biofuel (National Development and Reform Committee, 2007a).
Th e NDRC issued its Medium- and Long-Term Development Plan for Renewable Energy in September 2007. Th e Plan establishes targets for the development of various sources of renewable energy up to 2020, calling for the percentage of renewable energy to rise to 10 percent of total energy consumption by 2010 and 15 percent by 2020. An investment of RMB 2 trillion into renewable energy development in China before 2020 is envisaged to reach this goal. In addition, the plan establishes that the government will adopt a variety of measures to stimulate the development and use of renewable energy. Th ese include a wind power concession program, feed-in tariff s, green electricity voluntary markets and preferential fi nancial and tax policies, including funds to subsidize the development of renewable energy sources (National Development and Reform Committee, 2007a).
•
•
Th e State Council heads China’s executive branch and is led by Premier Wen Jiabao, with Vice Premiers and State Councilors each overseeing several ministries. Th e State Council has its own offi ces, which manage both the development of the Five-Year Plan and of various more specifi c plans, especially when these plans are cross-cutting. In considering MRV opportunities, this paper focuses on two such plans issued by the State Council: the Energy and Environmental Policy and the National Climate Change Program. Both assign specifi c programs and targets to multiple ministries. Th e Energy and Environment Policy has a somewhat higher status in Chinese policy-making because energy conservation and pollution abatement have been set as national policies—the highest level at which a target can be designated.
Ministries are subsequently assigned programs to implement. Th ese are then implemented directly or delegated either to the provinces or to national-level state enterprises. Th e “1000 Enterprise Program,” for example, focuses specifi cally on reducing energy consumption in the one thousand largest national-level state enterprises, accounting for roughly one-third of Chinese energy consumption. Th us, the NDRC assigns targets directly to the companies and assigns teams to inspect the enterprises.
Th e NDRC also administers a number of programs that help promote energy intensity improvements, for example specifi c measures for industry, buildings, etc. Provinces receive instructions and targets for energy conservation under these programs. By carrying out these instructions they contribute to achieving both their specifi c sectoral targets and the overall provincial energy intensity goal. Provinces also assign targets to the cities and counties in their jurisdiction, and to individual companies. Most provinces have copied the “1000 Enterprises” model for the larger fi rms under their supervision.
Th e Energy Effi ciency and Pollution Abatement Program goals have been assigned to the NDRC and the Ministry of Environmental Protection (MEP). All other ministries have been tasked with setting sectoral energy intensity targets, which are coordinated by the NDRC. Th e NDRC also plays a major role in implementing targets under the CNCCP, but a much larger number of ministries are involved.
In addition to the NDRC and MEP, the Ministry of Foreign Aff airs continues to have an important role in international negotiations; the State Forestry Administration is responsible for the reforestation goals; the Ministry of Science and Technology, the Chinese Academy of Sciences and the State Meteorological Administration are responsible for climate science, and the fi rst two are also responsible for technology development; agriculture and the various resource ministries, as well as the Ministry of Civil Aff airs all have a role in adaptation; and the Ministry of House and Urban Construction and the Ministry of Communications are responsible for the building and transportation sectors. Th is list is not exhaustive but illustrates the number of players involved in China’s climate change policy review.
Roles and Responsibilities of Government Bodies in Climate Change Policy in China

MITIGATION ACTIONS IN CHINA: MEASUREMENT, REPORTING AND VERIFICATION 9
For example, to increase the attractiveness of wind energy projects in China, the Value Added Tax (VAT) for wind generation equipment has been lowered from 17 percent to 8.5 percent, and income tax for wind projects has been cut from 33 percent to 15 percent.
Keep N2O emissions in 2010 stable relative to 2005 levels. Th e government aims to control GHG emissions generated through industrial processes by implementing effi ciency policies in various sectors, including metallurgy, building materials and the chemical industry, as well as developing a recycling economy, increasing resource effi ciency and strengthening control of N2O emissions (National Development and Reform Committee, 2007c).Increase Forest cover to 20 percent of total land cover by 2010. China aims to continue key aff orestration projects, converting cropland on steep slopes into forest, grassland, and natural forest protected areas, and improving basic farmland to increase forest cover from 18.2 percent in 2005 to 20 percent by 2010 (National Development and Reform Committee, 2007c).
Not all targets in the 11th Five-Year Plan are listed in the CNCCP because not all policies and measures contributing to sustainable development have an impact on climate change. In the following section, we select the 20 percent energy intensity reduction target as a case study to explore how a domestic framework for implementation can off er an example of how China could construct measurable, reportable and verifi able national policies.
•
•
Gathering and assessing Energy Data in ChinaTh e main metric used is energy intensity of GDP, which is measured through an energy accounting system. Th e State Council to the NDRC and the National Bureau of Statistics (NBS) jointly set the standards and implemented a comprehensive system to review performance towards its goals. NBS collects the data and the NDRC leads a verifi cation and inspection process. Th e NDRC has allocated energy conservation targets to every province, autonomous region and municipality. Th e regional governments have further allocated targets to cities, counties and key energy-intensive enterprises. All levels of government then report through their Statistics Departments. Th e Provincial and National levels of the NDRC then inspect enterprises to ensure compliance.
Th e energy accounting system covers three areas: energy production; energy circulation (transmission and distribution) among diff erent provinces; and energy consumption. Th e system is intended to collect energy data from specifi c sectors as needed to calculate the energy intensity of GDP as accurately as possible. Figure 2 demonstrates the primary data and end use sectors covered by this process.
Several specifi c sectoral plans have been developed under the Five-Year Plan including the forestry sector. Quantitative targets are also identifi ed in these sectoral plans. For example, Table 3 shows the energy intensities and targets for major industry sectors as specifi ed in the energy development plan.
TABLE 3 Energy Intensities and Targets for Major Industrial Products
Year 2000 Year 2005 Year 2010 Targets
Th ermal Power (gce/kWh) 392 370 355Steel (kgce/t) 784 700 685Aluminum (tce/t) 9.923 9.595 9.471Cement (kgce/t) 181 159 148Ethylene (kgce/t) 848 700 650Railway transportation (tce/Mt*km) 10.41 9.65 9.4Source: National Development and Reform Committee, 2004
10 WORLD RESOURCES INSTITUTE WORKING PAPER
ENERGY PRODUCTION ENERGY CONSUMPTIONENERGY CIRCULATION
Large scale industry:organized by NBSC and submit seasonal report
Small scale industry: (annual income less than 5 million RMB) organized by NBSC and submit seasonal report
Coal: CCTDA organize investiga-tion on regional coal sale and report every season
Crude oil: the data of production come from the monthly produc-tion report, the purchase comes from seasonal energy consumption report, and the import comes from custom import and export report
Oil products: NBSC organize the investigation and report every season
Natural gas: the circulation be-tween diff erent provinces will be reported by the top 3 petroleum companies
Electricity: data from State Elec-tricity Regulatory Council
Other energy: refer to crude oil
Industry: NBSC will investigate the consumption of coal, NG, oil, electricity, etc. and report every season
Agriculture: NBSC organize the investigation and submit annual report
Building: whole investigation should be submitted on survey year, and extrapolated data should be submitted on non-survey years, and the MOHURD should be orga-nized by MOHURD and submit annual report
Transportation:
Rail/air/pipeline: MOR, local railway council, CAAC, pipeline department of the top 3 petroleum companies will investigate the situ-ation and submit annual report
Road/ship/port: NBSC will be in charge of the statistics and report every year
Residence: NBSC spot checks the energy consumption on urban and rural residences and reports every year
FIGURE 2. Data Sources for Measuring Energy Intensity of GDP
NBS = National Bureau of Statistics of China;
CCTDA = China Coal Trade & Development Association;
MOHURD = Ministry of Housing and Urban-Rural Development;
CAAC = Civil Aviation Administration of China;
MOR = Ministry of Railway Source: Tsinghua University

MITIGATION ACTIONS IN CHINA: MEASUREMENT, REPORTING AND VERIFICATION 11
Th e procedure for reporting the data identifi ed in Figure 2 is depicted in Figure 3:
First, the provincial government submits a self-assessment report to the State Council and the NDRC by the end of March, based on data from the energy accounting system. Second, the NDRC and other related departments, such as the National Bureau of Statistics and the State-Owned Assets Supervision and Administration Commission (SASAC) verify and assess the implementation of energy conservation in the local government. Based on an on-site assessment and spot checks, the NDRC drafts an examination report and submits it to the State Council by the end of May each year. Th ird, the State Council examines and approves the examination report and returns it to the NDRC.Finally, the NDRC reports the energy savings to the general public
Th e Central government assesses and verifi es the progress of provincial governments in achieving their energy conservation targets (see Figure 4). A government-approved assessment team conducts an on-site assessment, spot checks for more than 10 percent of key enterprises annually, and submits an assessment report, which includes ten indicators (see Figure 5). Th e fi rst indicator is the reduction rate of energy intensity per unit of GDP. Th e other nine are qualitative indicators that evaluate the implementation of energy conservation measures.
•
•
•
•
FIGURE 3. Examination and Reporting System for Energy Intensity of GDP
MOS: ministry of supervisionSASAC: State-owned Assets Supervision and Administration Commission of the State CouncilAQSIQ: General Administration of Quality Supervision, Inspection and Quarantine of the People’s Republic of China
Provincial government and 1000 Enterprises Program
Th e State Council
NDRC, MOS, SASAC, AQSIQ, NBSC
Th e public
Examine and approve
Before the end of May
Before the end of March
Self Assessment Report
• To what level has the energy savings target been achieved?
• To what level have the energy savings measures been fulfi lled?
Examination Report
• To what level has the energy savings target been achieved?
• To what level have the energy savings measures been fulfi lled?
Source: Tsinghua University
FIGURE 4. Verifi cation System for Energy Intensity Data
Monitoring system
Progress of energy saving
Data quality of energy intensity of GDP and its
decrease rate
National level:energy
intensity of GDP
Key energy intensives
enterprises: energy
consumption per unit product
Top 10 energy saving projects:
indicator of recycledresource
utilization
Industry level:energy
consumption per unit products
value added
GDPGross
energy consumption
Source: Tsinghua University

12 WORLD RESOURCES INSTITUTE WORKING PAPER
TABLE 4. Summary of MRV Metrics and Mechanisms for Other National Mitigation Policies
NAMA Scope Metric Reporting Mechanism Verifi cation Mechanism Time FrameGDP Restructuring
National Share of GDP repre-sented by the service sector
NBS publishes a yearly statistics bulletin
Internal data quality assurance system within NBS
5 year goal, an-nual progress reports
Technology Development
National Share of GDP rep-resented by R&D spending
NBS, MOST and MOF jointly publish a yearly statistics bulletin
NBS and MOST collect en-terprise-level data separately
5 year goal, an-nual progress reports
Energy Intensity
National, with targets given to each province, local-ity and State-owned enterprise
Energy used (MTCE/Unit GDP)
Calculated by NBS and published in a semi-an-nual statistics bulletin
Collected from multiple sources to ensure cross-check-ing
Five year goal. Many data are tabulated month-ly. Provinces are required to report semi-annually
Renewable Energy
National, with targets given to provinces and power generation companies
Renewable energy portfolio standard (specifi ed percentage of renewable in total output)
Energy Bureau aggregates data from NBS, various ministries and industrial associations
Internal data quality assur-ance system within various ministries and cross-checking
Goals to year 2010 and 2020, calculated annually
Waste Recycling
National, industrial sector
Percentage of industri-al solid waste recycled
Calculated by Ministry of Environment Protection and published in a yearly bulletin
Internal data quality assur-ance system within MEP
Five year goal from 2006 to 2010
Forest Cover National Percentage of total landmass planted in trees
State Forestry Administra-tion conducts national forest resource inventory
Remote sensing and ground-truthing
Five year and longer-term goals
MOST = Ministry of Science and Technology, NBS = National Bureau of StatisticsMOEP = Ministry of Environment Protection, SFA = State Forestry AdministrationMOF = Ministry of Finance
QUALITATIVE CLIMATE CHANGE POLICIES IN CHINAChina’s mitigation actions do not consist solely of quantifi ed targets, but also include a set of supportive policies and measures, as summarized in Table 4. Th ese are designed to provide an enabling environment suitable to achieving the targets. Th e outcome of these supportive policies and measures may be diffi cult to quantify. For example, the CNCCP has identifi ed the enhancement of research and development, of institutional management and of public awareness as important mitigation policies and measures. In contrast to quantifi ed targets, these policies and measures may only have indirect mitigation benefi ts. On the other hand, some of these measures, such as fuel tax regimes, may have signifi cant impacts on energy consumption and related emissions long-term, so should therefore be considered important.
Source: Tsinghua University
FIGURE 5. Evaluation System for Energy Conservation Target
Assessment of energy conservation
Energy conservation target
Reduction rate of energy intensity
Organization and coordination
Target decomposition
Economic structure adjustment
Implementation of key projects
R&D of energy saving technologies
Energy conservation in key enterprises
Implementation of laws and regulations
Institutional development
Energy conservation measures

MITIGATION ACTIONS IN CHINA: MEASUREMENT, REPORTING AND VERIFICATION 13
Energy LegislationTh e Chinese Renewable Energy Law, enacted in January 2006, provides a comprehensive renewable policy framework at the national level. Th e law covers a variety of areas including resource investigation, renewable energy planning, grid connection for renewable generation projects, fi scal and taxation measures, technology research and development, and also education and public awareness.
Th e Energy Conservation Law of China was enacted in 1998. Th is focused primarily on energy conservation in the industrial sector and lacked incentives and compliance mechanisms. In June 2007, an amendment was drafted and submitted to the People’s Congress for approval. It extended the scope from the industrial sector to the residential and transportation sectors, established a framework for energy saving regulations and standards, provided a set of incentive policies ranging from tax reductions to subsidies, identifi ed the central and local government as the focal point to take responsibility for implementation and also strengthened the compliance articles in the law.
Th e Circular Economy Law was enacted by the Chinese government in 2004. Th e Circular Economy Law aims to improve productivity, reduce costs and achieve economic, social and environmental targets
as well as to realize the “reduce, reuse and recycle” principle from production to distribution and consumption. In January 2009 the Circular Economy Promotion Law was enacted to better specify how attain the aims of the Circular Economy. Th is law has seven chapters with 59 articles and adopts a key supervisory role over energy- and resource-intensive enterprises.
China is in the process of developing a more comprehensive system of energy legislation. A new Energy Law is now undergoing stakeholder consultation, and further legislation on electricity, coal and oil is under development.
Th e Energy Law itself is only a framework to guide the activity of government agencies and enterprises. Th e effi cient enforcement of laws depends on detailed incentive policies, regulations, and standards. For example, there are more than 300 regulations in the process of being formulated for the Circular Economy Promotion Law. After the enactment of the Energy Conservation Law, the General Administration of Quality Supervision, Inspection and Quarantine and National Standards Administration Commission was appointed to develop and update regulations and standards related to energy conservation. Some major national standards are listed in the next section; most were enacted in June 2008.
TABLE 5. Summary of MRV Metrics and Mechanisms for Energy Effi ciency
NAMA Scope Metric Reporting Mechanism Verifi cation Mechanism Time FrameEffi ciency Standards
Multiple industries and consumer products
Energy use per physical unit of output
Industrial processors and product manufacturers report the energy effi ciency of their products and pro-cesses when asking for approval and registration
Energy saving verifi ed by Energy Conservation Technology Service Center at national and local level
Effi ciency Labeling
Multiple Products
Energy use during product operation
All products in a given product category must be tested for energy effi ciency and labeled accordingly, with test results reported to National Institute of Standardization (NIS)
Test results verifi ed by Energy Label-ing Management Center under NIS
New products will be added accordingly
SAC: in charge of energy effi ciency standards
NDRC: carry out and suggest energy effi ciency measures
National Technical Committee on Environmental Protection Product of Standardization Administration of China: organize technological aspects of energy effi ciency standards
CNIS: Research
energy effi ency standards
Industry association: Supply analysis,
involved in establishing & amending standards
Test labs: alidation and tests
Industries: Involved in establishing and
amending standards
FIGURE 6. Th e Organization and Management of China’s Energy Effi ciency Standards
SAC: National Standardization Administration Committee of ChinaNDRC: National Development and Reform CommitteeCNIS: China National Institute of Standardization Source: Tsinghua University

14 WORLD RESOURCES INSTITUTE WORKING PAPER
Regulations and StandardsEnergy Effi ciency StandardsEnergy effi ciency standards and the energy effi ciency labeling system are two important measures aimed at enhancing the effi ciency of electric appliances. In the 1980s, China formulated its fi rst set of energy effi ciency standards, which included nine types of appliances. Th e energy standards system currently includes 23 types of products, including appliances, lighting elements and general industrial equipment. Th e breakdown of responsibilities or setting energy effi ciency standards is laid out in Figure 6.
Comprehensive information on the 23 product categories is publicly available. All of the products that enter the market must achieve the relevant standard. Th is is verifi ed by the State Administration for Industry & Commerce. Energy Effi ciency LabelingTh e energy effi ciency labeling system was established in 2004 with the goal of providing energy saving information to consumers. Th e aim of this measure is to help consumers save energy, encourage manufacturers to improve the energy effi ciency of their products, and to encourage distributors to select products with high energy effi ciency. For example, as of March 2005, TV sets and air conditioners with an energy effi ciency rank lower than 5 cannot enter into the market. Th is measure plays an active role in promoting energy saving on a large scale.
Th e energy effi ciency label includes (1) product specifi cations and type; (2) energy effi ciency grade; (3) estimated energy consumption of the product; (4) number of the applicable national energy effi ciency standard. To determine the energy effi ciency grade of the product the manufacturer or importer may either use its own testing capacity or a testing institution accredited by the State.
Th ere are two kinds of labels in the energy effi ciency labeling system. One is the Energy Conservation Certifi cation, and the other is the China Energy Label (see Figure 7). Th e Energy Conservation Certifi cation is awarded to equipment that meets specifi c energy effi ciency standards or technology criteria. Th ere is no information about the product’s energy effi ciency on the label. In contrast, the China Energy Label is an information label that provides consumers with information about the product’s energy effi ciency.
Th e China Energy Label is mandatory on all relevant consumer products. A manufacturer or importer is responsible for the accuracy of the information on the energy effi ciency label it uses and cannot forge or imitate any energy effi ciency label. Th e AQSIQ (Administration of Quality Supervision, Inspection and Quarantine) and the NDRC must, in accordance with their respective duties, inspect the products listed in the “Catalogue” and verify the information on energy effi ciency labels, as shown in Figure 8.
FIGURE 8. Organization System of Energy Effi ciency Label
organizationauthorization supervisionsuggestioninformation sharingbulletin
1.2.3.4.5.6.
checkrecord and ratifylodge a complaint & query;lodge a complaint & report; social supervision
7.8.9.10.11.
Organization and implementation: NDRC, AQSIQ, CNCA
Authorization:CNISMedia
Quality supervision organizations
Local departments related to energy saving and quality supervision
Consum
ers
Dealers
Enterprises/im
porters
10 10
1111
3
7
2 4
8 9 8
6
3
5
1
AQSIQ: General Administration of Quality Supervision, Inspection and Quarantine of the People’s Republic of ChinaCNCA: Certifi cation and Accreditation Administration of the People’s Republic of ChinaCNIS: China National Institute of Standardization
Source: Tsinghua University
FIGURE 7. Th e China Energy Label

MITIGATION ACTIONS IN CHINA: MEASUREMENT, REPORTING AND VERIFICATION 15
Incentive PoliciesTh e Chinese economic system is a combination of central planning and market mechanisms, including targeted taxes. Taxes are not only an important source of fi scal revenue in China, but can also be used as a tool to guide consumer and investor behavior. As shown in Figure 9, China’s tax system currently employs seven diff erent categories of taxes, including turnover taxes such as value-added taxes (VATs) and consumption taxes.
Value-added taxes have been used to encourage renewable and energy conservation projects in China. For example, to increase the attractiveness of wind energy projects in China, the VAT for wind generation equipment has been lowered from 17 percent to 8.5 percent and income tax for wind projects has been cut from 33 percent to 15 percent. Consumption taxes are also being employed to drive conservation. In December 2008, the Chinese government announced plans for a fuel tax, which will be collected beginning in 2009. Th e fuel tax has been debated for more than a decade. It will start at 1 RMB per liter of petrol and the revenue generated will replace road tolls as a funding source for highway maintenance and construction. Th is policy has obvious GHG benefi ts through reducing energy consumption and related emissions. Research shows that a fuel tax of 2.4 RMB per liter of petrol would be expected to reduce fuel demand by 10 percent in 2010 (Jiang, 2008).
Th e Chinese government also uses subsidies as an incentive for energy conservation. For example, the Ministry of Finance (MoF) provides a 30-50 percent subsidy for citizens who purchase energy-saving lamps. NDRC plans to promote the purchase of 150 million energy saving lamps from 2006 to 2010, and is also working with the Global Environment Facility (GEF) and UNDP to develop a plan for phasing out incandescent lamps.
Institutional ArrangementsTh e Chinese government set up a special institution to address climate change in 1990 and established the National Coordination Committee on Climate Change (NCCCC) in 1998. In 2007, the National Leading Group to Address Climate Change, headed by the Chinese premier, was established to formulate important strategies, policies and measures related to climate change and to address major problems in this regard. Th e number of member agencies of the National Leading Group increased from 18 to 20 in 2008.
Th e National Development and Reform Commission (NDRC) have been charged with undertaking the general work on climate change, and the offi ce of the National Leading Group was placed in the NDRC. Within the NDRC, a dedicated department has been established for organizing and coordinating work on climate change throughout the country. Th e Experts Committee on Climate Change has been set up to improve scientifi c decision-making on climate change, and has done a great deal of work in supporting government decision-making and promoting international cooperation and nongovernmental activities.
In contrast with target-oriented policies and measures, the results of these institutional reforms can be diffi cult to measure quantitatively or even qualitatively. A better way to evaluate such policies and measures might be through a decentralized self-reporting mechanism.
FIGURE 9. China’s Tax System
China’s tax system
VAT Consumption Tax
Business Tax
TurnoverTax
Special Purpose Tax
Property & Act Tax
Agricultural Behavior Tax
Income Tax
Resource Tax
Source: Tsinghua University
Table 6. Summary of MRV Metrics and Mechanisms for Incentive Policies
NAMA Scope Metric Reporting Mechanism Verifi cation Mechanism Time FrameTax policy National Increased cost of
fossil fuels (examples: fuel tax and VAT rebate change)
National Tax Bureau Tax bureau has tax receipts Change becomes permanent
Tax incentives National Tax breaks for renew-able investments
National Tax Bureau for amount of tax,NDRC for actual invest-ments
NDRC reports on new renewable power
Annual reports

16 WORLD RESOURCES INSTITUTE WORKING PAPER
SECTION III: A REVIEW OF POLICY IMPLEMENTATION AND MEASUREMENT STRUCTURES ACROSS SECTORS
INDUSTRIAL SECTORTh e industrial sector accounts for about 70 percent of China’s total energy consumption. Energy conservation in key industrial sectors is primarily implemented through energy conservation projects based on agreements negotiated between enterprises and the government. Th e Top Ten Energy Conservation Projects are the key measures to ensure that the target of 20 percent energy intensity reduction is met (National Development and Reform Committee, 2006). Six of these projects are in the industrial sector: Coal-fi red industrial boiler (kiln) retrofi t projects, district cogeneration projects, residual heat and pressure utilization projects, petroleum saving and substituting projects, motor system energy saving projects, and energy system optimization projects. Policies and measures to support these key projects include regulations and standards, a preferential tax regime, subsidies and low-interest loans.
The Thousand Enterprise ProgramUnder China’s Th ousand Enterprise program specifi c energy saving targets are negotiated between the government and major energy-consuming enterprises, with commitments and time schedules to achieve these commitments. Th e major goals of the Th ousand Enterprise program are to signifi cantly improve energy effi ciency, reduce unit energy consumption for all major products, employ either an international best practice or sectoral best practice benchmark, improve the energy effi ciency of each sector and achieve energy savings of approximately 100 million tons of coal equivalent during the 11th Five-Year Plan period. All participating enterprises have a signed contract with the central and provincial governments to commit to achieving their energy savings target (Price and Wang, 2007).
According to the Th ousand Enterprise program’s action plan, the enterprises involved should establish an energy conservation department and a reporting system for internal energy utilization. Th e enterprises must also conduct an energy audit and submit the audit report to local and central governments for assessment and verifi cation. Th e enterprises must report their achievements from the previous year to the local government by January of each year, and the provincial government must verify these achievements and report to the central government before March. Th e enterprises must also report their quarterly fuel consumption to the National Bureau of Statistics (NBS) via a web-based reporting system. Enterprise data are considered confi dential and provided only to NDRC. Th e local government is responsible for verifying the achievement of energy conservation targets through spot checks and energy audits by third parties.
NDRC has a system to evaluate the results of the 1000 enterprises program. Th e systems measures the level of eff ort in energy conservation activities and these are scored according to the following table which awards a score based on the reduction achieved. Enterprises with a score of more than 60 will be regarded as getting a “Pass” grade (see Table 7 for results).
Additionally, the system used to evaluate provincial governments takes into account the energy-saving performance of key enterprises. Th is provides a strong incentive to local offi cials to ensure that enterprises achieve their targets.
In mid-2008, NDRC published the 2007 assessment results of the 1000 enterprises program. Th e report showed that 90% of key enterprises achieved their energy conservation target, indicating an estimated energy conservation equivalent of about 38 million tons of coal in 2007 (National Development and Reform Committee, 2008).
TABLE 7. Evaluation system for 1000 enterprises programEnergy conservation target (40) 100% achieved: 40; 90% achieved: 35; 80% achieved: 30; 70% achieved 25; 60% achieved: 20; 50% achieved: 0
Energy conservation measures (60) Energy conservation leading group: 3Energy conservation management department: 2
Decomposition of target to unit and person 3Assessment of energy conservation target 3Reward and punishment system 4
Energy effi ciency performance in 1000 enterprises: 10 for top 10% and 5 for top 50%.Energy conservation R&D fund 4Annual energy conservation plan 4Closure of backward equipment 7 Retirement of outdated equipment
Implementation of local regulation 2Implementation of energy consumption norm 4Norm management for energy consuming equipments 2Implementation of energy conservation design 2
Energy audit and monitoring system 2Energy statistics manger and account 3Energy monitoring appliance 3Energy conservation training 2
Source: Tsinghua University

MITIGATION ACTIONS IN CHINA: MEASUREMENT, REPORTING AND VERIFICATION 17
Program to Close Small EnterprisesClosing small thermal power plants is part of the national energy saving and pollution reduction eff ort to meet the national target of 20 percent reduction in energy intensity by 2010. Th is program, which operates in parallel with plans to build larger, more effi cient plants, is offi cially called “Th e Program of Large Substituting for Small.” In order to promote the robust development of China’s power industry, NDRC has required the closure of small-scale thermal power units with high energy consumption and poor pollution control, and delegated this task to provincial governments and the power and grid companies.
Th is program is intended to close most of the existing small units, which currently produce approximately 114 GW of power; the program is expected to decommission about 50 percent of ineffi cient small units by 2010. Th ese include:
all conventional thermal power generating units of below 50 MW; all conventional thermal power generating units of 100 MW and below that have been operating for over 20 years; all conventional thermal power generating units of 200 MW and below that have reached the end of their design lives; all coal fi red generating units with a net heat rate at least 10% higher than the 2005 provincial average or at least 15% higher than the 2005 national average ; all generating units that fail to meet environmental standards; all generating units not complying with laws and regulations.
In 2007, China shut down 553 small thermal power generators under the program, with a total capacity of 14.38 million kilowatts and an average age of 28 years (State Electricity Regulatory Committee and National Development and Reform Committee, 2008). Large thermal power generators exceeding 50,000 kilowatts will be used to replace the lost capacity.
Implementation of this program is headed by NDRC at the national level and is supported by other government agencies, such as the State Electricity Regulatory Commission (SERC) and the Ministry of Environmental Protection (MEP). At the local level, the leading group is composed of the local development and reform commission (DRC) and other government agencies and local utility companies.
1.
2.
3.
4.
5.6.
It is relatively easy to measure the number and installed capacity of small size generation units that are closed. Moreover, this program creates a link between decisions to decommission ineffi cient small size units and permission to build newer and larger power generation projects. Th e decommissioning of ineffi cient small size units is the key criterion for eligibility for a new substituting power project to be included in the national power development plan, which is the basis for central government approval of projects. For example, a power company has to decommission 840MW of ineffi cient small size units to make it eligible to procure a new project of two 600MW super critical units approved by the NDRC.
Local governments/companies are in charge of implementing the program in their area and will be held accountable by higher level governments/companies for failure to accomplish the mission assigned. Provincial governments and major electricity companies were required to submit detailed implementation plans to NDRC before the end of March 2007 covering post-decommissioning issues such as reemployment and fi nancial compensation. Th e total capacity of small thermal power plants shut down is reported to NDRC by local governments.
NDRC or a relevant organization commissioned by NDRC verifi es report fi gures. Supervisory organizations, such as the electricity regulatory commission, are assigned by the central government to conduct verifi cation and registration of each ineffi cient small size unit decommissioned. A list of decommissioned units is published online for public monitoring to ensure that these units are truly and permanently decommissioned.
Th ere are similar programs in other industrial sectors. Some major substitution and closure programs to phase out ineffi cient equipment in key sectors are listed in Table 8.
TABLE 8. Closure Programs in Key Sectors
Closure Program Total Capacity of Closed Facilities
Closure of small-scale thermal power units 50GWClosure of blast furnaces under 300 m2 100 million tonsClosure of small-scale steel-making capacity 55 million tonsClosure of small-scale coking plants 80 million tonsClosure of calcium carbide facilities under 6300 kVA 2 million tonsClosure of small-scale clinker production capacity 250 million tonsSource: National Development and Reform Committee, 2004

18 WORLD RESOURCES INSTITUTE WORKING PAPER
Energy Conservation Power Generation Dispatch (ECPGD) ProgramTh e Energy Conservation Power Generation Dispatch Program began in December 2007 with pilot projects in the provinces of Guizhou, Jiangsu, Sichuan, Henan and Guangdong. Detailed implementation measures and working plans are still under development based on these pilots.
Th e ECPGD Program (State Council, 2008) is complementary to the Program Closing Small Enterprises and focuses on prioritizing power generation from existing renewable, nuclear, effi cient and clean coal power plants over other more carbon-intensive power plants. It is a major reform to the current pattern of power generation dispatch in China, intended to create a market mechanism by substituting the current even load power generation scheduling rule with an energy effi ciency-based rule that favors low-carbon energy.
Th e table of priority categories of generating units is the foundation of ECPGD and is established by the provincial development and reform commission. It is adjusted according to the operating situation of generating units. Th e priority categories are as follows: (1) wind power, solar power, oceanic power and hydro power;
(2) adjustable hydro, biomass, geothermal power and solid waste-fi red units; (3) nuclear power; (4) coal-fi red cogeneration units and units with comprehensive use of resources, including those using residual heat, residual gas, residual pressure, coal gangue, coal bed/coalmine methane, etc; (5) natural gas and coal gasifi cation-based; (6) other coal-fi red generating units, including cogeneration without heat load; (7) oil and oil product-based generating units.
Within each category, units are ranked according to their energy effi ciency. Units with the same energy effi ciency are further ranked according to their emission levels and water usage. Units are scheduled for generation only when all units in higher priority categories and ranks are operating at full capacity.
Local development and reform commissions organize the collection and management of load forecasting and load management and provide this information to industry, grid companies and power generation companies. Th e priority list for load management and dispatch is based on the information collected on individual plants and the load forecasts. Th ere is no offi cial estimate for energy-saving and emissions reduction resulting from the implementation of ECPGD, but it is likely to make the single greatest contribution to energy conservation in the electricity sector.
TABLE 9. Summary of MRV Metrics and Mechanisms for Industrial SectorsNAMA Scope Metric Reporting Mechanism Verifi cation Mechanism Time Frame
Th e Th ousand Enterprise Program
National, targeted at 1000 largest enterprises
Energy Intensity per unit output
Enterprise to local DRC to NDRC
NDRC verifi cation teams 5 year program with annual targets; progress reports twice a year
Individual Industrial Sector Targets
Set by Sector Energy Intensity per unit physical output or value added
Industrial association to NBS/NDRC
Aggregated data from indi-vidual companies
Annual and 5 year reporting
Program to Close Small Enterprises
National Percent of total land forested
State Forestry Administration Energy Bureau of NDRC conducts on-site verifi cation
5 year targets, annual progress reports
Energy Conservation Power Generation Dispatch
Currently piloted in fi ve provinces, but planned to be national within the electric power system
Currently a compli-ance metric, but no energy metric
Power plant performance determined by NDRC at local levels, which then sets the dispatch priority
Local technical bureaus verify effi ciency and perfor-mance
Coal-fi red industrial boiler (kiln) retrofi t projects
Coal-fi red industrial boilers nation-wide
Average effi ciency and energy saving of industrial coal-fi red boilers
Energy saving reported by enterprises to government
Energy saving projects veri-fi ed by third parties
2010 Goal
District cogeneration projects District heating, especially in northern China
Share of cogenera-tion in district heat-ing and cogeneration capacity
Energy saving reported by enterprises to government
Energy saving projects veri-fi ed by third parties
2010 Goal
Residual heat and pressure utilization projects
Iron and steel, construction material and other industries with saving potential
Energy saving from residual heat and pressure utilization
Energy saving reported by enterprises to government
Energy saving projects veri-fi ed by the third parties
2010 Goal
Petroleum saving and substi-tuting projects
Metal, construction material and other industries with saving potential
Quantity of pe-troleum saved and substituted
Energy saving reported by enterprises to government
Energy saving projects veri-fi ed by third parties
2010 Goal
Motor system energy saving projects
Major electricity consuming sectors
Motor effi ciency improvement and electricity saving
Energy saving reported by enterprises to government
Energy saving projects veri-fi ed by the third parties
2010 Goal
Energy system optimization projects
Refi nery, chemical, iron, and steel industries
Energy improvement per unit product and quantity of energy saving
Energy saving reported by enterprises to government
Energy saving projects veri-fi ed by the third parties
2010 Goal

MITIGATION ACTIONS IN CHINA: MEASUREMENT, REPORTING AND VERIFICATION 19
RESIDENTIAL SECTOREnergy saving in buildings requires effi cient use of energy during the construction and operation of buildings, as well as effi cient use of heating, air conditioning, lighting, electrical equipment, and hot water supply. About 2 billion m2 of new buildings are constructed every year in China (Newspaper on International Finance, 2005). Currently, buildings account for almost 28 percent of China’s total energy consumption – up from just 10 percent in 1978. Th is share could rise to 35-40 percent as living standards improve and workplaces develop. Under such a scenario, the residential sector could surpass other energy-intensive sectors, such as industry and transportation, to become the nation’s largest energy-consuming sector.
Th e mitigation policies and measures in the residential sector mainly consist of regulations and standards for building design, market mechanisms such as promoting the installation of heating meters in old buildings, and subsidies for energy-saving appliances in buildings.
Building Energy Conservation ProjectTh e Building Energy Conservation Project has three dimensions:
Energy conservation in new buildings; Energy-saving renovation in existing buildings; Renewable energy use in buildings.
Both public buildings and residential buildings have corresponding energy saving design standards. Policies on design standards, assessment and methodologies for examination have been implemented so as to: strengthen the operation and management of energy-consuming equipment for buildings; optimize the thermal engineering performance of the surrounding structures of buildings; improve the work effi ciency of heating, cooling, lighting, ventilation, water supply, drainage and pump systems; promote the use of renewable energy; and reduce energy consumption of buildings while guaranteeing their essential functions and ensuring suffi cient indoor heating.
1.2.3.
Th e government has also established the following indicators of energy conservation and effi ciency in buildings (see Table 10):
For new buildings, a 50 percent energy saving target has been set, with the target increased to 65 percent in Beijing, Tianjin, Shanghai and Chongqing. In the northern, southern and transition regions, the share of new energy-conserving wall and roof materials should increase from 40 percent to 60 percent, and the share of new heat-preserving and thermal insulation materials used in energy conservation programs in buildings should increase from 35 percent to 55 percent in 2010.For public buildings, the indoor air temperature cannot be higher than 20oC in the winter, and cannot be lower than 26oC in the summer.
Th e government has established diff erent monitoring and compliance processes for diff erent buildings, depending on whether they are residential or pubic, and in accordance with their diff erent design standards and energy conservation indicators.
For residential buildings, the Ministry of Housing and Urban-Rural Development (MOHURD) established the “Energy consumption statistical reporting mechanism of residential buildings” in 2007 to provide a comprehensive picture of residential energy consumption. Th is mechanism has been implemented in 23 cities, such as Beijing, Shanghai, Chongqing and Harbin, and will be extended throughout the country.
Information in this reporting system is organized in three diff erent accounting tables: a basic information table, an energy consumption table, and a centralized heating supply table. Provincial governments direct the collection of this data, and report these tables to the Provincial housing department, which submits the integrated tables to MOHURD. Figure 10 illustrates how the reporting mechanism works.
•
•
•
TABLE 10. Summary of MRV Metrics and Mechanisms for the Building Sector
NAMA Scope Metric Reporting Mechanism Verifi cation Mechanism Time FrameEnergy Effi ciency in Buildings
National Adherence to stan-dards
Building contractors report to local government and building owner in project acceptance report
Local quality supervision institution verifi es

20 WORLD RESOURCES INSTITUTE WORKING PAPER
Ultimately, the construction administrative department of the State Council receives the information collected by the reporting mechanism and uses it to supervise residential energy conservation at the national level. At the local level, however, the construction administrative department of local governments at the county level or above administers the energy conservation program for residential buildings within its jurisdiction. To help in this eff ort, MOHURD has established criteria for evaluating the quality of energy conservation projects in new buildings to make sure they meet conservation targets.
To ensure energy conservation in national government buildings and large public buildings, the government formulated a comprehensive energy conservation monitoring system with several elements, including a system for measuring building energy consumption (see fi gure 11), energy consumption statistics and accounting, an energy audit, an energy effi ciency report and an energy effi ciency assessment. Figure 10 illustrates this system.
FIGURE 10. Reporting Mechanism for Energy Consumption in Residential Buildings
MOHURD
Before 31st of July and March
Before 31st of July and 31st of March
Basic information tables:
• Basic information on buildings
• Energy consumption
• Volume of centralized heating supply
Integrated tables:
• Basic information on buildings
• Energy consumption
Provincial government and related departments
Provincial housing departments
MOHURD: Ministry of Housing and Urban-Rural Development of the People’s Republic of ChinaMOF: Ministry of FinanceEE: energy effi ciency Source: Tsinghua University
Source: Tsinghua University
Energy monitoring
Energy statistics
Energyaudit
EE report
Energyassessment
Install measuring equipment on public build-ings and implement the dynamic monitor of energy consumption. By the end of 2010, the monitor platform should be established.
Refer to “report forms on energy consump-tion statistics on building” and the “data col-lection standard for energy consumption in buildings”. Submit seasonal statistical report.
Refer to “energy audit guidelines for national government buildings and large public buildings.”
Publish the results of energy statistics and energy audit.
National: included in the examination on national “energy conservation of building projects”Regional: establish assessment mechanism and incorporate into assessment system for reduction rate of local energy intensity of GDP
MOHURDProvincial governments
Universities
Universities, institutes on building
MOHURD
MOHURD
MOHURD/MOFLocal governments
FIGURE 11. Monitoring System for Energy Savings in National Government Buildings and Large Public Buildings
MOF: Supply fi nancial support

MITIGATION ACTIONS IN CHINA: MEASUREMENT, REPORTING AND VERIFICATION 21
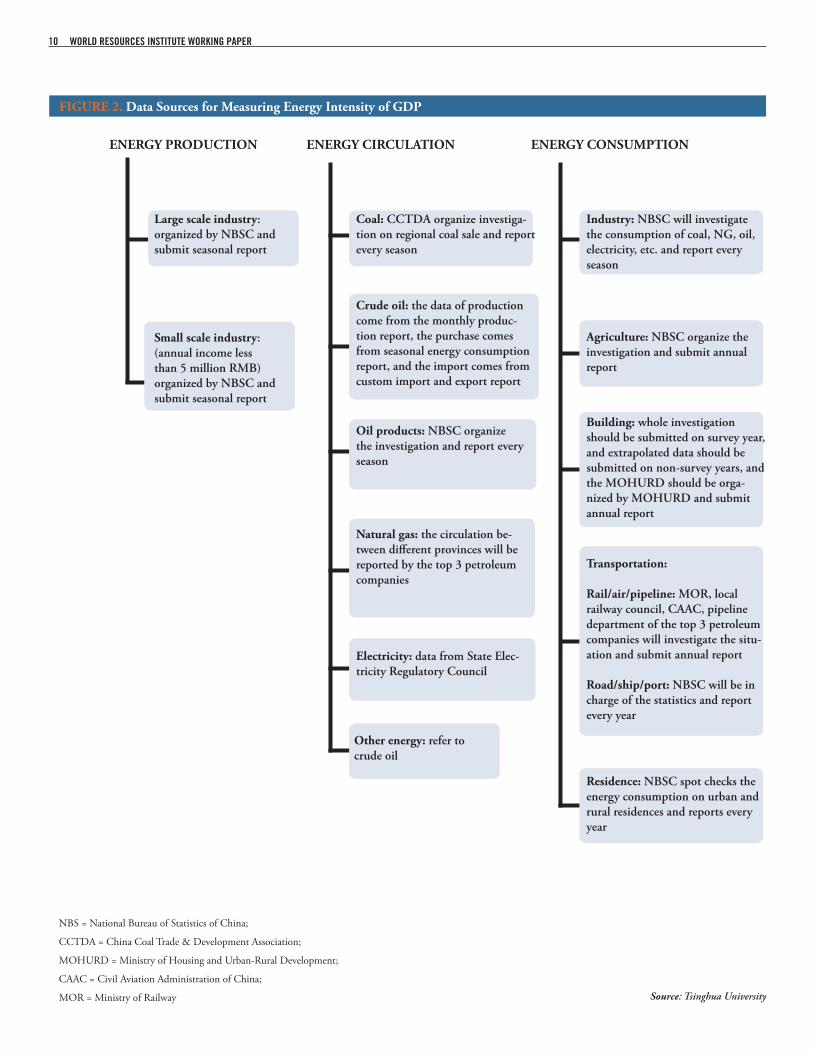
TRANSPORTATION SECTORTransport presents a signifi cant challenge because many current Chinese transport needs have not yet been met. Th ere is a need to develop additional public transportation services in ways that minimize carbon intensity. Th us, comprehensive policy planning that is aimed at reducing future rather than current emissions will actually have the greatest impact over time. Th is includes vehicle and fuel standards, as well as the development of mass transit and inter-city rapid transit. Th ese needs fi t well with a MRV structure that can take into account the diversity of actions and policies needed.
Th e transport sector has recently become one of the primary energy consumers in China. It accounted for 7.5 percent of total energy consumption in 2006 and this will continue to increase to meet growing demand. Th e transportation sector is also responsible for a signifi cant contribution to China’s GHG emissions.
To promote energy effi ciency in the transport sector, national and local governments are implementing a wide range of policies and measures including industrial strategies and supporting initiatives. Th e government also implements economic policies conducive to energy conservation such as a policy of tax reduction for the production and consumption of compact cars. In 2009, the government began collecting a fuel tax on petrol consumption, which was the fi rst energy tax to be collected in China. Mandatory entry permits for clean energy vehicles have also been introduced to improve the investment environment, regulate the vehicle market and encourage manufacturers to invest in research and development. Some voluntary actions, such as the “drive one day less a month” program have been implemented to improve public awareness of climate change.
After China’s Energy Conservation Law came into eff ect in 2007, the Ministry of Communication (MoC) established an energy saving coordination group and energy management offi ce to take responsibility for energy saving policy decisions and management in the transportation sector, the functioning of which is illustrated in Fig. 12. Th e MoC also set up several monitoring and service centers responsible for monitoring, auditing and promoting energy-saving technologies.
Fuel Consumption Limitation Standard for Motor VehiclesVehicle fuel economy standards have proven to be one of the most eff ective tools for controlling oil demand and GHG emissions from the transportation sector in many countries around the world. In 2000, China established its fi rst national fuel effi ciency standard, which was designed to reduce oil consumption and to encourage foreign automakers to introduce more fuel-effi cient vehicle technologies into the Chinese market.
Th e fi rst national standard for vehicle fuel effi ciency was enacted in July 2005. Th is new standard was implemented in two stages: stage 1, which aimed to improve fuel effi ciency by 10 percent, took eff ect on July 1, 2005. Stage 2 took eff ect on January 1, 2008 with the goal of improving fuel effi ciency by an additional 10 percent.A standard has been developed to set diff erent fuel effi ciency levels for diff erent types of vehicles to be sold in China. Th e vehicle companies are asked to provide detailed information for fuel effi ciency verifi cation reports. Every vehicle sold must be tested to confi rm that its fuel consumption meets specifi cations for that model.
Ministry of Communication
Wuhan shipping industry energy consumption monitoring center and ship energy saving technology service center
Energy SavingCoordinating Group
Energy Saving Management Offi ce
Vehicle transport energy consumption monitor center Yunnan (high altitude) station
Vehicle transport energy consumption monitor center and vehicle energy saving service center
Shipping industry energy consumption monitoring center and shipping energy saving technology service center
Shipping industry energy consumption monitor and shipping engineering monitor station
FIGURE 12. Organization Structure for MRV in the Transportation Sector
Source: Tsinghua University
22 WORLD RESOURCES INSTITUTE WORKING PAPER
Th e General Administration of Quality Supervision, Inspection and Quarantine is responsible for implementing and monitoring the fuel effi ciency standard. At the national level, responsibility for planning and checking is assigned to the State Council Standardization Administration Department and other State Council departments. At provincial level, this responsibility is assigned to provincial or autonomous regional or municipality standardization administration departments.
Railway System DevelopmentRail is the most commonly used mode of long-distance transportation in China. Th e Ministry of Railways is responsible for the construction and operation of the rail system. Compared with other long-distance transportation modes, such as highway and aviation systems, rail is less carbon-intensive in terms of emissions per person kilometers. In the 11th Five-Year plan of railway construction, the Chinese government allocated about 1.25 trillion RMB to expand its railway system, with the goal of growing from 78,000 km in 2007 to 85,000 km in 2010 and 100,000 km in 2020. In December 2008, the State Council announced an economic stimulus package with a 2 trillion RMB investment plan. As a result of increased investment, the country’s railway network is expected to expand further to 100,000 km in 2010 and 120,000 km in 2020. Th e Ministry of Railways is also paying greater attention to the development of a high-speed railway system that can compete with direct fl ights in the long distance transportation market. China Railway High-speed (CRH) has been utilized in several intercity rail system expansions in China. Th e goal is to extend the high-speed system to a length of 12,000 km with an average speed higher than 200km/h.
Mass Transit System in Major CitiesTh e economic growth that China has achieved in recent decades has been accompanied by extensive urbanization and associated transportation challenges. In 2005, the State Council issued a decree to give priority to urban public transport. Th is decree requires local governments to improve public transportation infrastructure, optimize operations, guarantee priority use of roads for public transportation, and implement reforms to further promote public transportation. Compared with other public transport modes, Bus Rapid Transit (BRT) is one of the more attractive solutions for developing countries as it has a low investment requirement (about 4 million $/km) and lower energy use and carbon emissions. At least 10 Chinese cities are actively planning or expanding BRT systems with varying approaches. Th e fi rst BRT line in Beijing began operation in Dec 2005 with a length of about 16 km. Th e average passenger rate is about 90,000 people per day, with a peak of more than 200,000 people per day. Compared with railway planning, urban transportation planning is more decentralized within local authorities. Most of the major Chinese cities have an urban transportation plan for the 11th Five-Year period. Th ese and other initiatives are summarized in Table 11. For example, the municipal government of Beijing published its urban transportation plan in 2010. Th e major goal is to increase the share of public transportation to 40 percent from 28 percent by the end of 2010.
TABLE 11. Summary of MRV Metrics and Mechanisms for the Transportation Sector NAMA Scope Metric Reporting Mechanism Verifi cation Mechanism Time FrameVehicle Ef-fi ciency Stan-dards
National, auto sector
Km/liter Th rough agricultural bureaus to the central ministry
Both pre- and post-manu-facture
Based on introduction of new models
Fuel tax National, vehicle sector
Absolute price increase to fuel
Set by central tax au-thorities, who also report revenues
Tax authority audits of local fuel tax revenues
Annual revenue reporting
Mass Transit development
Local au-thorities
Share of public transit in overall transportation system, km for BRT, metro and other public transit systems
Local municipal govern-ment
Annual report to People’s Congress at city level
Annual reporting
Intercity rail National, rail sector
Km of new track and investment in new rail infrastructure
Ministry of Railways National ministry collects data from localities
Annual reporting

MITIGATION ACTIONS IN CHINA: MEASUREMENT, REPORTING AND VERIFICATION 23
SECTION IV: LINKING MRV ON THE GROUND TO THE GLOBAL CLIMATE AGREEMENT
As outlined above, in Section II the Chinese government has laid out a national climate strategy. Th e climate change policies and measures identifi ed are development-focused and are diverse in terms of type and scope. A review of these policies and measures could provide important insights into a possible MRV system under the post-2012 climate regime.
Nationally Appropriate Mitigation ActionsA wide range of polices have been undertaken by the Chinese government, which could be classifi ed as a NAMA in the future, depending on the UNFCCC negotiations.
In theory, under a post-2012 climate agreement, NAMAs could be either defi ned through an agreed list or could emerge from broad national mitigation strategies or low-carbon development programs / plans, as has been proposed by some UNFCCC delegations such as the European Union (McMahon et al, 2009). As aforementioned, China’s broad strategy is refl ected in the Five Year Plan and China’s National Climate Change Program, as well as other programs. Th e broad strategy approach seems to encourage the development of a diversity of policies and measures, as evidenced by the range of possible NAMAs and metrics found in China and refl ected in this paper, and summarized in Figure 13.
Given that the identifi cation of NAMAs is likely to be a country-driven process (Ellis et al., 2007), some important questions remain: Is it reasonable to ask developing countries to choose which of their policies and measures could be submitted as NAMAs in order to garner external support? Or would countries simply submit all of their NAMAs, among which donors would decide which they chose to support, although this could encourage cherry-picking? Does this mean that MRV of actions would also be nationally determined, and if so, how would progress be demonstrated? Th rough national inventories or low-carbon development plans? Would there be specifi c fi nancial and technical support for the MRV process itself? All of these questions remain to be answered through international negotiations.
MeasurementMeasurement is central to MRV and metrics are the starting point of measurement. A wide range of metrics have been adopted by the Chinese government across sectors, and some are development focused while other are GHG specifi c, some are out-put focused, other are in-put focused eg GHG reduction, energy saving, acres of reforestation, Research and development funding and so on as shown in Figure 14.
FIGURE 13. Classifi cation of Policies and Measures based on Ease of Quantifi cation and GHGs Benefi t
RD&D on Climate ChangeEconomic structure change
Capacity buildingIncreased public awareness
LegislationInstitutional Arrangements
Energy intensity targetRenewable energy target
Urban PlanningTax regime on fossil fuels
Energy labelingRegulation and standards
Source: Tsinghua University
Direct GHG Benefi t Indirect GHG Benefi t
Easy to Quantify
Diffi cult to Q
uantify

24 WORLD RESOURCES INSTITUTE WORKING PAPER
Metrics that are output related measure the result of the mitigation action either directly in GHG emissions or indirectly in terms of energy saving or changing in production or consumption.
Energy-related metrics or other physical metrics can be used as proxies to estimate emissions (i.e. tCO2e) which can’t be measured directly. Th ese metrics can be translated to emission reduction metrics if methodologies are available. Th ere needs to be standardization of the methodologies employed .Th is will require building capacity around the methodologies themselves, as well as for the monitoring, reporting and verifi cation process itself.
Input related metrics may be necessary when the outcomes are hard to measure accurately. In such cases the mitigation actions themselves refl ect the key parameter to be monitored as shown in Figure 14. For example, a tax on fossil fuels may contribute to reducing GHG emissions, but the exact amount of emission reduction is hard to separate from the price eff ect and increased energy effi ciency. In that case, the level of fossil fuel tax may be a more appropriate metric for such mitigation actions.
Some metrics lend themselves well to quantifi cation and others less so as Figure 13 demonstrates. China currently employs a diverse set of metrics. Th ere are advantages and disadvantages to employing a diverse set of metrics. Th e advantage is that these programs can be developed, adapted and integrated into the nation’s overall development program. By using measures directly related to energy or transportation, for example, it is easier to relate these eff orts to both greenhouse gas mitigation and to overall economic development goals. Using measures directly related to energy and transportation also allows countries to measure progress and outcomes using targets and quotas, for example, and these
might better suit their institutional strengths. At the same time it enables countries to avoid a situation where an underdeveloped methodology leaves them without an appropriate tool to report their eff orts on carbon mitigation to the international community. Use of proxy GHG metrics or qualitative metrics is therefore an important fi rst step.
Generally, GHG measurement requires a complex methodologies and accounting systems, and in many developing countries, including China, these systems are not fully developed. However there is a wide range of international experience to build on, including systems such as the Greenhouse Gas Protocol developed under the auspices of the World Business Council for Sustainable Development and the World Resources Institute. China has pilot programs to improve GHG accounting in some industries but these are not comprehensive or across all sectors.
Many of China’s metrics are direct measurements. But there is the additional issue of progress over time, or policies or measures, or NAMAs that a well-designed MRV system can also address, and which we try to address by looking at qualitative as well as immediately quantifi able measures.
Th e disadvantages of diverse metrics include the bureaucratic eff ort required to collate and synthesize data at the national level, and the complexity of creating a system at the international level that suits all participating countries. Th ese disadvantages will become more acute when it comes to linking NAMAs to international support from developed country donors. Th is will require some forward thinking. Th ese are, however, issues that might be dealt with given time and the building of trust among countries under a post-2012 climate agreement.
FIGURE 14. Structure for Diff erent Quantitative Indicators
Quantitative Metrics
Output Related Metrics
Input Related Metrics
GHGs Related Metrics
Energy Related Metrics
Other PhysicalMetrics
Monetary Metrics
Non-monetary-Metrics
Emission of N2O
Energy intensity per unit of GDPGWh renewable energy generated
MW capacity in wind farmArea of land using balanced fertilization
RD&D funding for climate changeSubsidies for energy saving lamps
Man hours for tree planting campaign
Source: Tsinghua University

MITIGATION ACTIONS IN CHINA: MEASUREMENT, REPORTING AND VERIFICATION 25
Reporting and Verifi cationTh ere are already domestic reporting processes for various mitigation policies and measures in China across diff erent levels and sectors. Most of the mitigation actions reviewed in this paper are unilateral actions supported through domestic resources without international provisions in terms of fi nancial and technological support. A few have small levels of international support. Some reporting and verifi cation processes are decentralized and not integrated at the national level while others have been aggregated at diff erent levels. For example, reporting and verifi cation of energy intensity targets is implemented from the enterprise level all the way to the national level. Developing countries like China could improve reporting and verifi cation processes by integrating them at the national level to monitor mitigation actions in diff erent sectors. For most qualitative measures, for which there is no formal domestic procedure for reporting and verifi cation, a national or international registry of NAMAs, which has been proposed by several Parties within the UNFCCC, could be developed to recognize and assess these measures at the national or international level. Th is could provide a starting point for design of reporting and verifi cation procedures.
Important issues regarding what MRV structures should be created at the international level remain undecided. In terms of measurement, some questions include: should a system be established that is based on outcomes or based on performance-related metrics? How can the international system support national measurement processes for GHG emissions?
On the reporting side these questions include: should unilateral mitigation actions be reported to the international community? If yes, how should this be carried out? How should the outcome of enhanced mitigation actions that are supported by international fi nance and technology be reported? And how might the support itself be reported?
With regard to verifi cation, the international community will need to consider how international verifi cation processes might compliment national systems and how incentives can be confi gured to encourage verifi cation across all sectors in all countries?
In terms of institutional structures, some questions include: how should the linkage between these actions and capacity-building support be established? Will a registry-type approach, which is being considered under the UNFCCC and describes a system for ‘registering’ NAMAs in a central reporting system, be enough and how will this be linked to support structures?
CONCLUSIONMajor developing countries such as China have adopted mitigation eff orts to control their GHG emissions and contribute to global eff orts to deal with climate change. Some of these mitigation policies and measures have been reported and verifi ed through domestic processes. Th ese mitigation eff orts could be recognized by the international community and supported by a process of MRV under a post-2012 climate agreement. Th is could enhance the range and scale of actions through the provision of fi nancial, technological and capacity-building support from developed parties. Agreement on the defi nitions of terms such as “Nationally Appropriate Mitigation Actions,” “measurable,” “reportable,” and “verifi able” will be an important part of the consensus-building process. Th is report is intended to help clarify these defi nitional issues.
Th is report also suggests other conclusions. First, an MRV framework should cover “mitigation actions,” not just the emissions reductions resulting from these actions. Not all individual mitigation actions will result in direct and measurable emissions reduction. A uniform guideline for NAMAs may be helpful for developing countries to frame their mitigation actions, but it is not necessary for them to strictly follow these guidelines.
Second, most NAMAs are undertaken within the context of sustainable development policies and measures and their level and scope may diff er signifi cantly as a result of varying national circumstances and development paths. Any guideline for NAMAs should allow diff erent types of goals, initiatives, instruments and policy tools for developing countries. In particular, NAMAs should refl ect the specifi c development priorities of each country.
Finally, the reporting and verifi cation process for mitigation actions could be bolstered to give a more comprehensive picture of what actions have been taken and what outcomes have resulted, through for example low-carbon development plans or inventories. Such structures could provide better information to decision makers in developing countries and could also avoid possible double counting of mitigation actions.
Success depends on the ability of the international community to create the right environment for mitigation to take place. Th e Bali Action Plan provides the starting point. Th e challenge now is to translate this into concrete outcomes at the UNFCCC meeting in Copenhagen in December 2009.

26 WORLD RESOURCES INSTITUTE WORKING PAPER
REFERENCESEllis, J., R. Baron And B. Buchner (2007). SD-PAMs: What, Where and How? Paris: Organisation for Economic Co-operation and Development/International Energy Agency.
Ellis, J. And K. Larsen (2008). Measurement, Reporting and Verifi cation of Mitigation Actions and Commitments. Paris: Organisation for Economic Co-operation and Development/International Energy Agency.
Fransen, T., H. Mcmahon And S. Nakhooda (2009). Measuring the Way to a New Global Climate Agreement. Washington, DC: World Resources Institute.
Government Of China (GOC) (2006) 11th Five-Year Guidelines (2006-2010). Beijing: GOC.
Government Of China (GOC) (2008) White Paper: China’s Policies and Actions on Climate Change. Beijing: GOC.
Jiang, K.J. (2008). Energy taxes won’t hurt the economy. China Dialogue.
Price, L. and X. WANG (2007). Constraining Energy Consumption of China’s Largest Industrial Enterprises Th rough the Top-1000 Energy-Consuming Enterprise Program. Berkeley: Lawrence Berkeley National Laboratory.
McMahon, H. and R. Moncel (2009). Keeping Track: National Positions and Design Elements of an MRV Framework. WRI working paper. Washington D.C.: World Resources Institute.
National Development And Reform Committee (NDRC) (2004). Medium and Long Term Energy Conservation Plan. Beijing: NDRC.
National Development And Reform Committee (NDRC) (2006). Guidance on Ten Key Energy Saving Projects. Beijing: NDRC.
National Development And Reform Committee (NDRC) (2007a). Th e 11th Five Year Plan on Development of Renewable Energy. Beijing: NDRC.
National Development And Reform Committee (NDRC) (2007b). Th e 11th Five Year Plan on Energy Development. Beijing: NDRC.
National Development And Reform Committee (NDRC) (2007c). National Climate Change Programme. Beijing: NDRC.
National Development And Reform Committee (NDRC) (2008). Assessment Result of Top 1000 Energy-consuming Enerprises Program in Year 2007. Beijing: NDRC.
State Council (2008). Th e Energy Conservation Power Generation Dispatch Program. Beijing: State Council.
State Electricity Regulatory Committee, And National Development And Reform Committee (2008). Communication on Closure of Small Th ermal Power Plants in Year 2007. Beijing: SERC and NDRC.
United Nations (1992). United Nations Framework Convention on Climate Change. http://unfccc.int/essential_background/convention/background/items/2853.php
United Nations (1997). Kyoto Protocol to the United Nations Framework Convention on Climate Change. http://unfccc.int/kyoto_protocol/items/2830.php
United Nations (2007) Bali Action Plan: Decision 1/CP.13. http://unfccc.int/documentation/decisions/items/3597.php?such=j&volltext=/CP.13#beg
Winkler H (2008). “Measurable, Reportable and Verifi able: the Keys to Mitigation in the Copenhagen Deal.” Climate Policy, 8: 534-547.