Mitigating Risk of Disruptive Events: Application to …...Fault tree analysis for supply chain risk...
33
Department of Industrial and Manufacturing Systems Engineering Mitigating Risk of Disruptive Events: Application to Supply Chains and Allocating Resources for Preparedness Cameron MacKenzie IMSE Grad Seminar October 4, 2017
Transcript of Mitigating Risk of Disruptive Events: Application to …...Fault tree analysis for supply chain risk...

Department of Industrial and Manufacturing Systems Engineering
Mitigating Risk of Disruptive
Events: Application to Supply
Chains and Allocating
Resources for Preparedness
Cameron MacKenzie
IMSE Grad Seminar
October 4, 2017

Industrial and Manufacturing Systems Engineering
Outline
• Supply chain risk and disruptions
• Severe supply chain disruptions (simulation)
• Fault tree analysis
• Contamination in food supply chains
• Resource allocation for emergency
preparedness
2

Industrial and Manufacturing Systems Engineering
Interdependent economy
3

Industrial and Manufacturing Systems Engineering
Simulation
Supply
shortage for
firms
Move
production to
alternate
facility?
Firms receive
required supplies
Buy from
alternate
supplier?
No
YesSupplier’s
facility is
closed
Finished
goods
inventory?
Demand not
satisfied or
customers buy
from other firms
Supplier’s
facility
reopens?
No
No
Yes
Yes
No
Supply
inventory?
No 4

Industrial and Manufacturing Systems Engineering
Firm’s decision
How much to
produce?
Maximize
profit in
current period
Satisfy demand
Value
Time when
suppliers’
facilities
reopenCustomer
loyalty
Inventory
on hand
Selling
price
Cost of
alternate
suppliers
5

Industrial and Manufacturing Systems Engineering
Results in automobile sector
Maximize
profit and no
alternate
facility
Sacrifice profit
to meet
demand and
no alternate
facility
Sacrifice profit
to meet
demand and
alternate
facility
Ford, GM, and
Chrysler91.7 98.7 99.0
Toyota and Honda 68.7 86.7 93.4
Nissan 82.5 92.7 96.1
6
MacKenzie, C.A., Barker K., & Santos, J.R. (2014). Modeling a severe supply
chain disruption and post-disaster decision making with application to the
Japanese earthquake and tsunami. IIE Transactions, 46(12), 1243-1260.
Average percent of total demand satisfied

Industrial and Manufacturing Systems Engineering
Previous work
7
Chemical products
• Hydrogen peroxide
• Anode graphite for
lithium ion-battery
• Ethylene-
propylene-diene
rubber
• Poly-propylene
Silicon wafer
Semiconductor
• Micro-
processor
• Chip for
controlled
machining
Electronic materials
• Electrolytic copper
foil
• Synthetic quartz
Liquid crystal panel
Automotive Industry machine Home electronics
Ono, K., Akakura, Y., Kanda, M., & Ishihara (2015). Analyzing and simulating
supply chain disruptions to the automobile industry based on experiences of the
Great East Japan Earthquake. Journal of Integrated Disaster Risk Management,
DOI10.5595/idrm.2015.0102

Industrial and Manufacturing Systems Engineering
Preliminary results (concept
demonstration)
8
Average percent of total demand satisfied
Industry
Maximize
short-term
profit and no
alternate
facility
Sacrifice profit
to meet
demand and
no alternate
facility
Sacrifice profit
to meet
demand and
alternate
facility
Automobile 57.9 87.2 95.7
Electronics 38.9 98.1 99.4
Chemical 100 100 100
Semiconductor 44.3 97.3 100
Collaborators: Xue (Snow) Bai and Andre Fristo
Industrial and Manufacturing Systems Engineering
Fault tree analysis for supply chain
risk
9
Sherwin, M.D., Medal, H., & Lapp, S.A. (2016). Proactive cost-identification and
mitigation of supply delay risk in a low volume high value supply chain using fault tree
analysis. International Journal of Production Economics 175, 153-163.

Industrial and Manufacturing Systems Engineering
Dynamic fault tree
• Dynamic fault trees (DFT) are used to calculate
reliability over time in engineered systems
• Apply DFT to supply chains
• Main-backup supply chain
• Multiple units
• Single unit
• Mutual-assistant supply chain
• Multiple units
• Single unit
10
Lei, X., & MacKenzie, C.A. (2017). Supply chain risk analysis using dynamic fault
trees. Working paper.

Industrial and Manufacturing Systems Engineering
Four scenarios
11
A: information system
B: supplier 1
C: supplier 2

Industrial and Manufacturing Systems Engineering
Fresh produce contamination
12

Industrial and Manufacturing Systems Engineering
Model flowchart
13
At demand
node
Where is
contamination
node (CN)?
CN is distribution
node
CN is producing
node
Can produce
be rerouted?
Is safety stock
useable?
Is safety stock
useable?
Can
production be
increased?
Disruption
mitigated
Disruption
not
mitigated
Disruption
mitigated
Disruption
not
mitigated
Yes
Yes
No
Yes
Yes
No

Industrial and Manufacturing Systems Engineering
E. coli in bagged spinach
• E. coli discovered in bagged spinach in
September 2006
• Source of contamination traced back to Natural
Selection Foods, a supplier to Dole
• Fresh and bagged spinach was pulled from
shelves for 5 days
• Spinach from California unavailable for an
additional 10 days
14
MacKenzie, C.A., & Apte, A. (2017). Modeling disruption in a fresh produce supply
chain. Journal of Logistics Management, 28(2), 656-679.

Industrial and Manufacturing Systems Engineering
Dole’s production of spinach
15

Industrial and Manufacturing Systems Engineering
RESOURCE ALLOCATION FOR
EMERGENCY
PREPAREDNESS
16

Industrial and Manufacturing Systems Engineering
U.S. spending on disasters
• $85 - $136 billion per year (Weiss and
Weidman, 2013; Kostro et al., 2013)
• From 1985-2004 (Healy and Malhotra, 2009)
• $195 million per year on disaster preparedness
• $3.04 billion per year on disaster relief
17
Weiss, D.J. and J. Weidman (2013). Disastrous spending: Federal disaster-relief
expenditures rise amid more extreme weather. Center for American Progress.
Kostro, S.S., A. Nichols, and A. Temoshchuk (2013). White paper on U.S. disaster
preparedness and resilience: Recommendations for reform. CSIS-Pennington Family
Foundation Series on Community Resilience, Center for Strategic & International
Studies.
Healy, A. and N. Malhotra (2009). Myopic voters and natural disaster policy. American
Political Science Review 103(3), 387-406.

Industrial and Manufacturing Systems Engineering
Cost-benefit analyses
Benefit-cost ratio of FEMA mitigation grants (Rose
et al., 2005)
• 1.5 for earthquake mitigation grants
• 5.1 for flood mitigation grants
18
Rose, A., K. Porter, N. Dash, J. Bouabid, C. Huyck, J. Whitehead, D. Shaw, R.
Eguchi, C. Taylor, T. McLane, L.T. Tobin, P.T. Ganderton, D. Goldschalk, A.S.
Kiremidjian, K. Tierney, and C.T. West (2005). Benefit-cost analysis of FEMA hazard
mitigation grants. Natural Hazards Review 8(4), 97-111.

Industrial and Manufacturing Systems Engineering
Research questions
• What is the optimal allocation of resources pre-
disruption (prevention and preparedness) and
post-disruption (response and recovery)?
• How should resources be allocated between
different disruptions?
• How can we train decision makers to help them
prepare for disruptions?
19

Industrial and Manufacturing Systems Engineering
Outline
1. Resource allocation model
• Theoretical results: 1 disruption
• Example: 2 disruptions (oil spill, hurricane)
2. Hurricane decision simulator
20

Industrial and Manufacturing Systems Engineering
Resource allocation model
21
min 𝑝𝐱⊺𝐃𝐜 − 1 − 𝑝 𝑔 𝑧𝑝, 𝑍
𝑐𝑖 = 𝑐𝑖exp −𝑘𝑞𝑧𝑝 − 𝑘𝑖𝑧𝑖 − 𝑘0𝑧0
𝑧𝑝 +
𝑖=1
𝑚
𝑧𝑖 + 𝑧0 ≤ 𝑍
𝑧𝑝 ≥ 0, 𝑧𝑖 ≥ 0, 𝑧0 ≥ 0
Normal production
Direct impacts with no
resourcesAllocation to industry Allocation to
benefit all
industries
Effectiveness of recovery allocation
Overall budget
Interdependent matrix
subject to 𝑝 = 𝑝exp −𝑘𝑝𝑧𝑝
Vector of direct impacts (proportional)Probability of disruption
Probability with
no resourcesPre-disruption allocationEffectiveness of prevention
Increased
production if no
disruption
Effectiveness of preparation

Industrial and Manufacturing Systems Engineering
Optimal recovery allocation
• If 𝐱⊺𝐝∗𝑖 𝑐𝑖𝑘𝑖 ≤ 𝐱⊺𝐝∗𝑗 𝑐𝑗𝑘𝑗 and 𝑧𝑖 > 0, then 𝑧𝑗 > 0
• If 𝑘0 > 𝑧𝑖>0 1𝑘𝑖
−1then some 𝑧𝑖 > 0 is not
optimal
• If 𝑧0 > 0 then
𝑧𝑖 =1
𝑘𝑖log𝐱⊺𝐝∗𝑖 𝑐𝑖𝑘𝑖 1 − 𝑘0 𝑧𝑗>0
1𝑘𝑗
𝑘0 𝑧𝑗=0 𝐱⊺𝐝∗𝑗 𝑐𝑗
22
Consequence * Effectiveness
Effectiveness to all industries

Industrial and Manufacturing Systems Engineering
Optimal pre-disruption allocation
23 𝑝
−𝑘𝑝𝑔 0, 𝑍
𝜕𝑔𝜕𝑧𝑝0, 𝑍
1 − 𝑝
𝑝
𝑘𝑝 + 𝑘𝑞 > 𝑘0 𝑧𝑝 > 0
𝑧𝑝 = 0
Probability of disruption
Effectiveness
of prevention
Effectiveness of
preparedness
Effectiveness of
response
Opportunity
cost
function

Industrial and Manufacturing Systems Engineering
Optimal pre-disruption allocation
24
𝑧𝑝 = 𝑍
𝑔 𝑧𝑝, 𝑍

Industrial and Manufacturing Systems Engineering
Risk aversion
25
Industrial and Manufacturing Systems Engineering
Example: multiple disruptions
• Gulf states: Texas, Louisiana, Mississippi,
Alabama, Florida
• 2 disruptions: oil spill (Deepwater Horizon) and
hurricane (Katrina)
• Probability of each disruption
• Economic losses
• Demand losses
• Production shut-down
• Hypothetical decision maker
26
MacKenzie, C.A., A. Al-Kazimi (2017). Optimal resource allocation model to prevent,
prepare, and respond to multiple disruptions, with application to Deepwater Horizon
oil spill and Hurricane Katrina. Under review.
Industrial and Manufacturing Systems Engineering
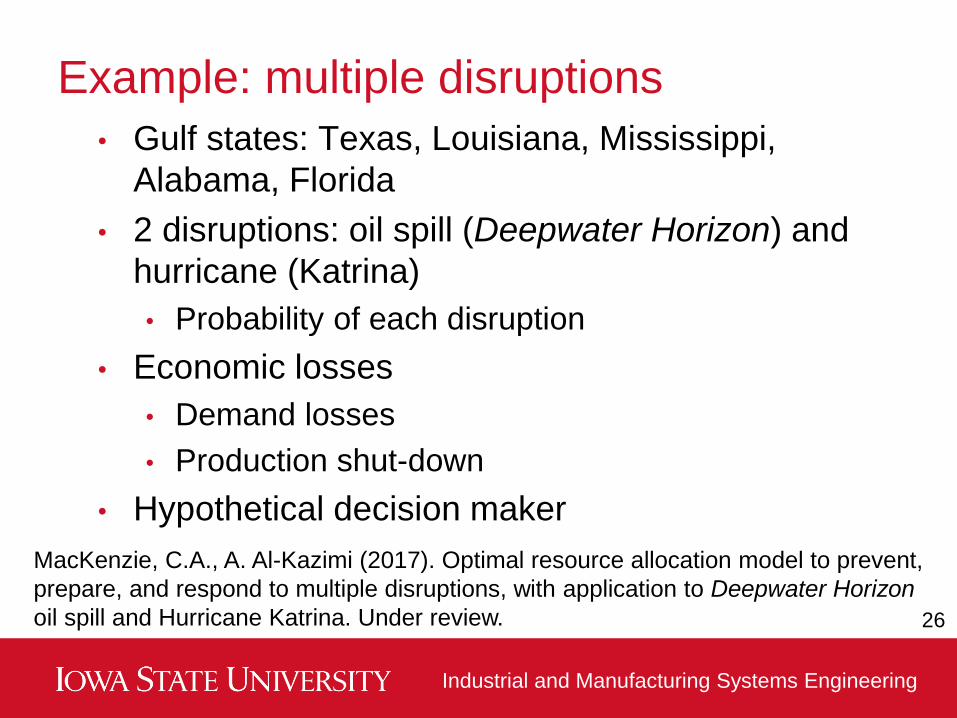
Input parameters
Probability 𝑝 = 0.045 𝑝 = 0.56
Prevention 𝑘𝑝 = 2.8*10-4 𝑘𝑝 = 0
Preparedness 𝑘𝑞 = 1.6*10-4
All industries 𝑘0 = 1.1*10-5
Directly impacted
industries
𝑚 = 5 𝑚 = 31
Fishing, Real
estate,
Amusements,
Accommodations,
Oil and gas
Service industries,
Farms, Fishing,
Construction,
Manufacturing
industries, Utilities,
Ports, Oil and gas,
𝑔 𝑧𝑝, 𝑍 = 1.6 𝑍 − 𝑧𝑝 27
Oil spill Hurricane

Industrial and Manufacturing Systems Engineering
Parameter estimation for fishing
28
$62 million lost sales from Gulf
Coast fishing
0.84% of region’s fishing
and forestry production
Studies on food safety and
impact of positive media stories
$792,000 to reduce losses
by $40 million
MacKenzie, C.A., H. Baroud, and K. Barker (2016). Static and dynamic resource
allocation models for recovery of interdependent systems: Application to the
Deepwater Horizon oil spill. Annals of Operations Research, 236, 103-129.

Industrial and Manufacturing Systems Engineering
Optimal pre-disruption allocation
29

Industrial and Manufacturing Systems Engineering
Economic losses
30

Industrial and Manufacturing Systems Engineering
Sensitivity analysis (pre-disruption
allocation as initial impacts vary)
31
$30 billion budget

Industrial and Manufacturing Systems Engineering
Conclusions
• Model benefits
• Consider one disruption versus another
disruption
• Pre versus post-disruption allocation
• Consider spending on disruptions versus other
priorities
• Decision maker should allocate more for
hurricane than oil spill more probable and
more consequential
• Lei Yao: allocating resources under deep
uncertainty32
Industrial and Manufacturing Systems Engineering
Final thoughts
• Models for disruptions provide insight into the
consequences of disruptions
• Models provide insight into how to make
decisions
• Getting data is difficult
If you are a new graduate student
• Find problems that interest you
• Don’t worry if data is not available: think about
how you might want to solve the problem first
33Email: [email protected]