Systems mitigate risks Risks not eliminated Public Works: Prepared Annual valve testing Ongoing dam…
Upload
truongduongCategory
view
223download
0
Mitigate Business Intelligence Project Risks With
Rule-Based Audits and Proof-of-Concepts
By: Michael L. Gonzales Managing Partner HandsOn-BI, LLC

Table of Contents Executive Summary............................................................................................................ 3 Introduction......................................................................................................................... 4
BI Real-World Risks Real-World Example: Disparate Data Sources............................................................... 6
Risk Mitigation ................................................................................................................... 8 The Spiral Approach ....................................................................................................... 8
Rule-Based Audits and Proof-of-Concepts....................................................................... 11 The Purpose of an RBA and POC................................................................................. 11 Rule-Based Audit and Proof-of-Concept Steps ............................................................ 12
Technology That Supports Your Risk Mitigation ............................................................ 14 Rule-Based Audits Using BRE..................................................................................... 14 Proof-of-Concepts Using DMExpress .......................................................................... 15
Conclusion ........................................................................................................................ 19 Appendix A – DMExpress Case Study: ACNielsen......................................................... 20
The Challenge ............................................................................................................... 20 The Solution.................................................................................................................. 20 The Benefits .................................................................................................................. 21
Figures and Tables
Figure 1 – Analysis Thrashing…………………………………………… Page 6 Figure 2 – Risk mitigation round…………………………………………. Page 9 Table 1.0 – RBA and POC comparison………………………………….. Page 11 Figure 3 – Sample data flow…………………………………………….. Page 14 Figure 4 – BRE rules definition…………………………………………. Page 15 Figure 5 – Complex rules with DMExpress ………………….................. Page 16
References Boehm, Barry, A Spiral Model of Software Development and Enhancement, IEEE, May 1988 Gonzales, Michael L., How To Make BI Less of a Gamble, Intelligent Enterprise, February 1, 2005 Gonzales, Michael L., Conducting A Data Quality Audit, Intelligent Enterprise, July 10, 2004 Gonzales, Michael L., The No-Sacrifice Affordable Data Warehouse APP, Intelligent Enterprise, October 30, 2004
2
Executive Summary Analytical applications such as those found in Business Intelligence (BI) and warehouse-centric projects, are often plagued with a lack of clear definitions of source data, as well as comprehensive application specifications. This creates a significant amount of project risk. Successfully implemented BI and data warehouse projects have one thing in common: explicit consideration of risk. To address BI project risk this author recommends using as a guide the seminal work of Barry Boehm and his process model, the Spiral Approach1. This approach:
• Fosters the development of specifications that are not necessarily uniform, exhaustive or formal.
• Incorporates prototyping as a natural part of risk reduction. • Encourages re-work in the early development stages as better alternatives are
discovered. The Spiral Approach is the only process model that is risk-driven. All other process models and software development methods are document-driven. Techniques for risk mitigation are woven into the project itself and include Rule-Based Audits (RBA) and Proof-of-Concepts (POC). Use RBAs to prove that sample source data, coupled with known business rules, can create your target table(s). Then follow up with a POC in order to prove that the results of the RBA can be achieved at production scale for both data volumes and platform capacity. Business Rules Engine (BRE) is a tool specifically designed to conduct inexpensive Rule-Based Audits on a laptop. For larger, more complex audits and especially Proof-of-Concepts, this author recommends DMExpress2.
1 Boehm, Barry, A Spiral Model of Software Development and Enhancement, IEEE, May 1988 2 Syncsort Inc., www.syncsort.com
3

Introduction Successful BI and data warehouse projects share at least one common characteristic: explicit consideration of risk. Nothing addresses BI project risks as well as a Rule-Based Audit or Proof-of-Concept. Nothing. Not a detailed project plan, not expensive technology, not high-priced talent. BI projects are peppered with risks, from data quality to analytic value and scalability. Furthermore, these risks often bring entire projects to a halt, leaving planners scrambling for cover, sponsors looking for remedies, and budgets wiped out. Simply put: analytic applications are some of the trickiest to develop3. They are stuffed with concepts like slice-and-dice, ad hoc, data pivoting, and drill-through. Users often don’t know exactly what they want you to build until they start seeing part of the application. This often requires BI teams to build an application before it’s fully defined and specified. Couple this challenge with the data quality problems inherent when sourcing operational systems, scalability in terms of data volumes, refresh rates, and the potential for risk is very real. This paper describes two methods for minimizing the risk associated with BI iterations: Rule-Based Audits and Proof-of-Concepts. Independently used, each will help you clarify and better understand risk points associated with your project. Implemented together, they represent a continuum of risk mitigating techniques. Their presence in projects is a demonstration of the professionalism and discipline found only in seasoned, successful BI teams.
BI Real-World Risks At the beginning of a project, BI planners might encounter the following response when asking users to specify parameters for strategic analysis and reporting: “Well, I need a weekly report that tells me this or that.” Frustratingly, the moment the report is delivered, they might hear: “Good. But, can you summarize this column or add another column?” Why does this happen? It’s because users are not entirely sure of the decision support requirements until they have something in front of them to work with. Then, and only then, are they better able to clarify their needs. Then there is the matter of the data being sourced. The Extraction, Transformation and Loading (ETL) process is still the most underestimated, under-budgeted part of most BI/DW iterations. And the biggest reason why the ETL portion of a project often raises more questions than it resolves has to do with a lack of understanding of the source data.
3 Gonzales, Michael L., The No-Sacrifice Affordable Data Warehouse APP, Intelligent Enterprise, October 30, 2004
4

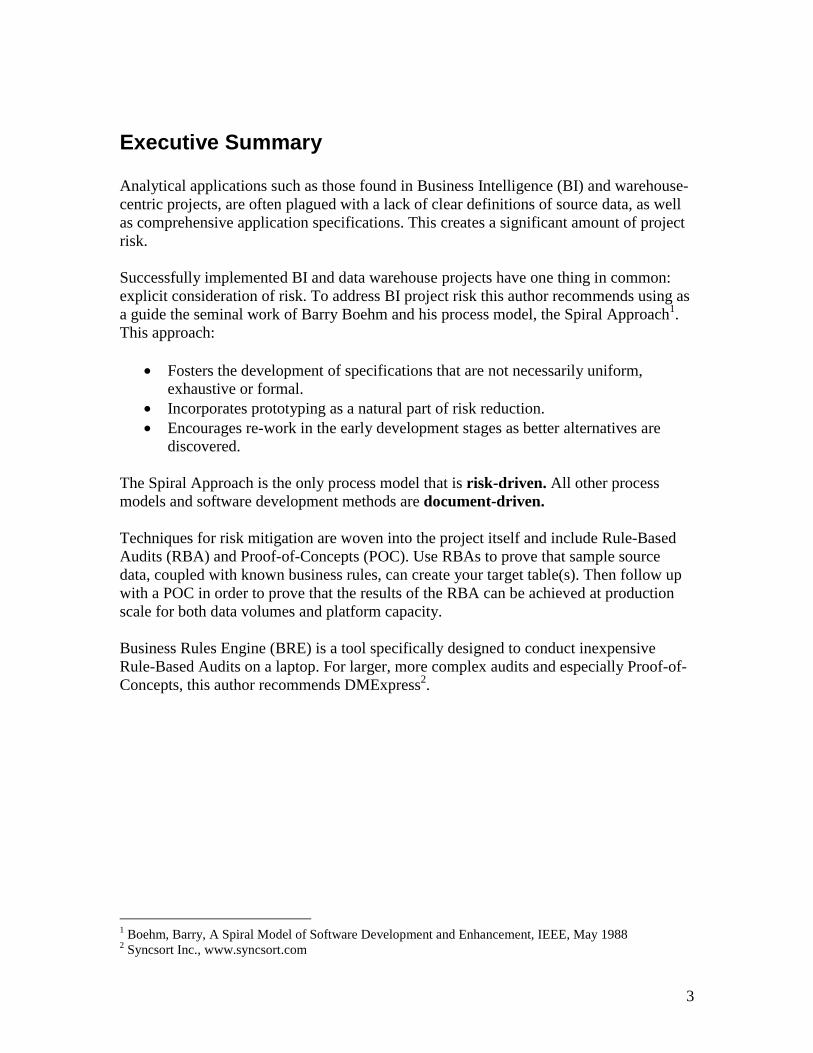
During data extraction and transformation there are numerous issues that your team will encounter. Many of these will require you to go back to the user group for further clarification. They include: Multiple meanings for the same data element. Once you have isolated the business requirement and have started to gather the source requirements, you may find that a value defined by one user audience is different for other users who may be accessing the same data store. An example would be values like ‘profit,’ ‘cost’ or ‘revenue’. Each of these values could have different meanings to different user communities. Consequently, you will need to document definitions from all groups and see if you can implement transformation processes to satisfy each. Multiple sources of data elements. It is often the case that specific data elements exist on multiple source systems. Your job will be to identify the various sources and discuss with the users which one is most applicable. Differing levels of history. Another challenge you may encounter has to do with availability of history. What if your business requirement calls for four years’ worth of history but the best, most recent data contains only one year? The other three years would need to be extracted from other data sources, possibly of questionable quality. Data cleanliness and accuracy. Warehouse data is never perfect. Instead, you need to ask yourself: is the data clean enough? De-integration for audits and validation. So now that you have done a wonderful job at integrating, transforming and cleansing the data, how do you separate the data for audit and validation purposes? The descriptions above should not suggest a defined sequence of events. The message is that any single data element can quickly go from a simple transformation into an explosion of new requirements, regardless of the mix or order in which the issues are confronted. And with each data quality issue uncovered, there is a significant amount of thrashing between the ETL team, project designers and end users (Refer to Figure 1). Often it requires everyone to evaluate the new transformation issues before a solution can be established and sent back to your ETL programmers. The project team designs a system to support a pretty pie chart. But if the project team and its designers never assess the quality of source data necessary for that pie chart, then they are exposing the entire project to great risk. Consider this carefully: if no one spends any time to assess the source data quality, then it is entirely possible that you will purchase and install all the technology, do all the analysis, write all the source-to-target code to populate target tables, and still fail. Figure 1 – Analysis Thrashing.
5
Analysis Thrashing
Multiple Sources
Problems with History
Multiple Meanings
Cleanliness & Accuracy
Users
Audit & Validation
Multiple Sources
Problems with History
Multiple Meanings
Cleanliness & Accuracy
Users
Audit & Validation
Real-World Example: Disparate Data Sources A project I worked on several years ago convinced me of the value of risk mitigation. The account had 20 different sales applications dispersed around the world, leaving executives unable to report current sales accurately. Their goal was not just to correctly report current sales, but all chronological history of sale order line detail changes, as well. The company hired one of the Big Six consulting firms to create a single sales data mart on a Windows platform. After spending nearly $1million on the effort and not achieving their goal, the account decided to stop the project. The problem was not data volume or technology—it was data quality. As it turned out, a few of the sales applications restated history anytime a change was made. Consequently, you would never be able to accurately report all reversing entries and changes to every sales order line simply because the application did not maintain that information. But they did not need to spend a million dollars to find out. Consider the following options: Option One. Spend $1million to bring in a high-priced BI team, conduct planning sessions to create and agree to an elaborate project plan, conduct business requirements gathering sessions, document and formalize all requirements in professional binders, build a fantastic entity-relationship model, gather and map source data to that model, purchase and install your platform, start writing transformation scripts—only then to find out that the source data cannot be transformed into the required target table. Option Two. Take a laptop with sample source data, apply your business rules and see if you can create the target table needed for less than $50k. Do this before you commit to the full scale project.
6

Risk mitigation is all about saving money, time and grief. You be the judge: Spend $1million to find out you have problems, or $50k.
7

Risk Mitigation The peculiarities of analytical applications, plus the lack of understanding of the source data create significant amount of project risk. And, it is the project risk that must be addressed as opposed to naively attempting to build detailed, formal documentation based on a best guess. To address BI project risk this author recommends using as a guide the seminal work of Barry Boehm and his process model, the Spiral Approach. This approach:
• Fosters the development of specifications that are not necessarily uniform, exhaustive or formal.
• Incorporates prototyping as a natural part of risk reduction. • Encourages re-work in the early development stages as better alternatives are
discovered. This section will briefly describe the Spiral Approach and more specifically, how it can be an integral part of your BI project planning.
The Spiral Approach The Spiral Approach is a unique risk mitigation process that can be used to drive the entire BI project iteration or to supplement your in-house life cycle development steps and warehouse planning procedures. The Spiral Approach contains four sections as outlined below and illustrated in Figure 2: Quadrant 1 – Determine Objectives & Constraints. This quadrant is designed for project planners to examine the objectives and any constraints that might be associated with this particular round. Quadrant 2 – Risk Analysis, Alternatives & Prototypes. Here is where risk is explicitly addressed. The quadrant is formally defined in order to ensure project planners identify means by which risk can be mitigated specific to the round being implemented. For example, if we have a known data quality issue in our data warehouse iteration, then we can define and initiate a Spiral round to address just that risk, up front. Perhaps we know that integrated sales data from 20 disparate locations is going to be difficult. To address the integration risks, we would conduct a Rule-Based Audit or Proof-of-Concept to see if we can achieve the level of integration necessary or come up with alternative solutions. Quadrant 3 – Development. This is where we would blend the results of our risk analysis with development requirements in order to create the needed solution. In the
8

example above, we may have identified an alternative approach to integrating sales data, which at this stage, is being developed into a formal ETL process. Quadrant 4 – Plan the Next Phase. As you conduct the risk analysis, and adapt those results into your formal development, you potentially change how the next tasks of your overall project may be conducted. Let’s say our initial plans called for nightly updates of integrated sales. And, after we conducted a test of the integration, we determined that updates could only be done weekly. This new information changes how subsequent tasks of the overall project iteration may be approached. This is the quadrant where you adjust your next step. The Spiral Approach is the only process model that is risk-driven. All other process models and software development methods are document-driven. What’s the difference? Document driven processes assume that complete, formal documentation can be obtained. Unfortunately, to obtain clear, concise documentation, the solution must be clearly understood and defined. Therein lies the problem. Anyone with experience in BI and warehouse-centric iterations knows that solutions are seldom clearly and accurately defined prior to development. Figure 2 – Risk mitigation round.
Risk MitigationRound
Q1-0.1: Objectives And Constraints•Create Preliminary Scope•Commit to Feasibility Study•Establish Objectives•Outline Issues and Constraints
Q2-0.2: Risk Analysis, Alternatives And Prototypes•Readiness Assessment•Data Quality Audit•Rules-based Audit•Proof-of-Concept•GAP Analysis
Q3-0.3: Development•DIF Assessment•DW Strategy•High-level WBS•Training Plan
Q4-0.4: Plan For Next Phase•ETL POC Effort•Data Quality Strategies•Establish Requirement Priorities
Spiral START
Examples:
Examples:
Examples:
Examples:
In our $1million example, the project was based on a document-driven approach. Consequently, they had very detailed, professional documents and only encountered the data quality problem in development. If they had taken a risk-driven approach to the project, the risky aspects of the effort would have been identified in advance and addressed first. In this manner, they would have established whether the level of integration could be achieved and if not, what alternative solutions might be available.
9

The power of the Spiral Approach is not just the fact that it is risk-driven, it is also adaptable. The Spiral Approach can be adapted for various BI iterations. Outlined in Figure 2 is a risk mitigation round with example tasks for each phase. The round is designed as a discovery effort to clarify, understand and otherwise address the risky points of any particular BI iteration. The round can be used to examine issues ranging from iteration priority, data quality, access alternatives, cultural aspects of the organization, as well as the skill of IT and user communities. This gives the organization a chance to better understand its BI and warehouse iteration requirements, strategies, and their relevant impact on costs and other resources. The most important thing to remember when implementing the Spiral Approach is to be flexible, creative, and to adapt the approach to the circumstance. The Spiral Approach is a process model. Its purpose is to help you define the entry and exit criteria between tasks and/or phases. Most importantly, it consciously blends risk assessment into the process before you develop or create anything.
10

Rule-Based Audits and Proof-of-Concepts Proof-of-Concepts and Rule-Based Audits are examples of risk analysis techniques used in the second phase of a risk mitigation round. These techniques might be used to evaluate source data quality, identify alternative data sources, or formalize new cleansing strategies. They can also help you address scale risks. For instance, you may have decided that loading large data sets within a limited window might be of greater concern, and therefore, a POC is used to test ETL processes for an optimum load time. Regardless of the type of risk mitigating technique used, its scope must be kept within the range of the Spiral round itself, and agreed to by planners in the first phase of the round. In this section we examine specific steps necessary to conduct a successful RBA or POC for your risk mitigation rounds.
The Purpose of an RBA and POC There are any number of questions, issues, doubts, and unknowns about BI projects that need answers. Conducting an RBA or POC is done in order to obtain those answers, to add clarity, as well as to understand the scale and scope of the project at hand. Specifically, the RBA is designed to answer a single, fundamental question: can we take known sources, add explicit business rules and create the target data necessary for subsequent analysis? If you cannot answer this question with confidence, then you have no business risking company resources for a project. A POC on the other hand, answers more questions regarding a BI project. A POC takes the results of your business rule audit and scales the testing to prove the feasibility of production issues such as actual data volumes, processing time constraints, and platform stress testing, to name just a few. Refer to Table 1.0 for a comparison between Rule-Based Audits and Proof-of-Concepts. Table 1.0 – RBA and POC comparison. Risk Mitigating Techniques Rule-Based Audit Proof-of-Concept Source Data Sample data only. Sample or complete data set.
Platform Completely conducted on an independent, isolated platform, such as a laptop.
Either similar to RBA, or implemented on the platform of choice to test things such as batch cycle time, network connections, CPU performance, elapsed time performance, etc.
Testing Goal Applying explicit business rules to sample source data in order to build a target table(s)
A POC takes the results of a business rules audit and scales the testing to address specific production level issues.
11

You certainly can implement either technique to mitigate your risk. But complete risk mitigation is achieved by conducting both. Rule-Based Audit and Proof-of-Concept Steps The steps to conduct an RBA/POC are straight forward and similar to the steps this author outlined in the article, Conducting A Data Quality Audit4. The five steps for a Rule-Based Audit and Proof-of-Concept are as follows:
1. Always perform the RBA/POC before committing to a project. Doing so uncovers potential problem areas in regards to data quality and target data requirements, as well as quantifies performance and scale issues in order to accurately size the scope of your project effort.
2. Select your RBA/POC tool(s). The tool(s) must be capable of applying a wide
variety of explicit business rules and yet be simple to install, modify and execute. There are three core criteria to consider during your selection process:
• The tools must be robust enough to apply a wide variety of explicit business
rules to source data in order to create a target table(s). This includes complex joins, sorting and filtering.
• The tools must not interfere with the objective of the RBA/POC. Use something that doesn’t require specialized skills or training.
• The tools must install completely on a single laptop and scale to the most powerful platforms. The RBA is always conducted on a laptop using sample data, but a POC must be able to test full data volumes and target production platforms.
3. Gather source data definitions: This step provides the initial scope of the tables
and their attributes relevant to the effort. 4. Run initial audit: The RBA is based on sample data in an attempt to determine if
we can build target data given known business rules and existing source data. There are three sub-steps to running an initial audit: • Apply known business rules: These are explicit business rules that must be
applied to transform the source data into whatever target is necessary for subsequent analysis.
• Create sample target: Once all rules are defined, you now can attempt to build the target structure(s).
• Test results: Assuming the target table(s) can be built, the final step is to actually test the results. That doesn’t mean building pie charts, but to test the
4 Gonzales, Michael L., Conducting A Data Quality Audit, Intelligent Enterprise, July 10, 2004
12

data itself. In other words: can I aggregate sales grouped by sales orders, products, and reversing entries made over the last quarter to get an accurate result?
5. Run Full-Scale POC: Once you have proven that you can create target tables
based on your RBA, you must scale up to address production risks. There are four sub-steps to this effort as follows:
• Choose a production data set(s). Testing current and future data volumes
requires sufficient data. • Establish a testing environment. If you can’t use the real production
environment for your POC, you must emulate it as much as possible. This means that if production uses X amount of disk space and is assigned Y processors and Z memory, then run your POC under similar conditions.
• Create metrics that can be verified and repeatable. You must be able to measure elapsed time performance and platform resources consumed, including CPU, memory, disk space, etc. This is critical as justification/proof for management.
• Synchronize POC target results with RBA results. Even though you are running a scaled up test, the target data results must represent the results of your audit.
Once you know that target table(s) can be created with an RBA, then you will want to prove what can be achieved at production scale using a Proof-of-Concept. Refer to the notes section of this article for more information regarding these risk mitigating techniques.
13

Technology That Supports Your Risk Mitigation
Rule-Based Audits Using BRE A Rule-Based Audit is specifically designed for audits based on business rules. Its sole purpose is to allow subject matter experts to import source data, apply explicit business rules, and attempt to create a target table to meet the user requirements. For the purpose of illustration, Figure 3 shows a data flow for a sample audit. Figure 3 – Sample data flow.
The goal of the process shown in Figure 3 is to use business rules to determine the total deposits by account for the current month from the current month’s transactions. To do so, we first define three new tables by filtering data from the main ‘Current Transactions’ table as follows:
• Debit corrections are transactions with an OPR_TYP(operation type) of 305. • Credit corrections are transactions with an OPR_TYP(operation type) of 003. • Deposit corrections are transactions with an OPR_TYP(operation type) which is
listed in the Deposits list. The next step is to create a list of credit corrections that have not been zeroed out by a corresponding debit correction. Credit corrections and debit corrections are compared by TRANSIT, ACCOUNT, and TRX_AMT with any matches being filtered out of credit corrections. A similar process is then used to filter the deposit transactions table with deposit transactions by comparing them to the filtered credit corrections. Once the deposit transactions have been filtered for off-setting corrections, they are filtered to make sure only debit transactions are used in the calculations. The month’s deposits per
14

account are then calculated by grouping transactions by TRANSIT and ACCOUNT and then a sum of TRX_AMT. It sounds confusing, I know. But that is exactly why we want to conduct this RBA in the first place. Complex filtering and integration increases risks. Instead of assuming we can do the work, the audit allows us to confidently determine if we can actually build the type of target necessary. My firm, HandsOn-BI, LLC, has designed, developed, and maintains a product called Business Rule Engine (BRE). BRE is an effective tool used for our audits based on sample data sets, and completely isolated from a technical architecture. It is made available to our members only and is unsupported. Most advanced integration rules or complex calculations can be applied in the BRE as shown in Figure 4. Figure 4 – BRE rules definition.
Although BRE is an effective tool for RBAs, it is homegrown. There are better tools available to perform an audit. Tools that are more robust, stable, and actually come with technical support! DMExpress is one.
Proof-of-Concepts Using DMExpress Once you have proven that you can create target tables using explicit business rules against sample source data, you must scale up to address production risks. For example, can you transform the data volume necessary on a nightly basis given target production
15

platforms and service level constraints? There are five sub-steps to running a full-scale POC and creating a Verifiable Production Environment and Metric:
• Choose production data with enough volume to eliminate your performance risks as future data volumes grow. Try to save the data for additional testing if needed.
• Choose a platform as close to production as possible – preferably the same platform used in production.
• Choose conditions that will be as close to production conditions as possible – if other jobs don’t normally run during production, then don’t run other jobs when the POC is running. If production uses X amount of disk space and is assigned Y processors and Z memory, then run the POC the same way.
• Measure elapsed time performance and platform resources used – CPU, memory, disk space, etc. Create metrics that can be verified and repeatable. This will be part of your justification/proof for management that this project works.
• Assure target data results match production target tables or expected targets. Figure 5 – Complex rules with DMExpress.
16
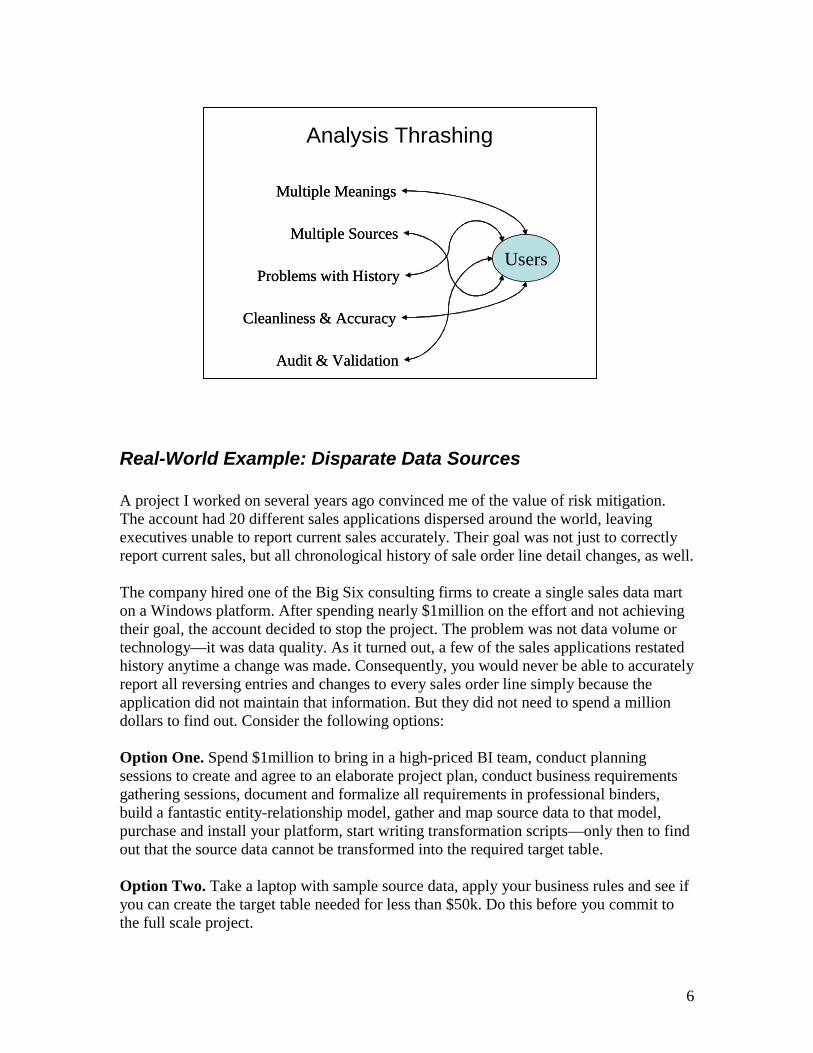
We use tools like DMExpress when confronted with audits that must address not just business rules, but scale and scope issues as well. For example, a client may want to test business rules against production data sets and not just sample data. BRE is designed for sample data sets—BRE will die with large data volumes. DMExpress on the other hand, is a high-performance technology that plows through large volumes of data with relative ease. DMExpress can also be used to build a POC that will answer questions about any number of technical issues or to address doubts and concerns regarding the project iteration at hand. The tool is consistent with the flow of a Rule-Based Audit. It is straightforward in identifying sources, defining targets and joins, as well as sorting and filtering. With products like DMExpress, you can readily address all issues common to the RBA as well as the development of a full-scale POC. For illustration, Figure 5 is a screen shot of DMExpress. The top menu shows buttons for aggregation, joining, merging, and sorting. If you read down the tree outline, you see
17

entries for data sources and data targets as well as values. This is one area where you can apply complex business rules.
18

Conclusion Well run projects always take explicit consideration of risks. They do not avoid risks nor minimize them. Instead, they integrate risk mitigation techniques such as Rule-Based Audits and Proof-of-Concepts. Reducing risk does not have to be expensive. The company I work for, HandsOn-BI5, has developed its own tool, Business Rules Engine (BRE), using Visual Basic and Excel. This tool allows us to conduct effective and focused audits for our clients, without the technology being an issue. A tool like BRE is homegrown, designed specifically to fit on a laptop. For larger, more complex audits and especially Proof-of-Concepts, we recommend DMExpress. This product scales from a simple laptop to a 64-way Superdome. It provides a full range of ETL functionality without a significant learning curve for business analysts. Consider applying both techniques to your risk mitigation efforts. Use RBAs to prove that sample source data, coupled with known business rules, can create your target table(s). Then follow up with a POC in order to show that the results of the RBA can be achieved at production scale. Ignoring the risks of BI projects is only for the reckless or the naive. This is especially true when you consider that implementing risk reducing techniques are not only effective, but relatively cheap when compared to full-scale production implementations. It’s your choice: spend a $1million only to find your project come to a grinding halt. Or, invest $50k initially to clearly define your BI projects prior to making any major commitments.
5 HandsOn-BI, LLC, www.handson-bi.com
19

Appendix A – DMExpress Case Study: ACNielsen
The Challenge ACNielsen, a VNU business, is in the process of building its New Factory for Europe, the largest retail sales data factory. New Factory will be used to analyze sales data from different retailer channels and countries in Europe. The analysis will provide insight into how much impact a specific promotion has had on the sale of a product, how well brands perform in comparison with other brands, and how successful the launch of a new product was, as well as a variety of other measurements. It is through innovations like New Factory that ACNielsen has become the world's leading marketing information provider. Offering services in more than 100 countries, the unit provides measurement and analysis of marketplace dynamics and consumer attitudes and behavior. Clients rely on ACNielsen's market research, proprietary products, analytical tools and professional service to understand competitive performance, to uncover new opportunities and to raise the profitability of their marketing and sales campaigns. Due to the necessary computation of non-additive distribution facts in New Factory, simple roll-up or cube functions would not be sufficient. But the need to complete a large number of complex aggregations represented a potential performance bottleneck for the company. ACNielsen began a thorough search to find a powerful, high-performance ETL solution that could complete the aggregations. DMExpress proved to be that solution.
The Solution DMExpress was installed by ACNielsen in a Proof-of-Concept to aggregate an initial 2.7 billion facts over 4 different dimensions, varying in hierarchy depth from 2 to 9 levels. According to Technical Director Michael Benillouche, “When we started developing our data factory application, called New Factory, we knew that performance was going to be an issue. We searched for a solution that could handle the high volume of data we were processing in the shortest amount of time. After considering ETL software from major vendors, we selected DMExpress. DMExpress easily integrated into New Factory’s distributed computing framework and provided us with the outstanding results we needed.” ACNielsen tested DMExpress in New Factory, running it on a large-scale UNIX server with 16 CPUs, 32 gigabytes of memory, and terabytes of disk arrays. The server is capable of delivering data at a sustained rate of 600 MB/sec. Once in production, data will be constantly processed in this carefully designed factory. It is estimated that 12 billion sales facts will be aggregated along four different dimensions each week in order
20

to aggregate the thousands of data elements accessed through the New Factory Web applications.
The Benefits ACNielsen discovered that as data volumes grow, so do the performance advantages of DMExpress. With the ability to process in parallel, DMExpress speeds through data-intensive applications. Application development is also much faster utilizing the advanced, easy-to-use graphical user interface (GUI). Instead of focusing on processing the data, you can use the time to create what you need. Discussing ACNielsen’s use of DMExpress for aggregation, Andrew Coleman, Syncsort’s Director of Software Engineering added, “More and more, we see the aggregation step being the critical performance issue in our customer’s data warehouse applications. The hardware capacity is typically available, provided that the software can fully exploit it. Our combination of proprietary aggregation algorithms and relentless pursuit of parallelization across multiple processors and multiple servers allows DMExpress to achieve the maximum from the hardware.”
21