Missouri Boating Statistics & Drownings
24
Missouri Boating Statistics & Drownings Department of Public Safety Missouri State Highway Patrol 2018 Edition 2017 Statistics
Transcript of Missouri Boating Statistics & Drownings

MissouriBoating Statistics
& Drownings
Department of Public Safety
Missouri State Highway Patrol
2018Edition
2017Statistics


Boating Statistics & Drownings/2017 statistics 1
Introduction This booklet is published by the Missouri State Highway Patrol as an aid to persons who are interested in recreational boating crashes and accidental drowning incidents occurring in the state. It contains information which provides a comprehensive look at statewide crashes and accidental drowning incidents as experienced in 2017. The Missouri State Highway Patrol is the central recreational boating data collection agency for the State of Missouri. The Patrol investigates all recreational boating crashes occurring in the state and either investigates or gathers data on accidental drowning incidents occurring in state and private waters.
Interesting Statistics
It is hoped that the information in this booklet will be of value to you. Certainly it is the most comprehensive look available at statewide crashes and accidental drowning incidents in Missouri.
Here at a glance are some interesting statistics found in this booklet:
• In 2017 there were 10 persons killed and 91 persons injured in recreational boating crashes in the state of Missouri. This was six fewer killed and 20 fewer injured than in 2016. There was a decrease of 7% in total crashes statewide (169) compared to 2016 (182).
• In 2017 there were 169 total crashes including 91 property damage only, 68 injury, and 10 fatal.• “Other” was the leading contributing circumstance for all crashes followed by “water conditions
(rough, chop, current, etc.).” “Impairment (alcohol/drugs)” was known to have been a contributing circumstance to 18 crashes statewide.
• “Falls overboard” crashes resulted in the deaths of three persons. This was 30% of the total persons killed in crashes.
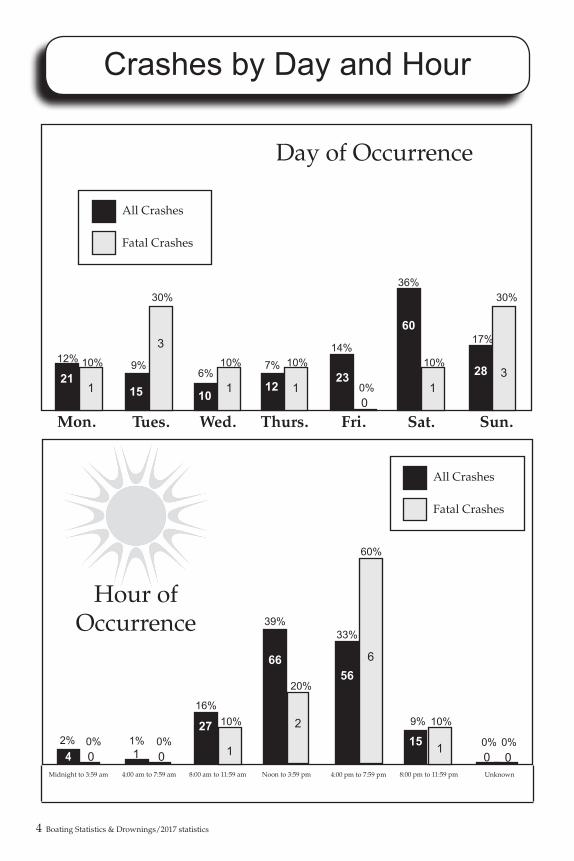
• Of all crashes reported statewide, 78% (132) occurred during the months of May through August.• Most crashes occurred on Saturday (60) and Sunday (28) and most (122) occurred between noon
and 8:00 p.m.• Of all crashes reported statewide, 72% (121) involved only one watercraft. All ten of the fatal
crashes involved only one watercraft.• Of the 192 boat operators involved in crashes, 106 had no prior boater education.• In 2017, there were 36 persons killed in accidental drowning incidents occurring in state waters,
five more than in 2016. The Missouri State Highway Patrol also investigated 15 accidental drowning incidents that occurred on private property. Additionally, there were eight accidental drowning incidents, directly attributable to flooding/flooded roadways, investigated by the Missouri State Highway Patrol.
• Most drowning incidents occurred on Saturday (11) and Wednesday (11), and most occurred during the months of May (10), June (9) and July (13).

2 Boating Statistics & Drownings/2017 statistics
Index
Boating Crashes by Year ........................................................................................3
Boating Crashes by Month ...................................................................................3
Boating Crashes by Day and Hour ......................................................................4
Water and Weather Conditions ............................................................................5
Nationwide Information .......................................................................................5
Boating Crashes by Troop/County .....................................................................6
Crash Type ..............................................................................................................7
Boating Crashes by Body of Water/County ...............................................8 & 9
Boating Crashes by Multi-County Body of Water .............................................9
Probable Contributing Circumstances ..............................................................10
Vessel Actions at Time of Crash .........................................................................11
Alcohol Involvement ...........................................................................................11
Number of Vessels Involved ...............................................................................12
Vessel Type Involved ...........................................................................................12
Age of Killed/Injured & Operators ...................................................................13
Buoy/Regatta/Dive Team/Boater Education Statistics .................................14
Drownings by Year ..............................................................................................15
Drownings by Month ..........................................................................................15
Drownings by Day & Hour ................................................................................16
Drownings by Troop/County ............................................................................17
Drownings by Body of Water .............................................................................18
Age of Drowning Victim .....................................................................................19
Holiday Crashes & Drownings ..........................................................................20
Highway Patrol Headquarters ...........................................................................21

Boating Statistics & Drownings/2017 statistics 3
Boating Crashes by Year
Statewide Boating Crashes in Missouri
Boating Crashes by MonthStatewide Boating Crashes By Month
Fatal Injury PropertyDamage Total
JanuaryFebruaryMarchAprilMayJuneJulyAugustSeptemberOctoberNovemberDecemberTotal
0219
22334433111031
169
000123202000
10
02037
1325104310
68
0015
131717235721
91
Total
111
105
118
87
127
101
Killed
Persons Involved
Injury
Statewide Crashes
2012
2013
2014
2015
2016
2017
10
17
14
17
14
10
75
61
82
52
91
68
109
62
83
83
77
91
194
140
179
152
182
169
PropertyDamageYear Fatal Injury Total
12
17
15
17
16
10
99
88
103
70
111
91
4 Boating Statistics & Drownings/2017 statistics
Crashes by Day and Hour
Midnight to 3:59 am 4:00 am to 7:59 am 8:00 am to 11:59 am Noon to 3:59 pm 4:00 pm to 7:59 pm Unknown
All Crashes
Fatal Crashes
Hour ofOccurrence
7%21
15 12
60
Day of Occurrence
All Crashes
Fatal Crashes
12%6%
1023 28
Mon. Tues. Wed. Fri. Sat. Sun.
17%
1
9%14%
36%30%
66
2
39%
20%
33%
566
60%
159%
10%
Thurs.
5
3
8:00 pm to 11:59 pm
42% 0%
2716%
0% 0%0
10%
001%
3
10%01
10%
1
0%0
30%
31
10%
1
10%
1
10%

Boating Statistics & Drownings/2017 statistics 5
Water Conditions Percent
PercentWeather Conditions
All Crashes
875486
131
169
All Crashes
1352814001
169
Percent
402000
3010
Percent
901000000
420031
10
9100000
10
Clear .........................................................Cloudy .....................................................Fog ............................................................Rain ..........................................................Snow .........................................................Hazy .........................................................Unknown .................................................Total ..........................................................
Calm (waves less than 6") ...............................Choppy (waves 6" to 2') ................................Rough (waves 2' to 6') ...................................Very Rough (waves more than 6') ..................Strong/Swift Current .............................Unknown ..................................................Total ...........................................................
Fatal Crashes
Fatal Crashes
51.4831.954.733.557.690.59
79.8816.570.592.370.000.000.59
Water & Weather Conditions
Nationwide Information
NationwideBoating Crashes
Boating Crashes ...................................
Injured ...................................................Killed .....................................................
Cost (Property Damage) .....................
2016
Source: United States Coast Guard
$49 million
4,463
2,903701
2017
$46 million
4,291
2,629658
*More than one condition can exist for a single crash

6 Boating Statistics & Drownings/2017 statistics
Boating Crashes by Troop/County
Troop InjuryFatal PropertyDamage
Troop A
00010000100010010000140000100000
101201010220000
1611122
263130001001
214223101111011820011
393061313110
County
BentonCarrollClayJacksonMonroeRallsFranklinJefferson St. CharlesBarryCedarDadeGreeneHickoryPolkStoneTaneyButlerMadisonRipleyWayneCamdenMillerMontgomeryMorganReynoldsShannonAndrewClintonCrawfordMariesPulaski
Troop B
Troop C
Troop D
Troop E
Troop F
Troop G
Troop H
Troop I
Total
14
Percent
8.28%
6 3.55%
4 2.37%
38 22.49%
9 5.33%
85 50.30%
5 2.96%
5 2.96%
3 1.78%

Boating Statistics & Drownings/2017 statistics 7
Cra
sh T
ype
% 1.98
11.8
80.
0021
.78
0.00
10.8
92.
977.
924.
952.
974.
954.
950.
001.
982.
970.
9917
.82
0.99
0.00
0.00
0.00
0.00
Tota
l
2 12 0 22 0 11 3 8 5 3 5 5 0 2 3 1 18 1 0 0 0 010
1
Kill
edIn
jury
Cra
shes
Cap
sizi
ng ...
......
......
......
......
......
......
......
......
......
...C
ollis
ion
wit
h Fi
xed
Obj
ect .
......
......
......
......
....
Col
lisio
n w
ith
Floa
ting
Obj
ect ..
......
......
......
.....
C
ollis
ion
wit
h V
esse
l .....
......
......
......
......
......
......
Equ
ipm
ent F
ailu
re ..
......
......
......
......
......
......
......
Fall
wit
hin
Ves
sel..
......
......
......
......
......
......
......
...Fa
ll on
a V
esse
l .....
......
......
......
......
......
......
......
....
Fall
Ove
rboa
rd ...
......
......
......
......
......
......
......
......
Fire
/Exp
losi
on (F
uel)
.....
......
......
......
......
......
....
Fire
/Exp
losi
on (O
ther
) ....
......
......
......
......
......
...Fl
ood
ing/
Swam
ping
.....
......
......
......
......
......
.....
Gro
und
ing
......
......
......
......
......
......
......
......
......
....
Impa
cts
a W
ave .
......
......
......
......
......
......
......
......
.Pe
rson
Lef
t Ves
sel ..
......
......
......
......
......
......
......
..Pe
rson
Eje
cted
from
a V
esse
l ....
......
......
......
.....
Oth
er...
......
......
......
......
......
......
......
......
......
......
.....
Skie
r M
isha
p ...
......
......
......
......
......
......
......
......
...St
ruck
by
Prop
or
Prop
ulsi
on U
nit .
......
......
....
Stru
ck b
y V
esse
l ....
......
......
......
......
......
......
......
...St
ruck
Sub
mer
ged
Obj
ect ..
......
......
......
......
......
.V
esse
l Str
uck
Trai
ler .
......
......
......
......
......
......
.....
Unk
now
n ...
......
......
......
......
......
......
......
......
......
...To
tal .
......
......
......
......
......
......
......
......
......
......
......
..Pe
rcen
tage
.....
......
......
......
......
......
......
......
......
.....
1 0 0 0 0 0 1 3 1 0 0 2 0 1 1 0 0 0 0 0 0 0 107.
82
1 8 0 12 0 11 2 5 2 2 3 0 0 1 2 1 17 1 0 0 0 0 6845
.81
4 22 3 35 0 0 0 0 2 7 10 8 0 0 0 0 0 0 0 0 0 0 9146
.37
6 30 3 47 0 11 3 8 5 9 13 10 0 2 3 1 17 1 0 0 0 016
9
3.55
17.7
51.
7827
.81
0.00
6.51
1.78
4.73
2.96
5.33
7.69
5.92
0.00
1.18
1.78
0.59
10.0
60.
590.
000.
000.
000.
00
Pro
pert
yD
amag
eTy
pe o
f Cra
shFa
tal
Inju
ryTo
tal
%
1 0 0 0 0 0 1 3 1 0 0 2 0 1 1 0 0 0 0 0 0 0 1012
.71
1 12 0 22 0 11 2 5 4 3 5 3 0 1 2 1 18 1 0 0 0 0 9187
.29Pers
ons

8 Boating Statistics & Drownings/2017 statistics
Crashes by Body of Water/County
Body of WaterCrashes Persons
InjuryFatal PropertyDamage Total Killed Injured Total
Big Piney RiverBlack RiverBlue SpringsClearwater LakeClearwater LakeCurrent RiverFredericktown City Lake
Gasconade RiverJacks Fork RiverLake of the OzarksLake of the OzarksLake of the OzarksLake JacomoLake SpringfieldLongview LakeMark Twain LakeMark Twain LakeMeramec RiverMeramec RiverMississippi RiverMissouri RiverMissouri RiverOther ImpoundmentPinnacle LakePomme de Terre LakeSmithville LakeSmithville LakeSt. Francis RiverStockton LakeStockton LakeStockton LakeTable Rock LakeTable Rock LakeTable Rock LakeTruman LakeWappapello LakeWappapello LakeTOTAL
0100000014001100000100000000000010000
10
100002100
263300201000001101110202
161111
68
012131010
39360002311111001430111182200
91
County
PulaskiWayneJacksonReynoldsShannonRipleyMadisonMariesShannonCamdenMillerMorganJacksonGreeneJacksonMonroeRallsCrawfordFranklinSt. CharlesAndrewCarrollJefferson MontgomeryHickoryClayClintonWayneCedarDadePolkBarryStoneTaneyBentonWayneButler
122133111
696911224112111115411313
253311
169
0100000014001100000100000000000010000
10
200002100
403300303000001101210203
171113
91
210002101
443311303001001101210203
181113
101

Boating Statistics & Drownings/2017 statistics 9
Crashes by Multi-CountyBody of Water
Body of WaterCrashes Persons
InjuryFatal PropertyDamage Total Killed Injured Total
Clearwater Lake ........................................Lake of the Ozarks ....................................Mark Twain Lake ......................................Meramec River ..........................................Missouri River ...........................................Smithville Lake ..........................................Stockton Lake.............................................Table Rock Lake .........................................Wappapello Lake .......................................Total ............................................................
0400000105
03210022
192
56
44852273
110
78
48462295
312
139
0400000105
04630032
214
79
05030032
224
80

10 Boating Statistics & Drownings/2017 statistics
Probable Contributing Circumstances
Fatal Total Killed Injured TotalInjury PropertyDamage
PersonsCrashesProbable ContributingCircumstance
0
0
0
1
0
2
0
0
0
2
0
0
1
1
0
0
1
2
2
0
0
0
0
0
0
2
1
0
1
0
0
0
2
0
0
2
1
1
0
0
2
9
0
14
6
0
1
5
2
1
0
8
0
2
8
9
2
2
0
0
0
6
1
0
13
0
16
1
0
0
0
0
1
21
2
0
0
0
0
1
0
2
0
0
0
2
0
0
1
1
0
0
1
2
2
0
0
0
0
0
0
2
1
0
1
0
0
0
2
0
0
2
1
1
1
0
7
19
0
28
16
0
1
22
2
1
1
18
0
4
25
28
21
3
0
0
2
19
11
9
41
1
17
3
0
0
2
1
1
37
9
3
0
0
4
20
0
23
14
0
2
11
2
2
2
9
0
0
1
2
2
0
0
0
0
6
1
5
22
0
17
1
0
0
2
0
2
25
3
1
1
0
5
9
0
12
10
0
0
15
0
0
0
9
0
2
16
17
17
1
0
0
2
13
10
7
27
1
0
2
0
0
0
1
0
14
6
2
Congested Waters........................................
Dam/Lock ....................................................
Equipment Failure (PFD, Bilge Pump, etc.) .......
Excessive Speed ...........................................
Exhaustion ....................................................
Failed to Keep Proper Lookout .................
Failed to Take Evasive Action ...................
Failure to Yield.............................................
Failure to Vent..............................................
Hazard in Water ..........................................
Health/Medical Problem ...........................
Hull Failure ..................................................
Ignition of Fuel or Vapor ............................
Impairment (Alcohol/Drugs) ...........................
Improper Anchoring ...................................
Improperly Loaded Vessel .........................
Inattention ....................................................
Inexperience of Operator ...........................
Mechanical Failure (Electric/Fuel, etc.) ...........
Navigation Lights (None/Partial) ...................
Navigation Rules Violation ........................
Off Throttle Steering ...................................
Obstructing Visibility in Vessel.................
Operated Too Close to Another Vessel ....
Operated Too Close to Dock or Other Object....
Operated Too Close to Shoreline ..............
Other .............................................................
Overloaded...................................................
Passenger/Skier Behavior .........................
Restricted Visibility (Fog, Rain, etc.) ...............
Restricted Vision ......................................................
Standing/Sitting on Gunwhal, Bows, Transom ..
Swimming Ability (Weak/None) ...................
Type of Vessel ...............................................
Wake..............................................................
Water Conditions (Rough, Chop, Current, etc.) ..
Weather Conditions ....................................
Unknown ......................................................
0
0
4
19
0
21
14
0
2
9
2
2
1
8
0
4
8
10
3
3
0
0
0
6
1
3
21
0
16
1
0
0
0
0
2
23
2
0

Boating Statistics & Drownings/2017 statistics 11
Vessel Action Fatal Injury Total %
Anchored ........................................................Boarding/Disembarking..............................Commercial Activity .....................................Docked ............................................................Docking Maneuver .......................................Fishing ............................................................Fueling............................................................Leaving Dock .................................................Other ...............................................................Recreational (Pleasure) Boating ..................Starting Engine ..............................................Moored (Bank, Vessel, etc.) ..........................Racing .............................................................Towing Other Vessel .....................................Tubing .............................................................Water Skiing ...................................................Whitewater Sports ........................................Unknown ........................................................Total .................................................................
000000001610000101
10
020120103
5520004
1101
82
400
25235008
6010001002
129
420
2625510
12121
40005
1204
221
1.810.900.00
11.7611.312.260.450.005.43
54.751.810.000.000.002.265.430.001.81
PropertyDamage
Vessel Actions at Time of Crash
Drinking and Crashes - Whether or not a person has been drinking cannot always be determined at the scene of a crash. Because of the time lapse from the moment of occurrence until an officer arrives at the scene to make the investigation, a person's condition concerning drinking can change a great deal. In cases where the individual may have been removed to a hospital, doctor's office or funeral home, his/her condition may never be determined.
All Boating Crashes: Alcohol Involved ..........................................33 No Alcohol Involved .................................136 Information Not Known ...............................0
Fatal Boating Crashes: Alcohol Involved ............................................4 No Alcohol Involved .....................................6 Information Not Known ...............................0
Persons Killed ................................................................. 1Persons Injured ............................................................... 8
Alcohol Involvement
YesNo
UnknownTotal
PropertyDamageFatal Injury Total
460
10
17510
68
33136
0169
12790
91
Alcohol/Drugs Probable Contributing Circumstance
(Includes crashes where an operator was drinking or using drugs regardless of the alcohol/drugs contributing to the crash.)
Alcohol Involved
(Includes crashes where alcohol or drug use contributed to the cause of the crash.)

12 Boating Statistics & Drownings/2017 statistics
Vessel Type Involved
Fatal Injury PropertyDamage
0
0
2
0
0
0
1
4
0
1
2
0
0
0
10
2
3
3
0
0
0
0
42
1
16
13
0
0
2
82
1
14
1
0
1
2
0
66
0
10
31
0
0
3
129
Bassboat ..................................................
Cabin Motorboat ...................................
Canoe ......................................................
Commercial ............................................
Inflatable.................................................
Jon Boat ...................................................
Kayak ......................................................
Open Motorboat ....................................
Paddle.....................................................
Personal Watercraft ...............................
Pontoon ...................................................
Runabout ................................................
Sail Only .................................................
Unknown ................................................
Total .........................................................
Vessel Type
Persons
1234
Total
Statewide Crashes by Number of Vessels Involved
Injury TotalNumber of
Vessels
10000
10
782210
101
CrashesFatal
682210
91
Prop. DamageFatal Injury Total
10000
10
551210
68
563311
91
1214521
169
Number of Vessels Involved
Total
3
17
6
0
1
2
1
112
1
27
46
0
0
5
221*More than one condition can exist for a single crash

Boating Statistics & Drownings/2017 statistics 13
Age of Killed/Injured and Operators
5 and Under
6 - 10
11 - 15
16 - 20
21 - 25
26 - 30
31 - 35
36 - 40
41 - 45
46 - 50
51 - 55
56 - 60
61 - 65
66 - 70
71 - 75
76 and Over
Not Stated
Total
Age of Person Killed Percent
0
0
10
10
10
0
0
10
10
30
0
0
0
10
0
10
0
Injured
2
1
9
9
12
10
3
0
8
10
11
4
4
4
1
3
0
91
Percent
2.20
1.10
9.89
9.89
13.19
10.99
3.30
0.00
8.79
10.99
12.09
4.40
4.40
4.40
1.10
3.30
0.00
NumberInvolvedAge of Operator
15 and Under1617181920
21 - 2526 - 3031 - 3536 - 4041 - 4546 - 5051 - 5556 - 6061 - 6566 - 7071 - 75
76 and OverNot Stated
Total Drivers
323034
13156
16221929171312519
192
Fatal
0000011001120001012
10
Injury
212023573878
11864103
81
PropertyDamage
1110107837
149
18977404
101
Killed/InjuredBy Age Group
Age ofOperatorsof Vessels
Involved inCrashes
0
0
1
1
1
0
0
1
1
3
0
0
0
1
0
1
0
10

14 Boating Statistics & Drownings/2017 statistics
Buoy/Regatta/Dive Team/Boater Education Statistics
Buoy/Regatta/Dive Team/Boater Education Statistics
Buoy PermittingPermits .................................................
Approved Applications .....................
Denied Applications ..........................
Revoked Permits ................................
Updated Permits ................................
Other Modifications/Reinstate. .......
Regatta PermittingTotal Permitted Events ......................
Dive Team MissionsTotal Dives ...........................................
Boater EducationStudents Taught by Troopers ............
Internet Courses Taught ....................
Total Education Cards Issued ...........
2014
5,349
38
40
199
21
9
1,880
51
2,333
10,160
12,144
2015
5,422
74
45
180
9
10
1,904
37
2,940
10,598
11,831
Boater Education of Operator
Fatal Injury PropertyDamage
0
2
0
0
0
5
3
10
0
14
0
3
2
47
15
81
1
24
1
5
1
54
15
101
American Red Cross ........................
State ....................................................
U.S. Power Squadron .......................
USCG Auxillary ................................
Other ..................................................
None ...................................................
Unknown ...........................................
Total ....................................................
Boater Education Received Total
1
40
1
8
3
106
33
192
2016
5,555
62
37
170
17
11
1,898
43
2,962
11,975
14,631
2017
5,622
58
36
236
20
20
1,878
35
3,186
12,132
15,114

Boating Statistics & Drownings/2017 statistics 15
Drownings by MonthStatewide Drowning Incidents By Month
Drownings by YearStatewide Drowning Incidents in Missouri
PrivateStateWaters
2012
2013
2014
2015
2016
2017
17
35
21
31
31
36
4
3
8
14
4
15
21
38
29
68
38
59
Year Total
PrivateStateWaters
January
February
March
April
May
June
July
August
September
October
November
December
Total
0
1
0
3
5
6
10
7
1
1
2
0
36
0
0
3
2
0
3
3
1
3
0
0
0
15
0
1
3
8
10
9
13
8
4
1
2
0
59
Month Total
No accidental drowning victim was wearing a personal floatation device.
Flood/Other
0
0
0
3
5
0
0
0
0
0
0
0
8
Flood/Other
0
0
0
23
3
8

16 Boating Statistics & Drownings/2017 statistics
Drownings by Day and Hour
Sunday
Monday
Tuesday
Wednesday
Thursday
Friday
Saturday
Total
Day of Week StateWaters Private
0
2
3
5
0
3
2
15
Total
8
10
8
11
5
6
11
59
Percent
13.56
16.95
13.56
18.64
8.47
10.17
18.64
Time of Day
Midnight to 3:59 a.m.
4:00 a.m. to 7:59 a.m.
8:00 a.m. to 11:59 a.m.
Noon to 3:59 p.m.
4:00 p.m. to 7:59 p.m.
8:00 p.m. to 11:59 p.m.
Unknown
Total
0
1
10
9
11
5
0
36
Private
0
0
3
6
4
2
0
15
Total
1
1
13
16
16
12
0
59
Percent
1.69
1.69
22.03
27.12
27.12
20.34
0.00
DrowningIncidents byDay of Week
DrowningIncidents byTime of Day
6
7
5
6
4
3
5
36
StateWaters
No accidental drowning victim was wearing a personal floatation device.
Flood/Other
1
0
0
1
1
5
0
8
Flood/Other
2
1
0
0
1
0
4
8

Boating Statistics & Drownings/2017 statistics 17
Statewide Drownings by Troop/County
No accidental drowning victim was wearing a personal floatation device.
Troop PrivateState Water
Flood/Other
Troop A210000402111011011100112520112011011
102111010000100000002000001000101020
000000000000000100030200000000000101
County
JacksonLafayettePlatteAdairPutnamRandolphJefferson PikeSt. CharlesSt. FrancoisSt. LouisSt. Louis CityWarrenWashingtonCedarChristianDadeMcDonaldNewtonTaneyVernonButlerMississippiRipleyCamdenColeGasconadeMillerMontgomeryMorganDouglasReynoldsCrawfordDentPhelpsPulaski
Troop B
Troop C
Troop D
Troop E
Troop F
Troop G
Total
312111412111111111132312521112112132
Troop I

18 Boating Statistics & Drownings/2017 statistics
Drownings by Body of Water
Body of Water PrivateState
Waters Total
0000000000000000000
510
0
15
Big RiverBlack RiverBlue RiverBrush CreekCurrent RiverElk RiverGasconade RiverGlaize CreekHuzzah CreekLake of the OzarksLake St. LouisMeramec RiverMississippi RiverMissouri RiverMoreau RiverPim LakeSandy CreekShoal CreekStockton Creek
Private (Other)Private PondPublic Roadway
Total
3211212118113221112
000
36
3211212118113221112
5108
59
No accidental drowning victim was wearing a personal floatation device.
Flood/Other
0000000000000000000
008
8

Boating Statistics & Drownings/2017 statistics 19
Age of Drowning Victim
1 - 56 - 10
11 - 1516 - 2021 - 2526 - 3031 - 3536 - 4041 - 4546 - 5051 - 5556 - 6061 - 6566 - 7071 - 75
76+Unknown
Total
Age ofPerson
StateWaters Total
41483154323523641
59
Private
41121000001200300
15
Percent
6.781.696.78
13.565.081.698.476.785.083.395.088.473.395.08
10.176.781.69
00342143322221241
36
No accidental drowning victim was wearing a personal floatation device.
Flood/Other
000200110001021008

20 Boating Statistics & Drownings/2017 statistics
Hol
iday
Cra
shes
& D
row
ning
s
Sta
te
Dro
wn
ings
Pri
vate
Cra
shes
Mem
oria
l Day
Pro
pert
yD
amag
eH
olid
ayFa
tal
Inju
ryP
erio
d
Ind
epen
den
ce D
ay
Lab
or D
ay
Tha
nksg
ivin
g
Chr
istm
as
New
Yea
r
Year
2016
2016
2016
2016
2016
2016
From
6:0
0 p.
m.,
Frid
ay, M
ay 2
7, to
11:5
9 p.
m.,
Mon
day
, May
30
From
6:0
0 p.
m.,
Frid
ay, J
uly
1, to
11:5
9 p.
m.,
Mon
day
, Jul
y 4
From
6:0
0 p.
m.,
Frid
ay, S
epte
mbe
r 2,
to11
:59
p.m
., M
ond
ay, S
epte
mbe
r 5
From
6:0
0 p.
m.,
Wed
nesd
ay, N
ovem
ber
23,
to 1
1:59
p.m
., Su
nday
, Nov
embe
r 27
From
6:0
0 p.
m.,
Frid
ay, D
ecem
ber
23, t
o 11
:59
p.m
., M
ond
ay, D
ecem
ber
26
From
6:0
0 p.
m.,
Frid
ay, D
ecem
ber
30, 2
016,
to
11:
59 p
.m.,
Mon
day
, Jan
uary
2, 2
017
0 0 0 0 0 0
5 6 7 0 0 0
6 4 3 0 0 0
0 0
0 1 0 0 0 0
0 0 0 0 0 0
2017
0 1 1 0 0 0
5 3 3 1 0 0
10 4 3 0 0 0
0 0
5 0 0 0 0 0
0 1 0 0 0 0
2017
2017
2017
2017
2017
From
6:0
0 p.
m.,
Frid
ay, M
ay 2
6, to
11:5
9 p.
m.,
Mon
day
, May
29
From
6:0
0 p.
m.,
Frid
ay, J
une
30, t
o11
:59
p.m
., Tu
esd
ay, J
uly
4
From
6:0
0 p.
m.,
Frid
ay, S
epte
mbe
r 1,
to11
:59
p.m
., M
ond
ay, S
epte
mbe
r 4
From
6:0
0 p.
m.,
Wed
nesd
ay, N
ovem
ber
22,
to 1
1:59
p.m
., Su
nday
, Nov
embe
r 26
From
6:0
0 p.
m.,
Frid
ay, D
ecem
ber
22, t
o 11
:59
p.m
., M
ond
ay, D
ecem
ber
25
From
6:0
0 p.
m.,
Frid
ay, D
ecem
ber
29, 2
017,
to
11:
59 p
.m.,
Mon
day
, Jan
uary
1, 2
018

Highway Patrol Headquarters
Troop A504 S.E. Blue ParkwayLee's Summit, MO 64063-4351Phone: 816-622-0800Fax: 816-622-0715
Troop B308 Pine Crest DriveMacon, MO 63552-1030Phone: 660-385-2132Fax: 660-385-3920
Troop C891 Technology DriveWeldon Spring, MO 63304Phone: 636-300-2800Fax: 636-300-2741
Troop C Service CenterP.O. Box 6125268 Flat River RoadPark Hills, MO 63601-0612Phone: 573-431-0166Fax: 573-431-4429
Troop D3131 East KearneySpringfield, MO 65803-5044Phone: 417-895-6868Fax: 417-895-6877
Troop D Service Center5182 South Grand AvenueCarthage, MO 64836-9541Phone: 417-359-1500Fax: 417-359-1506
Troop E4947 Highway 67 NorthPoplar Bluff, MO 63901-8719Phone: 573-840-9500Fax: 573-840-9509
Troop E Service Center105 Keystone DriveSikeston, MO 63801-5603Phone: 573-472-5200Fax: 573-472-5204
Troop FP.O. Box 5682920 N. Shamrock RoadJefferson City, MO 65102-0568Phone: 573-751-1000Fax: 573-751-6814
Troop G1226 West Business Highway 60/63Willow Springs, MO 65793Phone: 417-469-3121Fax: 417-469-3105
Troop H3525 North Belt HighwaySt. Joseph, MO 64506-1370Phone: 816-387-2345Fax: 816-387-2349
Troop IP.O. Box 1281301 Nagogami Road WestRolla, MO 65402-0128Phone: 573-368-2345Fax: 573-368-2352
General HeadquartersP.O. Box 5681510 East Elm StreetJefferson City, MO 65102-0568Phone: 573-751-3313Fax: 573-751-9419

SHP-652 09/2018
Information provided by:Patrol Records Division
Produced by:Public Information and Education Division
Printed by:Missouri State Highway Patrol
1510 East Elm StreetJefferson City, Missouri 65101
An Internationally Accredited Agency
Emergency Assistance:1-800-525-5555 or Cellular *55
Road Conditions:1-888-275-6636


![Boating - Pleasure Boating - Yachting Industry - Final Report - Ace Global[1]](https://static.fdocuments.us/doc/165x107/577ce6f81a28abf103941100/boating-pleasure-boating-yachting-industry-final-report-ace-global1.jpg)