MISSION REPORT South Tarawa Drought Committee Meeting ... · optimization of abstraction and...
72
MISSION REPORT Staff Member(s) Amandine Bosserelle and Peter Sinclair Countries visited Kiribati (Tarawa) Programme Water and Sanitation Programme – Water Resource Assessment and Monitoring Team (CAIA project) Period 26 to 29 October 2015 South Tarawa Drought Committee Meeting - October 2015 Activities Description The second South Tarawa Drought Committee meeting for 2015 was held at the Utererei Hotel in South Tarawa, Kiribati between the 27 th and the 28 th of October. The meeting objectives were to present and discuss key findings from Bonriki groundwater abstraction flow meter testing field investigations and the numerical groundwater modelling undertaken by the EU funded Climate and Abstraction Impacts in Atoll environments project, CAIA. The South Tarawa Drought Committee, consisting of members from NDMO, MPWU, KMS, PUB, and MOHMS, is the relevant government body to consider findings that may affect the operations and overall sustainability of the Bonriki freshwater lens. The flow meter testing conducted as part of the CAIA project’s field investigations in June 2015 for the Bonriki and Buota water reserves was reported back to the committee. Existing fixed flow meters installed near the main transmission lines and galleries were tested against portable ultrasonic flow meters to determine: the actual abstraction data at all galleries and transmission pipes flow meters, and the variability and reliability of flow estimates given by existing meters. An over-estimated flow of 18% and 9% were measured at the Bonriki and Buota main transmission lines flow meters, respectively. Incorrect flow meter installation and turbulent-induced errors associated with the gallery pump- house pipe works are possible causes of the variability margin. Replacement of flow meters, replacement of pumps, and the design and implementation of correct flow meter installation to minimise turbulence are amongst the key remedial measures to ensure the accurate estimation of abstraction data for the modelling and sustainable management of the water reserves. The groundwater numerical modelling study and predictive scenarios are
Transcript of MISSION REPORT South Tarawa Drought Committee Meeting ... · optimization of abstraction and...
MISSION REPORT
Staff Member(s) Amandine Bosserelle and Peter Sinclair
Countries visited Kiribati (Tarawa)
Programme Water and Sanitation Programme – Water Resource Assessment and Monitoring Team (CAIA project)
Period 26 to 29 October 2015
South Tarawa Drought Committee Meeting - October 2015
Activities Description The second South Tarawa Drought Committee meeting for 2015 was held at the Utererei Hotel in South Tarawa, Kiribati between the 27th and the 28th of October. The meeting objectives were to present and discuss key findings from Bonriki groundwater abstraction flow meter testing field investigations and the numerical groundwater modelling undertaken by the EU funded Climate and Abstraction Impacts in Atoll environments project, CAIA. The South Tarawa Drought Committee, consisting of members from NDMO, MPWU, KMS, PUB, and MOHMS, is the relevant government body to consider findings that may affect the operations and overall sustainability of the Bonriki freshwater lens. The flow meter testing conducted as part of the CAIA project’s field investigations in June 2015 for the Bonriki and Buota water reserves was reported back to the committee. Existing fixed flow meters installed near the main transmission lines and galleries were tested against portable ultrasonic flow meters to determine:
the actual abstraction data at all galleries and transmission pipes flow meters, and
the variability and reliability of flow estimates given by existing meters.
An over-estimated flow of 18% and 9% were measured at the Bonriki and Buota main transmission lines flow meters, respectively. Incorrect flow meter installation and turbulent-induced errors associated with the gallery pump-house pipe works are possible causes of the variability margin. Replacement of flow meters, replacement of pumps, and the design and implementation of correct flow meter installation to minimise turbulence are amongst the key remedial measures to ensure the accurate estimation of abstraction data for the modelling and sustainable management of the water reserves. The groundwater numerical modelling study and predictive scenarios are
being finalized and the key findings were discussed during the meeting:
Impact assessment of different abstraction rates from 900 to 1,800 kL/d under different rainfall scenarios on the salinity of the water provided to South Tarawa residents.
Impact assessment of clearing of existing vegetation and replacing with grass on the salinity and the volumes of the water available for network distribution.
Identification of infiltration galleries which are contributing most to the increased salinity during dry periods with consideration to optimization of abstraction and determination of pumping rates under different rainfall scenarios to minimise impact to the freshwater lens.
Why is the activity important?
The Bonriki Water Reserve is the main source of freshwater for the 52,000 residents of South Tarawa. The resource is under risk of salinization from over abstraction. The numerical model results are useful to improve the sustainability and consider impacts of possible climate and operational scenarios.
Disseminating the preliminary results of the CAIA project to MPWU, PUB and key agencies is important as they can use the results to define priorities on the government activities and directions, and operational activities.
Discussions with stakeholders were essential to define the output requirements from the modelling aspect of the study.
The measurement of abstraction of groundwater from the Bonriki Water Reserve is reliant on the installed flow meters. Identifying the errors associated with the existing flow meter setup and recommendations to correct the identified problems is important to ensure accurate readings are obtained which will help with the overall management of the groundwater system.
Who benefits/stands to benefit from activity?
MPWU, PUB, and the Government of Kiribati with better understanding of Bonriki’s groundwater model, and how the modelling and field work results can be used to improve the operation, management and planning of the Bonriki Water Reserve.
SPC – Presentation of results to the stakeholders and opportunity to inform about the CAIA project and links to other projects.
Researchers and practitioners in the field of atoll hydrology and groundwater management with improved understanding of the issues facing a highly developed and relied upon atoll groundwater system.
Problems encountered N/A
Follow Up Follow up with the ministry on the action items identified in the attached minutes.
Follow up with recommendations from meeting regarding any additional work with regards to flow meters installation, improving the presentation and use of the model results and its application into the planning and operational management of the Bonriki Water Reserve’s galleries field.
ANNEX I - Activity Name – Title / Task Profile Number ACTION
Monday 26th October 2015
Travel from Suva to Tarawa
Preparation of Drought Committee Meeting presentations
Tuesday 27th October 2015
Drought Committee Meeting – day 1 (See ANNEX III – Meeting
Minutes)
Wednesday 27th October 2015
Drought Committee Meeting – day 2 (See ANNEX III – Meeting
Minutes)
Thursday 27th October 2015
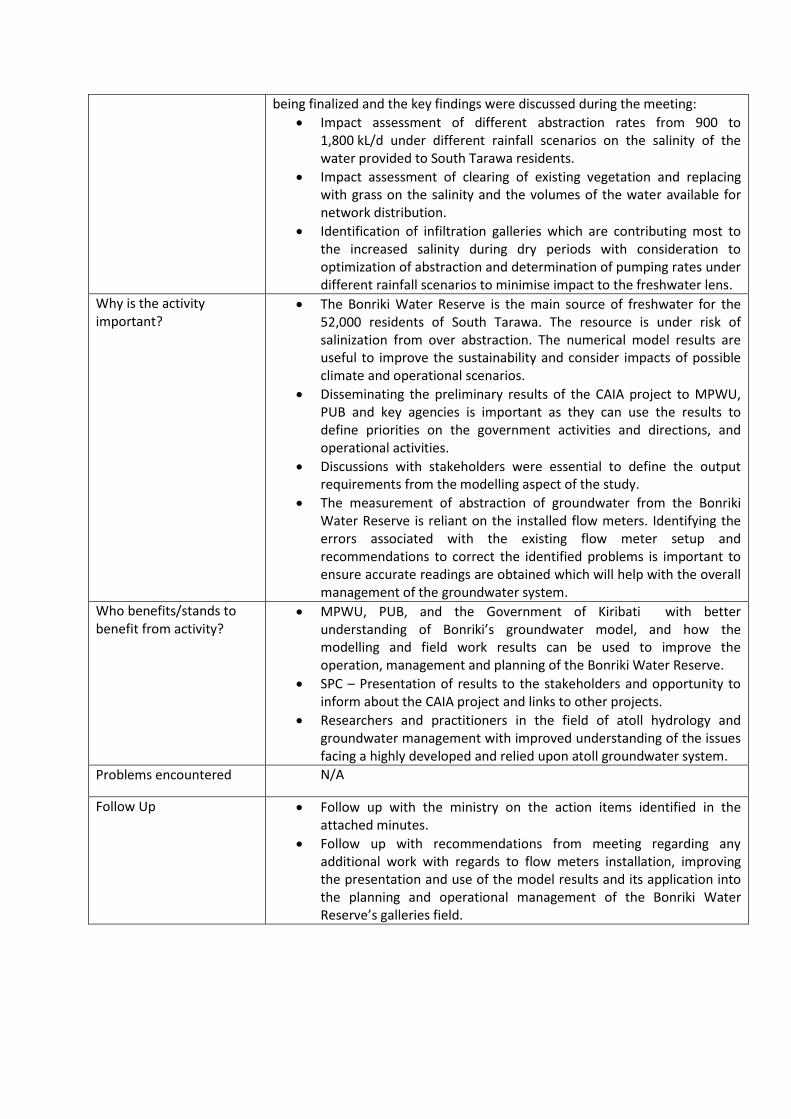
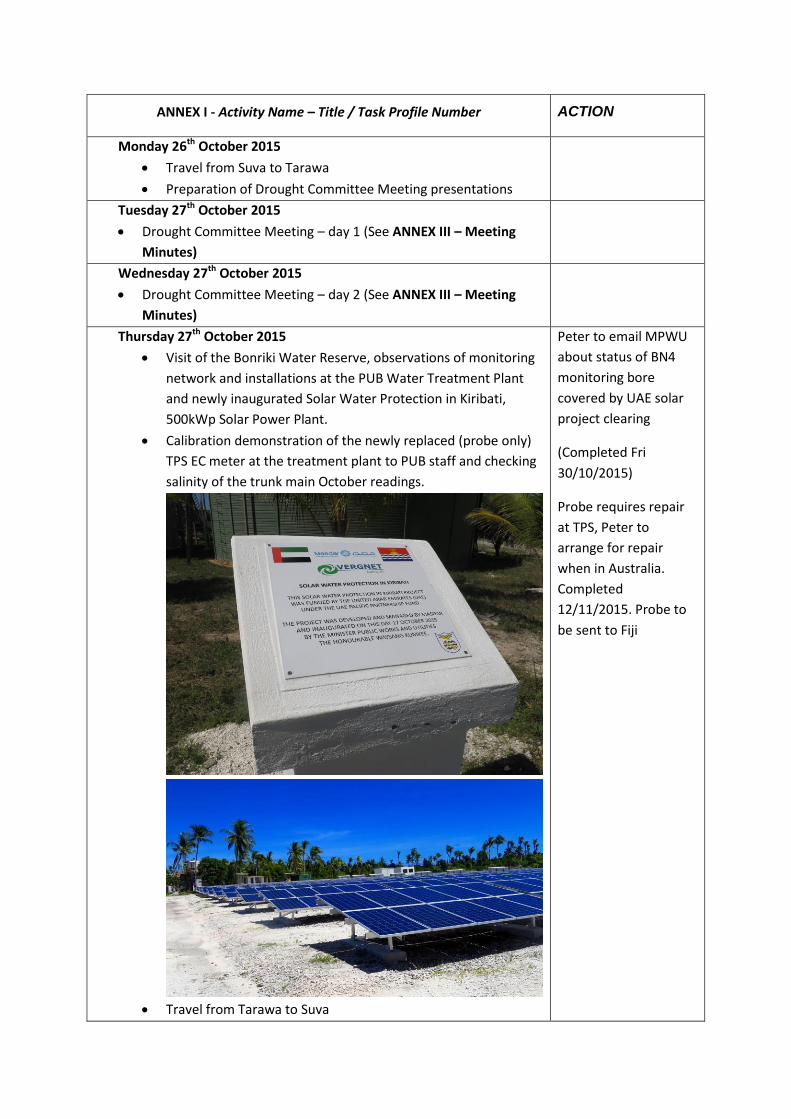
Visit of the Bonriki Water Reserve, observations of monitoring
network and installations at the PUB Water Treatment Plant
and newly inaugurated Solar Water Protection in Kiribati,
500kWp Solar Power Plant.
Calibration demonstration of the newly replaced (probe only)
TPS EC meter at the treatment plant to PUB staff and checking
salinity of the trunk main October readings.
Travel from Tarawa to Suva
Peter to email MPWU
about status of BN4
monitoring bore
covered by UAE solar
project clearing
(Completed Fri
30/10/2015)
Probe requires repair
at TPS, Peter to
arrange for repair
when in Australia.
Completed
12/11/2015. Probe to
be sent to Fiji
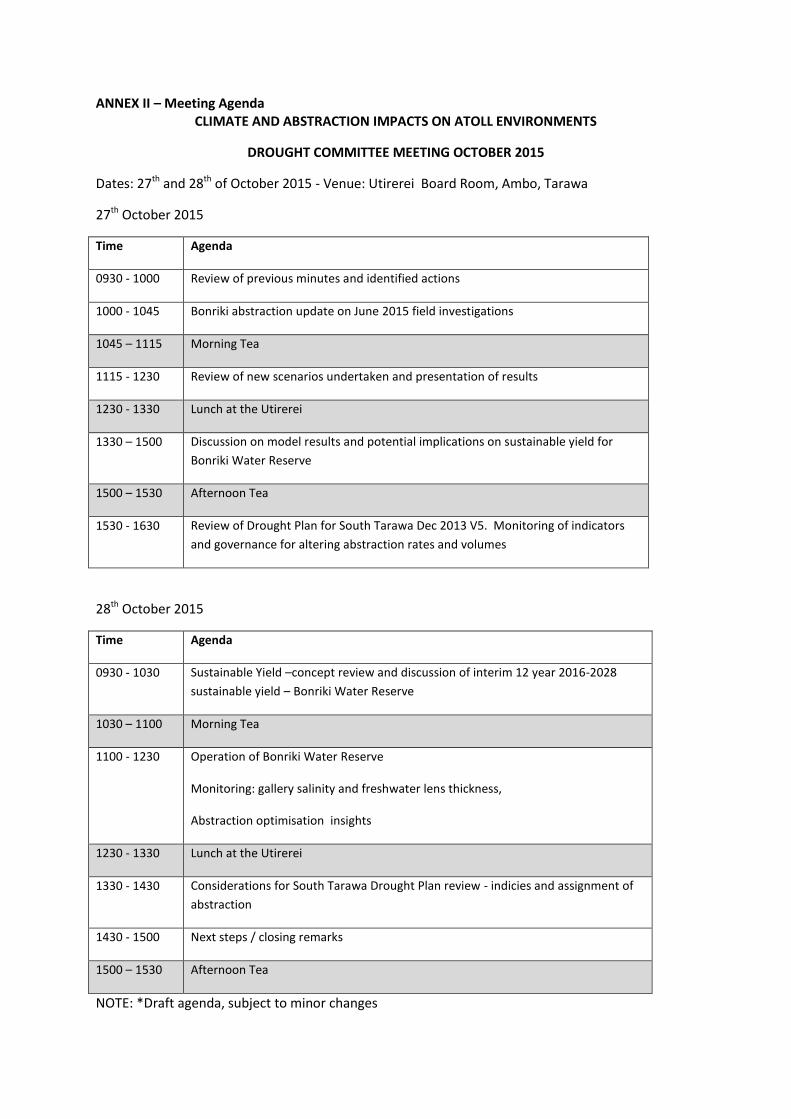
ANNEX II – Meeting Agenda CLIMATE AND ABSTRACTION IMPACTS ON ATOLL ENVIRONMENTS
DROUGHT COMMITTEE MEETING OCTOBER 2015
Dates: 27th and 28th of October 2015 - Venue: Utirerei Board Room, Ambo, Tarawa
27th October 2015
Time Agenda
0930 - 1000 Review of previous minutes and identified actions
1000 - 1045 Bonriki abstraction update on June 2015 field investigations
1045 – 1115 Morning Tea
1115 - 1230 Review of new scenarios undertaken and presentation of results
1230 - 1330 Lunch at the Utirerei
1330 – 1500 Discussion on model results and potential implications on sustainable yield for
Bonriki Water Reserve
1500 – 1530 Afternoon Tea
1530 - 1630 Review of Drought Plan for South Tarawa Dec 2013 V5. Monitoring of indicators
and governance for altering abstraction rates and volumes
28th October 2015
Time Agenda
0930 - 1030 Sustainable Yield –concept review and discussion of interim 12 year 2016-2028
sustainable yield – Bonriki Water Reserve
1030 – 1100 Morning Tea
1100 - 1230 Operation of Bonriki Water Reserve
Monitoring: gallery salinity and freshwater lens thickness,
Abstraction optimisation insights
1230 - 1330 Lunch at the Utirerei
1330 - 1430 Considerations for South Tarawa Drought Plan review - indicies and assignment of
abstraction
1430 - 1500 Next steps / closing remarks
1500 – 1530 Afternoon Tea
NOTE: *Draft agenda, subject to minor changes

ANNEX III – Meeting Minutes
CLIMATE AND ABSTRACTION IMPACTS ON ATOLL ENVIRONMENTS
DROUGHT COMMITTEE MEETING
27th-28thOctober 2015
Minutes
The second 2015 Drought Committee meeting for Kiribati was held at the Utererei Hotel in South
Tarawa between the 27th and the 28th of October. The meeting objectives were to discuss the key
findings of CAIA project with in particular the preliminary results from the modelling predictive
simulations that could be used by the Drought Committee to strength the existing Drought Response
Action Plan that is administered by the Drought Committee. The meeting also discussed the key
findings from the field investigations from June 2015 related to the abstraction verification work in
the Bonriki Water Reserve and the possible links between CAIA and other projects such as the New
Zealand Water Security project.
Present:
Name Agency Email
Riteta Iorome MPWU [email protected]
Itienang Timona PUB [email protected]
Mauna Eria MET (KMS) [email protected]
Marella Rebgetz KAP III [email protected]
Aritu Iotia Health [email protected]
Benjamin Tokataake MPWU [email protected]
Maiango Enota MPWU [email protected]
Tearinaki Tanielu DFAT - Australia High Commission [email protected]
Peter Sinclair SPC [email protected]
Amandine Bosserelle SPC [email protected]
Meeting Chair: The meeting chair was shared between the following persons, due to commitments with other ongoing meetings.
Benjamin Tokataake
MPWU Meeting Chair during the morning session on Tuesday 27th Oct
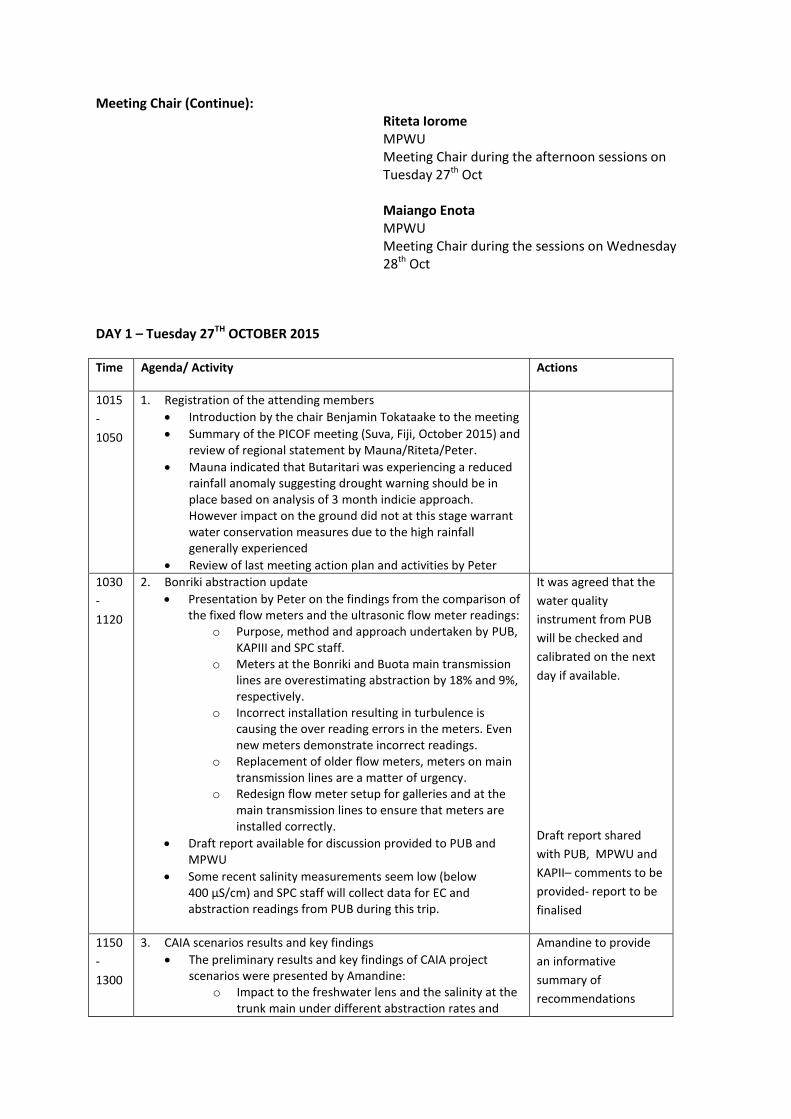
Meeting Chair (Continue): Riteta Iorome MPWU
Meeting Chair during the afternoon sessions on Tuesday 27th Oct Maiango Enota
MPWU Meeting Chair during the sessions on Wednesday 28th Oct
DAY 1 – Tuesday 27TH OCTOBER 2015
Time Agenda/ Activity Actions
1015
-
1050
1. Registration of the attending members
Introduction by the chair Benjamin Tokataake to the meeting
Summary of the PICOF meeting (Suva, Fiji, October 2015) and review of regional statement by Mauna/Riteta/Peter.
Mauna indicated that Butaritari was experiencing a reduced rainfall anomaly suggesting drought warning should be in place based on analysis of 3 month indicie approach. However impact on the ground did not at this stage warrant water conservation measures due to the high rainfall generally experienced
Review of last meeting action plan and activities by Peter
1030
-
1120
2. Bonriki abstraction update
Presentation by Peter on the findings from the comparison of the fixed flow meters and the ultrasonic flow meter readings:
o Purpose, method and approach undertaken by PUB, KAPIII and SPC staff.
o Meters at the Bonriki and Buota main transmission lines are overestimating abstraction by 18% and 9%, respectively.
o Incorrect installation resulting in turbulence is causing the over reading errors in the meters. Even new meters demonstrate incorrect readings.
o Replacement of older flow meters, meters on main transmission lines are a matter of urgency.
o Redesign flow meter setup for galleries and at the main transmission lines to ensure that meters are installed correctly.
Draft report available for discussion provided to PUB and MPWU
Some recent salinity measurements seem low (below 400 μS/cm) and SPC staff will collect data for EC and abstraction readings from PUB during this trip.
It was agreed that the
water quality
instrument from PUB
will be checked and
calibrated on the next
day if available.
Draft report shared
with PUB, MPWU and
KAPII– comments to be
provided- report to be
finalised
1150
-
1300
3. CAIA scenarios results and key findings
The preliminary results and key findings of CAIA project scenarios were presented by Amandine:
o Impact to the freshwater lens and the salinity at the trunk main under different abstraction rates and
Amandine to provide
an informative
summary of
recommendations
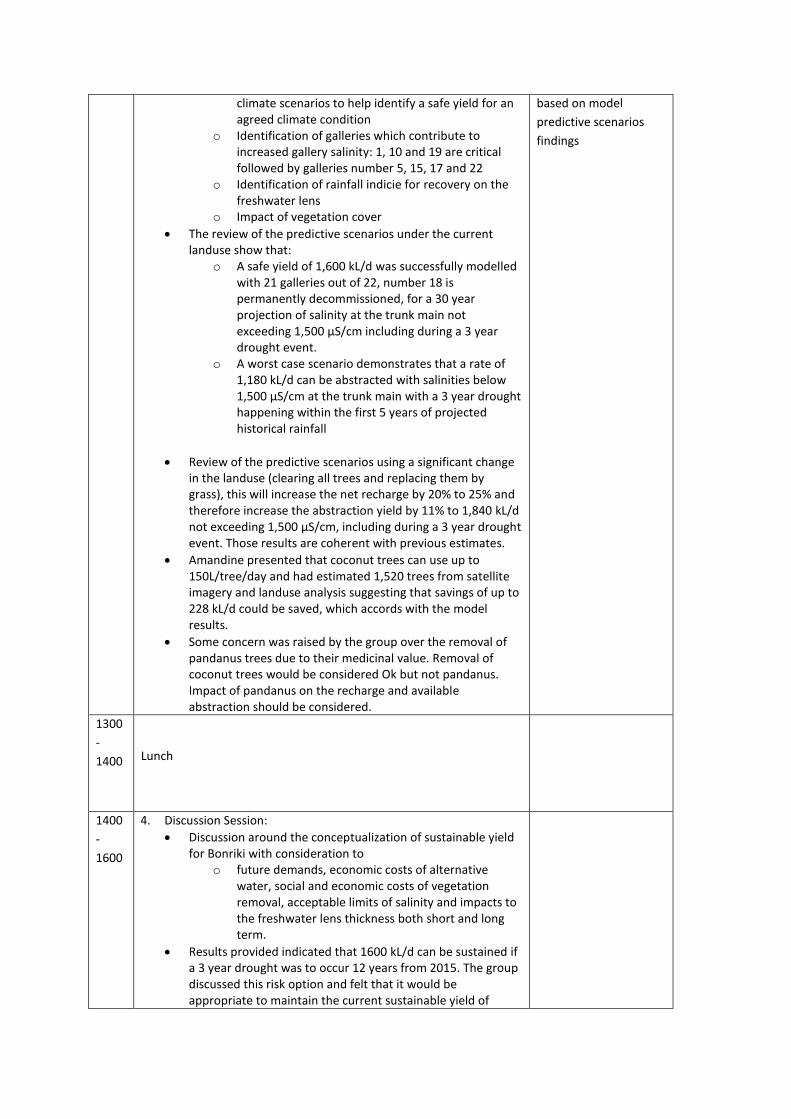
climate scenarios to help identify a safe yield for an agreed climate condition
o Identification of galleries which contribute to increased gallery salinity: 1, 10 and 19 are critical followed by galleries number 5, 15, 17 and 22
o Identification of rainfall indicie for recovery on the freshwater lens
o Impact of vegetation cover
The review of the predictive scenarios under the current landuse show that:
o A safe yield of 1,600 kL/d was successfully modelled with 21 galleries out of 22, number 18 is permanently decommissioned, for a 30 year projection of salinity at the trunk main not exceeding 1,500 μS/cm including during a 3 year drought event.
o A worst case scenario demonstrates that a rate of 1,180 kL/d can be abstracted with salinities below 1,500 μS/cm at the trunk main with a 3 year drought happening within the first 5 years of projected historical rainfall
Review of the predictive scenarios using a significant change in the landuse (clearing all trees and replacing them by grass), this will increase the net recharge by 20% to 25% and therefore increase the abstraction yield by 11% to 1,840 kL/d not exceeding 1,500 μS/cm, including during a 3 year drought event. Those results are coherent with previous estimates.
Amandine presented that coconut trees can use up to 150L/tree/day and had estimated 1,520 trees from satellite imagery and landuse analysis suggesting that savings of up to 228 kL/d could be saved, which accords with the model results.
Some concern was raised by the group over the removal of pandanus trees due to their medicinal value. Removal of coconut trees would be considered Ok but not pandanus. Impact of pandanus on the recharge and available abstraction should be considered.
based on model
predictive scenarios
findings
1300
-
1400
Lunch
1400
-
1600
4. Discussion Session:
Discussion around the conceptualization of sustainable yield for Bonriki with consideration to
o future demands, economic costs of alternative water, social and economic costs of vegetation removal, acceptable limits of salinity and impacts to the freshwater lens thickness both short and long term.
Results provided indicated that 1600 kL/d can be sustained if a 3 year drought was to occur 12 years from 2015. The group discussed this risk option and felt that it would be appropriate to maintain the current sustainable yield of
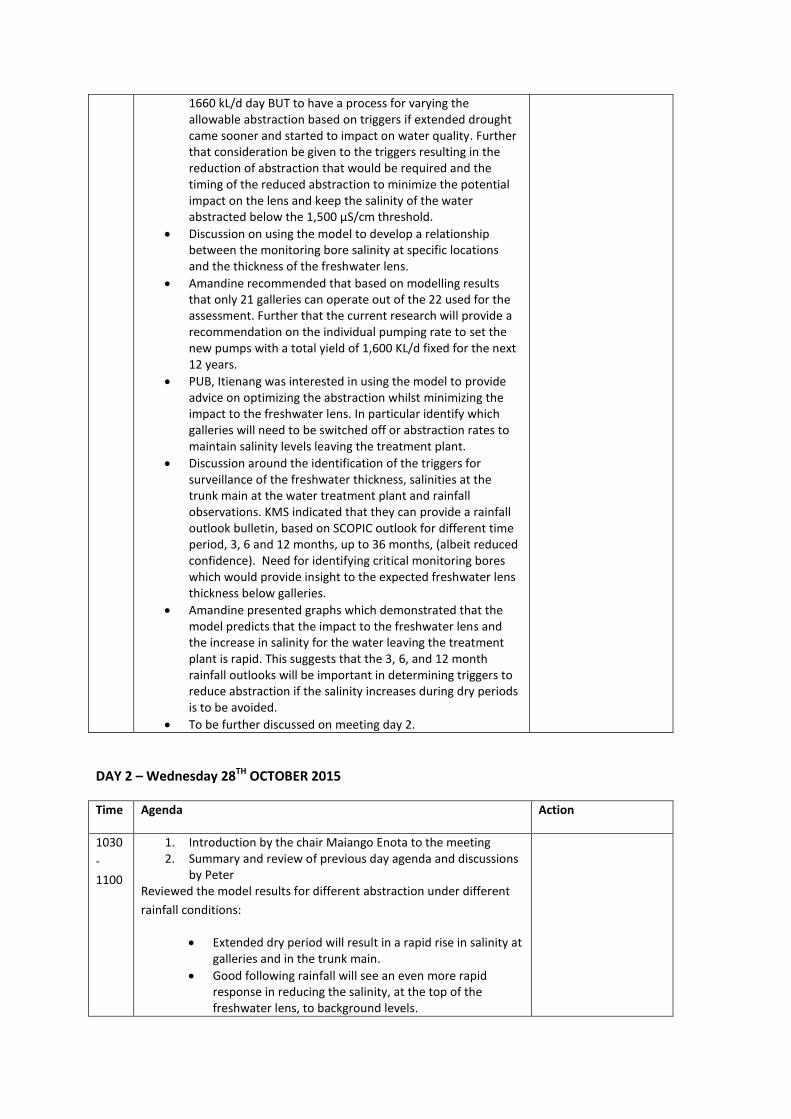
1660 kL/d day BUT to have a process for varying the allowable abstraction based on triggers if extended drought came sooner and started to impact on water quality. Further that consideration be given to the triggers resulting in the reduction of abstraction that would be required and the timing of the reduced abstraction to minimize the potential impact on the lens and keep the salinity of the water abstracted below the 1,500 μS/cm threshold.
Discussion on using the model to develop a relationship between the monitoring bore salinity at specific locations and the thickness of the freshwater lens.
Amandine recommended that based on modelling results that only 21 galleries can operate out of the 22 used for the assessment. Further that the current research will provide a recommendation on the individual pumping rate to set the new pumps with a total yield of 1,600 KL/d fixed for the next 12 years.
PUB, Itienang was interested in using the model to provide advice on optimizing the abstraction whilst minimizing the impact to the freshwater lens. In particular identify which galleries will need to be switched off or abstraction rates to maintain salinity levels leaving the treatment plant.
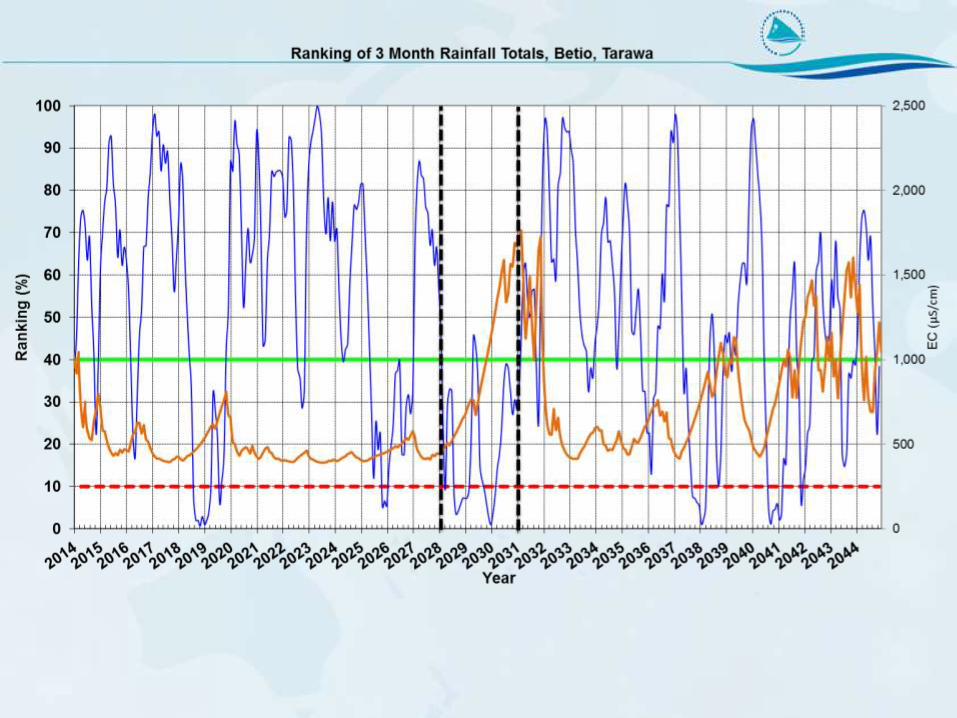
Discussion around the identification of the triggers for surveillance of the freshwater thickness, salinities at the trunk main at the water treatment plant and rainfall observations. KMS indicated that they can provide a rainfall outlook bulletin, based on SCOPIC outlook for different time period, 3, 6 and 12 months, up to 36 months, (albeit reduced confidence). Need for identifying critical monitoring bores which would provide insight to the expected freshwater lens thickness below galleries.
Amandine presented graphs which demonstrated that the model predicts that the impact to the freshwater lens and the increase in salinity for the water leaving the treatment plant is rapid. This suggests that the 3, 6, and 12 month rainfall outlooks will be important in determining triggers to reduce abstraction if the salinity increases during dry periods is to be avoided.
To be further discussed on meeting day 2.
DAY 2 – Wednesday 28TH OCTOBER 2015
Time Agenda Action
1030
-
1100
1. Introduction by the chair Maiango Enota to the meeting 2. Summary and review of previous day agenda and discussions
by Peter Reviewed the model results for different abstraction under different
rainfall conditions:
Extended dry period will result in a rapid rise in salinity at galleries and in the trunk main.
Good following rainfall will see an even more rapid response in reducing the salinity, at the top of the freshwater lens, to background levels.
The shorter the period between stresses e.g. droughts, the quicker the abstracted water will reach a higher salinity. Thinning of freshwater lens reduces its resilience to provide the same quality of water for the same abstracted volume.
The concept of an abstraction range was considered based on the anticipated rainfall and antecedent conditions. This range could vary from 900-1,800 kL/d based on model results.
Agreed that the SY would be restricted to 1,600 kL/d for a period of 12 years and that the focus should be on providing guidance on when and by how much abstraction may need to be varied in individual galleries to reduce the impact to the freshwater lens and maintain the salinity leaving the treatment plant to an acceptable level.
1100
-
1200
3. Sustainable Yield (SY) concept for Bonriki
Agreed that assigning a fixed SY involves a certain amount of risk, as the model identifies that fixed abstraction may range from 900-1,800 kL/d over a 12 year period, depending on rainfall climate experienced, to avoid breaching salinity thresholds, and a thinning trend in freshwater lens thickness.
Discussion over the current reform for PUB which will focus on reversing the revenue losses from water supply part of PUB. This will involve increasing the water demand with improved water service and supply, and resulting increased charge for service, which will have potential impact on the Bonriki Water Reserve. Consideration to alternate water sources is required to meet the predicted increases in demand whereby the model clearly identifies that the Bonriki freshwater lens is unable to increase abstraction long term. Discussion around the proposal to introduce a desalination plant to provide the water demands of Bairiki and Betio populations which will reduce the demand on the Bonriki Water Reserve and thereby increase its potential to meet the demands of a smaller population..
Discussion on the potential improvement in the operation of the Bonriki Water Reserve. Whereby with variable pumps provided from DFAT and MFAT funding the abstraction rate can be adjusted based on the performance of the gallery. Pumps are still waiting to be installed.
The current drought plan has no explicit guidance related to varying abstraction at the Bonriki Water Reserve, the committee would like to see some guidance provided from the modelling on the types of responses and what water conservation and water restriction may be required, including altering the abstraction at individual galleries using new adjustable pumps to meet the needs of the community and the resource
Possible triggers: o Measured salinities, daily readings at the
treatment plant o Communication and responsibility plan between
agencies and KMS for outlook when salinity reaches 1000 μS/cm at the treatment plant
1200
-
1230
4. Status of South Tarawa Drought plan
2013 update – Draft status under CoSPPAC project
Major changes include: o Name change from South Tarawa Drought
Response Action Plan to Drought Plan for South Tarawa
o Averaging the percentiles for 3,4,5 years is considered incorrect, plan recommends 4 and 5 year percentiles for Bonriki
o 7-day average salinity of the mixed water from the Buota and Bonriki galleries exceeds a critical salinity value (currently set at 1,200 µS/cm)
o Annex C removed – identifying responses and responsibilities applicable in each alert
1230
-
1330
Lunch
1330
-
1500
5. Operation of Bonriki Water Reserve
Amandine, based on model runs, proposed an assignment of variable abstraction with 9 galleries at 90 m³/d, 7 galleries at 70 m³/d and 5 galleries at 60 m³/d
During drought, identification of the galleries susceptible to increase salinity at the water treatment plant, number 1, 10 and 19, then galleries number 5, 15, 17 and 22.
Outputs from CAIA
(recommendations for
the Drought Plan for
South Tarawa update)
Agreement on abstraction yield for the next 12 years and distributions over the galleries field.
Recommendations on an approach to vary abstraction and guidance on how this could be achieved
Guidance from modelling results from specific scenarios
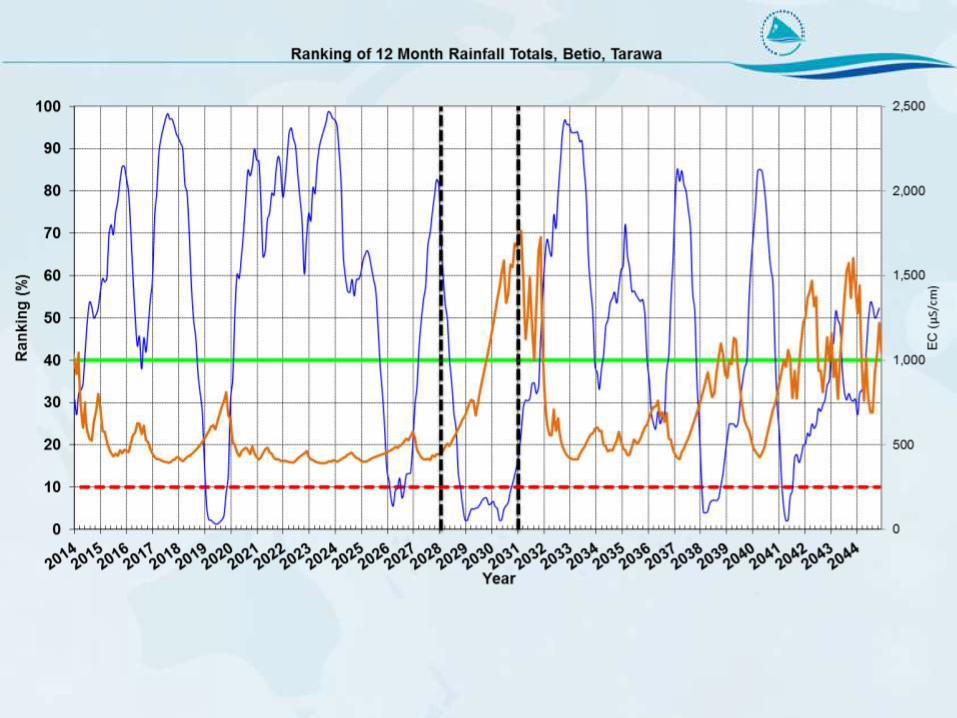
Additional figures on ranking of 6, 18 and 36 month rainfall totals for reporting on indices and triggers
Email CAIA website with a copy of the presentations
1500
-
1530
6. Considerations for South Tarawa Drought Plan review - indicies and assignment of abstraction
KMS system for identifying and track rainfall percentiles using selected indicie durations for triggering alert levels:
o 40 percentiles: Watch o 25 percentiles: Warning o 10 percentiles: Drought Declaration
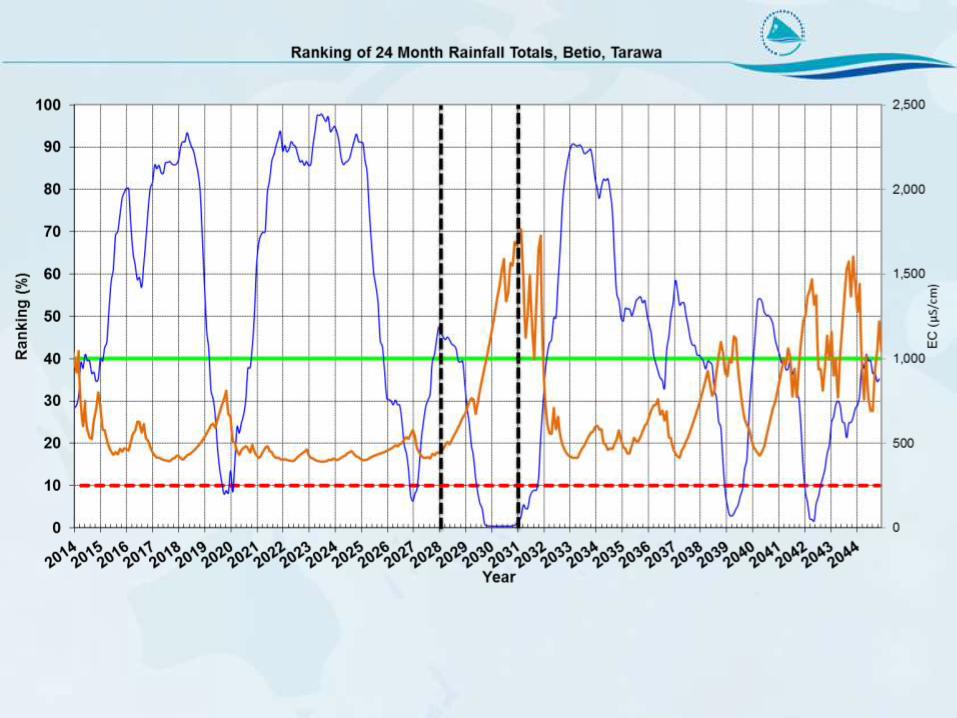
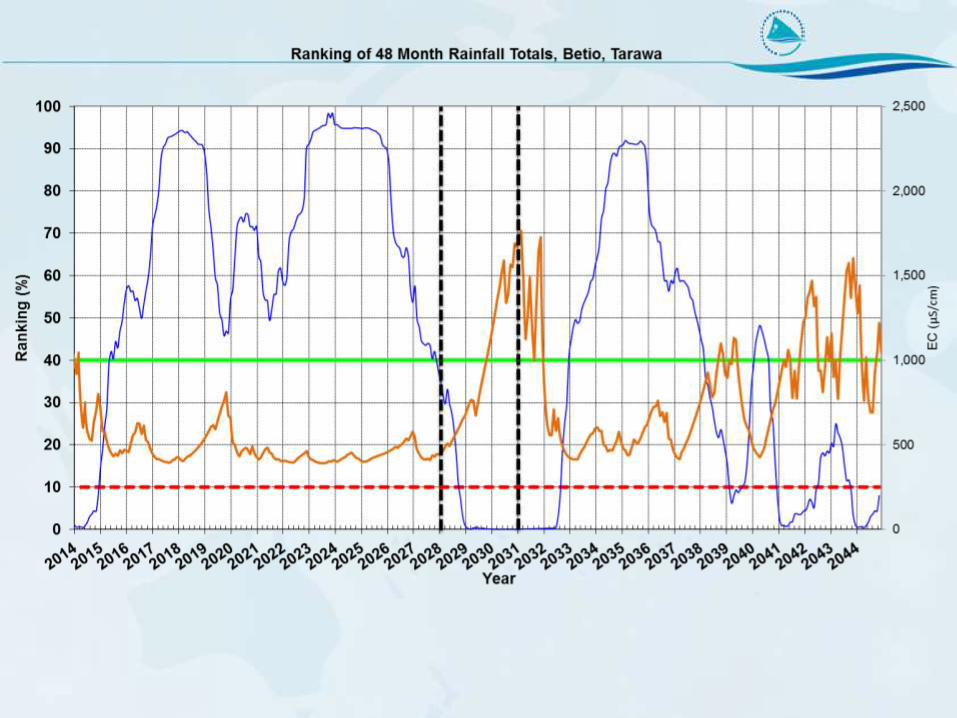
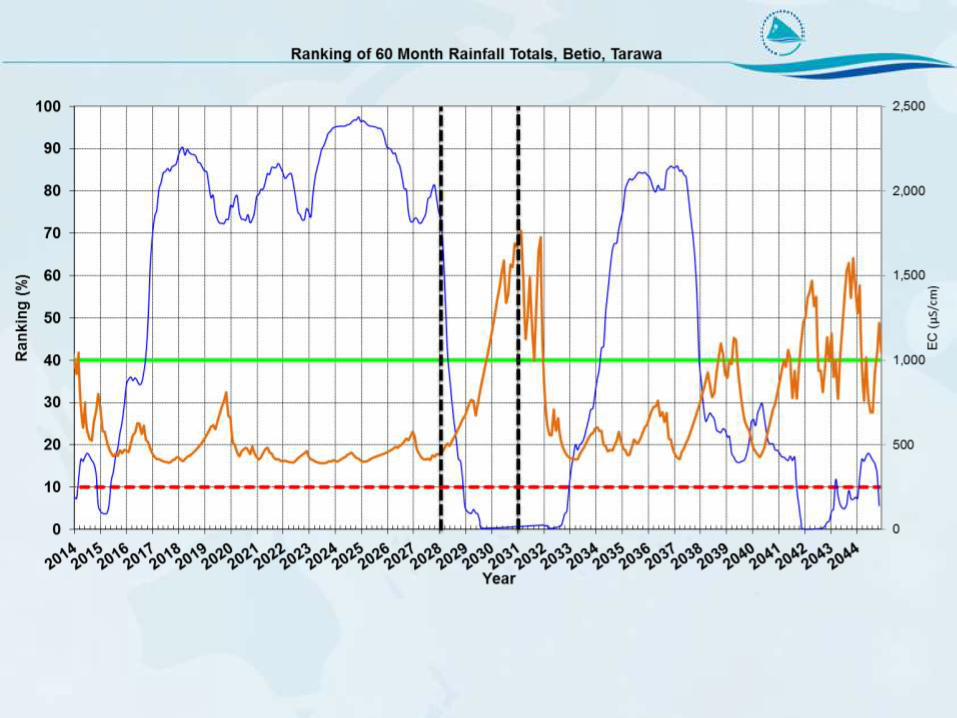
The analysis of rainfall ranking and the modelled salinity at the trunk main demonstrate that alert levels 1 and 2 could be given using the 12 or 24 months charts and that alert level 3 could be given using the 30 or 48 months charts. The 30 months rankings could also be used for the recovery and dropping the alert. This assessment was discussed briefly during the sessions and needs to be further explored in combination with the freshwater lens thickness and salinities at the trunk and galleries prior to a recommendation for the draft Drought Plan.
Consideration that a salinity of 1,000 μS/cm at the trunk main, in combination with a review of other rainfall outlooks and monitoring bores may be a useful trigger for a level three alert.
7. Meeting closing remarks from the chair Maiango and Peter

ANNEX III – Drought Committee meeting presentations – attached pdf files

Climate and Abstraction Impacts on Atoll Environments
Presenter: Peter Sinclair and Amandine Bosserelle
Tuesday 27 October 2015
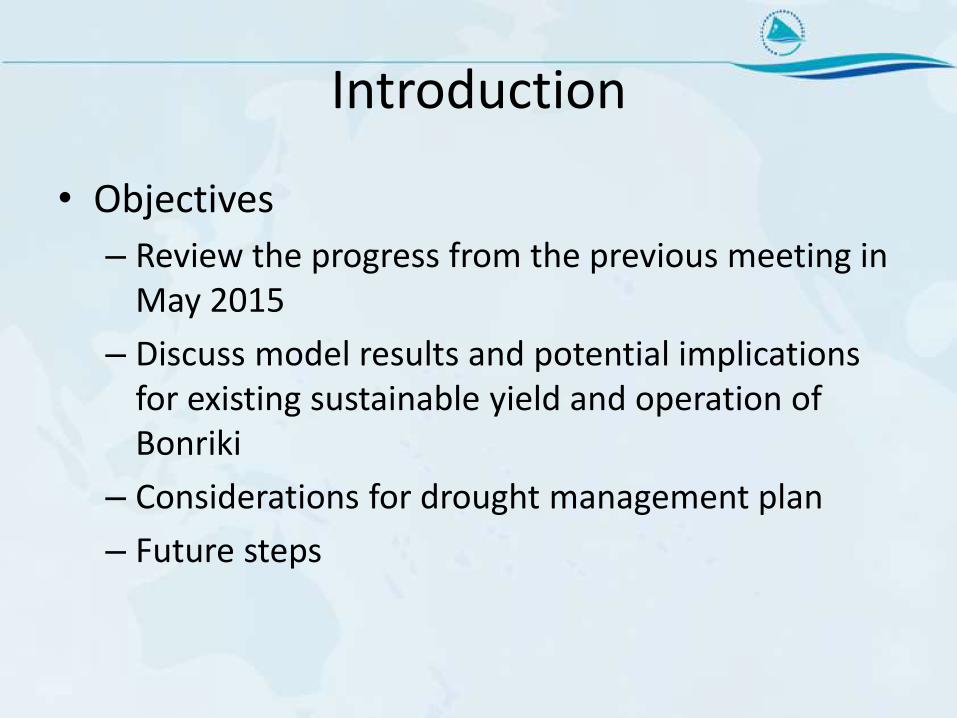
Introduction
• Objectives
– Review the progress from the previous meeting in May 2015
– Discuss model results and potential implications for existing sustainable yield and operation of Bonriki
– Considerations for drought management plan
– Future steps
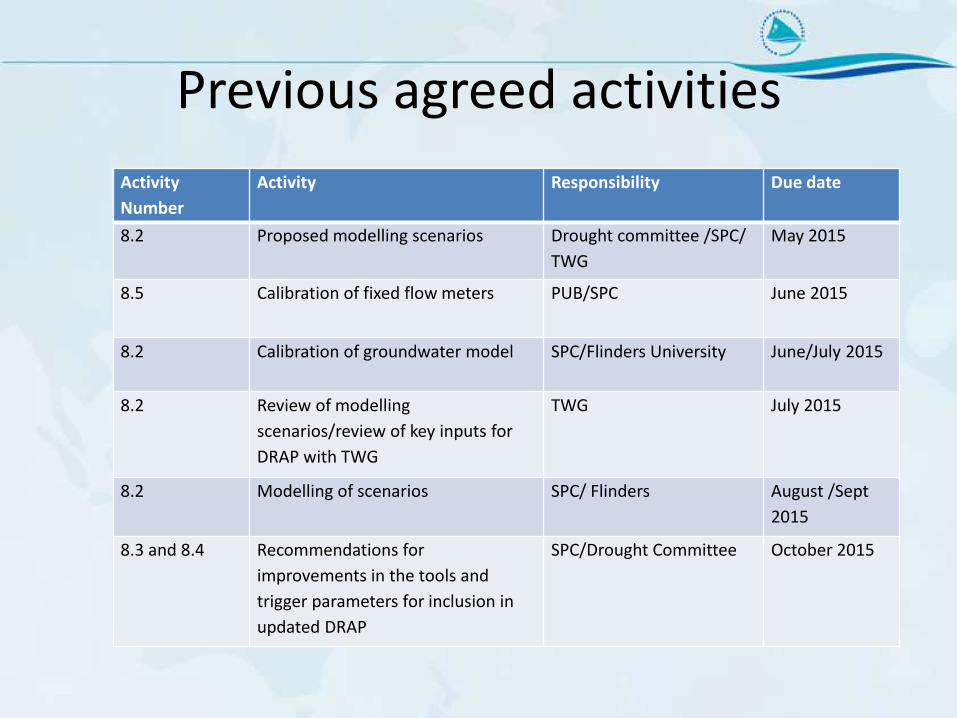
Previous agreed activities
Activity
Number
Activity Responsibility Due date
8.2 Proposed modelling scenarios Drought committee /SPC/
TWG
May 2015
8.5 Calibration of fixed flow meters PUB/SPC June 2015
8.2 Calibration of groundwater model SPC/Flinders University June/July 2015
8.2 Review of modelling
scenarios/review of key inputs for
DRAP with TWG
TWG July 2015
8.2 Modelling of scenarios SPC/ Flinders August /Sept
2015
8.3 and 8.4 Recommendations for
improvements in the tools and
trigger parameters for inclusion in
updated DRAP
SPC/Drought Committee October 2015
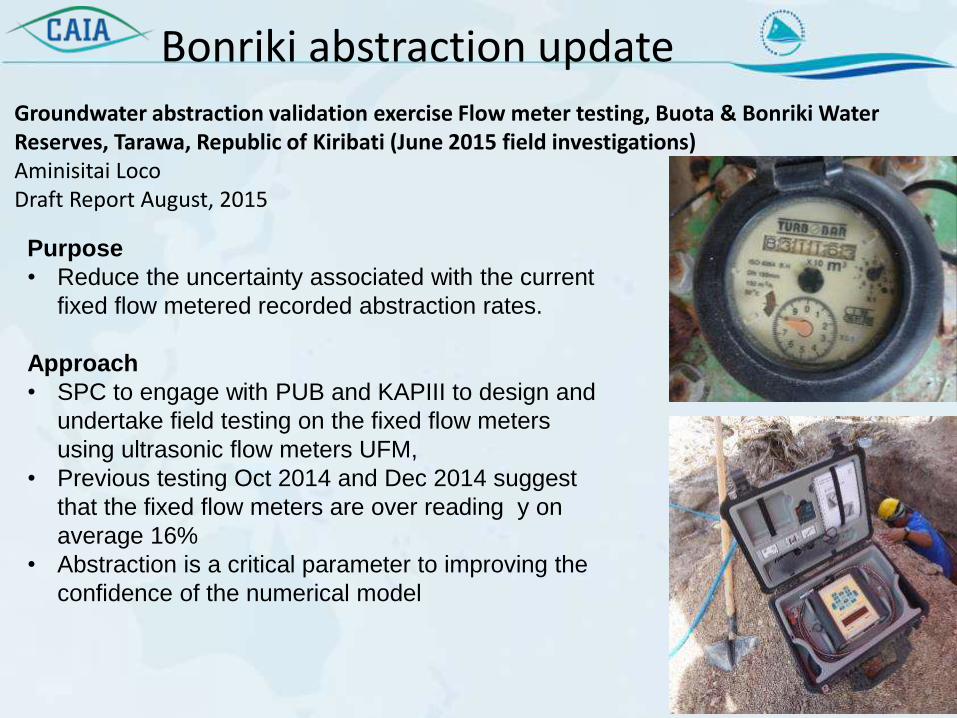
Groundwater abstraction validation exercise Flow meter testing, Buota & Bonriki Water Reserves, Tarawa, Republic of Kiribati (June 2015 field investigations) Aminisitai Loco Draft Report August, 2015
Purpose
• Reduce the uncertainty associated with the current
fixed flow metered recorded abstraction rates.
Approach
• SPC to engage with PUB and KAPIII to design and
undertake field testing on the fixed flow meters
using ultrasonic flow meters UFM,
• Previous testing Oct 2014 and Dec 2014 suggest
that the fixed flow meters are over reading y on
average 16%
• Abstraction is a critical parameter to improving the
confidence of the numerical model
Bonriki abstraction update
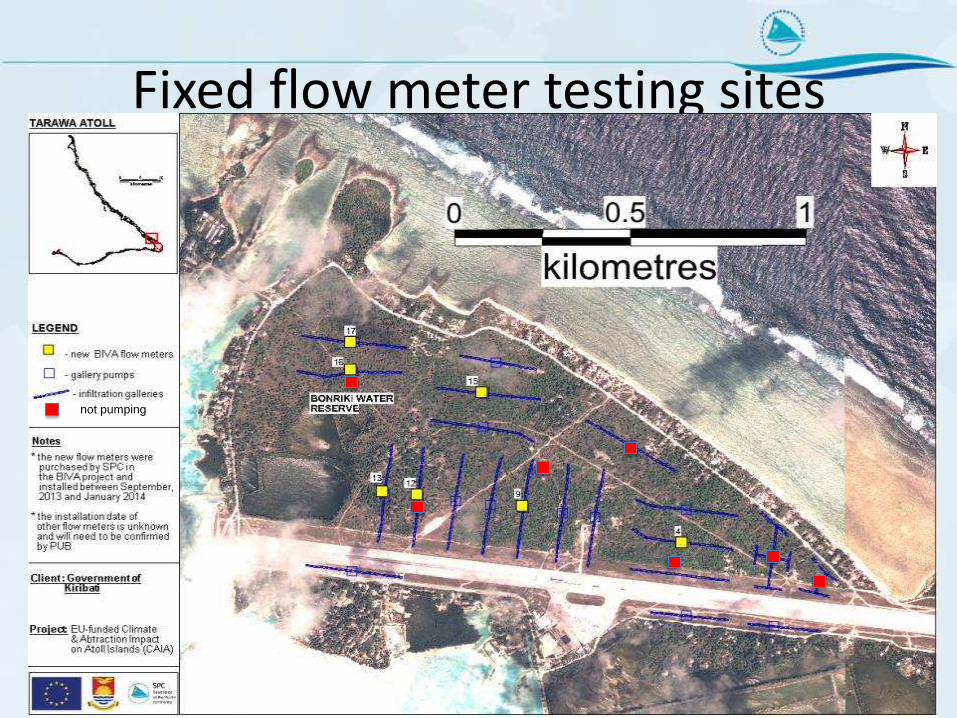
Fixed flow meter testing sites
not pumping
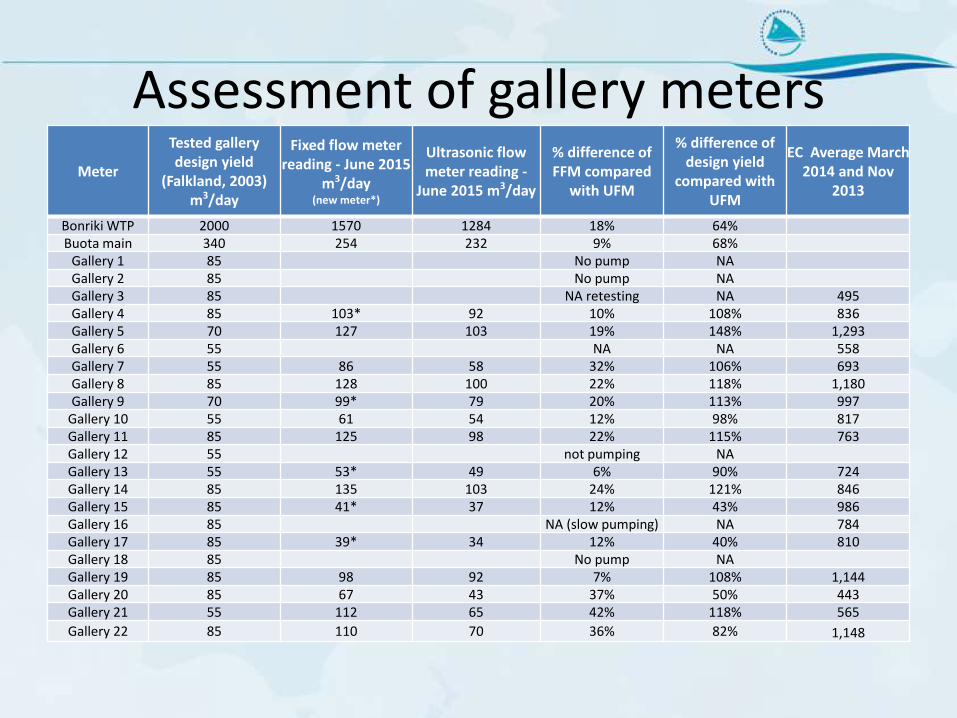
Assessment of gallery meters Meter
Tested gallery design yield
(Falkland, 2003) m3/day
Fixed flow meter reading - June 2015
m3/day (new meter*)
Ultrasonic flow meter reading -
June 2015 m3/day
% difference of FFM compared
with UFM
% difference of design yield
compared with UFM
EC Average March 2014 and Nov
2013
Bonriki WTP 2000 1570 1284 18% 64% Buota main 340 254 232 9% 68%
Gallery 1 85 No pump NA Gallery 2 85 No pump NA Gallery 3 85 NA retesting NA 495 Gallery 4 85 103* 92 10% 108% 836 Gallery 5 70 127 103 19% 148% 1,293 Gallery 6 55 NA NA 558 Gallery 7 55 86 58 32% 106% 693 Gallery 8 85 128 100 22% 118% 1,180 Gallery 9 70 99* 79 20% 113% 997
Gallery 10 55 61 54 12% 98% 817 Gallery 11 85 125 98 22% 115% 763 Gallery 12 55 not pumping NA Gallery 13 55 53* 49 6% 90% 724 Gallery 14 85 135 103 24% 121% 846 Gallery 15 85 41* 37 12% 43% 986 Gallery 16 85 NA (slow pumping) NA 784 Gallery 17 85 39* 34 12% 40% 810 Gallery 18 85 No pump NA Gallery 19 85 98 92 7% 108% 1,144 Gallery 20 85 67 43 37% 50% 443 Gallery 21 55 112 65 42% 118% 565
Gallery 22 85 110 70 36% 82% 1,148
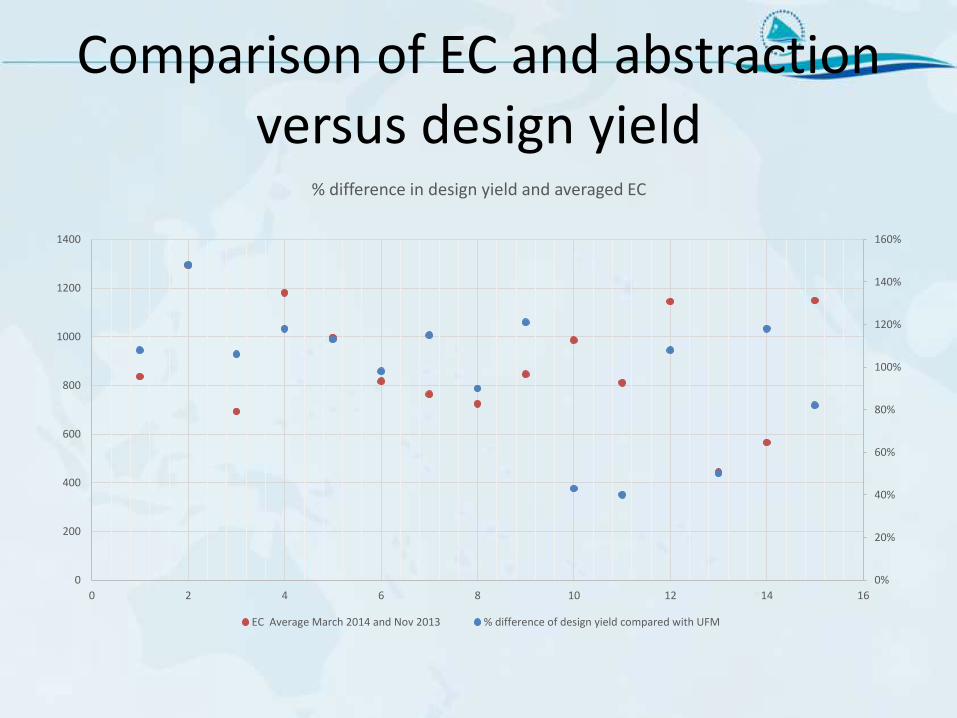
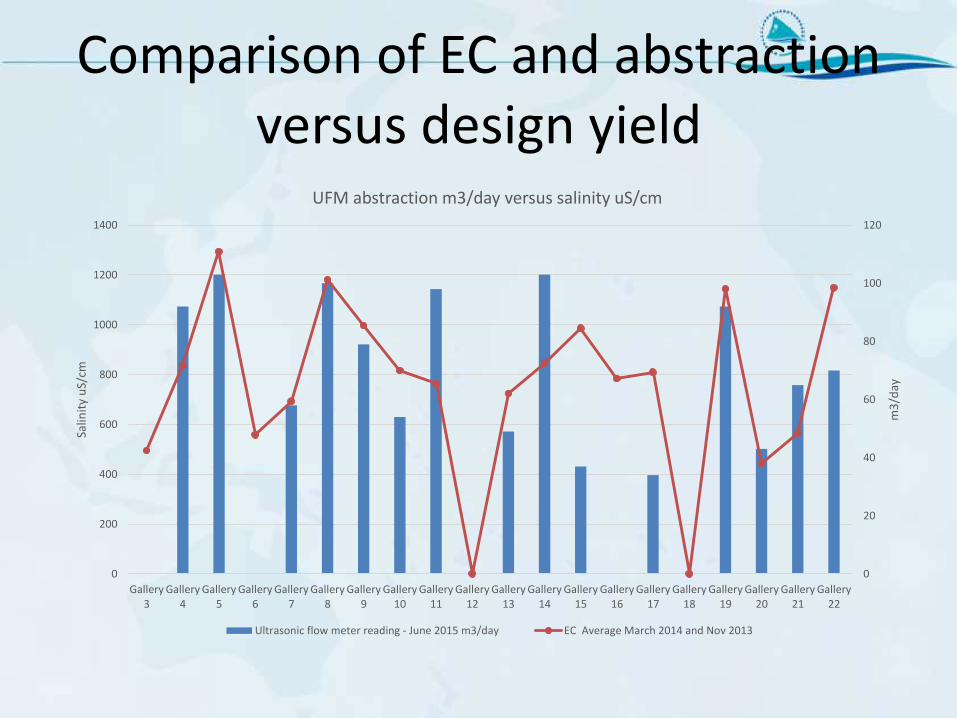
Comparison of EC and abstraction versus design yield
0%
20%
40%
60%
80%
100%
120%
140%
160%
0
200
400
600
800
1000
1200
1400
0 2 4 6 8 10 12 14 16
% difference in design yield and averaged EC
EC Average March 2014 and Nov 2013 % difference of design yield compared with UFM
Comparison of EC and abstraction versus design yield
0
20
40
60
80
100
120
0
200
400
600
800
1000
1200
1400
Gallery3
Gallery4
Gallery5
Gallery6
Gallery7
Gallery8
Gallery9
Gallery10
Gallery11
Gallery12
Gallery13
Gallery14
Gallery15
Gallery16
Gallery17
Gallery18
Gallery19
Gallery20
Gallery21
Gallery22
m3
/day
Salin
ity
uS/
cm
UFM abstraction m3/day versus salinity uS/cm
Ultrasonic flow meter reading - June 2015 m3/day EC Average March 2014 and Nov 2013
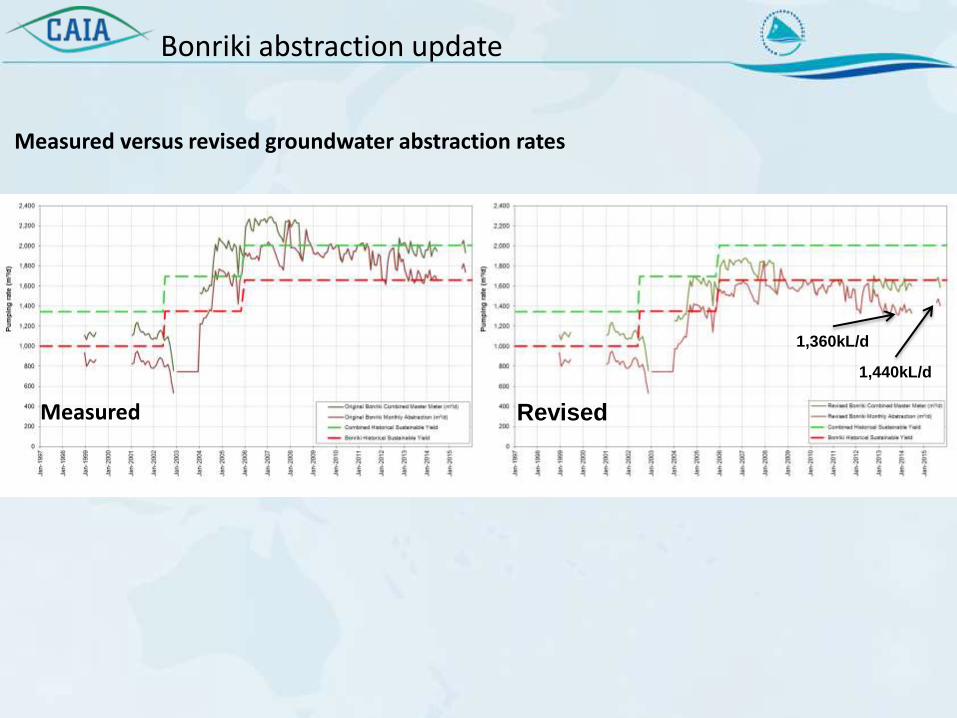
Measured versus revised groundwater abstraction rates
Measured Revised
1,440kL/d
1,360kL/d
Bonriki abstraction update
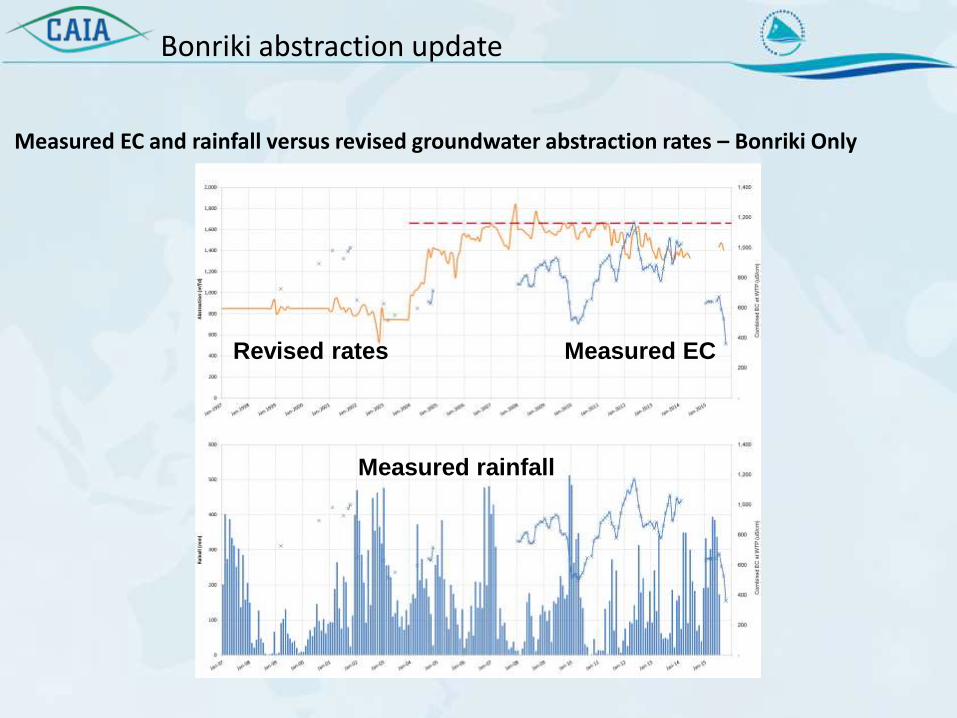
Measured EC and rainfall versus revised groundwater abstraction rates – Bonriki Only
Revised rates Measured EC
Measured rainfall
Bonriki abstraction update
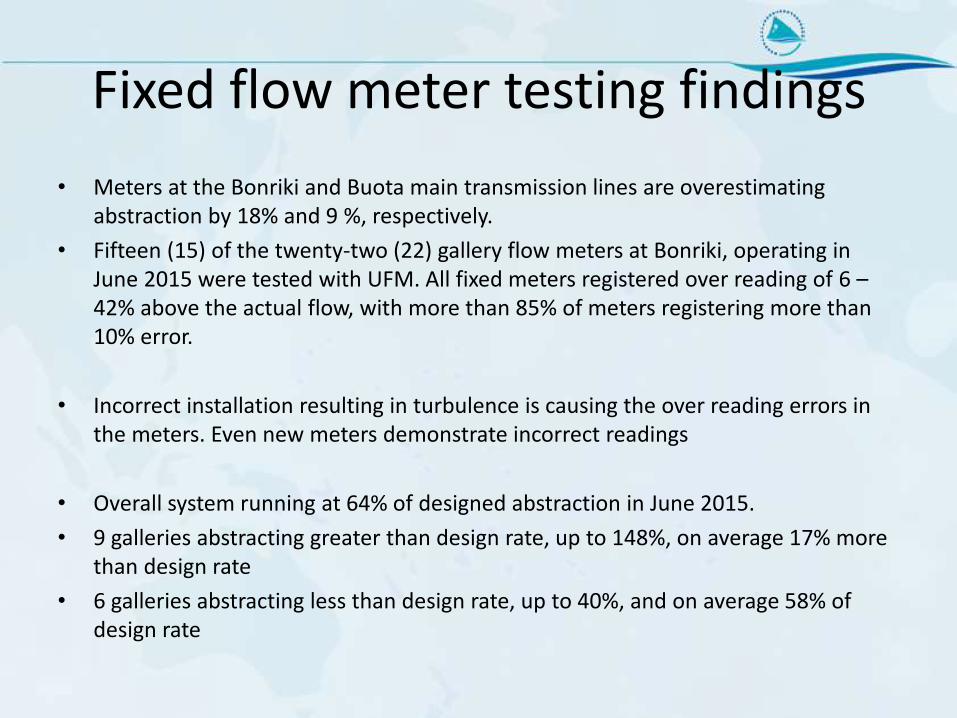
Fixed flow meter testing findings
• Meters at the Bonriki and Buota main transmission lines are overestimating abstraction by 18% and 9 %, respectively.
• Fifteen (15) of the twenty-two (22) gallery flow meters at Bonriki, operating in June 2015 were tested with UFM. All fixed meters registered over reading of 6 – 42% above the actual flow, with more than 85% of meters registering more than 10% error.
• Incorrect installation resulting in turbulence is causing the over reading errors in the meters. Even new meters demonstrate incorrect readings
• Overall system running at 64% of designed abstraction in June 2015.
• 9 galleries abstracting greater than design rate, up to 148%, on average 17% more than design rate
• 6 galleries abstracting less than design rate, up to 40%, and on average 58% of design rate
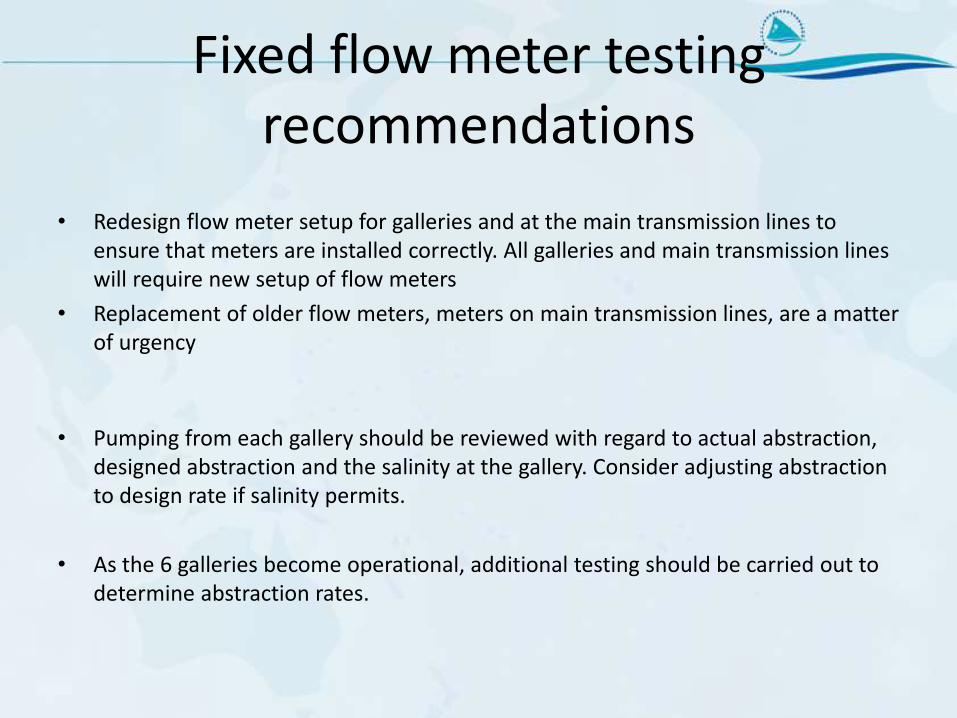
Fixed flow meter testing recommendations
• Redesign flow meter setup for galleries and at the main transmission lines to ensure that meters are installed correctly. All galleries and main transmission lines will require new setup of flow meters
• Replacement of older flow meters, meters on main transmission lines, are a matter of urgency
• Pumping from each gallery should be reviewed with regard to actual abstraction,
designed abstraction and the salinity at the gallery. Consider adjusting abstraction to design rate if salinity permits.
• As the 6 galleries become operational, additional testing should be carried out to determine abstraction rates.

Review of new scenarios
Presenter: Peter Sinclair and Amandine Bosserelle
Tuesday 27 October 2015
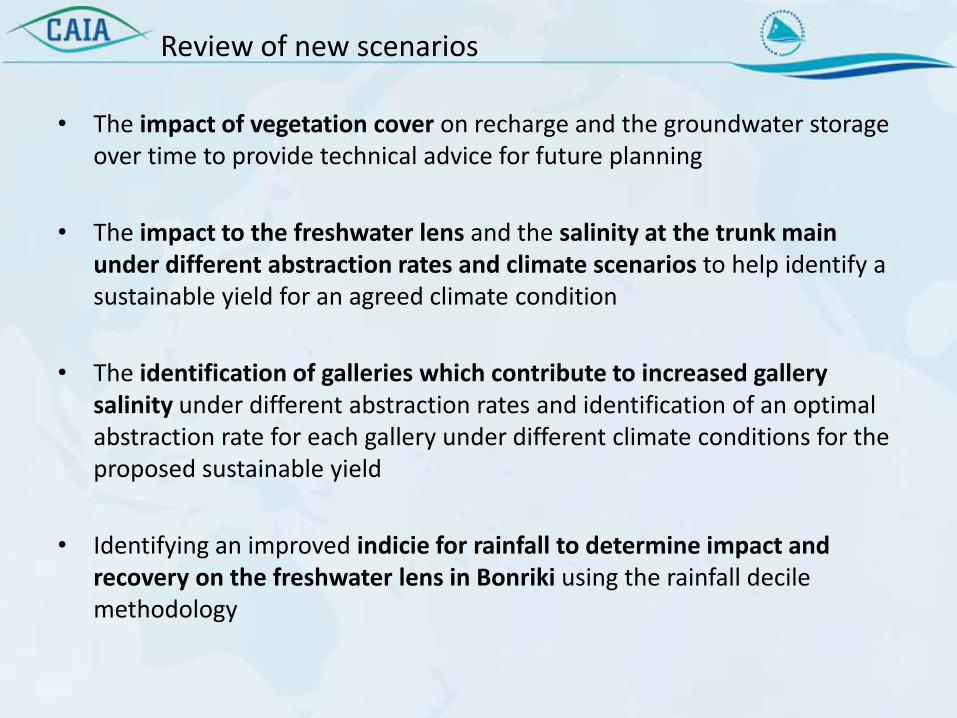
• The impact of vegetation cover on recharge and the groundwater storage over time to provide technical advice for future planning
• The impact to the freshwater lens and the salinity at the trunk main under different abstraction rates and climate scenarios to help identify a sustainable yield for an agreed climate condition
• The identification of galleries which contribute to increased gallery salinity under different abstraction rates and identification of an optimal abstraction rate for each gallery under different climate conditions for the proposed sustainable yield
• Identifying an improved indicie for rainfall to determine impact and recovery on the freshwater lens in Bonriki using the rainfall decile methodology
Review of new scenarios
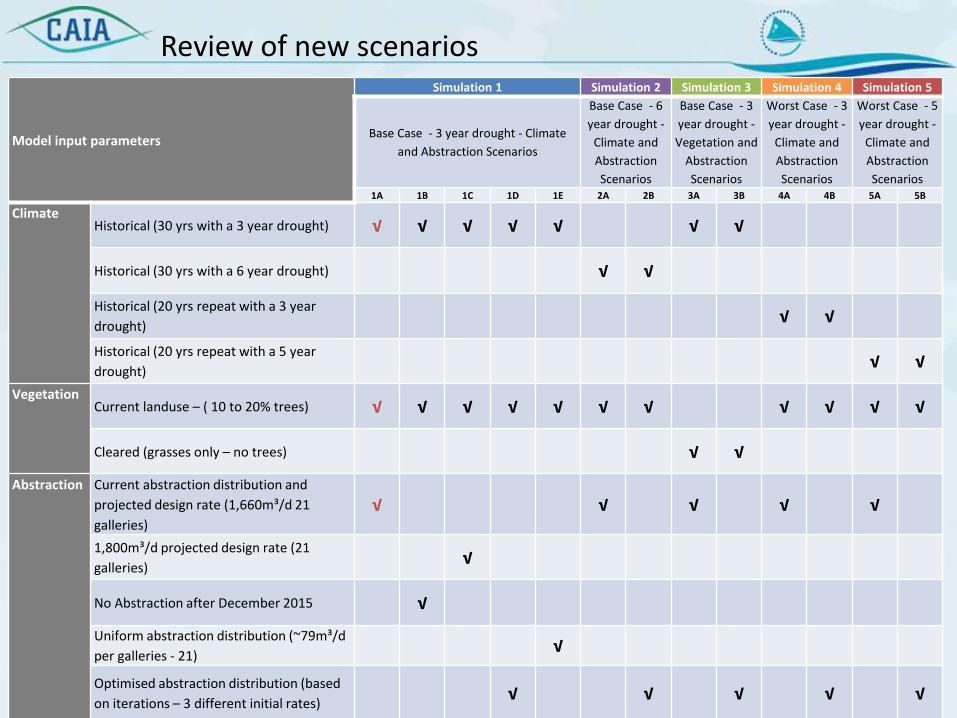
Model input parameters
Simulation 1 Simulation 2 Simulation 3 Simulation 4 Simulation 5
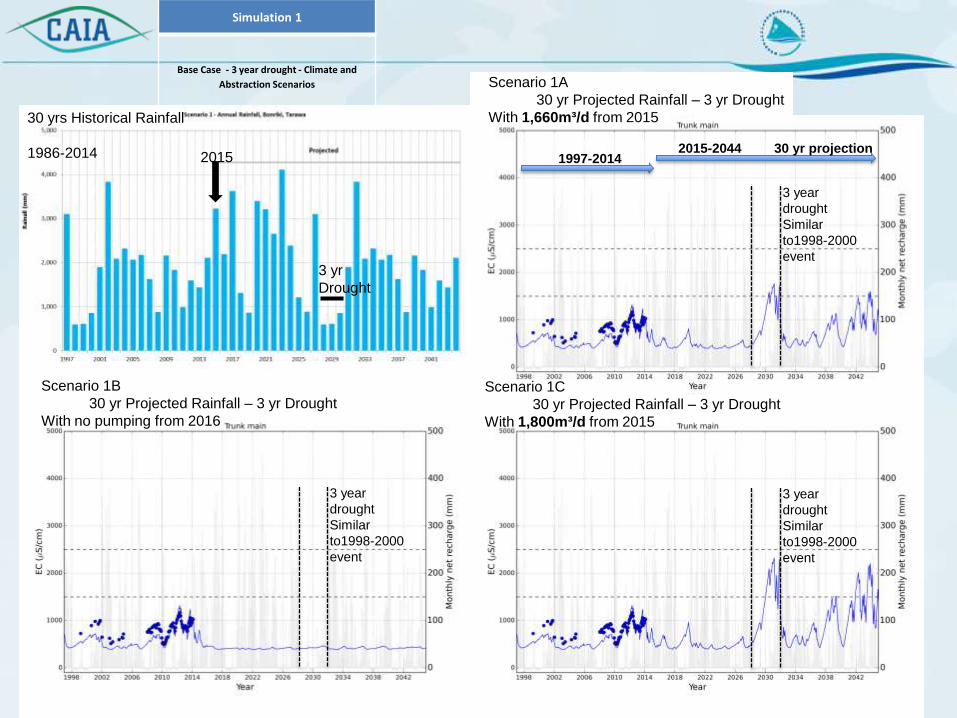
Base Case - 3 year drought - Climate
and Abstraction Scenarios
Base Case - 6
year drought -
Climate and
Abstraction
Scenarios
Base Case - 3
year drought -
Vegetation and
Abstraction
Scenarios
Worst Case - 3
year drought -
Climate and
Abstraction
Scenarios
Worst Case - 5
year drought -
Climate and
Abstraction
Scenarios 1A 1B 1C 1D 1E 2A 2B 3A 3B 4A 4B 5A 5B
Climate
Historical (30 yrs with a 3 year drought) √ √ √ √ √ √ √
Historical (30 yrs with a 6 year drought) √ √
Historical (20 yrs repeat with a 3 year
drought) √ √
Historical (20 yrs repeat with a 5 year
drought) √ √
Vegetation
Current landuse – ( 10 to 20% trees) √ √ √ √ √ √ √ √ √ √ √
Cleared (grasses only – no trees) √ √
Abstraction Current abstraction distribution and
projected design rate (1,660m³/d 21
galleries)
√ √ √ √ √
1,800m³/d projected design rate (21
galleries) √
No Abstraction after December 2015 √
Uniform abstraction distribution (~79m³/d
per galleries - 21) √
Optimised abstraction distribution (based
on iterations – 3 different initial rates) √ √ √ √ √
Review of new scenarios

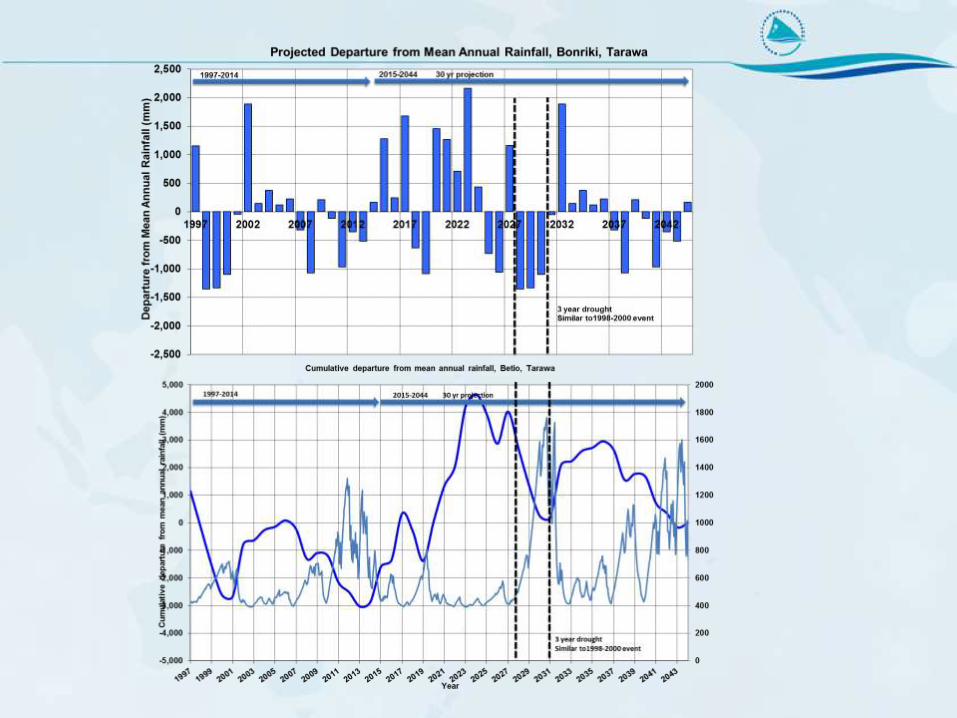
Scenario 1A
30 yr Projected Rainfall – 3 yr Drought
With 1,660m³/d from 2015
Scenario 1C
30 yr Projected Rainfall – 3 yr Drought
With 1,800m³/d from 2015
1997-2014 2015-2044 30 yr projection
3 year
drought
Similar
to1998-2000
event
3 year
drought
Similar
to1998-2000
event
3 year
drought
Similar
to1998-2000
event
Simulation 1
Base Case - 3 year drought - Climate and
Abstraction Scenarios
3 yr
Drought
2015
30 yrs Historical Rainfall
1986-2014
Scenario 1B
30 yr Projected Rainfall – 3 yr Drought
With no pumping from 2016
3 year
drought
Similar
to1998-2000
event

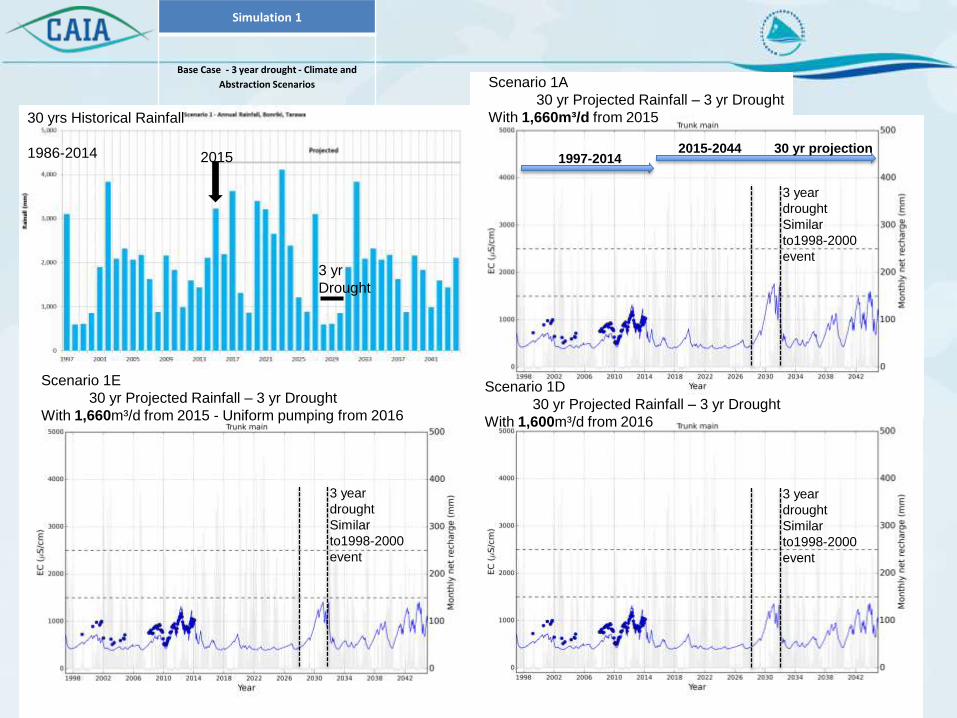
Scenario 1A
30 yr Projected Rainfall – 3 yr Drought
With 1,660m³/d from 2015
Scenario 1D
30 yr Projected Rainfall – 3 yr Drought
With 1,600m³/d from 2016
1997-2014 2015-2044 30 yr projection
3 year
drought
Similar
to1998-2000
event
3 year
drought
Similar
to1998-2000
event
Simulation 1
Base Case - 3 year drought - Climate and
Abstraction Scenarios
3 yr
Drought
2015
30 yrs Historical Rainfall
1986-2014
Scenario 1E
30 yr Projected Rainfall – 3 yr Drought
With 1,660m³/d from 2015 - Uniform pumping from 2016
3 year
drought
Similar
to1998-2000
event
1997-2014 2015-2044 30 yr projection
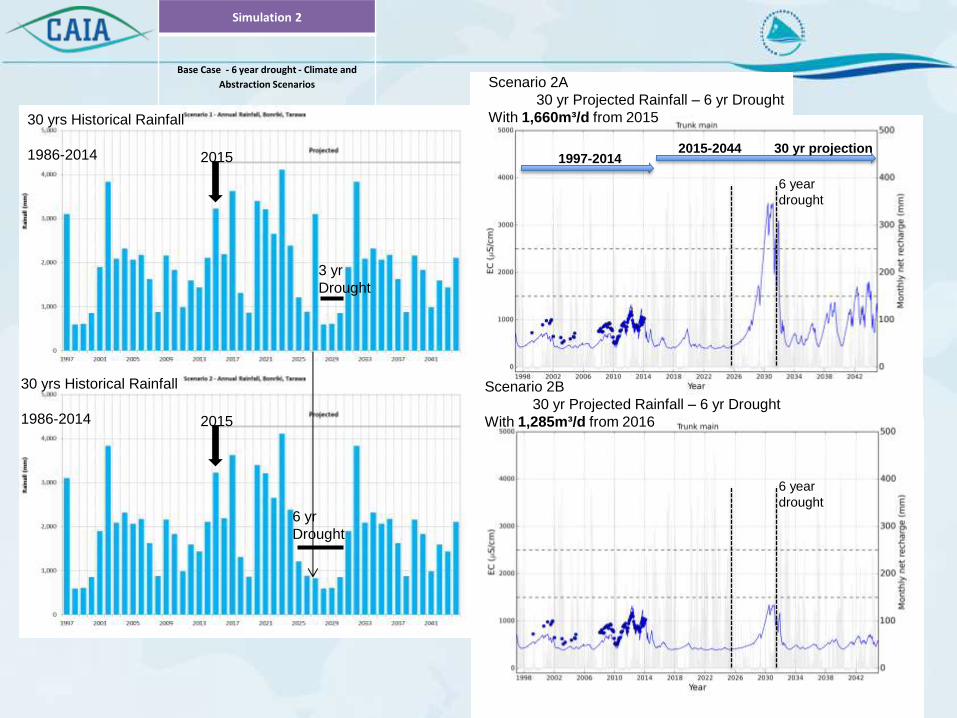
Simulation 2
Base Case - 6 year drought - Climate and
Abstraction Scenarios
6 yr
Drought
2015
3 yr
Drought
2015
30 yrs Historical Rainfall
1986-2014
30 yrs Historical Rainfall
1986-2014
6 year
drought
6 year
drought
Scenario 2A
30 yr Projected Rainfall – 6 yr Drought
With 1,660m³/d from 2015
Scenario 2B
30 yr Projected Rainfall – 6 yr Drought
With 1,285m³/d from 2016

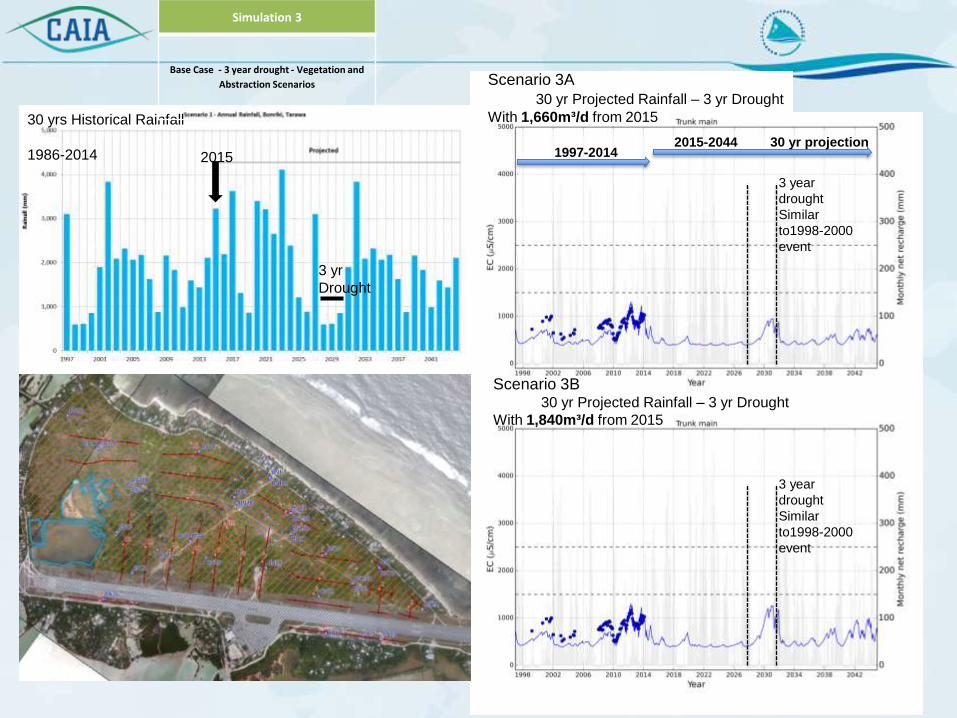
Scenario 3A
30 yr Projected Rainfall – 3 yr Drought
With 1,660m³/d from 2015
Scenario 3B 30 yr Projected Rainfall – 3 yr Drought
With 1,840m³/d from 2015
1997-2014 2015-2044 30 yr projection
3 year
drought
Similar
to1998-2000
event
3 year
drought
Similar
to1998-2000
event
3 yr
Drought
2015
30 yrs Historical Rainfall
1986-2014
Simulation 3
Base Case - 3 year drought - Vegetation and
Abstraction Scenarios

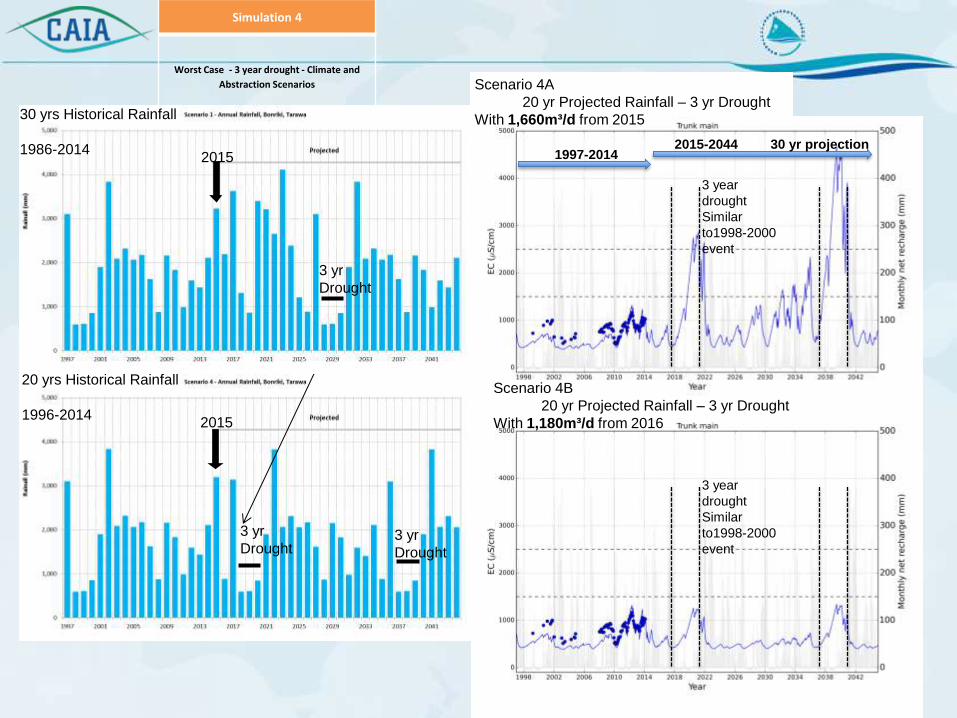
Scenario 4A
20 yr Projected Rainfall – 3 yr Drought
With 1,660m³/d from 2015
Scenario 4B
20 yr Projected Rainfall – 3 yr Drought
With 1,180m³/d from 2016
1997-2014 2015-2044 30 yr projection
3 year
drought
Similar
to1998-2000
event
3 year
drought
Similar
to1998-2000
event
3 yr
Drought
2015
20 yrs Historical Rainfall
1996-2014
3 yr
Drought
Simulation 4
Worst Case - 3 year drought - Climate and
Abstraction Scenarios
3 yr
Drought
2015
30 yrs Historical Rainfall
1986-2014

Scenario 5A
20 yr Projected Rainfall – 5 yr Drought
With 1,660m³/d from 2015
Scenario 5B
20 yr Projected Rainfall – 5 yr Drought
With 880m³/d from 2016
1997-2014 2015-2044 30 yr projection
5 year
drought
5 year
drought
Simulation 5
Worst Case - 5 year drought - Climate and
Abstraction Scenarios
3 yr
Drought
2015
20 yrs Historical Rainfall
1996-2014
3 yr
Drought
20 yrs Historical Rainfall
1996-2014
5 yr
Drought 5 yr
Drought
2015
Model input parameters
Simulation 1 Simulation 2 Simulation 3 Simulation 4 Simulation 5
Base Case - 3 year
drought - Climate and
Abstraction Scenarios
Base Case - 6 year
drought - Climate and
Abstraction Scenarios
Base Case - 3 year
drought - Vegetation
and Abstraction
Scenarios
Worst Case - 3 year
drought - Climate and
Abstraction Scenarios
Worst Case - 5 year
drought - Climate and
Abstraction Scenarios
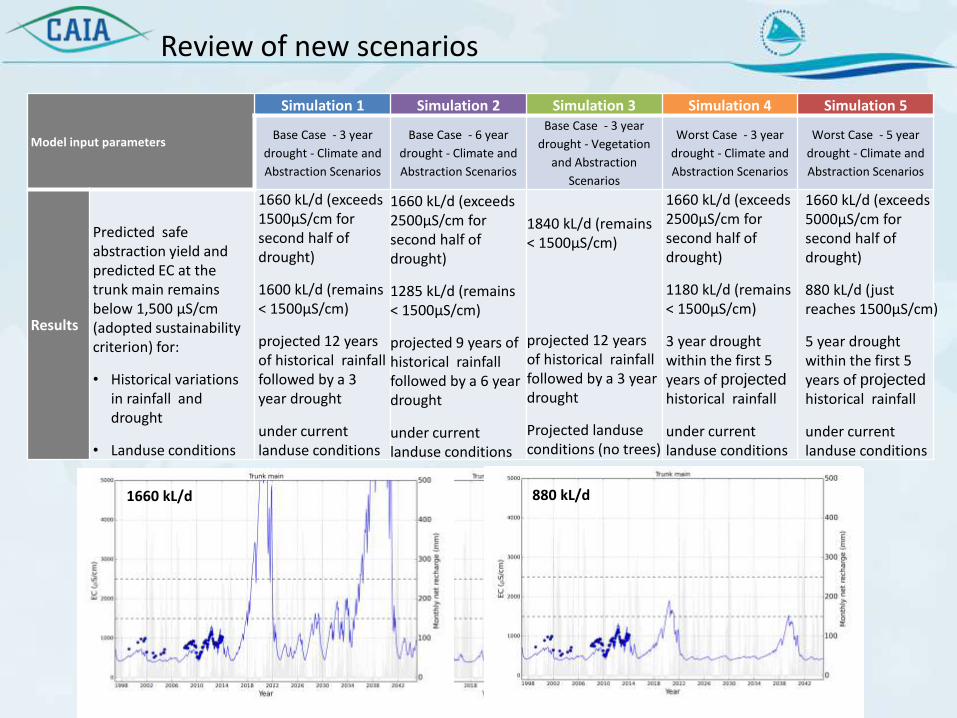
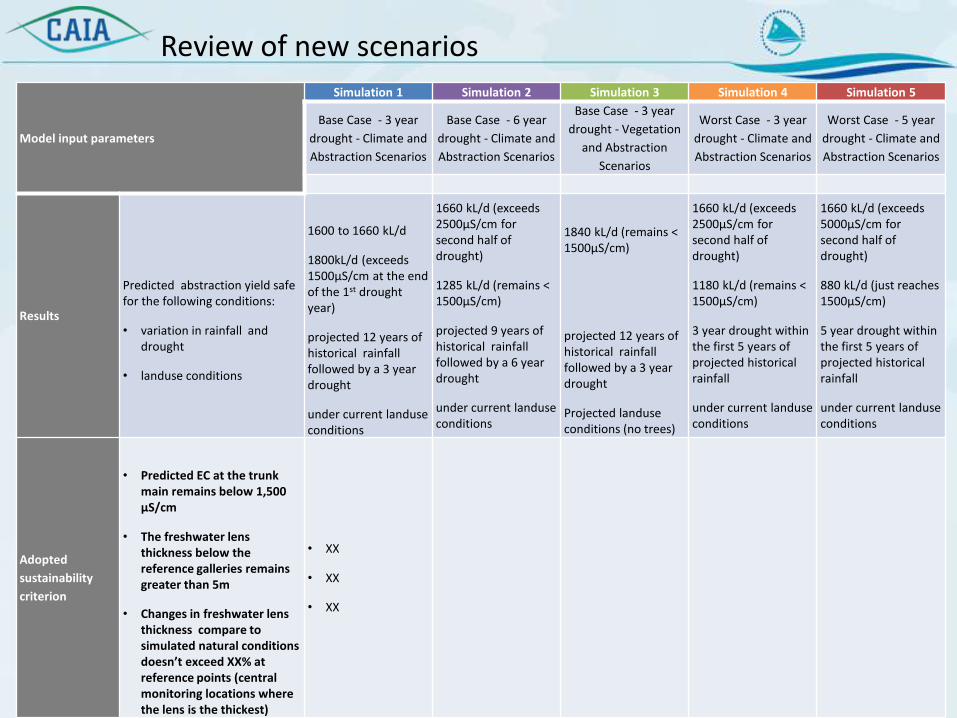
Results
Predicted safe abstraction yield and predicted EC at the trunk main remains below 1,500 μS/cm (adopted sustainability criterion) for:
• Historical variations in rainfall and drought
• Landuse conditions
1660 kL/d (exceeds 1500μS/cm for second half of drought)
1600 kL/d (remains < 1500μS/cm)
projected 12 years of historical rainfall followed by a 3 year drought
under current landuse conditions
Review of new scenarios
1660 kL/d (exceeds 2500μS/cm for second half of drought)
1285 kL/d (remains < 1500μS/cm)
projected 9 years of historical rainfall followed by a 6 year drought
under current landuse conditions
1660 kL/d 1600 kL/d 1660 kL/d 1285 kL/d 1840 kL/d
1840 kL/d (remains < 1500μS/cm)
projected 12 years of historical rainfall followed by a 3 year drought
Projected landuse conditions (no trees)
1660 kL/d (exceeds 2500μS/cm for second half of drought)
1180 kL/d (remains < 1500μS/cm)
3 year drought within the first 5 years of projected
historical rainfall
under current landuse conditions
1660 kL/d (exceeds 5000μS/cm for second half of drought)
880 kL/d (just reaches 1500μS/cm)
5 year drought within the first 5 years of projected
historical rainfall
under current landuse conditions
1660 kL/d 1180 kL/d 1660 kL/d 880 kL/d
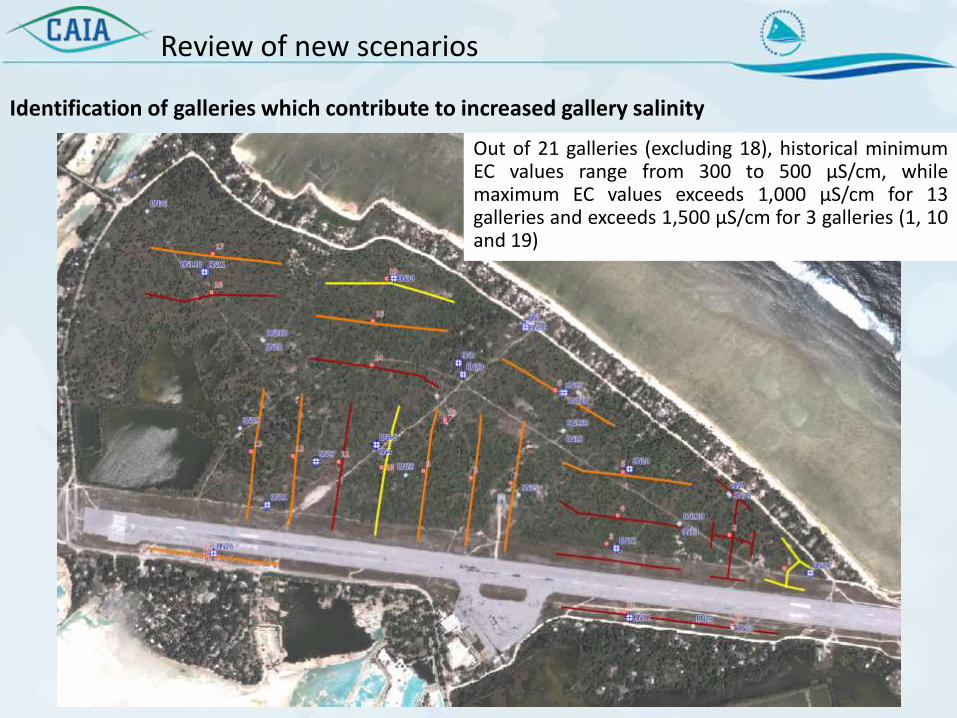
Review of new scenarios Identification of galleries which contribute to increased gallery salinity
Out of 21 galleries (excluding 18), historical minimum EC values range from 300 to 500 μS/cm, while maximum EC values exceeds 1,000 μS/cm for 13 galleries and exceeds 1,500 μS/cm for 3 galleries (1, 10 and 19)
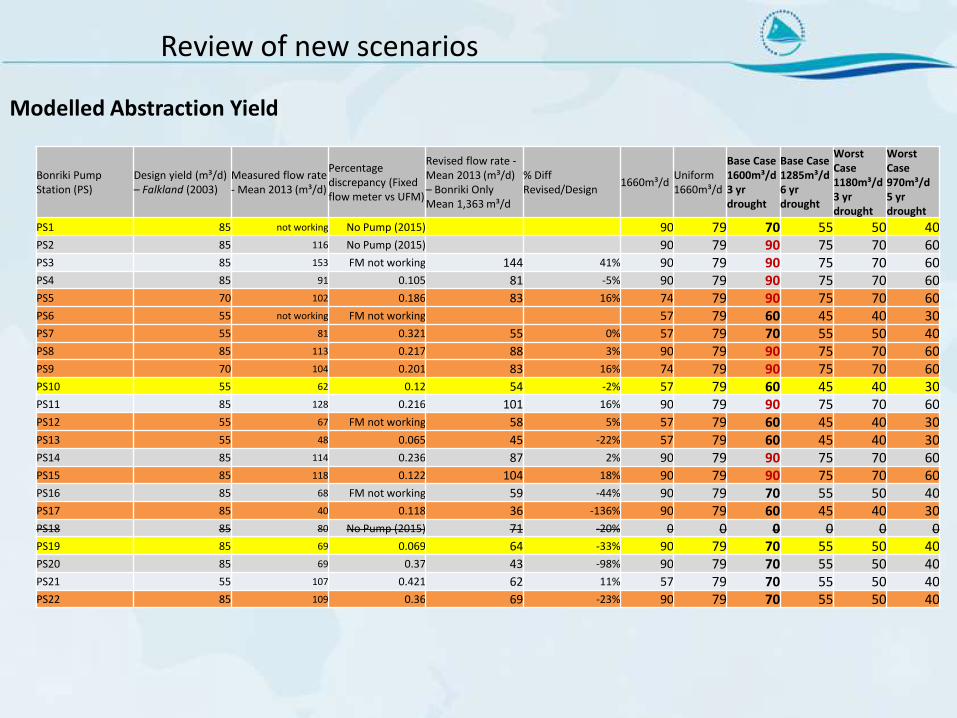
Bonriki Pump Station (PS)
Design yield (m³/d) – Falkland (2003)
Measured flow rate - Mean 2013 (m³/d)
Percentage discrepancy (Fixed flow meter vs UFM)
Revised flow rate - Mean 2013 (m³/d) – Bonriki Only Mean 1,363 m³/d
% Diff Revised/Design
1660m³/d Uniform 1660m³/d
Base Case 1600m³/d 3 yr drought
Base Case 1285m³/d 6 yr drought
Worst Case 1180m³/d 3 yr drought
Worst Case 970m³/d 5 yr drought
PS1 85 not working No Pump (2015) 90 79 70 55 50 40 PS2 85 116 No Pump (2015) 90 79 90 75 70 60 PS3 85 153 FM not working 144 41% 90 79 90 75 70 60 PS4 85 91 0.105 81 -5% 90 79 90 75 70 60 PS5 70 102 0.186 83 16% 74 79 90 75 70 60 PS6 55 not working FM not working 57 79 60 45 40 30 PS7 55 81 0.321 55 0% 57 79 70 55 50 40 PS8 85 113 0.217 88 3% 90 79 90 75 70 60 PS9 70 104 0.201 83 16% 74 79 90 75 70 60 PS10 55 62 0.12 54 -2% 57 79 60 45 40 30 PS11 85 128 0.216 101 16% 90 79 90 75 70 60 PS12 55 67 FM not working 58 5% 57 79 60 45 40 30 PS13 55 48 0.065 45 -22% 57 79 60 45 40 30 PS14 85 114 0.236 87 2% 90 79 90 75 70 60 PS15 85 118 0.122 104 18% 90 79 90 75 70 60 PS16 85 68 FM not working 59 -44% 90 79 70 55 50 40 PS17 85 40 0.118 36 -136% 90 79 60 45 40 30 PS18 85 80 No Pump (2015) 71 -20% 0 0 0 0 0 0 PS19 85 69 0.069 64 -33% 90 79 70 55 50 40 PS20 85 69 0.37 43 -98% 90 79 70 55 50 40 PS21 55 107 0.421 62 11% 57 79 70 55 50 40 PS22 85 109 0.36 69 -23% 90 79 70 55 50 40
Review of new scenarios Modelled Abstraction Yield

Climate and Abstraction Impacts on Atoll Environments
Presenter: Peter Sinclair and Amandine Bosserelle
Wednesday 28 October 2015
Recap • Reviewed the model results for different abstraction
under different rainfall conditions
• Common to all includes the following
– Extended dry period will result in a rapid rise in salinity at galleries and in the trunk main
– Good following rainfall will see an even more rapid response in reducing the salinity, at the top of the freshwater lens, to background levels
– The shorter the period between stresses eg droughts, the quicker the abstracted water will reach a higher salinity. Thinning of freshwater lens reduces its resilience to provide the same quality of water for the same abstracted volume
Scenario 1A
30 yr Projected Rainfall – 3 yr Drought
With 1,660m³/d from 2015
Scenario 1C
30 yr Projected Rainfall – 3 yr Drought
With 1,800m³/d from 2015
1997-2014 2015-2044 30 yr projection
3 year
drought
Similar
to1998-2000
event
3 year
drought
Similar
to1998-2000
event
3 year
drought
Similar
to1998-2000
event
Simulation 1
Base Case - 3 year drought - Climate and
Abstraction Scenarios
3 yr
Drought
2015
30 yrs Historical Rainfall
1986-2014
Scenario 1B
30 yr Projected Rainfall – 3 yr Drought
With no pumping from 2016
3 year
drought
Similar
to1998-2000
event
Scenario 1A
30 yr Projected Rainfall – 3 yr Drought
With 1,660m³/d from 2015
Scenario 1D
30 yr Projected Rainfall – 3 yr Drought
With 1,600m³/d from 2016
1997-2014 2015-2044 30 yr projection
3 year
drought
Similar
to1998-2000
event
3 year
drought
Similar
to1998-2000
event
Simulation 1
Base Case - 3 year drought - Climate and
Abstraction Scenarios
3 yr
Drought
2015
30 yrs Historical Rainfall
1986-2014
Scenario 1E
30 yr Projected Rainfall – 3 yr Drought
With 1,660m³/d from 2015 - Uniform pumping from 2016
3 year
drought
Similar
to1998-2000
event

1997-2014 2015-2044 30 yr projection
Simulation 2
Base Case - 6 year drought - Climate and
Abstraction Scenarios
6 yr
Drought
2015
3 yr
Drought
2015
30 yrs Historical Rainfall
1986-2014
30 yrs Historical Rainfall
1986-2014
6 year
drought
6 year
drought
Scenario 2A
30 yr Projected Rainfall – 6 yr Drought
With 1,660m³/d from 2015
Scenario 2B
30 yr Projected Rainfall – 6 yr Drought
With 1,285m³/d from 2016
Scenario 3A
30 yr Projected Rainfall – 3 yr Drought
With 1,660m³/d from 2015
Scenario 3B 30 yr Projected Rainfall – 3 yr Drought
With 1,840m³/d from 2015
1997-2014 2015-2044 30 yr projection
3 year
drought
Similar
to1998-2000
event
3 year
drought
Similar
to1998-2000
event
3 yr
Drought
2015
30 yrs Historical Rainfall
1986-2014
Simulation 3
Base Case - 3 year drought - Vegetation and
Abstraction Scenarios
Scenario 4A
20 yr Projected Rainfall – 3 yr Drought
With 1,660m³/d from 2015
Scenario 4B
20 yr Projected Rainfall – 3 yr Drought
With 1,180m³/d from 2016
1997-2014 2015-2044 30 yr projection
3 year
drought
Similar
to1998-2000
event
3 year
drought
Similar
to1998-2000
event
3 yr
Drought
2015
20 yrs Historical Rainfall
1996-2014
3 yr
Drought
Simulation 4
Worst Case - 3 year drought - Climate and
Abstraction Scenarios
3 yr
Drought
2015
30 yrs Historical Rainfall
1986-2014

Scenario 5A
20 yr Projected Rainfall – 5 yr Drought
With 1,660m³/d from 2015
Scenario 5B
20 yr Projected Rainfall – 5 yr Drought
With 880m³/d from 2016
1997-2014 2015-2044 30 yr projection
5 year
drought
5 year
drought
Simulation 5
Worst Case - 5 year drought - Climate and
Abstraction Scenarios
3 yr
Drought
2015
20 yrs Historical Rainfall
1996-2014
3 yr
Drought
20 yrs Historical Rainfall
1996-2014
5 yr
Drought 5 yr
Drought
2015
Recap
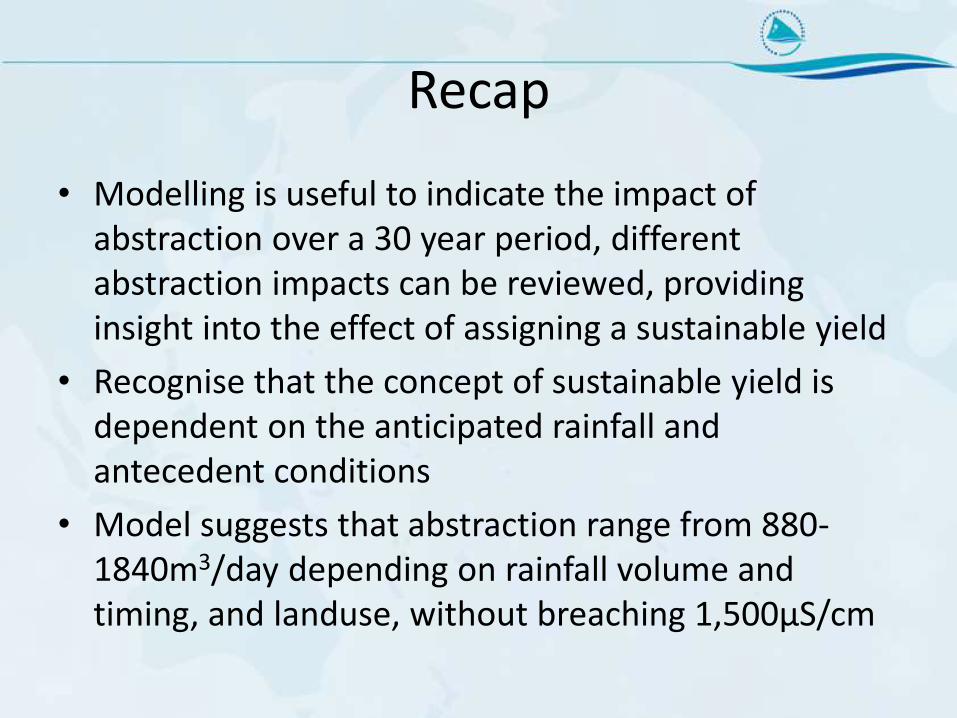
• Modelling is useful to indicate the impact of abstraction over a 30 year period, different abstraction impacts can be reviewed, providing insight into the effect of assigning a sustainable yield
• Recognise that the concept of sustainable yield is dependent on the anticipated rainfall and antecedent conditions
• Model suggests that abstraction range from 880- 1840m3/day depending on rainfall volume and timing, and landuse, without breaching 1,500µS/cm
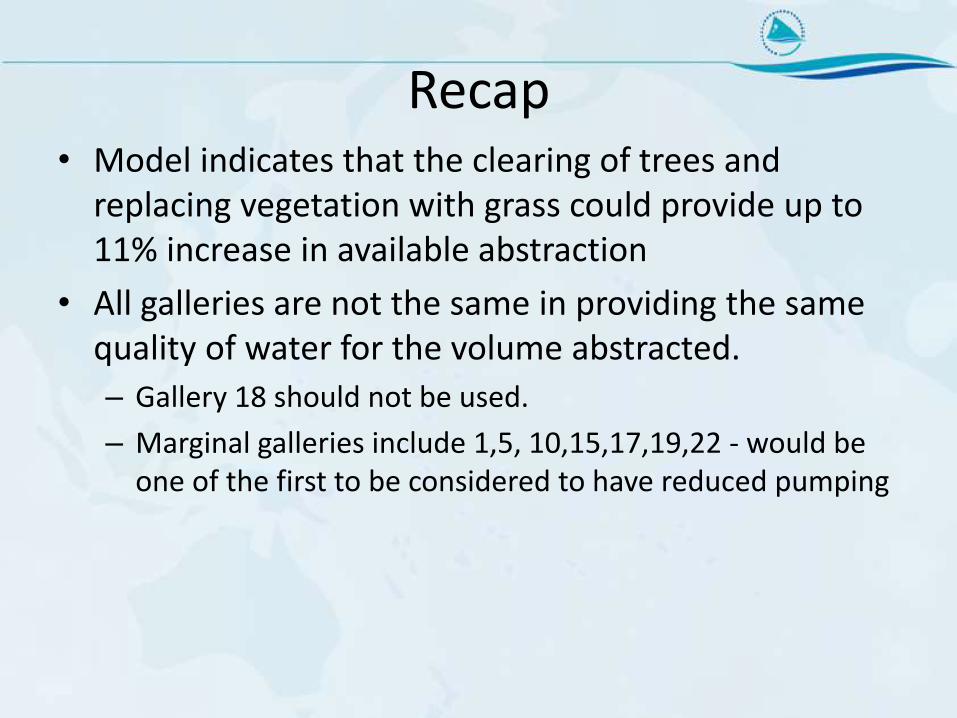
Recap • Model indicates that the clearing of trees and
replacing vegetation with grass could provide up to 11% increase in available abstraction
• All galleries are not the same in providing the same quality of water for the volume abstracted.
– Gallery 18 should not be used.
– Marginal galleries include 1,5, 10,15,17,19,22 - would be one of the first to be considered to have reduced pumping
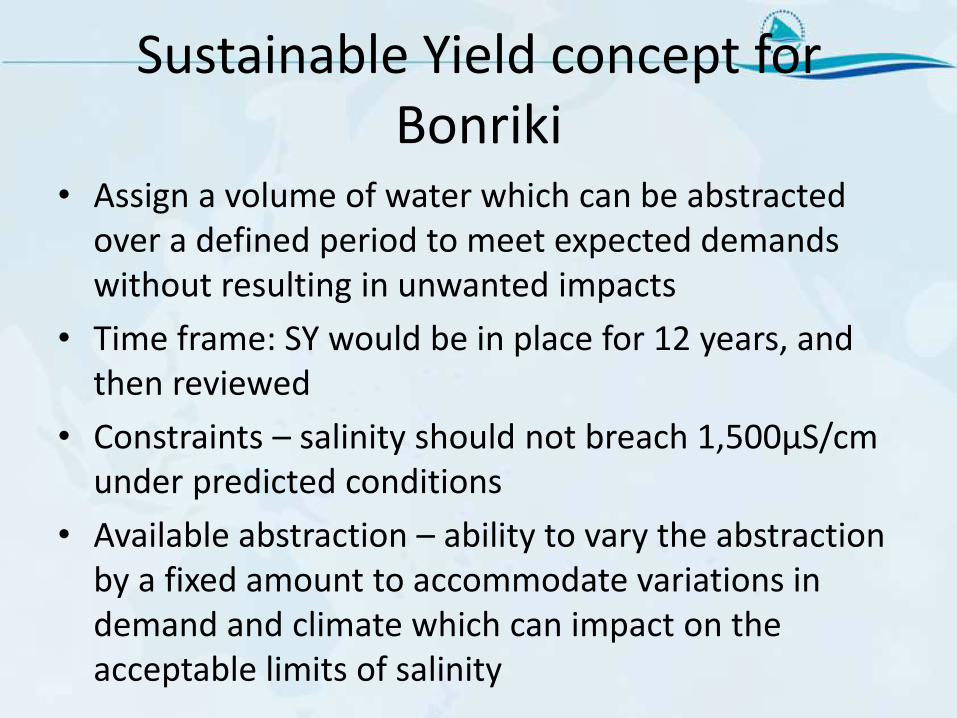
Sustainable Yield concept for Bonriki
• Assign a volume of water which can be abstracted over a defined period to meet expected demands without resulting in unwanted impacts
• Time frame: SY would be in place for 12 years, and then reviewed
• Constraints – salinity should not breach 1,500µS/cm under predicted conditions
• Available abstraction – ability to vary the abstraction by a fixed amount to accommodate variations in demand and climate which can impact on the acceptable limits of salinity
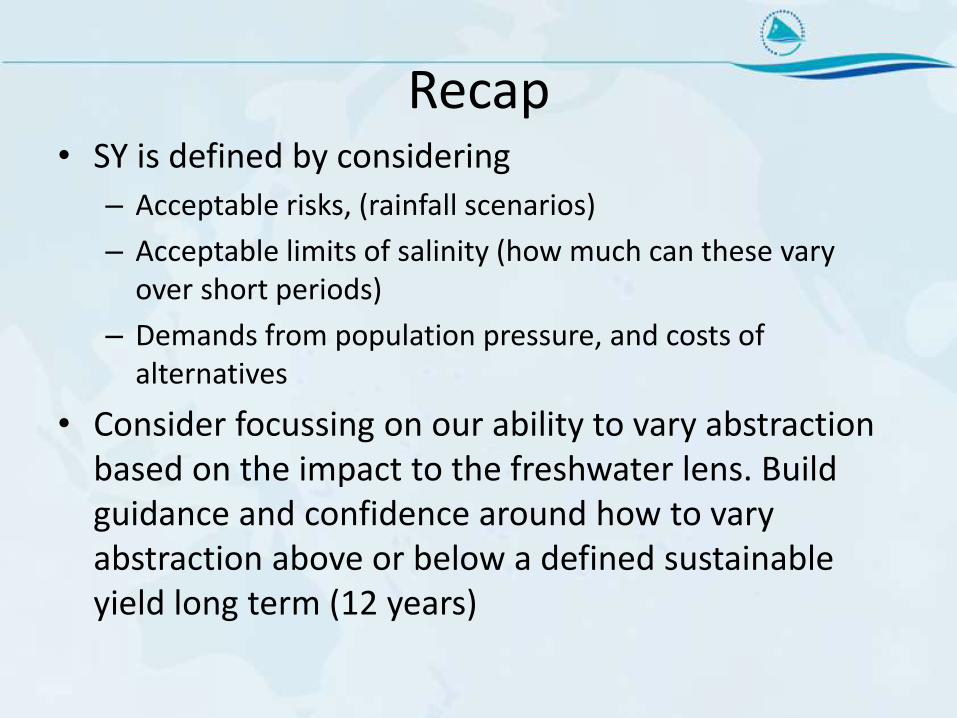
Recap • SY is defined by considering
– Acceptable risks, (rainfall scenarios)
– Acceptable limits of salinity (how much can these vary over short periods)
– Demands from population pressure, and costs of alternatives
• Consider focussing on our ability to vary abstraction based on the impact to the freshwater lens. Build guidance and confidence around how to vary abstraction above or below a defined sustainable yield long term (12 years)
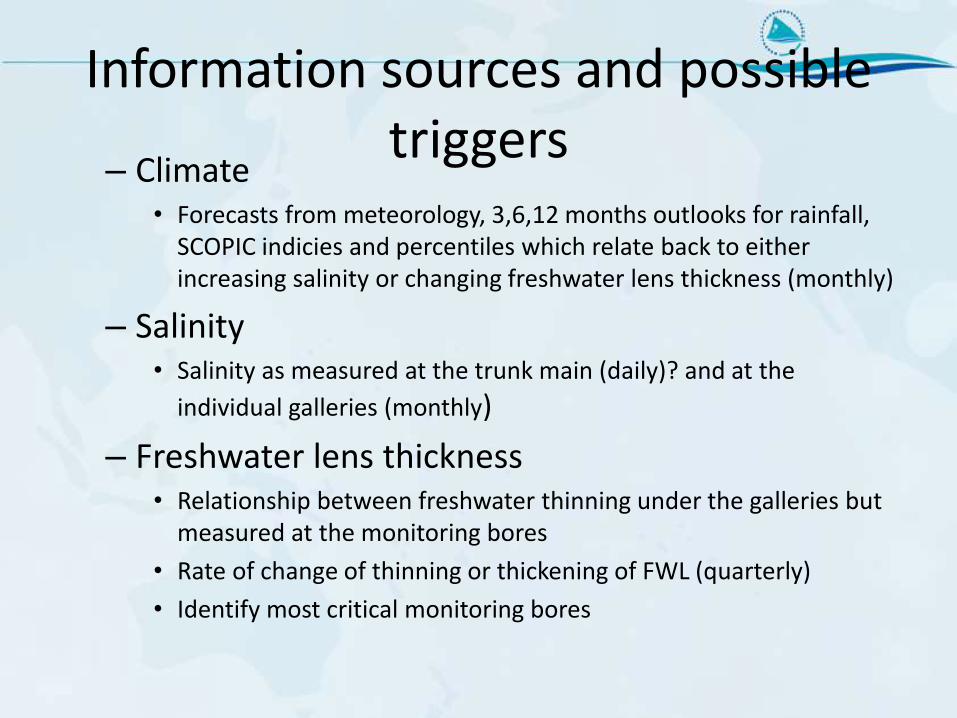
Information sources and possible triggers
– Climate • Forecasts from meteorology, 3,6,12 months outlooks for rainfall,
SCOPIC indicies and percentiles which relate back to either increasing salinity or changing freshwater lens thickness (monthly)
– Salinity • Salinity as measured at the trunk main (daily)? and at the
individual galleries (monthly)
– Freshwater lens thickness • Relationship between freshwater thinning under the galleries but
measured at the monitoring bores
• Rate of change of thinning or thickening of FWL (quarterly)
• Identify most critical monitoring bores
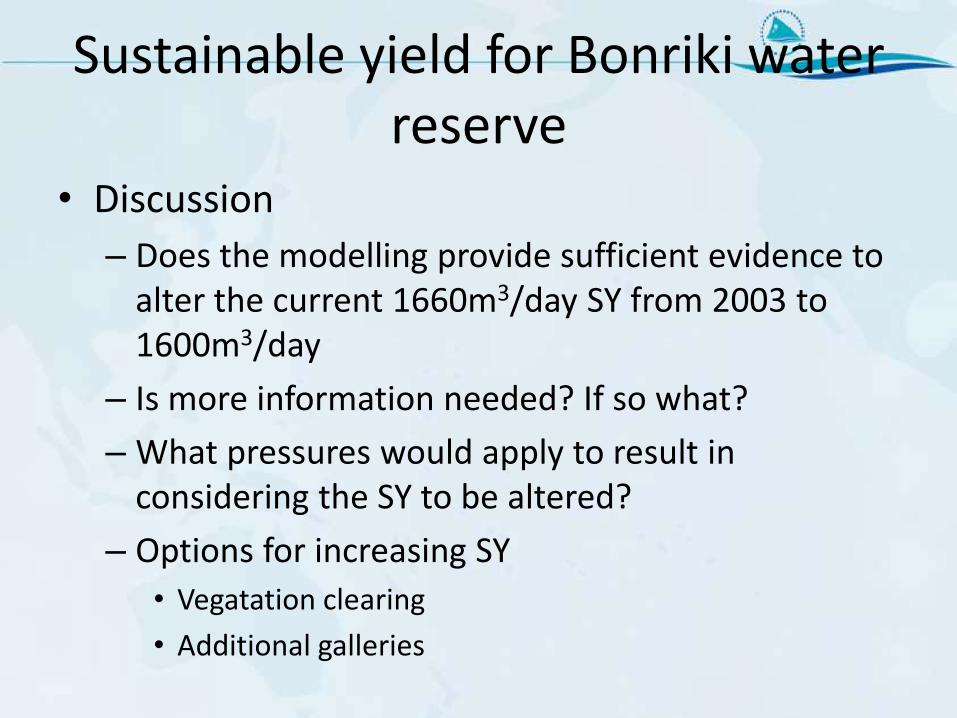
Sustainable yield for Bonriki water reserve
• Discussion
– Does the modelling provide sufficient evidence to alter the current 1660m3/day SY from 2003 to 1600m3/day
– Is more information needed? If so what?
– What pressures would apply to result in considering the SY to be altered?
– Options for increasing SY
• Vegatation clearing
• Additional galleries
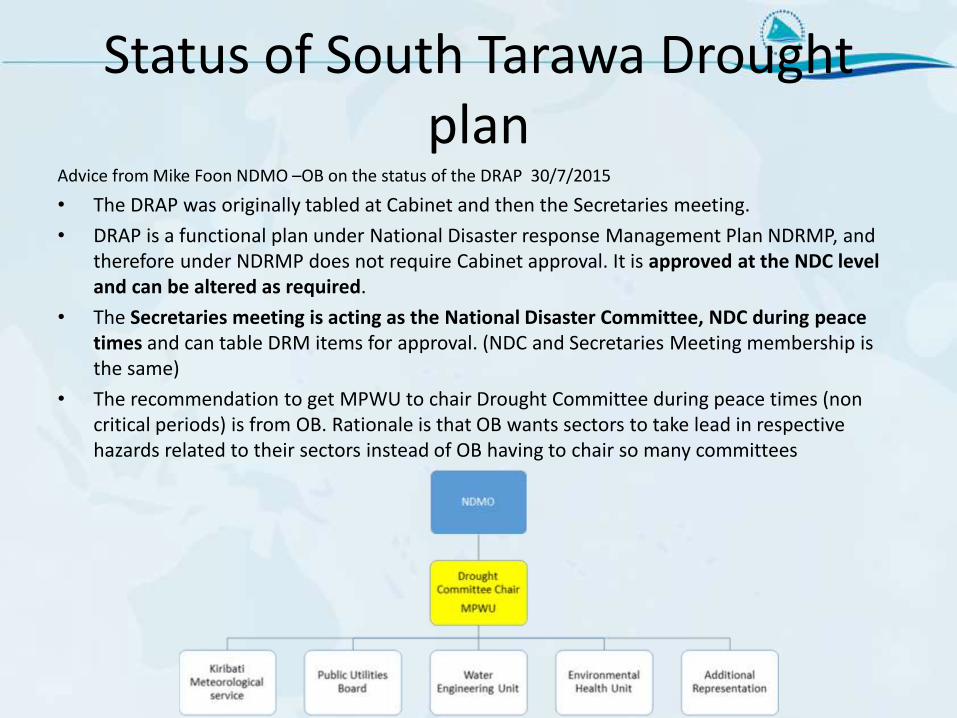
Status of South Tarawa Drought plan
Advice from Mike Foon NDMO –OB on the status of the DRAP 30/7/2015
• The DRAP was originally tabled at Cabinet and then the Secretaries meeting.
• DRAP is a functional plan under National Disaster response Management Plan NDRMP, and therefore under NDRMP does not require Cabinet approval. It is approved at the NDC level and can be altered as required.
• The Secretaries meeting is acting as the National Disaster Committee, NDC during peace times and can table DRM items for approval. (NDC and Secretaries Meeting membership is the same)
• The recommendation to get MPWU to chair Drought Committee during peace times (non critical periods) is from OB. Rationale is that OB wants sectors to take lead in respective hazards related to their sectors instead of OB having to chair so many committees
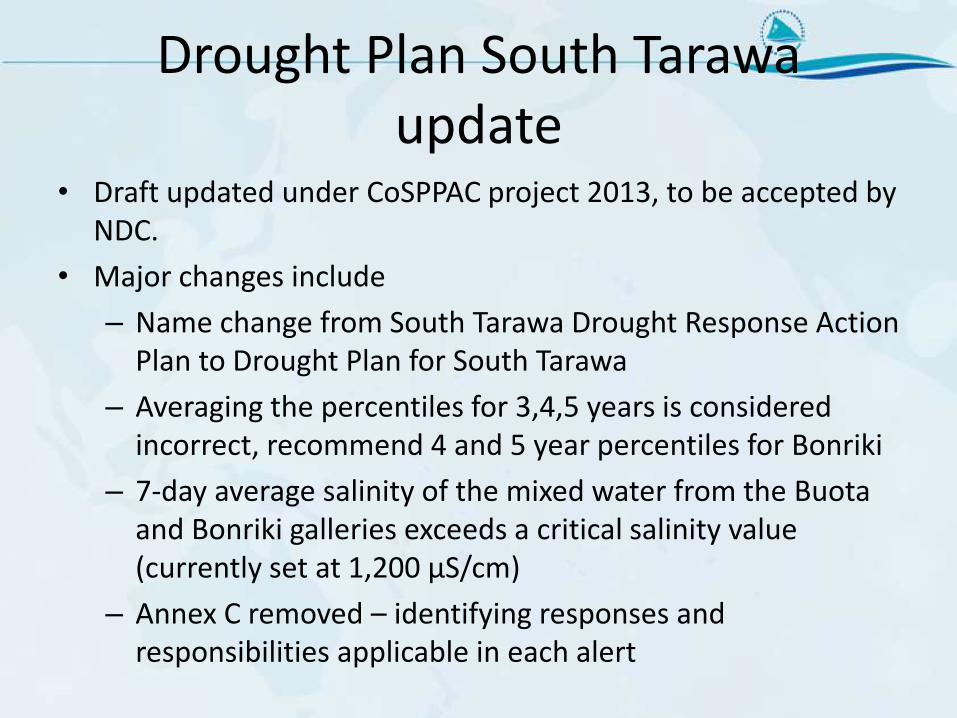
Drought Plan South Tarawa update
• Draft updated under CoSPPAC project 2013, to be accepted by NDC.
• Major changes include
– Name change from South Tarawa Drought Response Action Plan to Drought Plan for South Tarawa
– Averaging the percentiles for 3,4,5 years is considered incorrect, recommend 4 and 5 year percentiles for Bonriki
– 7-day average salinity of the mixed water from the Buota and Bonriki galleries exceeds a critical salinity value (currently set at 1,200 µS/cm)
– Annex C removed – identifying responses and responsibilities applicable in each alert
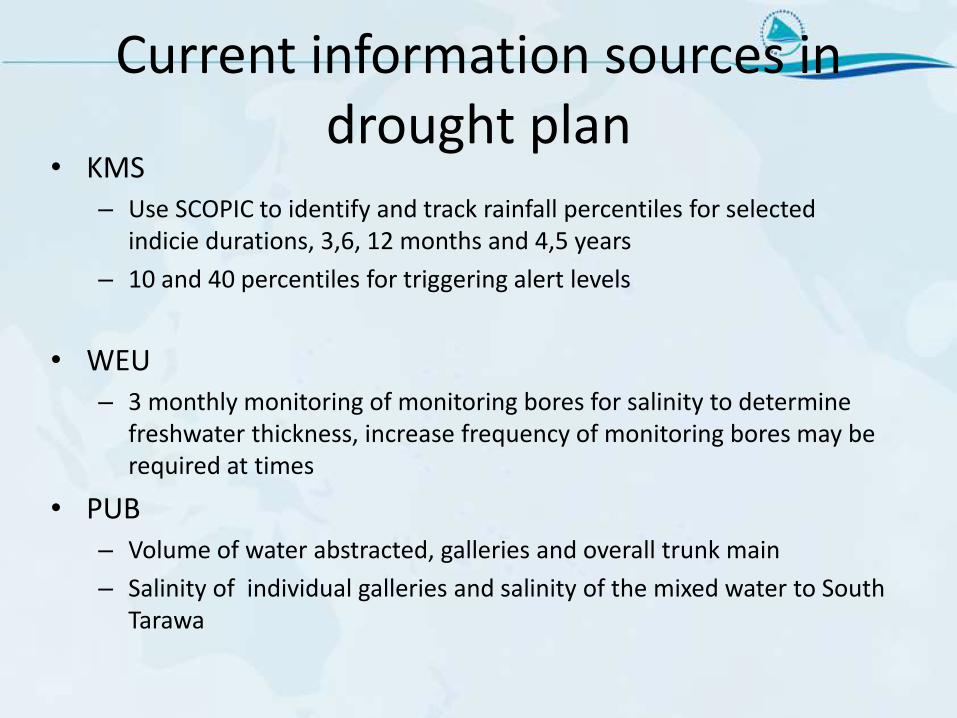
Current information sources in drought plan
• KMS – Use SCOPIC to identify and track rainfall percentiles for selected
indicie durations, 3,6, 12 months and 4,5 years
– 10 and 40 percentiles for triggering alert levels
• WEU – 3 monthly monitoring of monitoring bores for salinity to determine
freshwater thickness, increase frequency of monitoring bores may be required at times
• PUB – Volume of water abstracted, galleries and overall trunk main
– Salinity of individual galleries and salinity of the mixed water to South Tarawa
Drought Plan
– South Tarawa Drought plan currently provides limited guidance on the response actions for each alert level,
– Drought plan does not explicitly provide for varying abstraction at the Bonriki water reserve
– Drought plan considers triggers for alert levels and declaration of drought identifying information which could be used to inform community of status of climate outlook and water resources
– What would you like to see?
Operation of Bonriki Water Reserve – Monitoring and
Abstraction Optimisation Insights Presenter: Peter Sinclair and Amandine Bosserelle
Tuesday 27 October 2015

Model input parameters
Simulation 1 Simulation 2 Simulation 3 Simulation 4 Simulation 5
Base Case - 3 year
drought - Climate and
Abstraction Scenarios
Base Case - 6 year
drought - Climate and
Abstraction Scenarios
Base Case - 3 year
drought - Vegetation
and Abstraction
Scenarios
Worst Case - 3 year
drought - Climate and
Abstraction Scenarios
Worst Case - 5 year
drought - Climate and
Abstraction Scenarios
Results
Predicted abstraction yield safe for the following conditions:
• variation in rainfall and drought
• landuse conditions
1600 to 1660 kL/d
1800kL/d (exceeds 1500μS/cm at the end of the 1st drought year)
projected 12 years of historical rainfall followed by a 3 year drought
under current landuse conditions
1660 kL/d (exceeds 2500μS/cm for second half of drought)
1285 kL/d (remains < 1500μS/cm)
projected 9 years of historical rainfall followed by a 6 year drought
under current landuse conditions
1840 kL/d (remains < 1500μS/cm)
projected 12 years of historical rainfall followed by a 3 year drought
Projected landuse conditions (no trees)
1660 kL/d (exceeds 2500μS/cm for second half of drought)
1180 kL/d (remains < 1500μS/cm)
3 year drought within the first 5 years of projected historical rainfall
under current landuse conditions
1660 kL/d (exceeds 5000μS/cm for second half of drought)
880 kL/d (just reaches 1500μS/cm)
5 year drought within the first 5 years of projected historical rainfall
under current landuse conditions
Adopted
sustainability
criterion
• Predicted EC at the trunk main remains below 1,500 μS/cm
• The freshwater lens thickness below the reference galleries remains greater than 5m
• Changes in freshwater lens thickness compare to simulated natural conditions doesn’t exceed XX% at reference points (central monitoring locations where the lens is the thickest)
• XX
• XX
• XX
Review of new scenarios
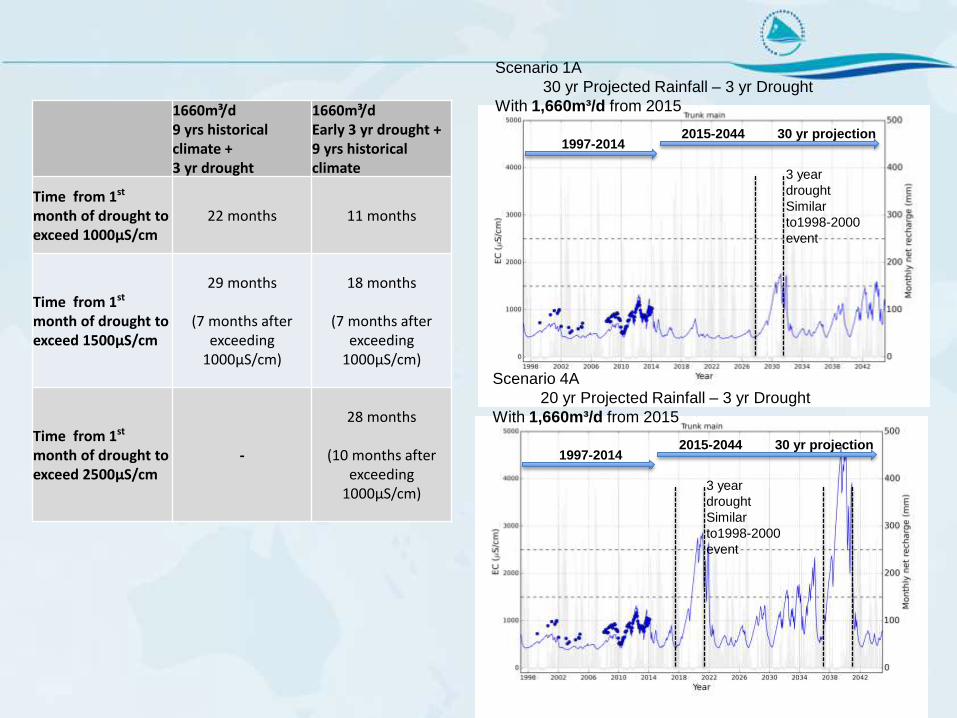
Scenario 1A
30 yr Projected Rainfall – 3 yr Drought
With 1,660m³/d from 2015
1997-2014 2015-2044 30 yr projection
3 year
drought
Similar
to1998-2000
event
Scenario 4A
20 yr Projected Rainfall – 3 yr Drought
With 1,660m³/d from 2015
1997-2014 2015-2044 30 yr projection
3 year
drought
Similar
to1998-2000
event
1660m³/d 9 yrs historical climate + 3 yr drought
1660m³/d Early 3 yr drought + 9 yrs historical climate
Time from 1st month of drought to exceed 1000μS/cm
22 months 11 months
Time from 1st month of drought to exceed 1500μS/cm
29 months
(7 months after
exceeding 1000μS/cm)
18 months
(7 months after exceeding
1000μS/cm)
Time from 1st month of drought to exceed 2500μS/cm
-
28 months
(10 months after
exceeding 1000μS/cm)
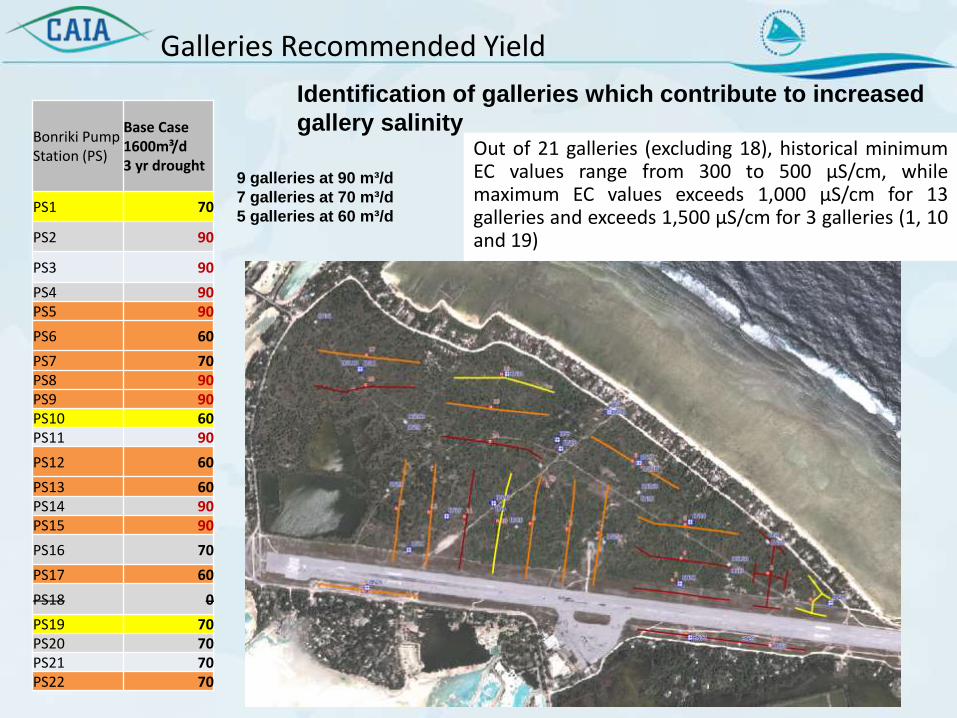
Bonriki Pump Station (PS)
Base Case 1600m³/d 3 yr drought
PS1 70
PS2 90
PS3 90
PS4 90 PS5 90
PS6 60
PS7 70 PS8 90 PS9 90 PS10 60 PS11 90
PS12 60
PS13 60 PS14 90 PS15 90
PS16 70
PS17 60
PS18 0
PS19 70 PS20 70 PS21 70 PS22 70
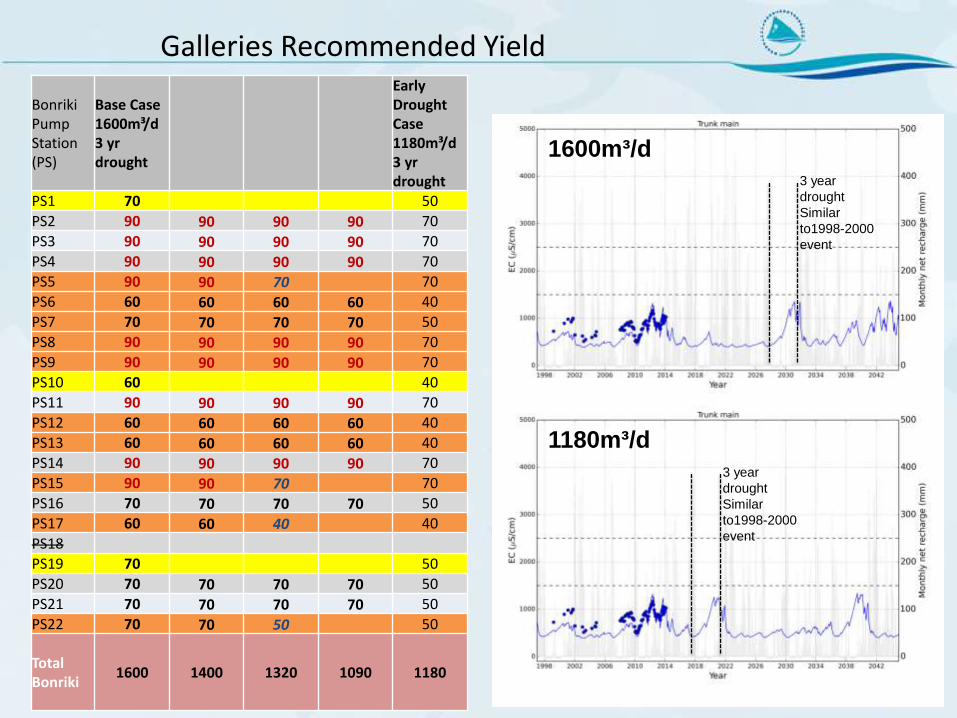
Galleries Recommended Yield
Out of 21 galleries (excluding 18), historical minimum EC values range from 300 to 500 μS/cm, while maximum EC values exceeds 1,000 μS/cm for 13 galleries and exceeds 1,500 μS/cm for 3 galleries (1, 10 and 19)
Identification of galleries which contribute to increased
gallery salinity
9 galleries at 90 m³/d
7 galleries at 70 m³/d
5 galleries at 60 m³/d
3 year
drought
Similar
to1998-2000
event
3 year
drought
Similar
to1998-2000
event
1600m³/d
1180m³/d
Bonriki Pump Station (PS)
Base Case 1600m³/d 3 yr drought
Early Drought Case 1180m³/d 3 yr drought
PS1 70 50
PS2 90 90 90 90 70
PS3 90 90 90 90 70
PS4 90 90 90 90 70
PS5 90 90 70 70
PS6 60 60 60 60 40
PS7 70 70 70 70 50
PS8 90 90 90 90 70
PS9 90 90 90 90 70
PS10 60 40
PS11 90 90 90 90 70
PS12 60 60 60 60 40
PS13 60 60 60 60 40
PS14 90 90 90 90 70
PS15 90 90 70 70
PS16 70 70 70 70 50
PS17 60 60 40 40
PS18
PS19 70 50
PS20 70 70 70 70 50
PS21 70 70 70 70 50
PS22 70 70 50 50 Total Bonriki
1600 1400 1320 1090 1180
Galleries Recommended Yield

Climate and Abstraction Impacts on Atoll Environments
Presenter: Peter Sinclair and Amandine Bosserelle
Wednesday 28 October 2015
Considerations for South Tarawa Drought Plan
Indicies and assignment of abstraction
– Current draft recommends
• Alert level 1 <40 percentile rainfall for 3months duration – (reflect rainfall tanks)
• Alert level 2 < 40 percentile rainfall for 5 year duration and/or impact to lens from salinity measurements at galleries of monitoring boreholes
• Alert level 3 <10 percentile rainfall for 5 year duration and or salinity at trunk main exceeds critical value 1,200uS/cm over 7 day average
• 5 year duration based on calculated residence time for Bonriki
water source
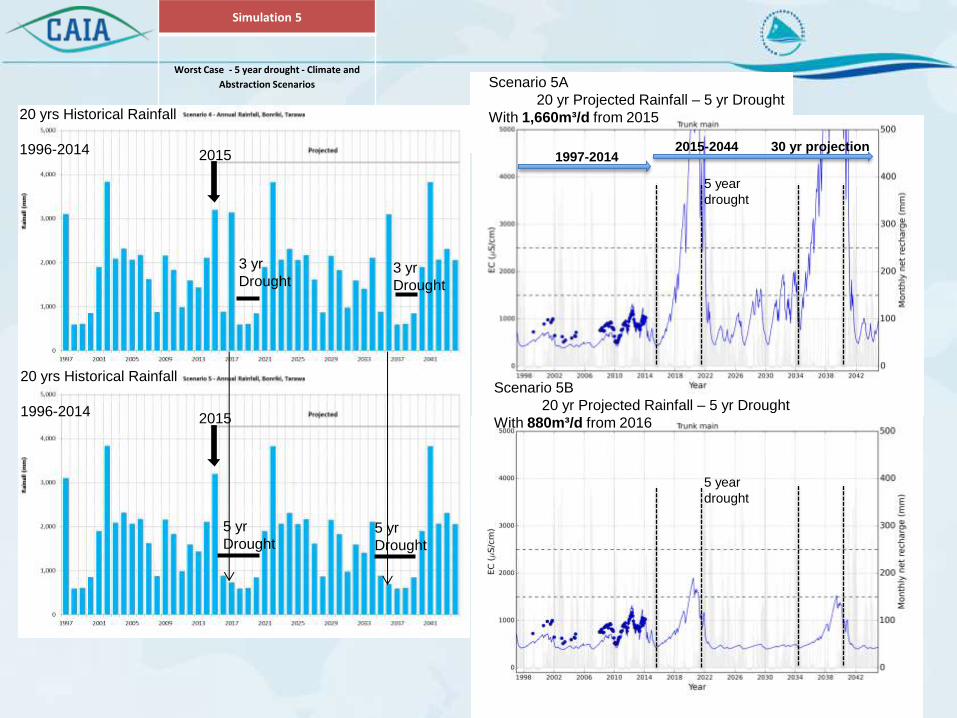
Scenario 5A
20 yr Projected Rainfall – 5 yr Drought
With 1,660m³/d from 2015
Scenario 5B
20 yr Projected Rainfall – 5 yr Drought
With 880m³/d from 2016
1997-2014 2015-2044 30 yr projection
5 year
drought
5 year
drought
Simulation 5
Worst Case - 5 year drought - Climate and
Abstraction Scenarios
3 yr
Drought
2015
20 yrs Historical Rainfall
1996-2014
3 yr
Drought
20 yrs Historical Rainfall
1996-2014
5 yr
Drought 5 yr
Drought
2015
Indicies
• Deterioration of salinity in gallery is a slower response than the recovery in salinity of gallery after rainfall,
• consider different indicies to better reflect the onground situation- avoid maintaining restrictions during wet periods, recognising that thickening of the water lens will take additional time
Assignment of abstraction
• Being able to assign abstraction for a defined period to respond to a change in salinity, rainfall, and freshwater lens status
• Consideration of rules that provide guidance
– How much to vary from the sustainable yield in a given year, or a given day?
– When it can vary, and for how long?
– Mechanism to vary – best to be incorporated in to a drought plan or separate policy, if seperate who would implement?
Next steps
• Additional information
– What expectations from govt for this work, where can it be best utilised
• Outputs from CAIA
– Agreement on sustainable yield
– Recommendations on an approach to vary abstraction and guidance on how this could be achieved
– Guidance from modelling results from specific scenarios
Next steps
• Linkages to other projects
– CoSPPAC,
– NZ water security
– Others?