Missing Persons Data Report 2016/2017
19
OFFICIAL OFFICIAL Missing Persons Data Report 2016/2017 The overall number of incidents recorded continues to rise, more so for children than for adults, with a greater proportion of incidents involving children attributable to repeat incidents than in previous years. 01 July 2019 Demand related to missing continues to rise This data comes from police forces in England & Wales, and reflects telephone calls made to them which are recorded on a command and control system. In a change to terminology, it should be noted that prior to 2013/14 these were reported as the incident figure. Missing children: incidents Missing adults: incidents Missing adults: individuals Missing children: individuals 12% 6% 21% 7% Change 16/17 on previous year
Transcript of Missing Persons Data Report 2016/2017

OFFICIAL
OFFICIAL
Missing Persons Data Report 2016/2017
The overall number of incidents recorded continues to rise, more so for children than for
adults, with a greater proportion of incidents involving children attributable to repeat
incidents than in previous years.
01 July 2019
Demand related to missing continues to rise
This data comes from
police forces in England &
Wales, and reflects
telephone calls made to
them which are recorded
on a command and
control system. In a
change to terminology, it
should be noted that prior
to 2013/14 these were
reported as the incident
figure.
Missing children:
incidents
Missing adults:
incidents
Missing adults:
individuals
Missing children:
individuals
12%
6%
21%
7%
Change 16/17
on previous year

OFFICIAL
OFFICIAL 2
Contents
1. Introduction ................................................................................................ 4
2. Key Statistics: Calls, incidents and individuals (Tables A1-A3, B1-B3) ................. 5
3. Repeat Missing (Tables B4,B5) ....................................................................... 6
4. Demographics (Tables C1-C10) ...................................................................... 7
Gender (Tables C1-C2, C4, C6, C8, C10) ............................................................... 7
Ethnicity (Tables C7-C10) .................................................................................... 9
5. Risk (Table D1) .......................................................................................... 10
6. Harm suffered (Tables E1-E3) ...................................................................... 12
7. Reason for missing episode (Table E4) .......................................................... 13
8. Length of time missing (Table E5) ................................................................ 14
9. Who finds missing people? (Table E6) ........................................................... 15
10. Missing from care (Tables F1, F2) ................................................................ 15
11. Unidentified individuals, bodies and remains (Tables G1, G2) .......................... 17
12. Data quality and limitations ......................................................................... 18
Incident data ................................................................................................... 18
Individual data ................................................................................................. 18
List of Figures
Figure 2.1: Key statistics for those reported missing in the UK in 2016-17 ................... 5
Figure 2.2: Calls and missing incidents recorded by the police in England and Wales 2012
– 2017 ................................................................................................................. 6
Figure 3.1: Proportion of missing reports attributable to repeats ................................. 6
Figure 4.1: Number of incidents and individuals recorded as missing across the UK ....... 7
Figure 4.2: Gender breakdown of those reported missing ........................................... 8
Figure 4.3: Missing and absent incidents by age group in England and Wales ............... 9

OFFICIAL
OFFICIAL 3
Figure 4.5: Ethnicity breakdown for those reported missing in England & Wales, Northern
Ireland and Scotland ........................................................................................... 10
Figure 5.1: Proportion of incidents/investigations by risk assessment for the UK ......... 11
Figure 5.2: Proportion of incidents by risk assessment including No Apparent Risk/Absent
......................................................................................................................... 11
Figure 6.1: Indication of harm suffered by adult and child incidents ........................... 12
Figure 8.1: Length of time missing for adult and children incidents for England and Wales
......................................................................................................................... 14
Figure 8.2: Length of time missing for adult and children incidents for Northern Ireland
......................................................................................................................... 15
Figure 9.1: Who missing people are found by ......................................................... 15
Figure 10.1: Incidents attributable to those missing from care .................................. 16
Figure 10.2: Reports attributable to repeat missing people by care status .................. 16
Figure 11.1: Number of unidentified cases found in 2016/17 reported to UKMPU by UK
police forces ....................................................................................................... 17

OFFICIAL
OFFICIAL 4
1. Introduction
This report provides key statistical data regarding missing people and unidentified
individuals/remains reported to UK police in the financial year 2016/17, where possible
identifying any trends in comparison with data received for the financial year 2015/161.
This is based on information supplied to the UK Missing Persons Unit (UKMPU) under the
2009 Code of Practice.2
In a change from previous years, the underlying data will be published in supporting
tables, rather than as Appendices to this report. This approach allows a greater set of
data to be released, allowing those interested to explore in more detail the data supplied
by UK Police.
In January 2017, the Authorised Professional Practice on Missing Persons was published
by the College of Policing; this is national guidance for police forces, and it amended the
definition of a missing person to:
Anyone whose whereabouts cannot be established will be considered as missing
until they have been located, and their well-being or otherwise confirmed.3
Prior to this, national guidance distinguished between a report of a missing person4, and
someone deemed to be absent5. Those deemed to be missing were then assessed and
classified as low, medium or high risk, with the police response tailored according to this
risk assessment. The revision of the definition in January 2017, meant that all reports
were to be classified as missing, with a four tier risk continuum, incorporating ‘no
apparent risk (absent)’ as a fourth and lowest risk classification.
As this change was introduced late in the reporting year, this publication continues to
distinguish between missing and absent reports. Adoption of the revised definition of a
missing person has varied across the police forces, and it should be noted that prior to
the change a number of forces had already chosen not to use, or had stopped using,
absent as a separate category. This change and the variation in practice across the
country should be borne in mind when comparing data between different forces, and
with data reported from previous years.
Additionally, due to differences in the way in which Police Scotland records data for
missing persons, its information has been separated from the call data for England and
Wales for 2016/17. This is also the first year that the Police Service for Northern Ireland
has been able to provide data for inclusion in the report.
1 National Crime Agency (2017) Missing Person Data Report 2015/2016.Available at:
http://missingpersons.police.uk/en-gb/resources/downloads/missing-person-statistical-bulletins 2 National Policing Improvement Agency (2009) Code of Practice for the Police Service on the Collecting and
Sharing of Data with Public Authorities. The code establishes minimum standard in relation to timeliness, quantity and quality of data submissions by police forces to UKMPU for the purposes of, inter alia, collecting data on missing persons investigations, developing strategic assessments and publishing statistical bulletins. 3 The Authorised Professional Practice is accessible at: http://www.app.college.police.uk/app-content/major-investigation-and-public-protection/missing-persons/ 4 A missing person was classified as: “Anyone whose whereabouts cannot be established and where the
circumstances are out of character or the context suggests the person may be subject of crime or at risk of harm to themselves or another.” 5 An absent person was classified as “A person not at a place where they are expected or required to be and
there is no apparent risk.”

OFFICIAL
OFFICIAL 5
2. Key Statistics: Calls, incidents and individuals6 (Tables A1-A3, B1-B3)
Figure 2.1: Key statistics for those reported missing in the UK in 2016-17
Although it is not possible to comment on trends for Northern Ireland or Scotland7, there
has continued to be an increase in the number of missing-related calls received by police
in England and Wales, with a substantial increase in the number of missing incidents
recorded since 2015/16; 124 more recorded per day. This trend is also reflected in the
number of individuals recorded as missing, with 37 more per day. However, this increase
is proportionately smaller, indicating an increase in the proportion of reports received
relating to repeat missing episodes. This increase has largely been driven by an increase
in the number of children8 reported missing more than once, as shown in the section on
repeated missing below. It is not possible to state whether this indicates an increase in
the number of children who go missing on more than one occasion, or if a similar
number of children are going missing a greater number of times.
6 Calls refer to telephone calls to the police relating to a missing or absent person, recorded on a command and control system. Multiple calls may relate to a single incident, or a call may relate to multiple different incidents/individuals. Incidents refer to a single episode of someone being reported as missing or absent. Multiple incidents may be attributable to a single individual, and some incidents may involve more than one individual. 7 Police Service for Northern Ireland refer to their records as missing person reports, and Police Scotland as missing person investigations – these are deemed to be similar but not directly comparable to the incidents created on the police recording systems in England and Wales. 8 For the purposes of this report, a child includes anyone under the age of 18.
387,930
calls
recorded
by police in
England
and Wales
286,763
missing
incidents across
43 police forces
41,927
absent
incidents across
30 police forces
786 per day
115 per day
21,989
missing investigations
in Scotland6
60 per day
12,821
missing reports
in Northern Ireland6
35 per day
147,859
missing
individuals
20,392
absent
individuals
5,643
missing
individuals
12,071
missing
individuals 4.1 missing
investigations
per 1,000
population
6.9 missing
reports per
1,000 population
4.9 missing
incidents per
1,000 population
0.7 absent
incidents per
1,000 population
405
per day
33
per day
16
per day
56
per day
OFFICIAL
OFFICIAL 6
It should also be noted that this trend is not observed for all police forces in England and
Wales, with some reporting a decline in the number of calls, incidents and/or individuals
recorded as missing.
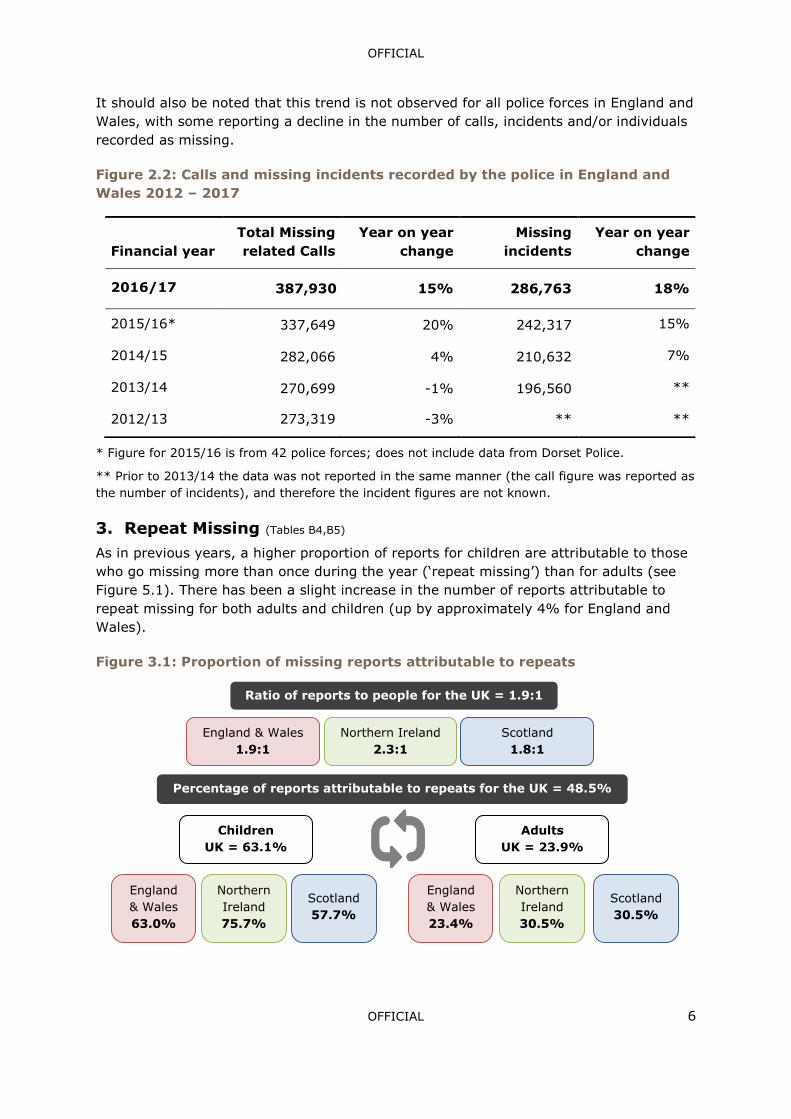
Figure 2.2: Calls and missing incidents recorded by the police in England and
Wales 2012 – 2017
* Figure for 2015/16 is from 42 police forces; does not include data from Dorset Police.
** Prior to 2013/14 the data was not reported in the same manner (the call figure was reported as
the number of incidents), and therefore the incident figures are not known.
3. Repeat Missing (Tables B4,B5)
As in previous years, a higher proportion of reports for children are attributable to those
who go missing more than once during the year (‘repeat missing’) than for adults (see
Figure 5.1). There has been a slight increase in the number of reports attributable to
repeat missing for both adults and children (up by approximately 4% for England and
Wales).
Figure 3.1: Proportion of missing reports attributable to repeats
Financial year
Total Missing
related Calls
Year on year
change
Missing
incidents
Year on year
change
2016/17 387,930 15% 286,763 18%
2015/16* 337,649 20% 242,317 15%
2014/15 282,066 4% 210,632 7%
2013/14 270,699 -1% 196,560 **
2012/13 273,319 -3% ** **
Ratio of reports to people for the UK = 1.9:1
Children
UK = 63.1%
Percentage of reports attributable to repeats for the UK = 48.5%
Adults
UK = 23.9%
England & Wales
1.9:1
Northern Ireland
2.3:1
Scotland
1.8:1
England
& Wales
63.0%
England
& Wales
23.4%
Northern
Ireland
75.7%
Northern
Ireland
30.5%
Scotland
57.7%
Scotland
30.5%

OFFICIAL
OFFICIAL 7
4. Demographics (Tables C1-C10)
Across nearly all UK forces9, a greater number of incidents relate to children who go
missing than adults (63% and 37% respectively), although this is more pronounced for
England, Wales and Scotland than it is for Northern Ireland. However some people go
missing more than once, and this appears to be more likely for children, with only 45%
of individuals recorded being children.
Figure 4.1: Number of incidents and individuals recorded as missing across the
UK (n=45 forces)
This reflects a greater year on year rise in the number of adults being reported missing
in England and Wales, up 16% since 2014/15, compared with only 2% for children.
Gender (Tables C1-C2, C4, C6, C8, C10)
As in previous years, more men and boys go missing (161,983; 53.9%), a pattern
evident for Northern Ireland (7,137; 55.7%) and Scotland (12,283; 55.9%) as well as
England and Wales (142,563; 53.6%). For England and Wales, it remains true that this
pattern reverses for children aged 12-17, with more girls reported missing (76,370;
51.9%) than boys (70,168; 47.7%), but this does not appear to be the case in Northern
Ireland, where a similar number of boys were reported missing (3,352; 49.8%)
compared with girls (3,302; 49.0%); Police Scotland is not able to provide this level of
breakdown.
Men aged 22-39 remain over represented. In England and Wales, 43.9% (24,409) of
adult males reported missing were aged 22-39, compared with 34% of the general adult
population. Similarly in Northern Ireland, this age-group made up 31% of the general
adult male population, but comprised 45.6% (1,610) of those reported missing.
9 The exception is the City of London Police, who reported 84 incidents relating to adults, and only 18 incidents
relating to children.

OFFICIAL
OFFICIAL 8
Of the relatively small number of reports relating to trans10 individuals (349), nearly
three quarters were children aged 15-17 (200; 72.5%); the next largest age group was
those aged 22-39 (35; 12.7%).
Figure 4.2: Gender breakdown of those reported missing
*It should be noted that the incident figure is lower than that shown in figure 4.1 due to the
information supplied by Bedfordshire and Lincolnshire Police coming from a different system
(COMPACT), in order to be able to provide the more detailed breakdown.
Age (Tables B2-B3, C3-C6)
Forty three forces in England, Wales and Northern Ireland provided a full demographic
breakdown of those reported missing. This showed that children aged 12-17 continue to
be responsible for the majority of reports (55.8%). Of 31 forces using the absent
10 The term ‘trans’ is used throughout the report to describe the full spectrum of people who do not identify
themselves as either male or female.
300,613* missing reports in England and Wales, Northern Ireland and Scotland
0.1% (349)
trans
0.8%
(2,488)
unknown
57.8% (81,131)
Under 18
42.1% (59,069)
Over 18
0.1%
(178)
Unknown
69.3% (82,964)
Under 18
30.6% (36,618)
Over 18
0.1%
(130)
Unknown
76.8% (212)
Under 18
23.2% (64)
Over 18
41.3%
(706)
Under 18
41.5%
(709)
Over 18
17.2%
(293)
Unknown
262,136
missing reports in England, Wales and Northern Ireland
45.2%
(135,793)
females 53.9%
(161,983)
males
OFFICIAL
OFFICIAL 9
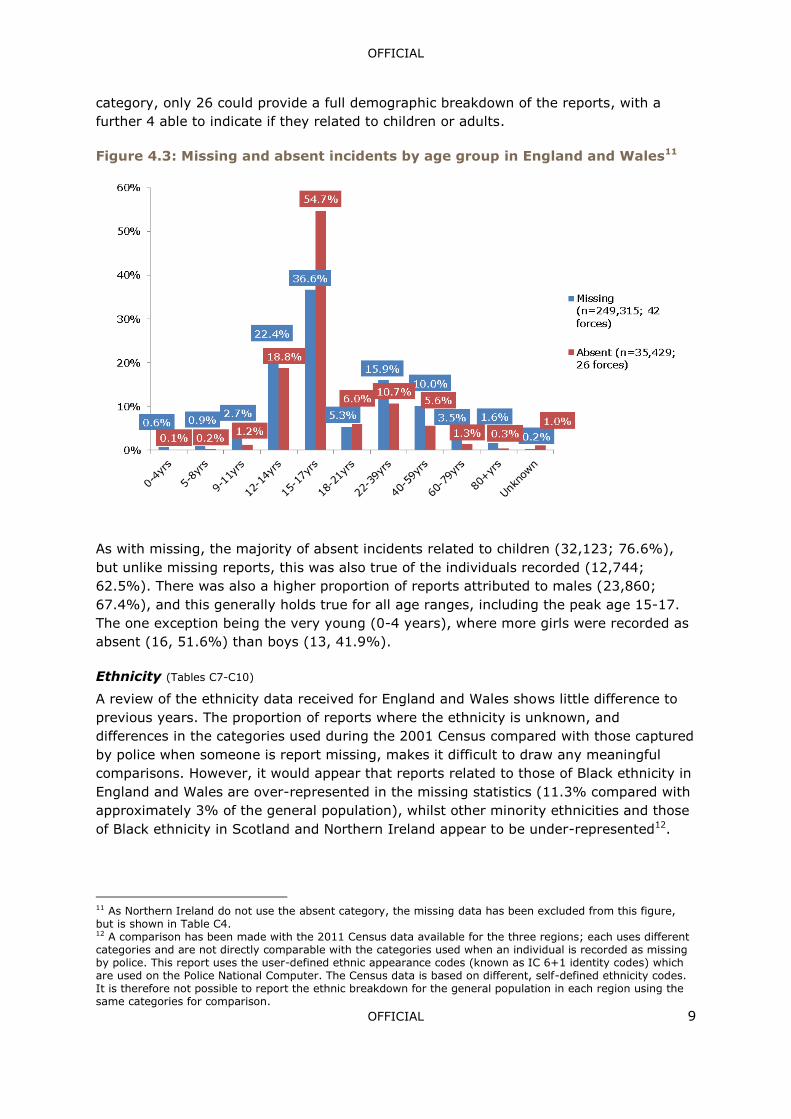
category, only 26 could provide a full demographic breakdown of the reports, with a
further 4 able to indicate if they related to children or adults.
Figure 4.3: Missing and absent incidents by age group in England and Wales11
As with missing, the majority of absent incidents related to children (32,123; 76.6%),
but unlike missing reports, this was also true of the individuals recorded (12,744;
62.5%). There was also a higher proportion of reports attributed to males (23,860;
67.4%), and this generally holds true for all age ranges, including the peak age 15-17.
The one exception being the very young (0-4 years), where more girls were recorded as
absent (16, 51.6%) than boys (13, 41.9%).
Ethnicity (Tables C7-C10)
A review of the ethnicity data received for England and Wales shows little difference to
previous years. The proportion of reports where the ethnicity is unknown, and
differences in the categories used during the 2001 Census compared with those captured
by police when someone is report missing, makes it difficult to draw any meaningful
comparisons. However, it would appear that reports related to those of Black ethnicity in
England and Wales are over-represented in the missing statistics (11.3% compared with
approximately 3% of the general population), whilst other minority ethnicities and those
of Black ethnicity in Scotland and Northern Ireland appear to be under-represented12.
11 As Northern Ireland do not use the absent category, the missing data has been excluded from this figure, but is shown in Table C4. 12 A comparison has been made with the 2011 Census data available for the three regions; each uses different categories and are not directly comparable with the categories used when an individual is recorded as missing by police. This report uses the user-defined ethnic appearance codes (known as IC 6+1 identity codes) which are used on the Police National Computer. The Census data is based on different, self-defined ethnicity codes. It is therefore not possible to report the ethnic breakdown for the general population in each region using the same categories for comparison.

OFFICIAL
OFFICIAL 10
As in previous years, there are more males reported in each group except for the
Chinese, Japanese and South East Asian population, where more females than males
were recorded as missing.
Data from the 27 English and Welsh forces able to supply it, shows a similar ethnic
distribution amongst those recorded as absent, although a slightly higher proportion
were IC0 – other/unknown (6,250; 17.6%).
Figure 4.5: Ethnicity breakdown for those reported missing in England & Wales,
Northern Ireland and Scotland (n=44 forces*)
Ethnicity coding England & Wales Northern Ireland Scotland
Totals % Totals % Totals %
IC1 White – N. European 168,607 67.6 11,788 91.9 17,717 80.6
IC2 White – S. European 6,949 2.8 0 0 0 0
IC3 Black 28,253 11.3 95 0.7 83 0.4
IC4 Asian 10,953 4.4 73 0.6 158 0.7
IC5 Chinese, Japanese &
SE. Asian 944 0.4 11 <0.1 9 <0.1
IC6 Middle Eastern 2,184 0.9 0 0 0 0
IC0 Other/Unknown 31,425 12.6 854 6.7 4,022 18.3
Total 249,315 12,821 21,989
*Greater Manchester Police is unable to provide this detail.
5. Risk (Table D1)
Although a new four tier risk continuum was introduced in the UK part way through
2016/17, this was late in the reporting year, and as many police forces had not
implemented this change by end of March 2017, it was felt appropriate to report on the
breakdown of incidents by the three tier risk assessment in place prior to January 2017.
This also allows the data from Northern Ireland and Scotland to be considered alongside
the data from England and Wales for the first time. This shows that as in previous years,
and for all areas of the UK, the majority of reports were categorised as medium risk (see
Figure 5.1).
42 police forces in England and Wales were able to provide this information
(n=229,840), and had the highest proportion of high risk incidents (14.0%) compared
with Northern Ireland (6.9%) and Scotland (10.3%). Scotland had the highest
proportion of low risk cases (18.2%) compared with England and Wales (8.3%) and
Northern Ireland (7.4%).
It should be noted that both Northern Ireland and Scotland reported figures for cases
that had not been graded, often due to the report being closed before an assessment
had been completed (1,784 and 7,492 respectively). It is not possible to determine the
level of ungraded reports for England and Wales due to inconsistencies in the information
provided.

OFFICIAL
OFFICIAL 11
Figure 5.1: Proportion of incidents/investigations by risk assessment for the UK
(n=44 forces)
Whilst the level of investigation depends on the circumstances of the case, and the risk
assessment applied may change during an investigation in order to take into account
evolving information13, it is estimated that a medium risk, medium term missing person
investigation costs between £1,325.44 - £2,415.8014. This equates to a cost of between
£263m and £480m to the UK forces for 2016/17 (based on recording 198,702 medium
risk investigations).
For the 3315 forces using the Absent and/or No Apparent Risk category, it appears that
the majority of reports were still classified as medium risk (63.4%). However, there was
significant variation across the forces, with some recording less than 1% as No Apparent
Risk/Absent whilst another force used this classification in nearly half of their cases
(47.8%).
Figure 5.2: Proportion of incidents by risk assessment including No Apparent
Risk/Absent (n=33 forces)
13 Police forces were requested to send the ‘closing’ risk assessments data for this 2015/16 report. 14 Shalev-Greene, K. and Pakes, F. (2012) Establishing the Cost of Missing Person Investigations (page 3). 15
Avon and Somerset Constabulary’s data has been excluded from the summary as it reported that three
quarters of the reports were classified as No Apparent Risk, but contact with the force indicates these may be cases where no risk assessment was recorded, due to the case being concluded without a risk assessment having been completed.

OFFICIAL
OFFICIAL 12
6. Harm suffered (Tables E1-E3)
Twenty five police forces in England and Wales have provided an indication of the harm
suffered by those reported missing. This information is subject to the assessment of the
officer at the time the report is closed. This does not take into account harm that may
only come to light at a later date, for example, during an independent return home
interview which must be offered to all children in England16, and is generally conducted
by a third party some time after the missing report itself has been closed. It is possible
the level of harm suffered is likely to be higher than that indicated in the data reported.
Additionally, officers may endorse more than one outcome, making it difficult to
determine what proportion of reports result in harm of any kind. It is also evident that
whether the individual suffered any form of harm is not accurately recorded for all
incidents, as the total number of reported outcomes is less than the number of incidents
reported from these forces. Therefore this should be considered only as indicative of the
risk to those who go missing.
Due to changes in the way in which data received is interpreted, the figures presented
are not directly comparable with previous reports. Percentages reported relate to
percentage of all missing incidents recorded by the forces who have contributed this
data; n=102,404 (children = 68,090; adults = 34,314). As it has not been possible to
obtain figures for how many incidents remained unresolved as at 31 March 2016, it is
not possible to confirm how many incidents actually resulted in some harm (as known at
the time of closure) or remain outstanding.
As in previous years, a majority of reports appear to result in no known harm to the
individual (96,698; 94.4%), with less than 1% resulting in a fatal outcome (341, 0.3%).
This suggests that around 6 per cent of cases (5,706) either resulted in some form of
harm, or the individual had not been located by the 31st April 2017.
Adults appear to be more likely to come to harm or remain missing (8.7%) compared to
children (4.0%) and accounted for 94 per cent of the fatal outcomes (321; in 15 cases
the age of the individual is not known). Adults were more likely to experience all forms
of harm except for sexual offences (see Figure 6.1).
Additionally, 16 police forces unable to provide the more detailed harm breakdown
provided data on the number of fatal outcomes, to give a total of 593 for 2016/17 in
England and Wales (compared with 599 in 2015/16). The Police Service of Northern
Ireland also reported 27 fatalities, all of which were adults, and Police Scotland reported
91 fatalities (ages unknown).
16 This is a requirement within the Department for Educations statutory guidance on those who go missing from home and care; this can be accessed at: https://assets.publishing.service.gov.uk/government/uploads/system/uploads/attachment_data/file/307867/Statuotory_Guidance_-_Missing_from_care_3_pdf

OFFICIAL
OFFICIAL 13
Figure 6.1: Indication of harm suffered by adult and child incidents (n=24
forces)
7. Reason for missing episode (Table E4)
As with the above harm data, this information is taken from the assessment made by
the officer at the time the report is closed, and more than one category can be selected.
The data is supplied by the 22 police forces using the COMPACT case management
system17, and it should be noted that police forces using later versions of the system
have a greater number of options available to select.
As in previous years, the reason chosen for a significant proportion of reports (54%) was
‘unknown’ (10,363), ‘declined’ (6,564), ‘unspecified’ (13) or ‘other’ (40,805). It appears
that children were less likely to provide a clear reason for going missing than adults
(65% classed one of the four categories, compared with 36% for adults). As in previous
years, these reports have been removed to assist review of the cases where a reason
was endorsed.
Health (physical and mental) remains a significant factor, accounting for over three
quarters of the reports for adults (19,653; 78.8%) but only 28.7% of reports for
children (6,752).
17
COMPACT is a missing person case management system currently used within 22 police forces.
No Known Harm
96,698 (94.4% of incidents)
Children
65,370
(96.0% of
incidents)
Adults
31,328
91.3% of
incidents)
Suffered harm or not found
5,706 (5.6% of incidents)
Children
2,720
(4.0% of
incidents)
Adults
2,986
(8.7% of
incidents)
Sexual offence
199
(0.3% of incidents)
Physical injury
569
(0.8% of incidents)
Self harm
352
(0.5% of incidents)
Accidental injury
107
(0.2% of incidents)
Emotional harm
86
(0.1% of incidents)
Fatal outcome
5
(0.01% of incidents)
Sexual offence
68
(0.2% of incidents)
Physical injury
816
(2.4% of incidents)
Self harm
1,221
(3.6% of incidents)
Accidental injury
252
(0.7% of incidents)
Emotional harm
89
(0.3% of incidents)
Fatal outcome
321
(0.9% of incidents)
Unspecified
326*
(0.9% of
incidents)
Unspecified
1,369*
(2.0% of
incidents)
*Only reported by Cheshire and Cumbria

OFFICIAL
OFFICIAL 14
There was a similar incidence of accidental causes for children and adults, with 1,720
reports for children (7.3%) and 2,035 reports for adults (8.2%) attributed to ‘lost’,
‘disoriented’, or ‘misunderstanding’.
The number of reports indicating female genital mutilation or terrorist causes has
grown, although are still rare (10 and 24 respectively, up from 2 and 7 in 2015/16),
and there has been a substantial increase in the number of reports categorised as
‘gang related’ (287 compared with 81 in 2015/16). It is suspected this is due to
greater recognition of county line activity18.
There has also been a significant increase in the number of reports categorised as
‘Asylum Seeker’ or ‘Unaccompanied Juvenile’, with 4,924 reports compared with
1,368 in 2015/16, of which 4,870 relate to children.
8. Length of time missing (Table E5)
More police forces have been able to supply data indicating the length of time the person
was missing than in the previous year, with 31 supplying data. This is based on
incidents, and indicates a slight increase in the length of time people are missing, with
only 73 per cent being resolved within 24 hours, compared with 79 per cent in 2015/16.
Figure 8.1: Length of time missing for adult and children incidents for England
and Wales (n=31 forces)
For the first time we also have data from Northern Ireland, showing that their missing
cases are generally resolved more quickly, with 88 per cent resolved within 24 hours.
18
‘County Lines’ is a term used when drug gangs from big cities expand their operations
to smaller towns, often using violence to drive out local dealers and exploiting children
and vulnerable people to sell drugs. See http://nationalcrimeagency.gov.uk/countylines
for more information.
NB. There were 8 incidents reported where the time missing wasn’t specified, and 10 where the age of the person wasn’t known.
OFFICIAL
OFFICIAL 15
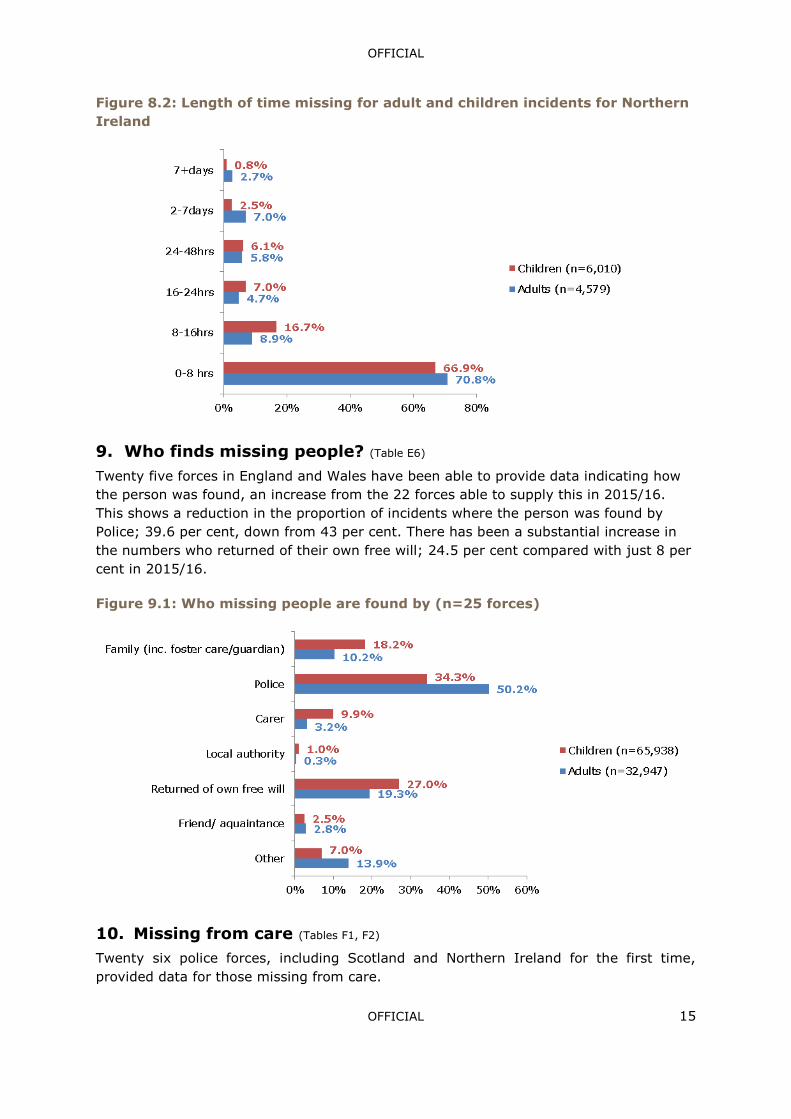
Figure 8.2: Length of time missing for adult and children incidents for Northern
Ireland
9. Who finds missing people? (Table E6)
Twenty five forces in England and Wales have been able to provide data indicating how
the person was found, an increase from the 22 forces able to supply this in 2015/16.
This shows a reduction in the proportion of incidents where the person was found by
Police; 39.6 per cent, down from 43 per cent. There has been a substantial increase in
the numbers who returned of their own free will; 24.5 per cent compared with just 8 per
cent in 2015/16.
Figure 9.1: Who missing people are found by (n=25 forces)
10. Missing from care (Tables F1, F2)
Twenty six police forces, including Scotland and Northern Ireland for the first time,
provided data for those missing from care.

OFFICIAL
OFFICIAL 16
It should be noted that definitions of a child in care and an adult in care applied may
differ to statutory definitions across the UK, as police reports are based on an officer’s
assessment and dependent on police force guidelines and training received.
For the purposes of this report, ‘missing from care’ refers to reports where an officer has
endorsed the child/adult as being ‘in care’, or where the address the person is missing
from is known to be a residential care unit (including psychiatric care). This may
therefore include individuals in a range of care situations, including those living in
children’s homes, in foster care, those living with parents/guardians in family homes, in
health placements and in care homes or nursing homes.
Figure 10.1: Incidents attributable to those missing from care (n=26 UK forces)
A smaller number of forces (23 including Northern Ireland) were able to provide data for
the number of individuals as well as the number of incidents for those missing from care,
which shows that those missing from care are significantly more likely to go missing
more than once.
Figure 10.2: Reports attributable to repeat missing people by care status (n=23
forces)
5,449 incidents
involving adults missing
from care
44,291 incidents
involving children
missing from care
45.5% of
missing
children
incidents
10.3% of
missing
adult
incidents
88.3% of missing from
care incidents involved
children
Ratio of reports to people = 2.0:1
Missing from care
4.8:1
Not missing from care
1.5:1
Missing from care
79.2%
Percentage of reports attributable to repeats = 49.6%
Not missing from care
35.2%
Children
83.9%
Adults
41.8%
Children
49.4%
Adults
18.8%

OFFICIAL
OFFICIAL 17
11. Unidentified individuals, bodies and remains (Tables G1, G2)
UKMPU collects information from police forces on individuals who are found alive but
cannot be immediately identified. These individuals may be unable to provide personal
details at the time of being found for reasons such as injuries sustained or medical
conditions, e.g. amnesia or dementia. Information is also collected from police forces
and coroners on unidentified deceased bodies and remains (body parts), and from
overseas law enforcement agencies where it is believed there may be a link to the UK.
The UKMPU stores this information on its database, Hermes, and uses it, together with
details of missing person reports to cross match (link) the missing and the found.
There has been a slight decrease in the number of cases reported to the UKMPU, with 66
unidentified cases recorded for UK police forces in 2016/17, a reduction of 15 from
2015/16. No cases were suspected to be children, although in 9 cases (4 bodies and 5
partial remains) only a very broad age range was specified (e.g. 1-100) which meant
this could not be ruled out. A similar number of international cases were recorded (10
compared with 11 the previous year).
Figure 11.1: Number of unidentified cases found in 2016/17 reported to UKMPU
by UK police forces
At the 31 March 2017, the UKMPU held a total of 913 unidentified cases from across the
UK. This includes 734 bodies, 124 body parts and 61 alive individuals. This is a
decrease in comparison to the 2015/16 total of 925. Including cases notified from the
Crown Dependencies, Ministry of Defence Police and those found overseas, the UKMPU
maintains details of 1,234 unresolved unidentified cases.
45 bodies 10 alive individuals 11 partial remains
42
males
3
females
4
female
5
women
5
male
5
men
2 unknown Unresolved (as
of 1 April 2017)
6 partial
remains 13
bodies
2 alive
individuals

OFFICIAL
OFFICIAL 18
12. Data quality and limitations
This report has been produced to provide a detailed assessment of missing person cases,
including absent, for the financial year 2016/17, where possible identifying any trends in
the data in comparison with data received for the financial year 2015/16.19
The data used has been taken from both police force command and control and missing
person case management systems. For the first time data has been obtained from all 45
UK territorial police forces across England, Wales, Northern Ireland and Scotland. A
variety of recording systems and practices are used, restricting the opportunity to
compare data across police forces, for example, not all use the absent category and the
interpretation of the absent definition differs across police forces, making it difficult to
compare data directly.
Whilst every effort has been taken to standardise the reporting of data to UKMPU to
allow year-on-year comparisons, changes to recording practices in some police forces
mean that year-on-year comparisons should be considered with caution. Additionally,
understanding of the nature of the data has improved, in some instances leading to
changes in the way it is reported. This includes introduction of ‘call data’ in 2013/14, in
recognition of the nature of the data previously reported as ‘incident data’ for 2011/12
and 2012/13.
The primary issue with the data supplied was that on some occasions it was incomplete,
this was mainly due to varying IT systems being unable to generate all the data
requested. Greater Manchester Police and Police Scotland could not provide a breakdown
of gender and age or for ethnicity; this limits the ability to draw comparisons and
identify national trends.
Incident data
For a small number of police forces, the number of incidents is higher or equal to the
number of calls received. This will partly be due to calls to the police which involve the
reporting of more than one person as missing at the same time. However, it will also be
due to the manner in which data is extracted from a command and control system.
Command and control systems use ‘opening’ and ‘closing’ codes for all occurrences,
including missing persons. An opening code reflects information received at the time of a
first call to the police, whereas a closing code reflects final information acquired during
the course of the whole occurrence/incident. Searching data by using one or other code,
or both codes, may produce different results. As an example, an incident may have an
opening code of ‘absent’ but then be closed as ‘missing’. UKMPU requests that closing
codes only are used to report data.
Individual data
Data used in this report is provided to UKMPU under a statutory code of practice.20 The
code requires the provision of quarterly data returns to aid collation of the relevant
information. In this report the four quarters’ call and incident figures have been added
together to produce annual call and incident figures. The majority of police forces have
19 National Crime Agency (2017) Missing Person Data Report 2015/2016. 20
National Policing Improvement Agency (2009) Code of Practice for the Police Service on the Collecting and
Sharing of Data with Public Authorities.

OFFICIAL
OFFICIAL 19
been able to provide annual figures for individuals recorded as missing, which will
exclude duplicates recorded across the quarters. However, three police forces have only
been able to provide quarterly data which has been summed to show an annual figure.
This summing means there may be some duplication within the individual figure, while
the extent of this is likely to be minimal, based upon comparisons with other police
forces’ data, it cannot be estimated reliably. In 2017, a decision was taken to only collect
data on an annual basis, which should remove this issue for future reports.
It is also possible there is some duplication of reports across police force areas. Part of
this duplication may be due to the collection of information about missing and absent
children in out of area placements (i.e. care placements outside a young person’s home
local authority). The level of duplication is assessed as having the potential to produce
some over- and under-estimates in the report, and is particularly relevant to the missing
from care section of this report.