Misbehavior, Suspensions, and Security Measures in...
63
Misbehavior, Suspensions and Security 1 Misbehavior, Suspensions, and Security Measures in High School: Racial/Ethnic and Gender Differences Jeremy D. Finn The University at Buffalo – SUNY Timothy J. Servoss Canisius College December 26, 2012 Work on this paper was supported in part by a grant from the Spencer Foundation entitled High School Regulatory Environment, Student Perceptions, and Dropping Out.
Transcript of Misbehavior, Suspensions, and Security Measures in...
Misbehavior, Suspensions and Security
1
Misbehavior, Suspensions, and Security Measures in High School:
Racial/Ethnic and Gender Differences
Jeremy D. Finn
The University at Buffalo – SUNY
Timothy J. Servoss
Canisius College
December 26, 2012
Work on this paper was supported in part by a grant from the Spencer Foundation entitled High
School Regulatory Environment, Student Perceptions, and Dropping Out.

Misbehavior, Suspensions and Security
2
Abstract
This study used merged data from three national surveys to address questions about security
measures in American high schools, suspension rates, and student misbehavior. First, the study
identified the characteristics of schools that implemented the most extreme security measures
and those with the highest levels of discipline. Second, the study used data on individual students
to examine misbehavior and race and gender disparities in suspensions not attributable to
misbehavior. The main findings were: (1) In-school suspensions serve a ‘gateway’ function with
regard to out-of-school suspensions. They may provide a time and place to address behavior
problems before they escalate or disproportionate out-of-school suspensions before they occur;
(2) Out-of-school suspensions were more frequent among schools in higher-crime
neighborhoods. Thus students suspended may be relegated to an environment not conducive to
positive educational or social outcomes; (3) African-American students and Hispanic/Latino
students were suspended at higher rates than were non-Hispanic whites, differences in most cases
not attributable to different levels of misbehavior; (4) Overall, males were more likely to be
suspended than were females, an effect above and beyond that explained by differences in
behavior. There was little or no difference in the suspension rates of black males and females,
however; (5) High degrees of school security were associated with increased suspension rates
and increased black – white disparities in total suspensions. At the same time, most black
students were enrolled in schools with high degrees of security; (6) Black males were suspended
at higher and higher rates as school size increased.
All of these have implications for school policy and practice. These are discussed in the
paper together with limitations of the investigation.

Misbehavior, Suspensions and Security
3
Misbehavior, Suspensions, and Security Measures in High School:
Racial/Ethnic and Gender Differences
Proponents of high security and strict disciplinary codes in American high schools argue
that they make schools safer and create an orderly environment for learning. But the same
practices can also create ‘prison like’ conditions that make some students feel ill at ease and
others aware that serious misconduct may occur at any time (Brooks, Schiraldi, & Zeidenberg,
2000). The result can be feelings of defensiveness on the part of students, accompanied by
emotional and physical disengagement from school. And some students may be affected more
than others, for example, males, minorities, students who perceive teachers as unwelcoming or
unfriendly, or students who have been disciplined for any major or minor infraction (see Ma,
2003; McNeely et al., 2002; Skiba, Michael, Nardo, & Peterson, 2002).
This research examined the relationships among student misbehavior, suspensions, and
security measures in a nationwide sample of high schools. The purpose was two-fold: first, to
identify the characteristics of schools that implemented the most invasive security measures. We
asked whether these schools were the largest, had the highest proportion of at-risk students, and
whether they were located primarily in urban or high-crime neighborhoods. We also asked if
high security in a school was related to increased suspension rates, thus depriving students of
continuous instruction and increasing their sense of alienation.
Next, we examined conditions related to racial/ethnic and gender inequities in
suspensions, focusing on the role of school security and students’ misbehavior. We asked
whether two students who exhibit the same levels of misbehavior but one is black and one white,
or one male and one female, would be more likely to be suspended because of race or gender.

Misbehavior, Suspensions and Security
4
Further, we asked whether inequitable practices were more common in schools with certain
characteristics, for example, larger or smaller schools, schools serving a large number of
minority students or students from low-income families. Because in-school and out-of-school
suspensions represent different exclusionary practices, we considered both.1
The study used national surveys of 10th
grade students and their schools. The main
findings were: 2
In-school suspensions serve a ‘gateway’ function with regard to out-of-school
suspensions. They may provide a time and place to address behavior problems before
they escalate or disproportionate out-of-school suspensions before they occur;
Out-of-school suspensions were more frequent among schools in higher-crime
neighborhoods. Thus students may be relegated to an environment not conducive to
positive educational or social outcomes;
African-American students and Hispanic/Latino students were suspended at higher rates
than were non-Hispanic whites, differences in most cases not attributable to different
levels of misbehavior;
Overall, males were more likely to be suspended than were females, an effect above and
beyond that explained by differences in behavior. There was little or no difference in the
suspension rates of black males and females, however;
High degrees of school security were associated with increased suspension rates and
increased black – white disparities in total suspensions. At the same time, most black
students were enrolled in schools with high degrees of security;
1 Out-of-school suspensions and total suspensions (in-plus-out) were considered in our analysis.
2Elaboration and policy recommendations in “Summary and Recommendations” section.

Misbehavior, Suspensions and Security
5
Black males were suspended at higher and higher rates as school size increased. This
finding is consistent with prior research showing behavioral and attitudinal benefits of
small schools.
Suspensions, Race and Gender
In theory, suspending a student from class or school serves two purposes: as punishment
for misbehavior intended to deter further misconduct on his/her part or that of others, and to
preserve orderliness and safety in the school setting. In the extreme, suspending or expelling a
student from school is necessary for the welfare of others. But suspending a student from a
school is a discretionary act that often fails to deter—or may even encourage—further
misconduct.
The educational consequences of suspensions can be serious. Absence for any reason
interferes with learning, an effect accentuated among students having academic or behavior
difficulty (Balfanz & Byrnes, 2012; Blum, Beuhring, & Rinehart, 2000; Fabelo et al., 2011; Finn
& Rock, 1997). A suspended student is disengaged from the flow of instruction, and more likely
to experience alienation from school altogether (Jessor, Turbin, & Kosta, 1998; Resnick et al.,
1997; Stewart, 2003). The educational and personal support needs of suspended students when
they return are great but the support they receive is likely to be minimal. This combination of
factors can easily accelerate a downward trajectory of failure and disengagement. It is little
wonder that suspensions, together with academic achievement and grade retentions, are the
strongest student-level predictors of dropping out (Finn & Zimmer, 2011; Rumberger, 2011).
Disparities in the use of exclusionary discipline compound the problem further (see
Gregory, Skiba, & Noguera, 2010). Studies showing racial/ethnic and gender differences in
suspensions are legion. In a 2010 address, U.S. Secretary of Education Arne Duncan stated,

Misbehavior, Suspensions and Security
6
“African-American students without disabilities are more than three times as likely to be
expelled as their white peers.” Black males are particularly targeted for school suspensions, a
factor that may itself account for the gender differences (Gregory, 1997; Losen & Skiba, 2010).
Although Hispanic/Latino students are generally suspended at greater rates than are non-
Hispanic white students, this finding and others related to misbehavior of Hispanic students have
been less consistent (Gordon, Della Piana, & Keleher, 2000).
The Reasons for Racial/Ethnic (and perhaps Gender) Differences
There have been several attempts to describe the mechanisms that produce disproportion
in the use of exclusionary discipline. These theories, however, do not provide sound educational
rationale for the disparities or even for the use of suspensions generally. One explanation is that
this disproportion, like the disproportionate placement of minorities in special education classes,
is an attempt to resegregate schools that have become desegregated because of state or federal
mandates (Heller, Holtzman, & Messick, 1982; Meier, Stewart, & England, 1989). A second
explanation, the racial threat hypothesis (Blalock, 1967) suggests that racial minorities are
perceived to present economic, political, and crime-related threats to the majority group. The
imposition of social controls like punitive discipline (i.e., suspensions, expulsions) is designed to
reduce the threat posed by racial minorities, particularly when minorities comprise a large
proportion of the student population.
A third explanation, often forwarded by proponents of strict discipline, is the differential
involvement hypothesis: that the racial/ethnic disparity in discipline is a proportional response to
different levels of misbehavior, especially among African American students. Several studies
attempted to address this argument empirically, but at the school level. For example, Eitle and
Eitle (2004) included school-level measures of misconduct in their examination of

Misbehavior, Suspensions and Security
7
disproportionate suspensions. This study concluded that disproportionate placements occurred in
a school environment characterized by high overall levels of misbehavior. However, the
misbehavior was not that of particular students or even particular racial/ethnic groups,
Several studies investigated the types of misbehavior that lead to suspensions in
particular gender and racial/ethnic groups (Mendez & Knoff, 2003; Skiba, Michael, Nardo, &
Peterson, 2002). Skiba et al. (2002) found that disciplinary consequences for African-American
students tended to be more subjective behaviors (e.g., being disrespectful or threatening) but for
white students tended to be more objective behavior (e.g., smoking or leaving the classroom).
However, the study did not address whether students, given similar levels of misbehavior (either
specifically or in general) are more likely to be suspended based on race/ethnicity. Likewise,
Mendez and Knoff (2003) found that suspension rates of black males were disproportionately
high for both minor and more serious infractions, and that black females were suspended at
higher rates than were white or Latino females. These studies and others raised the possibility
that punishment was a function of students’ race and not just the degree of misbehavior. .
In all, the consensus of research is that disciplinary measures are based on students’
race/ethnicity and gender above and beyond actual misbehavior. The present study expanded on
this work by using multiple measures of misbehavior in a nationally representative sample of
10th
grade students. Misbehavior was construed as a set of school-related behaviors, or else
chronic misbehavior, rather than any one specific act that may or may not be exhibited by a
particular student.
Focus of the Study
This study addressed four general questions, two concerned with schools’ decisions to
implement invasive security measures and two with suspensions of individual students.

Misbehavior, Suspensions and Security
8
School security measures and suspensions –
(1) What types of high schools have the most invasive security measures?
Security measures are discretionary acts on the part of administrators, based in part on student
behavior and the administration’s capacity to deal effectively with misbehavior. The decision to
implement security measures can reflect characteristics of the school and the student population.
We asked whether these characteristics included school size (enrollment), the racial/ethnic and
socioeconomic composition of the student body, and the location of the school, that is, the region
of the country, whether it was in an urban, suburban, or rural community, and the level of crime
in the school’s neighborhood.
(2) What types of schools suspend greater or fewer percentages of students (for example,
larger schools, schools in particular locations, schools with high levels of security)?
How high are the percentages?
Two policy manipulable features are especially germane, school size and levels of security. If
suspension rates are high in larger schools or high security schools, then the underlying reasons
for these connections need to be uncovered.
Suspensions of individual students and racial/ethnic or gender groups --
(3) Are particular gender and racial/ethnic groups more prone to being suspended than
others? How large are the disparities?
(3A) Are differential suspensions administered in proportion to the degree of students’
misbehavior?
Like other studies of suspensions, we asked whether disparities in suspensions were related to
race and gender. Unlike most prior research, we focused on the race, gender, and suspensions of
individual students rather than entire school populations, to see if a particular student is more

Misbehavior, Suspensions and Security
9
likely to be suspended for a certain level of misbehavior if s/he is minority and/or male than if
s/he is white and/or female. .
We also asked whether disparities—a concern under any circumstances—were even
greater than students’ misbehavior would lead us to predict. That is, are there groups for which
the level of misbehavior can also be ruled out as a reason for disparities in punishment?
(4) What types of schools have larger or smaller race or gender disparities in suspensions? In
particular, are the disparities related to school size or security measures? In what types of
schools are the race and gender differences even greater than would be predicted based on
student behavior?
Question (4) addressed the possibility that certain school characteristics accentuate racial
disparities in suspensions, for example, schools with high minority populations, urban schools,
larger schools, or schools with high levels of security.
Methods
Data for the study were drawn from national surveys of students and their schools. The
main database consisted of students in public schools that participated in the Education
Longitudinal Study of 2002 (ELS:2002) conducted by the National Center for Education
Statistics (NCES). This was augmented by information from the Common Core of Data (CCD),
also compiled by NCES, and by schoolwide suspension rates from the Civil Rights Data
Collection (CRDC). The ELS:2002 data (‘base year’) and CCD data were from the 2001-2002
school year; the CRDC data were from 2000, when all U.S. public schools were targeted for
inclusion.

Misbehavior, Suspensions and Security
10
The ELS:2002 survey collected data on a nationally representative sample of students
when they were high school sophomores, and at additional time points not used in this study.3
The data collection included surveys administered to school administrators, students, parents,
and teachers. The sample for the present study consisted of 8,775 tenth grade students in 500
public schools (66.0% white, 16.1% black, 17.9% Hispanic).4 The schools spanned all four
major geographic regions of the U.S. (16.1% northeast, 24.6% Midwest, 38.6% south, 20.6%
west) and were located in urban, suburban, and rural areas (25.6%, 51.0% 23.4%, respectively).5
They had the full range of school enrollments and socioeconomic characteristics as public high
schools in the country. Most of the schools (87.4%) had high school grades only; the remainder
had some earlier grades as well (e.g, middle-plus-high school; K-12 schools). We controlled for
this difference in analyses of other school characteristics.
Variables
Suspensions. The proportion of students in a school given out-of-school suspensions in
the 1999-2000 school year, not including students with disabilities, was taken directly from the
CRDC school-level files.6
Also, in ELS:2002, each student reported the number of times s/he received in-school7
and out-of-school suspensions during the past school year. Responses were ordered from
“never” to “10 or more times.” Both questions had a high proportion of “nevers” (86.2% and
91.9% respectively). Although we suspected that students might underreport their own
suspensions, these percentages were consistent with rates published by the U.S. Department of
3 Information about sampling is given in the Technical Appendix part A.
4 Of these, 7,138 students in 448 schools had all variables and were used in the multivariate analyses.
5 These are the actual percentage in our sample. Sampling weights were also provided by NCES so that the weighted
sample had the same proportions as the national population of high schools. 6 For 10 schools not included in the CRDC data for that year, the values were taken from the 2003-2004 survey.
7 Student removed from some or all classes for various amounts of time, but remains in the school building.

Misbehavior, Suspensions and Security
11
Education. For example, 6.6% of all public school students were suspended one or more times in
the year 2000 (Snyder & Tan, 2005, Table 144). Nevertheless, the self reports may have been
underestimates of suspension rates since students absent, suspended or expelled at the time of the
survey were among the nonrespondents.8
We analyzed student suspensions in two ways. The first was out-of-school suspensions
alone, consistent with the data tabulated by OCR. The second was the total number of
suspensions for each student (in-plus-out of school), which reflected the general disciplinary
environment of the schools. Due to the high proportion of “nevers” and small proportion of
multiple suspensions, each variable was classified as “never” or “one or more suspensions.”9
In-school and out-of-school suspensions. We did not focus on in-school suspensions
because of enormous variability from teacher to teacher and school to school in the types of
behavior that result in them. But we did compare in-school with out-of-school suspensions to see
their statistical connection. Of students who had not received an in-school suspension, very few
received an out-of-school suspension (4.5%).10
Of students who received one or more in-school
suspensions, 36% received an out-of-school suspension the same year. The ELS:2002 survey did
not indicate the behavior that resulted in any suspensions, nor the duration of suspensions.
Nevertheless, in-school suspensions appeared to be a ‘gateway’ to out-of-school suspensions: for
the most part, students given the more serious discipline (out) had also had the less serious form
(in). This suggests that in-school suspensions can serve as a point of intervention or warning sign
that more serious behavior and/or suspensions are coming.
8 Some students may have dropped out as well, but most dropping out occurs after 10
th grade.
9 We checked the reasonableness of this by performing a multinomial analysis to see if relationships were different
for infrequent suspenders and frequent suspenders as compared to non-suspenders and found no difference in results
between the two suspended groups. 10
Percentages weighted to represent the national population of 10th
graders.
Misbehavior, Suspensions and Security
12
School security measures. The ELS:2002 Administrator Questionnaire asked each
principal whether, during the current school year, the school had each of 20 security measures in
place, from some that were relatively innocuous (e.g., dress code; closed campus during lunch
hours) to others that were more invasive.
For this study, seven measures were selected that would be most salient to all members of
the school community: (1) metal detectors at the school entrance, (2) random metal detector
checks on students, (3) drug testing, (4) random sweeps for contraband, (5) security cameras, (6)
police or security guards during school hours, (7) random dog sniffs for drugs.11
The seven measures were used to obtain a score that represented the total security
environment of the school. The score was obtained by means of Rasch scaling (Rasch, 1960) that
weighs individual security measures according to the frequency with which they are used.
Measures used less often and which were generally more invasive contributed more toward the
total score than did frequently used security measures.12
Approximately 9% of schools reported having none of the seven security measures;13
the
largest number of measures in a single school was 5. The median number of security measures in
the schools in our sample was 1. For some of our analyses, high and low security schools were
defined as the upper 1/3 and lower 1/3 of the schools on the Rasch scale, respectively.
Student misbehavior. Our approach to misbehavior was based on assumption that the
occurrence of a particular misbehavior is not as important as the ‘whole’ of a student’s behavior.
11
Police or security guards were asked as two separate items. The other measures were require clear book bags,
require students to wear badges or picture ID, student uniforms, security officers outside of school hours, controlled
access to school grounds, telephones in classrooms, emergency call buttons in classrooms, dress code, controlled
access to buildings during school hours, closed campus during lunch, security guards at school activities. 12
The overall score accounted for 80.4% of the variability among schools; this value indicated that the single score
was a good summary of schools’ overall security environments. The score ranged from 5.6 (low security school) to
12.8 (high security school) with an average of 8.7. The scores on the scale do not indicate the number of measures in
place but to the total invasiveness of security measures in the school. 13
This was 17.3% weighted by sampling weights.

Misbehavior, Suspensions and Security
13
Indeed, adolescents who exhibit one misbehavior often exhibit others. Correlations among
multiple misbehaviors have been found routinely in developmental research (e.g., Kelley et al.,
1997; Loeber et al., 1993; Resnicow, Ross-gaddy, & Vaughan, 1995), and a single factor has
been found to explain these relationships (Jessor, Donovan, & Costa, 1991; Loeber et al., 1998).
Psychologists have proposed that an intrapersonal ‘problem behavior syndrome’ underlies the
clustering of multiple misbehaviors.
In this study, we assessed multiple misbehaviors and the frequency of each. In
ELS:2002, a student’s misbehavior was self-reported by the student and rated by two of the
student’s teachers (English and math). The questions were combined into two behavior scales,
self-reported and teacher-reported, respectively, using the Rasch method (Rasch, 1960; Wright
& Masters, 1982).14
Again, the scaling procedure weighted more severe (but less common)
misbehaviors more heavily in the scale scores, compared to more frequent misbehaviors. Thus,
the resulting scale is an assessment of the overall severity of a student’s misbehavior.
The student questionnaire asked “How many times did the following things happen to
you in the first term of this school year?” The list was: (1) getting into a physical fight; (2)
coming late to school; (3) cutting or skipping classes; (4) being absent from school; (5) getting
into trouble for not following rules. Response options for fighting were never, once or twice, or
more than twice. Responses for the other behaviors were never, 1-2 times, 3-6 times, 7-9 times,
and 10 or more times. Although students may have under-reported or over-reported their own
misbehavior, the numerical response categories used in the ELS:2002 survey were intended to
reduce the bias to some extent.
14
Additional information about the behavior scales is given in the Technical Appendix part B.

Misbehavior, Suspensions and Security
14
The teacher questionnaire asked both teachers to report: (1)-(2) whether s/he had
communicated with the student’s parents about disruptive behavior or absenteeism (two items:
yes, no); (3) whether s/he had communicated with the student’s guidance counselor about
disruptive behavior (yes, no); (4) whether the student has fallen behind due to a disciplinary
action (yes, no); (5)-(8) how often the student was absent from class, tardy to class, inattentive in
class, disruptive in class (four items: never, rarely, some of the time, most of the time, all the
time). Like the student self reports, there may have been some reporting bias in reporting on the
part of the teachers. However, agreement between student and teacher reports on behaviors asked
on both questionnaires (attendance) was good (see Technical Appendix part B). The fact that two
teachers rated each student may have helped the accuracy of the overall scale.
ELS:2002 did not ask about some of the more serious behaviors (e.g., drug or alcohol use in
school, bringing a weapon to school, theft, gang activities).15
Thus the measures were seen as
representing ‘everyday’ misbehavior that may be exhibited by many students. They also leave
more room for teachers’ and principals’ discretion in the administration of discipline.
Other background information. School characteristics used in the study were:
enrollment, the proportion of students eligible for free or reduced-price lunches,16
and the extent
of crime in the school’s neighborhood as reported by the school principal; the ELS:2002
response categories were high, moderate, low, and ‘mixed,’ from which we created three
categories, high (2% of schools), moderate/mixed (21%), and low (77%).17
.
15
Fighting was the most serious misbehavior included. Some information about fighting alone is given in the
Technical Appendix part D. 16
Used as a proxy for the socioeconomic level of the student body (SES). 17
Schools in the high- and low-crime neighborhoods were clearly different on all characteristics, but moderate and
mixed neighborhoods had similar values on most characteristics. Thus, we combined the mixed-crime
neighborhoods with moderate, resulting in the three-part classification. Weighted percentages were 8%, 25%, and
67%, respectively.

Misbehavior, Suspensions and Security
15
Analysis18
All analyses in this study used school and student sampling weights so that the weighted
sample more closely approximated the national population of 10th
graders and their schools.19
The questions about school-level security and suspensions (Questions 1 and 2) were
performed using ordinary correlations, t-tests for independent samples and chi-square tests of
independence in two-way tables. Schoolwide suspension rates were drawn from the CDRC files;
other school characteristics were from the ELS:2002 and CCD surveys.
Questions (3) and (4) were answered using forms of regression analysis that allowed us
to find out if the main independent variables (school characteristics including size and security
measures; student gender and race) were related to suspension rates above and beyond the impact
of other background characteristics. Questions (3A) and (4) also concerned suspensions above
and beyond those predicted from misbehavior; these required that student misbehavior (student
and teacher reports) be controlled statistically as well. These analyses used student-level data,
including suspensions, from ELS:2002 and school characteristics from ELS:2002 and CCD.
The dependent variable for these analyses, suspensions, was a simple yes/no for each
student. Thus a ‘logistic’ regression was used, appropriate for tests of significance with a
dichotomous dependent variable. Tests of significance are not sufficient by themselves, however.
They reveal whether a relationship is statistically reliable but tell little about whether effects are
weak or strong. For this reason, all statistically significant findings were accompanied by a
strength-of-effect measure. When the effect is a difference between two proportions (e.g., the
proportion of black students suspended compared to the proportion of whites) the proportions
themselves and the ‘odds ratio’ are the most common strength-of-effect measures. An odds ratio
18
Additional information about methods of analysis is given in the Technical Appendix part C. 19
All results from this point forward are based on weighted data.

Misbehavior, Suspensions and Security
16
close to 1.0 indicates that two proportions are about equal; an odds ratio much below 1.0 or
much above 1.0 indicates that the proportion in one group is less than or greater than the
proportion in the other group, respectively.20
Results
What Types of High Schools have the Highest Levels of Security?
This question was answered in two ways, by computing correlations between security
and other school characteristics (Table 1), and by comparing characteristics of the highest one-
third of schools on the security scale (high security) to the lowest third (low security) (Table 2).
The extent of school security was related significantly to all school characteristics studied. The
association was strongest for percent black students (r=0.37) and weakest, but still significant,
for percent of students eligible for free or reduced-price lunches (r=0.11).
Higher security was found in:
larger schools (average enrollment in high security schools was 921; in low-security
schools 521);
schools with a higher proportion of black students (average percent black in high security
schools was 21.5%; in low security schools 5.4%);21
schools with higher percentages of students on free lunch (28.3% compared to 25.6%);22
schools with higher percentages of students suspended. (14.0% compared to 7.5%)
The association of security with the percentage of Hispanic/Latino students in the school was
negative. Although the correlation was weak (r= -0.16) there was a slight tendency for schools
20
See Appendix part C for further information. 21
Student-level analysis showed that approximately 62% of all black 10th
grade students were attending high
security schools! 22
The relationship with free lunches was weak at best. The correlation (Table 1) was significant at p < .05; the
difference between schools with the highest and lowest security was not statistically significant.
Misbehavior, Suspensions and Security
17
with larger proportions of Hispanic students to have less security: the mean percentage of
Hispanic/Latino students in high-security schools was only 6.8% compared to 11.9% in low-
security schools. We did observe that schools with large percentages of Hispanic students were
not as common as those with large percentages of black students. This could account for a
reduced correlation with security measures but not the reverse correlation, which remains to be
investigated further.
School security was also related significantly to the three indicators of school location –
neighborhood crime, urbanicity, and geographic region (Table 2). About 90% of schools in
high-crime neighborhoods had high security, compared to 27% of schools in low-crime
neighborhoods. While not a surprise, this result indicates the importance of factors outside the
school to what transpires inside.
In urban areas, there were about as many high security as low security schools; the same
was found in suburban areas. It was not the case that urban communities had a high
concentration of high security schools or that suburban communities had far more low-security
schools. The percentages of high and low security schools in these communities were about the
same. Rural areas stood out in comparison. A relatively small percentage of rural schools had
high security (24%) and fully half had low security (50%). Indeed, the percentage of low-
security schools in rural areas was greater than any of the other percentages in this analysis.
There were different patterns according to geographic region. In the western and
northeastern U.S., only 17% to 19% of schools had high security according to our definition,
much lower than the percentages with low security. In the southern U.S., however, 45% of
schools were in the high-security category and only 26% had low security. At the same time, the
south also had the highest rates of property and violent crime of the geographic regions, a finding

Misbehavior, Suspensions and Security
18
that not only holds true for the year of the ELS data collection, but also a consistent trend from
the early nineties through present day (Bureau of Justice Statistics, 2012).
Individual security measures. The use of security measures in American schools is
pervasive (Table 3): Approximately half of all public schools with 10th
grade students used
random dog sniffs to check for drugs and/or had police or paid security officers on duty during
the school day. About one-third of schools had security cameras to monitor school areas, and
over one-fourth of schools performed random checks for contraband. Smaller percentages – but
many schools nevertheless23
– required drug testing and/or perform personal metal detector
checks on students. Approximately 1.4% of schools required students to pass through metal
detectors each day. The average number of invasive security measures in schools in the U.S.
serving 10th
grade students was 1.6 out of the 7 measures we studied.
When schools were classified as high security (top 1/3 in the U.S. based on the overall
security scale), a picture emerged of schools in which invasive security measures were even
more common. Over three-fourths of high security schools had a police presence and used dogs
to check for drugs; two-thirds had security cameras in our outside of school; over half performed
random sweeps for contraband; and one third required drug testing. The median number of
security measures in these schools was 3. That is, half of the schools in this group had three
security measures or more of the 7 salient measures we studied (or 5, the actual maximum
number).24
What Types of Schools Suspend Greater or Fewer Percentages of Students? How High are
the Percentages?
23
At the national level, 14.3% of schools with 10th
grade students is approximately 4000 schools. 24
Their impact may be bigger than it appears, because these measures are not ‘one-place’ or ‘one-time,’ but are
present or can be brought into play continually.

Misbehavior, Suspensions and Security
19
The schoolwide out-of-school suspension rates in our sample ranged from no students
suspended to almost 80% (Table 1). The median suspension rate was 6.6%; that is half of the
schools suspended fewer than 6.6% and half suspended more. Ten percent of schools suspended
20% or more of students in one school year – that is 1 out of 5 students or 5 in a typical class of
25. At the extreme, some schools in the sample suspended over half of their students, up to a
maximum of 79.8%.
The same characteristics that were related to security levels were also correlated with
suspensions. Schools with higher suspension rates were somewhat larger and had higher
percentages of black students and students from low-income homes. The strongest correlation
was the relationship with percent black students (r = 0.40).
In contrast, the correlation of suspension rates with percent of Hispanic/Latino students
was small and not statistically significant.25
This correlation encompassed all schools in the
sample. When schools were selected that had the highest one-third of all suspension rates (high
suspension) and the lowest one-third of suspension rates (low suspension), the percent of
Hispanic students in the two groups of was significantly related to suspensions: high suspension
schools had an average of 12.6% Hispanic students and low suspension schools averaged 5.0%.26
That is, being of Hispanic origin was related to suspensions in the extremes, when suspension
rates were very high and very low, but not in between.
The relationships of suspensions with school location paralleled those for security levels,
especially the association with neighborhood crime. Over half (58.3%) of schools in high-crime
neighborhoods were in the high suspension group and only 16.7% were in the low suspension
group. At the other extreme, 28.4% of schools in low-crime neighborhoods were in the high
25
The other characteristics remained significantly related to suspension rates. 26
Results not given in tables.

Misbehavior, Suspensions and Security
20
suspension group and 38.0% were in the low suspension group. Both urban and suburban areas
had greater percentages of schools in the high suspension group than in the low suspension
group, but the difference was more pronounced for rural schools: Only 21.2% of rural schools
were in the high suspension group but 47.6% of rural schools were in the low suspension group.
In general, rural schools were more characterized as having lower security and fewer suspensions
compared to urban or suburban schools.
Are Particular Gender and Racial/ethnic Groups More Prone to Being Suspended than
Others?27
The actual percentages of students suspended are shown in Table 4. Overall, males were
suspended at a substantially higher rate than were females, considering both out-of-school
suspensions (10.6% compared to 6.5%) and total suspensions (21.2% compared to 12.8%). The
gender difference was also found in each racial/ethnic group. African-American students were
suspended at a higher rate than were Hispanic/Latino students who, in turn, were suspended at
higher rates than non-Hispanic white students. This same rank order was found for out-of-school
suspensions (16.0%, 10.8%, and 8.5%, respectively) and total suspensions (31.6%, 21.5%, and
13.0%, respectively). The largest out-of-school percentage (16.0%) means that approximately
one out of every six black 10th
grade students was excluded from school one or more times
during the year.
We examined whether race and gender differences in suspensions were statistically
reliable and not explained by other school characteristics. A multilevel regression analysis
controlled statistically for geographic region, school urbanicity, neighborhood crime,
racial/ethnic and SES composition of the student body, school size, and the level of security.
27
Suspension and behavior data for this and all questions that follow were taken from individual student responses
in ELS:2002.
Misbehavior, Suspensions and Security
21
The analysis was conducted twice, once for out-of-school suspensions and once for total
suspensions. The results for race/ethnicity and gender are summarized in first and third columns
of Table 5 (OSS and TS, not “controlled”).28
29
Only statistically significant effects are shown.
In terms of gender, the odds of males being suspended out of school were significantly
greater than the odds of females being suspended by a ratio of 2.0-to-1.0. This is a formal
statistical test of the male – female difference of 10.6% compared to 6.5% in Table 4. The odds
of males being given any suspension (TS), were even greater with an odds ratio of 2.1-to-1.0.
This is a test of the male—female difference of 21.2% compared to 12.8% in Table 4. These
odds ratios are large by any common standard.
In terms of race/ethnicity, the odds ratios for black students were 1.78 for out-of-school
suspensions and 2.24 for total suspensions, when compared to whites. These correspond to the
percentages suspended of 16.0% compared to 6.4%, and 31.6% compared to 13.0%, respectively
in Table 4. The odds ratios were large, and the percentage of blacks suspended was the largest of
all racial/ethnic groups -- approximately 2-1/2 times those of whites for both out-of-school and
total suspensions.
Likewise, being Hispanic was associated with increased suspensions. The odds ratios for
comparing Hispanic to white students were 2.23 and 1.89 for out-of-school suspensions and total
suspensions, respectively. These large effects correspond to the percentages suspended of 10.8%
compared to 6.4%, and 21.5% compared to 13.0 percent, respectively, in Table 4. Both out-of-
school and total suspensions were administered to Hispanic/Latino students disproportionately,
although the percent suspended wasn’t as high as for black students.
28
Complete regression table in Appendix part D. 29
Some results are given in the Technical Appendix Part D for fighting alone, since this was the most extreme
misbehavior we studied and most likely to result in an out-of-school suspension.

Misbehavior, Suspensions and Security
22
Gender-race combinations. Our analysis also asked whether particular gender-race
combinations were associated with higher suspensions. Only one “interaction” was statistically
significant – the combined effect of gender and race for African-American males (bottom section
of table 5). To understand this, we examined the gender difference for black and white students
separately.30
The difference between male and female white students was statistically significant for
out-of-school and total suspensions (odds ratios = 2.53 and 2.43, respectively). The difference
between male and female black students was not statistically significant (odds ratios = 1.04 and
1.28, respectively). In sum, black students were suspended at a higher rate than were white
students generally and in each gender group. Beyond that, the suspension rates for black students
were found to be equally high for males and females.31
Are differential suspensions administered in proportion to the degree of students’
misbehavior?
There is no question that students who are suspended have generally poorer behavior than
those who are not. The correlations between out-of-school suspensions and reports of
misbehavior were r = 0.32 (self reports) and r = 0.27 (teacher reports). The correlations between
total suspensions and misbehavior were higher, r = 0.40 (self reports) and r = 0.37 (teacher
reports), probably reflecting that misbehavior results in disciplinary action other than excluding
the student from school. All correlations were statistically significant at the .01 level.
30
In statistical terms, these are the ‘simple main effects’ of gender. 31
This effect may not be totally apparent in Table 4, which contains only the observed proportions. The statistical
tests were conducted in a model that controlled statistically for school characteristics, e.g., the differential
enrollment of whites and blacks in large schools or schools in high crime neighborhoods.

Misbehavior, Suspensions and Security
23
In this analysis, gender and race differences were revisited controlling statistically for
ratings of student misbehavior.32
That is, if two students of different genders or racial/ethnic
identities exhibited the same level of misbehavior, would one still be more likely to be suspended
than the other? The results are summarized in the second and fourth columns of Table 5 (OSS
and TS Controlling for Student Misbehavior).
In terms of gender, the answer was yes. Males were suspended at a higher rate than were
females even after student- and teacher-reported misbehavior had been controlled statistically.
That is the odds of a male being suspended out of school for exhibiting the average level of
misbehavior were 1.64 times greater than the odds of a female being suspended for the same
level of behavior; for total suspensions the odds are 1.86 times greater. Both were statistically
significant at the .01 level.
In terms of race/ethnicity, the answers were mixed. Black students, who were subject to
highly disproportionate suspensions in general, were not given out-of-school suspensions more
than their behavior would predict. However, they were administered more total suspensions (TS)
than their behavior would predict (odds ratio = 1.80). Total suspensions represent the overall
tendency of teachers and administrators to discipline students. Of two students exhibiting the
same level of misbehavior, one black and one white, the odds of the black student being
excluded from the classroom or school were 1.80 times greater than that of the white student.
Hispanic/Latino students were also subject to disproportionate suspensions in general.
This analysis examined suspensions relative to behavior. It showed that Hispanic students
received disproportionate out-of-school suspensions even when behavior ratings were controlled
statistically (odds ratio = 1.64). That is, if two students exhibited the average level of
32
The mean scores of the behavior scales are given in the Technical Appendix part D.

Misbehavior, Suspensions and Security
24
misbehavior, one Hispanic and one white, the odds of the Hispanic student being suspended from
school were 1.64 times greater than that of the white student. Total suspensions for Hispanics
were highly disproportionate in general, a phenomenon that remains to be explained. However,
the difference was not greater than that predicted by differences in behavior ratings.
The contrast of results for black and Hispanic students was noteworthy. Both groups
were subject to discipline differences related to race/ethnicity beyond their respective
misbehavior. For black students, the race-related difference, above and beyond behavior, resulted
in total suspensions, that is removal from the classroom or from school. For Hispanic students,
the difference related to race/ethnicity but not to behavior was in out-of-school suspensions. That
is, for a particular level of misbehavior, there was a stronger tendency of teachers and
administrators to exclude black students from the classroom one way or another and to exclude
Hispanic students from school.
Gender-race combinations controlling for student behavior. The one interaction that
was statistically significant without controlling for behavior (“black males”) remained
statistically significant when misbehavior was controlled statistically. The same pattern of
suspension rates also remained: The difference between male and female white students,
controlling for misbehavior, was statistically significant for out-of-school and total suspensions
(odds ratios = 2.12 and 2.22, respectively). The difference between male and female black
students was not statistically significant (odds ratios = 0.79 and 0.97, respectively).
We also obtained estimated probabilities of suspension controlled for student
misbehavior (not tabled); this is a way to examine the actual proportions that produced the odds
ratios. Like the observed suspension rates in Table 4, these showed that overall suspension rates
for black students of both genders were higher than the respective rates for whites.

Misbehavior, Suspensions and Security
25
When we looked at gender, the same pattern was found for out-of-school suspensions and
total suspensions. The suspension rates for white males, controlling for student behavior, were
substantially higher than those for white females. The adjusted rates for black females were
slightly higher (but not significantly higher) than those for black males. We concluded that black
females are suspended far more frequently than their behavior would predict, bringing their
adjusted suspension rates up to that of black males.33
What Types of Schools have Larger or Smaller Race or Gender Disparities in Suspensions?
In Particular, are Disparities Related to School Size or School Security?
Six school characteristics were considered: the focus was on two policy manipulable features, the
use of security measures (Rasch scale) and school size. Non-manipulable characteristics included
the composition of the student body (percent black; percent Hispanic; percent free or reduced-
price lunches), school urbanicity, and neighborhood crime.34
Security and racial disparities. The effect of security on the black-white disparity in
total suspensions was statistically significant (Appendix Table A5). Greater black-white
disparities occurred in schools that had higher degrees of security. Further, the disparity in high
security schools was even greater than would be predicted from different levels of behavior (i.e.,
“controlled” for misbehavior).
To illustrate the relationship, we computed predicted probabilities of total suspensions of
black and white students in the low- and high-security schools (Table 6). Whether controlling for
misbehavior or not, the probability of suspension is similar for white students in low and high
security environments (12.8% and 11.8%, respectively not controlled). However, the probability
33
The title in Table 5, “Black Male,” actually refers to a male – female contrast. It could just as well have been
labeled “Black Female” or, more completely, “The difference between the gender difference for black students and
the gender difference for white students.” For obvious reasons, we chose a brief label. 34
Results given in the Technical Appendix part D.

Misbehavior, Suspensions and Security
26
of suspension for black students is greater high security environments (20.2%) than in lower
security environments (16.3%).
To examine the disparities directly, we conducted a statistical test of the black – white
difference in high and low security schools. The difference between suspensions of black
students and white students in low-security schools was not significant, whether suspensions
were or were not controlled for misbehavior. However, significantly more black students than
white students were suspended in high-security schools, both when the suspensions were not
controlled for misbehavior (odds ratio = 2.66) and when they were controlled (odds ratio = 2.23).
The percentages in Table 6 show that this is due to the elevated suspension rate of blacks in high-
security environments (20.2%), well above the other percentages in the table.
The relationship was not statistically significant for out-of-school suspensions but was in
the same direction as for total suspensions (bigger disparities in high security schools). We also
tested the black - white difference in out-of-school suspensions in high and low security
schools.35
Again, the black and white rates of suspensions were not significantly different in low-
security schools. But in high security schools, significantly more blacks than whites were
suspended when suspensions were not controlled for behavior (9.5% compared to 6.0%; odds
ratio = 1.87). The black – white difference in suspensions controlled for misbehavior was in the
same direction but not statistically significant (3.3% for black students, 2.7% for whites).
In sum, black students had the highest suspension rates generally, and are suspended at an
even higher rate when security in a school is high. This was not the case for white students or for
35
We recognized that this was not consistent with our practice of testing specific effects only when the overall effect
was significant (the interaction in this case). However, it seemed valuable since the percentages displayed the same
pattern as did total suspensions.

Misbehavior, Suspensions and Security
27
students of Hispanic origin. Total suspensions were affected to a greater degree than were out-of-
school suspensions.
School size and disparities in suspensions. One finding stood out in regard to school
size – the trend for more black males to be suspended in larger schools relative to black females,
white males and white females; the relationship was specific to total suspensions.36
The
suspension rates for all four gender-race groups are shown in Figure 1 for five school size
categories (0-300, 301-600, 601-900, 901-1200, 1201+). Unlike total suspensions of black
females, white males, or white females, black male students were suspended at increasingly
higher rates as the school size increased. In sum, suspension rates (in-school plus out-of-school)
are elevated in larger schools and are lower in smaller schools.
The same pattern was not found for out-of-school suspensions. While there was a clear
racial disparity in suspensions, neither the suspension rate for black males nor the black-white
difference increased in large schools. Larger schools may have more resources to keep students
in school, for example, more study halls or teachers to serve as monitors so that students can be
removed from the classroom without leaving school grounds. The relationship of out-of-school
suspensions with school size requires further study.
Summary and Recommendations for Policy/Practice
The purpose of this study was to answer questions about student suspensions as related to
misbehavior and security measures in American public schools. The study was motivated by the
rapidly increasing use of invasive security measures in high schools and the disproportionate use
of discipline measures with minority and male students. It is part of a multi-part investigation in
response to the concern that the regulatory environment, while intended to make schools safer
36
Technically, this was the three-way interaction of school size, race and gender. The interaction was statistically
significant for total suspensions whether or not they were controlled statistically for student behavior (Table A5).

Misbehavior, Suspensions and Security
28
and more orderly, does not always accomplish that purpose. Instead it may create a setting that is
educationally harmful, especially to some groups of students.
Two general questions were addressed. First, what are the characteristics of schools that
have implemented the most extreme security measures and those that have the highest
suspension rates in general? Second, is discipline in general, or the disproportionate discipline of
males or minorities, related to the characteristics of schools (e.g., size or security measures) or to
the misbehavior of the students disciplined?
Data for the study were drawn from three national databases that included information on
10th
grade students and their schools. The use of these databases allowed us to focus on the
behavior and discipline of individual students and also draw conclusions about school-level
practices and policies.
The measures used were a strength of the study. Rather than focusing on one particular
security measure, we characterized the school environment by an overall measure of the extent
of security present. The seven security measures in the scale were all salient to students but
ranged from some that were used infrequently (e.g., drug testing) to others that were more
common (e.g., police or security guards). The scaling procedure produced a security score for
each school that accounted for the different frequencies of use.
The misbehavior variables were based on two teachers’ ratings of each student plus the
student’s self report. The measures spanned a number of educationally relevant behaviors from
missing school and classes to being inattentive and/or disruptive in class to not following rules or
getting into fights. These were combined into a teacher rating and student rating that gave more
weight to more severe forms of misbehavior. This was consistent with research showing that
problem behaviors often ‘cluster’ (e.g., Jessor, Donovan, & Costa, 1991).

Misbehavior, Suspensions and Security
29
Individual discipline was the number of out-of-school suspensions and total suspensions
(in-school plus out-of-school) during the past school year, as reported by the students; few if any
previous studies have considered both. School discipline rate was the percentage of students
given out-of-school suspensions as reported to the Office for Civil Rights in the CRDC data
collection.
Suspensions37
Absenteeism for any reason, including suspension, has a consistent adverse impact on
learning and, further, students who are absent for reasons other than health tend to be denied the
academic support needed when they return. Suspensions and absenteeism are recognized
precursors to dropping out. Our study examined suspension rates and the context in which they
arose.
The Office for Civil Rights collected schoolwide suspension data indicating that between
zero and 80% of students received out-of-school suspensions in one school year. Ten percent of
schools suspended 20% or more of students in one year, that is, 1 out of every 5 students.
Neighborhood crime was related to school suspension rates. When schools were
classified as high suspension schools or low suspension schools (leaving out the middle 1/3),
over half of schools in high-crime neighborhoods were in the high suspension group. It is not
clear whether out of school students contribute to creating a high-crime neighborhood or whether
they are being sent by the school into a neighborhood that already has high crime levels. It is
clear, however, that out-of-school suspensions in these communities can be harmful to the
students suspended. This may explain in part why suspensions are less than effective in
remediating poor behavior or low academic motivation.
37
Main points in the findings and recommendations in Italics.

Misbehavior, Suspensions and Security
30
At the same time, the percentage of black students in a school was the strongest single
correlate of suspension rates of those characteristics studied.38
Thus, the impact of high-crime
neighborhoods may be felt disproportionately by black students suspended from school.
Recommendation: Because there can be harmful educational consequences due to out-
of-school suspensions and because suspensions may be ineffective in controlling student
behavior, it is recommended that to the extent feasible, educators should avoid the use of out-of-
school suspensions for students who do not misbehave continually or who are not a threat to
property or to others.
Student misbehavior of the relatively common types examined in this study (absenteeism,
moderate disruptiveness, and even fights among students) is inevitable. Alternative approaches
to discipline should be encouraged that do not exclude students from the school community.
Programs for doing this have been developed and tested with positive results, for example, the
Positive Behavioral Interventions and Supports program (PBIS), tested in a number of schools
(Muscott et al., 2004; Sugai & Horner, 2002), and others (see Osher, Bear, Sprague, and Doyle,
2010).
High and low security schools
Schools with high levels of security had significantly higher suspension rates than did
schools with lower security levels. High security schools were larger than low security schools,
with enrollments averaging 921 students (and many larger still). They had substantially higher
percentages of African-American students (averaging about 20%); in fact, over 60% of all black
students were attending high security schools. High security schools were located in
neighborhoods with moderate to high crime ratings.
38
Suspension rates were not found to be correlated with the percent Hispanic/Latino students enrolled.

Misbehavior, Suspensions and Security
31
Despite this, about 35% of suburban schools were classified as high security, almost as
high a percentage as urban schools (40%). The prevalence of security measures is not uniquely
an urban phenomenon but affects suburban areas as well.39
. Indeed, intended or not, security
measures have become a significant part of the discipline system of many schools.
Few studies have asked about students’ perceptions of security measures in their schools
and their reactions to them. In a limited study, Bracy (2011) found that students may view the
security measures as useless or else designed for administrators to exercise their authority.
Certainly, when students view schools rules as too harsh or applied inequitably, misbehavior can
increase and attitudes toward school and sense of school belonging can suffer (Bryk & Thum,
1989; Hyman & Perone, 1998; Rumberger, 1995). Further research is needed to understand the
full impact of security measures on students and school staff.
Recommendation: Security measures are widespread and their use is growing. Schools
implementing security measures should explain clearly to students, parents, and teachers the
reasons for the measures and the disciplinary action to be taken for all students if infractions are
detected. State or federal policies requiring that the information be provided should be
considered.
Differential suspensions by gender and race/ethnicity
This study confirmed large, statistically significant gender and race disproportions in
suspensions:
odds of 2-to-1 for males compared to females (out of school) and 2.1-to-1 (total
suspensions). The gender differences remained significant even when students’
behavior was controlled statistically;
39
Rural schools were mostly in the low-security category.

Misbehavior, Suspensions and Security
32
odds of 1.78-to-1 (out of school) and 2.24-to-1 (total suspensions) for black
students compared to whites. The difference for total suspensions remained
significant even when students’ behavior was controlled statistically;
odds of 2.23-to-1 (out of school) and 1.89-to-1 (total suspensions) for
Hispanic/Latino students compared to white students. The difference in out-of-
school suspensions remained significant even when students’ behavior was
controlled statistically.
These results refuted the differential involvement hypothesis clearly. For males, for
blacks (total suspensions), and for Hispanic/Latino students (out-of-school suspensions),
suspension rates were high even when their behavior was controlled statistically. Different levels
of behavior, as reflected in our behavior measures, were not sufficient to explain differential
discipline. Other gender- and race-related factors were at work.
The data also revealed a surprising gender-race ‘interaction.’ For white students, males
were given significantly more suspensions (of both types) than were females. Black students
were suspended at a higher rate than white students in general, but there was no significant
difference between black males and black females. That is, the rates were equally high for black
males and females. When student behavior was controlled statistically, the analysis showed that
black females were given harsher treatment relative to their behavior than were black males.
Recommendation: Disproportions in school suspensions require attention because of the
inequities being meted out by publically supported schools, and also because of the potential for
hindering academic performance and persistence (Gregory, Skiba, & Noguera, 2010; Hyman &
Perone, 1998). Schools should monitor in-school and out-of-school suspensions as they occur.
The data should be reviewed to see if racial or gender disparities are occurring. If so, the
Misbehavior, Suspensions and Security
33
teachers and/or administrators involved should be consulted to understand ‘why’ and to see if
alternative approaches to discipline are feasible. As electronic data systems become more
common in schools, monitoring suspensions on an ongoing basis should be relatively
straightforward. The aggregate data can be automatically forwarded to government agencies (as
they are from some districts at present).
School security, school size, and disproportionate suspensions
We examined two policy-manipulable characteristics of schools that may impact
disparities in suspensions, the degree of security in the school and school enrollments.
Security. The degree of security in American high schools, related to suspension rates
generally, was also related to racial disparities in total suspensions. The proportion of black
students suspended from high security schools (20.2%) was significantly greater than the
proportion of white students suspended (11.8%) – a disparity not explained by greater
misbehavior on the part of students suspended. The proportion of total suspensions of black
students in low security schools was similar to the proportion of whites.
The same pattern was also found for out-of-school suspensions, but was not statistically
significant in all aspects. The mechanism connecting security to suspensions of black students is
unclear. It is possible that both suspensions and security measures are reactions to large
proportions of black students in the school (the racial threat hypothesis) or other race-related
phenomena, but is not related to different levels of misbehavior as reflected in our measures.
No connection between security and suspensions was found for Hispanic students. In
fact, no school feature we studied was systematically associated with the suspension of Hispanics
as compared to non-Hispanic whites.

Misbehavior, Suspensions and Security
34
Recommendation: These findings underscore the need for discipline practices that are
clear, proportional to the student misbehavior and administered fairly. This may involve efforts
of teachers and school and district administrators to create conduct codes consistent with these
principles; they should be communicated clearly to teachers, students, and parents, and
monitored to assure that the principles are implemented.
The difference between the results for black students and Hispanic/Latino students
convinced us that further study is needed of the behavior and school discipline policies with
regard to students of Hispanic origin. It might begin with consideration of the national origins of
Hispanic/Latino students and regional differences in the U.S. Unfortunately, the surveys we used
did not provide this information in any direct way.
School size. School size was associated with suspensions of black males. As enrollment
increased, the proportion of black males suspended relative to black females and to white males
and females, increased monotonically – from an average of 16.6% in schools of 300 students or
fewer, to an average of 38.4% in schools with over 1200 students. Further, increased
suspensions in larger schools were not attributable to poorer behavior in those settings as
reflected in our behavior measures. Again, the explanation lies in other race- and/or gender-
related factors.
Recommendation: Educators should take advantage of the multiple benefits offered by
small schools, including improved student behavior and fewer suspensions of black males. Small
high schools have been shown repeatedly to have lower rates of misbehavior and thus less need
for disciplinary measures (Haller, 1992; Lee & Smith, 1997; NCES & BJS, 2006).40
The present
40
Despite many studies, there is still uncertainty about the relationship of school size with academic achievement.

Misbehavior, Suspensions and Security
35
study found that security levels were lower in smaller schools. Administrators in larger schools
may feel compelled to implement more security measures.
Alternately, small learning communities (SLCs) in the form of academies, house plans,
schools-within-a-school, and other models can produce small school dynamics even if housed in
large schools (Kemple & Snipes, 2000; U.S. Department of Education, 2001). We agree with
Fine and Powell (2001) that “Size is a means, not an end” (p. 47). Small schools facilitate but
don’t guarantee closer contact between adults and students and permit behavior problems to be
addressed before they become unmanageable. The advantages of small schools or SLCs are
likely to impact students at risk in particular.
In-school, out-of-school, and total suspensions
This study considered out-of-school suspensions and total suspensions (in-school plus
out-of-school). Out-of-school suspensions are administered for more serious offenses than in-
school suspensions,41
resulting in the student being removed from the school campus entirely.
Until recently, they were the only suspension rates tabulated by OCR in its CRDC school and
district surveys. Total suspensions were used in the study to reflect teachers’ and administrators’
disciplinary predispositions generally.
The two types of suspensions were administered differently to Hispanic and black
students. Overall disparities were significant for both groups on both types of suspensions, but
were smaller for students of Hispanic origin. For black students, the disparity in total suspensions
was greater than would be expected from their misbehavior. For Hispanic/Latino students, the
disparity in out-of-school suspensions (but not total suspensions) was greater than would be
expected by their misbehavior. That is, black students were excluded from the classroom one
41
In theory, at least.

Misbehavior, Suspensions and Security
36
way or another for race-related reasons other than misbehavior, and the same was true for
Hispanic students when it came to out-of-school suspensions.
We found that in-school suspensions appeared to lead the way to out-of-school
suspensions. Of students who did not receive any in-school suspensions, fewer than 5% received
an out-of-school suspension. Of students who received one or more in-school suspensions, about
one-third received an out-of school suspension the same year. It is well established that
misbehavior ‘tracks,’ that is, that early forms of misbehavior often lead to more serious forms
(Finn, 1989; 1993). The administration of in-school and out-of-school suspensions may reflect
that same principle.
Recommendation: In-school suspensions may offer the opportunity to identify elevated
suspension rates and disproportionate suspensions before students are removed from school
altogether. They should be monitored and reviewed regularly. Because students are still in school
and can interact with teachers and administrators, they offer an opportunity for alternative
approaches to discipline to be attempted and misbehavior prevented from escalating.
Limitations of the Study
Large scale survey data presented us with certain inescapable limitations; these included
characteristics of the sample and the measures in particular. The student response rate for the
ELS survey was 87%, quite good by conventional standards. However, the non-responders
would have included students currently skipping school, suspended, incarcerated, or in the
process of dropping out (together with those out of school for health reasons and others who
refused to participate). Dropouts in 10th
grades were probably a small group, but non-response
due to these reasons could create a downward bias in measures of suspension and misbehavior.

Misbehavior, Suspensions and Security
37
Although it was a limitation inherent in the data, the suspension rates we obtained appeared to be
in line with those reported elsewhere.
Of the measures in the current study student self-reports of misbehavior and suspensions
and the teacher reports of student misbehavior may be prone to respondent bias in one direction
or the other. For example, students may wish to ‘paint a better picture of themselves,’ thus
lowering their reports of misbehavior, or may wish to portray themselves as ‘confidently
misbehaving,’ thus increasing their reports. Teachers may have negative attitudes toward
particular students for a variety of reasons (including gender or race bias), thus perceiving and/or
judging those students’ misbehavior to be worse.
While we acknowledge these limitations, some procedures were put into place that could
reduce bias. For one, all of the surveys were conducted anonymously so that social desirability
bias may have been reduced. Also, as many questions as possible were asked with numerical
answers (e.g., none, 1 or 2, etc.) rather than judgment-laden categories (few, some, etc.),
including items in our behavior scales.
We took additional steps to reduce reporting bias. Student suspensions were
dichotomized into none--any to reduce the effect of students over-reporting disciplinary
consequences. Two teacher reports were considered and weighted for each student to reduce the
impact of one potentially biased teacher. Furthermore, student self-reports were compared to
teacher reports of misbehavior with significant agreement between sources, suggesting that,
although not perfect, bias based in misbehavior assessment was minimal.
Other features of ELS:2002 presented us with limitations that could not be overcome. For
one, the frequency of suspensions was reported but not the length. Thus, we were unable to
examine the relationship between other variables and the school and student characteristics of

Misbehavior, Suspensions and Security
38
interest and the severity or duration of suspensions. Also, the misbehavior items were asked
separately so it was not possible to study a particular suspension in relationship to a particular
misbehavior. This even allowed the possibility that a particular suspension was not in response to
any of the misbehaviors reported.42
Finally, due to increasing public pressure plus changing government regulations, the
ELS:2002 survey did not ask about more severe or violent types of misbehavior, for example,
drug/alcohol use in school, bringing or using weapons in school, or violent assaults on
teachers/other students. These misbehaviors may lead automatically to out-of-school
suspensions in many schools. Although this is a limitation of the current study, other research
indicates that many suspensions occur due to common and relatively mild misbehaviors like
those we examined (e.g., Mendez & Knoff, 2003).
42
The multiple-misbehavior (overall misbehavior) scales may have helped address this limitation.

Misbehavior, Suspensions and Security
39
Author Note
This study was a collaborative effort of the two authors. Both have conducted prior research in
this area and both participated in planning and carrying out the study. The development of
measures of school security and student misbehavior is an outgrowth of work presented in
Servoss’s doctoral dissertation, chaired by Finn. The remainder of the report represents the
authors’ combined work in this area.

Misbehavior, Suspensions and Security
40
References
Anderson, T.W. (1962). The choice of the degree of a polynomial regression as a multiple
decision problem. Annals of Mathematical Statistics, 33(1), 255-265.
Balfanz, R., & Byrnes, V. (2012). The importance of being in school: A report on absenteeism in
the nation’s public schools. Baltimore: Johns Hopkins University Center for Social
organization of Schools.
Blalock, H. (1967). Towards a theory of minority group relations. New York: Capricorn Books.
Blum, R. W., Beuhring, T., & Rinehart, P. M. (2000). Protecting teens: Beyond race, income, or
family structure. Princeton, NJ: Robert Wood Johnson Foundation.
Bracy, N.L. (2011). Student perceptions of high-security school environments. Youth and
Society, 43(1), 365-395. doi:10.1177/0044118X10365082
Brooks, K, Shiraldi, V, & Ziedenberg, J. (2000). School house hype: Two years later.
Washington, DC: Justice Policy Institute.
Bryk, A.S., & Thum, Y.M. (1989). The effects of high school organization on dropping out: An
exploratory investigation. American Education Research Journal, 26, 353-383.
Bureau of Justice Statistics. (2012). Number of violent victimizations, personal thefts/larcenies,
rape/sexual assaults, robberies, aggravated assaults, and simple assaults by region, 1993-
2011. Generated using the NCVS Victimization Analysis Tool at www.bjs.gov.
(12/21/2012).
Cohen, B.H. (2001). Explaining psychological statistics (2nd
ed). New York: John Wiley & Sons.
Duncan, A. (March 8, 2010). Crossing the Next Bridge. Remarks of the U.S. Secretary of
Education, Selma, Alabama: U.S. Department of Education. Retrieved February 10, 2012,
from http://www2.ed.gov/news/speeches/2010/03/03082010.thml

Misbehavior, Suspensions and Security
41
Eitle, T.M. & Eitle, D.J. (2004). Inequality, segregation, and the overrepresentation of African-
American in school suspensions. Sociological Perspectives, 47(3), 269-287.
Fabelo, T., Thompson, M. D., Plotkin, M., Carmichael, D., Marchbanks, M. P. III, and Booth E.
A. (2011). Breaking schools’ rules: A statewide study of how school discipline relates to
students’ success and juvenile justice involvement. New York , NY; College Station, TX:
Council of State Governments Justice Center; Public Policy Research Institute of Texas
A&M University.
Fine, M., & Powell, L. (2001). Small schools: An anti-racist intervention in urban America. In T.
Johnson, J. E. Boyden, & W. J. Pittz (Eds.), Racial Profiling and Punishment in U.S. Public
Schools (pp. 45-49). Oakland, CA: Applied Research Center.
Finn, J.D. (1989). Withdrawing from school. Review of Education Research, 59, 117-142.
Finn, J.D. (1993). School engagement and students at risk (NCES 93-470). Washington, DC:
U.S. Department of Education, National Center for Education Statistics.
Finn, J.D., & Rock, D.A. (1997). Academic success among students at risk for school failure.
Journal of Applied Psychology, 82, 221-234.
Finn, J. D., & Zimmer, K. S. (2011). Student engagement: What is it? Why does it matter? In
S. L. Christenson, A. L. Reschly, & C. Wylie (Eds). Handbook of research on student
engagement (pp. 97-131). New York: Springer Science.
Gregory, J.F. (1997). Three strikes and they’re out: African American boys and American
schools’ responses to misbehavior. International Journal of Adolescence and Youth, 7, 25-
34.
Gregory, A., Skiba, R.J., & Noguera, P.A. (2010). The achievement gap and the discipline gap:
Two sides of the same coin? Educational Researcher, 391(1), 59-68.

Misbehavior, Suspensions and Security
42
Gordon, R., Della Piana, L., & Keleher, T. (2000). Facing the consequences: An examination of
racial discrimination in U.S. public schools. Oakland, CA: Applied Research Center.
Haller, E.J. (1992). High school size and student indiscipline: Another aspect of the school
consolidation issue? Educational Evaluation and Policy Analysis, 14, 145-156.
Heller, K. A., Holtzman, W., & Messick, S. (Eds.). (1982). Placing children in special
education: A strategy for equity (pp. 322–381). Washington, DC: National Academy Press.
Hyman, I.A. & Perone, D.C. (1998). The other side of school violence: Educator policies and
practices that may contribute to student misbehavior. Journal of School Psychology, 36(1), 7-
27.
Ingels, S. J., Pratt, D. J., Rogers, J., Siegel, P. H. and Stutts, E. (2004). ELS:2002 Base Year Data
File User’s Manual (NCES 2004-405). U.S. Department of Education. Washington, DC:
National Center for Education Statistics.
Jessor, R., Donovan, J. E., & Costa, F. M. (1991). Beyond adolescence: Problem behavior and
young adult development. New York: Cambridge University Press.
Jessor, S., Turbin, M.S., & Costa, F.M. (1998). Protective factors in adolescent health behavior.
Journal of Personality & Social Psychology, 75, 788-800.
Kelley, B., Loeber, R., Keenan, K., DeLamatre, M., & Office of Juvenile Justice and Delinquent
Prevention (Dept. of Justice), W. C. (Dept. of Justice), Washington, DC. (1997).
Developmental Pathways in Boys' Disruptive Delinquent Behavior. Juvenile Justice Bulletin.
Kemple, J.J. and Snipes, J.C. (2000). Career Academies: Impacts on Students' Engagement and
Performance in High School. New York: Manpower Demonstration Research Corporation.
Retrieved August 15, 2012, from: http://www.mdrc.org/publications/41/execsum.html.

Misbehavior, Suspensions and Security
43
Lee, V., & Smith, J. (1997). High school size: Which works best and for whom? Educational
Evaluation and Policy Analysis, 19, 205-227.
Loeber, R., Farrington, D.P., Stouthamer-Loeber, M., & Van Kammen, W.B. (1998). Antisocial
behavior and mental health problems: Explanatory factors in childhood and adolescence.
Mahwah, NJ: Lawrence Erlbaum.
Loeber, R., Wung, P., Keenan, K., Giroux, B., Stouthamer-Loeber, M., Van Kammen, W.B., and
Maughan, B. 1993. Developmental pathways in disruptive child behavior. Development and
Psychopathology 5:103-133.
Losen, D.J. & Skiba, R.J. (2010, September). Suspended education: Urban middle schools in
crisis. Los Angeles: The Civil Rights Project at UCLA. Retrieved February 11, 2012, from:
http://civilrightsproject.ucla.edu/research/k-12-education/school-discipline/suspended-
education-urban-middle-schools-in-crisis/Suspended-Education_FINAL-2.pdf
Ma, X. (2003). Sense of belonging in school: Can schools make a difference? Journal of
Educational Research, 96, 340-349.
McNeely, C. A., Nonnemaker, J. M., & Blum, R. W. (2002). Promoting school connectedness:
Evidence from the National Longitudinal Study of Adolescent Health. Journal of School
Health, 72, 138-146.
Meier, K.J., Stewart, J., & England, R.E. (1989). Race, class, and education: The politics of
second-generation discrimination. Madison: University of Wisconsin Press.
Mendez, L. M., & Knoff, H. M. (2003). Who gets suspended from school and why: A
demographic analysis of schools and disciplinary infractions in a large school district.
Education and Treatment of Children, 26(1), 30-51.
Muscott, H. S., Mann, E., Benjamin, T. B., Gately, S., Bell, K. E., & Muscott, A. (2004).

Misbehavior, Suspensions and Security
44
Positive behavioral interventions and supports in New Hampshire: Preliminary results of a
statewide system for implementing schoolwide discipline practices. Education & Treatment
of Children, 27, 453-475.
National Center for Education Statistics and Bureau of Justice Statistics (NCES&BJS)
(2006).Indicators of school crime and safety. (NCES2007-003). Washington, DC: U.S.
Government Printing Office.
Osher, D., Bear, G. G., Sprague, J. R., & Doyle, W. (2010). How can we improve school
discipline? Educational Researcher, 39, 48–58.
Rasch, G. (1960). Probabilistic models for some intelligence and attainment tests. Copenhagen:
Danmarks Paedagogiske Institut.
Raudenbush, S.W., Bryk, A.S., Cheong, Y.F., & Congdon, R. (2004). HLM 6 for windows.
Lincolnwood, IL: Scientific Software International, Inc.
Resnick, M.D., Harris, K.M., & Shew, M. (1997). Protecting adolescents from harm: Findings
from the National Longitudinal Study on Adolescent Health. Journal of the American
Medical Association, 278, 823-832.
Resnicow, K., Ross-Gaddy, D., & Vaughan, R. D. (1995). Structure of problem and positive
behaviors in African American youths. Journal Of Consulting And Clinical Psychology,
63(4), 594-603. doi:10.1037/0022-006X.63.4.594
Rumberger, R.W. (1995). Dropping out of middle school: A multilevel analysis of students and
schools. American Educational Research Journal, 32, 583-625.
Rumberger, R.W. (2011). Dropping out: Why students drop out of high school and what can be
done about it. Cambridge, MA: Harvard University Press.
Misbehavior, Suspensions and Security
45
Skiba, R.J., Michael, R.S., Nardo, A.C., & Peterson, R.L. (2002). The color of discipline:
Sources of racial and gender disproportionality in school punishment. Urban Review, 34,
317-342.
Stewart, E. A. (2003). School social bonds, school climate, and school misbehavior: A multilevel
analysis. Justice Quarterly, 20(3), 575-604.
Snyder, T.G., & Tan, A.G. (2005). Digest of Education Statistics 2004 (NCES 2006-005). U.S.
Department of Education, National Center for Education Statistics. Washington, DC:
Government Printing Office.
Sugai, G., & Horner, R.H. (2002). The evolution of discipline practices: School-wide positive
behavior supports. Child and Family Behavior Therapy, 24, 23-50.
U.S. Department of Education (2001). An overview of small learning communities in high
schools. Washington, DC: U.S. Department of Education, Office of Elementary and
Secondary Education and Office of Vocational and Adult Education.
Wright, B.D., & Masters, G.N. (1982). Rating scale analysis. Chicago: MESA Press.
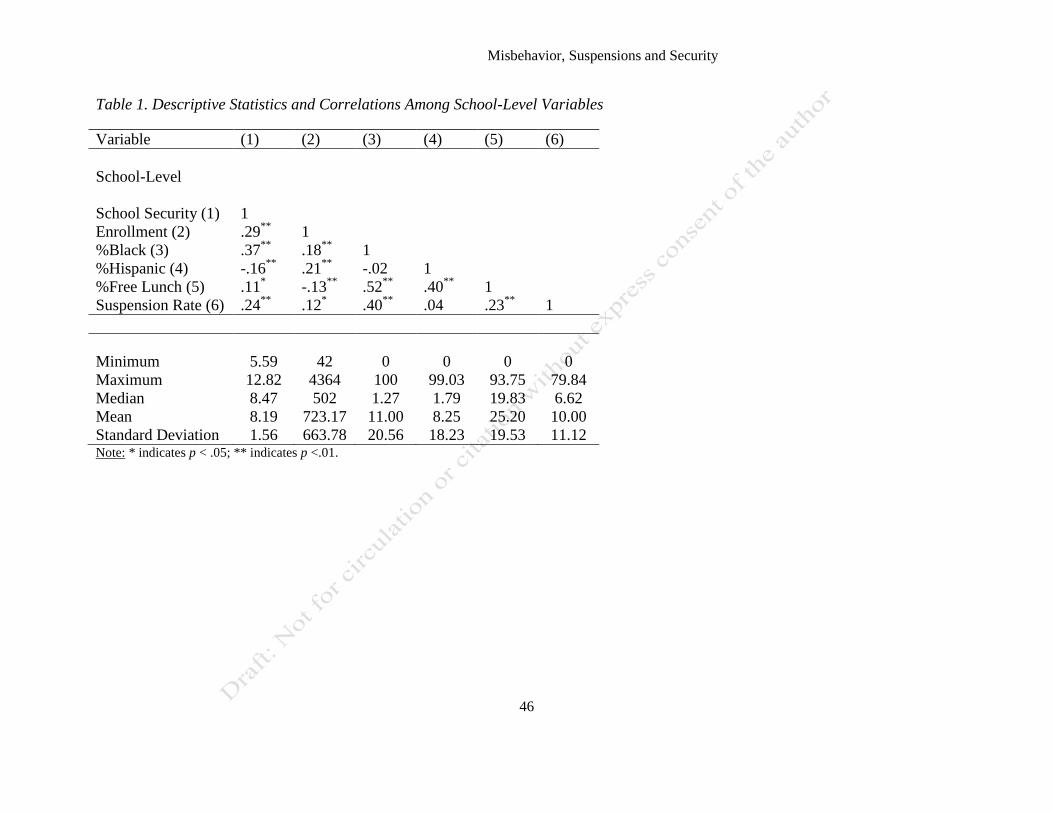
Misbehavior, Suspensions and Security
46
Table 1. Descriptive Statistics and Correlations Among School-Level Variables
Variable (1) (2) (3) (4) (5) (6)
School-Level
School Security (1) 1
Enrollment (2) .29**
1
%Black (3) .37**
.18**
1
%Hispanic (4) -.16**
.21**
-.02 1
%Free Lunch (5) .11* -.13
** .52
** .40
** 1
Suspension Rate (6) .24**
.12* .40
** .04 .23
** 1
Minimum 5.59 42 0 0 0 0
Maximum 12.82 4364 100 99.03 93.75 79.84
Median 8.47 502 1.27 1.79 19.83 6.62
Mean 8.19 723.17 11.00 8.25 25.20 10.00
Standard Deviation 1.56 663.78 20.56 18.23 19.53 11.12 Note: * indicates p < .05; ** indicates p <.01.
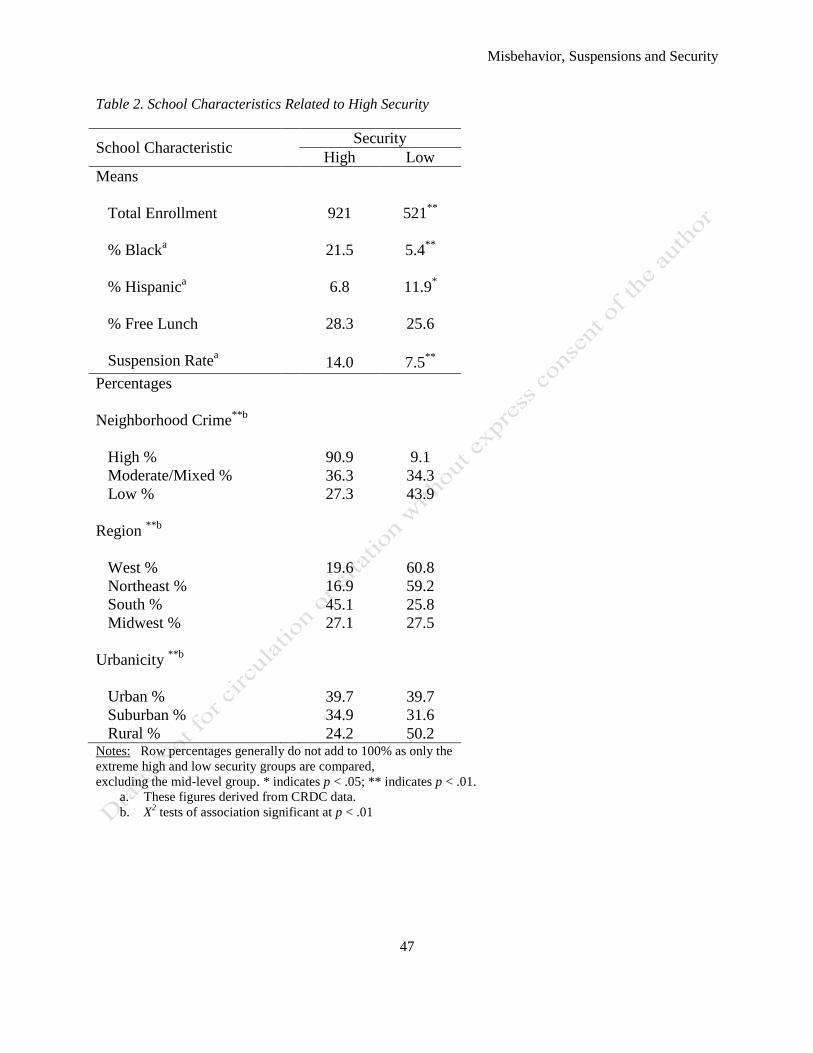
Misbehavior, Suspensions and Security
47
Table 2. School Characteristics Related to High Security
School Characteristic Security
High Low
Means
Total Enrollment 921 521**
% Blacka 21.5 5.4
**
% Hispanica 6.8 11.9
*
% Free Lunch 28.3 25.6
Suspension Ratea 14.0 7.5
**
Percentages
Neighborhood Crime**b
High % 90.9 9.1
Moderate/Mixed % 36.3 34.3
Low % 27.3 43.9
Region **b
West % 19.6 60.8
Northeast % 16.9 59.2
South % 45.1 25.8
Midwest % 27.1 27.5
Urbanicity **b
Urban % 39.7 39.7
Suburban % 34.9 31.6
Rural % 24.2 50.2 Notes: Row percentages generally do not add to 100% as only the
extreme high and low security groups are compared,
excluding the mid-level group. * indicates p < .05; ** indicates p < .01.
a. These figures derived from CRDC data.
b. X2 tests of association significant at p < .01
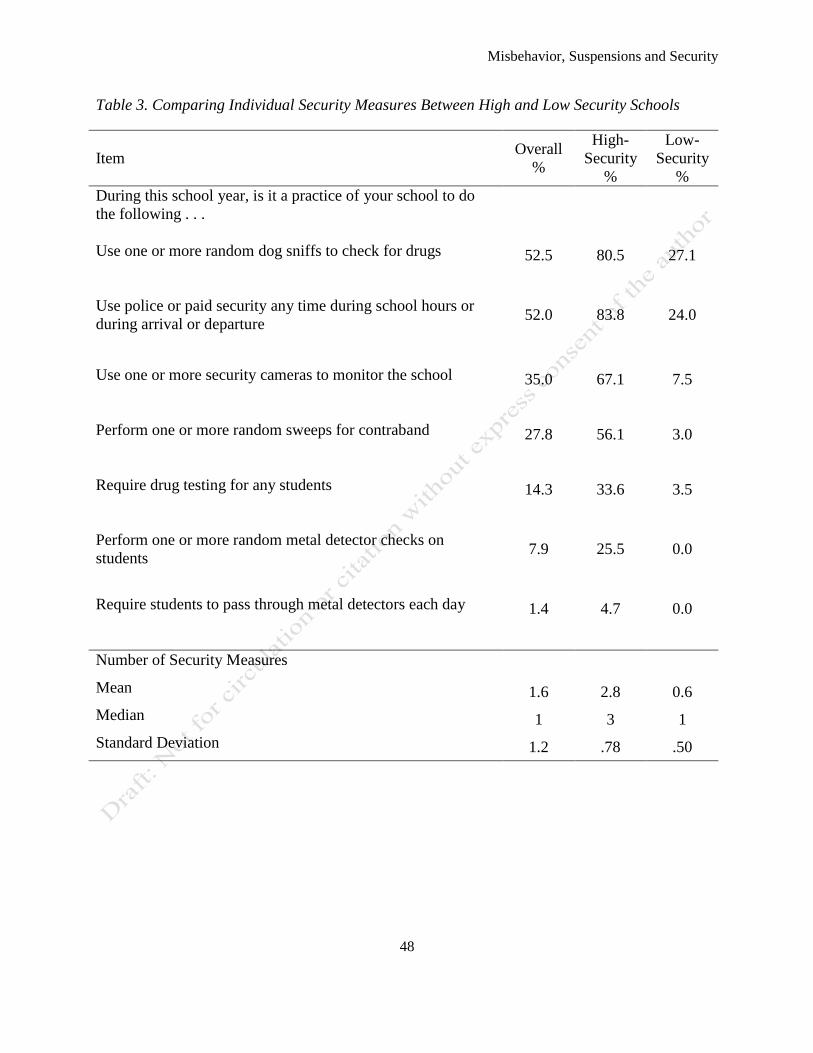
Misbehavior, Suspensions and Security
48
Table 3. Comparing Individual Security Measures Between High and Low Security Schools
Item Overall
%
High-
Security
%
Low-
Security
%
During this school year, is it a practice of your school to do
the following . . .
Use one or more random dog sniffs to check for drugs 52.5 80.5 27.1
Use police or paid security any time during school hours or
during arrival or departure 52.0 83.8 24.0
Use one or more security cameras to monitor the school 35.0 67.1 7.5
Perform one or more random sweeps for contraband 27.8 56.1 3.0
Require drug testing for any students 14.3 33.6 3.5
Perform one or more random metal detector checks on
students 7.9 25.5 0.0
Require students to pass through metal detectors each day 1.4 4.7 0.0
Number of Security Measures
Mean 1.6 2.8 0.6
Median 1 3 1
Standard Deviation 1.2 .78 .50
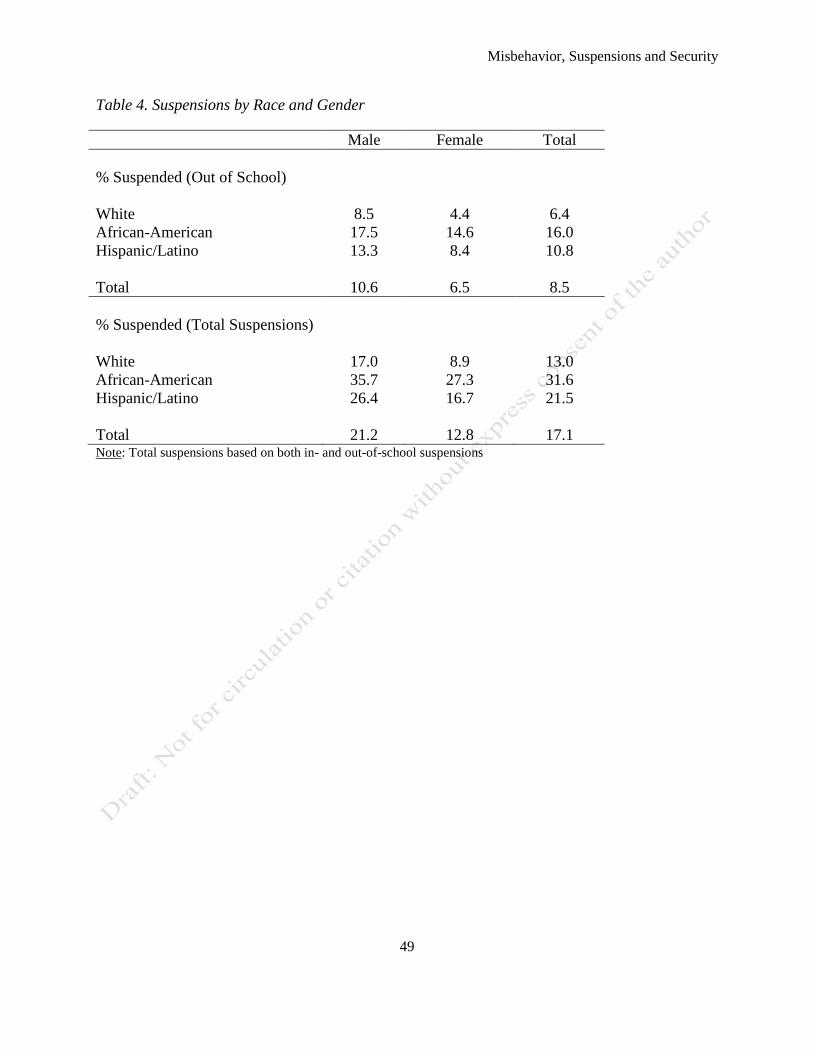
Misbehavior, Suspensions and Security
49
Table 4. Suspensions by Race and Gender
Male Female Total
% Suspended (Out of School)
White 8.5 4.4 6.4
African-American 17.5 14.6 16.0
Hispanic/Latino 13.3 8.4 10.8
Total 10.6 6.5 8.5
% Suspended (Total Suspensions)
White 17.0 8.9 13.0
African-American 35.7 27.3 31.6
Hispanic/Latino 26.4 16.7 21.5
Total 21.2 12.8 17.1 Note: Total suspensions based on both in- and out-of-school suspensions

Misbehavior, Suspensions and Security
50
Table 5. Student-Level Predictors of Suspensions Adjusted for School Characteristics
Predictor Out of School
Suspensions (OSS)
OSS Controlling for
Student Misbehavior
Total Suspensions
(TS)
TS Controlling for
Student Misbehavior
Student Characteristics Odds
Ratio
p-value Odds
Ratio
p-value Odds
Ratio
p-value Odds
Ratio
p-value
Misbehavior
Self-Report N/A 2.53 <.001 N/A 2.43 <.001
Teacher-Report N/A 1.44 <.001 N/A 1.70 <.001
Gender and Race
Male-Female 2.00 <.001 1.64 .004 2.14 <.001 1.86 <.001
Black-White 1.78 <.001 2.24 <.001 1.80 .003
Hispanic-White 2.23 <.001 1.64 .019 1.89 .001
Interactions
Black Male 0.41 .002 0.33 .001 0.51 .003 0.38 <.001
Hispanic Male Note: Blank spaces indicate non-significant relationships.

Misbehavior, Suspensions and Security
51
Table 6. Predicted Probabilities of Suspension by Race/Ethnicity in High vs. Low Security Schools With
and Without Controlling for Student Misbehavior
Not Controlling for Misbehavior Controlling for Misbehavior
Low Security High Security Low Security High Security
Out of School Suspensions %
White 6.5 6.0 2.8 2.7
Black 8.5 9.5 2.9 3.3
Total Suspensions %
White 12.8 11.8 6.2 5.8
Black 16.3 20.2 5.9 8.2

Misbehavior, Suspensions and Security
52
Figure 1. Total Suspensions by Race, Gender, and School Size
0
5
10
15
20
25
30
35
40
45
0-300 301-600 601-900 901-1200 >1200
S
u
s
p
s
e
n
s
i
o
n
R
a
t
e
School Size
White Males
White Females
Black Males
Black Females

Misbehavior, Suspensions and Security
53
Technical Appendix
(A) Sampling of Students and Schools in ELS:2002.
Sampling for ELS:2002 was conducted in two stages (see Ingels et al., 2004 for details).
Schools were sampled first followed by students within schools. Schools were selected based on
a probability proportional to size, stratified by U.S. Census division and metropolitan status (i.e.
urban, suburban, and rural). Ultimately, 752 schools chose to participate in the study, including
502 public schools with white, black, and/or Hispanic students. Twenty-six students were
targeted for selection from each school (although the actual number varied with an actualized
mean of about 20). Hispanic and Asian students were oversampled to allow for precision in
statistical analyses involving these groups of students. The participation rate for students was
approximately 87%. The sample for the present study consisted of 8,775 tenth grade students in
500 public schools.
(B) The Misbehavior Measures
This study used two constructed behavior scales, one based on student self reports (5 items)
and one based on two teachers’ ratings of each student (8 items). Both scales consisted of a set of
misbehaviors related to the school setting, e.g., attendance, getting in trouble, disrupting the
class.
The correlations among the items in the self reported behavior scale ranged from 0.14 to
0.45. The Rasch analysis indicated that a single score accounted for 85.3% of variation among
students in their self reported behavior; that is, the single score represented the overall
misbehavior level of a student well. This was consistent with prior research showing that
multiple misbehaviors tend to ‘cluster.’ The internal consistency reliability of the 5-item set
(coefficient alpha) was 0.69, which is adequate or better for large scale research.

Misbehavior, Suspensions and Security
54
The correlations among the items in the teacher reports ranged from 0.07 to 0.61. The eight-
question teacher scale accounted for 79.5% of variation among students in their behavior. The
internal reliability of the 8-item set was 0.85, which is considered to be high. This too was
consistent with the concept of a single factor underlying multiple misbehaviors.
As a rough check on reporting bias, we examined the extent of agreement between student
reports and teacher reports for two items that were most similar: number of times absent from
school (student) with number of times absent from class (English and math teachers), and
number of times late to school (student) with number of times late to class (teachers). The
response categories for the two scales were somewhat different. Students reported the actual
number of instances of each, and teachers reported “never,” “sometimes,” and so on. Thus, we
counted responses that agreed within one category of the parallel response on the other scale, for
example “never” (student) with “never” or “rarely” (teacher), “1-2 times” (student) with “rarely”
or “sometimes” (teacher), and so on.
On absence, the extent of “agreement” was 69% to 70%. Of the “disagreements,” somewhat
more teachers gave higher ratings (more absences) than did students (approximately 17%
compared to 13%). This might be expected if students attend school but skip a class. On lateness,
the extent of agreement was 67% to 68%. Of the disagreements, more students gave higher
ratings (more lateness) than did teachers rather than lower ratings (approximately 19% compared
to 13%). In all, the level of agreement appeared high and there was no conspicuous evidence of
students exaggerating their responses in a socially desirable direction or of teachers reporting
excess absences or lateness.
The correlation between the two behavior scales (r = 0.49) was substantial and statistically
significant, suggesting further that they were measuring the same or similar constructs.

Misbehavior, Suspensions and Security
55
(C) Details of the Analysis
All analyses were conducted using sampling weights for schools and students provided in
the ELS:2002 data files. This corrected for oversampling of certain groups (e.g., Hispanic
students) and for questionnaire nonresponse.
The school level analyses (Question 1) were performed using SPSS version 19. The
program requires the sampling weights to be normed to the unweighted sample size beforehand
in order to produce correct degrees of freedom for statistical tests. Questions (2) – (4) were
addressed through a series of multilevel logistic regression models using the HLM 6.06 program
(Raudenbush, Bryk, Cheong, & Congdon, 2004). The levels of analysis were schools and
students within schools. Each analysis described here was performed twice, once with out-of-
school suspensions as the dependent variable and again with total suspensions.
All regressions for questions (2) – (4) included school type (high school or combined
elementary/high school) as a control variable (block 1). The remaining predictor variables were
entered as blocks in a predetermined (fixed) order. The effect of each block was tested above and
beyond all preceding blocks, followed routinely in most regression analyses; this was shown by
Anderson (1962) to provide uniformly most powerful tests. Block 2 included geographic region,
school urbanicity, and the rating of neighborhood crime. Block 3 included characteristics of the
student population: percent of students on free lunch, percent Hispanic, and percent black
students. Blocks 4 and 5 had one variable each, school enrollment and the numeric security scale.
Some of the predictor variables in these analyses were categorical, specifically,
geographic region, urbanicity, neighborhood crime, student gender and race. Special variables
(“dummy codes”) were entered into the regression analysis in order to compare one group to
another. For regions, we compared the west, northeast and south to the midwest, respectively; for

Misbehavior, Suspensions and Security
56
urbanicity, we compared rural and suburban schools to urban schools; for neighborhood crime,
we compared high and moderate/mixed areas to low-crime areas, respectively; for gender, we
compared male suspension rates with those of females; for race/ethnicity, suspension rates for
black students and Hispanic/Latino students were compared to those of whites, respectively.
These particular comparisons were chosen for convenience; the “overall tests” (e.g., test of
different suspension rates among all four regions) are unchanged regardless of the specific
comparisons chosen.
For questions about suspensions being proportional to student misbehavior (3A and 4),
the student and teacher misbehavior ratings were entered as the first predictors. Thus all other
results were controlled statistically for misbehavior and we asked whether there were
relationships between the predictors and suspensions above and beyond that explained by student
behavior.
For question (3), additional student characteristics were added to the regressions. These
comprised two blocks. Block 6 included the gender effect and the two dummy variables for
race/ethnicity (black – white and Hispanic – white). This allowed us to test for gender and race
differences in suspensions. Block 7 included two race-by-gender interaction dummy variables;
these allowed us to test whether suspension rates were especially high or low for particular
gender-race combinations.
Question (4) concerned the school characteristics related to gender or racial/ethnic
differences in suspension rates. To answer this, a set of cross-level interactions were added to the
regressions, that is, school characteristics-by-student characteristics interactions. A significant
interaction indicated that higher values on the school characteristic (e.g., school size) were
associated with greater gender or racial disproportion in suspension rates.
Misbehavior, Suspensions and Security
57
Blockwise tests of significance. For effects that included two or more predictors (region,
urbanicity, crime, race/ethnicity and all interactions with these), individual predictors were tested
only if the overall (“omnibus”) test of the block was significant. This two-step procedure,
referred to as “Fisher’s protected t-test approach,” provides additional protection against type I
errors when several statistical tests are performed (Cohen, 2001, chapter 13).
More about odds ratios. Odds ratios are used to indicate how large a difference is
between proportions when there are two separate groups of participants (e.g., males and
females). They are also used in the regressions to show the change in odds associated with a
given change in a numeric predictor variable. For example, the odds of a student being
suspended (in total) when a school has 5% additional black students went up by a factor of 1.03
(Table A3); this was a small difference.
(D) Detailed Results
Fighting and suspensions. The relationship of fighting in school with out-of-school
suspensions was substantially stronger than the relationship of the total misbehavior scale with
suspensions. Of students who reported getting into a physical fight once or twice, 29% had been
suspended; of those who reported getting into a fight more than twice, 45.1% had been
suspended.
The suspension rates for the three racial/ethnic groups also differed for fighting. Of
students who reported being in a fight once or twice, 24.4% of whites had been suspended
during the year, 31.0% of Hispanic/Latino students, and 39.2% of black students. Of those who
had been in a fight more than twice, similar percentages had been suspended: 43.4% of whites,
47.6% of Hispanic/Latino students, and 47.1% of black students.

Misbehavior, Suspensions and Security
58
We must emphasize, however, that our data do not indicate if the suspensions were
connected to instances of fighting. The reports of fighting and the report of suspensions were
separate questions in the ELS:2002 survey.
Misbehavior ratings. The means for gender and racial/ethnic groups are given in Table
A1. According to teachers and the students, males exhibited more misbehavior than did female
students.43
According to the teachers, black students exhibited more misbehavior than did
Hispanic/Latino students, and white students exhibited substantially less than both minority
groups. According to student self reports, black students did not misbehave as much as
Hispanic/Latino students did although the difference is relatively small. White students reported
less misbehavior than either minority group. The pattern of racial/ethnic differences was the
same both for male and female students.
Table A1. Misbehavior by race and gender
Male Female Total
Misbehavior-Self Reported
White 7.96 7.78 7.87
African-American 8.26 8.00 8.14
Hispanic/Latino 8.35 8.13 8.24
Total 8.07 7.87 7.97
Misbehavior-Teacher Reported
White 7.28 6.77 7.02
African-American 7.94 7.51 7.72
Hispanic/Latino 7.62 7.27 7.44
Total 7.43 6.96 7.19
43
We did not perform statistical tests on these means. However, the standard deviations can be used to derive
strength-of-effect measures for the differences. For example, the male – female difference on self-reported
misbehavior is 0.20 points (8.07 – 7.87) and the standard deviation of the measures is 1.52 points. Thus the effect
size for the difference is 0.20/1.52 = 0.13, which represents a small difference. Foe teacher reported behavior, the
gender effect size is (7.42 – 6.96)/1.61 = 0.29, which represents a small-to-moderate difference.

Misbehavior, Suspensions and Security
59
Note: Standard deviations are 1.52 for self-reported and 1.61 for teacher-reported misbehavior.
Question 3 and 3A: Full regression results for out-of-school and total suspensions
Table A2. Predictors of Out of School Suspensions
Predictor Out of School
Suspensions (OSS)
OSS Controlling for
Student Misbehavior
Characteristics OR p OR p
Block 0
Misbehavior
Self-Report N/A
X2(2) = 218, p = <.001
2.53 <.001
Teacher-Report N/A 1.44 <.001
Block 1 X2(1) = 0.13, p > .50 X
2(1) = 0.55, p > .50
Grades 9-12 Only
Block 2 X2(7) = 22.58, p = .002 X
2(7) = 23.38, p = .002
Region
West-Midwest
Northeast-Midwest 1.47 .041
South-Midwest
Urbanicity
Rural-Urban
Suburban-Urban
Neighborhood Crime
High-Low 1.98 .006
Moderate/Mixed-Low 1.72 <.002 21.81 .001
Block 3 X2(3) = 6.15, p = .103 X
2(3) = 5.61, p = .131
% Free Lunch/5
% Hispanic/5
% Black/5
Block 4 X2(1) = 0.13, p > .50 X
2(1) = 0.54, p > .50
Enrollment/300
Block 5 X2(1) = 0.26, p > .50 X
2(1) = 0.02, p > .50
Security
Student Characteristics
Block 6 X2(3) = 52.88, p < .001 X
2(3) = 24.22, p < .001
Male-Female 2.00 <.001 1.64 .004
Black-White 1.78 <.001
Hispanic-White 2.23 <.001 1.64 .019
Block 7 X2(2) = 10.25, p = .006 X
2(2) = 11.21, p = .004
Black Male 0.41 .002 0.33 .001
Hispanic Male Note: Blank spaces indicate non-significant relationships.

Misbehavior, Suspensions and Security
60
Table A3. Predictors of Student Total Suspensions
Predictor Total Suspensions (TS) TS Controlling for
Student Misbehavior
Characteristics OR p OR p
Block 0
Misbehavior
Self-Report N/A
X2(2) = 550, p = <.001
2.43 <.001
Teacher-Report N/A 1.70 <.001
Block 1 X2(1) = 0.56, p > .50 X
2(1) = 2.03, p = .15
Grades 9-12 Only
Block 2 X2(7) = 28.76, p < .001 X
2(7) = 48.63, p < .001
Region
West-Midwest
Northeast-Midwest
South-Midwest
Urbanicity
Rural-Urban
Suburban-Urban
Neighborhood Crime
High-Low 1.97 .022
Moderate/Mixed-Low 1.82 <.001 2.11 <.001
Block 3 X2(3) = 12.28, p = .007 X
2(3) = 4.18, p = .24
% Free Lunch/5
% Hispanic/5
% Black/5 1.03 .059
Block 4 X2(1) = 2.98, p = .08 X
2(1) = 0.85, p > .50
Enrollment/300
Block 5 X2(1) = 0.38, p > .50 X
2(1) = 0.02, p > .50
Security
Student Characteristics
Block 6 X2(3) = 78.28, p < .001 X
2(3) = 31.35, p < .001
Male-Female 2.14 <.001 1.86 <.001
Black-White 2.24 <.001 1.80 .003
Hispanic-White 1.89 .001
Block 7 X2(2) = 9.14, p = .01 X
2(2) = 9.14, p = .002
Black Male 0.51 .003 0.38 <.001
Hispanic Male Note: Blank spaces indicate non-significant relationships.

Misbehavior, Suspensions and Security
61
Question 4: School characteristics related to disproportionate suspensions.
Besides school security and school size, several non-manipulable characteristics of
schools were associated with greater or smaller disparities in suspensions. These are summarized
in Tables A4 and A5 for out-of-school and total suspensions, respectively. In these tables, the
rows are the school characteristics (composition of student body, urbanicity, and neighborhood
crime) and the columns are the specific types of disparity (male – female differences; black –
white differences; Hispanic – white differences; specific disparities for black males compared to
black females and all white students). The entries in the tables are the odds ratio for the effect of
the particular school characteristic on the particular disparity in suspensions. Two entries are
shown for each effect (No/Yes), showing whether the effect was statistically significant without
considering different degrees of student misbehavior, and with statistical control for the extent of
misbehavior, respectively. No entry is made for effects that were not statistically significant.
In terms of the composition of the student body, there was a small but significant
tendency for males to be suspended at lower rates than females as the percentage of black
students attending the school increased (odds ratio= 0. 94 and 0.93 for out-of-school suspensions
and 0.93 and 0.91 for total suspensions). Similar trends were found for the percentage of
Hispanic/Latino students and the percentage of free-lunch students in the school: fewer males
compared to females were suspended in schools with higher percentages of Hispanic students or
higher percentages of free-lunch students. And, in terms of out-of-school suspensions, fewer
males were suspended compared to females in schools in high-crime neighborhoods. In contrast,

Misbehavior, Suspensions and Security
62
males were suspended at higher rates than were females in suburban schools relative to urban
schools, where the male-female difference was smaller.
Table A4. Odds Ratios of Significant Cross-Level Interactions Predicting Out of School
Suspensions
School Characteristic Student-Level Effect
Male Black Hispanic Black x Male
Adjusted for Misbehavior?
No Yes No Yes No Yes No Yes
Security
Enrollment/300 1.13* 1.19
* 1.39
*
% Black/5 0.94**
0.93**
% Hispanic/5 0.93* 0.93
*
% Free Lunch/5 0.92**
Urbanicity
Suburban-Urban 1.93* 2.17
*
Rural-Urban 2.86**
3.05* 0.35
** 0.14
* 0.09
*
Crime
High-Low 0.30**
0.32*
Mod/Mixed-Low 0.50* 0.49
* 1.91
* 2.40
*
Note: * indicates p < .05; ** indicates p < .01. Blank spaces indicate non-significant results. The Hispanic x Male
column was excluded because this term did not interact significantly with any of the school-level variables.
All of these effects are consistent; they may be indicative of higher suspension rates for
females in high minority schools, high free-lunch schools, schools in high crime neighborhoods,

Misbehavior, Suspensions and Security
63
and urban schools. The higher rate for females would approach that for males, resulting in a
smaller gender disparity. No other school characteristic was consistently related to the degree of
racial/ethnic or gender disparities in suspensions.
Table A5. Odds Ratios of Significant Cross-Level Interactions Predicting Total Suspensions
School Characteristic Student-Level Effect
Male Black Hispanic Black x Male
Adjusted for Misbehavior?
No Yes No Yes No Yes No Yes
Security 1.32**
1.39**
Enrollment/300 0.90* 1.28
* 1.54
**
% Black/5 0.93**
0.91**
% Hispanic/5 0.95*
% Free Lunch/5 0.93**
Urbanicity
Suburban-Urban 1.62**
1.95*
Rural-Urban 0.35**
Crime
High-Low 0.30*
Mod/Mixed-Low Note: * indicates p < .05; ** indicates p < .01. Blank spaces indicate non-significant results. The Hispanic x Male
column was excluded because this term did not interact significantly with any of the school-level variables.