Contents · Nishat Mis imited 1 Company Information Board of Directors Mian Umer Mansha Chief...
208
Transcript of Contents · Nishat Mis imited 1 Company Information Board of Directors Mian Umer Mansha Chief...
ContentsCorporate
Company Information ..................................... 1Directors’ Profile ............................................. 2Vision and Mission ......................................... 4Chairman’s Review ......................................... 5Directors’ Report ............................................ 6Financial Highlights ...................................... 20Statement of Compliance with the Code of Corporate Governance .................. 22 Review Report to the Members on the Statement of Compliance with the Code of Corporate Governance .............. 24Notice of Annual General Meeting ............... 25Jama Punji Ad .............................................. 34
Financial Statements ofNishat Mills Limited
Auditors’ Report to the Members ................. 37Balance Sheet .............................................. 38Profit and Loss Account ............................... 40Statement of Comprehensive Income .......... 41Cash Flow Statement .................................... 42Statement of Changes in Equity ................... 43Notes to the Financial Statements ................ 44
Consolidated Financial Statements of Nishat Mills Limited and its Subsidiaries
Directors’ Report ........................................ 103Auditors’ Report to the Members ............... 105Consolidated Balance Sheet ..................... 106Consolidated Profit and Loss Account ....... 108Consolidated Statement of Comprehensive Income .......................... 109Consolidated Cash Flow Statement .......... 110Consolidated Statement of Changes in Equity ................................................... 111Notes to the Consolidated Financial Statements ............................................... 112Pattern of Holding of the Shares ............... 181Directors’ Reports Consolidated in Urdu ... 187Directors’ Reports in Urdu .......................... 201Forms of Proxy in Urdu & English
1Nishat Mills Limited
Company InformationBoard of DirectorsMian Umer ManshaChief Executive Officer
Mian Hassan ManshaChairman
Syed Zahid HussainMr. Khalid Qadeer QureshiMr. Farid Noor Ali FazalMr. Ghazanfar Husain MirzaMr. Maqsood Ahmad
Audit CommitteeMr. Khalid Qadeer QureshiChairman / Member
Syed Zahid HussainMember
Mr. Farid Noor Ali FazalMember
Human Resource & Remuneration (HR & R) CommitteeMr. Khalid Qadeer QureshiChairman / Member
Mian Umer ManshaMember
Mr. Farid Noor Ali FazalMember
Chief Financial OfficerMr. Badar-ul-Hassan
Company SecretaryMr. Khalid Mahmood Chohan
AuditorsRiaz Ahmad & CompanyChartered Accountants
Legal Advisor Mr. M. Aurangzeb Khan, Advocate, Chamber No. 6, District Court, Faisalabad.
Bankers to the CompanyAlbaraka Bank (Pakistan) Limited Allied Bank LimitedAskari Bank LimitedBank Alfalah LimitedBank Islami Pakistan Limited Burj Bank Limited
Citibank N.A.Deutsche Bank AGDubai Islamic Bank Pakistan Limited Faysal Bank LimitedHabib Bank LimitedHabib Metropolitan Bank Limited Industrial and Commercial Bank of China LimitedJS Bank LimitedMeezan Bank LimitedMCB Bank LimitedMCB Islamic Bank Limited National Bank of Pakistan NIB Bank LimitedPak Brunei Investment Company LimitedPakistan Kuwait Investment Company (Private) Limited PAIR Investment Company Limited Samba Bank LimitedSilk Bank LimitedSoneri Bank LimitedSummit Bank LimitedStandard Chartered Bank (Pakistan) LimitedThe Bank of PunjabUnited Bank Limited
Mills
Spinning units, Yarn Dyeing& Power plantNishatabad, Faisalabad.
Spinning units & Power plant20 K.M. Sheikhupura FaisalabadRoad, Feroze Watwan.
Spinning units & Power plantPlot No. 172-208, M-3 Industrial City, Sahianwala, FIEDMC, 2 K.M. Jhumra Chiniot Road, Chak Jhumra, Faisalabad.
Weaving units & Power plant12 K.M. Faisalabad Road, Sheikhupura.
Weaving units, Dyeing & Finishing unit,Processing unit, Stitching units and Power plants5 K.M. Nishat Avenue Off 22 K.M. Ferozepur Road, Lahore.
Stitching unit21 K.M. Ferozepur Road, Lahore.
Apparel Units7 K.M. Nishat Avenue Off 22 K.M. Ferozepur Road, Lahore.
2 K.M. Nishat Avenue Off 22 K.M. Ferozepur Road, Lahore.
Registered officeNishat House,53 - A, Lawrence Road, Lahore.Tel: 042-36360154, 042-111 113 333 Fax: 042-36367414
Shares RegistrarTHK Associates (Private) Limited
Head Office, Karachi1st Floor, 40-C, Block-6,P.E.C.H.S, Karachi-75400Tel: 021-34168270,021-111 000 322Fax: 021-34168271
Branch Office, Lahore1st Floor, DYL Motorcycles Limited Office, 147-Q Block, behind Emporium Mall, Johar Town, LahoreTel: 0303-4444795, 0323-8999514
Head Office7, Main Gulberg, Lahore.Tel: 042-35716351-59,042-111 332 200Fax: 042-35716349-50E-mail: [email protected] Website: www.nishatmillsltd.com
Liaison OfficeIst Floor, Karachi Chambers, Hasrat Mohani Road, Karachi. Tel: 021-32414721-23Fax: 021-32412936
2
Directors’ Profile
Mian Umer Mansha holds a Bachelors degree in Business Administration from USA. He has been serving on the Board of Directors of various listed companies for more than 20 years.
He also serves on the Board of Adamjee Insurance Company Limited, MCB Bank Limited, Adamjee Life Assurance Company Limited, Nishat Dairy (Private) Limited, Nishat Hotels and Properties Limited, Nishat (Aziz Avenue) Hotels and Properties Limited, Nishat (Raiwind) Hotels and Properties Limited, Nishat (Gulberg) Hotels and Properties Limited, Nishat Developers (Private) Limited,Nishat Agriculture Farming (Private) Limited, NishatFarms Supplies (Private) Limited and Hyundai Nishat Motor (Private) Limited.
Mian Hassan Mansha has been serving on the Board of various listed companies for several years. He also serves on the Board of Nishat Power Limited, Security General Insurance Company Limited, Lalpir Power Limited, Pakgen Power Limited, Nishat Hotels and Properties Limited, Nishat (Aziz Avenue) Hotels and Properties Limited, Nishat (Raiwind) Hotels and Properties Limited, Nishat (Gulberg) Hotels and Properties Limited, Nishat Hospitality (Private) Limited, Nishat Dairy (Private) Limited, Pakistan Aviators and Aviation (Private) Limited, Nishat Automobiles (Private) Limited, Nishat Real Estate Development Company (Private) Limited, Nishat Agriculture Farming (Private) Limited, Nishat Farms Supplies (Private) Limited and Hyundai Nishat Motor (Private) Limited.
Syed Zahid Hussain is a seasoned professional in Pakistan’s corporate world. He possesses multi faceted talents and has attained exemplary accomplishments. He has in-depth knowledge of a wide range of subjects and has extensively diversified experience and exposure in senior positions. He has earned B.Sc, LLB and MA in International Relations. He has a vast experience of working as Chairman / Chief Executive / Director of various state owned enterprises and listed companies. He has also served as the High Commissioner / Ambassador of Pakistan in Kenya, with accredited assignments of Ambassadorship in Tanzania, Uganda, Rwanda, Krundse, Ethiopia and Eritrea. He is a fellow member of the Institute of Management, England, International Biographical Center, USA and the Institute of Marketing Management, Karachi.
Mr. Khalid Qadeer Qureshi is a fellow member of the Institute of Chartered Accountants of Pakistan. He has over 45 years of rich professional experience. He also serves on the Board of D.G. Khan Cement Company Limited, Nishat Power Limited, Lalpir Power Limited, Pakgen Power Limited, Nishat Paper Products Company Limited and Nishat Commodities (Private) Limited.
Mian Umer ManshaChief Executive Officer
Mian Hassan ManshaChairman
Syed Zahid HussainIndependent Non-Executive
Director
Mr. Khalid Qadeer QureshiNon-Executive Director
3Nishat Mills Limited
Mr. Farid Noor Ali Fazal is a Bachelor of Commerce, Bachelor of Laws and Bachelor of Management. He has more than 44 years’ experience of marketing. He has worked on various positions in Middle East and USA. He is associated with cement industry in one form or the other and was the acting chairman of All Pakistan Cement Manufacturers Association in 2002. He also serves on the Board of D. G. Khan Cement Company Limited.
Mr. Ghazanfar Hussain Mirza has a Bachelor degree in Mechanical Engineering from NED University of Engineering & Technology. Mr. Mirza has 37 years of experience in business development and business & corporate management in engineering, technical and multinational environment. He has served as Managing Director of Group Companies of Wartsila Corporation (Finland) in Pakistan and Saudi Arabia. He also serves on the Board of Nishat Power Limited and holds the office of Chief Executive Officer of Pakgen Power Limited.
Mr. Maqsood Ahmad holds a Masters degree and a rich professional experience of over 25 years in the textile industry, especially in the spinning business. He is a Certified Director by completing the Director’s Training Program from ICAP. He is actively involved in the strategic decisions relating to the operations of the Company.
Mr. Farid Noor Ali FazalNon-Executive Director
Mr. Maqsood AhmedExecutive Director
Mr. Ghazanfar HussainMirza
Non-Executive Director
4
To transform the Company into a modern and dynamic yarn, cloth and processed cloth and finished product manufacturing Company that is fully equipped to play a meaningful role on sustainable basis in the economy of Pakistan. To transform the Company into a modern and dynamic power generating Company that is fully equipped to play a meaningful role on sustainable basis in the economy of Pakistan.
Vision and Mission
Our Vision
Our MissionTo provide quality products to customers and explore new markets to promote/expand sales of the Company through good governance and foster a sound and dynamic team, so as to achieve optimum prices of products of the Company for sustainable and equitable growth and prosperity of the Company.
5Nishat Mills Limited
Chairman’s Review ReportFinancial year 2016-17 was another tough year for the textile sector in Pakistan. A significant drop was recorded in the textile exports which is mainly attributable to high cost of production as compared to that of our competitors. The cost of doing business such as high labour cost, expensive gas, soaring power tariff and over-valued Pak rupee created pressure on textile sector. Decline in textile exports is the continuation of consistent trend due to which textile exports have decreased by around 14% over the last ten years. Against this background, the Government of Pakistan announced Rs. 180 billion incentive package for the exports oriented sectors of which textile sector was the main beneficiary. This package included rebates on exports, reduction in import duties of machinery and man made fibers except polyester, imposition of additional duties on import of Indian yarn and subsidy on long term loans for up-gradation of plant and machinery.
Despite the difficulties faced by the textile sector, our Company performed considerably well and top line grew by 2.60% in the current year as compared to the corresponding last year. However, above mentioned high cost of production and intense competition were the main reasons for decrease in profits during the year. The Board and management of the Company are committed to enhance the rate of return for the shareholders of the Company. The Company expects better performance during the financial year 2017-18. The Company is also focused to fulfill the needs of its customers and several BMR projects are underway.
In addition to profits from its operations, dividend income is another regular source of income for the Company. The Company has made equity investment in a number of subsidiaries and associated companies. During the year, the Board approved equity investment in Hyundai Nishat Motor (Private) Limited for setting up a green field project for assembly and sales of HMC passenger and 1 ton range commercial vehicles in Pakistan.
It is matter of immense pleasure that the Company’s contribution towards the society and country is enormous in terms of being one of the largest providers of employment and leading exporter.
Mian Hassan ManshaChairman
September 25, 2017Lahore
6
Directors’ Report
Directors of Nishat Mills
Limited (“the Company”) are pleased
to present the annual report of
the Company for the year
ended 30 June 2017 along with
the financial statements and auditors’ report
thereon.
FINANCIAL REVIEW
Financial PerformanceProfitability of the Company decreased during the financial year ended 30 June 2017 as compared to the profitability of corresponding last year ended 30 June 2016 mainly due to increase in cotton prices, increase in labour cost due to increase in minimum wages from Rs. 13,000 to Rs. 14,000 per month, increase in fuel and power cost and decrease in profit margins due to low demand in international market. However, finance cost decreased due to better financial planning and fund management.
The summary of the key profitability measures is presented below.
Financial highlights 2017 2016 Rupees(000) Rupees(000)
Revenue 49,247,657 47,999,179Gross profit 5,379,838 6,239,391EBITDA 8,235,549 8,937,616Depreciation 2,300,135 2,166,357Finance cost 915,072 1,046,221Dividend Income 3,403,733 3,700,227Pre-tax profit 5,020,342 5,725,038After tax profit 4,262,342 4,923,038
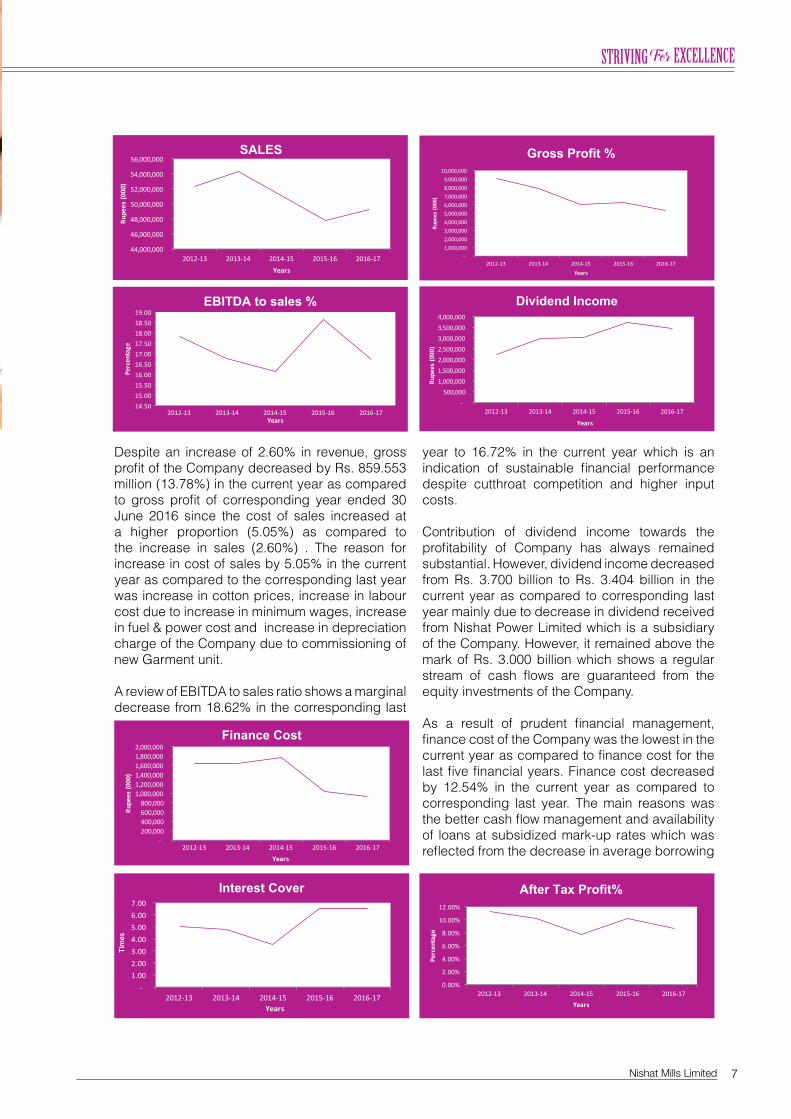
Revenue recorded an increase of Rs. 1,248.478 million (2.60%) in the current year as compared to the corresponding year ended 30 June 2016. Primary reason for this increase was the increase in export sales from US$ 344.744 million to US$ 350.736 despite severe competition and slow global demand for textile products and amount of Rs. 841.530 million accrued on account of duty draw back incentive on export sales.
7Nishat Mills Limited
Despite an increase of 2.60% in revenue, gross profit of the Company decreased by Rs. 859.553 million (13.78%) in the current year as compared to gross profit of corresponding year ended 30 June 2016 since the cost of sales increased at a higher proportion (5.05%) as compared to the increase in sales (2.60%) . The reason for increase in cost of sales by 5.05% in the current year as compared to the corresponding last year was increase in cotton prices, increase in labour cost due to increase in minimum wages, increase in fuel & power cost and increase in depreciation charge of the Company due to commissioning of new Garment unit.
A review of EBITDA to sales ratio shows a marginal decrease from 18.62% in the corresponding last
year to 16.72% in the current year which is an indication of sustainable financial performance despite cutthroat competition and higher input costs.
Contribution of dividend income towards the profitability of Company has always remained substantial. However, dividend income decreased from Rs. 3.700 billion to Rs. 3.404 billion in the current year as compared to corresponding last year mainly due to decrease in dividend received from Nishat Power Limited which is a subsidiary of the Company. However, it remained above the mark of Rs. 3.000 billion which shows a regular stream of cash flows are guaranteed from the equity investments of the Company.
As a result of prudent financial management, finance cost of the Company was the lowest in the current year as compared to finance cost for the last five financial years. Finance cost decreased by 12.54% in the current year as compared to corresponding last year. The main reasons was the better cash flow management and availability of loans at subsidized mark-up rates which was reflected from the decrease in average borrowing
SALES Gross Profit %
EBITDA to sales % Dividend Income
Finance Cost
Interest Cover After Tax Profit%
8
cost of debt from 4.60% in the last year to 3.50% in the current year. Interest cover ratio remained steady at the same higher level as was in the last year which is an indication of financial potential of the Company to run its operations and to carry out expansion projects.
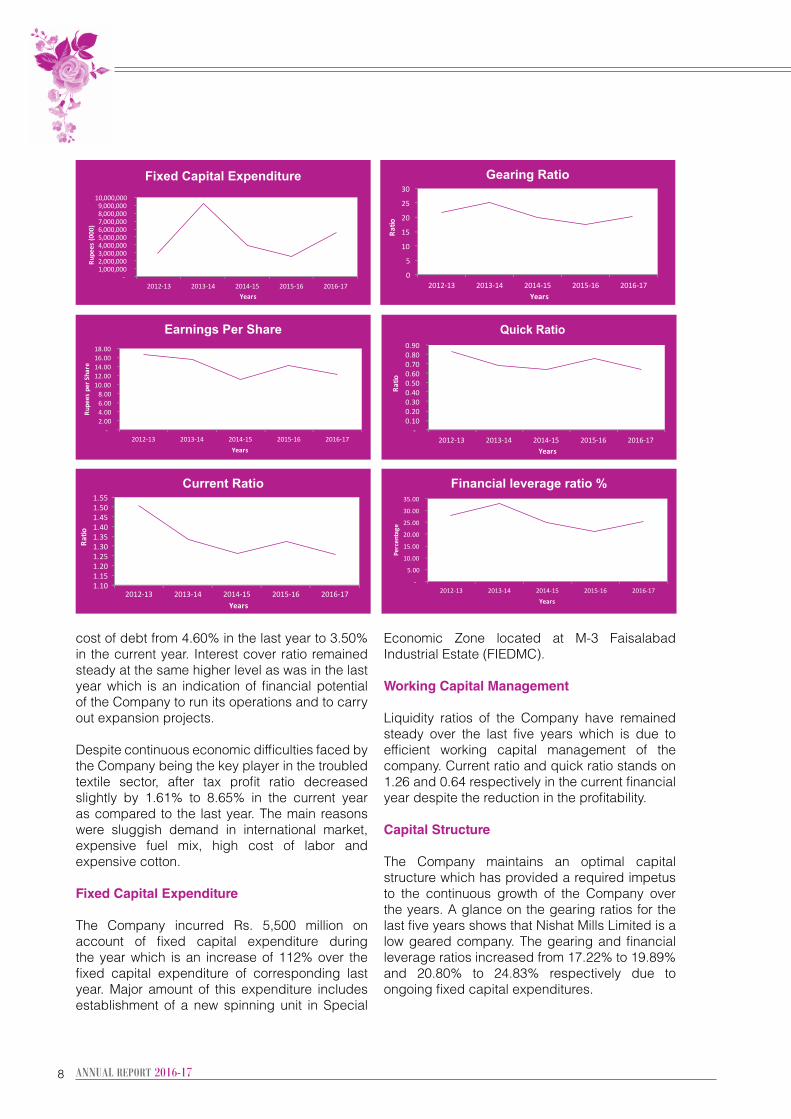
Despite continuous economic difficulties faced by the Company being the key player in the troubled textile sector, after tax profit ratio decreased slightly by 1.61% to 8.65% in the current year as compared to the last year. The main reasons were sluggish demand in international market, expensive fuel mix, high cost of labor and expensive cotton. Fixed Capital Expenditure
The Company incurred Rs. 5,500 million on account of fixed capital expenditure during the year which is an increase of 112% over the fixed capital expenditure of corresponding last year. Major amount of this expenditure includes establishment of a new spinning unit in Special
Economic Zone located at M-3 Faisalabad Industrial Estate (FIEDMC).
Working Capital Management
Liquidity ratios of the Company have remained steady over the last five years which is due to efficient working capital management of the company. Current ratio and quick ratio stands on 1.26 and 0.64 respectively in the current financial year despite the reduction in the profitability.
Capital Structure
The Company maintains an optimal capital structure which has provided a required impetus to the continuous growth of the Company over the years. A glance on the gearing ratios for the last five years shows that Nishat Mills Limited is a low geared company. The gearing and financial leverage ratios increased from 17.22% to 19.89% and 20.80% to 24.83% respectively due to ongoing fixed capital expenditures.
Fixed Capital Expenditure Gearing Ratio
Earnings Per Share Quick Ratio
Current Ratio Financial leverage ratio %
9Nishat Mills Limited
Appropriations
The Board of Directors of the Company has recommended 50% cash dividend (2016: 50%) and transferring of Rupees 2,504 million (2016: Rupees 3,165 million) to general reserve.
Earnings per Share (EPS)
Earnings per share of the Company has decreased from Rs. 14 per share in the last year to Rs. 12.12 per share in the current year as a result of low profitability but it has remained remarkable over the last five years.
SEGMENT ANALYSIS
Spinning
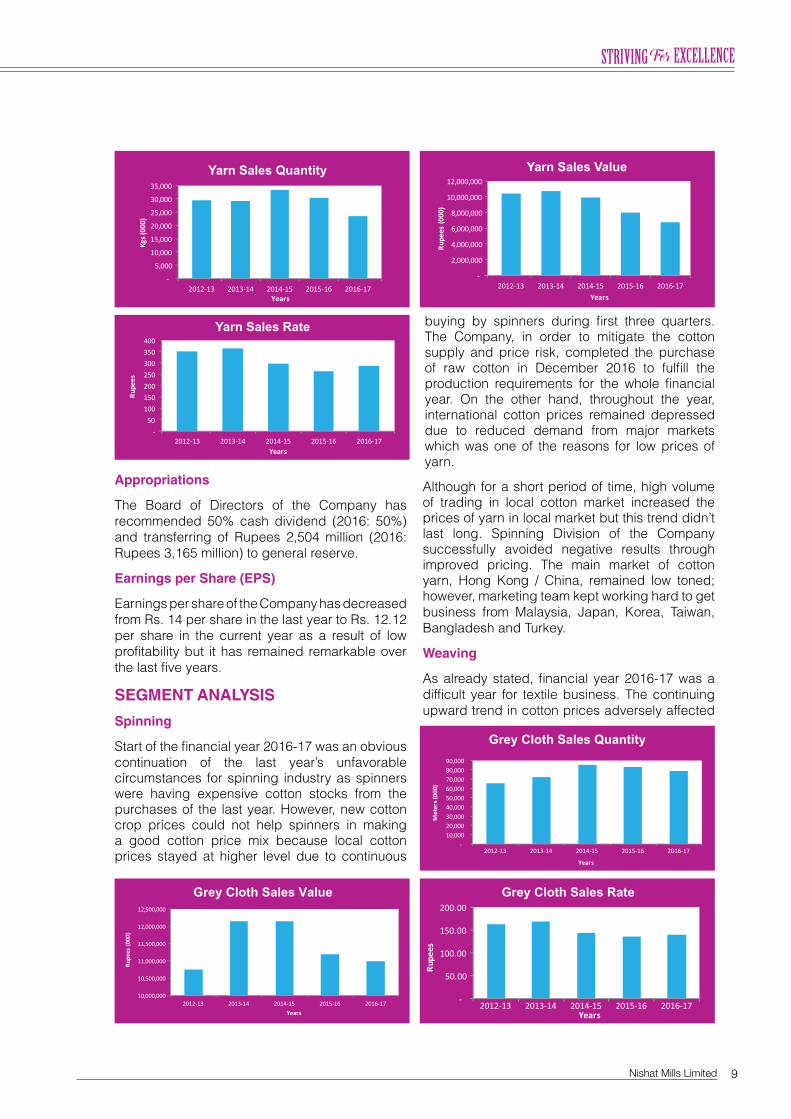
Start of the financial year 2016-17 was an obvious continuation of the last year’s unfavorable circumstances for spinning industry as spinners were having expensive cotton stocks from the purchases of the last year. However, new cotton crop prices could not help spinners in making a good cotton price mix because local cotton prices stayed at higher level due to continuous
buying by spinners during first three quarters. The Company, in order to mitigate the cotton supply and price risk, completed the purchase of raw cotton in December 2016 to fulfill the production requirements for the whole financial year. On the other hand, throughout the year, international cotton prices remained depressed due to reduced demand from major markets which was one of the reasons for low prices of yarn.
Although for a short period of time, high volume of trading in local cotton market increased the prices of yarn in local market but this trend didn’t last long. Spinning Division of the Company successfully avoided negative results through improved pricing. The main market of cotton yarn, Hong Kong / China, remained low toned; however, marketing team kept working hard to get business from Malaysia, Japan, Korea, Taiwan, Bangladesh and Turkey.
Weaving
As already stated, financial year 2016-17 was a difficult year for textile business. The continuing upward trend in cotton prices adversely affected
Grey Cloth Sales Quantity
Grey Cloth Sales RateGrey Cloth Sales Value
Yarn Sales Quantity Yarn Sales Value
Yarn Sales Rate
10
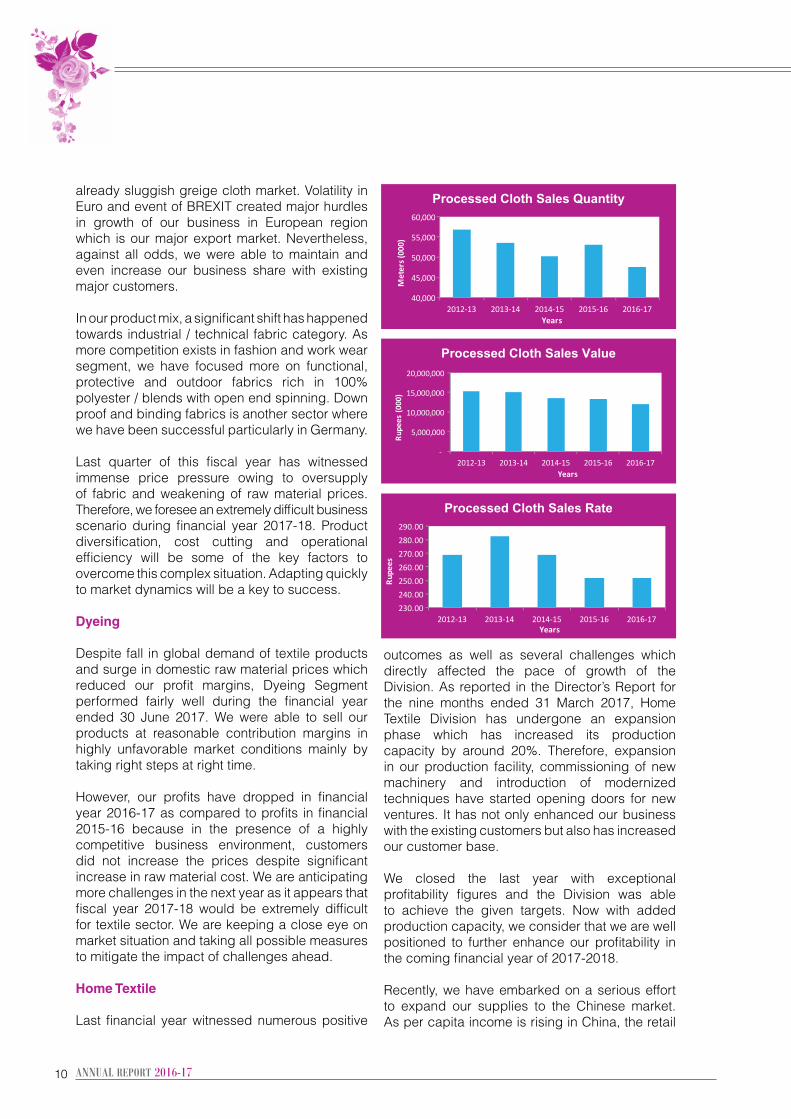
already sluggish greige cloth market. Volatility in Euro and event of BREXIT created major hurdles in growth of our business in European region which is our major export market. Nevertheless, against all odds, we were able to maintain and even increase our business share with existing major customers.
In our product mix, a significant shift has happened towards industrial / technical fabric category. As more competition exists in fashion and work wear segment, we have focused more on functional, protective and outdoor fabrics rich in 100% polyester / blends with open end spinning. Down proof and binding fabrics is another sector where we have been successful particularly in Germany.
Last quarter of this fiscal year has witnessed immense price pressure owing to oversupply of fabric and weakening of raw material prices. Therefore, we foresee an extremely difficult business scenario during financial year 2017-18. Product diversification, cost cutting and operational efficiency will be some of the key factors to overcome this complex situation. Adapting quickly to market dynamics will be a key to success.
Dyeing
Despite fall in global demand of textile products and surge in domestic raw material prices which reduced our profit margins, Dyeing Segment performed fairly well during the financial year ended 30 June 2017. We were able to sell our products at reasonable contribution margins in highly unfavorable market conditions mainly by taking right steps at right time. However, our profits have dropped in financial year 2016-17 as compared to profits in financial 2015-16 because in the presence of a highly competitive business environment, customers did not increase the prices despite significant increase in raw material cost. We are anticipating more challenges in the next year as it appears that fiscal year 2017-18 would be extremely difficult for textile sector. We are keeping a close eye on market situation and taking all possible measures to mitigate the impact of challenges ahead.
Home Textile
Last financial year witnessed numerous positive
outcomes as well as several challenges which directly affected the pace of growth of the Division. As reported in the Director’s Report for the nine months ended 31 March 2017, Home Textile Division has undergone an expansion phase which has increased its production capacity by around 20%. Therefore, expansion in our production facility, commissioning of new machinery and introduction of modernized techniques have started opening doors for new ventures. It has not only enhanced our business with the existing customers but also has increased our customer base.
We closed the last year with exceptional profitability figures and the Division was able to achieve the given targets. Now with added production capacity, we consider that we are well positioned to further enhance our profitability in the coming financial year of 2017-2018. Recently, we have embarked on a serious effort to expand our supplies to the Chinese market. As per capita income is rising in China, the retail
Processed Cloth Sales Quantity
Processed Cloth Sales Rate
Processed Cloth Sales Value
11Nishat Mills Limited
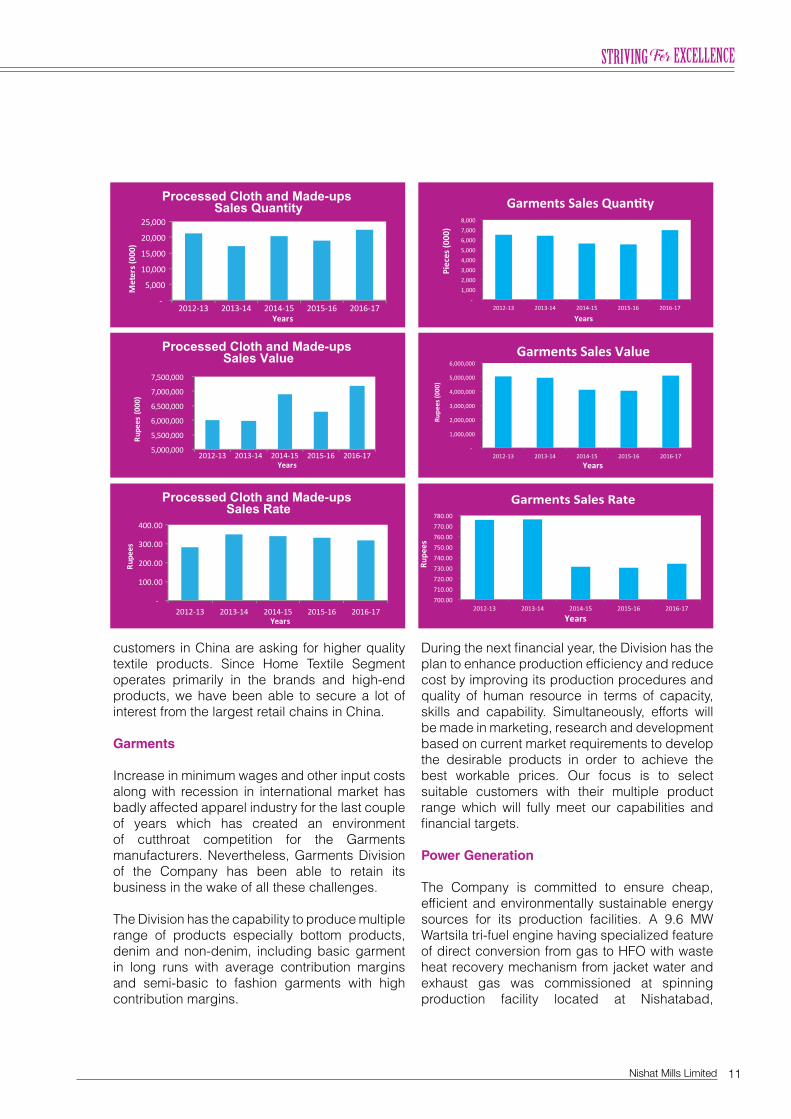
customers in China are asking for higher quality textile products. Since Home Textile Segment operates primarily in the brands and high-end products, we have been able to secure a lot of interest from the largest retail chains in China. Garments
Increase in minimum wages and other input costs along with recession in international market has badly affected apparel industry for the last couple of years which has created an environment of cutthroat competition for the Garments manufacturers. Nevertheless, Garments Division of the Company has been able to retain its business in the wake of all these challenges.
The Division has the capability to produce multiple range of products especially bottom products, denim and non-denim, including basic garment in long runs with average contribution margins and semi-basic to fashion garments with high contribution margins.
During the next financial year, the Division has the plan to enhance production efficiency and reduce cost by improving its production procedures and quality of human resource in terms of capacity, skills and capability. Simultaneously, efforts will be made in marketing, research and development based on current market requirements to develop the desirable products in order to achieve the best workable prices. Our focus is to select suitable customers with their multiple product range which will fully meet our capabilities and financial targets. Power Generation
The Company is committed to ensure cheap, efficient and environmentally sustainable energy sources for its production facilities. A 9.6 MW Wartsila tri-fuel engine having specialized feature of direct conversion from gas to HFO with waste heat recovery mechanism from jacket water and exhaust gas was commissioned at spinning production facility located at Nishatabad,
Processed Cloth and Made-ups Sales Value
Processed Cloth and Made-ups Sales Rate
Processed Cloth and Made-ups Sales Quantity
12
Faisalabad in October 2016 and is running efficiently. The Solar PV plant for Garments Segment II was also successfully commissioned in December 2016. Furthermore, to ensure cheap modes of energy sources, a 10 ton, low pressure coal fired boiler is being added at the location of Weaving Division, Bhikki which has started its commercial production during the first quarter of financial year 2017-18.
The Company has initiated a project to utilize fly ash, a waste from burning coal in Coal Fired Power Plant, for the production of pavers. For this purpose, a paver making machine was commissioned into production by the start of May 2017 and after successful test runs commercial production was started in the mid of May 2017. A project for installation of a new 65 ton coal fired boiler at Nishat Dyeing & Finishing unit, Lahore is under planning process, where technical proposals have been accepted and commercial proposals are yet to be finalized. Design of the new captive power plant to cater for the spinning production facilities located at M-3 Faisalabad Industrial Estate, Faisalabad has also been completed and construction of building is in progress. In the first phase, three 6 MW Wartsila generators, one pure gas fired and two dual fuel generators are being shifted to this power plant from other locations of the Company. This phase is expected to start production by the end of October 2017.
RISKS AND OPPORTUNITIES
Nishat Mills Limited takes risks and creates opportunities in the normal course of business. Taking risk is important to remain competitive and ensure sustainable success. Our risk and opportunity management encompass an effective framework to conduct business in a well-controlled environment where risk is mitigated and opportunities are availed. Each risk and opportunity is properly weighted and considered before making any choice. Decisions are formulated only if opportunities outweigh risks.
Following is the summary of risks and strategies to mitigate those risks:
STRATEGIC RISKS
We are operating in a competitive environment where innovation, quality and cost matters. This risk is mitigated through continuous research & development and persistent introduction of new technologies under BMR. Strategic risk is considered as the most crucial of all the risks. Head of all business divisions meet at regular basis to form an integrated approach towards tackling risks both at the international and national level.
BUSINESS RISKS
The Company faces a number of following business risks:
Cotton Supply and Price
The supply and prices of cotton is subject to the act of nature and demand dynamics of local and international cotton markets. There is always a risk of non-availability of cotton and upward shift in the cotton prices in local and international markets. The Company mitigates this risk by the procurement of the cotton in bulk at the start of the harvesting season.
Export Demand and Price
The exports are major part of our sales. We face the risk of competition and decline in demand of our products in international markets. We minimize this risk by building strong relations with customers, broadening our customer base, developing innovative products without compromising on quality and providing timely deliveries to customers.
Energy Availability and Cost
The rising cost and un-availability of energy i.e. electricity and gas shortage is a major threat to manufacturing industry. This risk, if unmitigated, can render us misfit to compete in the international markets. The Company has mitigated the risk of rising energy cost by opting for alternative fuels such as coal, furnace oil, bio-mass and diesel. The measures to conserve energy have also been taken at all manufacturing facilities of the Company. Likewise, risk of non-availability of the energy has been minimized by
13Nishat Mills Limited
installing power plants for generating electricity at almost all locations of the Company along with securing electricity connections from WAPDA and installation of 1.2 MW solar plant at new Apparel Denim Plant.
FINANCIAL RISKS
The Board of Directors of the Company is responsible to formulate the financial risk management policies which are implemented by the Finance Department of the Company. The Company faces the following financial risks:
Currency risk
The Company is exposed to currency risk arising from various currency exposures, primarily with respect to United States Dollar (USD), Arab Emirates Dirham (AED) and Euro. The Company’s foreign exchange risk exposure is restricted to the bank balances and the amounts receivable/ payable from/to the foreign entities.
Interest rate risk
The Company’s interest rate risk arises from long term financing, short term borrowings, loans and advances to subsidiary companies, term deposit receipts and bank balances in saving accounts. Fair value sensitivity analysis and cash flow sensitivity analysis shows that the Company’s profitability is not materially exposed to the interest rate risk.
Credit risk
The Company’s credit exposure to credit risk and impairment losses relates to its trade debts. This risk is mitigated by the fact that majority of our customers have a strong financial standing and we have a long standing business relationship with all our customers. We do not expect nonperformance by our customers; hence, the credit risk is minimal.
Liquidity risk
It is at the minimum due to the availability of enough funds through committed credit facilities from the Banks and Financial institutions.
Capital risk
When managing capital, it is our objective to safeguard the Company’s ability to continue as a going concern in order to provide returns for shareholders and benefits to other stakeholders and to maintain an optimal capital structure to reduce the cost of capital. The Company maintains low leveraged capital structure. We monitor the capital structure on the basis of the gearing ratio. Our strategy is to keep the gearing ratio at the maximum of 40% equity and 60% debt.
OPPORTUNITIES
As the leading textile company of the country, the Company is in a position to avail and exploit a number of opportunities. Following is the summary of some exciting opportunities.
• Regionally diversified customer base across the world provides a sustainable growth to export sales;
• Vibrant local and international subsidiary companies create demand for our products;
• Vertical integration makes it possible to exploit operational synergies;
• Abundant supply of cotton in the country; • High population growth of the country is a
source of suitable manpower and a stimulus in creating the demand for textile products.
TEXTILE INDUSTRY OVERVIEW
Textile is the largest and most important manufacturing sector in Pakistan. It provides employment to 40% of industrial labor force and its share in national exports is 62%. The sector recorded a growth of only 0.78% in the current year which is not up to the mark considering the key position of textile industry in the Pakistani economy. Textile exports decreased by 1% in the current year as compared to the previous year which is the continuation of declining trend for last ten years in which textile exports have gone down from US$ 14 Billion to US$ 12 Billion.
Diminishing demand for textile products worldwide and surge in raw material cost were the main challenges which textile industry in Pakistan faced during fiscal year 2016-17. Uncertainties
14
created due to BRIXET also created an adverse environment for trade with UK and Europe. Although value added segments performed relatively better in second and third quarters of the fiscal year as compared to other segments of the industry but overall performance remained unsatisfactory.
In addition to external factors, textile sector is marred by internal problems which are the root cause of high input cost. Main reasons affecting the cost are production inefficiencies of the industry and inability to upgrade the plant and machinery. Majority of the units are operating without energy audits which results in wastage of electricity. By improving efficiency in this area alone they can significantly reduce their power cost. Moreover, productivity of our workers is low in comparison to regional countries particularly China and India. Majority of industry does not provide conducive work conditions to workers which hamper their productivity.
Considering global retail environment, cut-throat competition and high cost of doing business in Pakistan, the government announced incentive package for export oriented sectors of the country. As per the new package, duty drawback of taxes at specified rates was available on the FOB value of exports for the period starting from 16 January 2017 to 30 June 2017 on the selected product range of yarn, greige fabric, processed fabric, made-ups and garments. The announcement of this package was a healthy sign for the textile
sector of the country. Government has also allowed sales tax zero rating facility to textile sector along with other exports-oriented sectors (textile, leather, surgical and sports goods and carpets) to provide relief to the sector from cash flow problems.
SUBSIDIARY COMPANIES
The Company has also annexed its consolidated financial statements along with separate financial statements in accordance with the requirements of International Financial Reporting Standards and Companies Ordinance, 1984.
Following is a brief description of all subsidiary companies of Nishat Mills Limited:
1. Nishat Power Limited
The Company owns and controls 51.01% shares of this subsidiary. The subsidiary is listed on Pakistan Stock Exchange Limited. The principle business of the subsidiary is to build, operate and maintain a fuel powered station having gross capacity of 200MW in Jamber Kalan, Tehsil Pattoki, District Kasur, Punjab, Pakistan. The subsidiary commenced its commercial production on 09 June 2010.
2. Nishat Linen (Private) Limited
This is a wholly owned subsidiary of the Company. The principal objects of the

15Nishat Mills Limited
Subsidiary are to operate retail outlets for sale of textile and other products and to sale the textile products by processing the textile goods in own and outside manufacturing facilities. The subsidiary started its operations in July 2011 and is presently operating 89 retail outlets in Pakistan.
3. Nishat Hospitality (Private) Limited
This is a wholly owned subsidiary of the Company. Subsidiary’s object is to run a chain of hotels across the country. Currently it is operating a four star hotel in Lahore on international standards under the name of “The Nishat St. James Hotel”. The subsidiary started its operations on 01 March 2014.
4. Nishat Commodities (Private) Limited
This is a wholly owned subsidiary of the Company. The object of the subsidiary is to carry on the business of trading of commodities including fuels, coals, building material in any form or shape manufactured, semi-manufactured, raw materials and their import and sale in Pakistan. The subsidiary started its operations in March 2016.
5. Lalpir Solar Power (Private) Limited
Lalpir Solar Power (Private) Limited is a private limited Company incorporated in Pakistan on 09 November 2015. It is a wholly owned subsidiary of Nishat Power Limited which is a subsidiary of Nishat Mills Limited. The subsidiary has not yet started its commercial operations. The principal activity of company will be to build, own, operate and maintain or invest in a solar power project.
6. Hyundai Nishat Motor (Private) Limited
Hyundai Nishat Motor (Private) Limited is a private limited Company incorporated in Pakistan under the Companies Ordinance, 1984 on 03 March 2017. The Subsidiary is a wholly owned subsidiary of Nishat Mills Limited. The principal activity of the Subsidiary is to carry out the import, assembly and distribution of Hyundai automobiles of
both passenger and commercial category. Its registered office is situated at 53-A, Lawrence Road, Lahore.
7. Nishat Linen Trading LLC
Nishat Linen Trading LLC is a limited liability company incorporated in Dubai, UAE. It is a wholly owned subsidiary of the Company. The subsidiary is principally engaged in trading of textile, blankets, towels, linens, ready-made garments, garments accessories and leather products along with ancillaries thereto through retail outlets and warehouses across United Arab Emirates. The subsidiary started its commercial operations in May 2011 and is presently operating 11 retail outlets in UAE.
8. Nishat International FZE
This is also a wholly owned subsidiary of Nishat Mills Limited. It has been incorporated as a Free Zone Establishment limited Liability Company in Jebel Ali Free Zone, Dubai according to the laws of United Arab Emirates (UAE). It has been registered in the FZE register on February 7, 2013. The principal activity of the Subsidiary Company is trading in textile products such as blankets, towels & linens, ready-made garments, garments accessories and leather products such as shoes, handbags and all such ancillaries thereto.
9. Nishat Global China Company Limited
Nishat Global China Company Limited is incorporated in Yuexiu District, Guangzhou, China, as Foreign Invested Commercial Enterprises “FICE”, in accordance with the Law of Peoples Republic of China on Foreign-Capital enterprises and other relevant Laws and Regulations. Nishat Global China Company Limited is a wholly owned subsidiary of Nishat International FZE which is a wholly owned subsidiary of Nishat Mills Limited. The principal business of the Subsidiary is wholesale, commission agency (excluding auction), import and export of textile goods and women fashion accessories. The subsidiary started its commercial operations in January 2014.
16
10. Nishat USA Inc. The subsidiary is a corporation service
company incorporated in the State of New York. It is a wholly owned subsidiary of the Company and was acquired by the Company on 01 October 2008. The corporation is a liaison office of the Company’s marketing department providing access, information and other services relating to US Market.
11. Nishat UK (Private) Limited
Nishat UK (Private) Limited is a private limited company incorporated in England and Wales on 8 June 2015. It is a wholly owned subsidiary of Nishat International FZE which is a wholly owned subsidiary of Nishat Mills Limited. The primary function of Nishat UK (Private) Limited is sale of textile and related products in England and Wales through retail outlets and wholesale operations.
12. Concept Garments and Textile Trading FZE
Concept Garments and Textile Trading FZE is incorporated as a free zone establishment with limited liability in accordance with the Law No: 9 of 1992 and Licensed by the Registrar of Jabel Ali Free Zone Authority. It is a wholly owned subsidiary of Nishat International FZE which is a wholly owned subsidiary of Nishat Mills Limited. Date of incorporation of the Company was 11 October 2016. The registered office of Concept Garments and Textile Trading FZE is situated at Jabel Ali Free Zone, Dubai. The principal business of the Company is trading in textile and related products.
CORPORATE SOCIAL RESPONSIBILITY
The Company has strong commitment towards corporate social responsibility and allocates sizable resources for the benefit of environment and society.
Environment Protection
Textile manufacturing especially dyeing and printing processes can cause significant harm to environment if adequate measures are not taken to mitigate hazardous effects of textile processes. The Company is deeply concerned and has established effluent treatment plants at its dyeing, printing and garments manufacturing facilities. Moreover, a project is underway for installation of a new waste water treatment plant which will increase existing capacity for treatment of waste water by 200 cubic meters per hour at production facilities of Dyeing and Home Textile Segments. Apart from an elaborated policy for tree plantation at its manufacturing facilities, the Company is investing in solar technology for generation of energy to minimize the impact of CO2 emission. The Code of Conduct for employees also requires using the Company’s facilities and processes in environmentally sustainable way.
Energy Conservation
In addition to investing in the alternative energy sources, conservation of energy sources are under special focus of the Company. The Company is in the process of replacement of conventional tube lights with LED lights and installation of solar panels.
17Nishat Mills Limited
Waste Recycling
Another way to protect environment is to recycle waste. This is why the Company regularly acquires such technologies which can recycle waste generated by production processes. The Company has installed water treatment plants, cotton recycling plants and oil recycling machines at different sites to recycle the water, waste cloth and oil for maximum saving of natural resources. Recently, a paver making machine has been commissioned to make pavers from fly ash which is a waste from burning coal in Coal Fired Plant. Successful research has been carried out at the Company’s facility to produce pavers by creating various combinations of ingredients to achieve standard compressive strength.
Occupational Safety and Health
The Company has a comprehensive policy for health and safety standards. Workers are engaged in manufacturing activities after taking into account professional safety measures. Apart from that, the Company arranges health awareness programs, medical camps for Malaria and Typhoid vaccination and routine fumigation of insecticide to prevent dengue and other diseases. The Company has also established dispensaries at its production facilities which are equipped with ambulances.
Equal Opportunity Employer
The Company takes pride in being an equal opportunity employer. The workforce of the Company comprises of people with diverse background including large number of women and disabled persons. The Company believes that collective creativity of people with varied background is the reason for its growth over the years.
Community Welfare Schemes
The medical camps organized by the Company not only provide free medical advice and treatment to workers and their families but also provide medical services to people living near the manufacturing facilities of the Company. Likewise, blood banks at different sites to deal with emergency needs have been established.
Consumer Protection Measures
The Company also ensures safety measures for the protection of its customers when they use its products. Our expanding customer base and long term relations with customers show the care
we exercise for the protection of our customers in manufacturing and transit of our goods. We have set up systems such as the installation of metal detectors for prevention and detection of any harmful substance in the products. For this, the Company meets the OEKO Tex Standards 100 which is an independent testing and certification system for textile raw materials, intermediate and end products at all stages of production. The Company has also acquired C-TPAT Certification Customs-Trade Partnership against Terrorism at all its production facilities. Further the Company has obtained SA-8000, WRAP and SEDEX certifications.
CORPORATE GOVERNANCEBest Corporate Practices
We are committed to good corporate governance and do comply with the requirements of Code of Corporate Governance 2012 (CCG 2012) included in the listing regulations of Pakistan Stock Exchange Limited. The statement of compliance with the CCG 2012 is enclosed.
Board CommitteesAudit Committee
The Audit Committee is performing its duties in line with its terms of reference as determined by the Board of Directors. During the year under review, four Audit Committee Meetings were held, attendance position was as under:-
No. of Meetings Sr.# Name of Member Attended
1. Mr. Khalid Qadeer Qureshi (Member/Chairman) 32. Syed Zahid Hussain (Member) 4
3. *Ms. Nabiha Shahnawaz Cheema (Member) 3
4. *Mr. Farid Noor Ali Fazal (Member) 1
*Ms. Nabiha Shahnawaz Cheema retired as member on March 31, 2017 and Mr. Farid Noor Ali Fazal appointed as member audit committee in her place on April 06, 2017.
Human Resource & Remuneration (HR&R) Committee
The Human Resource & Remuneration Committee is performing its duties in line with its terms of reference as determined by the Board of Directors.
18
During the year under review, two Human Resource & Remuneration (HR&R) Committee meetings were held, attendance position was as under:- No. of Meetings Sr.# Name of Member Attended 1. *Mr. Hassan Mansha (Member/Chairman) 1
2. Mr. Umer Mansha (Member) 2
3. *Mr. Khalid Qadeer Qureshi (Member/Chairman) 2
4. **Ms. Nabiha Shahnawaz Cheema (Member) 2
5. **Mr. Farid Noor Ali Fazal (Member) 0
*Mr. Hassan Mansha retired as Member / Chairman on April 06, 2017 and Mr. Khalid Qadeer Qureshi appointed as Member / Chairman of HR&R Committee in his place on April 06, 2017. **Ms. Nabiha Shahnawaz Cheema retired as Member on March 31, 2017 and Mr. Farid Noor Ali Fazal appointed as Member HR&R committee in her place on April 06, 2017.
Meetings of the Board of Directors.
During the year under review, seven meetings of the Board of Directors of the Company were held in Pakistan and the attendance position is as follows: No. of Meetings Sr.# Name of Director Attended
1. Mian Umer Mansha (Chief Executive Officer) 7
2. Mian Hassan Mansha (Chairman) 4
3. Mr. Syed Zahid Hussain 7
4. Mr. Khalid Qadeer Qureshi 5
5. Mr. Maqsood Ahmad 7
6. *Ms. Nabiha Shahnawaz Cheema 3
7. Mr. Ghazanfar Hussain Mirza 5
8. **Mr. Farid Noor Ali Fazal 2
*Ms. Nabiha Shahnawaz Cheema retired on March 31, 2017 **Mr. Farid Noor Ali Fazal elected as director on March 31, 2017.
Directors’ Statement
Following are the statements on Corporate and Financial Reporting framework in compliance with the Code of Corporate Governance:
1. The financial statements, prepared by the management of the Company, present fairly its state of affairs, the result of its operations, cash flows and changes in equity.
2. Proper books of account of the Company have been maintained.
3. Appropriate accounting policies have been consistently applied in preparation of the financial statements and accounting estimates are based on reasonable and prudent judgment.
4. International Financial Reporting Standards, as applicable in Pakistan, have been followed in preparation of financial statements and any departure there from has been adequately disclosed.
5. The system of internal control is sound in design and has been effectively implemented and monitored.
6. There are no significant doubts upon the Company’s ability to continue as a going concern.
7. There has been no material departure from the best practices of corporate governance, as detailed in the listing regulations.
8. Value of investments in respect of retirement benefits fund: Provident Fund: 30th June, 2017: Rs. 3,460.986 Million-Audited, (2016: Rs. 2,837.307 Million-Audited).
Transactions with related parties
Transactions with related parties were carried out at arm’s length prices determined in accordance with the comparable uncontrolled prices method. The Company has fully complied with best practices on Transfer Pricing as contained in the Listing Regulations of Pakistan Stock Exchange. The detail of arrangements for transactions, as approved by the Board during the year, other than transactions in the ordinary course of business is as follows:
a. Loan up to Rs. 1 billion to Nishat Hotels and Properties Limited, an associated company, in accordance with its investment policy to earn higher interest rate as compared to other investment opportunities available to the Company.
19Nishat Mills Limited
b. Further investment up to Rs. 2 billion as loan and advances in Nishat Linen (Private) Limited, a wholly owned subsidiary of the Company, in accordance with its investment policy to earn higher interest rate as compared to other investment opportunities available to the Company.
c. Equity investment up to Rs. 100 million in Hyundai Nishat Motor (Private) Limited, a wholly owned subsidiary of the Company, to earn dividend and prospective capital gains.
d. Further equity investment of up to Rs. 1.213 billion in MCB Bank Limited, an associated company, to earn dividend and prospective capital gains.
e. The renewal of investment up to Rs. 1.5 billion as loan and advances in Nishat Power Limited, a subsidiary company, to earn higher interest rate as compared to other investment opportunities available to the Company.
Auditors
The present auditors of the Company M/s Riaz Ahmed & Company Chartered Accountants have completed the annual audit for the year ended 30 June 2017 and have issued an unqualified audit report. The auditors will retire on conclusion of the Annual General Meeting of the Company, and being eligible; have offered themselves for reappointment for the year ending 30 June 2018.
FUTURE PROSPECTS
The scenario of slow demand and stiff competition is anticipated in the next financial year as well. However, with the expectation of bumper cotton crop in Pakistan and world over, price stability in cotton is expected which is the most important factor in bringing the potential growth in the industry.Nishat Mills Limited, in addition to regularly carrying out BMR, also invests in the expansion of its manufacturing facilities. Currently, a plan to expand and relocate Spinning Segment located at Nishatabad, Faisalabad is underway according to which the Company has acquired land in Special Economic Zone (SEZ) located at M-3 Faisalabad Industrial Estate FIEDMC. In the
first phase, 49,536 spindles are being planned to be installed on the newly acquired land which includes transfer of 22,176 spindles from existing production facility located at Nishatabad, Faisalabad and acquisition of 27,360 new spindles. The Company has acquired automatic machinery for the automation of production processes at this location like Automatic Luwa Waste Collection and Dust Removal Systems, Automatic Winders, Link Coners Eco Pulsars and Semi Automatic Bailing Press. This state of art unit with advanced technology and fully automatic procedures and systems will increase the future profitability and cash flows of the Company.
These spindles are expected to commence commercial production in first half of financial year 2017-18. The Company will enjoy benefits of tax and duty exemptions and infrastructure facilities especially designed for SEZ members at this location. The Company is also establishing a Power Unit at this location to provide electricity to Spinning Unit.
The Company is also planning to replace its existing 30 narrow width Tsudakoma looms located at Weaving Division, Bhikki, with wider width looms. These wider width looms with specialized technology will cater to lucrative Home Textile business.
The Company is also expanding the existing capacity of Dyeing Division by 500,000 meters per month to cater to the increased demand of its customers.
There have been no material changes and commitments affecting the financial position of the company which have occurred between 30 June 2017 and 25 September 2017.
PATTERN OF SHAREHOLDING
A statement of the pattern of shareholding as at June 30, 2017, which is required to be disclosed under the reporting framework, is included in the annexed shareholders’ information at page No.181.
ACKNOWLEDGEMENT
The Board is pleased with the continued dedication and efforts of the employees of the Company.
For and on behalf of the Board of Directors
Mian Umer Mansha Maqsood AhmedChief Executive Officer Director
Lahore25 September 2017
20
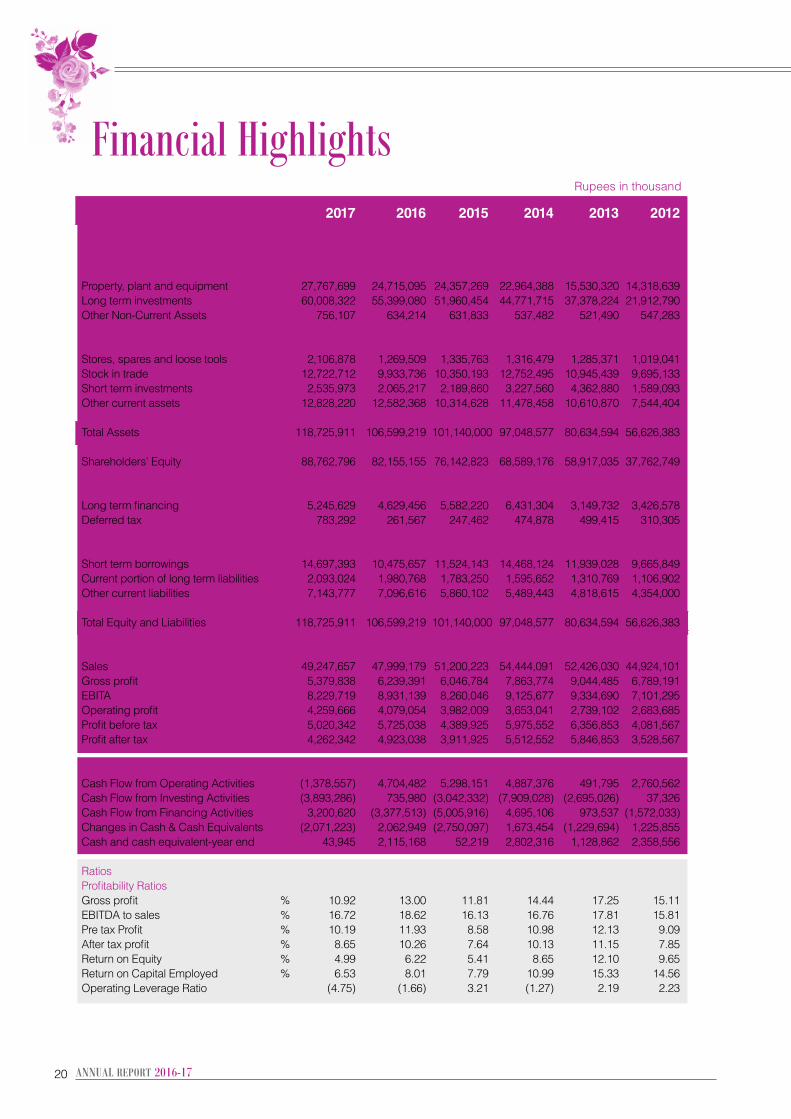
Financial Highlights 2017 2016 2015 2014 2013 2012 Summarized Balance Sheet
Non-Current Assets Property, plant and equipment 27,767,699 24,715,095 24,357,269 22,964,388 15,530,320 14,318,639 Long term investments 60,008,322 55,399,080 51,960,454 44,771,715 37,378,224 21,912,790 Other Non-Current Assets 756,107 634,214 631,833 537,482 521,490 547,283 Current Assets Stores, spares and loose tools 2,106,878 1,269,509 1,335,763 1,316,479 1,285,371 1,019,041 Stock in trade 12,722,712 9,933,736 10,350,193 12,752,495 10,945,439 9,695,133 Short term investments 2,535,973 2,065,217 2,189,860 3,227,560 4,362,880 1,589,093 Other current assets 12,828,220 12,582,368 10,314,628 11,478,458 10,610,870 7,544,404 Total Assets 118,725,911 106,599,219 101,140,000 97,048,577 80,634,594 56,626,383 Shareholders’ Equity 88,762,796 82,155,155 76,142,823 68,589,176 58,917,035 37,762,749 Non-Current liabilities Long term financing 5,245,629 4,629,456 5,582,220 6,431,304 3,149,732 3,426,578 Deferred tax 783,292 261,567 247,462 474,878 499,415 310,305 Current Liabilities Short term borrowings 14,697,393 10,475,657 11,524,143 14,468,124 11,939,028 9,665,849 Current portion of long term liabilities 2,093,024 1,980,768 1,783,250 1,595,652 1,310,769 1,106,902 Other current liabilities 7,143,777 7,096,616 5,860,102 5,489,443 4,818,615 4,354,000 Total Equity and Liabilities 118,725,911 106,599,219 101,140,000 97,048,577 80,634,594 56,626,383 Profit & Loss Sales 49,247,657 47,999,179 51,200,223 54,444,091 52,426,030 44,924,101 Gross profit 5,379,838 6,239,391 6,046,784 7,863,774 9,044,485 6,789,191 EBITA 8,229,719 8,931,139 8,260,046 9,125,677 9,334,690 7,101,295 Operating profit 4,259,666 4,079,054 3,982,009 3,653,041 2,739,102 2,683,685 Profit before tax 5,020,342 5,725,038 4,389,925 5,975,552 6,356,853 4,081,567 Profit after tax 4,262,342 4,923,038 3,911,925 5,512,552 5,846,853 3,528,567 Cash Flows Cash Flow from Operating Activities (1,378,557) 4,704,482 5,298,151 4,887,376 491,795 2,760,562 Cash Flow from Investing Activities (3,893,286) 735,980 (3,042,332) (7,909,028) (2,695,026) 37,326 Cash Flow from Financing Activities 3,200,620 (3,377,513) (5,005,916) 4,695,106 973,537 (1,572,033)Changes in Cash & Cash Equivalents (2,071,223) 2,062,949 (2,750,097) 1,673,454 (1,229,694) 1,225,855 Cash and cash equivalent-year end 43,945 2,115,168 52,219 2,802,316 1,128,862 2,358,556 Ratios Profitability Ratios Gross profit % 10.92 13.00 11.81 14.44 17.25 15.11 EBITDA to sales % 16.72 18.62 16.13 16.76 17.81 15.81 Pre tax Profit % 10.19 11.93 8.58 10.98 12.13 9.09 After tax profit % 8.65 10.26 7.64 10.13 11.15 7.85 Return on Equity % 4.99 6.22 5.41 8.65 12.10 9.65 Return on Capital Employed % 6.53 8.01 7.79 10.99 15.33 14.56 Operating Leverage Ratio (4.75) (1.66) 3.21 (1.27) 2.19 2.23
Rupees in thousand
21Nishat Mills Limited
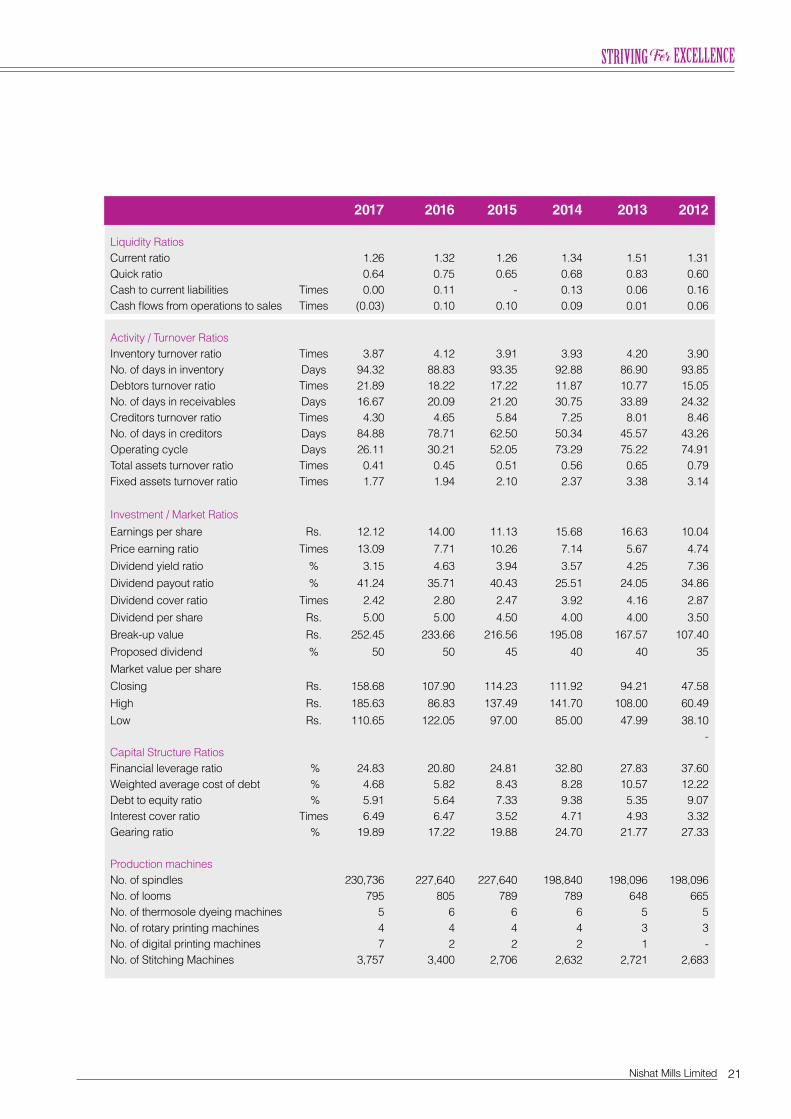
Liquidity Ratios Current ratio 1.26 1.32 1.26 1.34 1.51 1.31 Quick ratio 0.64 0.75 0.65 0.68 0.83 0.60 Cash to current liabilities Times 0.00 0.11 - 0.13 0.06 0.16 Cash flows from operations to sales Times (0.03) 0.10 0.10 0.09 0.01 0.06 Activity / Turnover Ratios Inventory turnover ratio Times 3.87 4.12 3.91 3.93 4.20 3.90 No. of days in inventory Days 94.32 88.83 93.35 92.88 86.90 93.85 Debtors turnover ratio Times 21.89 18.22 17.22 11.87 10.77 15.05 No. of days in receivables Days 16.67 20.09 21.20 30.75 33.89 24.32 Creditors turnover ratio Times 4.30 4.65 5.84 7.25 8.01 8.46 No. of days in creditors Days 84.88 78.71 62.50 50.34 45.57 43.26 Operating cycle Days 26.11 30.21 52.05 73.29 75.22 74.91 Total assets turnover ratio Times 0.41 0.45 0.51 0.56 0.65 0.79 Fixed assets turnover ratio Times 1.77 1.94 2.10 2.37 3.38 3.14 Investment / Market Ratios Earnings per share Rs. 12.12 14.00 11.13 15.68 16.63 10.04 Price earning ratio Times 13.09 7.71 10.26 7.14 5.67 4.74 Dividend yield ratio % 3.15 4.63 3.94 3.57 4.25 7.36 Dividend payout ratio % 41.24 35.71 40.43 25.51 24.05 34.86 Dividend cover ratio Times 2.42 2.80 2.47 3.92 4.16 2.87 Dividend per share Rs. 5.00 5.00 4.50 4.00 4.00 3.50 Break-up value Rs. 252.45 233.66 216.56 195.08 167.57 107.40 Proposed dividend % 50 50 45 40 40 35 Market value per share Closing Rs. 158.68 107.90 114.23 111.92 94.21 47.58 High Rs. 185.63 86.83 137.49 141.70 108.00 60.49 Low Rs. 110.65 122.05 97.00 85.00 47.99 38.10 - Capital Structure Ratios Financial leverage ratio % 24.83 20.80 24.81 32.80 27.83 37.60 Weighted average cost of debt % 4.68 5.82 8.43 8.28 10.57 12.22 Debt to equity ratio % 5.91 5.64 7.33 9.38 5.35 9.07 Interest cover ratio Times 6.49 6.47 3.52 4.71 4.93 3.32 Gearing ratio % 19.89 17.22 19.88 24.70 21.77 27.33 Production machines No. of spindles 230,736 227,640 227,640 198,840 198,096 198,096No. of looms 795 805 789 789 648 665No. of thermosole dyeing machines 5 6 6 6 5 5No. of rotary printing machines 4 4 4 4 3 3No. of digital printing machines 7 2 2 2 1 - No. of Stitching Machines 3,757 3,400 2,706 2,632 2,721 2,683
2017 2016 2015 2014 2013 2012
22
Statement of Compliance with the Code of Corporate Governance [See clause 5.19.24]
Name of company : Nishat Mills LimitedYear ended : June 30, 2017
This statement is being presented to comply with the Code of Corporate Governance (CCG) contained in listing Regulation No. 5.19.24 of listing regulations of Pakistan Stock Exchange Limited for the purpose of establishing a framework of good governance, whereby a listed company is managed in compliance with the best practices of corporate governance.
The Company has applied the principles contained in the CCG in the following manner:
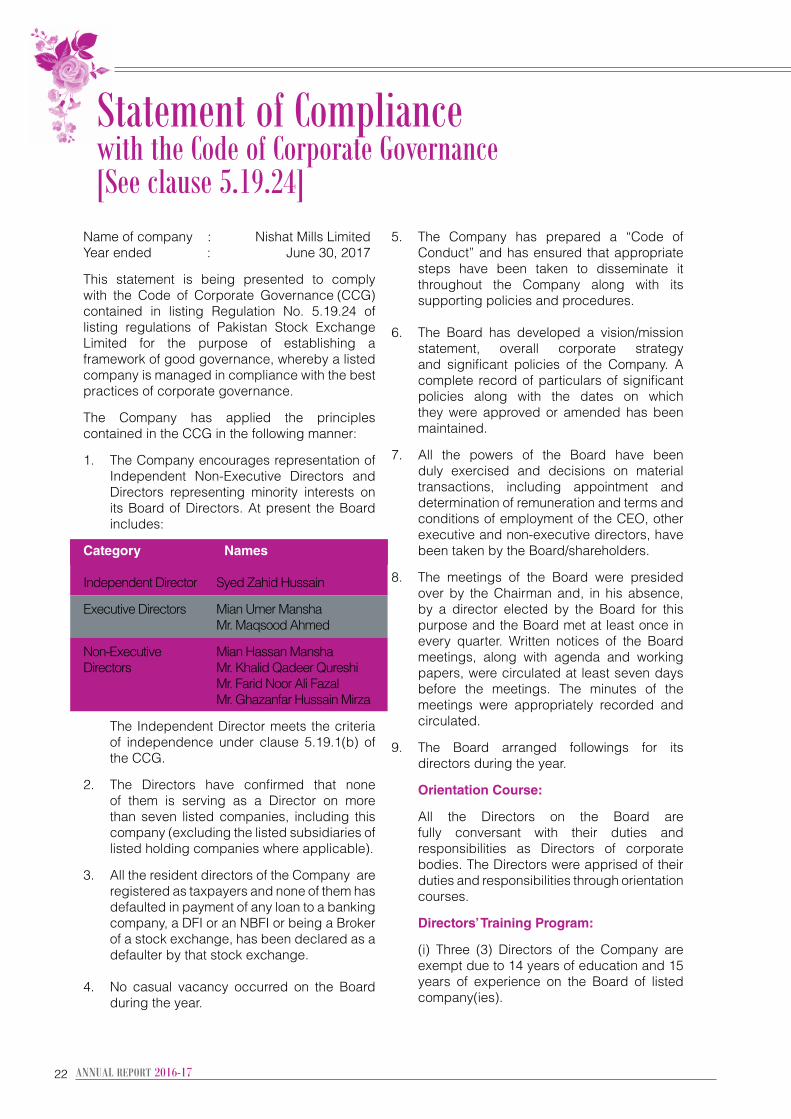
1. The Company encourages representation of Independent Non-Executive Directors and Directors representing minority interests on its Board of Directors. At present the Board includes:
Category Names
Independent Director Syed Zahid Hussain
Executive Directors Mian Umer Mansha Mr. Maqsood Ahmed
Non-Executive Mian Hassan ManshaDirectors Mr. Khalid Qadeer Qureshi Mr. Farid Noor Ali Fazal Mr. Ghazanfar Hussain Mirza
The Independent Director meets the criteria of independence under clause 5.19.1(b) of the CCG.
2. The Directors have confirmed that none of them is serving as a Director on more than seven listed companies, including this company (excluding the listed subsidiaries of listed holding companies where applicable).
3. All the resident directors of the Company are registered as taxpayers and none of them has defaulted in payment of any loan to a banking company, a DFI or an NBFI or being a Broker of a stock exchange, has been declared as a defaulter by that stock exchange.
4. No casual vacancy occurred on the Board during the year.
5. The Company has prepared a “Code of Conduct” and has ensured that appropriate steps have been taken to disseminate it throughout the Company along with its supporting policies and procedures.
6. The Board has developed a vision/mission statement, overall corporate strategy and significant policies of the Company. A complete record of particulars of significant policies along with the dates on which they were approved or amended has been maintained.
7. All the powers of the Board have been duly exercised and decisions on material transactions, including appointment and determination of remuneration and terms and conditions of employment of the CEO, other executive and non-executive directors, have been taken by the Board/shareholders.
8. The meetings of the Board were presided over by the Chairman and, in his absence, by a director elected by the Board for this purpose and the Board met at least once in every quarter. Written notices of the Board meetings, along with agenda and working papers, were circulated at least seven days before the meetings. The minutes of the meetings were appropriately recorded and circulated.
9. The Board arranged followings for its directors during the year.
Orientation Course:
All the Directors on the Board are fully conversant with their duties and responsibilities as Directors of corporate bodies. The Directors were apprised of their duties and responsibilities through orientation courses.
Directors’ Training Program:
(i) Three (3) Directors of the Company are exempt due to 14 years of education and 15 years of experience on the Board of listed company(ies).
23Nishat Mills Limited
(ii) Three ( 3 ) Directors of the Company, Mr. Farid Noor Ali Fazal, Mr. Ghazanfar Hussain Mirza and Mr. Maqsood Ahmed have completed the directors training program.
10. The Board has approved appointment of Mrs. Hina Rauf as Head of Internal Audit including terms and conditions of her employment in place of Syed Arshad Ali Zaidi. The remuneration of CFO was revised during the year after due approval of the Board.
11. The Directors’ Report for this year has been prepared in compliance with the requirements of the CCG and fully describes the salient matters required to be disclosed.
12. The financial statements of the Company were duly endorsed by CEO and CFO before approval of the Board.
13. The Directors, CEO and executives do not hold any interest in the shares of the Company other than that disclosed in the pattern of shareholding.
14. The Company has complied with all the corporate and financial reporting requirements of the CCG.
15. The Board has formed an Audit Committee. It comprises 3 members, of whom 2 are non-executive directors and one is independent director and the chairman of the committee is a non executive director.
16. The meetings of the Audit Committee were held at least once every quarter prior to approval of interim and final results of the Company and as required by the CCG. The terms of reference of the committee have been formed and advised to the committee for compliance.
17. The Board has formed HR and Remuneration Committee. It comprises 3 members, of whom 2 are Non-Executive Directors and the Chairman of the Committee is a Non-Executive director.
18. The Board has set up an effective internal audit function and the members of internal audit function are considered suitably qualified and experienced for the purpose and are conversant with the policies and procedures of the Company.
19. The statutory auditors of the Company have confirmed that they have been given a satisfactory rating under the quality control review program of the ICAP, that they or any of the partners of the firm, their spouses and minor children do not hold shares of the Company and that the firm and all its partners are in compliance with International Federation of Accountants (IFAC) guidelines on code of ethics as adopted by the ICAP.
20. The statutory auditors or the persons associated with them have not been appointed to provide other services except in accordance with the listing regulations and the auditors have confirmed that they have observed IFAC guidelines in this regard.
21. The ‘closed period’, prior to the announcement of interim / final results, and business decisions, which may materially affect the market price of company’s securities, was determined and intimated to directors, employees and stock exchange.
22. Material / price sensitive information has been disseminated among all market participants at once through stock exchange.
23. The Company has complied with the requirements relating to maintenance of register of persons having access to inside information by designated senior management officer in a timely manner and maintained proper record including basis for inclusion or exclusion of names of persons from the said list.
24. We confirm that all other material requirments in the CCG have been complied with.
Mian Umer Mansha Maqsood AhmedChief Executive Officer Director
Lahore25 September 2017
24
Review Report to the Members on the Statement of Compliance withThe Code of Corporate Governance
We have reviewed the enclosed Statement of Compliance with the best practices contained in the Code of Corporate Governance (“the Code”) prepared by the Board of Directors of NISHAT MILLS LIMITED (“the Company”) for the year ended 30 June 2017 to comply with the Code contained in the Regulations of Pakistan Stock Exchange Limited, where the Company is listed.
The responsibility for compliance with the Code is that of the Board of Directors of the Company. Our responsibility is to review, to the extent where such compliance can be objectively verified, whether the statement of compliance reflects the status of the Company’s compliance with the provisions of the Code and report if it does not and to highlight any non-compliance with the requirements of the Code. A review is limited primarily to inquiries of the Company personnel and reviews of various documents prepared by the Company to comply with the Code.
As a part of our audit of the financial statements we are required to obtain an understanding of the accounting and internal control systems sufficient to plan the audit and develop an effective audit approach. We are not required to consider whether the Board of Directors’ statement on internal control covers all risks and controls or to form an opinion on the effectiveness of such internal controls, the Company’s corporate governance procedures and risks.
The Code requires the Company to place before the Audit Committee and upon recommendation of the Audit Committee, place before the Board of Directors for their review and approval its related party transactions distinguishing between transactions carried out on terms equivalent to
those that prevail in arm’s length transactions and transactions which are not executed at arm’s length price and recording proper justification for using such alternate pricing mechanism. We are only required and have ensured compliance of this requirement to the extent of the approval of the related party transactions by the Board of Directors upon recommendation of the Audit Committee. We have not carried out any procedures to determine whether the related party transactions were undertaken at arm’s length price or not.
Based on our review, nothing has come to our attention which causes us to believe that the Statement of Compliance does not appropriately reflect the Company’s compliance, in all material respects, with the best practices contained in the Code as applicable to the Company for the year ended 30 June 2017.
RIAZ AHMAD & COMPANYChartered Accountants
Name of engagement partner:Mubashar Mehmood
Lahore September 25, 2017
25Nishat Mills Limited
Notice of Annual General MeetingNotice is hereby given that Annual General Meeting of the Members of Nishat Mills Limited (the “Company”) will be held on October 28, 2017 (Saturday) at 12:30 p.m. at the Grand Ball Room-D, the Nishat Hotel, Trade and Finance Centre Block, Near Expo Centre, Abdul Haq Road, Johar Town, Lahore, to transact the following business:
1. To receive, consider and adopt the Audited Un-consolidated and Consolidated Financial Statements of the Company for the year ended June 30, 2017 together with the Directors’ and Auditors’ reports thereon.
2. To approve Final Cash Dividend @ 50% [i.e. Rs.5/- (Rupees five Only) Per Ordinary Share] as recommended by the Board of Directors.
3. To appoint statutory Auditors for the year ending June 30, 2018 and fix their remuneration.
4. Special Business:-
1. To consider and if deemed fit, to pass the following resolutions as special resolutions under Section 199 of the Companies Act, 2017, as recommended by the Board of Directors with or without modification, addition(s) or deletion(s).
RESOLVED that approval of the members of Nishat Mills Limited (the “Company”) be and is hereby accorded in terms of Section 199 of the Companies Act, 2017, Regulation No. 7(e) of Companies (Investment in Associated Companies or Associated Undertakings) Regulations 2012 and subject to the compliance with all statutory and legal requirements, for renewal of investment up to PKR 1,000,000,000/- (Rupees One Billion Only) in Nishat Hotels and Properties Limited (“NHPL”), an associated company, in the form of working capital loan for a period of one year starting from the date of approval by Shareholders, provided that the return on any outstanding amount of loan shall be 3 Months KIBOR plus 0.50% (which shall not be less than the average borrowing cost of the Company) and as per other terms and conditions of the agreement to be executed in writing and as disclosed to the members.
FURTHER RESOLVED that the said resolution shall be valid for one year starting from the date of approval by shareholders and the Chief Executive Officer and/or Chief Financial Officer and/or Company Secretary of the Company be and are hereby singly empowered and authorized to undertake the decision of said investment as and when required by NHPL and to take all steps and actions necessary, incidental and ancillary including execution of any and all documents and agreements as may be required in this regard and to do all acts, matters, deeds and things as may be necessary or expedient for the purpose of implementing the aforesaid resolution.
By order of the Board
Lahore (KHALID MAHMOOD CHOHAN) September 25, 2017 COMPANY SECRETARY
26
NotesBOOK CLOSURE NOTICE:-
The Ordinary Shares Transfer Books of the Company will remain closed from 21-10-2017 to 28-10-2017 (both days inclusive) for entitlement of 50% final cash dividend [i.e. Rs.5/- (Rupees Five Only) Per Ordinary Share] and for attending and voting at Annual General Meeting. Physical transfers/ CDS Transactions IDs received in order in all respect up to 1:00 p.m. on 20-10-2017 at Share Registrar, THK Associates (Pvt) Limited, Karachi Office: 1st Floor, 40-C, Block-6, PECHS, Karachi, Lahore Office: 1st Floor, DYL Motorcycles Ltd. Office, 147-Q Block, behind Emporium Mall, Johar Town, Lahore, will be considered in time, for entitlement of 50% final cash dividend and for attending of meeting.
A member eligible to attend and vote at this meeting may appoint another member his / her proxy to attend and vote instead of him/her. Proxies in order to be effective must reach the Company’s registered office not less than 48 hours before the time for holding the meeting. Proxies of the Members through CDC shall be accompanied with attested copies of their CNIC. In case of corporate entity, the Board’s Resolution/power of attorney with specimen signature shall be furnished along with proxy form to the Company. The shareholders through CDC are requested to bring original CNIC, Account Number and Participant Account Number to produce at the time of attending the meeting.
Shareholders are requested to immediately notify the change in address, if any.
Deduction of Withholding Tax on Dividend
Pursuant to the provisions of the Finance Act 2017 the rates of deduction of income tax from dividend payments under the Income Tax Ordinance have been revised as follows:
- Filler 15%- Non-Filler 20%
All shareholders are advised to check their status on Active Taxpayers List (ATL) available on FBR Website and may, if required, take necessary actions for inclusion of their name in ATL to avail the lower rate of tax deduction.
Deduction of Withholding Tax on Dividend in
case of Joint Account Holders
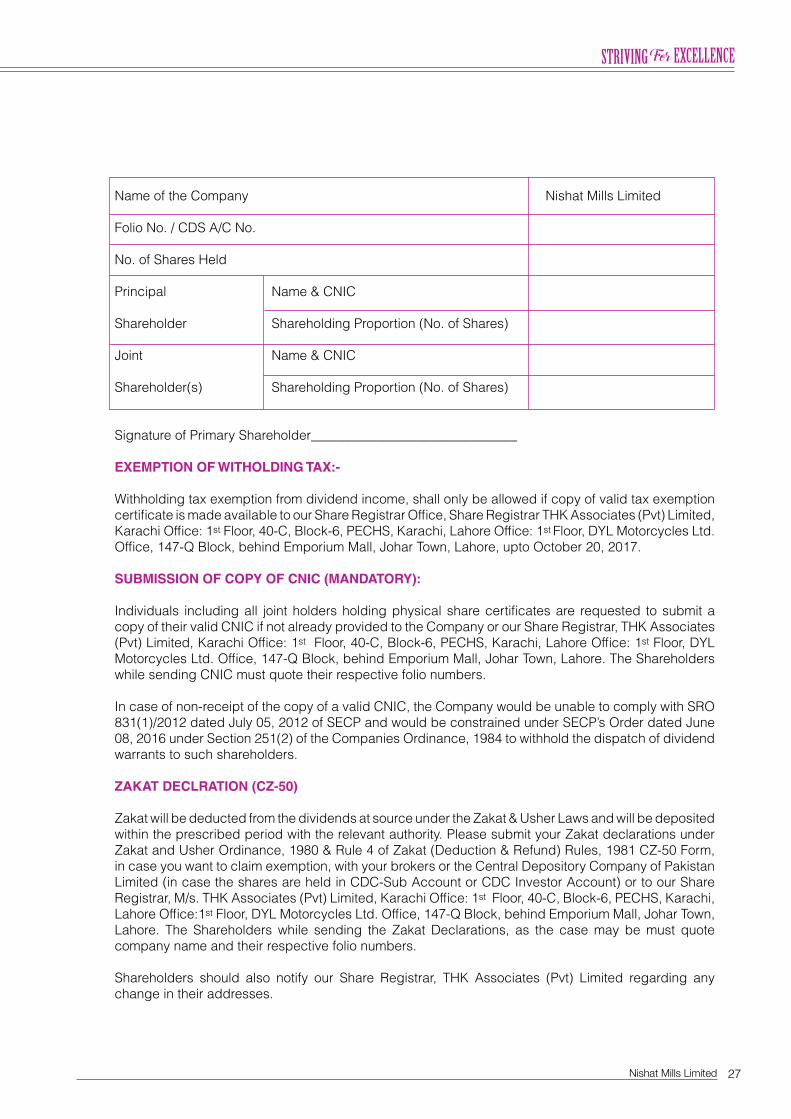
All shareholders who hold shares jointly are requested to provide following information regarding shareholding proportions of Principal Shareholder and Joint-holder(s) in respect of shares held by them to our Share Registrar THK Associates (Pvt) Limited, Karachi Office: 1st Floor, 40-C, Block-6, PECHS, Karachi, Lahore Office: 1st Floor, DYL Motorcycles Ltd. Office, 147-Q Block, behind Emporium Mall, Johar Town, Lahore, latest by October 20, 2017, otherwise each joint holder shall be assumed to have an equal number of shares.
27Nishat Mills Limited
Name of the Company Nishat Mills Limited
Folio No. / CDS A/C No.
No. of Shares Held
Principal Name & CNIC
Shareholder Shareholding Proportion (No. of Shares)
Joint Name & CNIC
Shareholder(s) Shareholding Proportion (No. of Shares)
Signature of Primary Shareholder_______________________________
EXEMPTION OF WITHOLDING TAX:-
Withholding tax exemption from dividend income, shall only be allowed if copy of valid tax exemption certificate is made available to our Share Registrar Office, Share Registrar THK Associates (Pvt) Limited, Karachi Office: 1st Floor, 40-C, Block-6, PECHS, Karachi, Lahore Office: 1st Floor, DYL Motorcycles Ltd. Office, 147-Q Block, behind Emporium Mall, Johar Town, Lahore, upto October 20, 2017.
SUBMISSION OF COPY OF CNIC (MANDATORY):
Individuals including all joint holders holding physical share certificates are requested to submit a copy of their valid CNIC if not already provided to the Company or our Share Registrar, THK Associates (Pvt) Limited, Karachi Office: 1st Floor, 40-C, Block-6, PECHS, Karachi, Lahore Office: 1st Floor, DYL Motorcycles Ltd. Office, 147-Q Block, behind Emporium Mall, Johar Town, Lahore. The Shareholders while sending CNIC must quote their respective folio numbers.
In case of non-receipt of the copy of a valid CNIC, the Company would be unable to comply with SRO 831(1)/2012 dated July 05, 2012 of SECP and would be constrained under SECP’s Order dated June 08, 2016 under Section 251(2) of the Companies Ordinance, 1984 to withhold the dispatch of dividend warrants to such shareholders.
ZAKAT DECLRATION (CZ-50)
Zakat will be deducted from the dividends at source under the Zakat & Usher Laws and will be deposited within the prescribed period with the relevant authority. Please submit your Zakat declarations under Zakat and Usher Ordinance, 1980 & Rule 4 of Zakat (Deduction & Refund) Rules, 1981 CZ-50 Form, in case you want to claim exemption, with your brokers or the Central Depository Company of Pakistan Limited (in case the shares are held in CDC-Sub Account or CDC Investor Account) or to our Share Registrar, M/s. THK Associates (Pvt) Limited, Karachi Office: 1st Floor, 40-C, Block-6, PECHS, Karachi, Lahore Office:1st Floor, DYL Motorcycles Ltd. Office, 147-Q Block, behind Emporium Mall, Johar Town, Lahore. The Shareholders while sending the Zakat Declarations, as the case may be must quote company name and their respective folio numbers.
Shareholders should also notify our Share Registrar, THK Associates (Pvt) Limited regarding any change in their addresses.
28
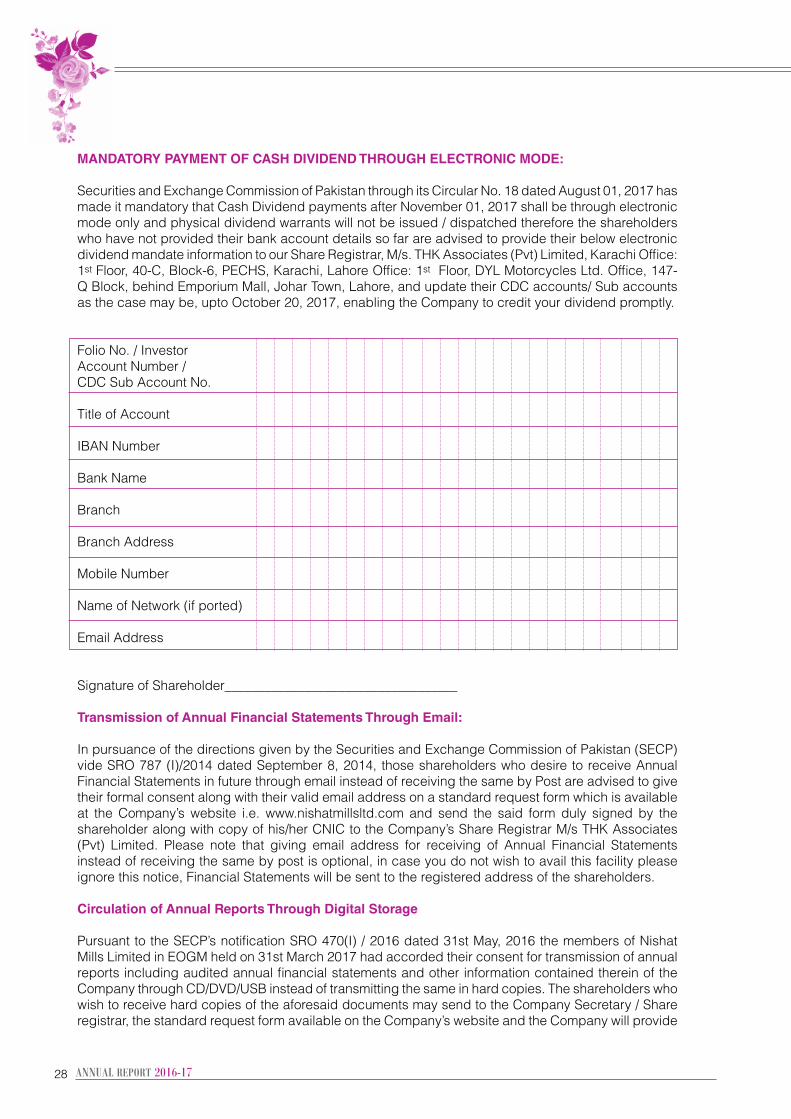
MANDATORY PAYMENT OF CASH DIVIDEND THROUGH ELECTRONIC MODE:
Securities and Exchange Commission of Pakistan through its Circular No. 18 dated August 01, 2017 has made it mandatory that Cash Dividend payments after November 01, 2017 shall be through electronic mode only and physical dividend warrants will not be issued / dispatched therefore the shareholders who have not provided their bank account details so far are advised to provide their below electronic dividend mandate information to our Share Registrar, M/s. THK Associates (Pvt) Limited, Karachi Office: 1st Floor, 40-C, Block-6, PECHS, Karachi, Lahore Office: 1st Floor, DYL Motorcycles Ltd. Office, 147-Q Block, behind Emporium Mall, Johar Town, Lahore, and update their CDC accounts/ Sub accounts as the case may be, upto October 20, 2017, enabling the Company to credit your dividend promptly.
Folio No. / Investor Account Number / CDC Sub Account No.
Title of Account
IBAN Number
Bank Name
Branch
Branch Address
Mobile Number
Name of Network (if ported)
Email Address
Signature of Shareholder___________________________________
Transmission of Annual Financial Statements Through Email:
In pursuance of the directions given by the Securities and Exchange Commission of Pakistan (SECP) vide SRO 787 (I)/2014 dated September 8, 2014, those shareholders who desire to receive Annual Financial Statements in future through email instead of receiving the same by Post are advised to give their formal consent along with their valid email address on a standard request form which is available at the Company’s website i.e. www.nishatmillsltd.com and send the said form duly signed by the shareholder along with copy of his/her CNIC to the Company’s Share Registrar M/s THK Associates (Pvt) Limited. Please note that giving email address for receiving of Annual Financial Statements instead of receiving the same by post is optional, in case you do not wish to avail this facility please ignore this notice, Financial Statements will be sent to the registered address of the shareholders.
Circulation of Annual Reports Through Digital Storage
Pursuant to the SECP’s notification SRO 470(I) / 2016 dated 31st May, 2016 the members of Nishat Mills Limited in EOGM held on 31st March 2017 had accorded their consent for transmission of annual reports including audited annual financial statements and other information contained therein of the Company through CD/DVD/USB instead of transmitting the same in hard copies. The shareholders who wish to receive hard copies of the aforesaid documents may send to the Company Secretary / Share registrar, the standard request form available on the Company’s website and the Company will provide
29Nishat Mills Limited
the aforesaid documents to the shareholders on demand, free of cost, within one week of such demand.
Unclaimed Dividend / Shares
Shareholders who could not collect their dividend/physical shares are advised to contact our Share Registrar to collect/enquire about their unclaimed dividend or shares, if any. In compliance with Section 244 of the Companies Act, 2017, after having completed the stipulated procedure, all such dividend and shares outstanding for a period of 3 years or more from the date due and payable shall be deposited to the credit of Federal Government in case of unclaimed dividend and in case of shares, shall be delivered to the SECP.
Video Conference Facility
In terms of the Companies Act, 2017, members residing in a city holding at least 10% of the total paid up share capital may demand the facility of video-link for participating in the annual general meeting. The request for video-link facility shall be received by the Share Registrar at their address at least 7 days prior to the date of the meeting on the Standard Form available on the website of the Company.
STATEMENT UNDER SECTION134(3) OF THE COMPANIES ACT, 2017.
This statement sets out the material facts pertaining to the special business to be transacted at the Annual General Meeting of the Company to be held on October 28, 2017.
The Company obtained approval from its Board of Directors and Shareholders on 27 September 2016 and 31 October 2016 respectively to make an investment up to Rs. 1 billion in the form of working capital loan for a period of one year at the interest rate of 3 Month KIBOR plus 0.50%. However, the Company did not make the investment in NHPL against the said approval because the funds were not required by the NHPL. The Board of Directors of the Company in their meeting held on September 25, 2017 has recommended renewal of the said investment for a period of another one year starting from the date of this AGM.
Nishat Hotels and Properties Limited (NHPL) was incorporated on 04 October 2007 as a public limited company with an authorized share capital of Rs. 10,000,000/- (Rupees Ten Million Only). The authorized share capital has subsequently been enhanced to Rs. 10,000,000,000/- (Rupees Ten Billion Only).
NHPL was set up with the main object of carrying hotel and hospitality business in Pakistan. For the intended purpose, the company acquired Hotel site of 119 Kanals, 6 Marlas and 73 Sq Ft of Commercial Land situated at Trade and Finance Block, Johar Town, Lahore, from Lahore Development Authority (LDA) – Urban Development Wing.
Nishat Hotels & Properties Limited started its commercial operation of Emporium Mall on 30 June 2016 and majority of the outlets have been handed over to tenants. Four Star Hotel has also started its commercial operations on 20 May 2017 and its occupancy rate is around 70%.
The Building has a covered area of 2.742 Million Square Feet comprising the following building components (3 basements, ground floor and 11 floors):
• 4 star hotel comprising of 198 rooms hotel• Banquet halls• Hyper Star• Shopping Mall with following features: – Retail outlets – Food courts – Cineplex – Fun Factory – Health and Leisure Zones – Two basements with 2,815 parking
bays for cars and motorcycles.
Since the approval of the shareholders for investment in NHPL has lapsed and Nishat Hotel and Properties Limited needs short term finance for meeting expense of staff salary, power generation, maintenance of HVAC and other working capital requirements and considering the average borrowing cost of the Company and the return offered by Banks on term deposits, the Directors of the Company have recommended to invest surplus funds of the Company by renewing the working capital loan of up to Rs. 1 billion to NHPL at the interest rate of 3 Month KIBOR plus
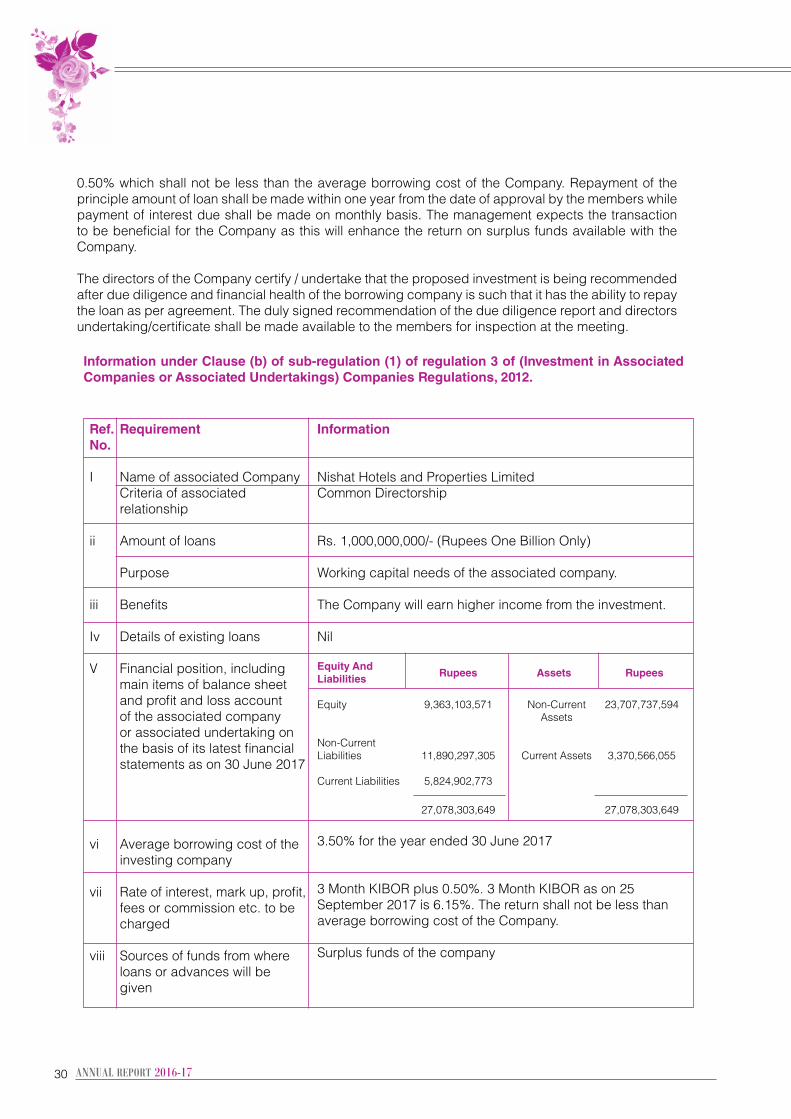
30
Information under Clause (b) of sub-regulation (1) of regulation 3 of (Investment in Associated Companies or Associated Undertakings) Companies Regulations, 2012.
Ref. No.
I
ii
iii
Iv
V
vi
vii
viii
Requirement
Name of associated Company Criteria of associated relationship
Amount of loans
Purpose
Benefits
Details of existing loans
Financial position, including main items of balance sheet and profit and loss account of the associated company or associated undertaking on the basis of its latest financial statements as on 30 June 2017
Average borrowing cost of the investing company
Rate of interest, mark up, profit, fees or commission etc. to be charged
Sources of funds from where loans or advances will be given
Information
Nishat Hotels and Properties LimitedCommon Directorship
Rs. 1,000,000,000/- (Rupees One Billion Only)
Working capital needs of the associated company.
The Company will earn higher income from the investment.
Nil
Equity And Rupees
Assets
RupeesLiabilities
Equity 9,363,103,571 Non-Current 23,707,737,594 Assets
Non-Current Liabilities 11,890,297,305 Current Assets 3,370,566,055
Current Liabilities 5,824,902,773
27,078,303,649 27,078,303,649
3.50% for the year ended 30 June 2017
3 Month KIBOR plus 0.50%. 3 Month KIBOR as on 25 September 2017 is 6.15%. The return shall not be less than average borrowing cost of the Company.
Surplus funds of the company
0.50% which shall not be less than the average borrowing cost of the Company. Repayment of the principle amount of loan shall be made within one year from the date of approval by the members while payment of interest due shall be made on monthly basis. The management expects the transaction to be beneficial for the Company as this will enhance the return on surplus funds available with the Company.
The directors of the Company certify / undertake that the proposed investment is being recommended after due diligence and financial health of the borrowing company is such that it has the ability to repay the loan as per agreement. The duly signed recommendation of the due diligence report and directors undertaking/certificate shall be made available to the members for inspection at the meeting.
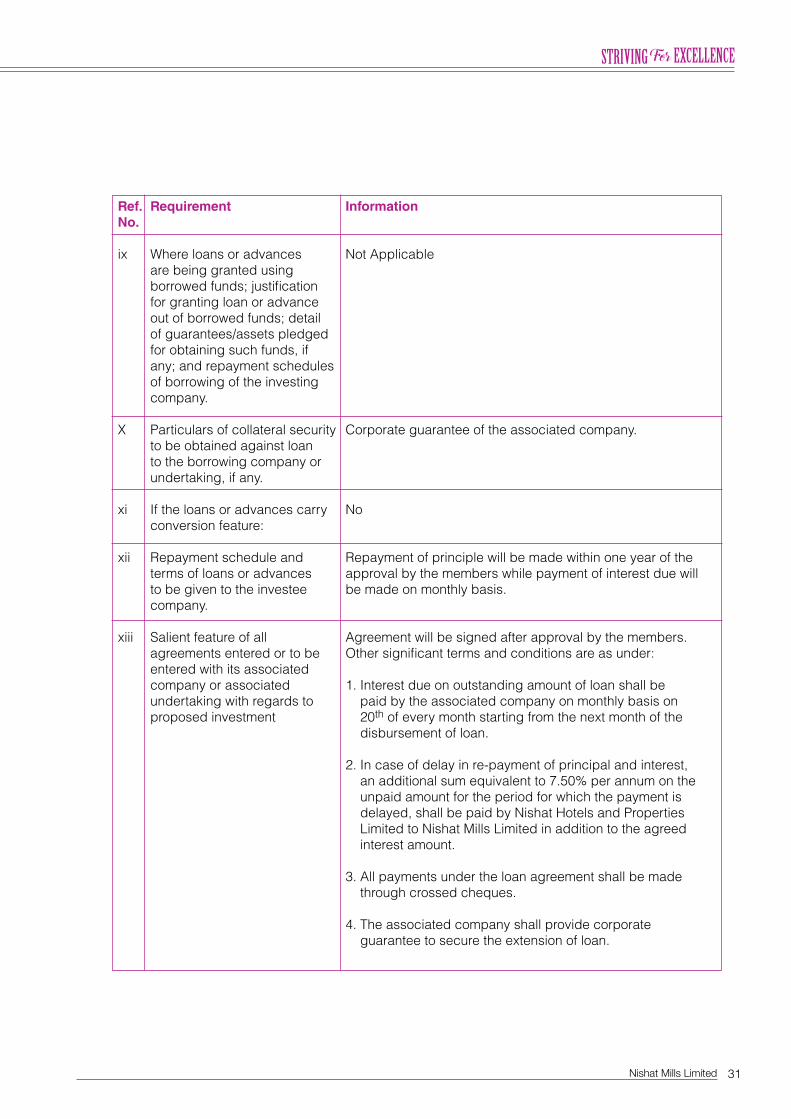
31Nishat Mills Limited
Ref. No.
ix
X
xi
xii
xiii
Requirement
Where loans or advances are being granted using borrowed funds; justification for granting loan or advance out of borrowed funds; detail of guarantees/assets pledged for obtaining such funds, if any; and repayment schedules of borrowing of the investing company.
Particulars of collateral security to be obtained against loan to the borrowing company or undertaking, if any.
If the loans or advances carry conversion feature:
Repayment schedule and terms of loans or advances to be given to the investee company.
Salient feature of all agreements entered or to be entered with its associated company or associated undertaking with regards to proposed investment
Information
Not Applicable
Corporate guarantee of the associated company.
No
Repayment of principle will be made within one year of the approval by the members while payment of interest due will be made on monthly basis.
Agreement will be signed after approval by the members. Other significant terms and conditions are as under:
1. Interest due on outstanding amount of loan shall be paid by the associated company on monthly basis on 20th of every month starting from the next month of the disbursement of loan.
2. In case of delay in re-payment of principal and interest, an additional sum equivalent to 7.50% per annum on the unpaid amount for the period for which the payment is delayed, shall be paid by Nishat Hotels and Properties Limited to Nishat Mills Limited in addition to the agreed interest amount.
3. All payments under the loan agreement shall be made through crossed cheques.
4. The associated company shall provide corporate guarantee to secure the extension of loan.
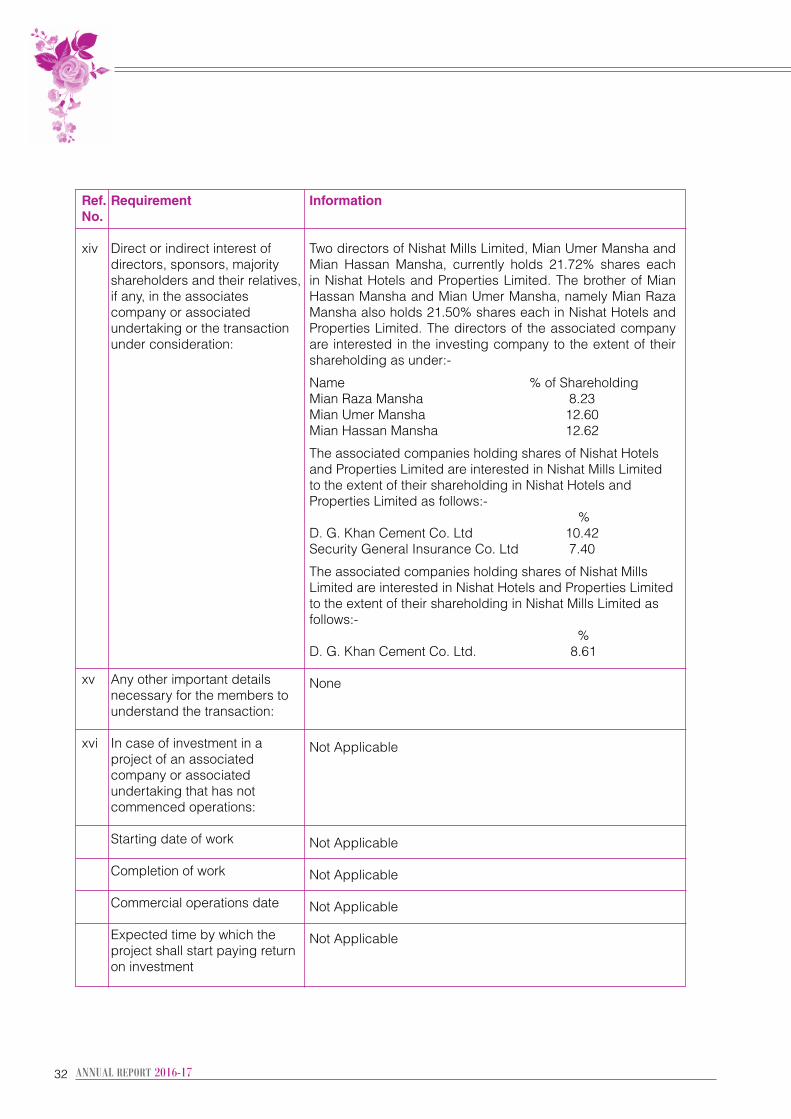
32
Ref. No.
xiv
xv
xvi
Requirement
Direct or indirect interest of directors, sponsors, majority shareholders and their relatives, if any, in the associates company or associated undertaking or the transaction under consideration:
Any other important details necessary for the members to understand the transaction:
In case of investment in a project of an associated company or associated undertaking that has not commenced operations:
Starting date of work
Completion of work
Commercial operations date
Expected time by which the project shall start paying return on investment
Information
Two directors of Nishat Mills Limited, Mian Umer Mansha and Mian Hassan Mansha, currently holds 21.72% shares each in Nishat Hotels and Properties Limited. The brother of Mian Hassan Mansha and Mian Umer Mansha, namely Mian Raza Mansha also holds 21.50% shares each in Nishat Hotels and Properties Limited. The directors of the associated company are interested in the investing company to the extent of their shareholding as under:-
Name % of Shareholding Mian Raza Mansha 8.23Mian Umer Mansha 12.60Mian Hassan Mansha 12.62
The associated companies holding shares of Nishat Hotels and Properties Limited are interested in Nishat Mills Limited to the extent of their shareholding in Nishat Hotels and Properties Limited as follows:- %D. G. Khan Cement Co. Ltd 10.42Security General Insurance Co. Ltd 7.40
The associated companies holding shares of Nishat Mills Limited are interested in Nishat Hotels and Properties Limited to the extent of their shareholding in Nishat Mills Limited as follows:- %D. G. Khan Cement Co. Ltd. 8.61
None
Not Applicable
Not Applicable
Not Applicable
Not Applicable
Not Applicable
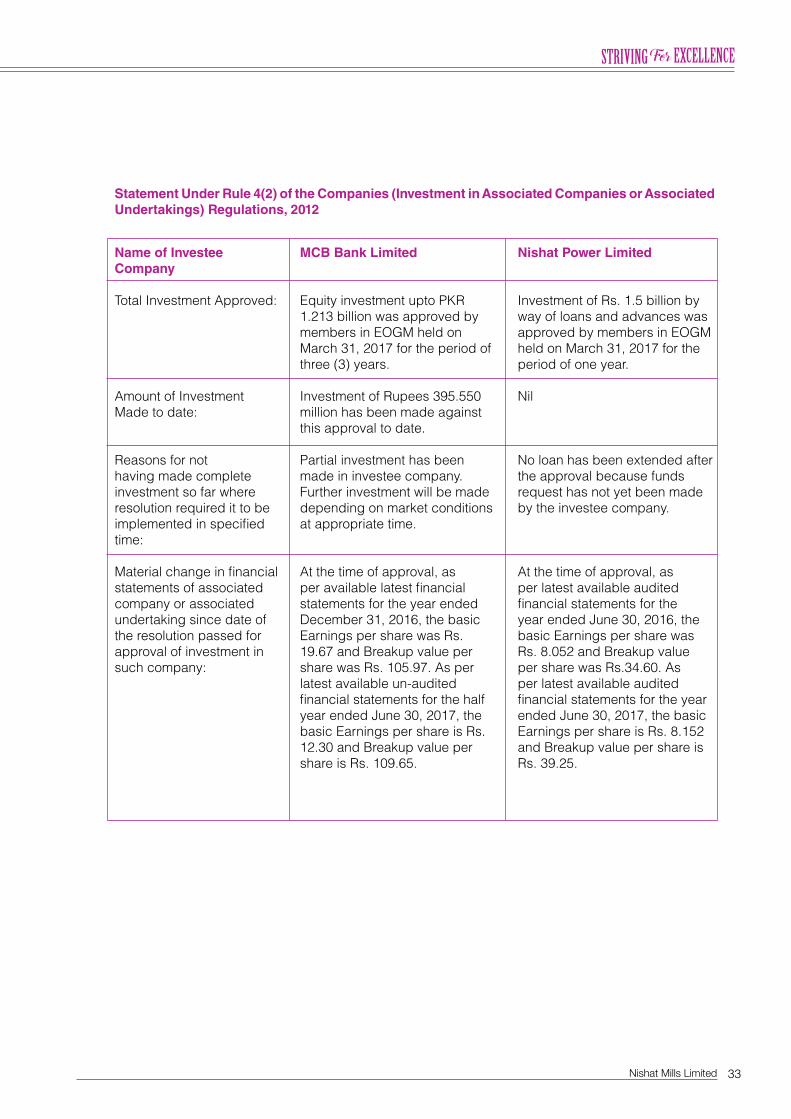
33Nishat Mills Limited
Name of Investee Company
Total Investment Approved:
Amount of Investment Made to date:
Reasons for not having made complete investment so far where resolution required it to be implemented in specified time:
Material change in financial statements of associated company or associated undertaking since date of the resolution passed for approval of investment in such company:
MCB Bank Limited
Equity investment upto PKR 1.213 billion was approved by members in EOGM held on March 31, 2017 for the period of three (3) years.
Investment of Rupees 395.550 million has been made against this approval to date.
Partial investment has been made in investee company. Further investment will be made depending on market conditions at appropriate time.
At the time of approval, as per available latest financial statements for the year ended December 31, 2016, the basic Earnings per share was Rs. 19.67 and Breakup value per share was Rs. 105.97. As per latest available un-audited financial statements for the half year ended June 30, 2017, the basic Earnings per share is Rs. 12.30 and Breakup value per share is Rs. 109.65.
Nishat Power Limited
Investment of Rs. 1.5 billion by way of loans and advances was approved by members in EOGM held on March 31, 2017 for the period of one year.
Nil
No loan has been extended after the approval because funds request has not yet been made by the investee company.
At the time of approval, as per latest available audited financial statements for the year ended June 30, 2016, the basic Earnings per share was Rs. 8.052 and Breakup value per share was Rs.34.60. As per latest available audited financial statements for the year ended June 30, 2017, the basic Earnings per share is Rs. 8.152 and Breakup value per share is Rs. 39.25.
Statement Under Rule 4(2) of the Companies (Investment in Associated Companies or Associated Undertakings) Regulations, 2012
34
Financial Statements ofNISHAT MILLS LIMITED
for the year ended June 30, 2017
36
37Nishat Mills Limited
We have audited the annexed balance sheet of NISHAT MILLS LIMITED as at 30 June 2017 and the related profit and loss account, statement of comprehensive income, cash flow statement and statement of changes in equity together with the notes forming part thereof, for the year then ended and we state that we have obtained all the information and explanations which, to the best of our knowledge and belief, were necessary for the purposes of our audit.
It is the responsibility of the Company’s management to establish and maintain a system of internal control, and prepare and present the above said statements in conformity with the approved accounting standards and the requirements of the repealed Companies Ordinance, 1984. Our responsibility is to express an opinion on these statements based on our audit.
We conducted our audit in accordance with the auditing standards as applicable in Pakistan. These standards require that we plan and perform the audit to obtain reasonable assurance about whether the above said statements are free of any material misstatement. An audit includes examining, on a test basis, evidence supporting the amounts and disclosures in the above said statements. An audit also includes assessing the accounting policies and significant estimates made by management, as well as, evaluating the overall presentation of the above said statements. We believe that our audit provides a reasonable basis for our opinion and, after due verification, we report that:
(a) in our opinion, proper books of account have been kept by the Company as required by the repealed Companies Ordinance, 1984;
(b) in our opinion:
i) the balance sheet and profit and loss account together with the notes thereon have been drawn up in conformity with the repealed Companies Ordinance, 1984, and are in agreement with the books of account and are further in accordance with accounting policies consistently applied;
ii) the expenditure incurred during the year was for the purpose of the Company’s business;
and iii) the business conducted, investments made and the expenditure incurred during the year
were in accordance with the objects of the Company;
(c) in our opinion and to the best of our information and according to the explanations given to us, the balance sheet, profit and loss account, statement of comprehensive income, cash flow statement and statement of changes in equity together with the notes forming part thereof conform with approved accounting standards as applicable in Pakistan, and, give the information required by the repealed Companies Ordinance, 1984, in the manner so required and respectively give a true and fair view of the state of the Company’s affairs as at 30 June 2017 and of the profit, its comprehensive income, its cash flows and changes in equity for the year then ended; and
(d) in our opinion, Zakat deductible at source under the Zakat and Ushr Ordinance, 1980 (XVIII of
1980), was deducted by the Company and deposited in the Central Zakat Fund established under Section 7 of that Ordinance.
RIAZ AHMAD & COMPANYChartered Accountants
Name of engagement partner:Mubashar Mehmood
25 September 2017
LAHORE
Auditors’ Report to the Members
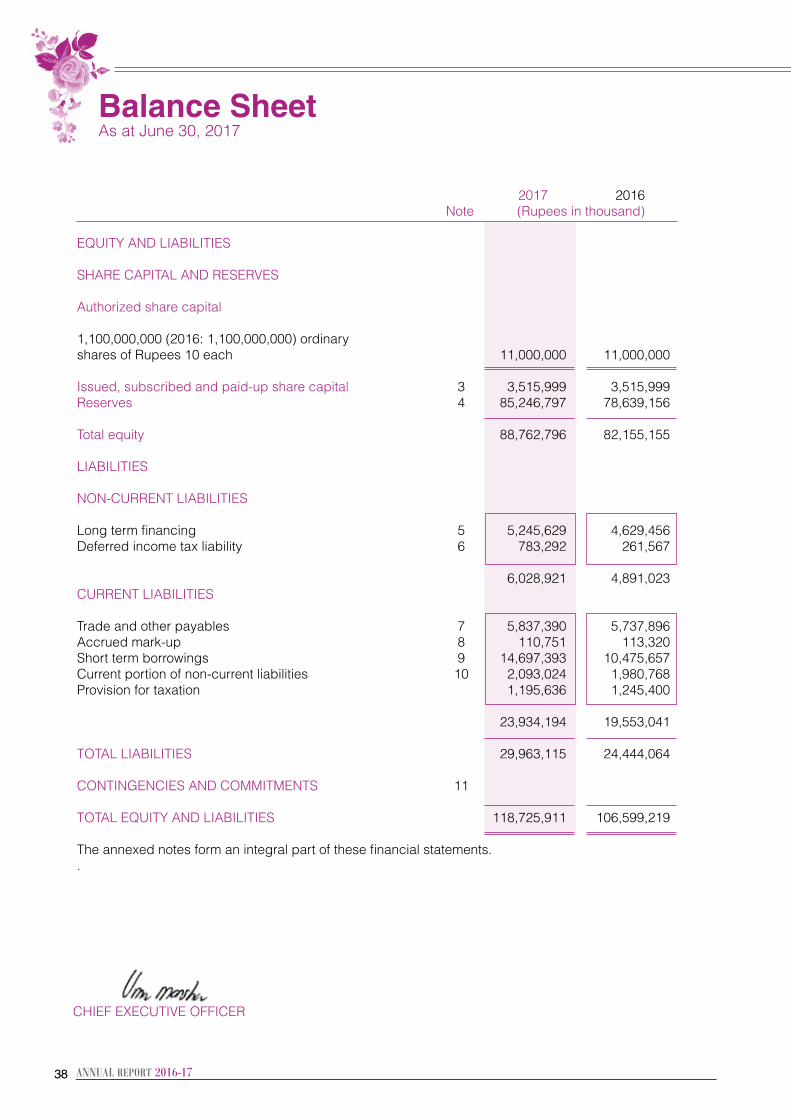
3838
2017 2016 Note (Rupees in thousand)
EQUITY AND LIABILITIES SHARE CAPITAL AND RESERVES Authorized share capital 1,100,000,000 (2016: 1,100,000,000) ordinary shares of Rupees 10 each 11,000,000 11,000,000 Issued, subscribed and paid-up share capital 3 3,515,999 3,515,999 Reserves 4 85,246,797 78,639,156
Total equity 88,762,796 82,155,155 LIABILITIES NON-CURRENT LIABILITIES Long term financing 5 5,245,629 4,629,456 Deferred income tax liability 6 783,292 261,567
6,028,921 4,891,023 CURRENT LIABILITIES Trade and other payables 7 5,837,390 5,737,896 Accrued mark-up 8 110,751 113,320 Short term borrowings 9 14,697,393 10,475,657 Current portion of non-current liabilities 10 2,093,024 1,980,768 Provision for taxation 1,195,636 1,245,400 23,934,194 19,553,041 TOTAL LIABILITIES 29,963,115 24,444,064 CONTINGENCIES AND COMMITMENTS 11 TOTAL EQUITY AND LIABILITIES 118,725,911 106,599,219 The annexed notes form an integral part of these financial statements. .
Balance Sheet As at June 30, 2017
CHIEF EXECUTIVE OFFICER
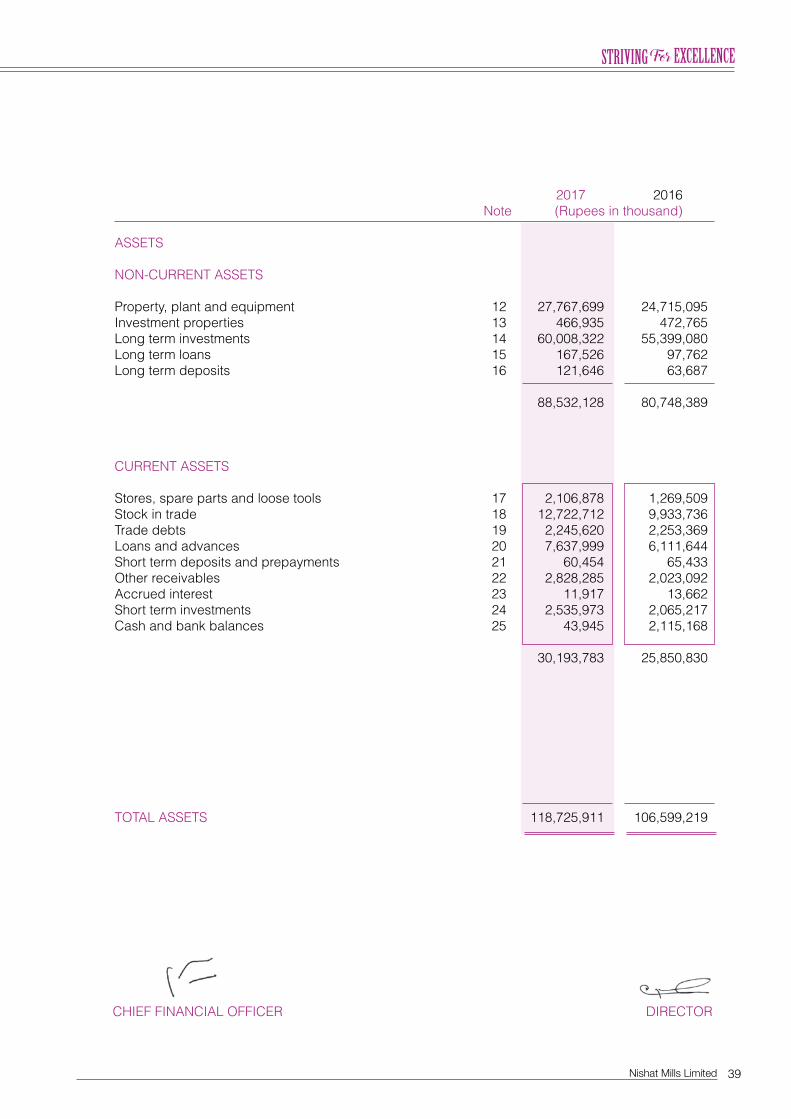
39Nishat Mills Limited
2017 2016 Note (Rupees in thousand)
ASSETS NON-CURRENT ASSETS Property, plant and equipment 12 27,767,699 24,715,095 Investment properties 13 466,935 472,765 Long term investments 14 60,008,322 55,399,080 Long term loans 15 167,526 97,762 Long term deposits 16 121,646 63,687
88,532,128 80,748,389 CURRENT ASSETS Stores, spare parts and loose tools 17 2,106,878 1,269,509 Stock in trade 18 12,722,712 9,933,736 Trade debts 19 2,245,620 2,253,369 Loans and advances 20 7,637,999 6,111,644 Short term deposits and prepayments 21 60,454 65,433 Other receivables 22 2,828,285 2,023,092 Accrued interest 23 11,917 13,662 Short term investments 24 2,535,973 2,065,217 Cash and bank balances 25 43,945 2,115,168
30,193,783 25,850,830 TOTAL ASSETS 118,725,911 106,599,219
CHIEF FINANCIAL OFFICER DIRECTOR
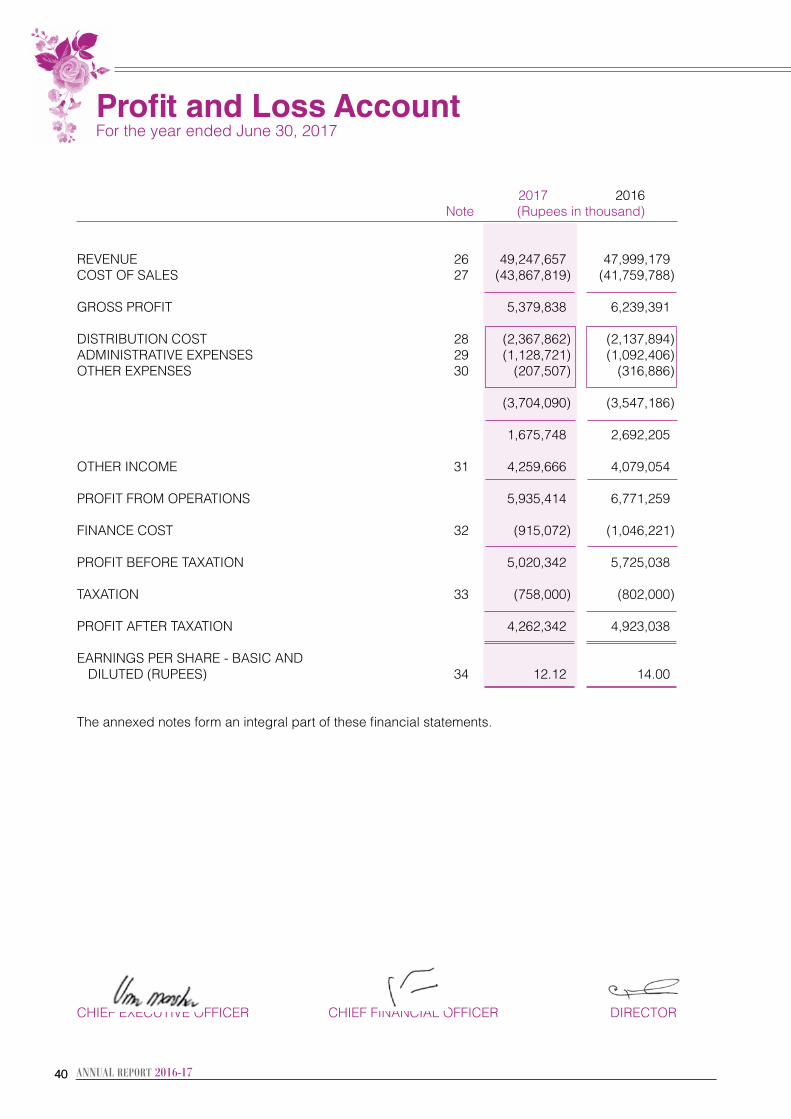
4040
2017 2016 Note (Rupees in thousand)
REVENUE 26 49,247,657 47,999,179 COST OF SALES 27 (43,867,819) (41,759,788)
GROSS PROFIT 5,379,838 6,239,391 DISTRIBUTION COST 28 (2,367,862) (2,137,894)ADMINISTRATIVE EXPENSES 29 (1,128,721) (1,092,406)OTHER EXPENSES 30 (207,507) (316,886)
(3,704,090) (3,547,186)
1,675,748 2,692,205 OTHER INCOME 31 4,259,666 4,079,054
PROFIT FROM OPERATIONS 5,935,414 6,771,259 FINANCE COST 32 (915,072) (1,046,221)
PROFIT BEFORE TAXATION 5,020,342 5,725,038 TAXATION 33 (758,000) (802,000)
PROFIT AFTER TAXATION 4,262,342 4,923,038 EARNINGS PER SHARE - BASIC AND DILUTED (RUPEES) 34 12.12 14.00 The annexed notes form an integral part of these financial statements.
Profit and Loss Account For the year ended June 30, 2017
CHIEF EXECUTIVE OFFICER CHIEF FINANCIAL OFFICER DIRECTOR
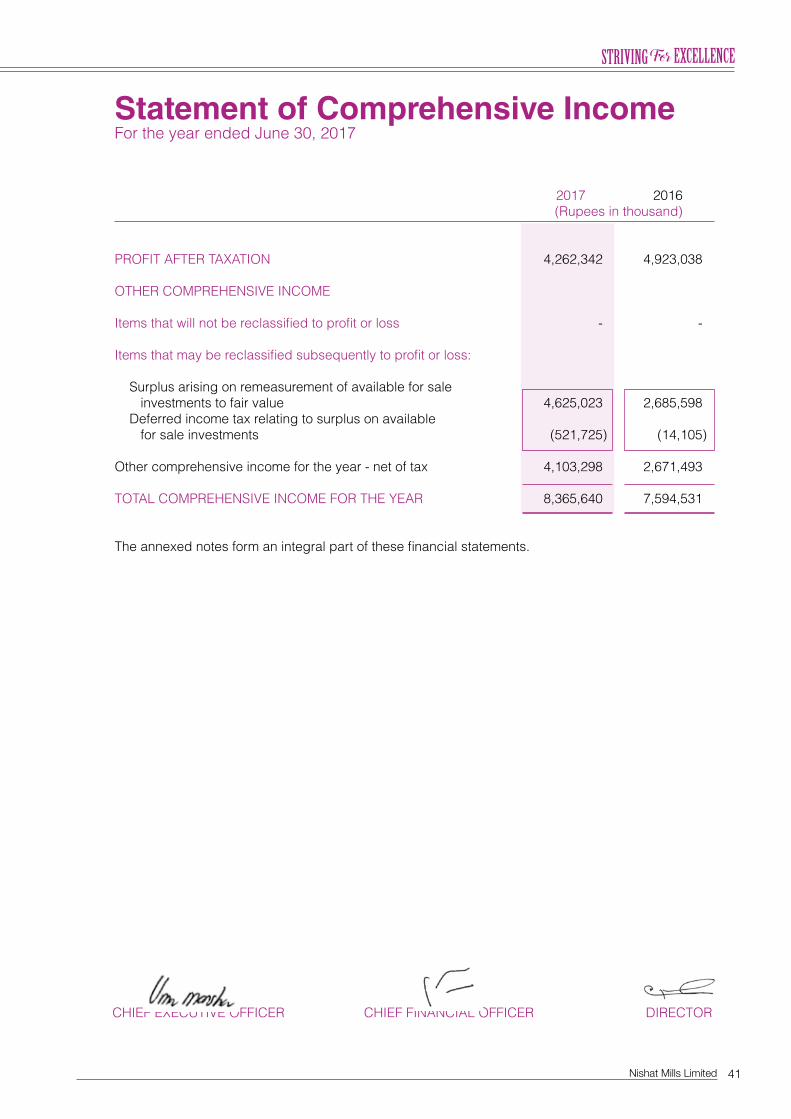
41Nishat Mills Limited
2017 2016 (Rupees in thousand)
PROFIT AFTER TAXATION 4,262,342 4,923,038 OTHER COMPREHENSIVE INCOME Items that will not be reclassified to profit or loss - - Items that may be reclassified subsequently to profit or loss: Surplus arising on remeasurement of available for sale investments to fair value 4,625,023 2,685,598 Deferred income tax relating to surplus on available for sale investments (521,725) (14,105)
Other comprehensive income for the year - net of tax 4,103,298 2,671,493 TOTAL COMPREHENSIVE INCOME FOR THE YEAR 8,365,640 7,594,531 The annexed notes form an integral part of these financial statements.
Statement of Comprehensive Income For the year ended June 30, 2017
CHIEF EXECUTIVE OFFICER CHIEF FINANCIAL OFFICER DIRECTOR
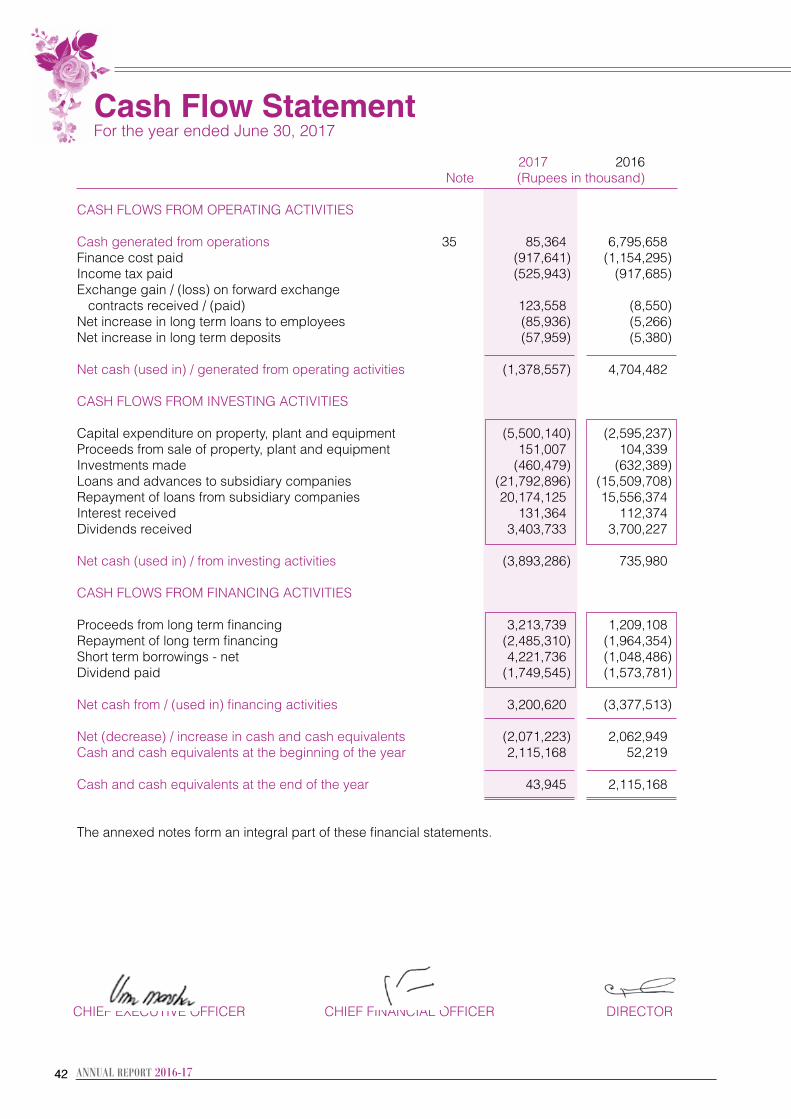
4242
Cash Flow Statement For the year ended June 30, 2017
2017 2016 Note (Rupees in thousand)
CASH FLOWS FROM OPERATING ACTIVITIES Cash generated from operations 35 85,364 6,795,658 Finance cost paid (917,641) (1,154,295)Income tax paid (525,943) (917,685)Exchange gain / (loss) on forward exchange contracts received / (paid) 123,558 (8,550)Net increase in long term loans to employees (85,936) (5,266)Net increase in long term deposits (57,959) (5,380)
Net cash (used in) / generated from operating activities (1,378,557) 4,704,482 CASH FLOWS FROM INVESTING ACTIVITIES Capital expenditure on property, plant and equipment (5,500,140) (2,595,237)Proceeds from sale of property, plant and equipment 151,007 104,339 Investments made (460,479) (632,389)Loans and advances to subsidiary companies (21,792,896) (15,509,708)Repayment of loans from subsidiary companies 20,174,125 15,556,374 Interest received 131,364 112,374 Dividends received 3,403,733 3,700,227 Net cash (used in) / from investing activities (3,893,286) 735,980 CASH FLOWS FROM FINANCING ACTIVITIES Proceeds from long term financing 3,213,739 1,209,108 Repayment of long term financing (2,485,310) (1,964,354)Short term borrowings - net 4,221,736 (1,048,486)Dividend paid (1,749,545) (1,573,781)
Net cash from / (used in) financing activities 3,200,620 (3,377,513)
Net (decrease) / increase in cash and cash equivalents (2,071,223) 2,062,949 Cash and cash equivalents at the beginning of the year 2,115,168 52,219
Cash and cash equivalents at the end of the year 43,945 2,115,168 The annexed notes form an integral part of these financial statements.
CHIEF EXECUTIVE OFFICER CHIEF FINANCIAL OFFICER DIRECTOR
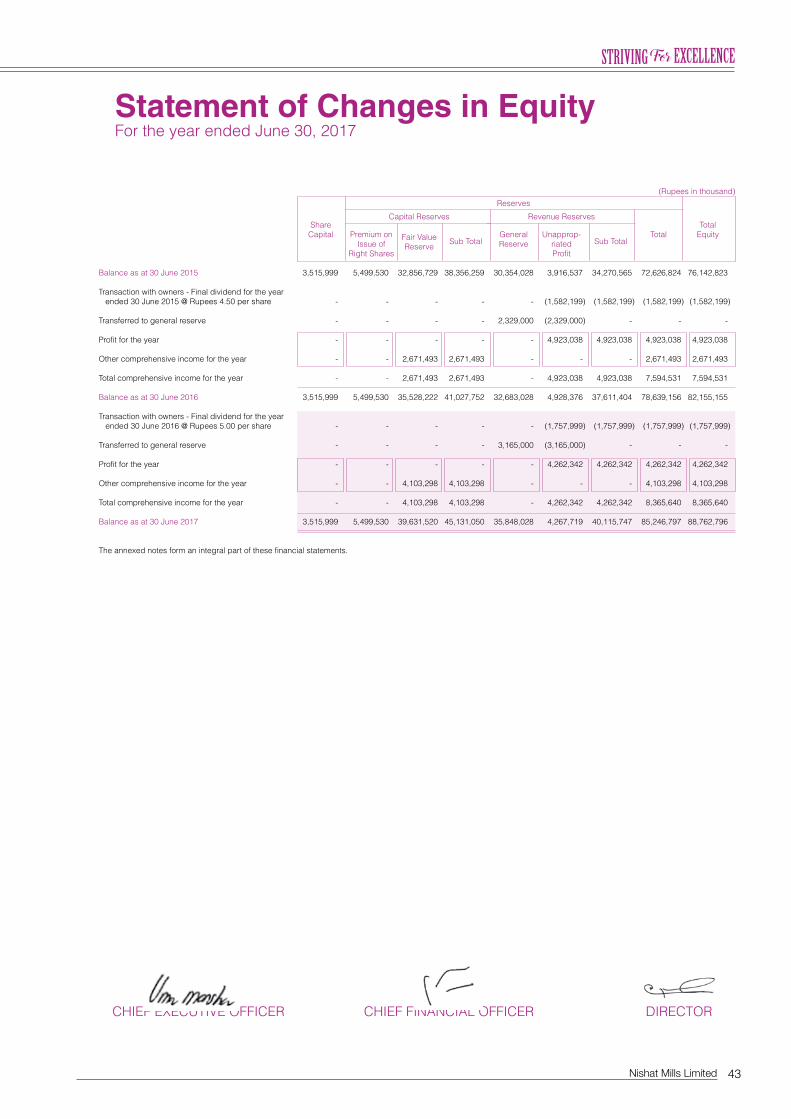
43Nishat Mills Limited
Statement of Changes in EquityFor the year ended June 30, 2017
(Rupees in thousand) Reserves Capital Reserves Revenue Reserves Share Total Capital Premium on Fair Value General Unapprop- Total Equity Issue of Reserve Sub Total Reserve riated Sub Total Right Shares Profit Balance as at 30 June 2015 3,515,999 5,499,530 32,856,729 38,356,259 30,354,028 3,916,537 34,270,565 72,626,824 76,142,823 Transaction with owners - Final dividend for the year ended 30 June 2015 @ Rupees 4.50 per share - - - - - (1,582,199) (1,582,199) (1,582,199) (1,582,199) Transferred to general reserve - - - - 2,329,000 (2,329,000) - - - Profit for the year - - - - - 4,923,038 4,923,038 4,923,038 4,923,038 Other comprehensive income for the year - - 2,671,493 2,671,493 - - - 2,671,493 2,671,493 Total comprehensive income for the year - - 2,671,493 2,671,493 - 4,923,038 4,923,038 7,594,531 7,594,531 Balance as at 30 June 2016 3,515,999 5,499,530 35,528,222 41,027,752 32,683,028 4,928,376 37,611,404 78,639,156 82,155,155 Transaction with owners - Final dividend for the year ended 30 June 2016 @ Rupees 5.00 per share - - - - - (1,757,999) (1,757,999) (1,757,999) (1,757,999) Transferred to general reserve - - - - 3,165,000 (3,165,000) - - - Profit for the year - - - - - 4,262,342 4,262,342 4,262,342 4,262,342 Other comprehensive income for the year - - 4,103,298 4,103,298 - - - 4,103,298 4,103,298 Total comprehensive income for the year - - 4,103,298 4,103,298 - 4,262,342 4,262,342 8,365,640 8,365,640 Balance as at 30 June 2017 3,515,999 5,499,530 39,631,520 45,131,050 35,848,028 4,267,719 40,115,747 85,246,797 88,762,796
The annexed notes form an integral part of these financial statements.
CHIEF EXECUTIVE OFFICER CHIEF FINANCIAL OFFICER DIRECTOR
4444
1 THE COMPANY AND ITS OPERATIONS
Nishat Mills Limited is a public limited Company incorporated in Pakistan under the Companies Act, 1913 (Now Companies Act, 2017) and listed on Pakistan Stock Exchange Limited. Its registered office is situated at 53-A, Lawrence Road, Lahore. The Company is engaged in the business of textile manufacturing and of spinning, combing, weaving, bleaching, dyeing, printing, stitching, apparel, buying, selling and otherwise dealing in yarn, linen, cloth and other goods and fabrics made from raw cotton, synthetic fibre and cloth and to generate, accumulate, distribute, supply and sell electricity.
2 SUMMARY OF SIGNIFICANT ACCOUNTING POLICIES
The significant accounting policies applied in the preparation of these financial statements are set out below. These policies have been consistently applied to all years presented, unless otherwise stated:
2.1 Basis of preparation
a) Statement of compliance
These financial statements have been prepared in accordance with approved accounting standards as applicable in Pakistan. Approved accounting standards comprise of such International Financial Reporting Standards (IFRS) issued by the International Accounting Standards Board as are notified under the repealed Companies Ordinance, 1984, provisions of and directives issued under the repealed Companies Ordinance, 1984. In case requirements differ, the provisions or directives of the repealed Companies Ordinance, 1984 shall prevail.
The Companies Ordinance, 1984 has been repealed after the enactment of the Companies Act, 2017 on 30 May 2017. SECP vide its Circular 17 of 2017 and its press release dated 20 July 2017 has clarified that the companies whose financial year, including quarterly and other interim period, closes on or before 30 June 2017 shall prepare their financial statements in accordance with the provisions of the repealed Companies Ordinance, 1984. The Companies Act, 2017 requires enhanced disclosures about Company’s operations and has also enhanced the definition of related parties.
b) Accounting convention
These financial statements have been prepared under the historical cost convention except for the certain financial instruments carried at fair value.
c) Critical accounting estimates and judgments
The preparation of financial statements in conformity with the approved accounting standards requires the use of certain critical accounting estimates. It also requires the management to exercise its judgment in the process of applying the Company’s accounting policies. Estimates and judgments are continually evaluated and are based on historical experience and other factors, including expectations of future events that are believed to be reasonable under the circumstances. The areas where various assumptions and estimates are significant to the Company’s financial statements or where judgments were exercised in application of accounting policies are as follows:
Financial instruments
The fair value of financial instruments that are not traded in an active market is determined by using valuation techniques based on assumptions that are dependent on conditions existing at balance sheet date.
Useful lives, patterns of economic benefits and impairments
Estimates with respect to residual values and useful lives and pattern of flow of economic benefits are based on the analysis of the management of the Company. Further, the Company reviews the value of assets for possible impairment on an annual basis. Any change in the estimates in the future might affect the carrying amount of respective item of property, plant and equipment, with a corresponding effect on the depreciation charge and impairment.
Notes to the Financial Statements For the year ended June 30, 2017
45Nishat Mills Limited
Inventories
Net realizable value of inventories is determined with reference to currently prevailing selling prices less estimated expenditure to make sales.
Taxation
In making the estimates for income tax currently payable by the Company, the management takes into account the current income tax law and the decisions of appellate authorities on certain issues in the past.
Provision for doubtful debts
The Company reviews its receivable against any provision required for any doubtful balances on an ongoing basis. The provision is made while taking into consideration expected recoveries, if any.
Impairment of investments in subsidiaries and equity method accounted for associated companies
In making an estimate of recoverable amount of the Company’s investments in subsidiaries and equity method accounted for associated companies, the management considers future cash flows.
d) Amendments to published approved accounting standards that are effective in current year and are relevant to the Company
The following amendments to published approved accounting standards are mandatory for the Company’s accounting periods beginning on or after 01 July 2016:
IAS 1 (Amendments) ‘Presentation of Financial Statements’ (effective for annual periods beginning on or after 01 January 2016). Amendments have been made to address perceived impediments to preparers exercising their judgement in presenting their financial reports by making the following changes: clarification that information should not be obscured by aggregating or by providing immaterial information, materiality consideration apply to the all parts of the financial statements, and even when a standard requires a specific disclosure, materiality consideration do apply; clarification that the list of the line items to be presented in these statements can be disaggregated and aggregated as relevant and additional guidance on subtotals in these statements and clarification that an entity’s share of other comprehensive income of equity-accounted associates and joint ventures should be presented in aggregate as single line items based on whether or not it will subsequently be reclassified to profit or loss; and additional examples of possible ways of ordering the notes to clarify that understandability and comparability should be considered when determining the order of the notes and to demonstrate that the notes need not be presented in the order so far listed in IAS 1.
IAS 16 (Amendments) ‘Property, Plant and Equipment’ (effective for annual periods beginning on or after 01 January 2016). The amendments clarify that a depreciation method which is based on revenue, generated by an activity by using of an asset is not appropriate for property, plant and equipment; and add guidance that expected future reductions in the selling price of an item that was produced using an asset could indicate the expectation of technological or commercial obsolescence of the asset, which, in turn, might reflect a reduction of the future economic benefits embodied in the asset.
IAS 27 (Amendments) ‘Separate Financial Statements’ (effective for annual periods beginning on or after 01 January 2016). The amendments have been made to permit investments in subsidiaries, joint ventures and associates to be optionally accounted for using the equity method in separate financial statements. However, the Company has not availed this option.
4646
IAS 34 (Amendments) ‘Interim Financial Reporting’ (effective for annual periods beginning on or after 01 January 2016). This amendment clarifies what is meant by the reference in the standard to ‘information disclosed elsewhere in the interim financial report’. The amendment also amends IAS 34 to require a cross-reference from the interim financial statements to the location of that information.
The application of the above amendments does not result in any impact on profit or loss, other comprehensive income and total comprehensive income.
e) Amendments to published approved accounting standards that are effective in current year but not relevant to the Company
There are other amendments to published approved accounting standards that are mandatory for accounting periods beginning on or after 01 July 2016 but are considered not to be relevant or do not have any significant impact on the Company’s financial statements and are therefore not detailed in these financial statements.
f) Standards, interpretations and amendments to published approved accounting standards that are not yet effective but relevant to the Company
Following standards, interpretations and amendments to existing standards have been published and are mandatory for the Company’s accounting periods beginning on or after 01 July 2017 or later periods:
IFRS 9 ‘Financial Instruments’ (effective for annual periods beginning on or after 01 January 2018). A finalized version of IFRS 9 which contains accounting requirements for financial instruments, replacing IAS 39 ‘Financial Instruments: Recognition and Measurement’. Financial assets are classified by reference to the business model within which they are held and their contractual cash flow characteristics. The 2014 version of IFRS 9 introduces a ‘fair value through other comprehensive income’ category for certain debt instruments. Financial liabilities are classified in a similar manner to under IAS 39, however there are differences in the requirements applying to the measurement of an entity’s own credit risk. The 2014 version of IFRS 9 introduces an ‘expected credit loss’ model for the measurement of the impairment of financial assets, so it is no longer necessary for a credit event to have occurred before a credit loss is recognized. It introduces a new hedge accounting model that is designed to be more closely aligned with how entities undertake risk management activities when hedging financial and non-financial risk exposures. The requirements for the derecognition of financial assets and liabilities are carried forward from IAS 39. The management of the Company is in the process of evaluating the impacts of the aforesaid standard on the Company’s financial statements.
IFRS 15 ‘Revenue from Contracts with Customers’ (effective for annual periods beginning on or after 01 January 2018). IFRS 15 provides a single, principles based five-step model to be applied to all contracts with customers. The five steps in the model are: identify the contract with the customer; identify the performance obligations in the contract; determine the transaction price; allocate the transaction price to the performance obligations in the contracts; and recognize revenue when (or as) the entity satisfies a performance obligation. Guidance is provided on topics such as the point in which revenue is recognized, accounting for variable consideration, costs of fulfilling and obtaining a contract and various related matters. New disclosures about revenue are also introduced. IFRS 15 replaces IAS 11 ‘Construction Contracts’, IAS 18 ‘Revenue’, IFRIC 13 ‘Customer Loyalty Programmes’, IFRIC 15 ‘Agreements for Construction of Real Estate’, IFRIC 18 ‘Transfer of Assets from Customers’ and SIC 31’ Revenue-Barter Transactions Involving Advertising Services. The aforesaid standard is not expected to have a material impact on the Company’s financial statements.
Notes to the Financial Statements For the year ended June 30, 2017
47Nishat Mills Limited
IFRS 16 ‘Lease’ (effective for annual periods beginning on or after 01 January 2019). IFRS 16 specifies how an entity will recognize, measure, present and disclose leases. The standard provides a single lessee accounting model, requiring lessees to recognize assets and liabilities for all leases unless the lease term is 12 months or less or the underlying asset has a low value. Lessors continue to classify leases as operating or finance, with IFRS 16 approach to lessor accounting substantially unchanged from its predecessor, IAS 17 ‘Leases’. IFRS 16 replaces IAS 17 ‘Leases’, IFRIC 4 ‘Determining Whether an Arrangement Contains a Lease’, SIC-15 ‘Operating Leases–Incentives’ and SIC-27 ‘Evaluating the Substance of Transactions Involving the Legal Form of a Lease’. The management of the Company is in the process of evaluating the impacts of the aforesaid standard on the Company’s financial statements.
IFRIC 22 ‘Foreign Currency Transactions and Advance Consideration’ (effective for annual periods beginning on or after 01 January 2018). IFRIC 22 clarifies which date should be used for translation when a foreign currency transaction involves payment or receipt in advance of the item it relates to. The related item is translated using the exchange rate on the date the advance foreign currency is received or paid and the prepayment or deferred income is recognized. The date of the transaction for the purpose of determining the exchange rate to use on initial recognition of the related asset, expense or income (or part of it) would remain the date on which receipt of payment from advance consideration was recognized. If there are multiple payments or receipts in advance, the entity shall determine a date of the transaction for each payment or receipt of advance consideration. The interpretation is not expected to have a material impact on the Company’s financial statements.
IFRIC 23 ‘Uncertainty over Income Tax Treatments’ (effective for annual periods beginning on or after 01 January 2019). The interpretation addresses the determination of taxable profit (tax loss), tax bases, unused tax losses, unused tax credits and tax rates, when there is uncertainty over income tax treatments under IAS 12 ‘Income Taxes’. It specifically considers: whether tax treatments should be considered collectively; assumptions for taxation authorities’ examinations; the determination of taxable profit (tax loss), tax bases, unused tax losses, unused tax credits and tax rates; and the effect of changes in facts and circumstances. The interpretation is not expected to have a material impact on the Company’s financial statements.
IFRS 15 (Amendments), ‘Revenue from Contracts with Customers’ (effective for annual periods beginning on or after 01 January 2018). Amendments clarify three aspects of the standard (identifying performance obligations, principal versus agent considerations, and licensing) and to provide some transition relief for modified contracts and completed contracts. The aforesaid amendments are not expected to have a material impact on the Company’s financial statements.
IAS 7 (Amendments), ‘Statement of Cash Flows’ (effective for annual periods beginning on or after 01 January 2017). Amendments have been made to clarify that entities shall provide disclosures that enable users of financial statements to evaluate changes in liabilities arising from financing activities. The aforesaid amendments will result in certain additional disclosures in the Company’s financial statements.
IAS 12 (Amendments), ‘Income Taxes’ (effective for annual periods beginning on or after 01 January 2017). The amendments clarify that the existence of a deductible temporary difference depends solely on a comparison of the carrying amount of an asset and its tax base at the end of the reporting period, and is not affected by possible future changes in the carrying amount or expected manner of recovery of the asset. The amendments further clarify that when calculating deferred tax asset in respect of insufficient taxable temporary differences, the future taxable profit excludes tax deductions resulting from the reversal of those deductible temporary differences. The amendments are not likely to have significant impact on Company’s financial statements.
4848
IAS 40 (Amendments), ‘Investment Property’ (effective for annual periods beginning on or after 01 January 2018). Amendments have been made to state that an entity shall transfer a property to, or from, investment property when, and only when, there is evidence of a change in use. A change of use occurs if property meets, or ceases to meet, the definition of investment property. A change in management’s intentions for the use of a property by itself does not constitute evidence of a change in use. The list of examples of evidence in paragraph 57(a) – (d) is now presented as a non-exhaustive list of examples instead of the previous exhaustive list. The amendment is not likely to have a significant impact on the Company’s financial statements.
Amendments to IFRS 10 and IAS 28 (deferred indefinitely) to clarify the treatment of the sale or contribution of assets from an investor to its associates or joint venture, as follows: require full recognition in the investor’s financial statements of gains and losses arising on the sale or contribution of assets that constitute a business (as defined in IFRS 3 ‘Business Combinations’); require the partial recognition of gains and losses where the assets do not constitute a business, i.e. a gain or loss is recognized only to the extent of the unrelated investors’ interests in that associate or joint venture. These requirements apply regardless of the legal form of the transaction, e.g. whether the sale or contribution of assets occur by an investor transferring shares in a subsidiary that holds the assets (resulting in loss of control of the subsidiary), or by the direct sale of the assets themselves. The management of the Company is in the process of evaluating the impacts of the aforesaid amendments on the Company’s financial statements.
On 8 December 2016, IASB issued Annual Improvements to IFRSs: 2014 – 2016 Cycle, incorporating amendments to three IFRSs more specifically in IFRS 12 ‘Disclosure of Interests in Other Entities’ and IAS 28 ‘Investments in Associates and Joint Ventures’. These amendments are effective for annual periods beginning on or after 01 January 2017 and 01 January 2018 respectively. These amendments have no significant impact on the Company’s financial statements and have therefore not been analyzed in detail.
g) Standards and amendments to approved published standards that are not yet effective and not considered relevant to the Company
There are other standards and amendments to published standards that are mandatory for accounting periods beginning on or after 01 July 2017 but are considered not to be relevant or do not have any significant impact on the Company’s financial statements and are therefore not detailed in these financial statements.
2.2 Employee benefit
The Company operates an approved funded provident fund scheme covering all its permanent employees and permanent employees of a Group Company. Equal monthly contributions are made both by the Company, other Group Company and employees at the rate of 9.5 percent of the basic salary to the fund. The Company’s contributions to the fund are charged to profit and loss account.
2.3 Taxation
Current
Provision for current tax is based on the taxable income for the year determined in accordance with the prevailing law for taxation of income. The charge for current tax is calculated using prevailing tax rates or tax rates expected to apply to the profit for the year, if enacted. The charge for current tax also includes adjustments, where considered necessary, to provision for tax made in previous years arising from assessments framed during the year for such years.
Notes to the Financial Statements For the year ended June 30, 2017
49Nishat Mills Limited
Deferred
Deferred tax is accounted for using the balance sheet liability method in respect of all temporary differences arising from differences between the carrying amount of assets and liabilities in the financial statements and the corresponding tax bases used in the computation of the taxable profit. Deferred tax liabilities are generally recognized for all taxable temporary differences and deferred tax assets to the extent that it is probable that taxable profits will be available against which the deductible temporary differences, unused tax losses and tax credits can be utilized.
Deferred tax is calculated at the rates that are expected to apply to the period when the differences reverse based on tax rates that have been enacted or substantively enacted by the balance sheet date. Deferred tax is charged or credited in the profit and loss account, except to the extent that it relates to items recognized in other comprehensive income or directly in equity. In this case, the tax is also recognized in other comprehensive income or directly in equity, respectively.
2.4 Foreign currencies
These financial statements are presented in Pak Rupees, which is the Company’s functional currency. All monetary assets and liabilities denominated in foreign currencies are translated into Pak Rupees at the rates of exchange prevailing at the balance sheet date, while the transactions in foreign currencies during the year are initially recorded in functional currency at the rates of exchange prevailing at the transaction date. All non-monetary items are translated into Pak Rupees at exchange rates prevailing on the date of transaction or on the date when fair values are determined. Exchange gains and losses are recorded in the profit and loss account.
2.5 Property, plant, equipment and depreciation
Owned
Property, plant and equipment except freehold land and capital work-in-progress are stated at cost less accumulated depreciation and accumulated impairment losses (if any). Cost of property, plant and equipment consists of historical cost, borrowing cost pertaining to erection / construction period of qualifying assets and other directly attributable costs of bringing the asset to working condition. Freehold land and capital work-in- progress are stated at cost less any recognized impairment loss.
Subsequent costs are included in the asset’s carrying amount or recognized as a separate asset, as appropriate, only when it is probable that future economic benefits associated with the item will flow to the Company and the cost of the item can be measured reliably. All other repair and maintenance costs are charged to profit and loss account during the period in which they are incurred.
Leased
Leases where the Company has substantially all the risk and rewards of ownership are classified as finance lease. Assets subject to finance lease are capitalized at the commencement of the lease term at the lower of present value of minimum lease payments under the lease agreements and the fair value of the leased assets, each determined at the inception of the lease.
The related rental obligation net of finance cost is included in liabilities against assets subject to finance lease. The liabilities are classified as current and long term depending upon the timing of payments.
5050
Each lease payment is allocated between the liability and finance cost so as to achieve a constant rate on the balance outstanding. The finance cost is charged to profit and loss account over the lease term.
Depreciation of assets subject to finance lease is recognized in the same manner as for owned assets. Depreciation of the leased assets is charged to profit and loss account.
Depreciation
Depreciation on property, plant and equipment is charged to profit and loss account applying the reducing balance method so as to write off the cost / depreciable amount of the assets over their estimated useful lives at the rates given in Note 12.1. The Company charges the depreciation on additions from the date when the asset is available for use and on deletions upto the date when the asset is de-recognized. The residual values and useful lives are reviewed by the management, at each financial year-end and adjusted if impact on depreciation is significant.
De-recognition
An item of property, plant and equipment is de-recognized upon disposal or when no future economic benefits are expected from its use or disposal. Any gain or loss arising on de-recognition of the asset is included in the profit and loss account in the year the asset is de-recognized.
2.6 Investment properties
Land and buildings held for capital appreciation or to earn rental income are classified as investment properties. Investment properties except land, are stated at cost less accumulated depreciation and any recognized impairment loss. Land is stated at cost less any recognized impairment loss. Depreciation on buildings is charged to profit and loss account applying the reducing balance method so as to write off the cost of buildings over their estimated useful lives at a rate of 10% per annum.
2.7 Operating leases
Assets leased out under operating leases are included in investment properties. They are depreciated over their expected useful lives on a basis consistent with similar owned property, plant and equipment.
2.8 Investments
Classification of an investment is made on the basis of intended purpose for holding such investment. Management determines the appropriate classification of its investments at the time of purchase and re-evaluates such designation on regular basis.
Investments are initially measured at fair value plus transaction costs directly attributable to acquisition, except for “Investment at fair value through profit or loss” which is initially measured at fair value.
The Company assesses at the end of each reporting period whether there is any objective evidence that investments are impaired. If any such evidence exists, the Company applies the provisions of IAS 39 ‘Financial Instruments: Recognition and Measurement’ to all investments, except investments in subsidiaries and equity method accounted for associates, which are tested for impairment in accordance with the provisions of IAS 36 ‘Impairment of Assets’.
Notes to the Financial Statements For the year ended June 30, 2017
51Nishat Mills Limited
a) Investment at fair value through profit or loss
Investments classified as held-for-trading and those designated as such are included in this category. Investments are classified as held-for-trading if these are acquired for the purpose of selling in the short term. Gains or losses on investments held-for-trading are recognized in profit and loss account.
b) Held-to-maturity
Investments with fixed or determinable payments and fixed maturity are classified as held-to-maturity when the Company has the positive intention and ability to hold to maturity. Investments intended to be held for an undefined period are not included in this classification. Other long-term investments that are intended to be held to maturity are subsequently measured at amortized cost. This cost is computed as the amount initially recognized minus principal repayments, plus or minus the cumulative amortization, using the effective interest method, of any difference between the initially recognized amount and the maturity amount. For investments carried at amortized cost, gains and losses are recognized in profit and loss account when the investments are de-recognized or impaired, as well as through the amortization process.
c) Investment in subsidiaries
Investments in subsidiaries are stated at cost less impairment loss, if any, in accordance with the provisions of IAS 27 ‘Separate Financial Statements’.
d) Investment in associates - (with significant influence)
The Company is required to prepare separate financial statements, hence, in accordance with the requirements of IAS 27 ‘Separate Financial Statements’, the investments in associated undertakings are accounted for in accordance with IAS 39 ‘Financial Instruments: Recognition and Measurement’ and are classified as available for sale.
e) Available-for-sale
Investments intended to be held for an indefinite period of time, which may be sold in response to need for liquidity, or changes to interest rates or equity prices are classified as available-for-sale. After initial recognition, investments which are classified as available-for-sale are measured at fair value. Gains or losses on available-for-sale investments are recognized directly in statement of other comprehensive income until the investment is sold, de-recognized or is determined to be impaired, at which time the cumulative gain or loss previously reported in statement of other comprehensive income is included in profit and loss account. These are sub-categorized as under:
Quoted
For investments that are actively traded in organized capital markets, fair value is determined by reference to stock exchange quoted market bids at the close of business on the balance sheet date. Fair value of investments in open-end mutual funds is determined using redemption price.
Unquoted
Fair value of unquoted investments is determined on the basis of appropriate valuation techniques as allowed by IAS 39 ‘Financial Instruments: Recognition and Measurement’.
5252
2.9 Inventories
Inventories, except for stock in transit and waste stock / rags, are stated at lower of cost and net realizable value. Cost is determined as follows:
Stores, spare parts and loose tools
Useable stores, spare parts and loose tools are valued principally at moving average cost, while items considered obsolete are carried at nil value. Items in transit are valued at cost comprising invoice value plus other charges paid thereon.
Stock-in-trade
Cost of raw material, work-in-process and finished goods is determined as follows:
i) For raw materials: Annual average basis. ii) For work-in-process and finished goods: Average manufacturing cost including a portion of production overheads.
Materials in transit are valued at cost comprising invoice value plus other charges paid thereon. Waste stock / rags are valued at net realizable value.
Net realizable value signifies the estimated selling price in the ordinary course of business less the estimated costs of completion and the estimated costs necessary to make a sale.
2.10 Trade and other receivables
Trade debts and other receivables are carried at original invoice value less an estimate made for doubtful debts based on a review of all outstanding amounts at the year end. Bad debts are written off when identified.
2.11 Non–current assets (or disposal groups) held for sale
Non-current assets (or disposal groups) are classified as assets held for sale when their carrying amount is to be recovered principally through a sale transaction and a sale is considered highly probable. They are stated at the lower of carrying amount and fair value less costs to sell.
2.12 Borrowings
Borrowings are recognized initially at fair value and are subsequently stated at amortized cost. Any difference between the proceeds and the redemption value is recognized in the profit and loss account over the period of the borrowings using the effective interest method.
2.13 Borrowing cost
Interest, mark-up and other charges on long-term finances are capitalized up to the date of commissioning of respective qualifying assets acquired out of the proceeds of such long-term finances. All other interest, mark-up and other charges are recognized in profit and loss account.
2.14 Share capital
Ordinary shares are classified as share capital.
Notes to the Financial Statements For the year ended June 30, 2017
53Nishat Mills Limited
2.15 Trade and other payables
Liabilities for trade and other amounts payable are initially recognized at fair value, which is normally the transaction cost.
2.16 Revenue recognition
Revenue from different sources is recognized as under:
- Revenue from sale of goods is recognized on dispatch of goods to customers.
- Revenue from sale of electricity is recognized at the time of transmission.
- Dividend on equity investments is recognized when right to receive the dividend is established.
- Operating lease rentals are recorded in profit and loss account on a time proportion basis over the term of the lease arrangements.
- Profit on deposits with banks is recognized on time proportion basis taking into account the amounts outstanding and rates applicable thereon.
2.17 Financial instruments
Financial instruments carried on the balance sheet include investments, deposits, trade debts, loans and advances, other receivables, cash and bank balances, long-term financing, short-term borrowings, accrued mark-up and trade and other payables etc. Financial assets and liabilities are recognized when the Company becomes a party to the contractual provisions of instrument. Initial recognition is made at fair value plus transaction costs directly attributable to acquisition, except for “financial instruments at fair value through profit or loss” which are initially measured at fair value.
Financial assets are de-recognized when the Company loses control of the contractual rights that comprise the financial asset. The Company loses such control if it realizes the rights to benefits specified in contract, the rights expire or the Company surrenders those rights. Financial liabilities are de-recognized when the obligation specified in the contract is discharged, cancelled or expired. Any gain or loss on subsequent measurement (except available for sale investments) and de-recognition is charged to the profit or loss currently. The particular measurement methods adopted are disclosed in the individual policy statements associated with each item.
2.18 Provisions
Provisions are recognized when the Company has a legal or constructive obligation as a result of past events and it is probable that an outflow of resources embodying economic benefits will be required to settle the obligations and a reliable estimate of the amount can be made.
2.19 Impairment
a) Financial assets
A financial asset is considered to be impaired if objective evidence indicate that one or more events had a negative effect on the estimated future cash flows of that asset.
5454
An impairment loss in respect of a financial asset measured at amortized cost is calculated as a difference between its carrying amount and the present value of estimated future cash flows discounted at the original effective interest rate. An impairment loss in respect of available for sale financial asset is calculated with reference to its current fair value.
Individually significant financial assets are tested for impairment on an individual basis. The remaining financial assets are assessed collectively in groups that share similar credit risk characteristics.
b) Non-financial assets
The carrying amounts of the Company’s non-financial assets are reviewed at each balance sheet date to determine whether there is any indication of impairment. If such indication exists, the recoverable amount of such asset is estimated. An impairment loss is recognized wherever the carrying amount of the asset exceeds its recoverable amount. Impairment losses are recognized in profit and loss account. A previously recognized impairment loss is reversed only if there has been a change in the estimates used to determine the asset’s recoverable amount since the last impairment loss was recognized. If that is the case, the carrying amount of the asset is increased to its recoverable amount. That increased amount cannot exceed the carrying amount that would have been determined, net of depreciation, had no impairment loss been recognized for the asset in prior years. Such reversal is recognized in profit and loss account.
2.20 Derivative financial instruments
Derivative that do not qualify for hedge accounting are recognized in the balance sheet at estimated fair value with corresponding effect to profit and loss account. Derivative financial instruments are carried as assets when fair value is positive and liabilities when fair value is negative.
2.21 Off setting
Financial assets and financial liabilities are set off and the net amount is reported in the financial statements when there is a legal enforceable right to set off and the Company intends either to settle on a net basis or to realize the assets and to settle the liabilities simultaneously.
2.22 Cash and cash equivalents
Cash and cash equivalents comprise cash in hand, cash at banks on current, saving and deposit accounts and other short term highly liquid instruments that are readily convertible into known amounts of cash and which are subject to insignificant risk of changes in values.
2.23 Segment reporting
Segment reporting is based on the operating (business) segments of the Company. An operating segment is a component of the Company that engages in business activities from which it may earn revenues and incur expenses, including revenues and expenses that relate to the transactions with any of the Company’s other components. An operating segment’s operating results are reviewed regularly by the chief executive officer to make decisions about resources to be allocated to the segment and assess its performance, and for which discrete financial information is available.
Notes to the Financial Statements For the year ended June 30, 2017
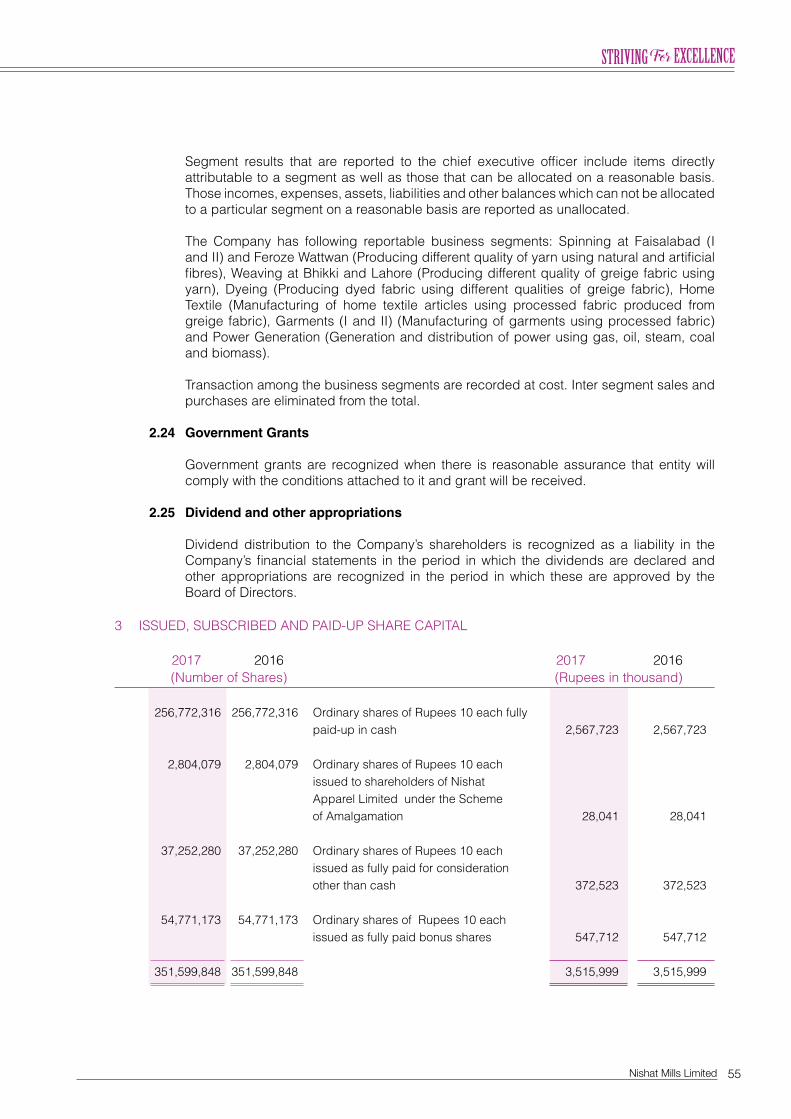
55Nishat Mills Limited
Segment results that are reported to the chief executive officer include items directly attributable to a segment as well as those that can be allocated on a reasonable basis. Those incomes, expenses, assets, liabilities and other balances which can not be allocated to a particular segment on a reasonable basis are reported as unallocated.
The Company has following reportable business segments: Spinning at Faisalabad (I and II) and Feroze Wattwan (Producing different quality of yarn using natural and artificial fibres), Weaving at Bhikki and Lahore (Producing different quality of greige fabric using yarn), Dyeing (Producing dyed fabric using different qualities of greige fabric), Home Textile (Manufacturing of home textile articles using processed fabric produced from greige fabric), Garments (I and II) (Manufacturing of garments using processed fabric) and Power Generation (Generation and distribution of power using gas, oil, steam, coal and biomass).
Transaction among the business segments are recorded at cost. Inter segment sales and purchases are eliminated from the total.
2.24 Government Grants
Government grants are recognized when there is reasonable assurance that entity will comply with the conditions attached to it and grant will be received.
2.25 Dividend and other appropriations
Dividend distribution to the Company’s shareholders is recognized as a liability in the Company’s financial statements in the period in which the dividends are declared and other appropriations are recognized in the period in which these are approved by the Board of Directors.
3 ISSUED, SUBSCRIBED AND PAID-UP SHARE CAPITAL 2017 2016 2017 2016 (Number of Shares) (Rupees in thousand)
256,772,316 256,772,316 Ordinary shares of Rupees 10 each fully paid-up in cash 2,567,723 2,567,723 2,804,079 2,804,079 Ordinary shares of Rupees 10 each issued to shareholders of Nishat Apparel Limited under the Scheme of Amalgamation 28,041 28,041 37,252,280 37,252,280 Ordinary shares of Rupees 10 each issued as fully paid for consideration other than cash 372,523 372,523 54,771,173 54,771,173 Ordinary shares of Rupees 10 each issued as fully paid bonus shares 547,712 547,712 351,599,848 351,599,848 3,515,999 3,515,999
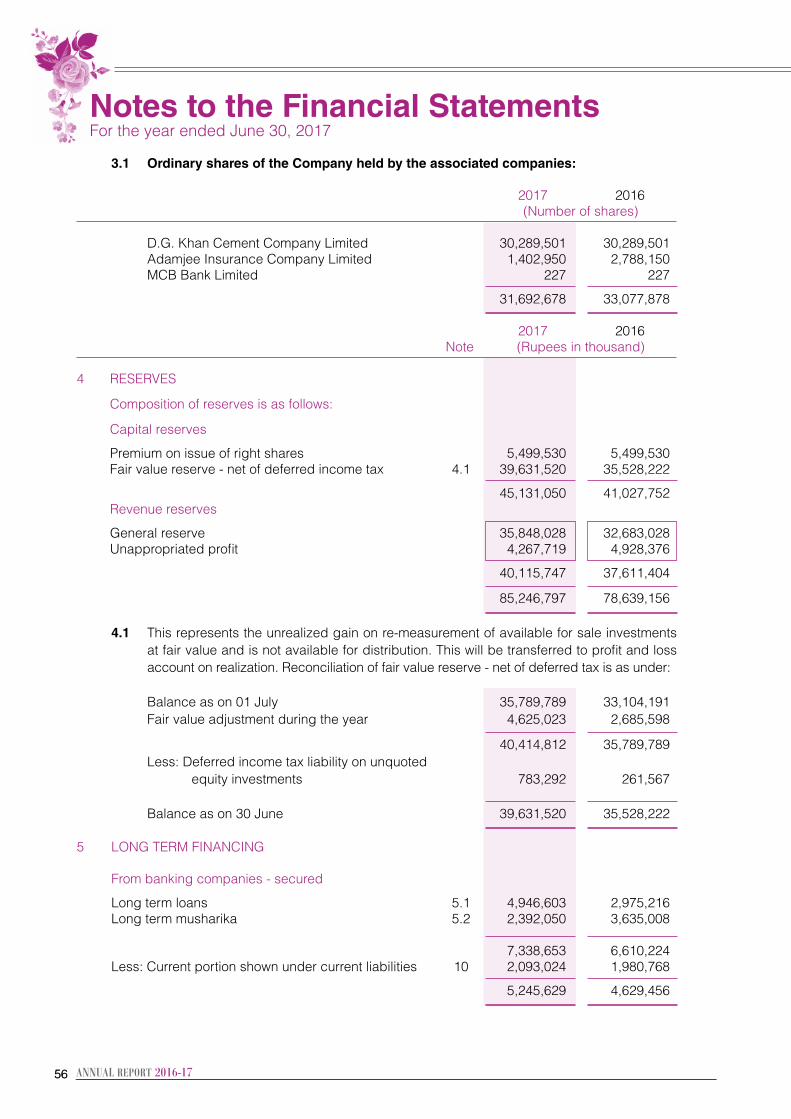
5656
3.1 Ordinary shares of the Company held by the associated companies:
2017 2016 (Number of shares) D.G. Khan Cement Company Limited 30,289,501 30,289,501 Adamjee Insurance Company Limited 1,402,950 2,788,150 MCB Bank Limited 227 227 31,692,678 33,077,878
2017 2016 Note (Rupees in thousand)
4 RESERVES Composition of reserves is as follows: Capital reserves Premium on issue of right shares 5,499,530 5,499,530 Fair value reserve - net of deferred income tax 4.1 39,631,520 35,528,222 45,131,050 41,027,752 Revenue reserves General reserve 35,848,028 32,683,028 Unappropriated profit 4,267,719 4,928,376 40,115,747 37,611,404 85,246,797 78,639,156 4.1 This represents the unrealized gain on re-measurement of available for sale investments
at fair value and is not available for distribution. This will be transferred to profit and loss account on realization. Reconciliation of fair value reserve - net of deferred tax is as under:
Balance as on 01 July 35,789,789 33,104,191 Fair value adjustment during the year 4,625,023 2,685,598 40,414,812 35,789,789 Less: Deferred income tax liability on unquoted equity investments 783,292 261,567 Balance as on 30 June 39,631,520 35,528,222 5 LONG TERM FINANCING From banking companies - secured Long term loans 5.1 4,946,603 2,975,216 Long term musharika 5.2 2,392,050 3,635,008
7,338,653 6,610,224 Less: Current portion shown under current liabilities 10 2,093,024 1,980,768
5,245,629 4,629,456
Notes to the Financial Statements For the year ended June 30, 2017
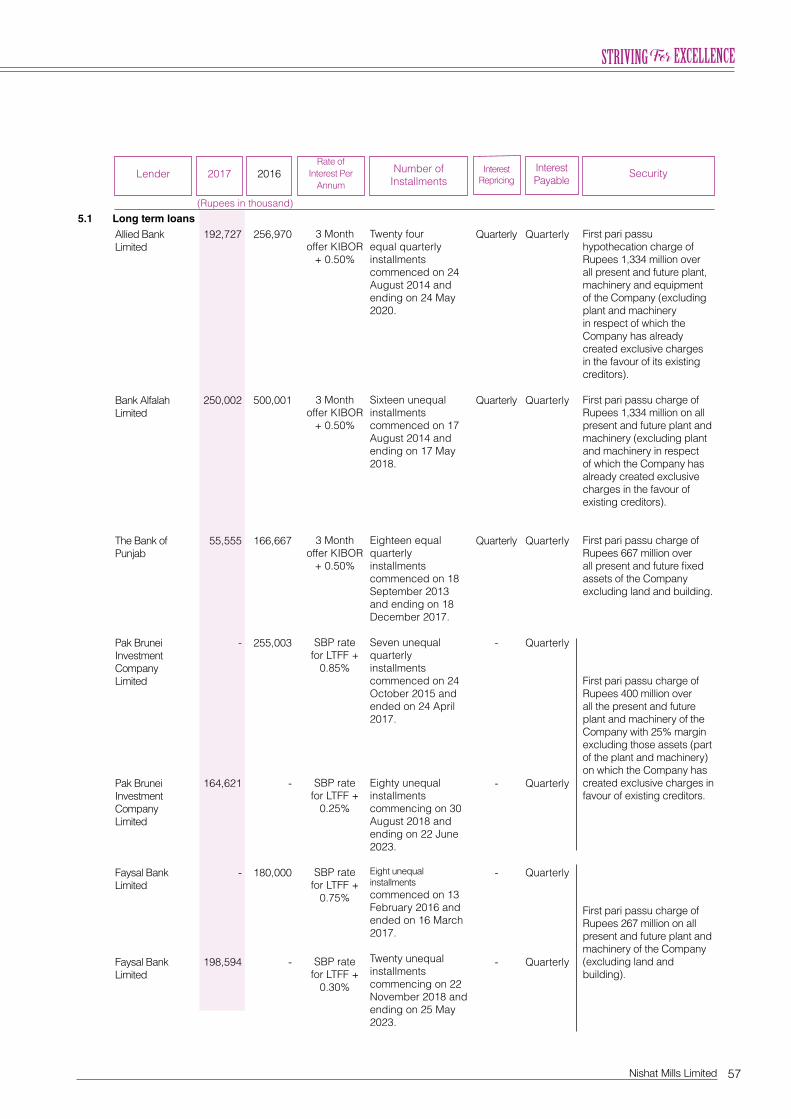
57Nishat Mills Limited
Allied Bank Limited
Bank Alfalah Limited
The Bank of Punjab
Pak Brunei InvestmentCompany Limited
Pak Brunei InvestmentCompany Limited
Faysal Bank Limited
Faysal Bank Limited
192,727
250,002
55,555
-
164,621
-
198,594
256,970
500,001
166,667
255,003
-
180,000
-
Quarterly
Quarterly
Quarterly
-
-
-
-
Quarterly
Quarterly
Quarterly
Quarterly
Quarterly
Quarterly
Quarterly
3 Month offer KIBOR
+ 0.50%
3 Month offer KIBOR
+ 0.50%
3 Month offer KIBOR
+ 0.50%
SBP rate for LTFF +
0.85%
SBP rate for LTFF +
0.25%
SBP rate for LTFF +
0.75%
SBP rate for LTFF +
0.30%
Twenty four equal quarterly installments commenced on 24 August 2014 and ending on 24 May 2020.
Sixteen unequal installments commenced on 17 August 2014 and ending on 17 May 2018.
Eighteen equal quarterly installments commenced on 18 September 2013 and ending on 18 December 2017. Seven unequal quarterly installments commenced on 24 October 2015 and ended on 24 April 2017.
Eighty unequal installments commencing on 30 August 2018 and ending on 22 June 2023. Eight unequal installments commenced on 13 February 2016 and ended on 16 March 2017. Twenty unequal installments commencing on 22 November 2018 and ending on 25 May 2023.
First pari passu hypothecation charge of Rupees 1,334 million over all present and future plant, machinery and equipment of the Company (excluding plant and machinery in respect of which the Company has already created exclusive charges in the favour of its existing creditors). First pari passu charge of Rupees 1,334 million on all present and future plant and machinery (excluding plant and machinery in respect of which the Company has already created exclusive charges in the favour of existing creditors).
First pari passu charge of Rupees 667 million over all present and future fixed assets of the Company excluding land and building.
First pari passu charge of Rupees 400 million over all the present and future plant and machinery of the Company with 25% margin excluding those assets (part of the plant and machinery) on which the Company has created exclusive charges in favour of existing creditors.
First pari passu charge of Rupees 267 million on all present and future plant and machinery of the Company (excluding land and building).
Lender 2017 2016 InterestRepricing
InterestPayable
Rate ofInterest Per
Annum
Number ofInstallments
Security
(Rupees in thousand)
5.1 Long term loans
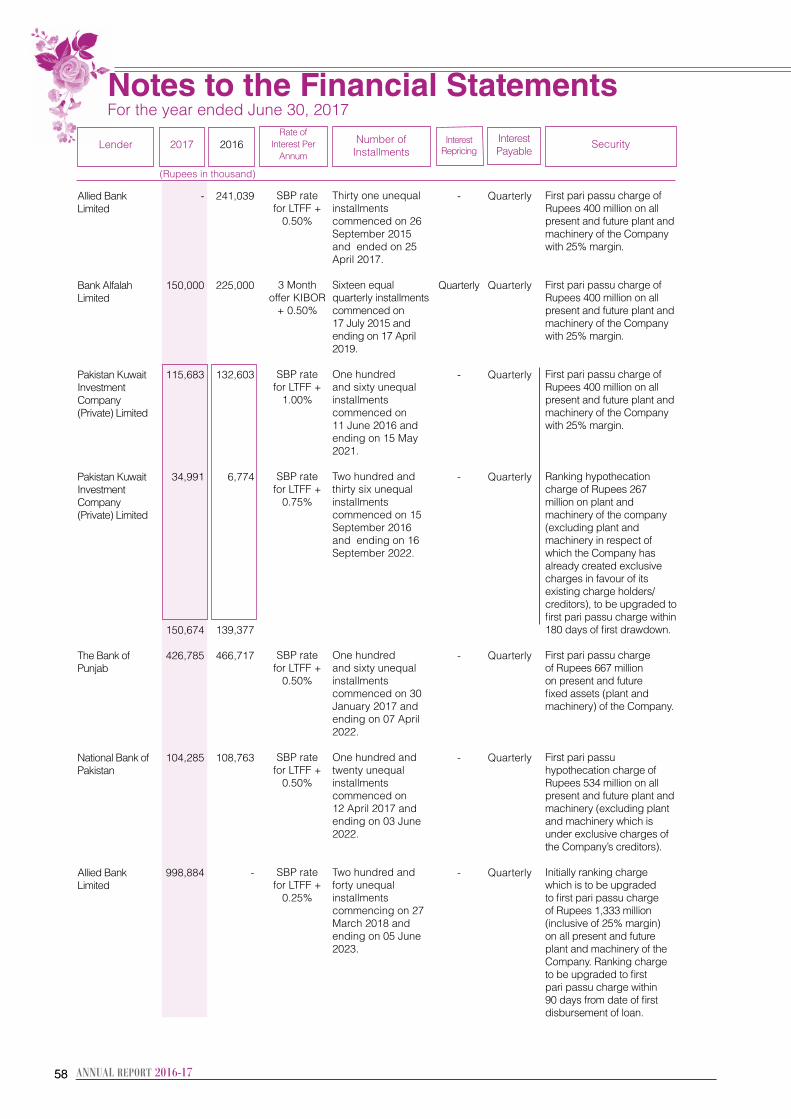
5858
Allied Bank Limited
Bank Alfalah Limited
Pakistan Kuwait InvestmentCompany (Private) Limited
Pakistan Kuwait InvestmentCompany (Private) Limited
The Bank of Punjab
National Bank of Pakistan
Allied Bank Limited
-
150,000
115,683
34,991
150,674
426,785
104,285
998,884
241,039
225,000
132,603
6,774
139,377
466,717
108,763
-
-
Quarterly
-
-
-
-
-
Quarterly
Quarterly
Quarterly
Quarterly
Quarterly
Quarterly
Quarterly
SBP rate for LTFF +
0.50%
3 Month offer KIBOR
+ 0.50%
SBP rate for LTFF +
1.00%
SBP rate for LTFF +
0.75%
SBP rate for LTFF +
0.50%
SBP rate for LTFF +
0.50%
SBP rate for LTFF +
0.25%
Thirty one unequal installments commenced on 26 September 2015 and ended on 25 April 2017. Sixteen equal quarterly installments commenced on 17 July 2015 and ending on 17 April 2019. One hundred and sixty unequal installments commenced on 11 June 2016 and ending on 15 May 2021. Two hundred and thirty six unequal installments commenced on 15 September 2016 and ending on 16 September 2022.
One hundred and sixty unequal installments commenced on 30 January 2017 and ending on 07 April 2022. One hundred and twenty unequal installments commenced on 12 April 2017 and ending on 03 June 2022. Two hundred and forty unequal installments commencing on 27 March 2018 and ending on 05 June 2023.
First pari passu charge of Rupees 400 million on all present and future plant and machinery of the Company with 25% margin.
First pari passu charge of Rupees 400 million on all present and future plant and machinery of the Company with 25% margin.
First pari passu charge of Rupees 400 million on all present and future plant and machinery of the Company with 25% margin.
Ranking hypothecation charge of Rupees 267 million on plant and machinery of the company (excluding plant and machinery in respect of which the Company has already created exclusive charges in favour of its existing charge holders/creditors), to be upgraded to first pari passu charge within 180 days of first drawdown. First pari passu charge of Rupees 667 million on present and future fixed assets (plant and machinery) of the Company.
First pari passu hypothecation charge of Rupees 534 million on all present and future plant and machinery (excluding plant and machinery which is under exclusive charges of the Company’s creditors). Initially ranking charge which is to be upgraded to first pari passu charge of Rupees 1,333 million (inclusive of 25% margin) on all present and future plant and machinery of the Company. Ranking charge to be upgraded to first pari passu charge within 90 days from date of first disbursement of loan.
Lender 2017 2016 InterestRepricing
InterestPayable
Rate ofInterest Per
Annum
Number ofInstallments
Security
(Rupees in thousand)
Notes to the Financial Statements For the year ended June 30, 2017
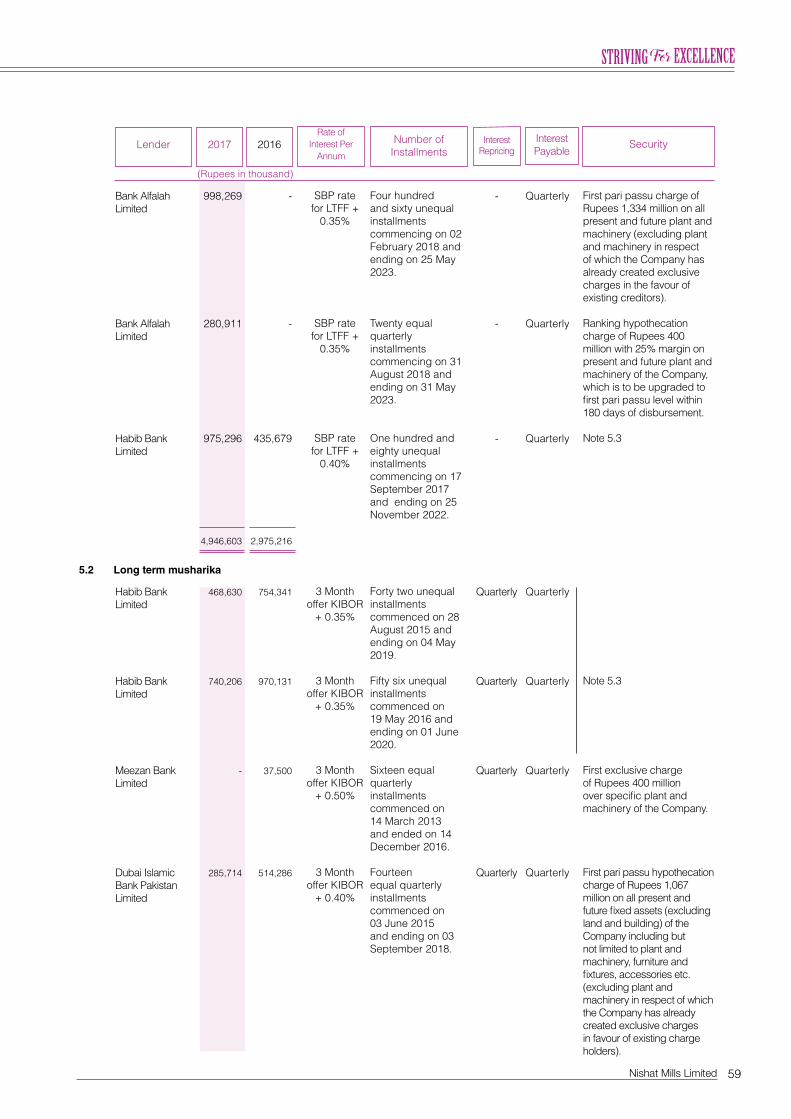
59Nishat Mills Limited
Bank Alfalah Limited
Bank Alfalah Limited
Habib Bank Limited
Habib Bank Limited
Habib Bank Limited
Meezan Bank Limited
Dubai Islamic Bank Pakistan Limited
998,269
280,911
975,296
4,946,603
468,630
740,206
-
285,714
-
-
435,679
2,975,216
754,341
970,131
37,500
514,286
-
-
-
Quarterly
Quarterly
Quarterly
Quarterly
Quarterly
Quarterly
Quarterly
Quarterly
Quarterly
Quarterly
Quarterly
SBP rate for LTFF +
0.35%
SBP rate for LTFF +
0.35%
SBP rate for LTFF +
0.40%
3 Month offer KIBOR
+ 0.35%
3 Month offer KIBOR
+ 0.35%
3 Month offer KIBOR
+ 0.50%
3 Month offer KIBOR
+ 0.40%
Four hundred and sixty unequal installments commencing on 02 February 2018 and ending on 25 May 2023.
Twenty equal quarterly installments commencing on 31 August 2018 and ending on 31 May 2023. One hundred and eighty unequal installments commencing on 17 September 2017 and ending on 25 November 2022. Forty two unequal installments commenced on 28 August 2015 and ending on 04 May 2019. Fifty six unequal installments commenced on 19 May 2016 and ending on 01 June 2020. Sixteen equal quarterly installments commenced on 14 March 2013 and ended on 14 December 2016. Fourteen equal quarterly installments commenced on 03 June 2015 and ending on 03 September 2018.
First pari passu charge of Rupees 1,334 million on all present and future plant and machinery (excluding plant and machinery in respect of which the Company has already created exclusive charges in the favour of existing creditors).
Ranking hypothecation charge of Rupees 400 million with 25% margin on present and future plant and machinery of the Company, which is to be upgraded to first pari passu level within 180 days of disbursement. Note 5.3
Note 5.3
First exclusive charge of Rupees 400 million over specific plant and machinery of the Company.
First pari passu hypothecation charge of Rupees 1,067 million on all present and future fixed assets (excluding land and building) of the Company including but not limited to plant and machinery, furniture and fixtures, accessories etc. (excluding plant and machinery in respect of which the Company has already created exclusive charges in favour of existing charge holders).
5.2 Long term musharika
Lender 2017 2016 InterestRepricing
InterestPayable
Rate ofInterest Per
Annum
Number ofInstallments
Security
(Rupees in thousand)
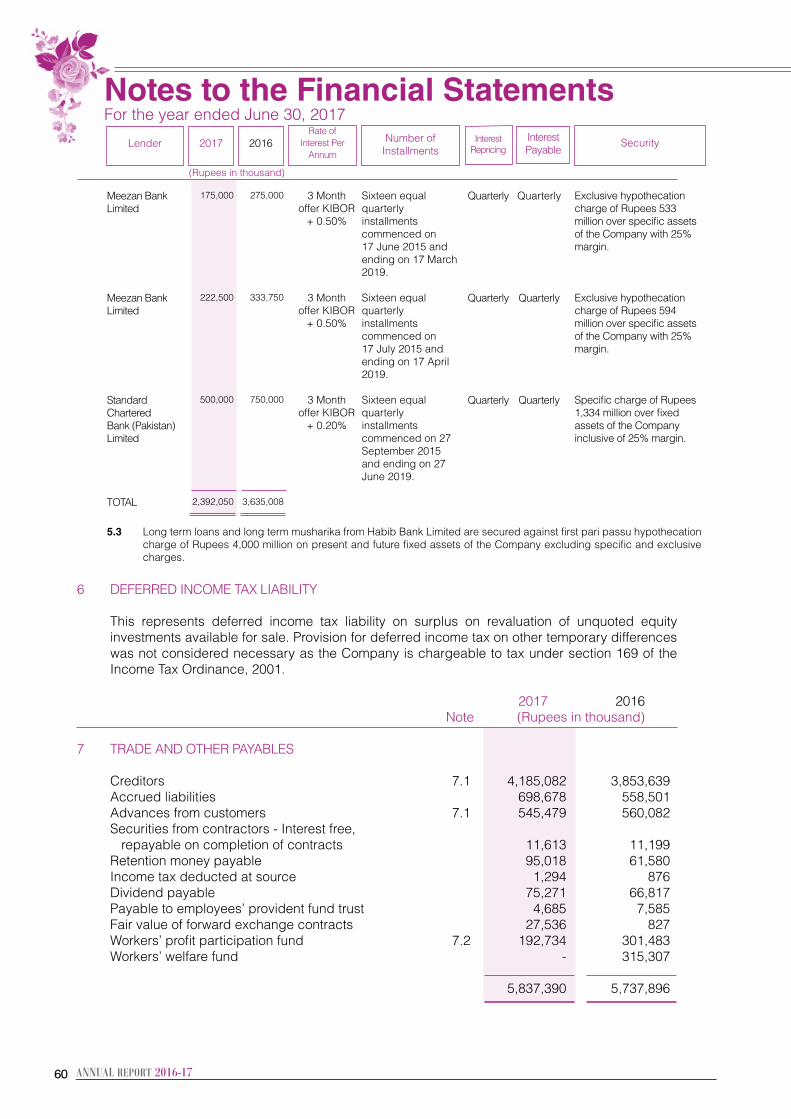
6060
Meezan Bank Limited
Meezan Bank Limited
Standard Chartered Bank (Pakistan) Limited
TOTAL
175,000
222,500
500,000
2,392,050
275,000
333,750
750,000
3,635,008
Quarterly
Quarterly
Quarterly
Quarterly
Quarterly
Quarterly
3 Month offer KIBOR
+ 0.50%
3 Month offer KIBOR
+ 0.50%
3 Month offer KIBOR
+ 0.20%
Sixteen equal quarterly installments commenced on 17 June 2015 and ending on 17 March 2019. Sixteen equal quarterly installments commenced on 17 July 2015 and ending on 17 April 2019. Sixteen equal quarterly installments commenced on 27 September 2015 and ending on 27 June 2019.
Exclusive hypothecation charge of Rupees 533 million over specific assets of the Company with 25% margin.
Exclusive hypothecation charge of Rupees 594 million over specific assets of the Company with 25% margin.
Specific charge of Rupees 1,334 million over fixed assets of the Company inclusive of 25% margin.
6 DEFERRED INCOME TAX LIABILITY This represents deferred income tax liability on surplus on revaluation of unquoted equity
investments available for sale. Provision for deferred income tax on other temporary differences was not considered necessary as the Company is chargeable to tax under section 169 of the Income Tax Ordinance, 2001.
2017 2016 Note (Rupees in thousand) 7 TRADE AND OTHER PAYABLES Creditors 7.1 4,185,082 3,853,639 Accrued liabilities 698,678 558,501 Advances from customers 7.1 545,479 560,082 Securities from contractors - Interest free, repayable on completion of contracts 11,613 11,199 Retention money payable 95,018 61,580 Income tax deducted at source 1,294 876 Dividend payable 75,271 66,817 Payable to employees’ provident fund trust 4,685 7,585 Fair value of forward exchange contracts 27,536 827 Workers’ profit participation fund 7.2 192,734 301,483 Workers’ welfare fund - 315,307 5,837,390 5,737,896
5.3 Long term loans and long term musharika from Habib Bank Limited are secured against first pari passu hypothecation charge of Rupees 4,000 million on present and future fixed assets of the Company excluding specific and exclusive charges.
Lender 2017 2016 InterestRepricing
InterestPayable
Rate ofInterest Per
Annum
Number ofInstallments
Security
(Rupees in thousand)
Notes to the Financial Statements For the year ended June 30, 2017
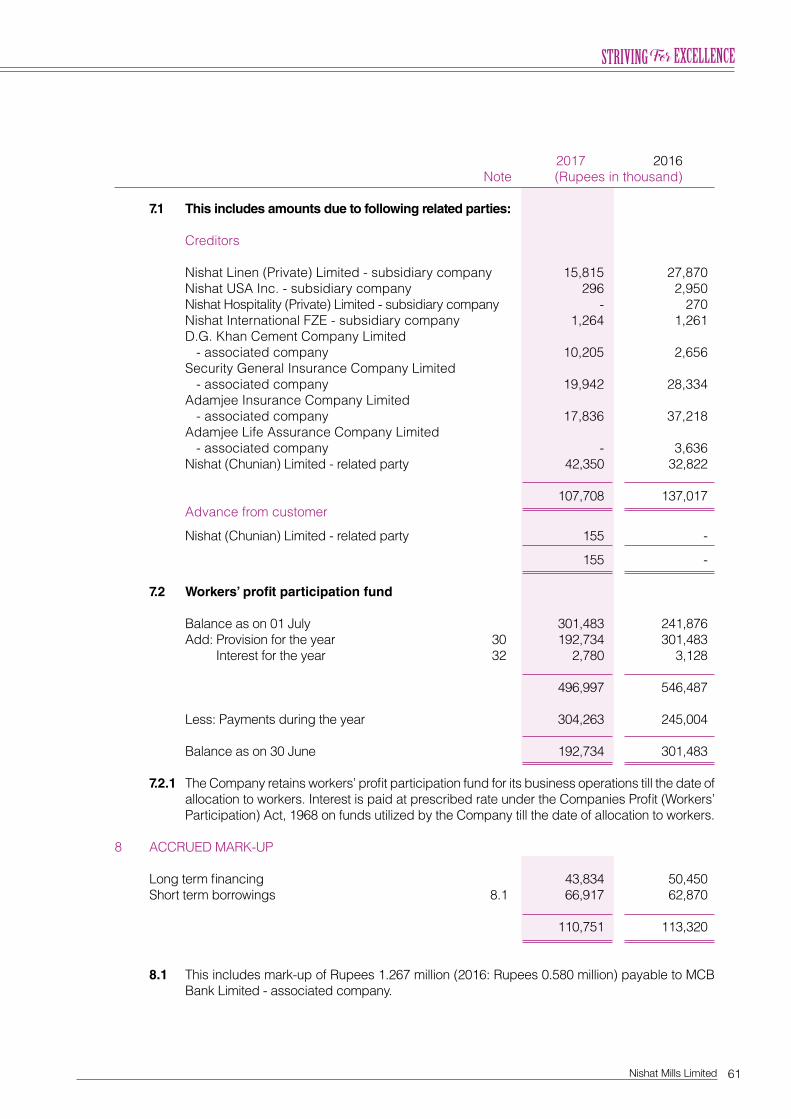
61Nishat Mills Limited
2017 2016 Note (Rupees in thousand)
7.1 This includes amounts due to following related parties:
Creditors Nishat Linen (Private) Limited - subsidiary company 15,815 27,870 Nishat USA Inc. - subsidiary company 296 2,950 Nishat Hospitality (Private) Limited - subsidiary company - 270 Nishat International FZE - subsidiary company 1,264 1,261 D.G. Khan Cement Company Limited - associated company 10,205 2,656 Security General Insurance Company Limited - associated company 19,942 28,334 Adamjee Insurance Company Limited - associated company 17,836 37,218 Adamjee Life Assurance Company Limited - associated company - 3,636 Nishat (Chunian) Limited - related party 42,350 32,822 107,708 137,017 Advance from customer
Nishat (Chunian) Limited - related party 155 -
155 - 7.2 Workers’ profit participation fund Balance as on 01 July 301,483 241,876 Add: Provision for the year 30 192,734 301,483 Interest for the year 32 2,780 3,128 496,997 546,487 Less: Payments during the year 304,263 245,004 Balance as on 30 June 192,734 301,483 7.2.1 The Company retains workers’ profit participation fund for its business operations till the date of
allocation to workers. Interest is paid at prescribed rate under the Companies Profit (Workers’ Participation) Act, 1968 on funds utilized by the Company till the date of allocation to workers.
8 ACCRUED MARK-UP Long term financing 43,834 50,450 Short term borrowings 8.1 66,917 62,870 110,751 113,320 8.1 This includes mark-up of Rupees 1.267 million (2016: Rupees 0.580 million) payable to MCB
Bank Limited - associated company.
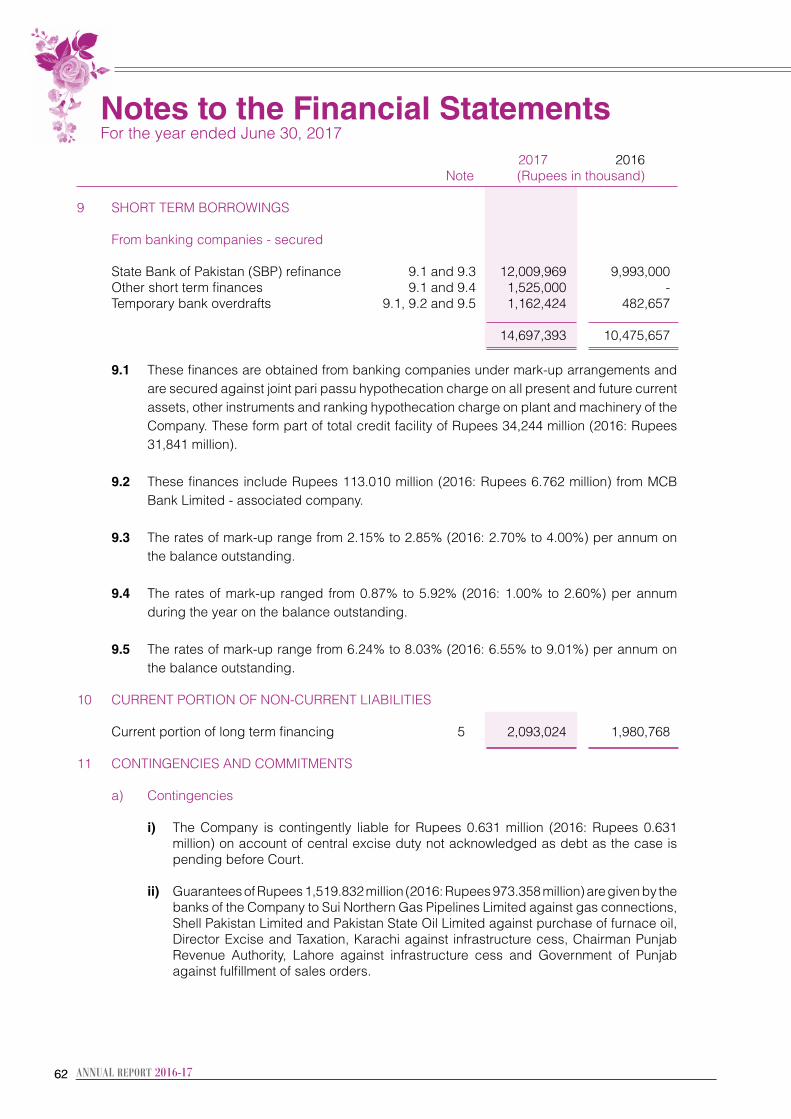
6262
2017 2016 Note (Rupees in thousand) 9 SHORT TERM BORROWINGS From banking companies - secured State Bank of Pakistan (SBP) refinance 9.1 and 9.3 12,009,969 9,993,000 Other short term finances 9.1 and 9.4 1,525,000 - Temporary bank overdrafts 9.1, 9.2 and 9.5 1,162,424 482,657
14,697,393 10,475,657 9.1 These finances are obtained from banking companies under mark-up arrangements and
are secured against joint pari passu hypothecation charge on all present and future current assets, other instruments and ranking hypothecation charge on plant and machinery of the Company. These form part of total credit facility of Rupees 34,244 million (2016: Rupees 31,841 million).
9.2 These finances include Rupees 113.010 million (2016: Rupees 6.762 million) from MCB
Bank Limited - associated company. 9.3 The rates of mark-up range from 2.15% to 2.85% (2016: 2.70% to 4.00%) per annum on
the balance outstanding. 9.4 The rates of mark-up ranged from 0.87% to 5.92% (2016: 1.00% to 2.60%) per annum
during the year on the balance outstanding. 9.5 The rates of mark-up range from 6.24% to 8.03% (2016: 6.55% to 9.01%) per annum on
the balance outstanding.
10 CURRENT PORTION OF NON-CURRENT LIABILITIES Current portion of long term financing 5 2,093,024 1,980,768 11 CONTINGENCIES AND COMMITMENTS a) Contingencies i) The Company is contingently liable for Rupees 0.631 million (2016: Rupees 0.631
million) on account of central excise duty not acknowledged as debt as the case is pending before Court.
ii) Guarantees of Rupees 1,519.832 million (2016: Rupees 973.358 million) are given by the banks of the Company to Sui Northern Gas Pipelines Limited against gas connections, Shell Pakistan Limited and Pakistan State Oil Limited against purchase of furnace oil, Director Excise and Taxation, Karachi against infrastructure cess, Chairman Punjab Revenue Authority, Lahore against infrastructure cess and Government of Punjab against fulfillment of sales orders.
Notes to the Financial Statements For the year ended June 30, 2017
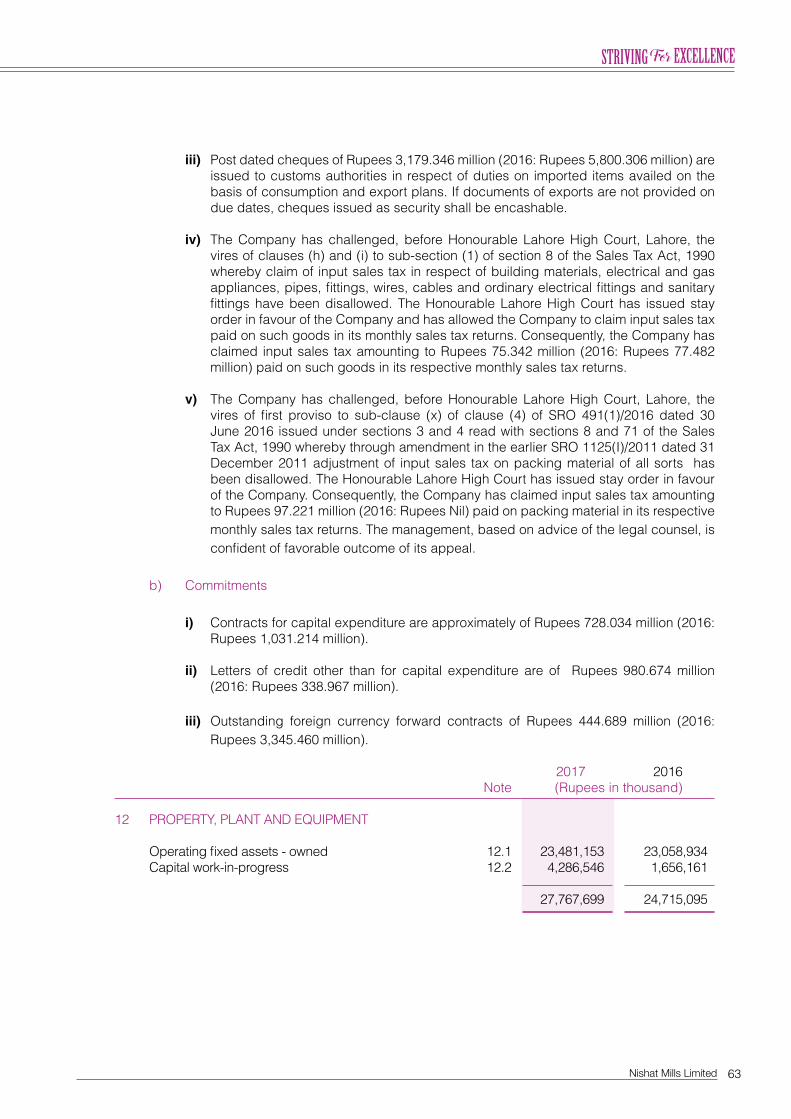
63Nishat Mills Limited
iii) Post dated cheques of Rupees 3,179.346 million (2016: Rupees 5,800.306 million) are issued to customs authorities in respect of duties on imported items availed on the basis of consumption and export plans. If documents of exports are not provided on due dates, cheques issued as security shall be encashable.
iv) The Company has challenged, before Honourable Lahore High Court, Lahore, the vires of clauses (h) and (i) to sub-section (1) of section 8 of the Sales Tax Act, 1990 whereby claim of input sales tax in respect of building materials, electrical and gas appliances, pipes, fittings, wires, cables and ordinary electrical fittings and sanitary fittings have been disallowed. The Honourable Lahore High Court has issued stay order in favour of the Company and has allowed the Company to claim input sales tax paid on such goods in its monthly sales tax returns. Consequently, the Company has claimed input sales tax amounting to Rupees 75.342 million (2016: Rupees 77.482 million) paid on such goods in its respective monthly sales tax returns.
v) The Company has challenged, before Honourable Lahore High Court, Lahore, the
vires of first proviso to sub-clause (x) of clause (4) of SRO 491(1)/2016 dated 30 June 2016 issued under sections 3 and 4 read with sections 8 and 71 of the Sales Tax Act, 1990 whereby through amendment in the earlier SRO 1125(I)/2011 dated 31 December 2011 adjustment of input sales tax on packing material of all sorts has been disallowed. The Honourable Lahore High Court has issued stay order in favour of the Company. Consequently, the Company has claimed input sales tax amounting to Rupees 97.221 million (2016: Rupees Nil) paid on packing material in its respective monthly sales tax returns. The management, based on advice of the legal counsel, is confident of favorable outcome of its appeal.
b) Commitments i) Contracts for capital expenditure are approximately of Rupees 728.034 million (2016:
Rupees 1,031.214 million). ii) Letters of credit other than for capital expenditure are of Rupees 980.674 million
(2016: Rupees 338.967 million). iii) Outstanding foreign currency forward contracts of Rupees 444.689 million (2016:
Rupees 3,345.460 million). 2017 2016 Note (Rupees in thousand) 12 PROPERTY, PLANT AND EQUIPMENT Operating fixed assets - owned 12.1 23,481,153 23,058,934 Capital work-in-progress 12.2 4,286,546 1,656,161
27,767,699 24,715,095
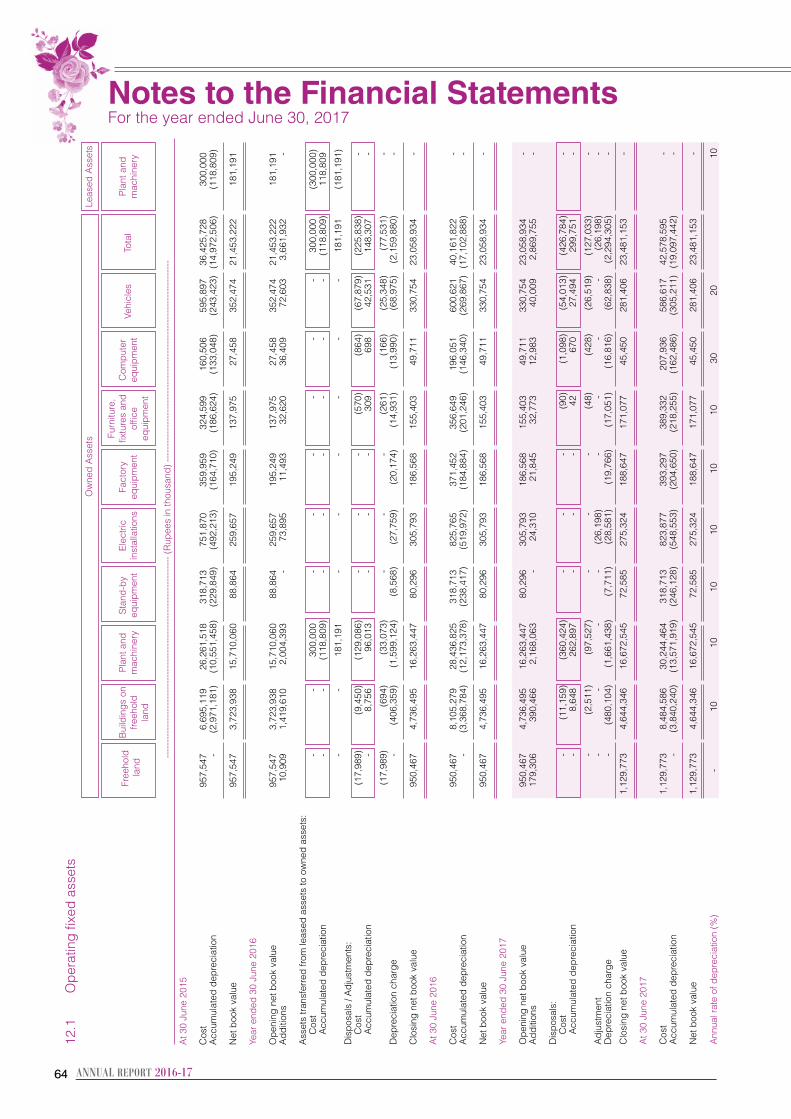
6464
Ow
ned
Ass
ets
Leas
ed A
sset
s
Furn
iture
,
Fre
ehol
d B
uild
ings
on
Plan
t and
St
and-
by
Elec
tric
Fact
ory
fixtu
res
and
Com
pute
r Ve
hicl
es
Tota
l Pl
ant a
nd
l
and
freeh
old
mac
hine
ry
equi
pmen
t in
stal
latio
ns
equi
pmen
t of
fice
equi
pmen
t
m
achi
nery
land
eq
uipm
ent
--
----
----
----
----
----
----
----
----
----
----
----
----
----
----
----
--- (
Rup
ees
in th
ousa
nd) -
----
----
----
----
----
----
----
----
----
----
----
----
----
----
----
----
At 3
0 Ju
ne 2
015
C
ost
957
,547
6
,695
,119
2
6,26
1,51
8
318
,713
7
51,8
70
359
,959
3
24,5
99
160
,506
5
95,8
97
36,
425,
728
3
00,0
00
Acc
umul
ated
dep
reci
atio
n -
(2
,971
,181
) (1
0,55
1,45
8)
(229
,849
) (4
92,2
13)
(164
,710
) (1
86,6
24)
(133
,048
) (2
43,4
23)
(14,
972,
506)
(1
18,8
09)
Net
boo
k va
lue
957
,547
3
,723
,938
1
5,71
0,06
0
88,
864
2
59,6
57
195
,249
1
37,9
75
27,
458
3
52,4
74
21,
453,
222
1
81,1
91
Ye
ar e
nded
30
June
201
6
Ope
ning
net
boo
k va
lue
9
57,5
47
3,7
23,9
38
15,
710,
060
8
8,86
4
259
,657
1
95,2
49
137
,975
2
7,45
8
352
,474
2
1,45
3,22
2
181
,191
A
dditi
ons
10,
909
1
,419
,610
2
,004
,393
-
7
3,89
5
11,
493
3
2,62
0
36,
409
7
2,60
3
3,6
61,9
32
-
Ass
ets
trans
ferr
ed fr
om le
ased
ass
ets
to o
wne
d as
sets
:
Cos
t -
-
3
00,0
00
-
-
-
-
-
-
300
,000
(3
00,0
00)
A
ccum
ulat
ed d
epre
ciat
ion
-
-
(118
,809
) -
-
-
-
-
-
(1
18,8
09)
118
,809
-
-
1
81,1
91
-
-
-
-
-
-
181
,191
(1
81,1
91)
Dis
posa
ls /
Adj
ustm
ents
:
Cos
t (1
7,98
9)
(9,4
50)
(129
,086
) -
-
-
(5
70)
(864
) (6
7,87
9)
(225
,838
) -
A
ccum
ulat
ed d
epre
ciat
ion
-
8,7
56
96,
013
-
-
-
3
09
698
4
2,53
1
148
,307
-
(1
7,98
9)
(694
) (3
3,07
3)
-
-
-
(261
) (1
66)
(25,
348)
(7
7,53
1)
-
Dep
reci
atio
n ch
arge
-
(4
06,3
59)
(1,5
99,1
24)
(8,5
68)
(27,
759)
(2
0,17
4)
(14,
931)
(1
3,99
0)
(68,
975)
(2
,159
,880
) -
Clo
sing
net
boo
k va
lue
9
50,4
67
4,7
36,4
95
16,
263,
447
8
0,29
6
305
,793
1
86,5
68
155
,403
4
9,71
1
330
,754
2
3,05
8,93
4
-
A
t 30
June
201
6
Cos
t 9
50,4
67
8,1
05,2
79
28,
436,
825
3
18,7
13
825
,765
3
71,4
52
356
,649
1
96,0
51
600
,621
4
0,16
1,82
2
-
Acc
umul
ated
dep
reci
atio
n -
(3
,368
,784
) (1
2,17
3,37
8)
(238
,417
) (5
19,9
72)
(184
,884
) (2
01,2
46)
(146
,340
) (2
69,8
67)
(17,
102,
888)
-
Net
boo
k va
lue
950
,467
4
,736
,495
1
6,26
3,44
7
80,
296
3
05,7
93
186
,568
1
55,4
03
49,
711
3
30,7
54
23,
058,
934
-
Year
end
ed 3
0 Ju
ne 2
017
O
peni
ng n
et b
ook
valu
e
950
,467
4
,736
,495
1
6,26
3,44
7
80,
296
3
05,7
93
186
,568
1
55,4
03
49,
711
3
30,7
54
23,
058,
934
-
A
dditi
ons
179
,306
3
90,4
66
2,1
68,0
63
-
24,
310
2
1,84
5
32,
773
1
2,98
3
40,
009
2
,869
,755
-
Dis
posa
ls:
C
ost
-
(11,
159)
(3
60,4
24)
-
-
-
(90)
(1
,098
) (5
4,01
3)
(426
,784
) -
A
ccum
ulat
ed d
epre
ciat
ion
-
8,6
48
262
,897
-
-
-
4
2
670
2
7,49
4
299
,751
-
-
(2
,511
) (9
7,52
7)
-
-
-
(48)
(4
28)
(26,
519)
(1
27,0
33)
- A
djus
tmen
t -
-
-
-
(2
6,19
8)
-
-
-
-
(26,
198)
-
Dep
reci
atio
n ch
arge
-
(4
80,1
04)
(1,6
61,4
38)
(7,7
11)
(28,
581)
(1
9,76
6)
(17,
051)
(1
6,81
6)
(62,
838)
(2
,294
,305
) -
Clo
sing
net
boo
k va
lue
1
,129
,773
4
,644
,346
1
6,67
2,54
5
72,
585
2
75,3
24
188
,647
1
71,0
77
45,
450
2
81,4
06
23,
481,
153
-
At 3
0 Ju
ne 2
017
C
ost
1,1
29,7
73
8,4
84,5
86
30,
244,
464
3
18,7
13
823
,877
3
93,2
97
389
,332
2
07,9
36
586
,617
4
2,57
8,59
5
-
Acc
umul
ated
dep
reci
atio
n -
(3
,840
,240
) (1
3,57
1,91
9)
(246
,128
) (5
48,5
53)
(204
,650
) (2
18,2
55)
(162
,486
) (3
05,2
11)
(19,
097,
442)
-
Net
boo
k va
lue
1,1
29,7
73
4,6
44,3
46
16,
672,
545
7
2,58
5
275
,324
1
88,6
47
171
,077
4
5,45
0
281
,406
2
3,48
1,15
3
-
A
nnua
l rat
e of
dep
reci
atio
n (%
) -
1
0
10
1
0
10
1
0
10
3
0
20
10
12.1
Ope
ratin
g fix
ed a
sset
s
Notes to the Financial Statements For the year ended June 30, 2017
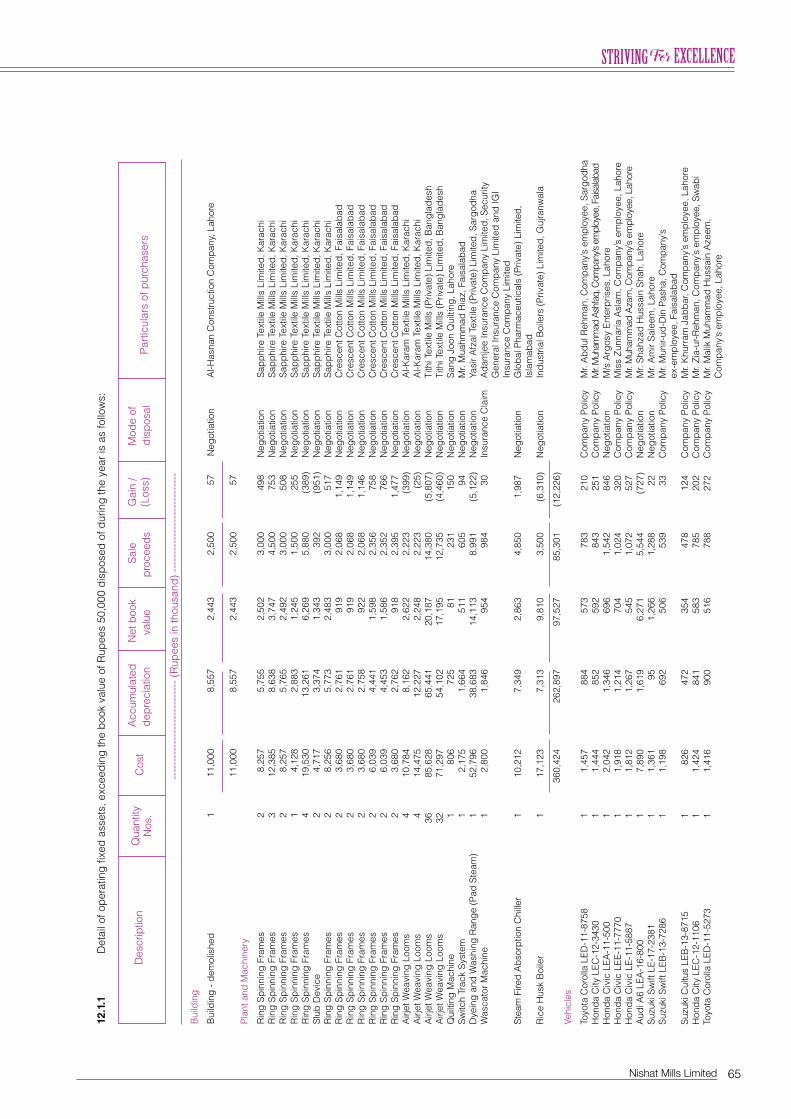
65Nishat Mills Limited
12.1
.1
D
etai
l of o
pera
ting
fixed
ass
ets,
exc
eedi
ng th
e bo
ok v
alue
of R
upee
s 50
,000
dis
pose
d of
dur
ing
the
year
is a
s fo
llow
s:
Des
crip
tion
Acc
umul
ated
N
et b
ook
S
ale
Gai
n /
Mod
e of
Part
icul
ars
of p
urch
aser
s
Qua
ntity
C
ost
depr
ecia
tion
va
lue
proc
eeds
(L
oss)
di
spos
al
N
os.
----
----
----
----
----
----
----
(Rup
ees
in th
ousa
nd) -
----
----
----
----
----
----
---
Bui
ldin
g
B
uild
ing
- dem
olis
hed
1 11
,000
8,
557
2,
443
2,
500
57
N
egot
iatio
n
Al-H
asna
n C
onst
ruct
ion
Com
pany
, Lah
ore
11,0
00
8,55
7
2,44
3
2,50
0
57
Pl
ant a
nd M
achi
nery
Rin
g Sp
inni
ng F
ram
es
2 8,
257
5,
755
2,
502
3,
000
49
8
Neg
otia
tion
Sa
pphi
re T
extil
e M
ills
Lim
ited,
Kar
achi
Rin
g Sp
inni
ng F
ram
es
3 12
,385
8,
638
3,
747
4,
500
75
3
Neg
otia
tion
Sa
pphi
re T
extil
e M
ills
Lim
ited,
Kar
achi
Rin
g Sp
inni
ng F
ram
es
2 8,
257
5,
765
2,
492
3,
000
50
8
Neg
otia
tion
Sa
pphi
re T
extil
e M
ills
Lim
ited,
Kar
achi
Rin
g Sp
inni
ng F
ram
es
1 4,
128
2,
883
1,
245
1,
500
25
5
Neg
otia
tion
Sa
pphi
re T
extil
e M
ills
Lim
ited,
Kar
achi
Rin
g Sp
inni
ng F
ram
es
4 19
,530
13
,261
6,
269
5,
880
(3
89)
Neg
otia
tion
Sa
pphi
re T
extil
e M
ills
Lim
ited,
Kar
achi
Slub
Dev
ice
2 4,
717
3,
374
1,
343
39
2
(951
) N
egot
iatio
n
Sapp
hire
Tex
tile
Mill
s Li
mite
d, K
arac
hiR
ing
Spin
ning
Fra
mes
2
8,25
6
5,77
3
2,48
3
3,00
0
517
N
egot
iatio
n
Sapp
hire
Tex
tile
Mill
s Li
mite
d, K
arac
hiR
ing
Spin
ning
Fra
mes
2
3,68
0
2,76
1
919
2,
068
1,
149
N
egot
iatio
n
Cre
scen
t Cot
ton
Mill
s Li
mite
d, F
aisa
laba
dR
ing
Spin
ning
Fra
mes
2
3,68
0
2,76
1
919
2,
068
1,
149
N
egot
iatio
n
Cre
scen
t Cot
ton
Mill
s Li
mite
d, F
aisa
laba
dR
ing
Spin
ning
Fra
mes
2
3,68
0
2,75
8
922
2,
068
1,
146
N
egot
iatio
n
Cre
scen
t Cot
ton
Mill
s Li
mite
d, F
aisa
laba
dR
ing
Spin
ning
Fra
mes
2
6,03
9
4,44
1
1,59
8
2,35
6
758
N
egot
iatio
n
Cre
scen
t Cot
ton
Mill
s Li
mite
d, F
aisa
laba
dR
ing
Spin
ning
Fra
mes
2
6,03
9
4,45
3
1,58
6
2,35
2
766
N
egot
iatio
n
Cre
scen
t Cot
ton
Mill
s Li
mite
d, F
aisa
laba
dR
ing
Spin
ning
Fra
mes
2
3,68
0
2,76
2
918
2,
395
1,
477
N
egot
iatio
n
Cre
scen
t Cot
ton
Mill
s Li
mite
d, F
aisa
laba
dA
irjet
Wea
ving
Loo
ms
4 10
,784
8,
162
2,
622
2,
223
(3
99)
Neg
otia
tion
A
l-Kar
am T
extil
e M
ills
Lim
ited,
Kar
achi
Airj
et W
eavi
ng L
oom
s 4
14,4
75
12,2
27
2,24
8
2,22
3
(25)
N
egot
iatio
n
Al-K
aram
Tex
tile
Mill
s Li
mite
d, K
arac
hiA
irjet
Wea
ving
Loo
ms
36
85,6
28
65,4
41
20,1
87
14,3
80
(5,8
07)
Neg
otia
tion
Ti
thi T
extil
e M
ills
(Priv
ate)
Lim
ited,
Ban
glad
esh
Airj
et W
eavi
ng L
oom
s 32
71
,297
54
,102
17
,195
12
,735
(4
,460
) N
egot
iatio
n
Tith
i Tex
tile
Mill
s (P
rivat
e) L
imite
d, B
angl
ades
hQ
uilti
ng M
achi
ne
1 80
6
725
81
23
1
150
N
egot
iatio
n
Sang
Joo
n Q
uilti
ng, L
ahor
eSw
itch
Trac
k Sy
stem
1
2,17
5
1,66
4
511
60
5
94
Neg
otia
tion
M
r. M
uahm
mad
Ria
z, F
aisa
laba
dD
yein
g an
d W
ashi
ng R
ange
(Pad
Ste
am)
1 52
,796
38
,683
14
,113
8,
991
(5
,122
) N
egot
iatio
n
Yasi
r Afz
al T
extil
e (P
rivat
e) L
imite
d, S
argo
dha
Was
cato
r Mac
hine
1
2,80
0
1,84
6
954
98
4
30
Insu
ranc
e C
laim
A
dam
jee
Insu
ranc
e C
ompa
ny L
imite
d, S
ecur
ity
Gen
eral
Insu
ranc
e C
ompa
ny L
imite
d an
d IG
I
In
sura
nce
Com
pany
Lim
ited
Stea
m F
ired
Abs
orpt
ion
Chi
ller
1 10
,212
7,
349
2,
863
4,
850
1,
987
N
egot
iatio
n
Glo
bal P
harm
aceu
tical
s (P
rivat
e) L
imite
d,
Isla
mab
adR
ice
Hus
k B
oile
r 1
17,1
23
7,31
3
9,81
0
3,50
0
(6,3
10)
Neg
otia
tion
In
dust
rial B
oile
rs (P
rivat
e) L
imite
d, G
ujra
nwal
a
36
0,42
4
262,
897
97
,527
85
,301
(1
2,22
6)
Ve
hicl
es
To
yota
Cor
olla
LED
-11-
8758
1
1,45
7
884
57
3
783
21
0
Com
pany
Pol
icy
M
r. A
bdul
Reh
man
, Com
pany
’s e
mpl
oyee
, Sar
godh
aH
onda
City
LEC
-12-
3430
1
1,44
4
852
59
2
843
25
1
Com
pany
Pol
icy
M
r. M
uham
mad
Ash
faq,
Com
pany
’s em
ploy
ee, F
aisa
laba
dH
onda
Civ
ic L
EA-1
1-50
0 1
2,04
2
1,34
6
696
1,
542
84
6
Neg
otia
tion
M
/s A
rgos
y En
terp
rises
, Lah
ore
Hon
da C
ivic
LEE
-11-
7770
1
1,91
8
1,21
4
704
1,
024
32
0
Com
pany
Pol
icy
M
iss
Zunn
aria
Asl
am, C
ompa
ny’s
em
ploy
ee, L
ahor
eH
onda
Civ
ic L
E-11
-588
7 1
1,81
2
1,26
7
545
1,
072
52
7
Com
pany
Pol
icy
M
r. M
uham
mad
Aza
m, C
ompa
ny’s
empl
oyee
, Lah
ore
Aud
i A6
LEA
-16-
800
1 7,
890
1,
619
6,
271
5,
544
(7
27)
Neg
otia
tion
M
r. Sh
ahza
d H
ussa
in S
hah,
Lah
ore
Suzu
ki S
wift
LE-
17-2
381
1 1,
361
95
1,
266
1,
288
22
N
egot
iatio
n
Mr.
Am
ir Sa
leem
, Lah
ore
Suzu
ki S
wift
LEB
-13-
7286
1
1,19
8
692
50
6
539
33
C
ompa
ny P
olic
y
Mr.
Mun
ir-ud
-Din
Pas
ha, C
ompa
ny’s
ex
-em
ploy
ee, F
aisa
laba
dSu
zuki
Cul
tus
LEB
-13-
8715
1
826
47
2
354
47
8
124
C
ompa
ny P
olic
y
Mr.
Khu
rram
Jab
bar,
Com
pany
’s e
mpl
oyee
, Lah
ore
Hon
da C
ity L
EC-1
2-11
06
1 1,
424
84
1
583
78
5
202
C
ompa
ny P
olic
y
Mr.
Zia-
ur-R
ehm
an, C
ompa
ny’s
em
ploy
ee, S
wab
iTo
yota
Cor
olla
LED
-11-
5273
1
1,41
6
900
51
6
788
27
2
Com
pany
Pol
icy
M
r. M
alik
Muh
amm
ad H
ussa
in A
zeem
,
C
ompa
ny’s
em
ploy
ee, L
ahor
e
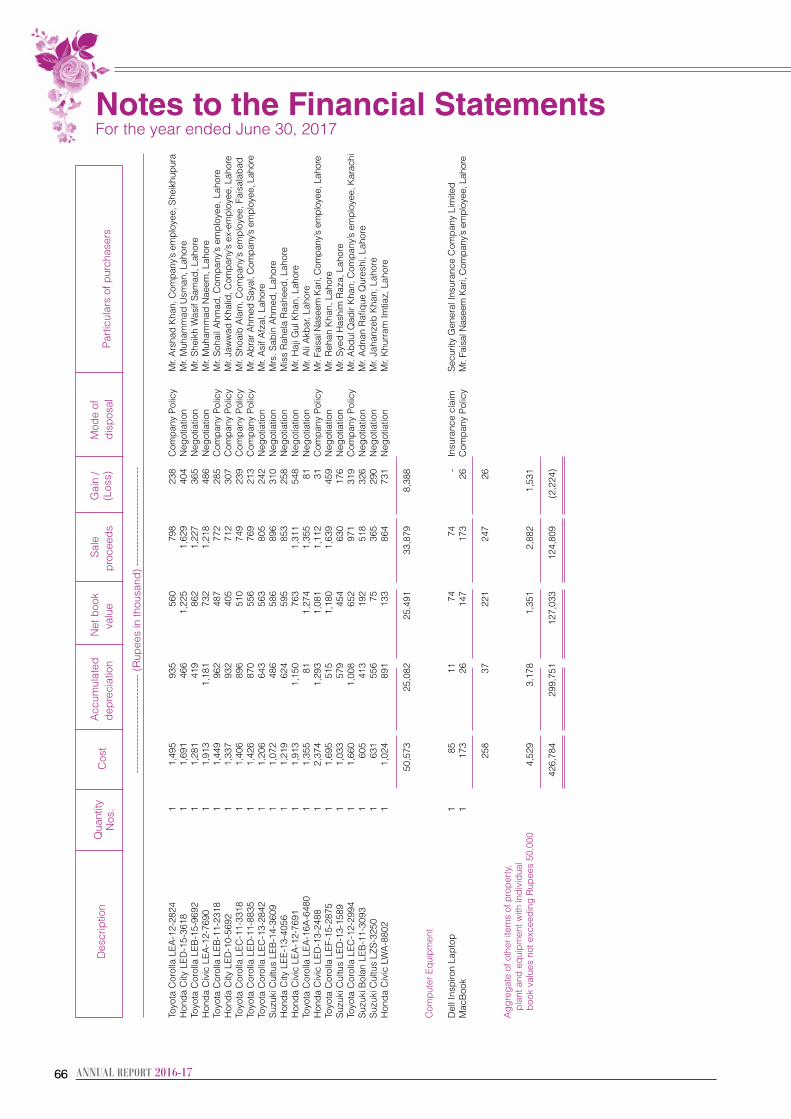
6666
Des
crip
tion
Acc
umul
ated
N
et b
ook
S
ale
Gai
n /
Mod
e of
Part
icul
ars
of p
urch
aser
s
Qua
ntity
C
ost
depr
ecia
tion
va
lue
proc
eeds
(L
oss)
di
spos
al
N
os.
----
----
----
----
----
----
----
(Rup
ees
in th
ousa
nd) -
----
----
----
----
----
----
---
Toyo
ta C
orol
la L
EA-1
2-28
24
1 1,
495
93
5
560
79
8
238
C
ompa
ny P
olic
y
Mr.
Ars
had
Kha
n, C
ompa
ny’s
em
ploy
ee, S
heik
hupu
raH
onda
City
LED
-15-
3618
1
1,69
1
466
1,
225
1,
629
40
4
Neg
otia
tion
M
r. M
uham
mad
Usm
an, L
ahor
eTo
yota
Cor
olla
LEB
-15-
9692
1
1,28
1
419
86
2
1,22
7
365
N
egot
iatio
n
Mr.
Shei
kh W
asif
Sam
ad, L
ahor
eH
onda
Civ
ic L
EA-1
2-76
90
1 1,
913
1,
181
73
2
1,21
8
486
N
egot
iatio
n
Mr.
Muh
amm
ad N
aeem
, Lah
ore
Toyo
ta C
orol
la L
EB-1
1-23
18
1 1,
449
96
2
487
77
2
285
C
ompa
ny P
olic
y
Mr.
Soha
il A
hmad
, Com
pany
’s e
mpl
oyee
, Lah
ore
Hon
da C
ity L
ED-1
0-56
92
1 1,
337
93
2
405
71
2
307
C
ompa
ny P
olic
y
Mr.
Jaw
wad
Kha
lid, C
ompa
ny’s
ex-
empl
oyee
, Lah
ore
Toyo
ta C
orol
la L
EC-1
1-33
18
1 1,
406
89
6
510
74
9
239
C
ompa
ny P
olic
y
Mr.
Shoa
ib A
lam
, Com
pany
’s e
mpl
oyee
, Fai
sala
bad
Toyo
ta C
orol
la L
ED-1
1-88
35
1 1,
426
87
0
556
76
9
213
C
ompa
ny P
olic
y
Mr.
Abr
ar A
hmed
Say
al, C
ompa
ny’s
empl
oyee
, Lah
ore
Toyo
ta C
orol
la L
EC-1
3-28
42
1 1,
206
64
3
563
80
5
242
N
egot
iatio
n
Mr.
Asi
f Afz
al, L
ahor
eSu
zuki
Cul
tus
LEB
-14-
3609
1
1,07
2
486
58
6
896
31
0
Neg
otia
tion
M
rs. S
abin
Ahm
ed, L
ahor
eH
onda
City
LEE
-13-
4056
1
1,21
9
624
59
5
853
25
8
Neg
otia
tion
M
iss
Rah
ela
Ras
heed
, Lah
ore
Hon
da C
ivic
LEA
-12-
7691
1
1,91
3
1,15
0
763
1,
311
54
8
Neg
otia
tion
M
r. H
aji G
ul K
han,
Lah
ore
Toyo
ta C
orol
la L
EA-1
6A-6
480
1 1,
355
81
1,
274
1,
355
81
N
egot
iatio
n
Mr.
Ali
Akb
ar, L
ahor
eH
onda
Civ
ic L
ED-1
3-24
88
1 2,
374
1,
293
1,
081
1,
112
31
C
ompa
ny P
olic
y
Mr.
Fais
al N
asee
m K
ari,
Com
pany
’s em
ploy
ee, L
ahor
eTo
yota
Cor
olla
LEF
-15-
2875
1
1,69
5
515
1,
180
1,
639
45
9
Neg
otia
tion
M
r. R
ehan
Kha
n, L
ahor
eSu
zuki
Cul
tus
LED
-13-
1589
1
1,03
3
579
45
4
630
17
6
Neg
otia
tion
M
r. Sy
ed H
ashi
m R
aza,
Lah
ore
Toyo
ta C
orol
la L
EC-1
2-29
94
1 1,
660
1,
008
65
2
971
31
9
Com
pany
Pol
icy
M
r. A
bdul
Qad
ir K
han,
Com
pany
’s e
mpl
oyee
, Kar
achi
Suzu
ki B
olan
LEB
-11-
3093
1
605
41
3
192
51
8
326
N
egot
iatio
n
Mr.
Adn
an R
afiqu
e Q
ures
hi, L
ahor
eSu
zuki
Cul
tus
LZS-
3250
1
631
55
6
75
365
29
0
Neg
otia
tion
M
r. Ja
hanz
eb K
han,
Lah
ore
Hon
da C
ivic
LW
A-8
802
1 1,
024
89
1
133
86
4
731
N
egot
iatio
n
Mr.
Khu
rram
Imtia
z, L
ahor
e
50
,573
25
,082
25
,491
33
,879
8,
388
Com
pute
r Equ
ipm
ent
D
ell I
nspi
ron
Lapt
op
1 85
11
74
74
-
In
sura
nce
clai
m
Secu
rity
Gen
eral
Insu
ranc
e C
ompa
ny L
imite
dM
acB
ook
1
173
26
14
7
173
26
C
ompa
ny P
olic
y
Mr.
Fais
al N
asee
m K
ari,
Com
pany
’s em
ploy
ee, L
ahor
e
25
8
37
221
24
7
26
A
ggre
gate
of o
ther
item
s of
pro
pert
y,
pl
ant a
nd e
quip
men
t with
indi
vidu
al
bo
ok v
alue
s no
t exc
eedi
ng R
upee
s 50
,000
4,5
29
3,1
78
1,3
51
2,8
82
1,5
31
42
6,78
4
299,
751
12
7,03
3
124,
809
(2
,224
)
Notes to the Financial Statements For the year ended June 30, 2017
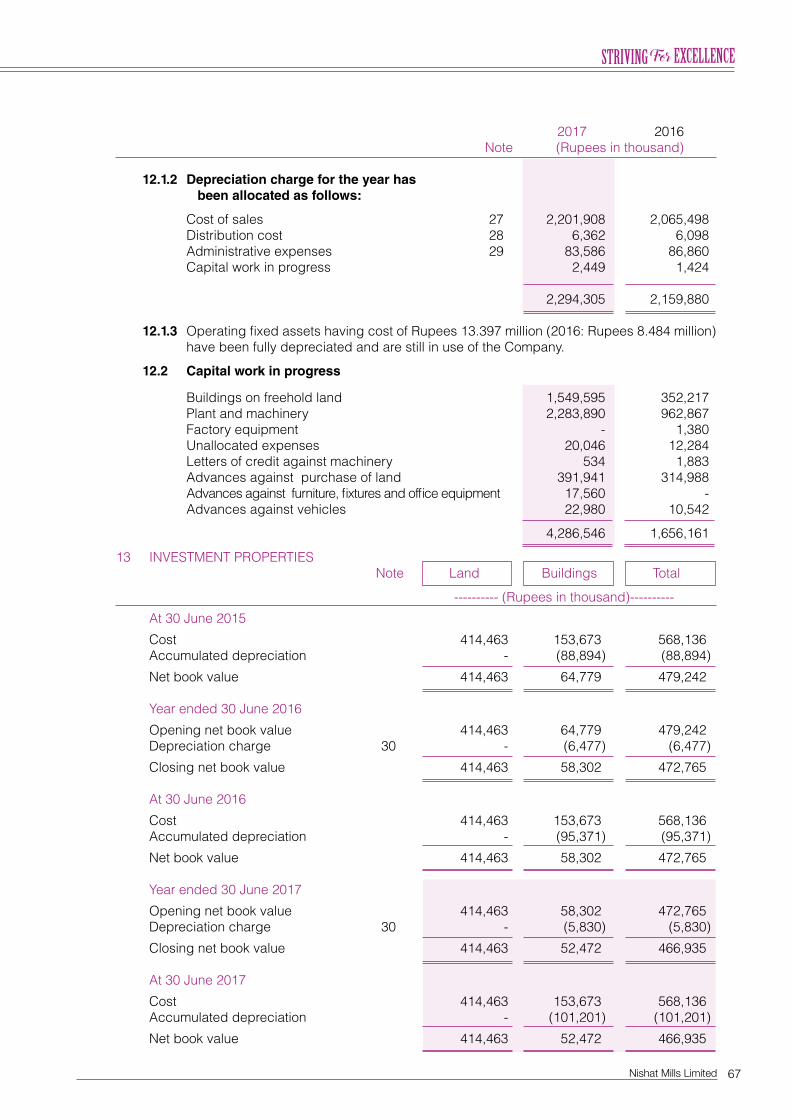
67Nishat Mills Limited
2017 2016 Note (Rupees in thousand)
12.1.2 Depreciation charge for the year has been allocated as follows: Cost of sales 27 2,201,908 2,065,498 Distribution cost 28 6,362 6,098 Administrative expenses 29 83,586 86,860 Capital work in progress 2,449 1,424
2,294,305 2,159,880 12.1.3 Operating fixed assets having cost of Rupees 13.397 million (2016: Rupees 8.484 million)
have been fully depreciated and are still in use of the Company. 12.2 Capital work in progress
Buildings on freehold land 1,549,595 352,217 Plant and machinery 2,283,890 962,867 Factory equipment - 1,380 Unallocated expenses 20,046 12,284 Letters of credit against machinery 534 1,883 Advances against purchase of land 391,941 314,988 Advances against furniture, fixtures and office equipment 17,560 - Advances against vehicles 22,980 10,542 4,286,546 1,656,161 13 INVESTMENT PROPERTIES Note Land Buildings Total ---------- (Rupees in thousand)----------
At 30 June 2015 Cost 414,463 153,673 568,136 Accumulated depreciation - (88,894) (88,894) Net book value 414,463 64,779 479,242 Year ended 30 June 2016 Opening net book value 414,463 64,779 479,242 Depreciation charge 30 - (6,477) (6,477) Closing net book value 414,463 58,302 472,765 At 30 June 2016 Cost 414,463 153,673 568,136 Accumulated depreciation - (95,371) (95,371) Net book value 414,463 58,302 472,765 Year ended 30 June 2017 Opening net book value 414,463 58,302 472,765 Depreciation charge 30 - (5,830) (5,830) Closing net book value 414,463 52,472 466,935 At 30 June 2017 Cost 414,463 153,673 568,136 Accumulated depreciation - (101,201) (101,201) Net book value 414,463 52,472 466,935
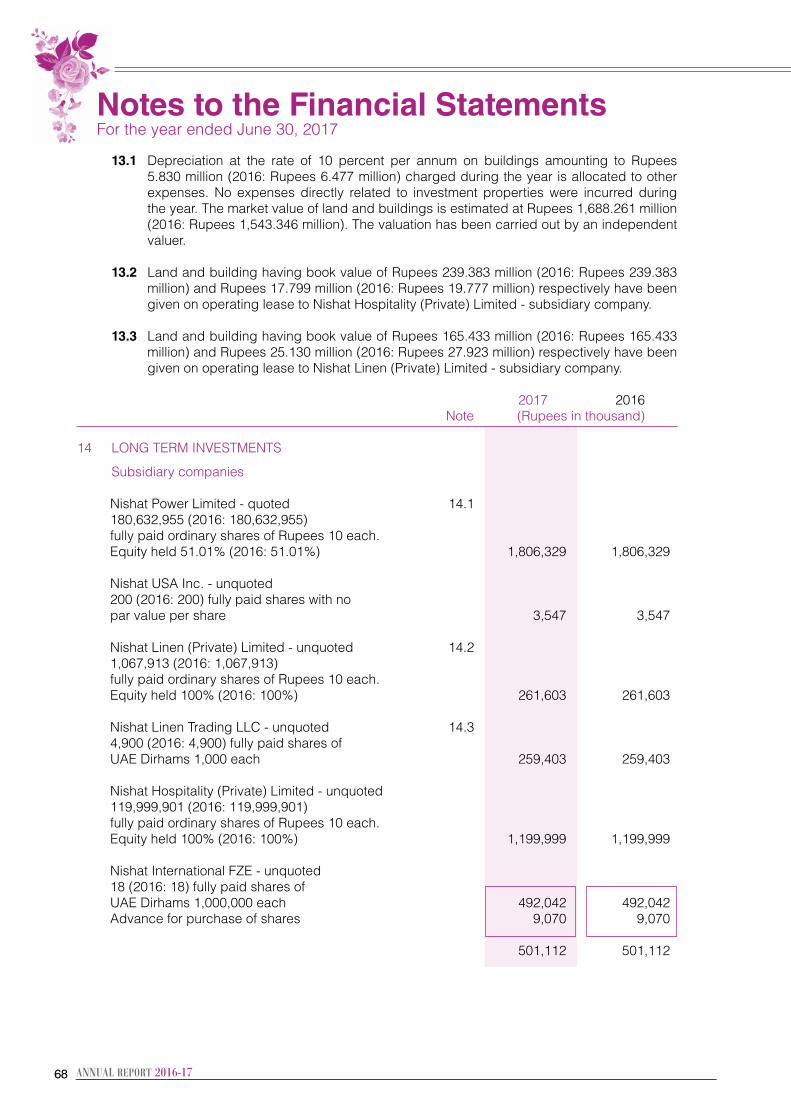
6868
13.1 Depreciation at the rate of 10 percent per annum on buildings amounting to Rupees 5.830 million (2016: Rupees 6.477 million) charged during the year is allocated to other expenses. No expenses directly related to investment properties were incurred during the year. The market value of land and buildings is estimated at Rupees 1,688.261 million (2016: Rupees 1,543.346 million). The valuation has been carried out by an independent valuer.
13.2 Land and building having book value of Rupees 239.383 million (2016: Rupees 239.383
million) and Rupees 17.799 million (2016: Rupees 19.777 million) respectively have been given on operating lease to Nishat Hospitality (Private) Limited - subsidiary company.
13.3 Land and building having book value of Rupees 165.433 million (2016: Rupees 165.433
million) and Rupees 25.130 million (2016: Rupees 27.923 million) respectively have been given on operating lease to Nishat Linen (Private) Limited - subsidiary company.
2017 2016 Note (Rupees in thousand)
14 LONG TERM INVESTMENTS Subsidiary companies Nishat Power Limited - quoted 14.1 180,632,955 (2016: 180,632,955) fully paid ordinary shares of Rupees 10 each. Equity held 51.01% (2016: 51.01%) 1,806,329 1,806,329 Nishat USA Inc. - unquoted 200 (2016: 200) fully paid shares with no par value per share 3,547 3,547 Nishat Linen (Private) Limited - unquoted 14.2 1,067,913 (2016: 1,067,913) fully paid ordinary shares of Rupees 10 each. Equity held 100% (2016: 100%) 261,603 261,603 Nishat Linen Trading LLC - unquoted 14.3 4,900 (2016: 4,900) fully paid shares of UAE Dirhams 1,000 each 259,403 259,403 Nishat Hospitality (Private) Limited - unquoted 119,999,901 (2016: 119,999,901) fully paid ordinary shares of Rupees 10 each. Equity held 100% (2016: 100%) 1,199,999 1,199,999 Nishat International FZE - unquoted 18 (2016: 18) fully paid shares of UAE Dirhams 1,000,000 each 492,042 492,042 Advance for purchase of shares 9,070 9,070
501,112 501,112
Notes to the Financial Statements For the year ended June 30, 2017
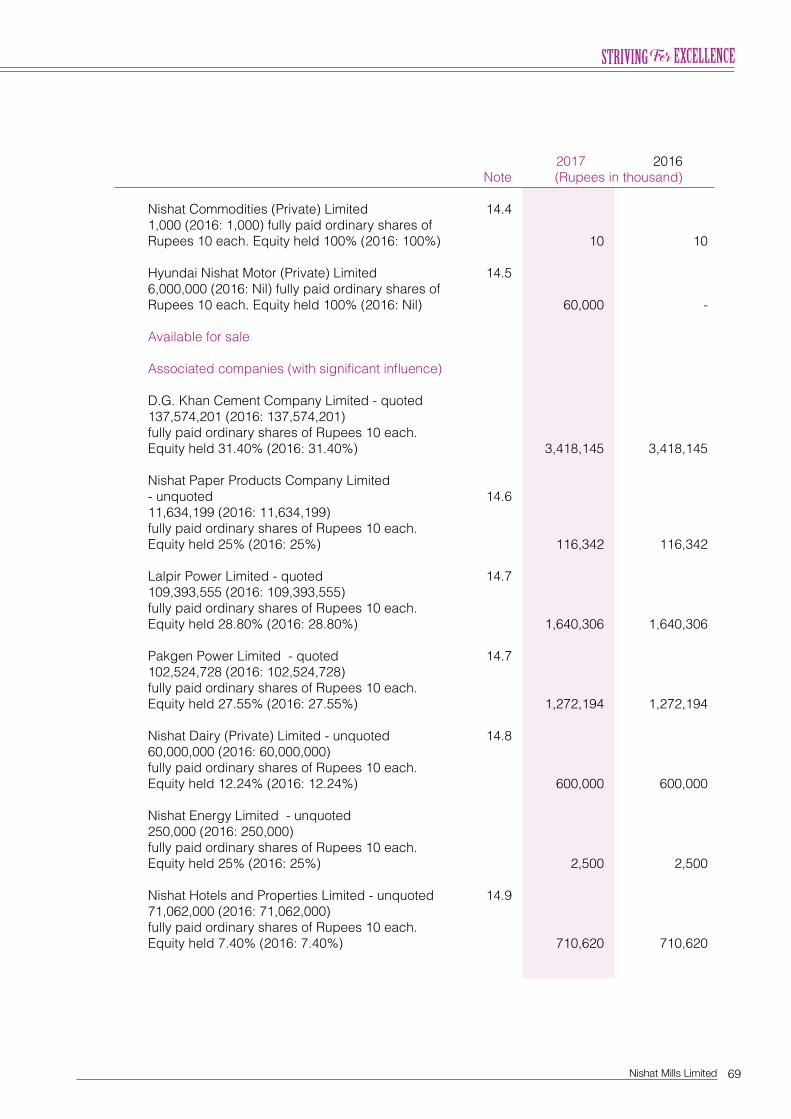
69Nishat Mills Limited
2017 2016 Note (Rupees in thousand)
Nishat Commodities (Private) Limited 14.4 1,000 (2016: 1,000) fully paid ordinary shares of Rupees 10 each. Equity held 100% (2016: 100%) 10 10 Hyundai Nishat Motor (Private) Limited 14.5 6,000,000 (2016: Nil) fully paid ordinary shares of Rupees 10 each. Equity held 100% (2016: Nil) 60,000 - Available for sale Associated companies (with significant influence) D.G. Khan Cement Company Limited - quoted 137,574,201 (2016: 137,574,201) fully paid ordinary shares of Rupees 10 each. Equity held 31.40% (2016: 31.40%) 3,418,145 3,418,145 Nishat Paper Products Company Limited - unquoted 14.6 11,634,199 (2016: 11,634,199) fully paid ordinary shares of Rupees 10 each. Equity held 25% (2016: 25%) 116,342 116,342 Lalpir Power Limited - quoted 14.7 109,393,555 (2016: 109,393,555) fully paid ordinary shares of Rupees 10 each. Equity held 28.80% (2016: 28.80%) 1,640,306 1,640,306 Pakgen Power Limited - quoted 14.7 102,524,728 (2016: 102,524,728) fully paid ordinary shares of Rupees 10 each. Equity held 27.55% (2016: 27.55%) 1,272,194 1,272,194 Nishat Dairy (Private) Limited - unquoted 14.8 60,000,000 (2016: 60,000,000) fully paid ordinary shares of Rupees 10 each. Equity held 12.24% (2016: 12.24%) 600,000 600,000 Nishat Energy Limited - unquoted 250,000 (2016: 250,000) fully paid ordinary shares of Rupees 10 each. Equity held 25% (2016: 25%) 2,500 2,500 Nishat Hotels and Properties Limited - unquoted 14.9 71,062,000 (2016: 71,062,000) fully paid ordinary shares of Rupees 10 each. Equity held 7.40% (2016: 7.40%) 710,620 710,620
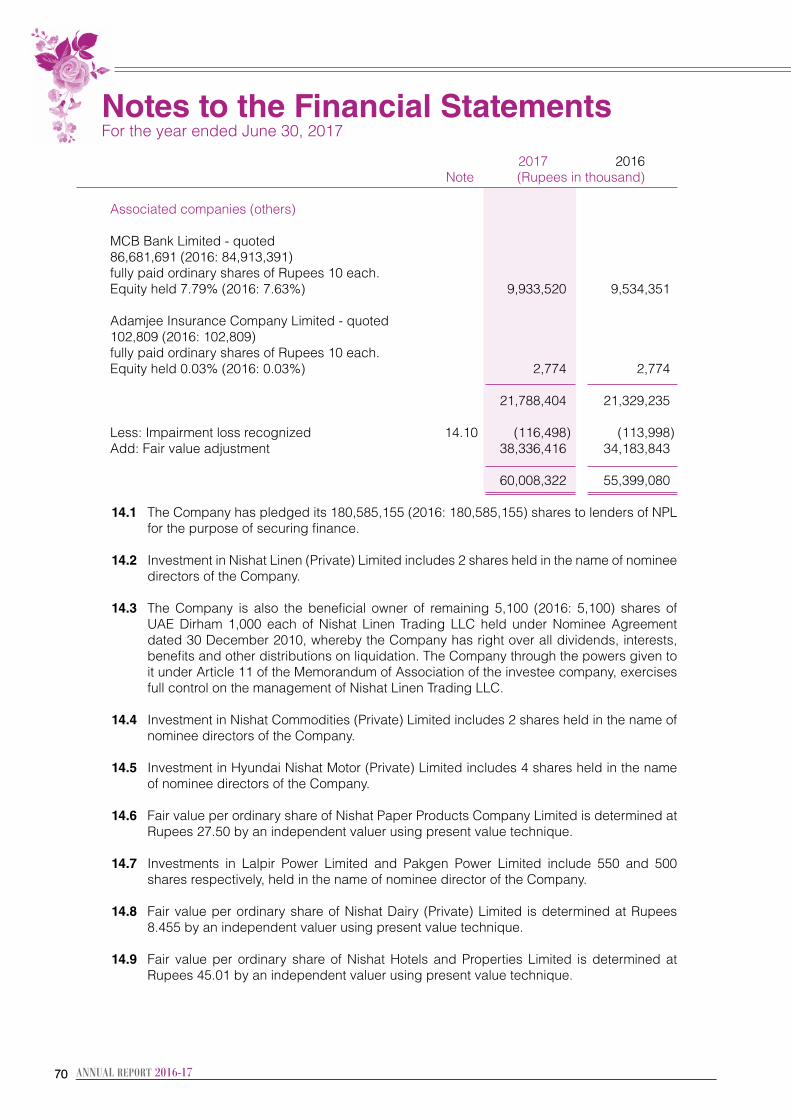
7070
2017 2016 Note (Rupees in thousand)
Associated companies (others) MCB Bank Limited - quoted 86,681,691 (2016: 84,913,391) fully paid ordinary shares of Rupees 10 each. Equity held 7.79% (2016: 7.63%) 9,933,520 9,534,351 Adamjee Insurance Company Limited - quoted 102,809 (2016: 102,809) fully paid ordinary shares of Rupees 10 each. Equity held 0.03% (2016: 0.03%) 2,774 2,774 21,788,404 21,329,235 Less: Impairment loss recognized 14.10 (116,498) (113,998) Add: Fair value adjustment 38,336,416 34,183,843 60,008,322 55,399,080 14.1 The Company has pledged its 180,585,155 (2016: 180,585,155) shares to lenders of NPL
for the purpose of securing finance. 14.2 Investment in Nishat Linen (Private) Limited includes 2 shares held in the name of nominee
directors of the Company. 14.3 The Company is also the beneficial owner of remaining 5,100 (2016: 5,100) shares of
UAE Dirham 1,000 each of Nishat Linen Trading LLC held under Nominee Agreement dated 30 December 2010, whereby the Company has right over all dividends, interests, benefits and other distributions on liquidation. The Company through the powers given to it under Article 11 of the Memorandum of Association of the investee company, exercises full control on the management of Nishat Linen Trading LLC.
14.4 Investment in Nishat Commodities (Private) Limited includes 2 shares held in the name of
nominee directors of the Company. 14.5 Investment in Hyundai Nishat Motor (Private) Limited includes 4 shares held in the name
of nominee directors of the Company. 14.6 Fair value per ordinary share of Nishat Paper Products Company Limited is determined at
Rupees 27.50 by an independent valuer using present value technique. 14.7 Investments in Lalpir Power Limited and Pakgen Power Limited include 550 and 500
shares respectively, held in the name of nominee director of the Company. 14.8 Fair value per ordinary share of Nishat Dairy (Private) Limited is determined at Rupees
8.455 by an independent valuer using present value technique. 14.9 Fair value per ordinary share of Nishat Hotels and Properties Limited is determined at
Rupees 45.01 by an independent valuer using present value technique.
Notes to the Financial Statements For the year ended June 30, 2017
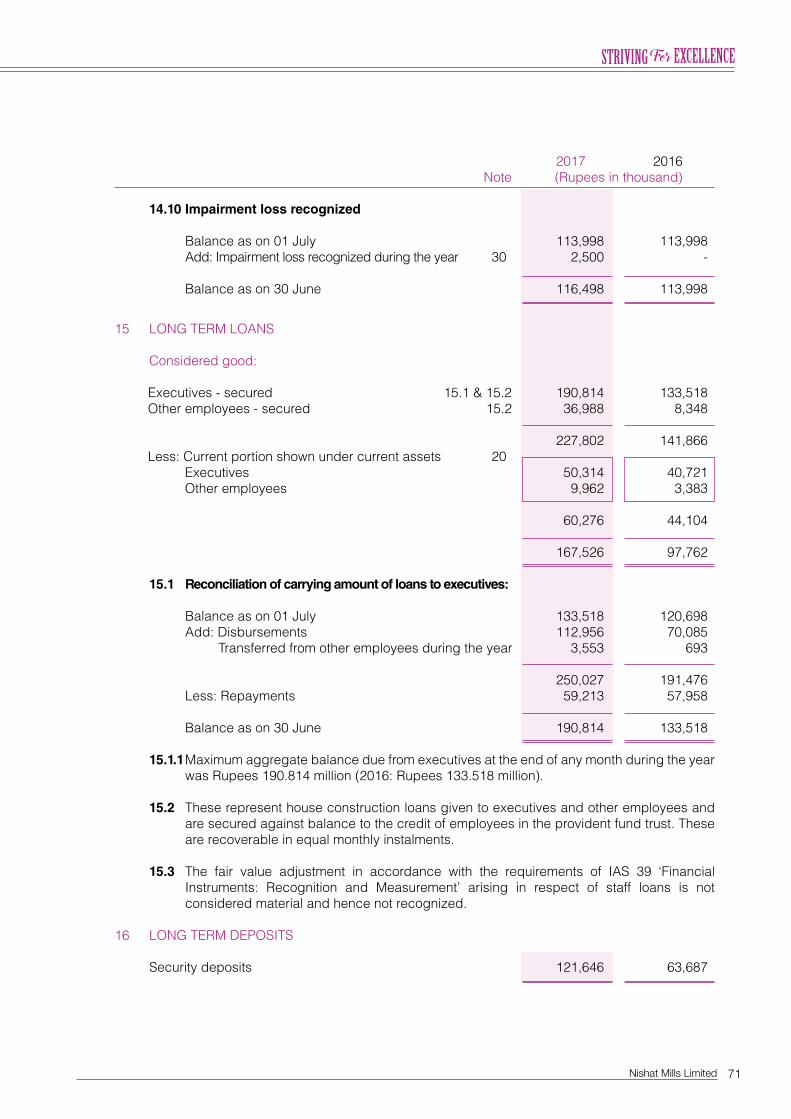
71Nishat Mills Limited
2017 2016 Note (Rupees in thousand)
14.10 Impairment loss recognized Balance as on 01 July 113,998 113,998 Add: Impairment loss recognized during the year 30 2,500 -
Balance as on 30 June 116,498 113,998
15 LONG TERM LOANS Considered good: Executives - secured 15.1 & 15.2 190,814 133,518 Other employees - secured 15.2 36,988 8,348 227,802 141,866 Less: Current portion shown under current assets 20 Executives 50,314 40,721 Other employees 9,962 3,383 60,276 44,104
167,526 97,762
15.1 Reconciliation of carrying amount of loans to executives:
Balance as on 01 July 133,518 120,698 Add: Disbursements 112,956 70,085 Transferred from other employees during the year 3,553 693 250,027 191,476 Less: Repayments 59,213 57,958 Balance as on 30 June 190,814 133,518 15.1.1 Maximum aggregate balance due from executives at the end of any month during the year
was Rupees 190.814 million (2016: Rupees 133.518 million).
15.2 These represent house construction loans given to executives and other employees and are secured against balance to the credit of employees in the provident fund trust. These are recoverable in equal monthly instalments.
15.3 The fair value adjustment in accordance with the requirements of IAS 39 ‘Financial
Instruments: Recognition and Measurement’ arising in respect of staff loans is not considered material and hence not recognized.
16 LONG TERM DEPOSITS Security deposits 121,646 63,687
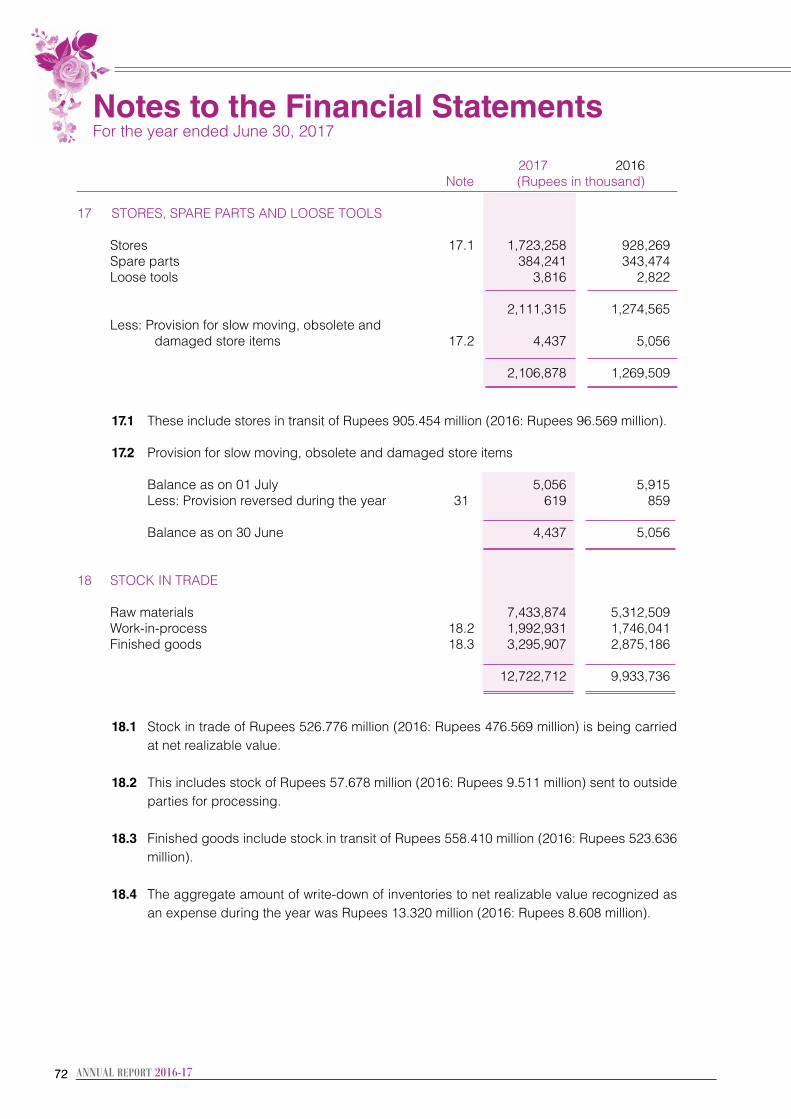
7272
2017 2016 Note (Rupees in thousand)
17 STORES, SPARE PARTS AND LOOSE TOOLS Stores 17.1 1,723,258 928,269 Spare parts 384,241 343,474 Loose tools 3,816 2,822 2,111,315 1,274,565 Less: Provision for slow moving, obsolete and damaged store items 17.2 4,437 5,056
2,106,878 1,269,509
17.1 These include stores in transit of Rupees 905.454 million (2016: Rupees 96.569 million).
17.2 Provision for slow moving, obsolete and damaged store items
Balance as on 01 July 5,056 5,915 Less: Provision reversed during the year 31 619 859
Balance as on 30 June 4,437 5,056 18 STOCK IN TRADE Raw materials 7,433,874 5,312,509 Work-in-process 18.2 1,992,931 1,746,041 Finished goods 18.3 3,295,907 2,875,186 12,722,712 9,933,736 18.1 Stock in trade of Rupees 526.776 million (2016: Rupees 476.569 million) is being carried
at net realizable value. 18.2 This includes stock of Rupees 57.678 million (2016: Rupees 9.511 million) sent to outside
parties for processing. 18.3 Finished goods include stock in transit of Rupees 558.410 million (2016: Rupees 523.636
million). 18.4 The aggregate amount of write-down of inventories to net realizable value recognized as
an expense during the year was Rupees 13.320 million (2016: Rupees 8.608 million).
Notes to the Financial Statements For the year ended June 30, 2017
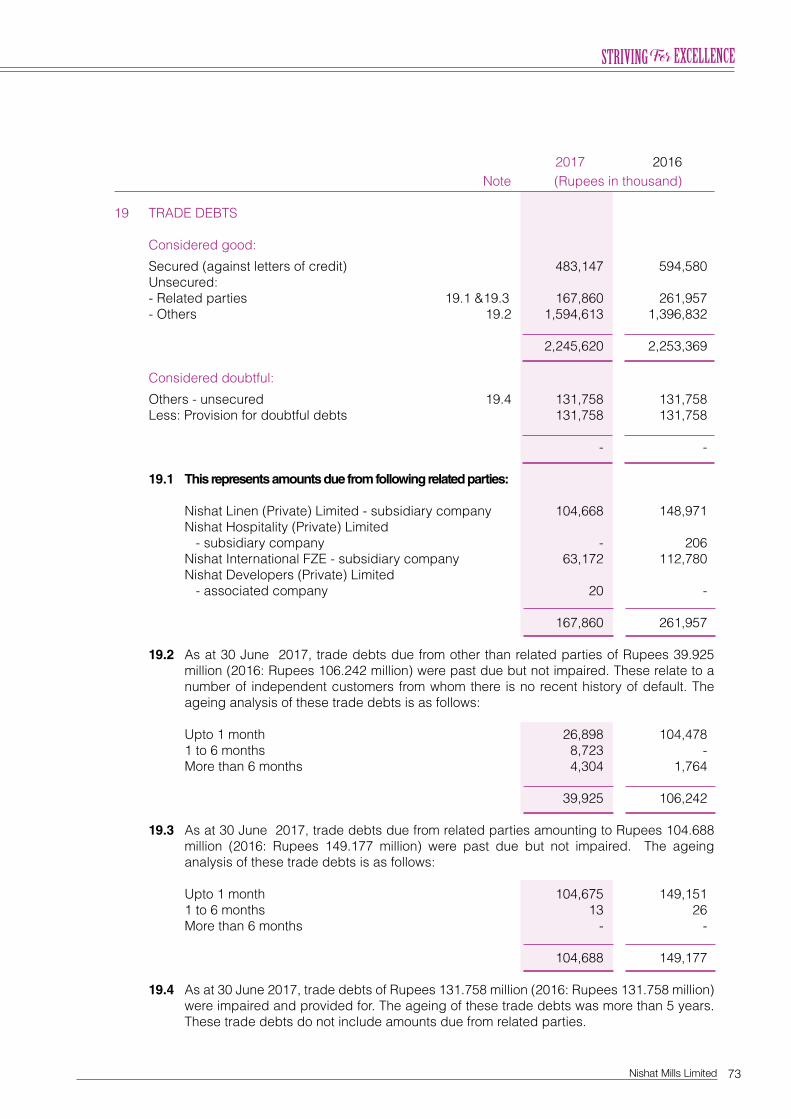
73Nishat Mills Limited
2017 2016 Note (Rupees in thousand)
19 TRADE DEBTS Considered good: Secured (against letters of credit) 483,147 594,580 Unsecured: - Related parties 19.1 &19.3 167,860 261,957 - Others 19.2 1,594,613 1,396,832 2,245,620 2,253,369 Considered doubtful: Others - unsecured 19.4 131,758 131,758 Less: Provision for doubtful debts 131,758 131,758 - - 19.1 This represents amounts due from following related parties:
Nishat Linen (Private) Limited - subsidiary company 104,668 148,971 Nishat Hospitality (Private) Limited - subsidiary company - 206 Nishat International FZE - subsidiary company 63,172 112,780 Nishat Developers (Private) Limited - associated company 20 - 167,860 261,957 19.2 As at 30 June 2017, trade debts due from other than related parties of Rupees 39.925
million (2016: Rupees 106.242 million) were past due but not impaired. These relate to a number of independent customers from whom there is no recent history of default. The ageing analysis of these trade debts is as follows:
Upto 1 month 26,898 104,478 1 to 6 months 8,723 - More than 6 months 4,304 1,764
39,925 106,242 19.3 As at 30 June 2017, trade debts due from related parties amounting to Rupees 104.688
million (2016: Rupees 149.177 million) were past due but not impaired. The ageing analysis of these trade debts is as follows:
Upto 1 month 104,675 149,151 1 to 6 months 13 26 More than 6 months - -
104,688 149,177 19.4 As at 30 June 2017, trade debts of Rupees 131.758 million (2016: Rupees 131.758 million)
were impaired and provided for. The ageing of these trade debts was more than 5 years. These trade debts do not include amounts due from related parties.
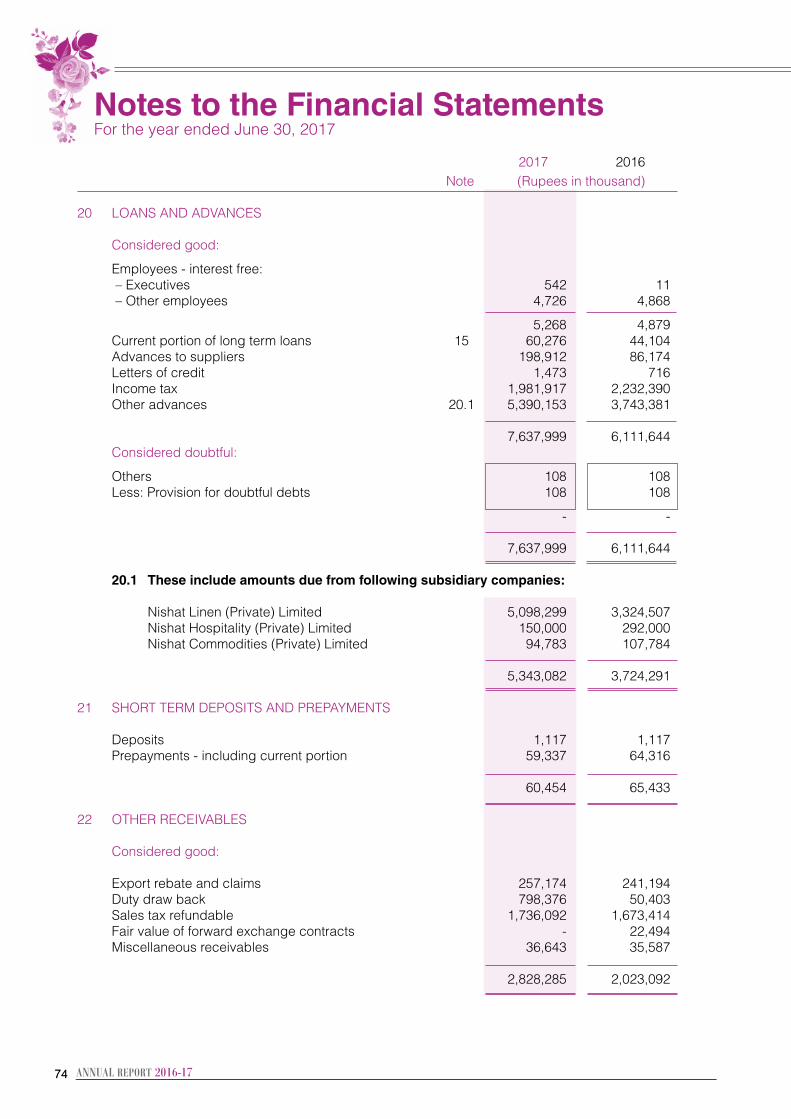
7474
2017 2016 Note (Rupees in thousand)
20 LOANS AND ADVANCES Considered good: Employees - interest free: – Executives 542 11 – Other employees 4,726 4,868 5,268 4,879 Current portion of long term loans 15 60,276 44,104 Advances to suppliers 198,912 86,174 Letters of credit 1,473 716 Income tax 1,981,917 2,232,390 Other advances 20.1 5,390,153 3,743,381
7,637,999 6,111,644 Considered doubtful: Others 108 108 Less: Provision for doubtful debts 108 108 - -
7,637,999 6,111,644 20.1 These include amounts due from following subsidiary companies:
Nishat Linen (Private) Limited 5,098,299 3,324,507 Nishat Hospitality (Private) Limited 150,000 292,000 Nishat Commodities (Private) Limited 94,783 107,784 5,343,082 3,724,291 21 SHORT TERM DEPOSITS AND PREPAYMENTS Deposits 1,117 1,117 Prepayments - including current portion 59,337 64,316 60,454 65,433 22 OTHER RECEIVABLES Considered good: Export rebate and claims 257,174 241,194 Duty draw back 798,376 50,403 Sales tax refundable 1,736,092 1,673,414 Fair value of forward exchange contracts - 22,494 Miscellaneous receivables 36,643 35,587
2,828,285 2,023,092
Notes to the Financial Statements For the year ended June 30, 2017
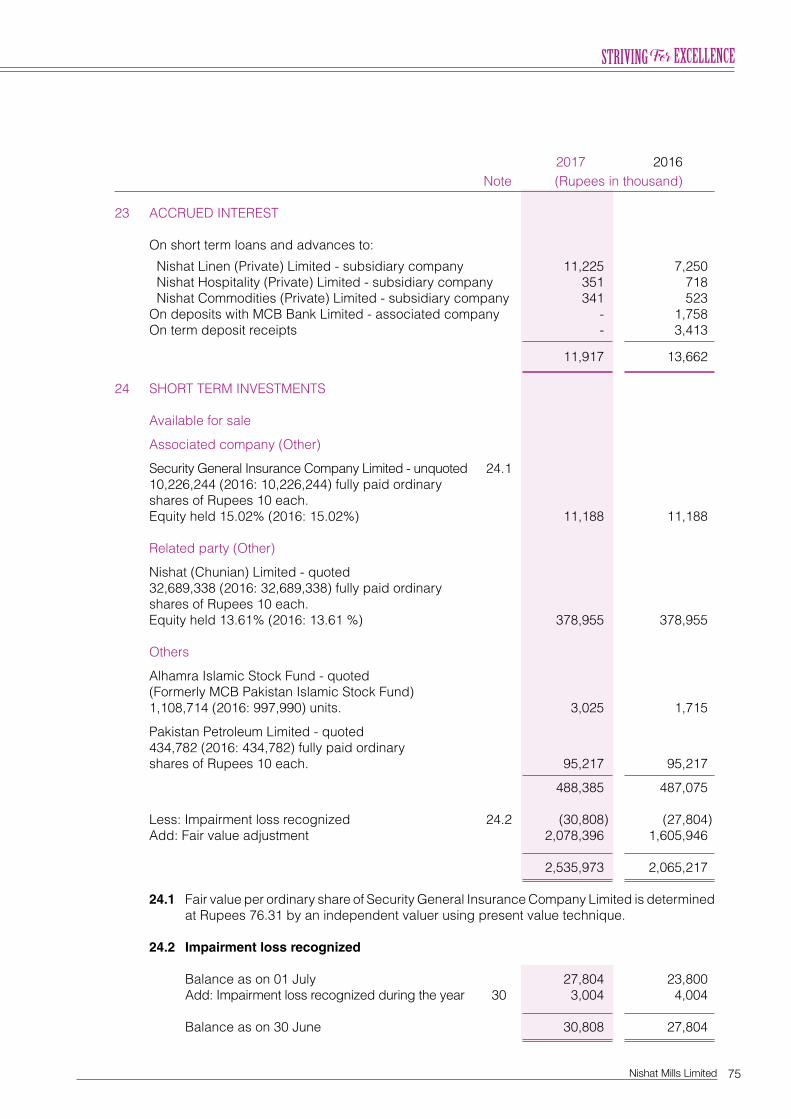
75Nishat Mills Limited
2017 2016 Note (Rupees in thousand)
23 ACCRUED INTEREST On short term loans and advances to:
Nishat Linen (Private) Limited - subsidiary company 11,225 7,250 Nishat Hospitality (Private) Limited - subsidiary company 351 718 Nishat Commodities (Private) Limited - subsidiary company 341 523 On deposits with MCB Bank Limited - associated company - 1,758 On term deposit receipts - 3,413 11,917 13,662 24 SHORT TERM INVESTMENTS Available for sale Associated company (Other) Security General Insurance Company Limited - unquoted 24.1 10,226,244 (2016: 10,226,244) fully paid ordinary shares of Rupees 10 each. Equity held 15.02% (2016: 15.02%) 11,188 11,188 Related party (Other) Nishat (Chunian) Limited - quoted 32,689,338 (2016: 32,689,338) fully paid ordinary shares of Rupees 10 each. Equity held 13.61% (2016: 13.61 %) 378,955 378,955 Others Alhamra Islamic Stock Fund - quoted (Formerly MCB Pakistan Islamic Stock Fund) 1,108,714 (2016: 997,990) units. 3,025 1,715 Pakistan Petroleum Limited - quoted 434,782 (2016: 434,782) fully paid ordinary shares of Rupees 10 each. 95,217 95,217 488,385 487,075 Less: Impairment loss recognized 24.2 (30,808) (27,804) Add: Fair value adjustment 2,078,396 1,605,946
2,535,973 2,065,217 24.1 Fair value per ordinary share of Security General Insurance Company Limited is determined
at Rupees 76.31 by an independent valuer using present value technique.
24.2 Impairment loss recognized Balance as on 01 July 27,804 23,800 Add: Impairment loss recognized during the year 30 3,004 4,004 Balance as on 30 June 30,808 27,804
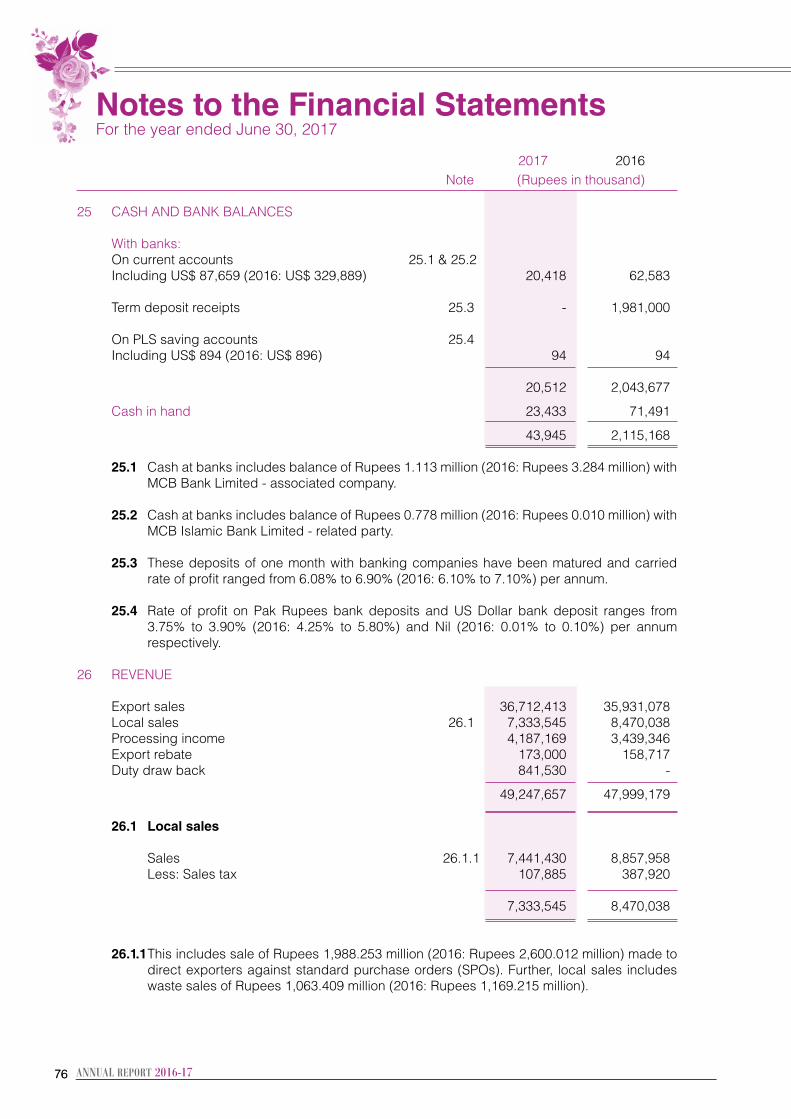
7676
2017 2016 Note (Rupees in thousand)
25 CASH AND BANK BALANCES With banks: On current accounts 25.1 & 25.2 Including US$ 87,659 (2016: US$ 329,889) 20,418 62,583 Term deposit receipts 25.3 - 1,981,000 On PLS saving accounts 25.4 Including US$ 894 (2016: US$ 896) 94 94
20,512 2,043,677 Cash in hand 23,433 71,491 43,945 2,115,168 25.1 Cash at banks includes balance of Rupees 1.113 million (2016: Rupees 3.284 million) with
MCB Bank Limited - associated company. 25.2 Cash at banks includes balance of Rupees 0.778 million (2016: Rupees 0.010 million) with
MCB Islamic Bank Limited - related party. 25.3 These deposits of one month with banking companies have been matured and carried
rate of profit ranged from 6.08% to 6.90% (2016: 6.10% to 7.10%) per annum.
25.4 Rate of profit on Pak Rupees bank deposits and US Dollar bank deposit ranges from 3.75% to 3.90% (2016: 4.25% to 5.80%) and Nil (2016: 0.01% to 0.10%) per annum respectively.
26 REVENUE Export sales 36,712,413 35,931,078 Local sales 26.1 7,333,545 8,470,038 Processing income 4,187,169 3,439,346 Export rebate 173,000 158,717 Duty draw back 841,530 - 49,247,657 47,999,179 26.1 Local sales Sales 26.1.1 7,441,430 8,857,958 Less: Sales tax 107,885 387,920 7,333,545 8,470,038
26.1.1 This includes sale of Rupees 1,988.253 million (2016: Rupees 2,600.012 million) made to direct exporters against standard purchase orders (SPOs). Further, local sales includes waste sales of Rupees 1,063.409 million (2016: Rupees 1,169.215 million).
Notes to the Financial Statements For the year ended June 30, 2017
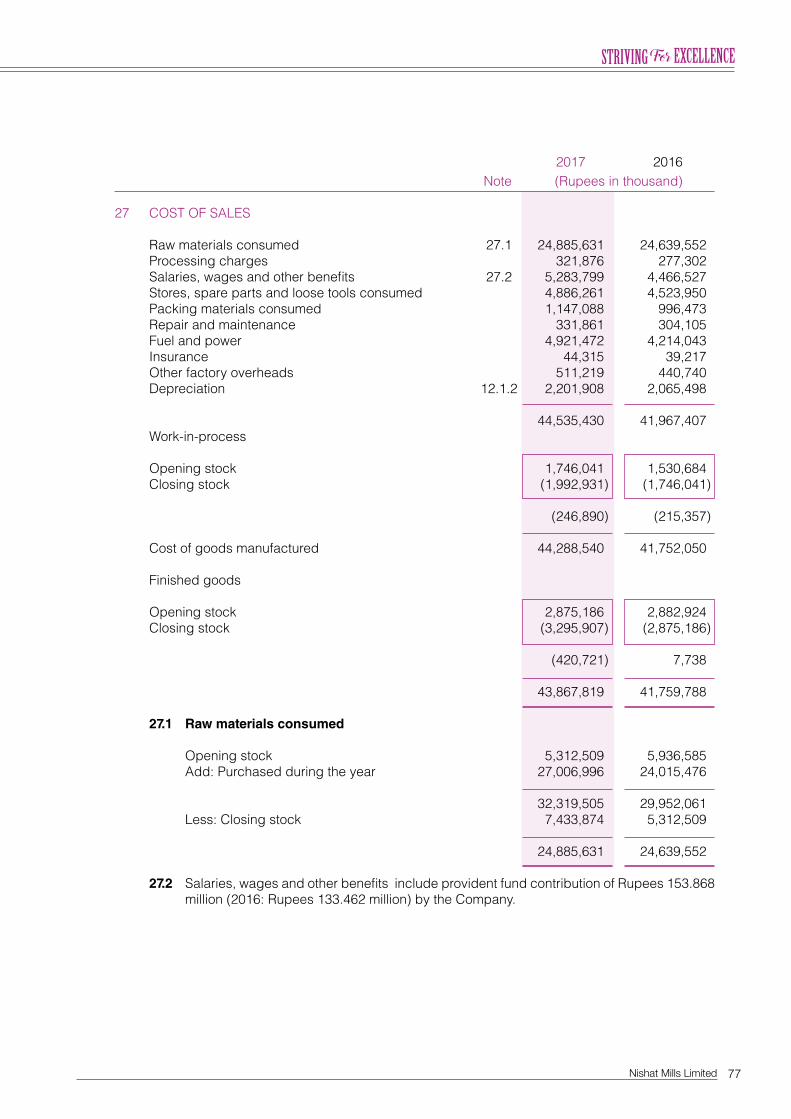
77Nishat Mills Limited
2017 2016 Note (Rupees in thousand)
27 COST OF SALES Raw materials consumed 27.1 24,885,631 24,639,552 Processing charges 321,876 277,302 Salaries, wages and other benefits 27.2 5,283,799 4,466,527 Stores, spare parts and loose tools consumed 4,886,261 4,523,950 Packing materials consumed 1,147,088 996,473 Repair and maintenance 331,861 304,105 Fuel and power 4,921,472 4,214,043 Insurance 44,315 39,217 Other factory overheads 511,219 440,740 Depreciation 12.1.2 2,201,908 2,065,498 44,535,430 41,967,407 Work-in-process Opening stock 1,746,041 1,530,684 Closing stock (1,992,931) (1,746,041)
(246,890) (215,357)
Cost of goods manufactured 44,288,540 41,752,050 Finished goods Opening stock 2,875,186 2,882,924 Closing stock (3,295,907) (2,875,186) (420,721) 7,738 43,867,819 41,759,788 27.1 Raw materials consumed Opening stock 5,312,509 5,936,585 Add: Purchased during the year 27,006,996 24,015,476
32,319,505 29,952,061 Less: Closing stock 7,433,874 5,312,509
24,885,631 24,639,552 27.2 Salaries, wages and other benefits include provident fund contribution of Rupees 153.868
million (2016: Rupees 133.462 million) by the Company.
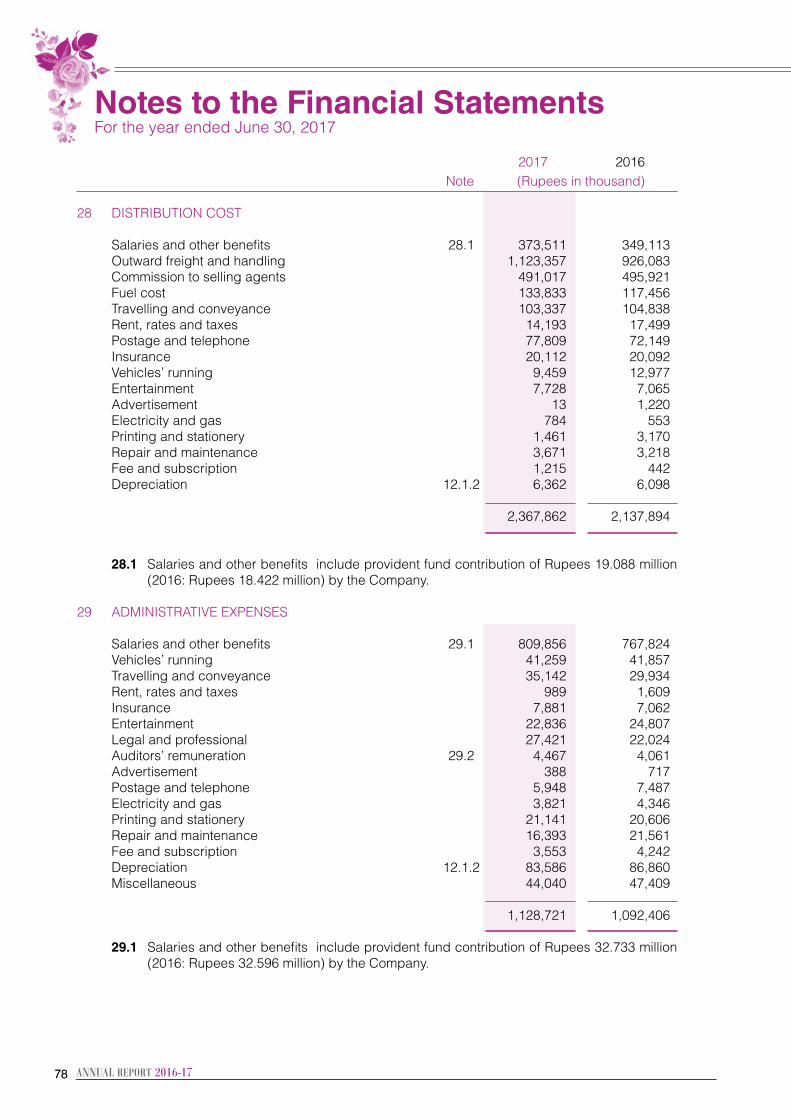
7878
2017 2016 Note (Rupees in thousand)
28 DISTRIBUTION COST Salaries and other benefits 28.1 373,511 349,113 Outward freight and handling 1,123,357 926,083 Commission to selling agents 491,017 495,921 Fuel cost 133,833 117,456 Travelling and conveyance 103,337 104,838 Rent, rates and taxes 14,193 17,499 Postage and telephone 77,809 72,149 Insurance 20,112 20,092 Vehicles’ running 9,459 12,977 Entertainment 7,728 7,065 Advertisement 13 1,220 Electricity and gas 784 553 Printing and stationery 1,461 3,170 Repair and maintenance 3,671 3,218 Fee and subscription 1,215 442 Depreciation 12.1.2 6,362 6,098
2,367,862 2,137,894
28.1 Salaries and other benefits include provident fund contribution of Rupees 19.088 million (2016: Rupees 18.422 million) by the Company.
29 ADMINISTRATIVE EXPENSES Salaries and other benefits 29.1 809,856 767,824 Vehicles’ running 41,259 41,857 Travelling and conveyance 35,142 29,934 Rent, rates and taxes 989 1,609 Insurance 7,881 7,062 Entertainment 22,836 24,807 Legal and professional 27,421 22,024 Auditors’ remuneration 29.2 4,467 4,061 Advertisement 388 717 Postage and telephone 5,948 7,487 Electricity and gas 3,821 4,346 Printing and stationery 21,141 20,606 Repair and maintenance 16,393 21,561 Fee and subscription 3,553 4,242 Depreciation 12.1.2 83,586 86,860 Miscellaneous 44,040 47,409 1,128,721 1,092,406 29.1 Salaries and other benefits include provident fund contribution of Rupees 32.733 million
(2016: Rupees 32.596 million) by the Company.
Notes to the Financial Statements For the year ended June 30, 2017
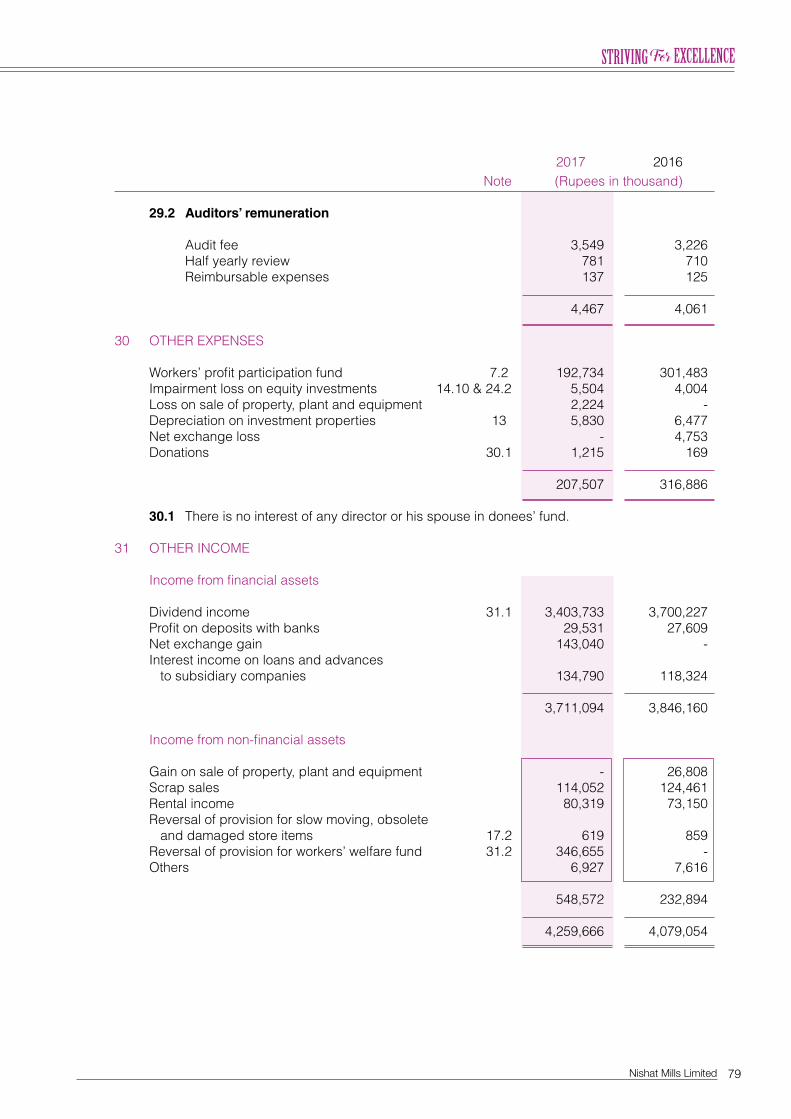
79Nishat Mills Limited
2017 2016 Note (Rupees in thousand)
29.2 Auditors’ remuneration Audit fee 3,549 3,226 Half yearly review 781 710 Reimbursable expenses 137 125 4,467 4,061 30 OTHER EXPENSES Workers’ profit participation fund 7.2 192,734 301,483 Impairment loss on equity investments 14.10 & 24.2 5,504 4,004 Loss on sale of property, plant and equipment 2,224 - Depreciation on investment properties 13 5,830 6,477 Net exchange loss - 4,753 Donations 30.1 1,215 169 207,507 316,886 30.1 There is no interest of any director or his spouse in donees’ fund. 31 OTHER INCOME Income from financial assets Dividend income 31.1 3,403,733 3,700,227 Profit on deposits with banks 29,531 27,609 Net exchange gain 143,040 - Interest income on loans and advances to subsidiary companies 134,790 118,324
3,711,094 3,846,160 Income from non-financial assets Gain on sale of property, plant and equipment - 26,808 Scrap sales 114,052 124,461 Rental income 80,319 73,150 Reversal of provision for slow moving, obsolete and damaged store items 17.2 619 859 Reversal of provision for workers’ welfare fund 31.2 346,655 - Others 6,927 7,616
548,572 232,894
4,259,666 4,079,054
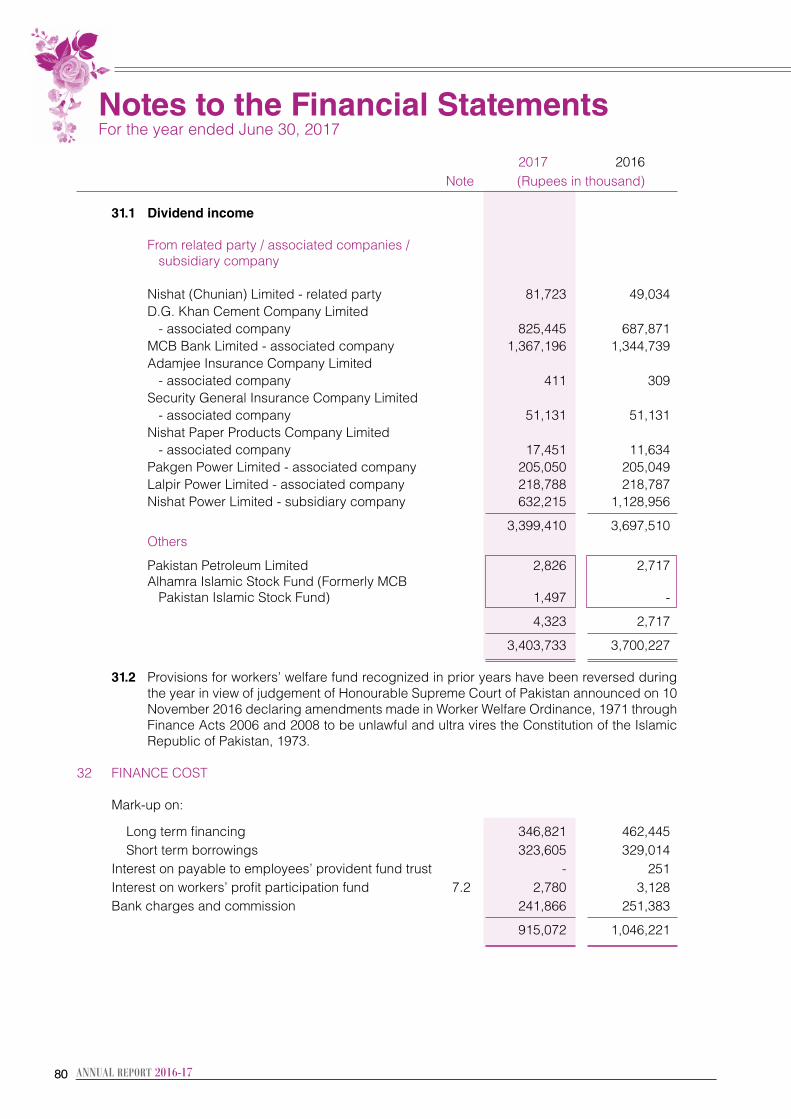
8080
2017 2016 Note (Rupees in thousand)
31.1 Dividend income From related party / associated companies / subsidiary company Nishat (Chunian) Limited - related party 81,723 49,034 D.G. Khan Cement Company Limited - associated company 825,445 687,871 MCB Bank Limited - associated company 1,367,196 1,344,739 Adamjee Insurance Company Limited - associated company 411 309 Security General Insurance Company Limited - associated company 51,131 51,131 Nishat Paper Products Company Limited - associated company 17,451 11,634 Pakgen Power Limited - associated company 205,050 205,049 Lalpir Power Limited - associated company 218,788 218,787 Nishat Power Limited - subsidiary company 632,215 1,128,956 3,399,410 3,697,510 Others Pakistan Petroleum Limited 2,826 2,717 Alhamra Islamic Stock Fund (Formerly MCB Pakistan Islamic Stock Fund) 1,497 - 4,323 2,717 3,403,733 3,700,227 31.2 Provisions for workers’ welfare fund recognized in prior years have been reversed during
the year in view of judgement of Honourable Supreme Court of Pakistan announced on 10 November 2016 declaring amendments made in Worker Welfare Ordinance, 1971 through Finance Acts 2006 and 2008 to be unlawful and ultra vires the Constitution of the Islamic Republic of Pakistan, 1973.
32 FINANCE COST Mark-up on: Long term financing 346,821 462,445 Short term borrowings 323,605 329,014 Interest on payable to employees’ provident fund trust - 251 Interest on workers’ profit participation fund 7.2 2,780 3,128 Bank charges and commission 241,866 251,383 915,072 1,046,221
Notes to the Financial Statements For the year ended June 30, 2017
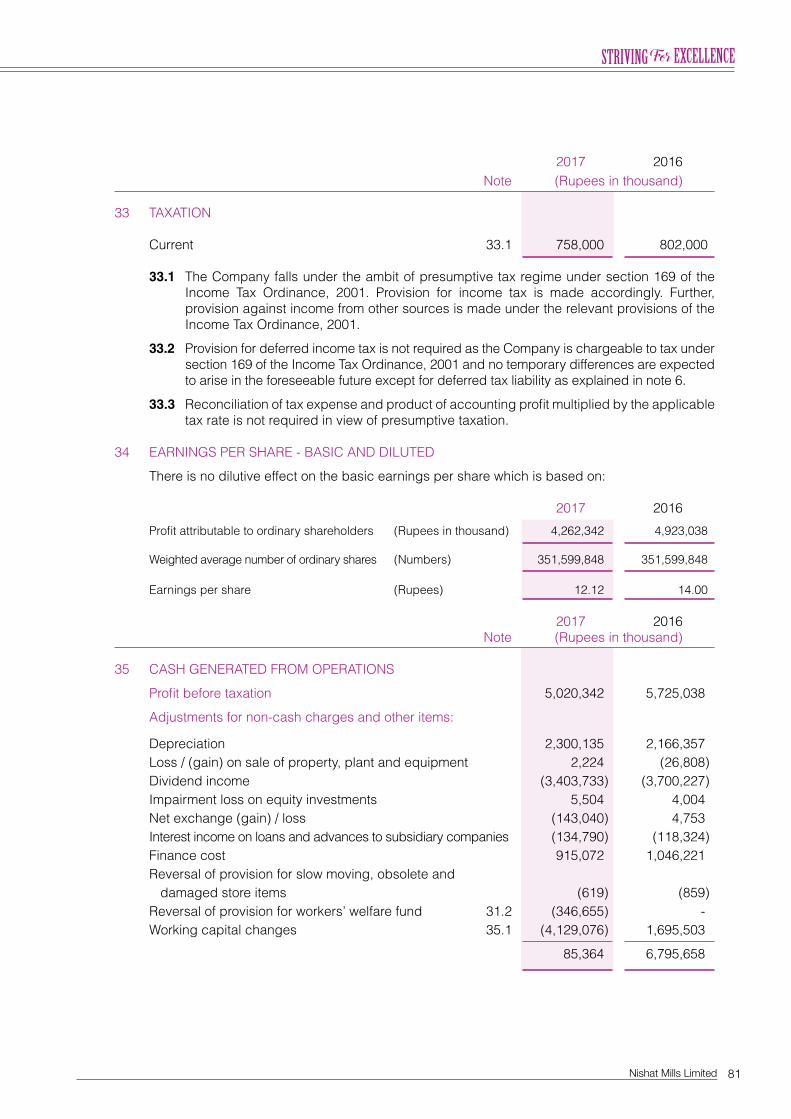
81Nishat Mills Limited
2017 2016 Note (Rupees in thousand)
33 TAXATION Current 33.1 758,000 802,000 33.1 The Company falls under the ambit of presumptive tax regime under section 169 of the
Income Tax Ordinance, 2001. Provision for income tax is made accordingly. Further, provision against income from other sources is made under the relevant provisions of the Income Tax Ordinance, 2001.
33.2 Provision for deferred income tax is not required as the Company is chargeable to tax under section 169 of the Income Tax Ordinance, 2001 and no temporary differences are expected to arise in the foreseeable future except for deferred tax liability as explained in note 6.
33.3 Reconciliation of tax expense and product of accounting profit multiplied by the applicable tax rate is not required in view of presumptive taxation.
34 EARNINGS PER SHARE - BASIC AND DILUTED There is no dilutive effect on the basic earnings per share which is based on:
2017 2016 Profit attributable to ordinary shareholders (Rupees in thousand) 4,262,342 4,923,038 Weighted average number of ordinary shares (Numbers) 351,599,848 351,599,848 Earnings per share (Rupees) 12.12 14.00 2017 2016 Note (Rupees in thousand)
35 CASH GENERATED FROM OPERATIONS Profit before taxation 5,020,342 5,725,038 Adjustments for non-cash charges and other items: Depreciation 2,300,135 2,166,357 Loss / (gain) on sale of property, plant and equipment 2,224 (26,808) Dividend income (3,403,733) (3,700,227) Impairment loss on equity investments 5,504 4,004 Net exchange (gain) / loss (143,040) 4,753 Interest income on loans and advances to subsidiary companies (134,790) (118,324) Finance cost 915,072 1,046,221 Reversal of provision for slow moving, obsolete and damaged store items (619) (859) Reversal of provision for workers’ welfare fund 31.2 (346,655) - Working capital changes 35.1 (4,129,076) 1,695,503 85,364 6,795,658
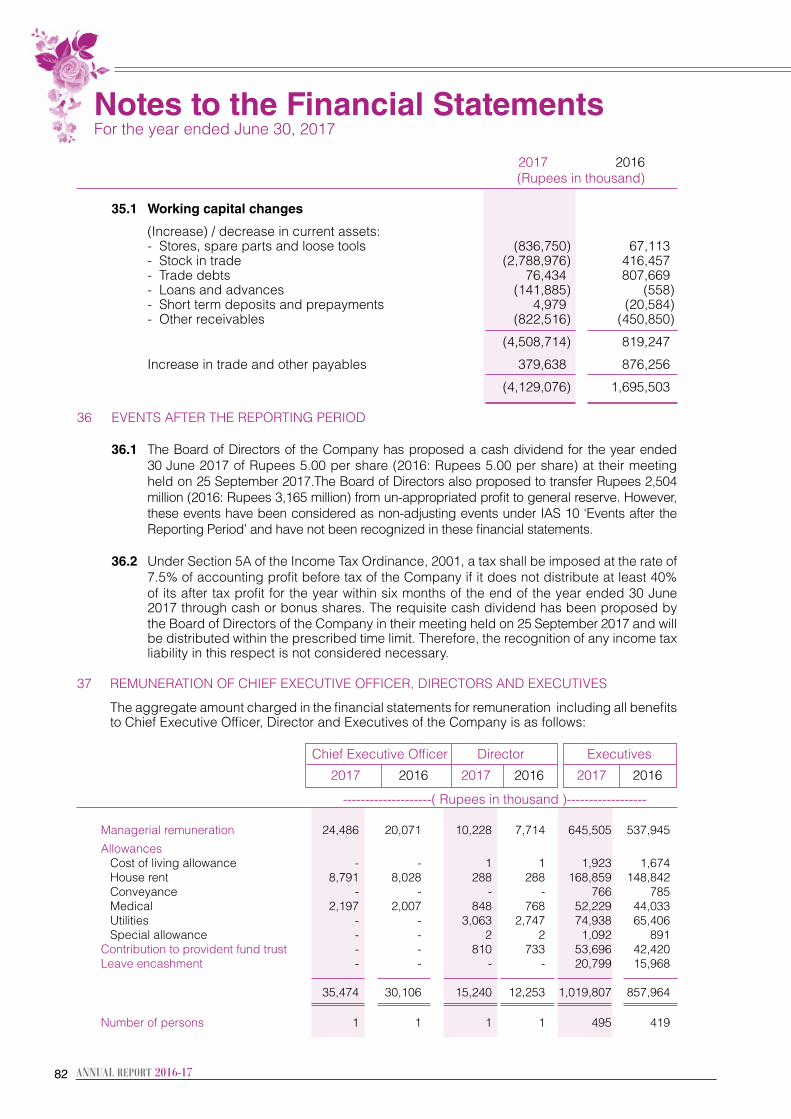
8282
2017 2016 (Rupees in thousand)
35.1 Working capital changes
(Increase) / decrease in current assets: - Stores, spare parts and loose tools (836,750) 67,113 - Stock in trade (2,788,976) 416,457 - Trade debts 76,434 807,669 - Loans and advances (141,885) (558) - Short term deposits and prepayments 4,979 (20,584) - Other receivables (822,516) (450,850)
(4,508,714) 819,247
Increase in trade and other payables 379,638 876,256
(4,129,076) 1,695,503 36 EVENTS AFTER THE REPORTING PERIOD
36.1 The Board of Directors of the Company has proposed a cash dividend for the year ended 30 June 2017 of Rupees 5.00 per share (2016: Rupees 5.00 per share) at their meeting held on 25 September 2017.The Board of Directors also proposed to transfer Rupees 2,504 million (2016: Rupees 3,165 million) from un-appropriated profit to general reserve. However, these events have been considered as non-adjusting events under IAS 10 ‘Events after the Reporting Period’ and have not been recognized in these financial statements.
36.2 Under Section 5A of the Income Tax Ordinance, 2001, a tax shall be imposed at the rate of 7.5% of accounting profit before tax of the Company if it does not distribute at least 40% of its after tax profit for the year within six months of the end of the year ended 30 June 2017 through cash or bonus shares. The requisite cash dividend has been proposed by the Board of Directors of the Company in their meeting held on 25 September 2017 and will be distributed within the prescribed time limit. Therefore, the recognition of any income tax liability in this respect is not considered necessary.
37 REMUNERATION OF CHIEF EXECUTIVE OFFICER, DIRECTORS AND EXECUTIVES
The aggregate amount charged in the financial statements for remuneration including all benefits to Chief Executive Officer, Director and Executives of the Company is as follows:
Chief Executive Officer Director Executives
2017 2016 2017 2016 2017 2016 --------------------( Rupees in thousand )------------------
Managerial remuneration 24,486 20,071 10,228 7,714 645,505 537,945
Allowances Cost of living allowance - - 1 1 1,923 1,674 House rent 8,791 8,028 288 288 168,859 148,842 Conveyance - - - - 766 785 Medical 2,197 2,007 848 768 52,229 44,033 Utilities - - 3,063 2,747 74,938 65,406 Special allowance - - 2 2 1,092 891 Contribution to provident fund trust - - 810 733 53,696 42,420 Leave encashment - - - - 20,799 15,968 35,474 30,106 15,240 12,253 1,019,807 857,964 Number of persons 1 1 1 1 495 419
Notes to the Financial Statements For the year ended June 30, 2017
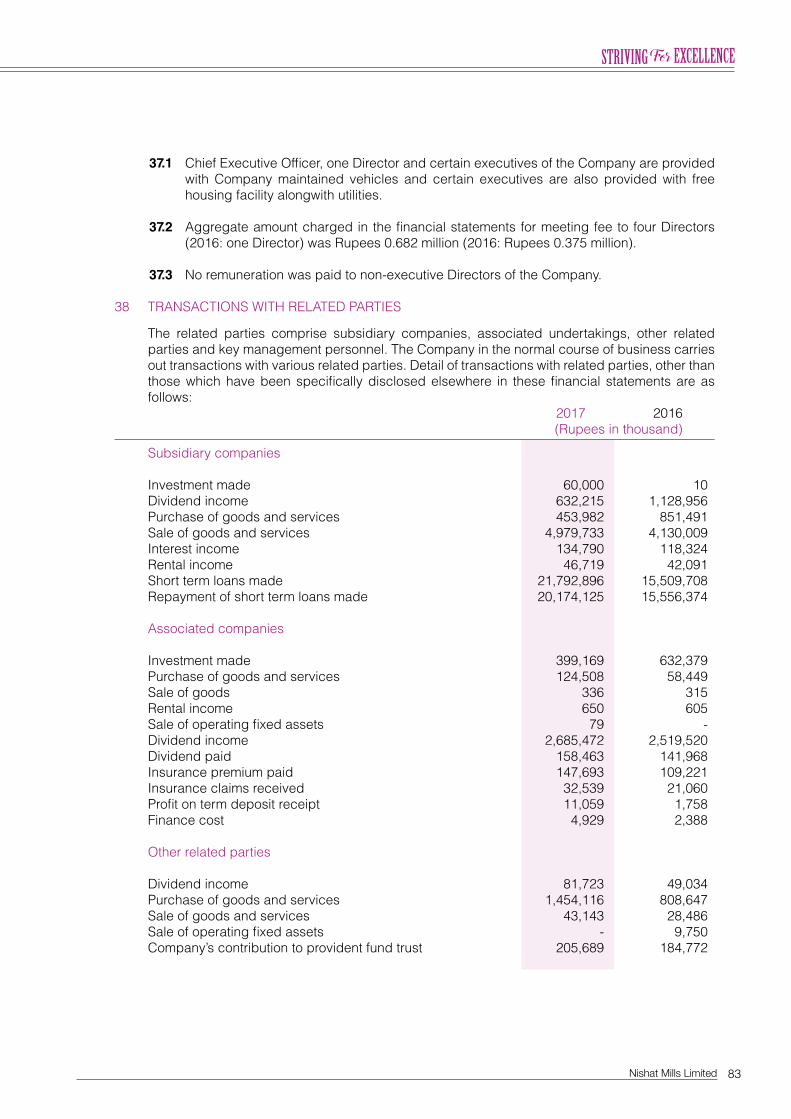
83Nishat Mills Limited
37.1 Chief Executive Officer, one Director and certain executives of the Company are provided with Company maintained vehicles and certain executives are also provided with free housing facility alongwith utilities.
37.2 Aggregate amount charged in the financial statements for meeting fee to four Directors
(2016: one Director) was Rupees 0.682 million (2016: Rupees 0.375 million). 37.3 No remuneration was paid to non-executive Directors of the Company. 38 TRANSACTIONS WITH RELATED PARTIES The related parties comprise subsidiary companies, associated undertakings, other related
parties and key management personnel. The Company in the normal course of business carries out transactions with various related parties. Detail of transactions with related parties, other than those which have been specifically disclosed elsewhere in these financial statements are as follows:
2017 2016 (Rupees in thousand)
Subsidiary companies Investment made 60,000 10 Dividend income 632,215 1,128,956 Purchase of goods and services 453,982 851,491 Sale of goods and services 4,979,733 4,130,009 Interest income 134,790 118,324 Rental income 46,719 42,091 Short term loans made 21,792,896 15,509,708 Repayment of short term loans made 20,174,125 15,556,374 Associated companies Investment made 399,169 632,379 Purchase of goods and services 124,508 58,449 Sale of goods 336 315 Rental income 650 605 Sale of operating fixed assets 79 - Dividend income 2,685,472 2,519,520 Dividend paid 158,463 141,968 Insurance premium paid 147,693 109,221 Insurance claims received 32,539 21,060 Profit on term deposit receipt 11,059 1,758 Finance cost 4,929 2,388 Other related parties Dividend income 81,723 49,034 Purchase of goods and services 1,454,116 808,647 Sale of goods and services 43,143 28,486 Sale of operating fixed assets - 9,750 Company’s contribution to provident fund trust 205,689 184,772
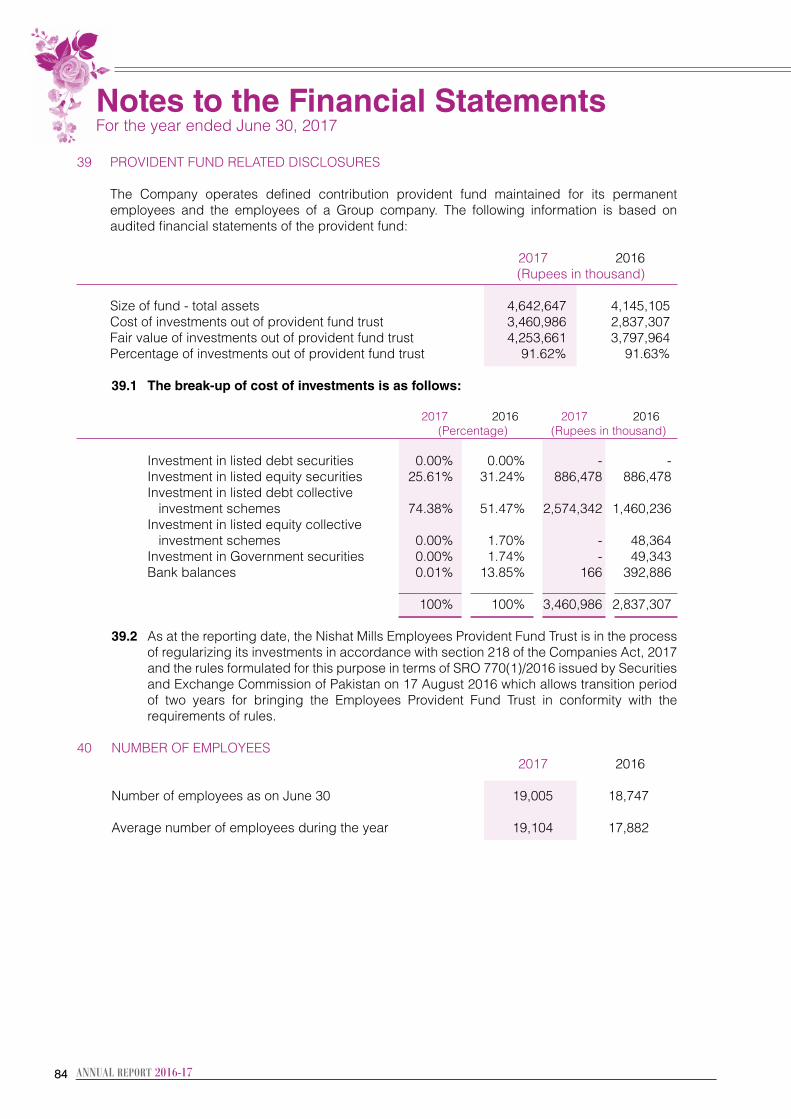
8484
39 PROVIDENT FUND RELATED DISCLOSURES The Company operates defined contribution provident fund maintained for its permanent
employees and the employees of a Group company. The following information is based on audited financial statements of the provident fund:
2017 2016 (Rupees in thousand)
Size of fund - total assets 4,642,647 4,145,105 Cost of investments out of provident fund trust 3,460,986 2,837,307 Fair value of investments out of provident fund trust 4,253,661 3,797,964 Percentage of investments out of provident fund trust 91.62% 91.63%
39.1 The break-up of cost of investments is as follows:
2017 2016 2017 2016 (Percentage) (Rupees in thousand) Investment in listed debt securities 0.00% 0.00% - - Investment in listed equity securities 25.61% 31.24% 886,478 886,478 Investment in listed debt collective investment schemes 74.38% 51.47% 2,574,342 1,460,236 Investment in listed equity collective investment schemes 0.00% 1.70% - 48,364 Investment in Government securities 0.00% 1.74% - 49,343 Bank balances 0.01% 13.85% 166 392,886 100% 100% 3,460,986 2,837,307
39.2 As at the reporting date, the Nishat Mills Employees Provident Fund Trust is in the process of regularizing its investments in accordance with section 218 of the Companies Act, 2017 and the rules formulated for this purpose in terms of SRO 770(1)/2016 issued by Securities and Exchange Commission of Pakistan on 17 August 2016 which allows transition period of two years for bringing the Employees Provident Fund Trust in conformity with the requirements of rules.
40 NUMBER OF EMPLOYEES 2017 2016
Number of employees as on June 30 19,005 18,747
Average number of employees during the year 19,104 17,882
Notes to the Financial Statements For the year ended June 30, 2017
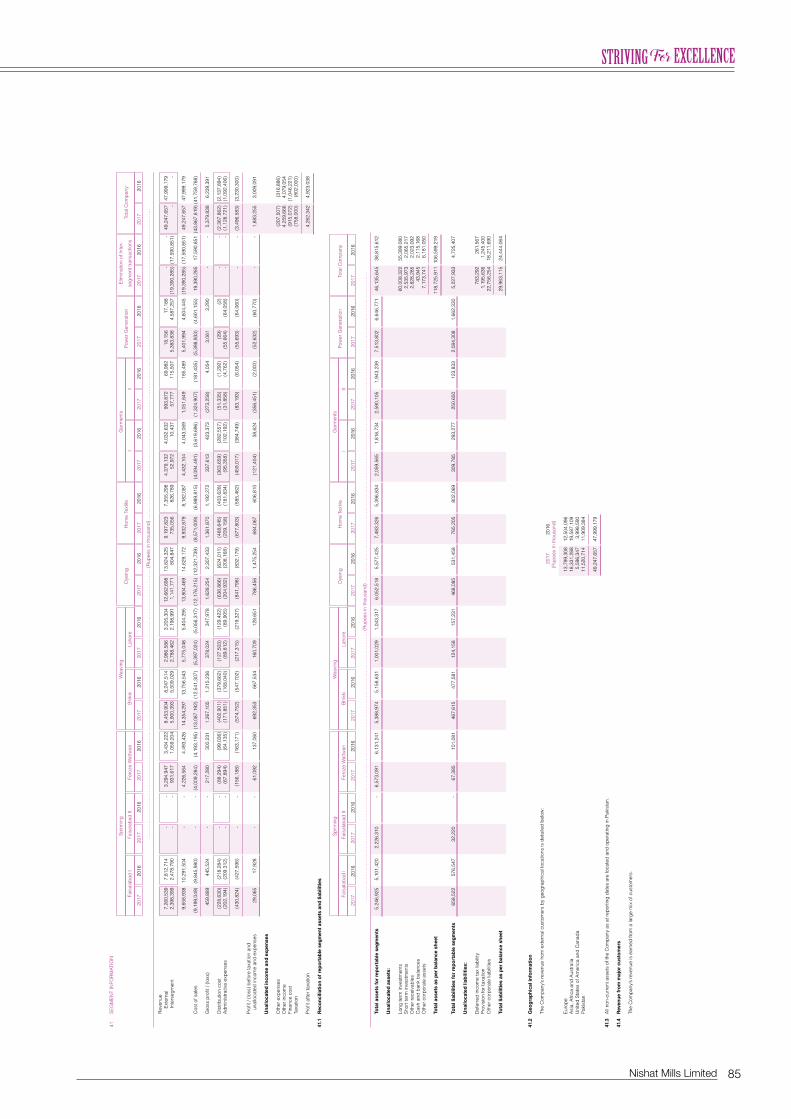
85Nishat Mills Limited
41
SEG
MEN
T IN
FOR
MAT
ION
Spin
ning
W
eavi
ng
D
yein
g
Hom
e Te
xtile
Gar
men
ts
Po
wer
Gen
erat
ion
E
limin
atio
n of
Inte
r-
Tota
l Com
pany
Fai
sala
bad
I
F
aisa
laba
d II
Fe
roze
Wat
twan
B
hikk
i
La
hore
I
I
I
se
gmen
t tra
nsac
tions
201
7
201
6
201
7
201
6
201
7
201
6
201
7
201
6
201
7
201
6
201
7
201
6
201
7
201
6
201
7
201
6
201
7
201
6
201
7
201
6
201
7
201
6
201
7
201
6
……
……
……
……
……
……
……
……
……
.. ……
……
……
……
……
……
……
……
……
..……
……
……
……
……
……
……
……
…..
(Rup
ees
in th
ousa
nd) …
……
……
……
… …
……
……
……
……
……
……
……
……
…..…
……
……
……
……
…..…
……
……
……
……
……
……
……
……
……
……
……
……
…
R
even
ue
E
xter
nal
7,2
60,5
39
7,8
12,7
14
-
-
3,2
94,9
47
3,4
34,2
22
8,4
53,9
04
8,2
47,5
14
2,9
86,5
86
3,2
05,3
04
12,
662,
698
1
3,82
4,32
5
9,1
97,8
23
7,3
55,2
98
4,3
79,1
32
4,0
32,6
32
993
,872
6
9,98
2
18,
156
1
7,18
8
-
-
49,
247,
657
47
,999
,179
In
ters
egm
ent
2,3
98,3
99
2,4
78,7
90
-
-
931
,617
1
,059
,204
5
,900
,393
5
,509
,029
2
,788
,462
2
,198
,991
1
,141
,771
8
04,8
47
735
,056
8
26,7
89
52,
972
1
0,43
7
57,
777
1
15,5
07
5,3
83,8
38
4,5
87,2
57
(19,
390,
285)
(17
,590
,851
) -
-
9,6
58,9
38
10,
291,
504
-
-
4
,226
,564
4
,493
,426
1
4,35
4,29
7
13,
756,
543
5
,775
,048
5
,404
,295
1
3,80
4,46
9
14,
629,
172
9
,932
,879
8
,182
,087
4
,432
,104
4
,043
,069
1
,051
,649
1
85,4
89
5,4
01,9
94
4,6
04,4
45
(19,
390,
285)
(17
,590
,851
) 4
9,24
7,65
7
47,9
99,1
79
Cos
t of s
ales
(9
,199
,049
) (9
,845
,980
) -
-
(4
,009
,284
) (4
,193
,195
) (1
3,08
7,19
2) (
12,5
41,3
07)
(5,3
97,0
24)
(5,0
56,3
17)
(12,
176,
215)
(12
,321
,739
) (8
,571
,009
) (6
,989
,815
) (4
,094
,491
) (3
,619
,696
) (1
,324
,907
) (1
81,4
35)
(5,3
98,9
33)
(4,6
01,1
55)
19,
390,
285
1
7,59
0,85
1 (4
3,86
7,81
9) (4
1,75
9,78
8)
G
ross
pro
fit /
(loss
) 4
59,8
89
445
,524
-
-
2
17,2
80
300
,231
1
,267
,105
1
,215
,236
3
78,0
24
347
,978
1
,628
,254
2
,307
,433
1
,361
,870
1
,192
,272
3
37,6
13
423
,373
(2
73,2
58)
4,0
54
3,0
61
3,2
90
-
-
5,3
79,8
38
6,2
39,3
91
Dis
tribu
tion
cost
(2
28,6
30)
(218
,284
) -
-
(8
8,29
4)
(99,
036)
(4
02,9
01)
(379
,662
) (1
27,5
03)
(129
,422
) (6
36,8
66)
(624
,011
) (4
68,6
45)
(403
,628
) (3
63,6
59)
(282
,557
) (5
1,33
5)
(1,2
92)
(29)
(2
) -
-
(2
,367
,862
) (2
,137
,894
)
Adm
inis
trativ
e ex
pens
es
(202
,194
) (2
09,3
12)
-
-
(67,
894)
(6
4,13
5)
(171
,851
) (1
68,0
40)
(89,
812)
(8
9,90
5)
(204
,932
) (2
08,1
68)
(209
,158
) (1
81,8
34)
(95,
358)
(1
02,1
92)
(31,
858)
(4
,762
) (5
5,66
4)
(64,
058)
-
-
(1
,128
,721
) (1
,092
,406
)
(430
,824
) (4
27,5
96)
-
-
(156
,188
) (1
63,1
71)
(574
,752
) (5
47,7
02)
(217
,315
) (2
19,3
27)
(841
,798
) (8
32,1
79)
(677
,803
) (5
85,4
62)
(459
,017
) (3
84,7
49)
(83,
193)
(6
,054
) (5
5,69
3)
(64,
060)
-
-
(3
,496
,583
) (3
,230
,300
)
Pr
ofit /
(los
s) b
efor
e ta
xatio
n an
d
un
allo
cate
d in
com
e an
d ex
pens
es
29,
065
1
7,92
8
-
-
61,
092
1
37,0
60
692
,353
6
67,5
34
160
,709
1
28,6
51
786
,456
1
,475
,254
6
84,0
67
606
,810
(1
21,4
04)
38,
624
(3
56,4
51)
(2,0
00)
(52,
632)
(6
0,77
0)
-
-
1,8
83,2
55
3,0
09,0
91
Un
allo
cate
d in
com
e an
d e
xpen
ses
O
ther
exp
ense
s
(2
07,5
07)
(316
,886
)
Oth
er in
com
e
4
,259
,666
4
,079
,054
Fina
nce
cost
(9
15,0
72)
(1,0
46,2
21)
Ta
xatio
n
(7
58,0
00)
(802
,000
)
Pr
ofit a
fter t
axat
ion
4,2
62,3
42
4,9
23,0
38
41
.1
Rec
on
cilia
tio
n o
f re
po
rtab
le s
egm
ent
asse
ts a
nd
liab
iliti
es
Spin
ning
W
eavi
ng
D
yein
g
Hom
e Te
xtile
Gar
men
ts
Po
wer
Gen
erat
ion
To
tal C
ompa
ny
Fai
sala
bad
I
F
aisa
laba
d II
Fe
roze
Wat
twan
B
hikk
i
La
hore
I
I
I
201
7
201
6
201
7
201
6
201
7
201
6
201
7
201
6
201
7
201
6
201
7
201
6
201
7
201
6
201
7
201
6
201
7
201
6
201
7
201
6
201
7
201
6
……
……
……
……
……
……
……
……
……
.. ……
……
……
……
……
……
……
……
……
..……
……
……
……
……
……
……
……
…..
(Rup
ees
in th
ousa
nd) …
……
……
……
… …
……
……
……
……
……
……
……
……
…..…
……
……
……
……
…..…
……
……
……
……
……
……
……
……
……
……
……
……
…
To
tal a
sset
s fo
r re
po
rtab
le s
egm
ents
5
,246
,925
5
,101
,420
2
,226
,310
-
6
,573
,091
6
,131
,241
5
,388
,974
5
,158
,631
1
,001
,029
1
,043
,317
6
,052
,518
5
,577
,425
7
,483
,326
5
,396
,834
2
,059
,565
1
,816
,734
2
,590
,105
1
,943
,239
7
,513
,802
6
,646
,771
4
6,13
5,64
5
38,
815,
612
U
nal
loca
ted
ass
ets:
Long
term
inve
stm
ents
6
0,00
8,32
2
55,
399,
080
Sh
ort t
erm
inve
stm
ents
2
,535
,973
2
,065
,217
O
ther
rece
ivab
les
2,8
28,2
85
2,0
23,0
92
Cas
h an
d ba
nk b
alan
ces
43,
945
2
,115
,168
O
ther
cor
pora
te a
sset
s
7
,173
,741
6
,181
,050
Tota
l ass
ets
as p
er b
alan
ce s
hee
t
1
18,7
25,9
11
106,
599,
219
To
tal l
iab
iliti
es fo
r re
po
rtab
le s
egm
ents
6
58,5
22
576
,547
3
2,22
0
-
67,
385
1
01,0
81
467
,615
4
77,5
81
124
,158
1
57,2
31
468
,085
5
31,4
58
765
,205
8
02,0
69
309
,785
2
93,2
77
250
,650
1
23,8
33
2,0
84,3
08
1,6
62,3
30
5,2
27,9
33
4,7
25,4
07
U
nal
loca
ted
liab
iliti
es:
D
efer
red
inco
me
tax
liabi
lity
783
,292
2
61,5
67
Prov
isio
n fo
r tax
atio
n
1
,195
,636
1
,245
,400
O
ther
cor
pora
te li
abili
ties
22,
756,
254
1
8,21
1,69
0
To
tal l
iab
iliti
es a
s p
er b
alan
ce s
hee
t
2
9,96
3,11
5
24,
444,
064
41.2
G
eog
rap
hic
al in
form
atio
n
Th
e C
ompa
ny’s
reve
nue
from
ext
erna
l cus
tom
ers
by g
eogr
aphi
cal l
ocat
ions
is d
etai
led
belo
w:
2
017
2
016
(Rup
ees
In th
ousa
nd)
Eu
rope
13,
799,
308
1
2,50
4,09
6
Asi
a, A
frica
and
Aus
tralia
18,
331,
288
1
9,58
7,10
9
Uni
ted
Stat
es o
f Am
eric
a an
d C
anad
a
5,5
96,3
47
3,9
98,5
90
Pa
kist
an
1
1,52
0,71
4
11,
909,
384
4
9,24
7,65
7
47,
999,
179
41.3
A
ll no
n-cu
rren
t ass
ets
of th
e C
ompa
ny a
s at
repo
rtin
g da
tes
are
loca
ted
and
oper
atin
g in
Pak
ista
n.
41
.4
Rev
enu
e fr
om
maj
or
cust
om
ers
Th
e C
ompa
ny’s
reve
nue
is e
arne
d fro
m a
larg
e m
ix o
f cus
tom
ers.
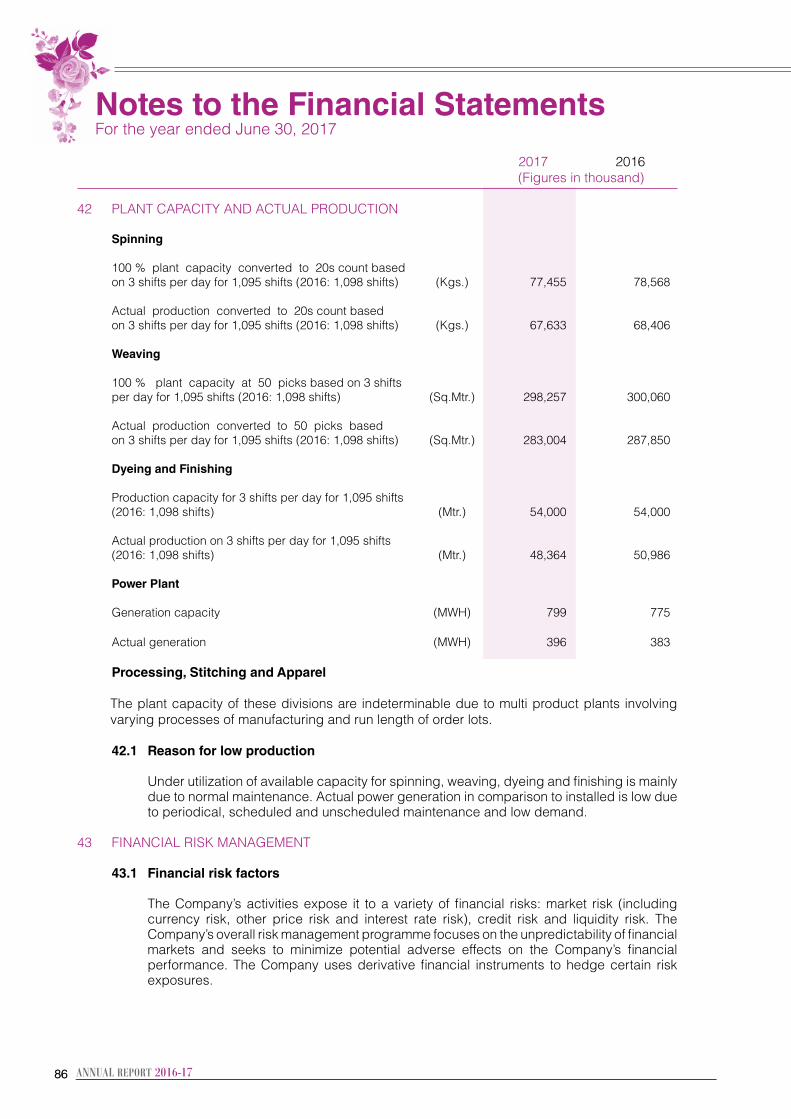
8686
2017 2016 (Figures in thousand) 42 PLANT CAPACITY AND ACTUAL PRODUCTION Spinning 100 % plant capacity converted to 20s count based on 3 shifts per day for 1,095 shifts (2016: 1,098 shifts) (Kgs.) 77,455 78,568 Actual production converted to 20s count based on 3 shifts per day for 1,095 shifts (2016: 1,098 shifts) (Kgs.) 67,633 68,406 Weaving 100 % plant capacity at 50 picks based on 3 shifts per day for 1,095 shifts (2016: 1,098 shifts) (Sq.Mtr.) 298,257 300,060 Actual production converted to 50 picks based on 3 shifts per day for 1,095 shifts (2016: 1,098 shifts) (Sq.Mtr.) 283,004 287,850 Dyeing and Finishing Production capacity for 3 shifts per day for 1,095 shifts (2016: 1,098 shifts) (Mtr.) 54,000 54,000 Actual production on 3 shifts per day for 1,095 shifts (2016: 1,098 shifts) (Mtr.) 48,364 50,986 Power Plant Generation capacity (MWH) 799 775 Actual generation (MWH) 396 383 Processing, Stitching and Apparel The plant capacity of these divisions are indeterminable due to multi product plants involving
varying processes of manufacturing and run length of order lots.
42.1 Reason for low production Under utilization of available capacity for spinning, weaving, dyeing and finishing is mainly
due to normal maintenance. Actual power generation in comparison to installed is low due to periodical, scheduled and unscheduled maintenance and low demand.
43 FINANCIAL RISK MANAGEMENT
43.1 Financial risk factors The Company’s activities expose it to a variety of financial risks: market risk (including
currency risk, other price risk and interest rate risk), credit risk and liquidity risk. The Company’s overall risk management programme focuses on the unpredictability of financial markets and seeks to minimize potential adverse effects on the Company’s financial performance. The Company uses derivative financial instruments to hedge certain risk exposures.
Notes to the Financial Statements For the year ended June 30, 2017
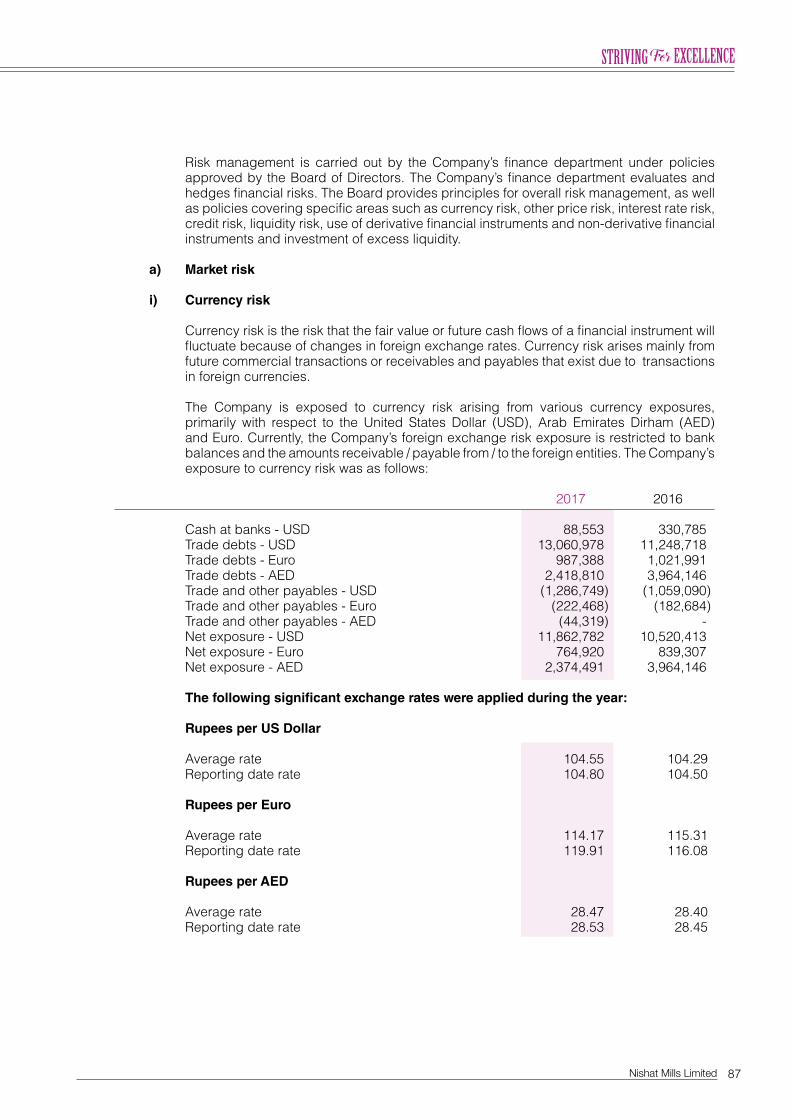
87Nishat Mills Limited
Risk management is carried out by the Company’s finance department under policies approved by the Board of Directors. The Company’s finance department evaluates and hedges financial risks. The Board provides principles for overall risk management, as well as policies covering specific areas such as currency risk, other price risk, interest rate risk, credit risk, liquidity risk, use of derivative financial instruments and non-derivative financial instruments and investment of excess liquidity.
a) Market risk i) Currency risk Currency risk is the risk that the fair value or future cash flows of a financial instrument will
fluctuate because of changes in foreign exchange rates. Currency risk arises mainly from future commercial transactions or receivables and payables that exist due to transactions in foreign currencies.
The Company is exposed to currency risk arising from various currency exposures,
primarily with respect to the United States Dollar (USD), Arab Emirates Dirham (AED) and Euro. Currently, the Company’s foreign exchange risk exposure is restricted to bank balances and the amounts receivable / payable from / to the foreign entities. The Company’s exposure to currency risk was as follows:
2017 2016 Cash at banks - USD 88,553 330,785 Trade debts - USD 13,060,978 11,248,718 Trade debts - Euro 987,388 1,021,991 Trade debts - AED 2,418,810 3,964,146 Trade and other payables - USD (1,286,749) (1,059,090) Trade and other payables - Euro (222,468) (182,684) Trade and other payables - AED (44,319) - Net exposure - USD 11,862,782 10,520,413 Net exposure - Euro 764,920 839,307 Net exposure - AED 2,374,491 3,964,146 The following significant exchange rates were applied during the year:
Rupees per US Dollar Average rate 104.55 104.29 Reporting date rate 104.80 104.50 Rupees per Euro Average rate 114.17 115.31 Reporting date rate 119.91 116.08 Rupees per AED Average rate 28.47 28.40 Reporting date rate 28.53 28.45
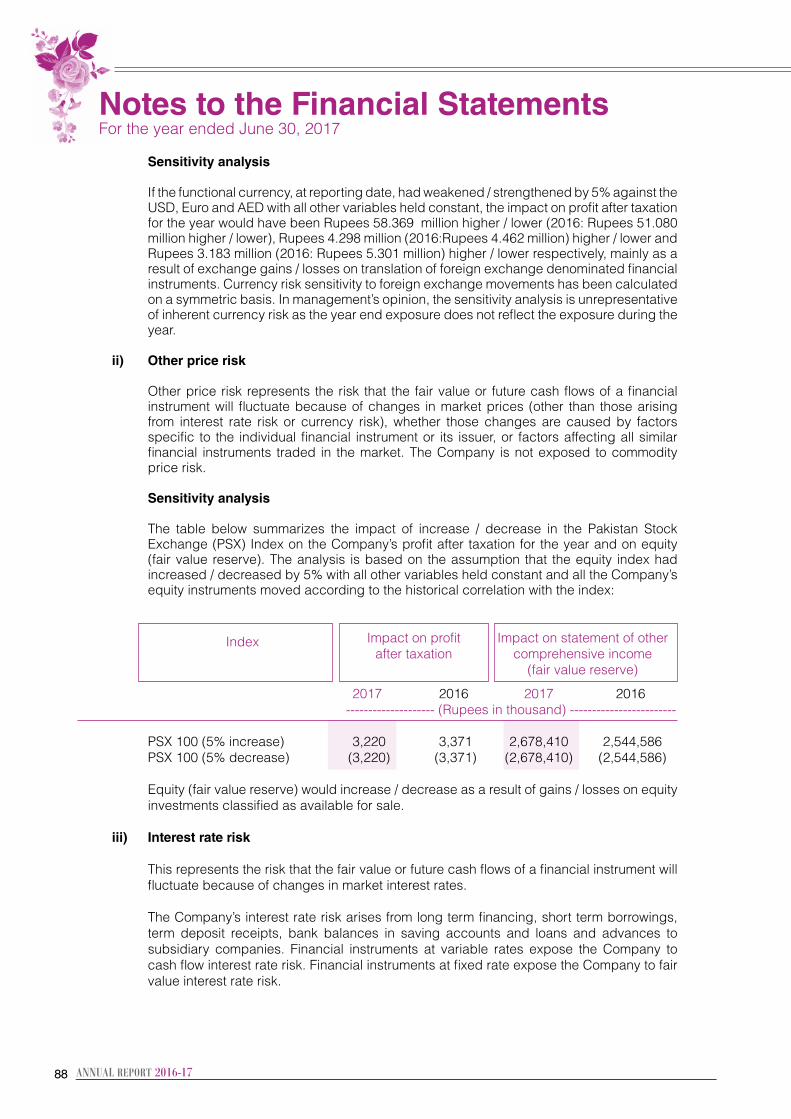
8888
Sensitivity analysis If the functional currency, at reporting date, had weakened / strengthened by 5% against the
USD, Euro and AED with all other variables held constant, the impact on profit after taxation for the year would have been Rupees 58.369 million higher / lower (2016: Rupees 51.080 million higher / lower), Rupees 4.298 million (2016:Rupees 4.462 million) higher / lower and Rupees 3.183 million (2016: Rupees 5.301 million) higher / lower respectively, mainly as a result of exchange gains / losses on translation of foreign exchange denominated financial instruments. Currency risk sensitivity to foreign exchange movements has been calculated on a symmetric basis. In management’s opinion, the sensitivity analysis is unrepresentative of inherent currency risk as the year end exposure does not reflect the exposure during the year.
ii) Other price risk Other price risk represents the risk that the fair value or future cash flows of a financial
instrument will fluctuate because of changes in market prices (other than those arising from interest rate risk or currency risk), whether those changes are caused by factors specific to the individual financial instrument or its issuer, or factors affecting all similar financial instruments traded in the market. The Company is not exposed to commodity price risk.
Sensitivity analysis The table below summarizes the impact of increase / decrease in the Pakistan Stock
Exchange (PSX) Index on the Company’s profit after taxation for the year and on equity (fair value reserve). The analysis is based on the assumption that the equity index had increased / decreased by 5% with all other variables held constant and all the Company’s equity instruments moved according to the historical correlation with the index:
Index Impact on profit Impact on statement of other after taxation comprehensive income (fair value reserve)
2017 2016 2017 2016 -------------------- (Rupees in thousand) ------------------------ PSX 100 (5% increase) 3,220 3,371 2,678,410 2,544,586 PSX 100 (5% decrease) (3,220) (3,371) (2,678,410) (2,544,586)
Equity (fair value reserve) would increase / decrease as a result of gains / losses on equity investments classified as available for sale.
iii) Interest rate risk
This represents the risk that the fair value or future cash flows of a financial instrument will fluctuate because of changes in market interest rates.
The Company’s interest rate risk arises from long term financing, short term borrowings,
term deposit receipts, bank balances in saving accounts and loans and advances to subsidiary companies. Financial instruments at variable rates expose the Company to cash flow interest rate risk. Financial instruments at fixed rate expose the Company to fair value interest rate risk.
Notes to the Financial Statements For the year ended June 30, 2017
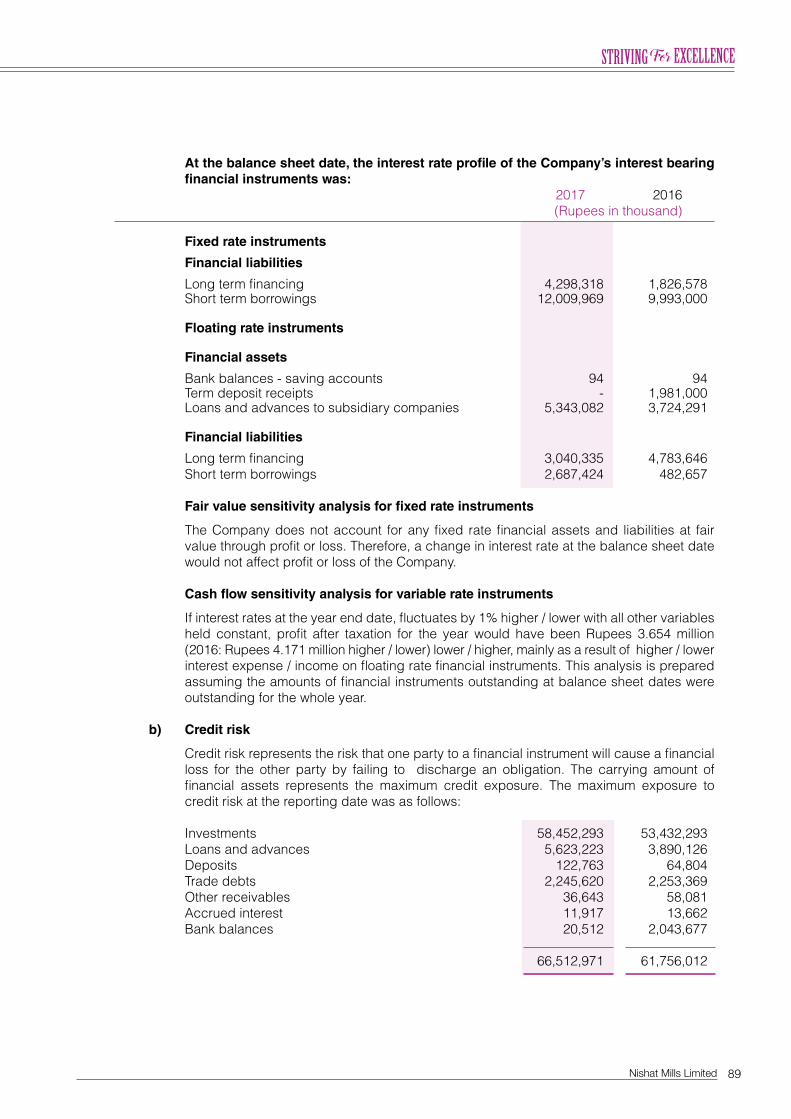
89Nishat Mills Limited
At the balance sheet date, the interest rate profile of the Company’s interest bearing financial instruments was:
2017 2016 (Rupees in thousand)
Fixed rate instruments Financial liabilities Long term financing 4,298,318 1,826,578 Short term borrowings 12,009,969 9,993,000 Floating rate instruments Financial assets Bank balances - saving accounts 94 94 Term deposit receipts - 1,981,000 Loans and advances to subsidiary companies 5,343,082 3,724,291 Financial liabilities Long term financing 3,040,335 4,783,646 Short term borrowings 2,687,424 482,657
Fair value sensitivity analysis for fixed rate instruments The Company does not account for any fixed rate financial assets and liabilities at fair
value through profit or loss. Therefore, a change in interest rate at the balance sheet date would not affect profit or loss of the Company.
Cash flow sensitivity analysis for variable rate instruments If interest rates at the year end date, fluctuates by 1% higher / lower with all other variables
held constant, profit after taxation for the year would have been Rupees 3.654 million (2016: Rupees 4.171 million higher / lower) lower / higher, mainly as a result of higher / lower interest expense / income on floating rate financial instruments. This analysis is prepared assuming the amounts of financial instruments outstanding at balance sheet dates were outstanding for the whole year.
b) Credit risk Credit risk represents the risk that one party to a financial instrument will cause a financial
loss for the other party by failing to discharge an obligation. The carrying amount of financial assets represents the maximum credit exposure. The maximum exposure to credit risk at the reporting date was as follows:
Investments 58,452,293 53,432,293 Loans and advances 5,623,223 3,890,126 Deposits 122,763 64,804 Trade debts 2,245,620 2,253,369 Other receivables 36,643 58,081 Accrued interest 11,917 13,662 Bank balances 20,512 2,043,677
66,512,971 61,756,012
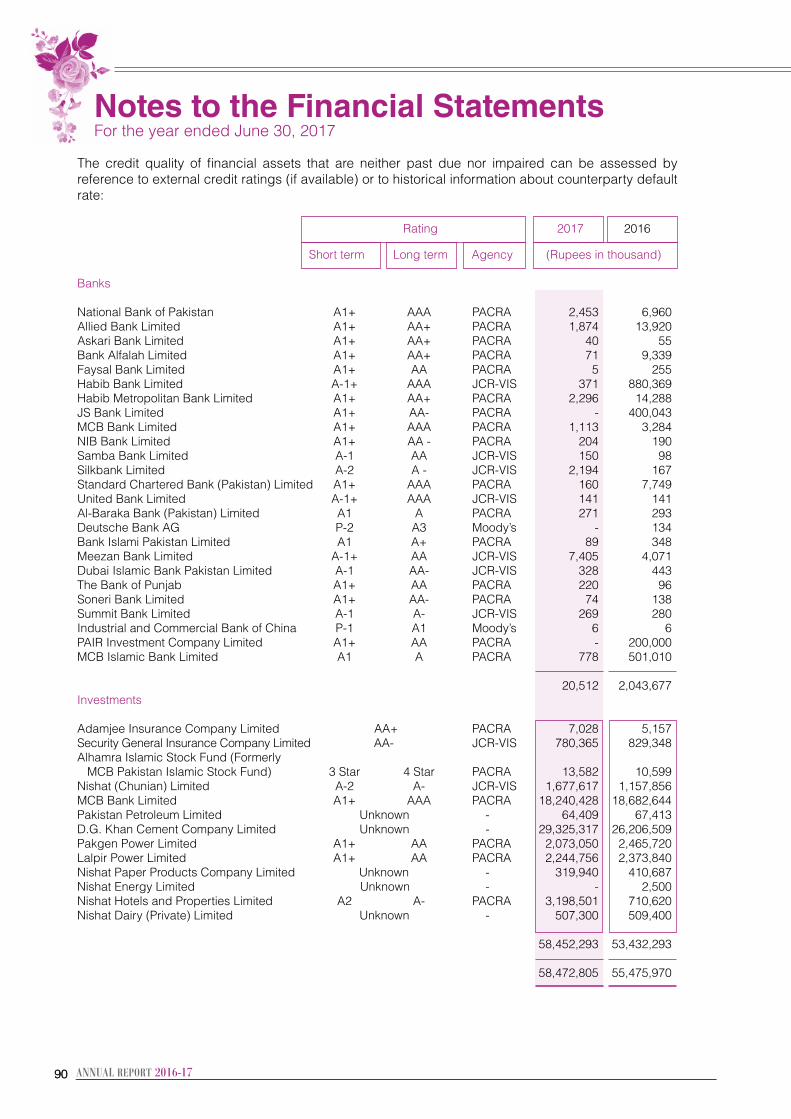
9090
The credit quality of financial assets that are neither past due nor impaired can be assessed by reference to external credit ratings (if available) or to historical information about counterparty default rate:
Rating 2017 2016
Short term Long term Agency (Rupees in thousand)
Banks National Bank of Pakistan A1+ AAA PACRA 2,453 6,960 Allied Bank Limited A1+ AA+ PACRA 1,874 13,920 Askari Bank Limited A1+ AA+ PACRA 40 55 Bank Alfalah Limited A1+ AA+ PACRA 71 9,339 Faysal Bank Limited A1+ AA PACRA 5 255 Habib Bank Limited A-1+ AAA JCR-VIS 371 880,369 Habib Metropolitan Bank Limited A1+ AA+ PACRA 2,296 14,288 JS Bank Limited A1+ AA- PACRA - 400,043 MCB Bank Limited A1+ AAA PACRA 1,113 3,284 NIB Bank Limited A1+ AA - PACRA 204 190 Samba Bank Limited A-1 AA JCR-VIS 150 98 Silkbank Limited A-2 A - JCR-VIS 2,194 167 Standard Chartered Bank (Pakistan) Limited A1+ AAA PACRA 160 7,749 United Bank Limited A-1+ AAA JCR-VIS 141 141 Al-Baraka Bank (Pakistan) Limited A1 A PACRA 271 293 Deutsche Bank AG P-2 A3 Moody’s - 134 Bank Islami Pakistan Limited A1 A+ PACRA 89 348 Meezan Bank Limited A-1+ AA JCR-VIS 7,405 4,071 Dubai Islamic Bank Pakistan Limited A-1 AA- JCR-VIS 328 443 The Bank of Punjab A1+ AA PACRA 220 96 Soneri Bank Limited A1+ AA- PACRA 74 138 Summit Bank Limited A-1 A- JCR-VIS 269 280 Industrial and Commercial Bank of China P-1 A1 Moody’s 6 6 PAIR Investment Company Limited A1+ AA PACRA - 200,000 MCB Islamic Bank Limited A1 A PACRA 778 501,010
20,512 2,043,677 Investments Adamjee Insurance Company Limited AA+ PACRA 7,028 5,157 Security General Insurance Company Limited AA- JCR-VIS 780,365 829,348 Alhamra Islamic Stock Fund (Formerly MCB Pakistan Islamic Stock Fund) 3 Star 4 Star PACRA 13,582 10,599 Nishat (Chunian) Limited A-2 A- JCR-VIS 1,677,617 1,157,856 MCB Bank Limited A1+ AAA PACRA 18,240,428 18,682,644 Pakistan Petroleum Limited Unknown - 64,409 67,413 D.G. Khan Cement Company Limited Unknown - 29,325,317 26,206,509 Pakgen Power Limited A1+ AA PACRA 2,073,050 2,465,720 Lalpir Power Limited A1+ AA PACRA 2,244,756 2,373,840 Nishat Paper Products Company Limited Unknown - 319,940 410,687 Nishat Energy Limited Unknown - - 2,500 Nishat Hotels and Properties Limited A2 A- PACRA 3,198,501 710,620 Nishat Dairy (Private) Limited Unknown - 507,300 509,400
58,452,293 53,432,293
58,472,805 55,475,970
Notes to the Financial Statements For the year ended June 30, 2017
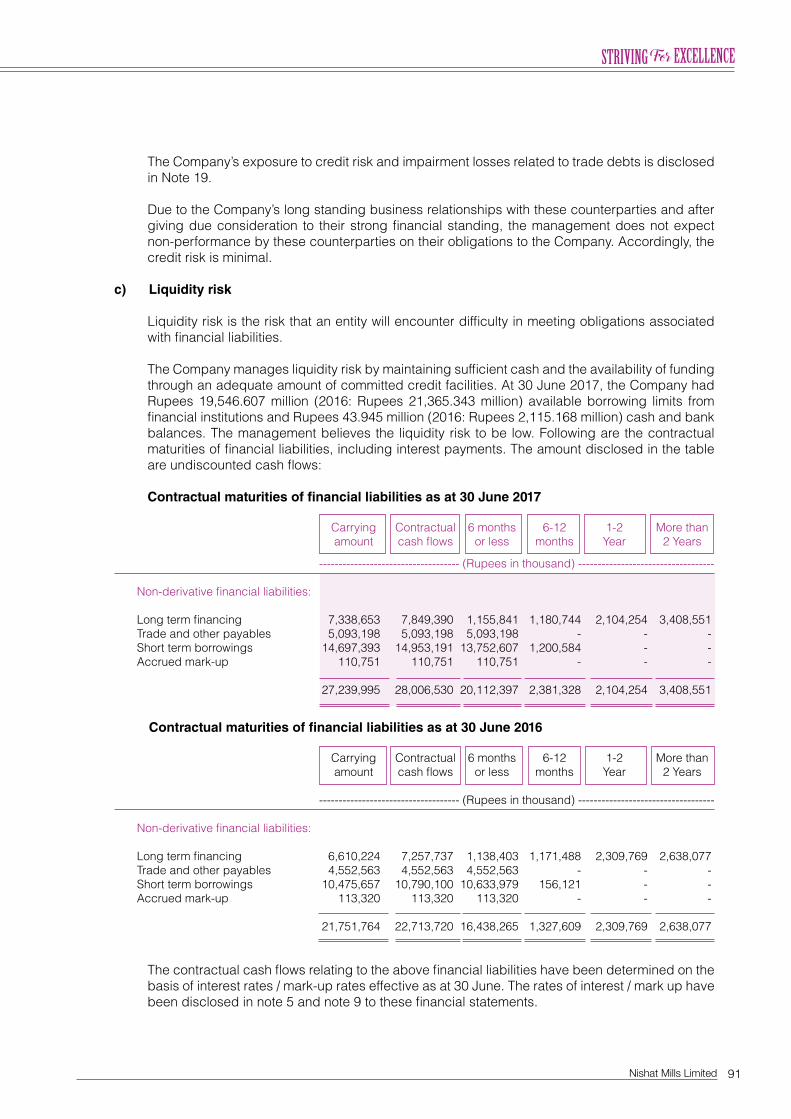
91Nishat Mills Limited
The Company’s exposure to credit risk and impairment losses related to trade debts is disclosed in Note 19.
Due to the Company’s long standing business relationships with these counterparties and after
giving due consideration to their strong financial standing, the management does not expect non-performance by these counterparties on their obligations to the Company. Accordingly, the credit risk is minimal.
c) Liquidity risk Liquidity risk is the risk that an entity will encounter difficulty in meeting obligations associated
with financial liabilities. The Company manages liquidity risk by maintaining sufficient cash and the availability of funding
through an adequate amount of committed credit facilities. At 30 June 2017, the Company had Rupees 19,546.607 million (2016: Rupees 21,365.343 million) available borrowing limits from financial institutions and Rupees 43.945 million (2016: Rupees 2,115.168 million) cash and bank balances. The management believes the liquidity risk to be low. Following are the contractual maturities of financial liabilities, including interest payments. The amount disclosed in the table are undiscounted cash flows:
Contractual maturities of financial liabilities as at 30 June 2017
Carrying Contractual 6 months 6-12 1-2 More than amount cash flows or less months Year 2 Years
------------------------------------ (Rupees in thousand) -----------------------------------
Non-derivative financial liabilities: Long term financing 7,338,653 7,849,390 1,155,841 1,180,744 2,104,254 3,408,551 Trade and other payables 5,093,198 5,093,198 5,093,198 - - - Short term borrowings 14,697,393 14,953,191 13,752,607 1,200,584 - - Accrued mark-up 110,751 110,751 110,751 - - - 27,239,995 28,006,530 20,112,397 2,381,328 2,104,254 3,408,551
Contractual maturities of financial liabilities as at 30 June 2016
Carrying Contractual 6 months 6-12 1-2 More than amount cash flows or less months Year 2 Years
------------------------------------ (Rupees in thousand) -----------------------------------
Non-derivative financial liabilities: Long term financing 6,610,224 7,257,737 1,138,403 1,171,488 2,309,769 2,638,077 Trade and other payables 4,552,563 4,552,563 4,552,563 - - - Short term borrowings 10,475,657 10,790,100 10,633,979 156,121 - - Accrued mark-up 113,320 113,320 113,320 - - -
21,751,764 22,713,720 16,438,265 1,327,609 2,309,769 2,638,077
The contractual cash flows relating to the above financial liabilities have been determined on the basis of interest rates / mark-up rates effective as at 30 June. The rates of interest / mark up have been disclosed in note 5 and note 9 to these financial statements.
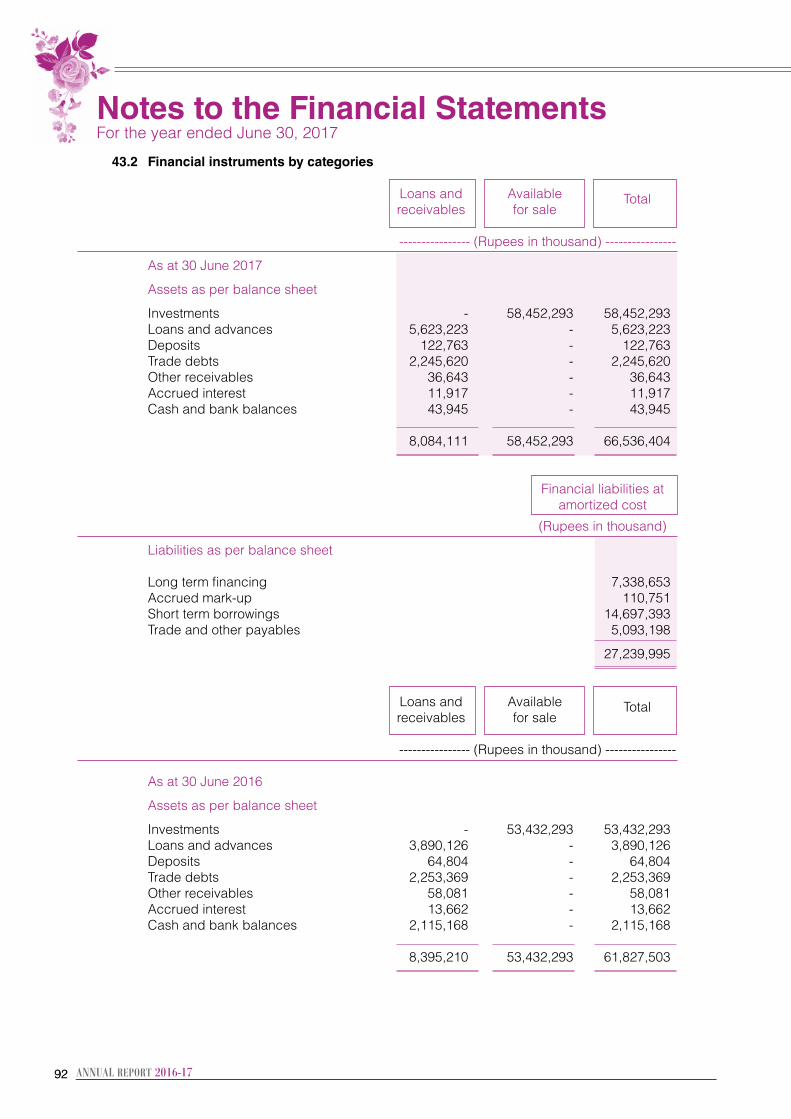
9292
43.2 Financial instruments by categories Loans and Available Total receivables for sale ---------------- (Rupees in thousand) ----------------
As at 30 June 2017 Assets as per balance sheet
Investments - 58,452,293 58,452,293 Loans and advances 5,623,223 - 5,623,223 Deposits 122,763 - 122,763 Trade debts 2,245,620 - 2,245,620 Other receivables 36,643 - 36,643 Accrued interest 11,917 - 11,917 Cash and bank balances 43,945 - 43,945
8,084,111 58,452,293 66,536,404
Financial liabilities at amortized cost
(Rupees in thousand) Liabilities as per balance sheet Long term financing 7,338,653 Accrued mark-up 110,751 Short term borrowings 14,697,393 Trade and other payables 5,093,198 27,239,995
Loans and Available Total receivables for sale ---------------- (Rupees in thousand) ----------------
As at 30 June 2016 Assets as per balance sheet Investments - 53,432,293 53,432,293 Loans and advances 3,890,126 - 3,890,126 Deposits 64,804 - 64,804 Trade debts 2,253,369 - 2,253,369 Other receivables 58,081 - 58,081 Accrued interest 13,662 - 13,662 Cash and bank balances 2,115,168 - 2,115,168
8,395,210 53,432,293 61,827,503
Notes to the Financial Statements For the year ended June 30, 2017
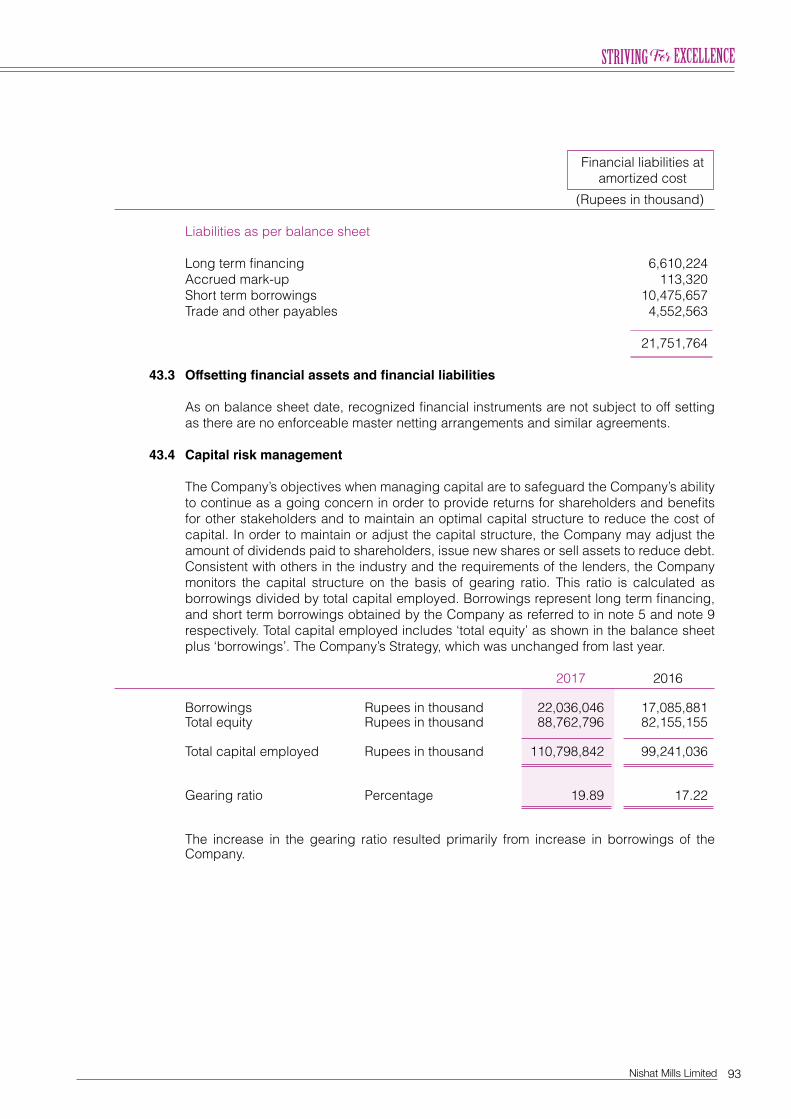
93Nishat Mills Limited
Financial liabilities at amortized cost
(Rupees in thousand)
Liabilities as per balance sheet Long term financing 6,610,224 Accrued mark-up 113,320 Short term borrowings 10,475,657 Trade and other payables 4,552,563 21,751,764
43.3 Offsetting financial assets and financial liabilities As on balance sheet date, recognized financial instruments are not subject to off setting
as there are no enforceable master netting arrangements and similar agreements. 43.4 Capital risk management The Company’s objectives when managing capital are to safeguard the Company’s ability
to continue as a going concern in order to provide returns for shareholders and benefits for other stakeholders and to maintain an optimal capital structure to reduce the cost of capital. In order to maintain or adjust the capital structure, the Company may adjust the amount of dividends paid to shareholders, issue new shares or sell assets to reduce debt. Consistent with others in the industry and the requirements of the lenders, the Company monitors the capital structure on the basis of gearing ratio. This ratio is calculated as borrowings divided by total capital employed. Borrowings represent long term financing, and short term borrowings obtained by the Company as referred to in note 5 and note 9 respectively. Total capital employed includes ‘total equity’ as shown in the balance sheet plus ‘borrowings’. The Company’s Strategy, which was unchanged from last year.
2017 2016
Borrowings Rupees in thousand 22,036,046 17,085,881 Total equity Rupees in thousand 88,762,796 82,155,155 Total capital employed Rupees in thousand 110,798,842 99,241,036 Gearing ratio Percentage 19.89 17.22
The increase in the gearing ratio resulted primarily from increase in borrowings of the Company.
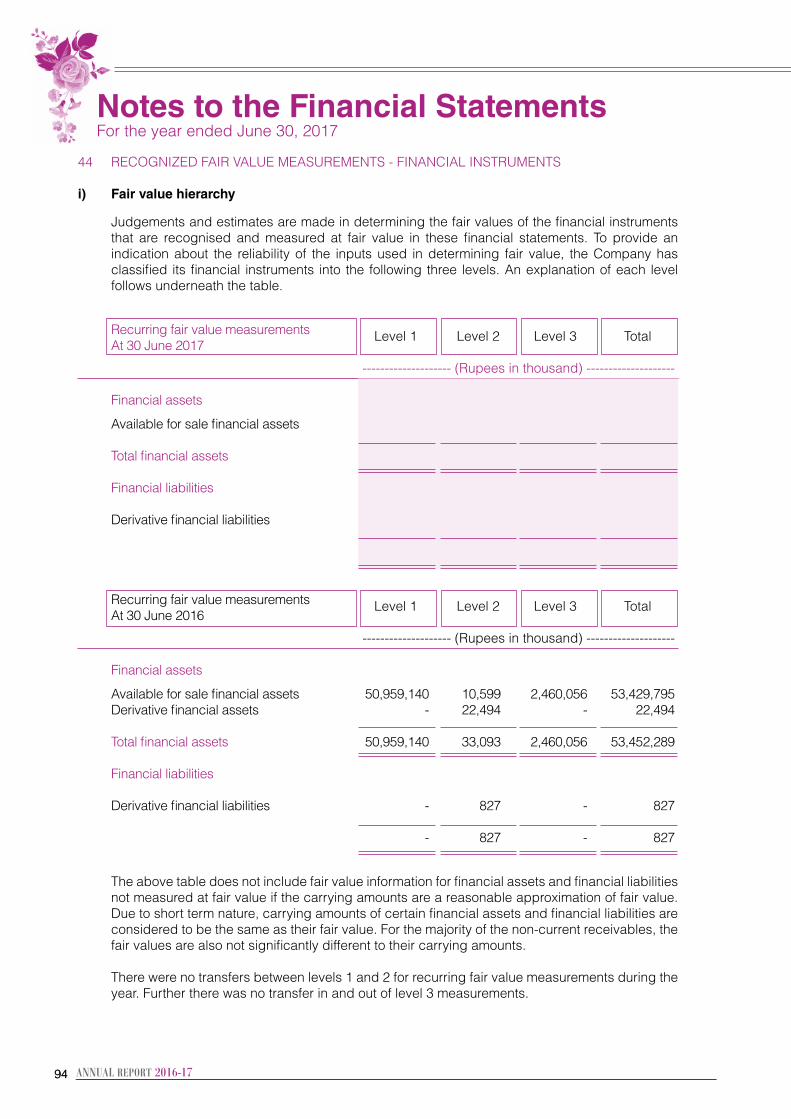
9494
44 RECOGNIZED FAIR VALUE MEASUREMENTS - FINANCIAL INSTRUMENTS i) Fair value hierarchy
Judgements and estimates are made in determining the fair values of the financial instruments that are recognised and measured at fair value in these financial statements. To provide an indication about the reliability of the inputs used in determining fair value, the Company has classified its financial instruments into the following three levels. An explanation of each level follows underneath the table.
Recurring fair value measurements Level 1 Level 2 Level 3 Total At 30 June 2017
-------------------- (Rupees in thousand) -------------------- Financial assets Available for sale financial assets 53,632,605 13,582 4,806,106 58,452,293 Total financial assets 53,632,605 13,582 4,806,106 58,452,293 Financial liabilities Derivative financial liabilities - 27,536 - 27,536 - 27,536 - 27,536
Recurring fair value measurements Level 1 Level 2 Level 3 Total At 30 June 2016
-------------------- (Rupees in thousand) --------------------
Financial assets Available for sale financial assets 50,959,140 10,599 2,460,056 53,429,795 Derivative financial assets - 22,494 - 22,494 Total financial assets 50,959,140 33,093 2,460,056 53,452,289 Financial liabilities Derivative financial liabilities - 827 - 827 - 827 - 827
The above table does not include fair value information for financial assets and financial liabilities not measured at fair value if the carrying amounts are a reasonable approximation of fair value. Due to short term nature, carrying amounts of certain financial assets and financial liabilities are considered to be the same as their fair value. For the majority of the non-current receivables, the fair values are also not significantly different to their carrying amounts.
There were no transfers between levels 1 and 2 for recurring fair value measurements during the
year. Further there was no transfer in and out of level 3 measurements.
Notes to the Financial Statements For the year ended June 30, 2017
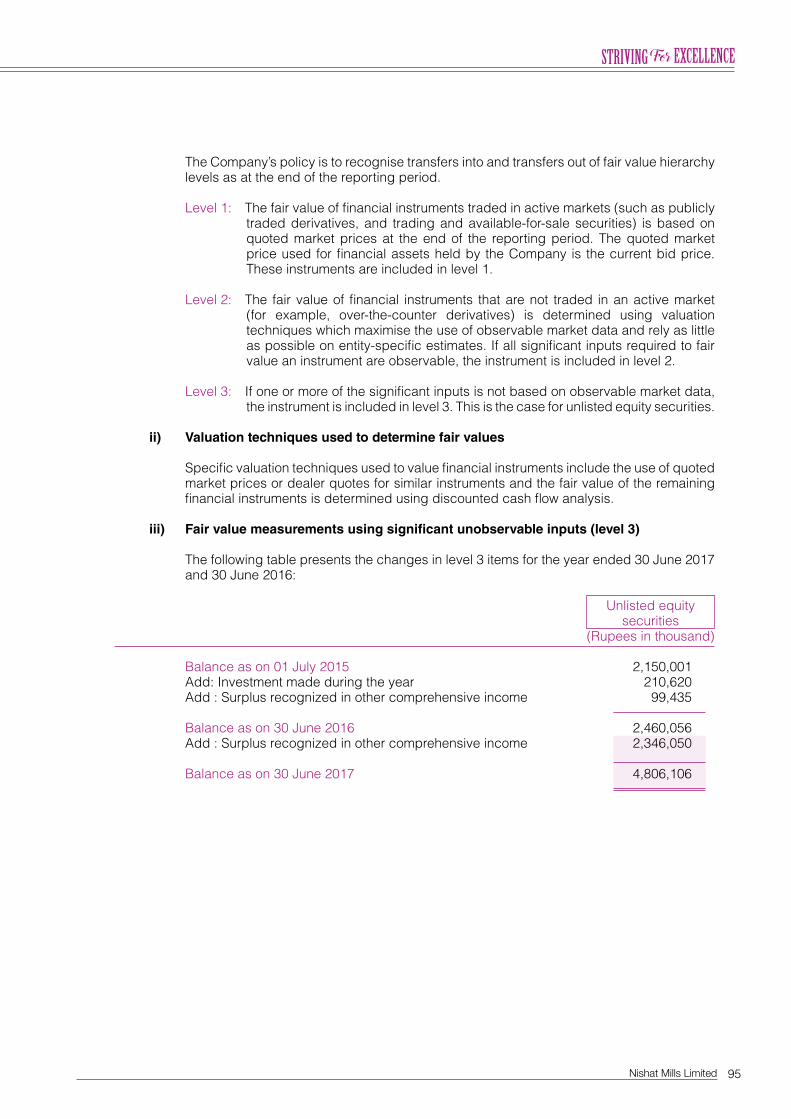
95Nishat Mills Limited
The Company’s policy is to recognise transfers into and transfers out of fair value hierarchy levels as at the end of the reporting period.
Level 1: The fair value of financial instruments traded in active markets (such as publicly
traded derivatives, and trading and available-for-sale securities) is based on quoted market prices at the end of the reporting period. The quoted market price used for financial assets held by the Company is the current bid price. These instruments are included in level 1.
Level 2: The fair value of financial instruments that are not traded in an active market
(for example, over-the-counter derivatives) is determined using valuation techniques which maximise the use of observable market data and rely as little as possible on entity-specific estimates. If all significant inputs required to fair value an instrument are observable, the instrument is included in level 2.
Level 3: If one or more of the significant inputs is not based on observable market data,
the instrument is included in level 3. This is the case for unlisted equity securities. ii) Valuation techniques used to determine fair values
Specific valuation techniques used to value financial instruments include the use of quoted
market prices or dealer quotes for similar instruments and the fair value of the remaining financial instruments is determined using discounted cash flow analysis.
iii) Fair value measurements using significant unobservable inputs (level 3)
The following table presents the changes in level 3 items for the year ended 30 June 2017 and 30 June 2016:
Unlisted equity securities (Rupees in thousand) Balance as on 01 July 2015 2,150,001 Add: Investment made during the year 210,620 Add : Surplus recognized in other comprehensive income 99,435
Balance as on 30 June 2016 2,460,056 Add : Surplus recognized in other comprehensive income 2,346,050
Balance as on 30 June 2017 4,806,106
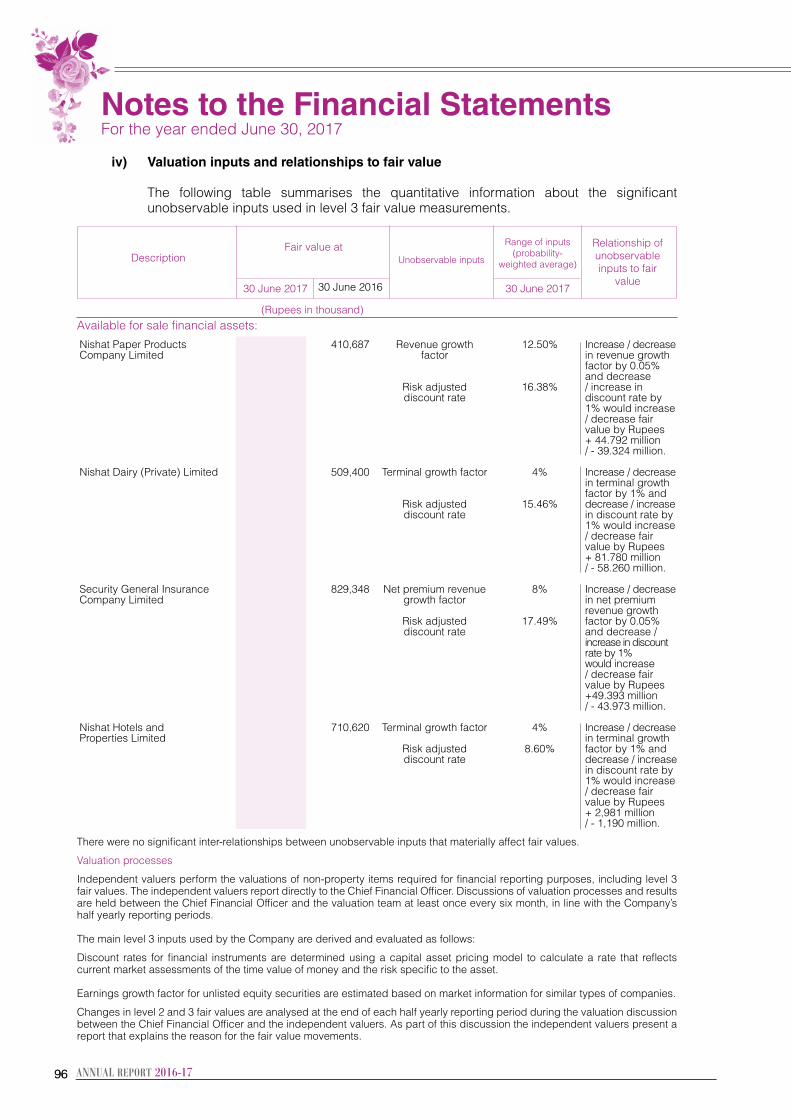
9696
iv) Valuation inputs and relationships to fair value The following table summarises the quantitative information about the significant
unobservable inputs used in level 3 fair value measurements.
(Rupees in thousand)Available for sale financial assets:
Nishat Paper Products 319,940 410,687 Revenue growth 12.50% Increase / decrease Company Limited factor in revenue growth
factor by 0.05% and decrease
Risk adjusted 16.38% / increase in discount rate discount rate by
1% would increase / decrease fair value by Rupees
+ 44.792 million / - 39.324 million. Nishat Dairy (Private) Limited 507,300 509,400 Terminal growth factor 4% Increase / decrease
in terminal growth factor by 1% and
Risk adjusted 15.46% decrease / increase discount rate in discount rate by
1% would increase / decrease fair value by Rupees
+ 81.780 million / - 58.260 million. Security General Insurance 780,365 829,348 Net premium revenue 8% Increase / decreaseCompany Limited growth factor in net premium
revenue growth Risk adjusted 17.49% factor by 0.05% discount rate and decrease /
increase in discount rate by 1% would increase / decrease fair value by Rupees +49.393 million
/ - 43.973 million. Nishat Hotels and 3,198,501 710,620 Terminal growth factor 4% Increase / decrease Properties Limited in terminal growth Risk adjusted 8.60% factor by 1% and discount rate decrease / increase
in discount rate by 1% would increase / decrease fair value by Rupees
+ 2,981 million / - 1,190 million.
There were no significant inter-relationships between unobservable inputs that materially affect fair values.
Valuation processes
Independent valuers perform the valuations of non-property items required for financial reporting purposes, including level 3 fair values. The independent valuers report directly to the Chief Financial Officer. Discussions of valuation processes and results are held between the Chief Financial Officer and the valuation team at least once every six month, in line with the Company’s half yearly reporting periods.
The main level 3 inputs used by the Company are derived and evaluated as follows:
Discount rates for financial instruments are determined using a capital asset pricing model to calculate a rate that reflects current market assessments of the time value of money and the risk specific to the asset.
Earnings growth factor for unlisted equity securities are estimated based on market information for similar types of companies.
Changes in level 2 and 3 fair values are analysed at the end of each half yearly reporting period during the valuation discussion between the Chief Financial Officer and the independent valuers. As part of this discussion the independent valuers present a report that explains the reason for the fair value movements.
DescriptionFair value at
Unobservable inputs
Range of inputs (probability-
weighted average)
Relationship of unobservable inputs to fair
value30 June 2017 30 June 201730 June 2016
Notes to the Financial Statements For the year ended June 30, 2017
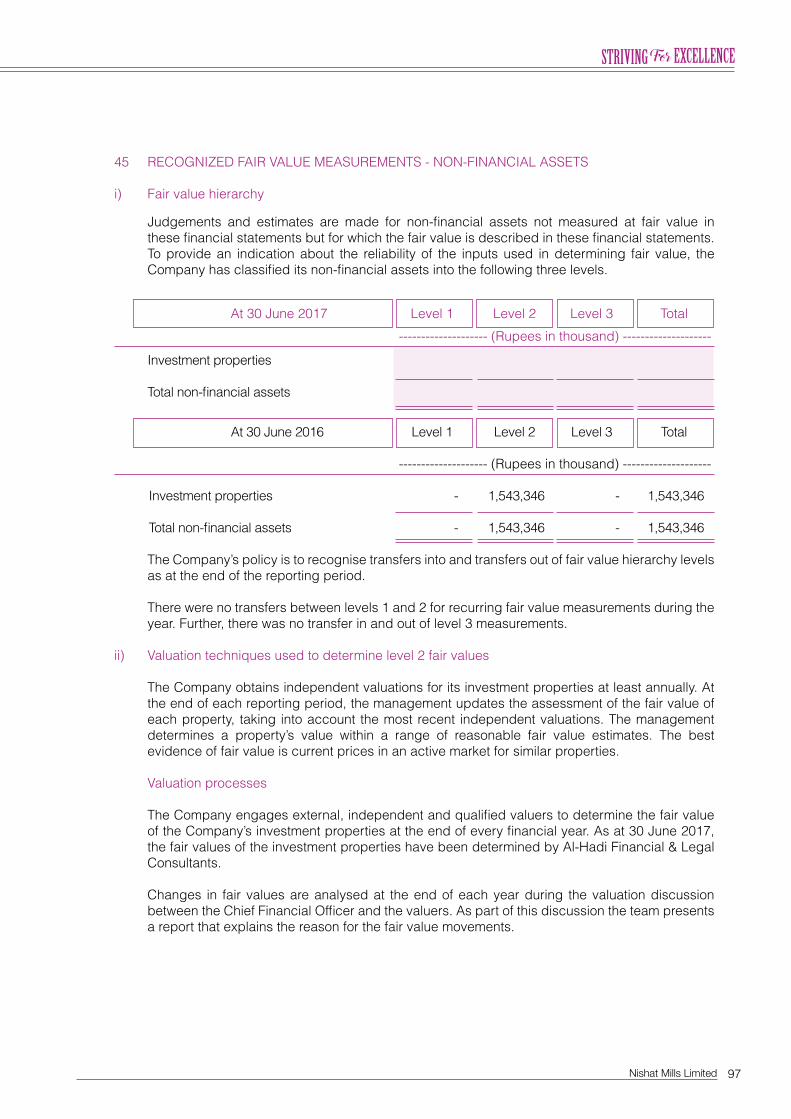
97Nishat Mills Limited
45 RECOGNIZED FAIR VALUE MEASUREMENTS - NON-FINANCIAL ASSETS i) Fair value hierarchy
Judgements and estimates are made for non-financial assets not measured at fair value in these financial statements but for which the fair value is described in these financial statements. To provide an indication about the reliability of the inputs used in determining fair value, the Company has classified its non-financial assets into the following three levels.
At 30 June 2017 Level 1 Level 2 Level 3 Total
-------------------- (Rupees in thousand) -------------------- Investment properties - 1,688,261 - 1,688,261 Total non-financial assets - 1,688,261 - 1,688,261
At 30 June 2016 Level 1 Level 2 Level 3 Total
-------------------- (Rupees in thousand) -------------------- Investment properties - 1,543,346 - 1,543,346 Total non-financial assets - 1,543,346 - 1,543,346
The Company’s policy is to recognise transfers into and transfers out of fair value hierarchy levels as at the end of the reporting period.
There were no transfers between levels 1 and 2 for recurring fair value measurements during the
year. Further, there was no transfer in and out of level 3 measurements. ii) Valuation techniques used to determine level 2 fair values The Company obtains independent valuations for its investment properties at least annually. At
the end of each reporting period, the management updates the assessment of the fair value of each property, taking into account the most recent independent valuations. The management determines a property’s value within a range of reasonable fair value estimates. The best evidence of fair value is current prices in an active market for similar properties.
Valuation processes The Company engages external, independent and qualified valuers to determine the fair value
of the Company’s investment properties at the end of every financial year. As at 30 June 2017, the fair values of the investment properties have been determined by Al-Hadi Financial & Legal Consultants.
Changes in fair values are analysed at the end of each year during the valuation discussion
between the Chief Financial Officer and the valuers. As part of this discussion the team presents a report that explains the reason for the fair value movements.
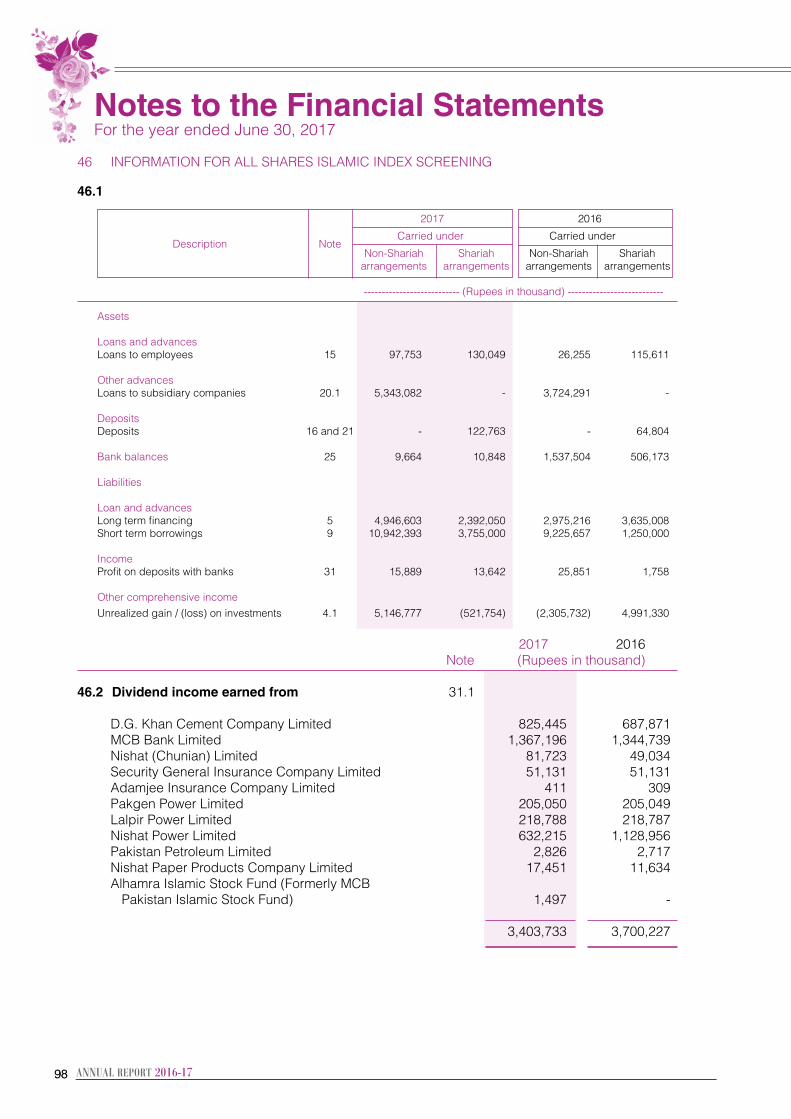
9898
46 INFORMATION FOR ALL SHARES ISLAMIC INDEX SCREENING
46.1
2017 2016
Description Note
Carried under Carried under
Non-Shariah Shariah Non-Shariah Shariah arrangements arrangements arrangements arrangements
--------------------------- (Rupees in thousand) ---------------------------
Assets Loans and advances Loans to employees 15 97,753 130,049 26,255 115,611 Other advances Loans to subsidiary companies 20.1 5,343,082 - 3,724,291 - Deposits Deposits 16 and 21 - 122,763 - 64,804 Bank balances 25 9,664 10,848 1,537,504 506,173 Liabilities Loan and advances Long term financing 5 4,946,603 2,392,050 2,975,216 3,635,008 Short term borrowings 9 10,942,393 3,755,000 9,225,657 1,250,000 Income Profit on deposits with banks 31 15,889 13,642 25,851 1,758 Other comprehensive income Unrealized gain / (loss) on investments 4.1 5,146,777 (521,754) (2,305,732) 4,991,330
2017 2016 Note (Rupees in thousand)
46.2 Dividend income earned from 31.1 D.G. Khan Cement Company Limited 825,445 687,871 MCB Bank Limited 1,367,196 1,344,739 Nishat (Chunian) Limited 81,723 49,034 Security General Insurance Company Limited 51,131 51,131 Adamjee Insurance Company Limited 411 309 Pakgen Power Limited 205,050 205,049 Lalpir Power Limited 218,788 218,787 Nishat Power Limited 632,215 1,128,956 Pakistan Petroleum Limited 2,826 2,717 Nishat Paper Products Company Limited 17,451 11,634 Alhamra Islamic Stock Fund (Formerly MCB Pakistan Islamic Stock Fund) 1,497 - 3,403,733 3,700,227
Notes to the Financial Statements For the year ended June 30, 2017
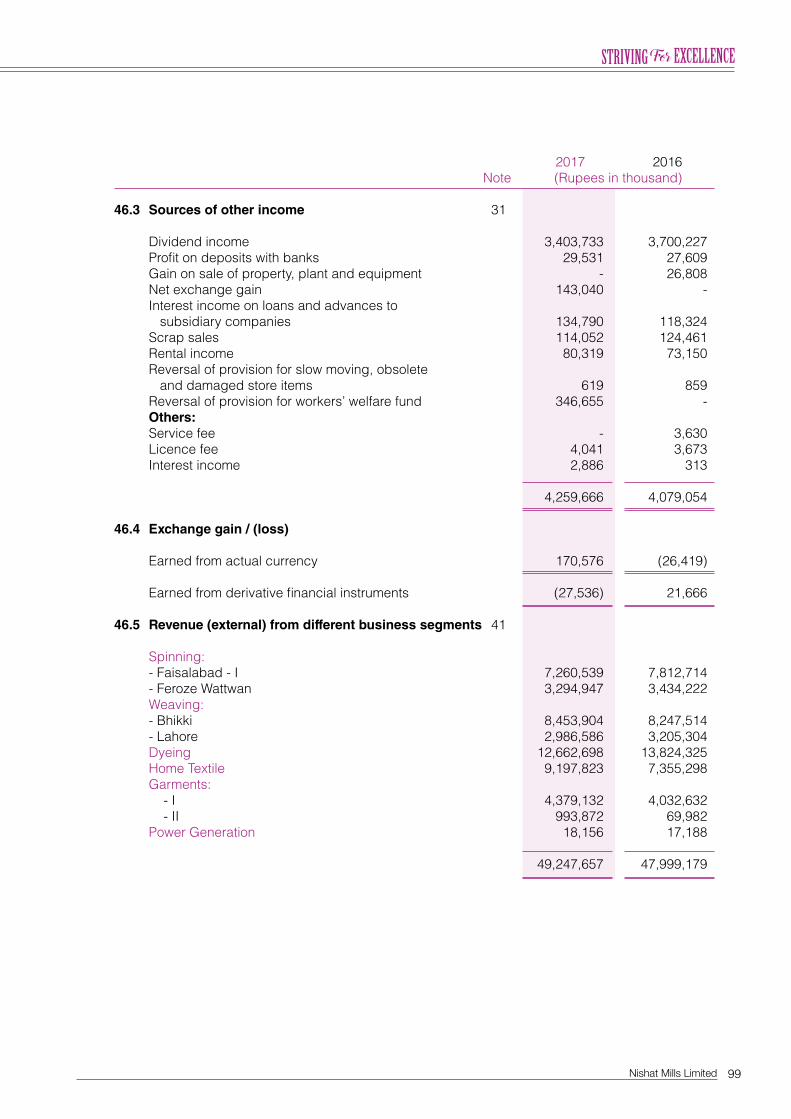
99Nishat Mills Limited
2017 2016 Note (Rupees in thousand)
46.3 Sources of other income 31 Dividend income 3,403,733 3,700,227 Profit on deposits with banks 29,531 27,609 Gain on sale of property, plant and equipment - 26,808 Net exchange gain 143,040 - Interest income on loans and advances to subsidiary companies 134,790 118,324 Scrap sales 114,052 124,461 Rental income 80,319 73,150 Reversal of provision for slow moving, obsolete and damaged store items 619 859 Reversal of provision for workers’ welfare fund 346,655 - Others: Service fee - 3,630 Licence fee 4,041 3,673 Interest income 2,886 313 4,259,666 4,079,054 46.4 Exchange gain / (loss) Earned from actual currency 170,576 (26,419)
Earned from derivative financial instruments (27,536) 21,666 46.5 Revenue (external) from different business segments 41 Spinning: - Faisalabad - I 7,260,539 7,812,714 - Feroze Wattwan 3,294,947 3,434,222 Weaving: - Bhikki 8,453,904 8,247,514 - Lahore 2,986,586 3,205,304 Dyeing 12,662,698 13,824,325 Home Textile 9,197,823 7,355,298 Garments: - I 4,379,132 4,032,632 - II 993,872 69,982 Power Generation 18,156 17,188
49,247,657 47,999,179
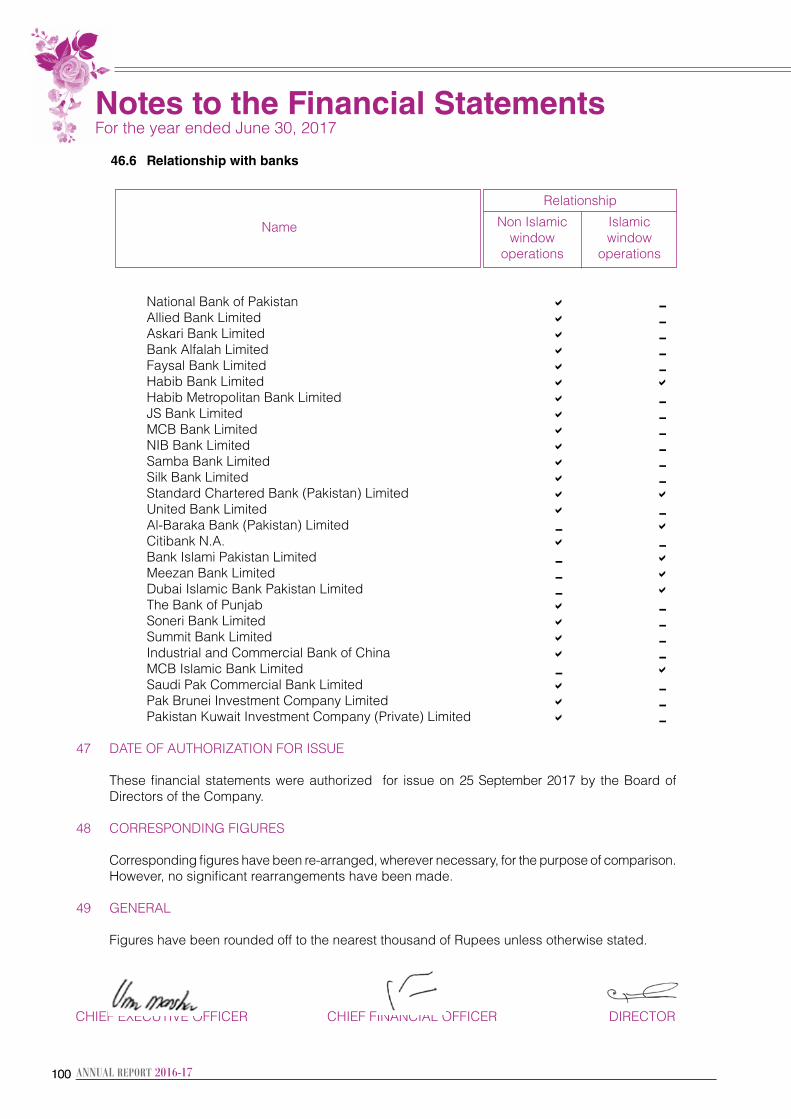
100100
46.6 Relationship with banks
Relationship
Name Non Islamic Islamic window window operations operations
National Bank of Pakistan a 0 Allied Bank Limited a 0 Askari Bank Limited a 0 Bank Alfalah Limited a 0 Faysal Bank Limited a 0 Habib Bank Limited a a Habib Metropolitan Bank Limited a 0 JS Bank Limited a 0 MCB Bank Limited a 0 NIB Bank Limited a 0 Samba Bank Limited a 0 Silk Bank Limited a 0 Standard Chartered Bank (Pakistan) Limited a a United Bank Limited a 0 Al-Baraka Bank (Pakistan) Limited 0 a Citibank N.A. a 0 Bank Islami Pakistan Limited 0 a Meezan Bank Limited 0 a Dubai Islamic Bank Pakistan Limited 0 a The Bank of Punjab a 0 Soneri Bank Limited a 0 Summit Bank Limited a 0 Industrial and Commercial Bank of China a 0 MCB Islamic Bank Limited 0 a Saudi Pak Commercial Bank Limited a 0 Pak Brunei Investment Company Limited a 0 Pakistan Kuwait Investment Company (Private) Limited a 0 47 DATE OF AUTHORIZATION FOR ISSUE These financial statements were authorized for issue on 25 September 2017 by the Board of
Directors of the Company. 48 CORRESPONDING FIGURES Corresponding figures have been re-arranged, wherever necessary, for the purpose of comparison.
However, no significant rearrangements have been made. 49 GENERAL Figures have been rounded off to the nearest thousand of Rupees unless otherwise stated.
Notes to the Financial Statements For the year ended June 30, 2017
CHIEF EXECUTIVE OFFICER CHIEF FINANCIAL OFFICER DIRECTOR
Consolidated Financial Statements of
Nishat Mills Limitedand its Subsidiaries
for the year ended June 30, 2017
102102
103Nishat Mills Limited and its Subsidiaries
The Directors are pleased to present their report together with the consolidated financial statements of Nishat Mills Limited (“the Holding Company”) and its Subsidiary Companies (together referred to as Group) for the year ended 30 June 2017. The consolidated results comprise of financial statements of Nishat Mills Limited, Nishat Power Limited, Nishat Linen (Private) Limited, Nishat Hospitality (Private) Limited, Nishat USA Inc., Nishat Linen Trading LLC, Nishat International FZE, Nishat Global China Company Limited, Nishat UK (Private) Limited, Nishat Commodities (Private) Limited, Lalpir Solar Power (Private) Limited, Concept Garments and Textile Trading FZE and Hyundai Nishat Motor (Private) Limited. The Holding Company has annexed its consolidated financial statements along with its separate financial statements, in accordance with the requirements of International Financial Reporting Standards and Companies Ordinance, 1984. The Directors’ Report, giving a commentary on the performance of Nishat Mills Limited for the year ended 30 June 2017 has been presented separately. It also includes a brief description of all the subsidiary companies of the Holding Company.
Clarification to Qualifications in Audit Report
In their Report to the Members, Auditors have stated that consolidated financial statements include un-audited figures pertaining to Nishat USA Incorporated, a wholly owned subsidiary of Nishat Mills Limited. This Subsidiary Company is incorporated under the Business Corporation Law of the State of New York. The governing law does not require audit of financial statements of the Subsidiary Company. Hence, we have used un-audited financial statements of the Subsidiary Company to prepare Consolidated Financial Statements.
Auditors have also informed to the members in their report that un-audited financial statements of Nishat Global China Company Limited (“the Chinese subsidiary”), a wholly owned subsidiary of Nishat International FZE which is a wholly owned subsidiary of Nishat Mills Limited, were included in the consolidated financial statements of the Company. As per the laws of China, the financial year of companies ends on 31 December, hence, the financial statements of the Chinese Subsidiary will be audited after the end of its financial year on 31 December 2017. Therefore, we have used un-audited financial statements to prepare consolidated financial statements of Nishat Mills Limited and its subsidiary companies for the year ended June 30, 2017.
The auditors’ report also stated that un-audited financial statements of Lalpir Solar Power (Private) Limited which is a wholly owned subsidiary of Nishat Power Limited were included in the consolidated financial statements. Audit of financial statements of Lalpir Solar Power (Private) Limited was in progress at the time of finalization of consolidated financial statements of Nishat Mills Limited and its subsidiaries which is reason why un-audited financial statements of Lalpir Solar Power (Private) Limited were used in consolidation.
The auditors’ report also stated that un-audited financial statements of Nishat Hotels and Properties Limited, an associated company, were used to account for under equity method. Audit of financial statements of Nishat Hotels and Properties Limited was in progress at the time of finalization of consolidated financial statements of Nishat Mills Limited and its subsidiaries which is reason why un-audited financial statements of Nishat Hotels and Properties Limited were used.
The auditors’ report to the members draws attention to Note 21.6 to the consolidated financial statements which refers to an amount of Rs. 816 million (2016: Rs. 816 million) relating to capacity purchase price, included in trade debts of Nishat Power Limited (subsidiary of Nishat Mills Limited), not acknowledged by National Transmission and Dispatch Company Limited (NTDCL). Further details are mentioned in note 21.6 of the annexed consolidated financial statements. Based on the advice of the subsidiary company’s legal counsel, Expert’s determination and Arbitration Awards, management of the Subsidiary Company feels that above amount is likely to be recovered by the Subsidiary Company. Consequently, no provision for the above mentioned amount has been made in the consolidated financial statements.
For and on behalf of the Board of Directors
Mian Umer Mansha Maqsood AhmedChief Executive Officer Director
25 September 2017Lahore
Directors’ Report
104104 CONSOLIDATED ANNUAL REPORT 2016-17
105Nishat Mills Limited and its Subsidiaries
We have audited the annexed consolidated financial statements comprising consolidated balance sheet of Nishat Mills Limited (the Holding Company) and its Subsidiary Companies (together referred to as Group) as at 30 June 2017 and the related consolidated profit and loss account, consolidated statement of comprehensive income, consolidated cash flow statement and consolidated statement of changes in equity together with the notes forming part thereof, for the year then ended. We have also expressed separate opinions on the financial statements of Nishat Mills Limited, Nishat Linen (Private) Limited and Nishat Commodities (Private) Limited. The financial statements of the Subsidiary Companies, Nishat Power Limited, Nishat Hospitality (Private) Limited, Hyundai Nishat Motor (Private) Limited, Nishat Linen Trading LLC and Nishat International FZE were audited by other firms of auditors, whose reports have been furnished to us and our opinion, in so far as it relates to the amounts included for such Companies, is based solely on the reports of such other auditors. These financial statements are the responsibility of the Holding Company’s management. Our responsibility is to express an opinion on these financial statements based on our audit.
Our audit was conducted in accordance with the International Standards on Auditing and accordingly included such tests of accounting records and such other auditing procedures as we considered necessary in the circumstances.
The financial statements of Nishat USA, Inc. (Subsidiary Company), Nishat Global China Company Limited [wholly owned subsidiary of Nishat International FZE (Subsidiary Company)] and Lalpir Solar Power (Private) Limited [wholly owned subsidiary of Nishat Power Limited (Subsidiary Company)] for the year ended 30 June 2017 were unaudited. Hence, total assets of Rupees 44,384,756 as at 30 June 2017 and total turnover and net loss of Rupees 121,946,314 and Rupees 2,996,524 respectively for the year ended 30 June 2017 pertaining to the aforesaid Companies have been incorporated in these consolidated financial statements by the management using un-audited financial statements.
Adjustments of Rupees 5,610,000 made during the year ended 30 June 2017 in the carrying amount of investment in Nishat Hotels and Properties Limited (Associated Company), accounted for under equity method, are based on un-audited financial statements of that Associated Company.
In our opinion, except for any adjustments that may have been required due to the un-audited figures in respect of Nishat USA, Inc., Nishat Global China Company Limited, Lalpir Solar Power (Private) Limited and Nishat Hotels and Properties Limited as referred to in above paragraphs of the report, the consolidated financial statements present fairly the financial position of Nishat Mills Limited and its Subsidiary Companies as at 30 June 2017 and the results of their operations for the year then ended.
The auditors of Nishat Power Limited (Subsidiary Company) have drawn attention to Note 21.6 to the consolidated financial statements, which describe the matter regarding recoverability of certain trade debts. Their opinion is not qualified in respect of this matter.
RIAZ AHMAD & COMPANYChartered Accountants
Name of engagement partner:Mubashar Mehmood
25 September 2017
LAHORE
Auditors’ Report to the Members
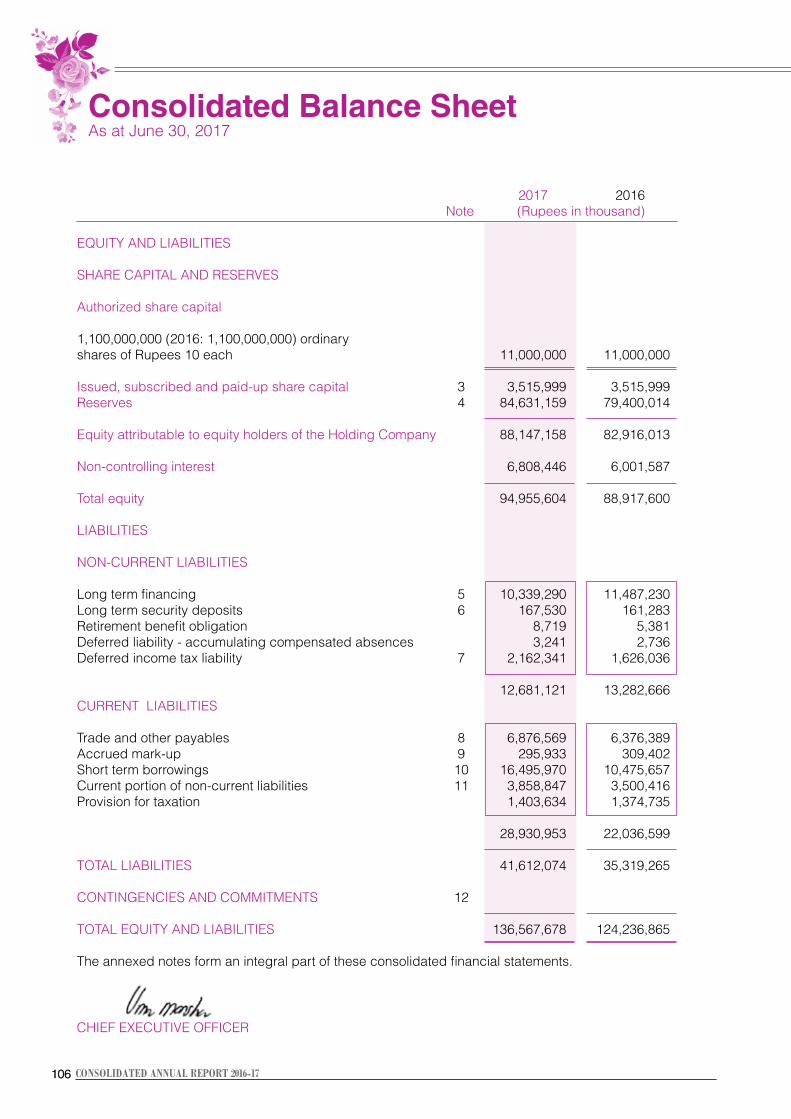
106106 CONSOLIDATED ANNUAL REPORT 2016-17
2017 2016 Note (Rupees in thousand)
EQUITY AND LIABILITIES SHARE CAPITAL AND RESERVES Authorized share capital 1,100,000,000 (2016: 1,100,000,000) ordinary shares of Rupees 10 each 11,000,000 11,000,000 Issued, subscribed and paid-up share capital 3 3,515,999 3,515,999 Reserves 4 84,631,159 79,400,014 Equity attributable to equity holders of the Holding Company 88,147,158 82,916,013 Non-controlling interest 6,808,446 6,001,587 Total equity 94,955,604 88,917,600 LIABILITIES NON-CURRENT LIABILITIES Long term financing 5 10,339,290 11,487,230 Long term security deposits 6 167,530 161,283 Retirement benefit obligation 8,719 5,381 Deferred liability - accumulating compensated absences 3,241 2,736 Deferred income tax liability 7 2,162,341 1,626,036
12,681,121 13,282,666 CURRENT LIABILITIES Trade and other payables 8 6,876,569 6,376,389 Accrued mark-up 9 295,933 309,402 Short term borrowings 10 16,495,970 10,475,657 Current portion of non-current liabilities 11 3,858,847 3,500,416 Provision for taxation 1,403,634 1,374,735
28,930,953 22,036,599
TOTAL LIABILITIES 41,612,074 35,319,265 CONTINGENCIES AND COMMITMENTS 12 TOTAL EQUITY AND LIABILITIES 136,567,678 124,236,865 The annexed notes form an integral part of these consolidated financial statements.
Consolidated Balance Sheet As at June 30, 2017
CHIEF EXECUTIVE OFFICER
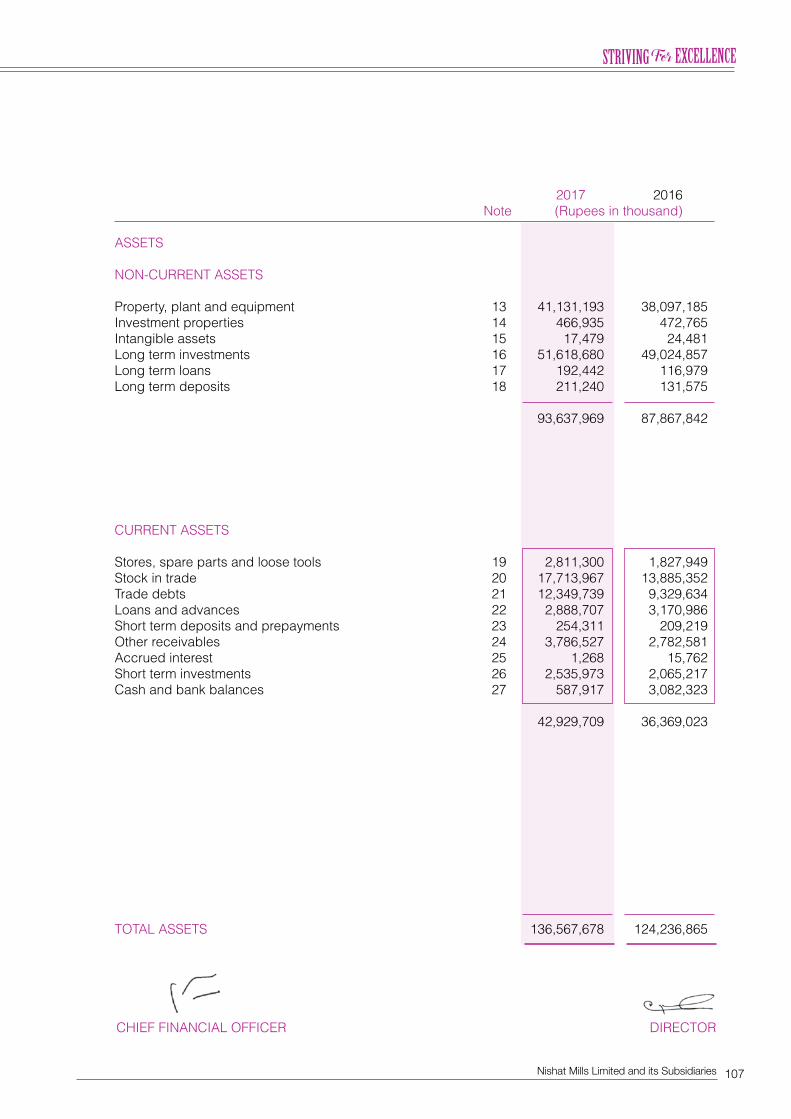
107Nishat Mills Limited and its Subsidiaries
2017 2016 Note (Rupees in thousand)
ASSETS NON-CURRENT ASSETS Property, plant and equipment 13 41,131,193 38,097,185 Investment properties 14 466,935 472,765 Intangible assets 15 17,479 24,481 Long term investments 16 51,618,680 49,024,857 Long term loans 17 192,442 116,979 Long term deposits 18 211,240 131,575 93,637,969 87,867,842 CURRENT ASSETS Stores, spare parts and loose tools 19 2,811,300 1,827,949 Stock in trade 20 17,713,967 13,885,352 Trade debts 21 12,349,739 9,329,634 Loans and advances 22 2,888,707 3,170,986 Short term deposits and prepayments 23 254,311 209,219 Other receivables 24 3,786,527 2,782,581 Accrued interest 25 1,268 15,762 Short term investments 26 2,535,973 2,065,217 Cash and bank balances 27 587,917 3,082,323
42,929,709 36,369,023
TOTAL ASSETS 136,567,678 124,236,865
CHIEF FINANCIAL OFFICER DIRECTOR
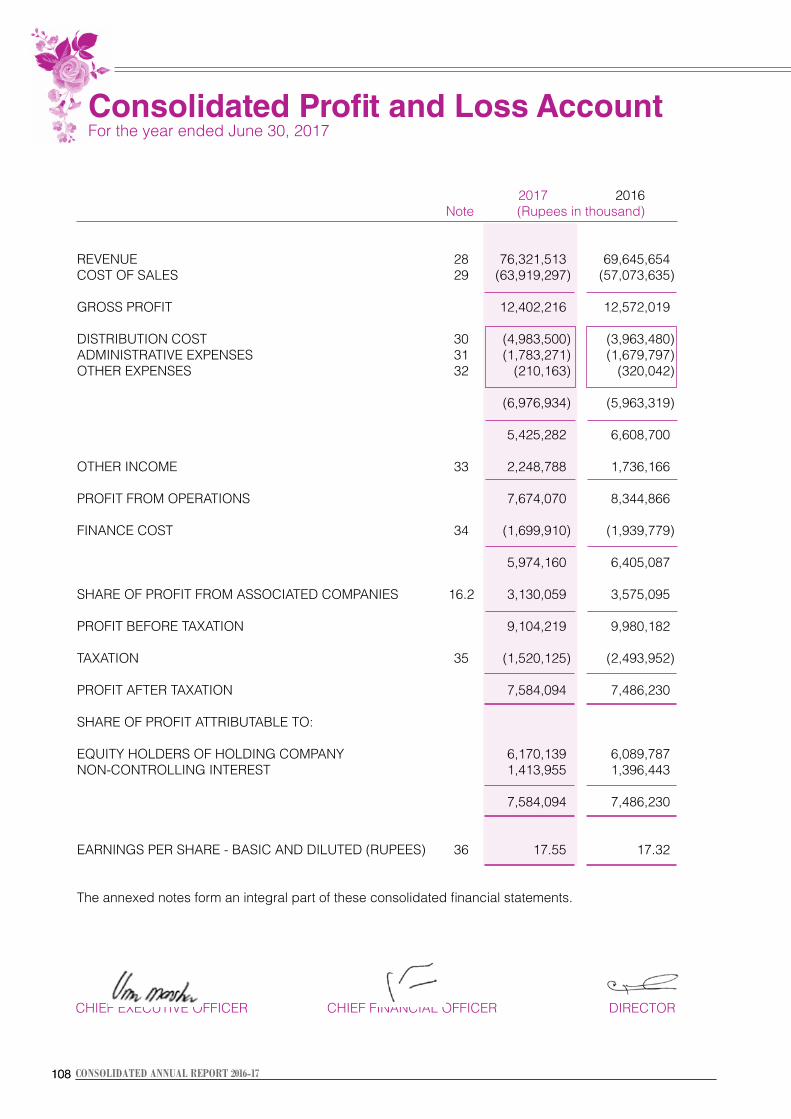
108108 CONSOLIDATED ANNUAL REPORT 2016-17
2017 2016 Note (Rupees in thousand)
REVENUE 28 76,321,513 69,645,654 COST OF SALES 29 (63,919,297) (57,073,635)
GROSS PROFIT 12,402,216 12,572,019 DISTRIBUTION COST 30 (4,983,500) (3,963,480)ADMINISTRATIVE EXPENSES 31 (1,783,271) (1,679,797)OTHER EXPENSES 32 (210,163) (320,042)
(6,976,934) (5,963,319)
5,425,282 6,608,700 OTHER INCOME 33 2,248,788 1,736,166
PROFIT FROM OPERATIONS 7,674,070 8,344,866 FINANCE COST 34 (1,699,910) (1,939,779)
5,974,160 6,405,087 SHARE OF PROFIT FROM ASSOCIATED COMPANIES 16.2 3,130,059 3,575,095
PROFIT BEFORE TAXATION 9,104,219 9,980,182 TAXATION 35 (1,520,125) (2,493,952)
PROFIT AFTER TAXATION 7,584,094 7,486,230 SHARE OF PROFIT ATTRIBUTABLE TO: EQUITY HOLDERS OF HOLDING COMPANY 6,170,139 6,089,787 NON-CONTROLLING INTEREST 1,413,955 1,396,443
7,584,094 7,486,230 EARNINGS PER SHARE - BASIC AND DILUTED (RUPEES) 36 17.55 17.32 The annexed notes form an integral part of these consolidated financial statements.
Consolidated Profit and Loss Account For the year ended June 30, 2017
CHIEF EXECUTIVE OFFICER CHIEF FINANCIAL OFFICER DIRECTOR
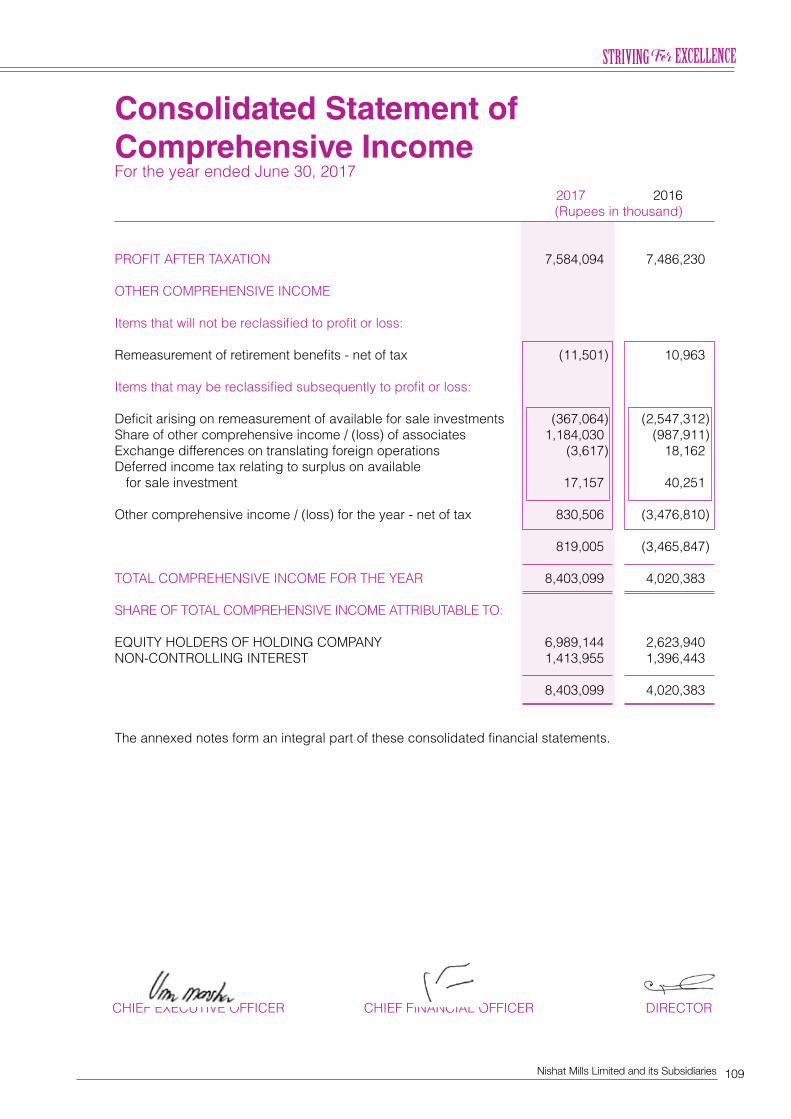
109Nishat Mills Limited and its Subsidiaries
2017 2016 (Rupees in thousand)
PROFIT AFTER TAXATION 7,584,094 7,486,230 OTHER COMPREHENSIVE INCOME Items that will not be reclassified to profit or loss: Remeasurement of retirement benefits - net of tax (11,501) 10,963 Items that may be reclassified subsequently to profit or loss: Deficit arising on remeasurement of available for sale investments (367,064) (2,547,312)Share of other comprehensive income / (loss) of associates 1,184,030 (987,911)Exchange differences on translating foreign operations (3,617) 18,162 Deferred income tax relating to surplus on available for sale investment 17,157 40,251
Other comprehensive income / (loss) for the year - net of tax 830,506 (3,476,810)
819,005 (3,465,847) TOTAL COMPREHENSIVE INCOME FOR THE YEAR 8,403,099 4,020,383 SHARE OF TOTAL COMPREHENSIVE INCOME ATTRIBUTABLE TO:
EQUITY HOLDERS OF HOLDING COMPANY 6,989,144 2,623,940 NON-CONTROLLING INTEREST 1,413,955 1,396,443 8,403,099 4,020,383
The annexed notes form an integral part of these consolidated financial statements.
Consolidated Statement of Comprehensive Income For the year ended June 30, 2017
CHIEF EXECUTIVE OFFICER CHIEF FINANCIAL OFFICER DIRECTOR
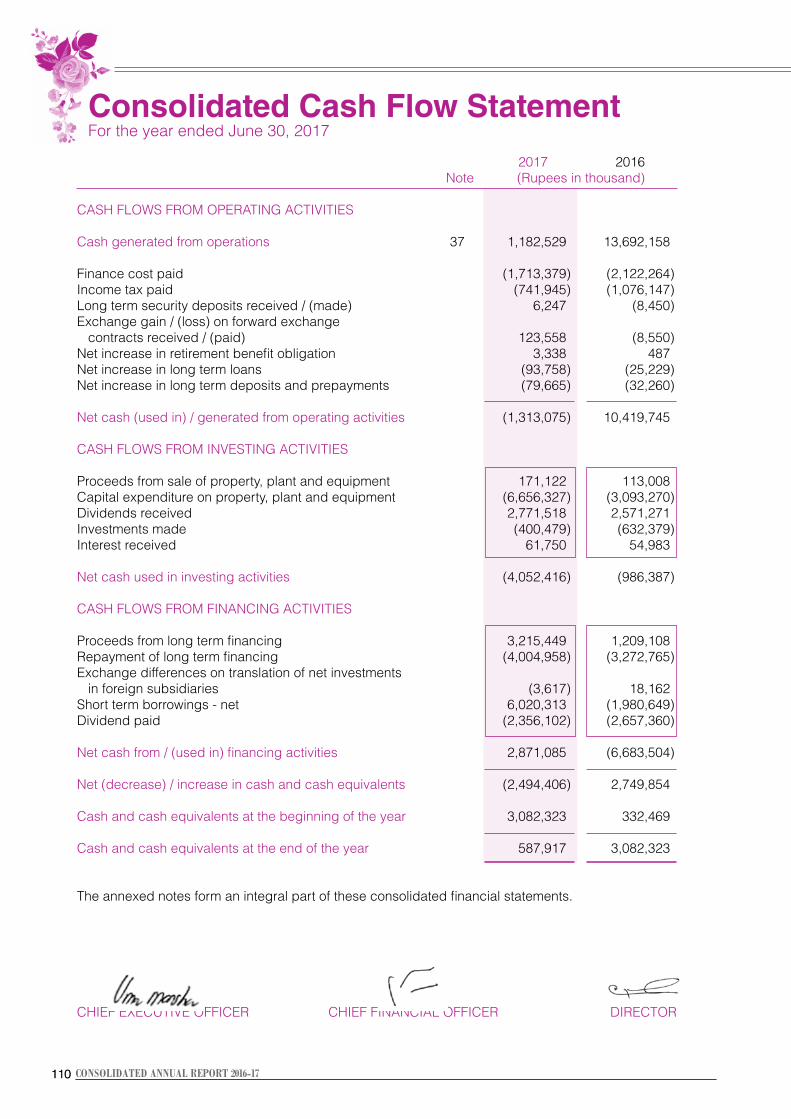
110110 CONSOLIDATED ANNUAL REPORT 2016-17
Consolidated Cash Flow Statement For the year ended June 30, 2017
2017 2016 Note (Rupees in thousand)
CASH FLOWS FROM OPERATING ACTIVITIES Cash generated from operations 37 1,182,529 13,692,158 Finance cost paid (1,713,379) (2,122,264)Income tax paid (741,945) (1,076,147)Long term security deposits received / (made) 6,247 (8,450)Exchange gain / (loss) on forward exchange contracts received / (paid) 123,558 (8,550)Net increase in retirement benefit obligation 3,338 487 Net increase in long term loans (93,758) (25,229)Net increase in long term deposits and prepayments (79,665) (32,260)
Net cash (used in) / generated from operating activities (1,313,075) 10,419,745 CASH FLOWS FROM INVESTING ACTIVITIES Proceeds from sale of property, plant and equipment 171,122 113,008 Capital expenditure on property, plant and equipment (6,656,327) (3,093,270)Dividends received 2,771,518 2,571,271 Investments made (400,479) (632,379)Interest received 61,750 54,983
Net cash used in investing activities (4,052,416) (986,387) CASH FLOWS FROM FINANCING ACTIVITIES Proceeds from long term financing 3,215,449 1,209,108 Repayment of long term financing (4,004,958) (3,272,765)Exchange differences on translation of net investments in foreign subsidiaries (3,617) 18,162 Short term borrowings - net 6,020,313 (1,980,649)Dividend paid (2,356,102) (2,657,360)
Net cash from / (used in) financing activities 2,871,085 (6,683,504)
Net (decrease) / increase in cash and cash equivalents (2,494,406) 2,749,854 Cash and cash equivalents at the beginning of the year 3,082,323 332,469 Cash and cash equivalents at the end of the year 587,917 3,082,323
The annexed notes form an integral part of these consolidated financial statements.
CHIEF EXECUTIVE OFFICER CHIEF FINANCIAL OFFICER DIRECTOR
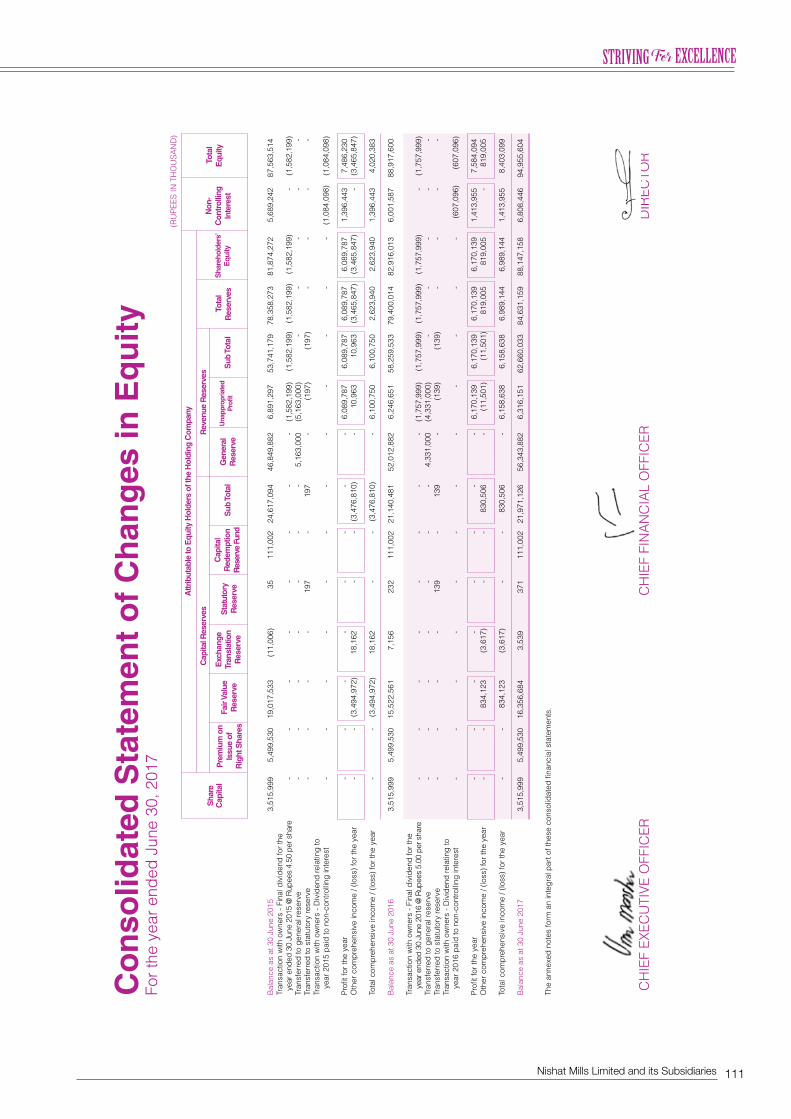
111Nishat Mills Limited and its Subsidiaries
Co
nso
lidat
ed S
tate
men
t o
f C
han
ges
in E
qu
ity
For t
he y
ear e
nded
Jun
e 30
, 201
7
Sha
reC
apita
lP
rem
ium
on
Issu
e of
Rig
ht S
hare
s
Exc
hang
e Tr
ansl
atio
n
Res
erve
Cap
ital
Red
empt
ion
R
eser
ve F
und
Non
-C
ontr
ollin
g
Inte
rest
Fair
Valu
e R
eser
veS
tatu
tory
R
eser
ve S
ub T
otal
Sub
Tot
al T
otal
Res
erve
s
Tot
alE
quity
Gen
eral
R
eser
veU
napp
ropr
iate
d
Pro
fit
Sha
reho
lder
s’
Equ
ity
Cap
ital R
eser
ves
Rev
enue
Res
erve
s
Attr
ibut
able
to E
quity
Hol
ders
of t
he H
oldi
ng C
ompa
ny
Bal
ance
as
at 3
0 Ju
ne 2
015
3,5
15,9
99
5,4
99,5
30
19,
017,
533
(1
1,00
6)
35
1
11,0
02
24,
617,
094
4
6,84
9,88
2
6,8
91,2
97
53,
741,
179
7
8,35
8,27
3
81,
874,
272
5
,689
,242
8
7,56
3,51
4 Tr
ansa
ctio
n w
ith o
wne
rs -
Fina
l div
iden
d fo
r the
y
ear e
nded
30
June
201
5 @
Rup
ees
4.50
per
sha
re
-
-
-
-
-
-
-
-
(1,5
82,1
99)
(1,5
82,1
99)
(1,5
82,1
99)
(1,5
82,1
99)
-
(1,5
82,1
99)
Tran
sfer
red
to g
ener
al re
serv
e -
-
-
-
-
-
-
5
,163
,000
(5
,163
,000
) -
-
-
-
-
Tran
sfer
red
to s
tatu
tory
rese
rve
-
-
-
-
197
-
1
97
-
(197
) (1
97)
-
-
-
- Tr
ansa
ctio
n w
ith o
wne
rs -
Div
iden
d re
latin
g to
year
201
5 pa
id to
non
-con
trolli
ng in
tere
st
-
-
-
-
-
-
-
-
-
-
-
-
(1,0
84,0
98)
(1,0
84,0
98)
Profi
t for
the
year
-
-
-
-
-
-
-
-
6
,089
,787
6
,089
,787
6
,089
,787
6
,089
,787
1
,396
,443
7
,486
,230
O
ther
com
preh
ensi
ve in
com
e / (
loss
) for
the
year
-
-
(3
,494
,972
) 1
8,16
2
-
-
(3,4
76,8
10)
-
10,
963
1
0,96
3
(3,4
65,8
47)
(3,4
65,8
47)
-
(3,4
65,8
47)
Tota
l com
preh
ensi
ve in
com
e / (
loss
) for
the
year
-
-
(3
,494
,972
) 1
8,16
2
-
-
(3,4
76,8
10)
-
6,1
00,7
50
6,1
00,7
50
2,6
23,9
40
2,6
23,9
40
1,3
96,4
43
4,0
20,3
83 B
alan
ce a
s at
30
June
201
6 3
,515
,999
5
,499
,530
1
5,52
2,56
1
7,1
56
232
1
11,0
02
21,
140,
481
5
2,01
2,88
2
6,2
46,6
51
58,
259,
533
7
9,40
0,01
4
82,
916,
013
6
,001
,587
8
8,91
7,60
0
Tran
sact
ion
with
ow
ners
- Fi
nal d
ivid
end
for t
he
ye
ar e
nded
30
June
201
6 @
Rup
ees
5.00
per
sha
re
-
-
-
-
-
-
-
-
(1,7
57,9
99)
(1,7
57,9
99)
(1,7
57,9
99)
(1,7
57,9
99)
-
(1,7
57,9
99)
Tran
sfer
red
to g
ener
al re
serv
e -
-
-
-
-
-
-
4
,331
,000
(4
,331
,000
) -
-
-
-
-
Tran
sfer
red
to s
tatu
tory
rese
rve
-
-
-
-
139
-
1
39
-
(139
) (1
39)
-
-
-
- Tr
ansa
ctio
n w
ith o
wne
rs -
Div
iden
d re
latin
g to
year
201
6 pa
id to
non
-con
trolli
ng in
tere
st
-
-
-
-
-
-
-
-
-
-
-
-
(607
,096
) (6
07,0
96)
Profi
t for
the
year
-
-
-
-
-
-
-
-
6
,170
,139
6
,170
,139
6
,170
,139
6
,170
,139
1
,413
,955
7
,584
,094
O
ther
com
preh
ensi
ve in
com
e / (
loss
) for
the
year
-
-
8
34,1
23
(3,6
17)
-
-
830
,506
-
(1
1,50
1)
(11,
501)
8
19,0
05
819
,005
-
8
19,0
05
Tota
l com
preh
ensi
ve in
com
e / (
loss
) for
the
year
-
-
8
34,1
23
(3,6
17)
-
-
830
,506
-
6
,158
,638
6
,158
,638
6
,989
,144
6
,989
,144
1
,413
,955
8
,403
,099
B
alan
ce a
s at
30
June
201
7 3
,515
,999
5
,499
,530
1
6,35
6,68
4
3,5
39
371
1
11,0
02
21,
971,
126
5
6,34
3,88
2
6,3
16,1
51
62,
660,
033
8
4,63
1,15
9
88,
147,
158
6
,808
,446
9
4,95
5,60
4
The
anne
xed
note
s fo
rm a
n in
tegr
al p
art o
f the
se c
onso
lidat
ed fi
nanc
ial s
tate
men
ts.
(RU
PEES
IN T
HO
USA
ND
)
CH
IEF
EXEC
UTI
VE O
FFIC
ER
CH
IEF
FIN
AN
CIA
L O
FFIC
ER
DIR
ECTO
R
112112 CONSOLIDATED ANNUAL REPORT 2016-17
1 THE GROUP AND ITS OPERATIONS
a) The Group consists of: Holding Company -Nishat Mills Limited Subsidiary Companies -Nishat Power Limited -Nishat Linen (Private) Limited -Nishat Hospitality (Private) Limited -Nishat USA, Inc. -Nishat Linen Trading LLC -Nishat International FZE -Nishat Global China Company Limited -Nishat UK (Private) Limited -Nishat Commodities (Private) Limited -Lalpir Solar Power (Private) Limited -Concept Garments and Textile Trading FZE -Hyundai Nishat Motor (Private) Limited NISHAT MILLS LIMITED Nishat Mills Limited is a public limited Company incorporated in Pakistan under the Companies
Act, 1913 (Now Companies Act, 2017) and listed on Pakistan Stock Exchange Limited. Its registered office is situated at 53-A, Lawrence Road, Lahore. The Company is engaged in the business of textile manufacturing and of spinning, combing, weaving, bleaching, dyeing, printing, stitching, apparel, buying, selling and otherwise dealing in yarn, linen, cloth and other goods and fabrics made from raw cotton, synthetic fibre and cloth and to generate, accumulate, distribute, supply and sell electricity.
NISHAT POWER LIMITED Nishat Power Limited is a public limited Company incorporated in Pakistan under the Companies
Ordinance, 1984 (Now Companies Act, 2017) and listed on Pakistan Stock Exchange Limited. The Company is a subsidiary of Nishat Mills Limited. The principal activity of the Company is to build, own, operate and maintain a fuel fired power station having gross capacity of 200 MW ISO in Jamber Kalan, Tehsil Pattoki, District Kasur, Punjab, Pakistan. Its registered office is situated at 53-A, Lawrence Road, Lahore. Ownership interest held by non-controlling interests in Nishat Power Limited is 48.99% (2016: 48.99%).
NISHAT LINEN (PRIVATE) LIMITED Nishat Linen (Private) Limited, a wholly owned subsidiary of Nishat Mills Limited, is a private limited
company incorporated in Pakistan under the Companies Ordinance, 1984 (Now Companies Act, 2017) on 15 March 2011. The registered office of Nishat Linen (Private) Limited is situated at 7- Main, Gulberg Lahore. The principal objects of the Company are to operate retail outlets for sale of textile and other products and to sale the textile products by processing the textile goods in own and outside manufacturing facility.
Notes to the Consolidated Financial Statements For the year ended June 30, 2017
113Nishat Mills Limited and its Subsidiaries
NISHAT HOSPITALITY (PRIVATE) LIMITED Nishat Hospitality (Private) Limited, a wholly owned subsidiary of Nishat Mills Limited, is a
private limited company incorporated in Pakistan under the Companies Ordinance, 1984 (Now Companies Act, 2017) on 01 July 2011. The registered office of Nishat Hospitality (Private) Limited is situated at 1-B Aziz Avenue, Canal Bank, Gulberg-V, Lahore. The principal activity of the Company is to carry on the business of hotels, cafes, restaurants and lodging or apartment houses, bakers and confectioners in Pakistan and outside Pakistan.
NISHAT USA, INC. Nishat USA, Inc. is a foreign subsidiary incorporated under the Business Corporation Laws of
the State of New York. The registered office of Nishat USA, Inc. is situated at 676 Broadway, New York, NY 10012, U.S.A. The principal business of the Company is to provide marketing services to Nishat Mills Limited - Holding Company. Nishat Mills Limited acquired 100% shareholding of Nishat USA, Inc. on 01 October 2008.
NISHAT LINEN TRADING LLC Nishat Linen Trading LLC is a limited liability company formed in pursuance to statutory provisions
of the United Arab Emirates (UAE) Federal Law No. (8) of 1984 as amended and registered with the Department of Economic Development, Government of Dubai. Nishat Linen Trading LLC is a subsidiary of Nishat Mills Limited as Nishat Mills Limited, through the powers given to it under Article 11 of the Memorandum of Association, exercise full control on the management of Nishat Linen Trading LLC. Date of incorporation of the Company was 29 December 2010. The registered office of Nishat Linen Trading LLC is situated at P.O. Box 28189 Dubai, UAE. The principal business of the Company is to operate retail outlets in UAE for sale of textile and related products.
NISHAT INTERNATIONAL FZE Nishat International FZE is incorporated as free zone establishment with limited liability in
accordance with the Law No. 9 of 1992 and licensed by the Registrar of Jebel Ali Free Zone Authority. Nishat International FZE is a wholly owned subsidiary of Nishat Mills Limited. Date of incorporation of the Company was 07 February 2013. The registered office of Nishat International FZE is situated at P.O. Box 114622, Jebel Ali Free Zone, Dubai. The principal business of the Company is trading in textile and related products.
NISHAT GLOBAL CHINA COMPANY LIMITED Nishat Global China Company Limited is a Company incorporated in People’s Republic of China
on 25 November 2013. It is a wholly owned subsidiary of Nishat International FZE which is a wholly owned subsidiary of Nishat Mills Limited. The primary function of Nishat Global China Company Limited is to competitively source products for the retail outlets operated by Group companies in Pakistan and the UAE.
NISHAT UK (PRIVATE) LIMITED Nishat UK (Private) Limited is a private limited Company incorporated in England and Wales
on 8 June 2015. It is a wholly owned subsidiary of Nishat International FZE which is a wholly owned subsidiary of Nishat Mills Limited. The primary function of Nishat UK (Private) Limited is sale of textile and related products in England and Wales through retail outlets and wholesale operations.
114114 CONSOLIDATED ANNUAL REPORT 2016-17
NISHAT COMMODITIES (PRIVATE) LIMITED Nishat Commodities (Private) Limited is a private limited Company incorporated in Pakistan on
16 July 2015 under the Companies Ordinance, 1984 (Now Companies Act, 2017). It is a wholly owned subsidiary of Nishat Mills Limited. Its registered office is situated at 53-A, Lawrence Road, Lahore. The principal objects of the Company is to carry on the business of trading of commodities including fuels, coals, building material in any form or shape manufactured, semi-manufactured, raw materials and their import and sale in Pakistan.
LALPIR SOLAR POWER (PRIVATE) LIMITED Lalpir Solar Power (Private) Limited is a private limited Company incorporated in Pakistan on
09 November 2015 under the Companies Ordinance, 1984 (Now Companies Act, 2017). It is a wholly owned subsidiary of Nishat Power Limited which is a subsidiary of Nishat Mills Limited. Its registered office is situated at 53-A, Lawrence Road, Lahore. The principal activity of the Company will be to build, own, operate and maintain or invest in a solar power project.
CONCEPT GARMENTS AND TEXTILE TRADING FZE Concept Garments and Textile Trading FZE is incorporated as a free zone establishment with
limited liability in accordance with the Law No. 9 of 1992 and licensed by the Registrar of Jabel Ali Free Zone Authority. It is wholly owned subsidiary of Nishat International FZE which is a wholly owned subsidiary of Nishat Mills Limited. Date of incorporation of the Company was 11 October 2016. The registered office of Concept Garments and Textile Trading FZE is situated at Jabel Ali Free Zone, Dubai. The principal business of the Company is trading in textile and related products.
HYUNDAI NISHAT MOTOR (PRIVATE) LIMITED Hyundai Nishat Motor (Private) Limited is a private limited Company incorporated in Pakistan on
03 March 2017 under the Companies Ordinance, 1984 (Now Companies Act, 2017). It is a wholly owned subsidiary of Nishat Mills Limited. The registered office of the Company is situated at Nishat House, 53-A Lawrance Road, Lahore. The principal activity of the Company is to carry on the business of all sort of automobiles, motor vehicles, motor buses, commercial vehicles, motor vans and other vehicles, machinery and equipment (whether locally manufactured or not) and to carry on assembly, importing, manufacturing, export, trading, fabrication, distributorship and other allied services for all types of automobiles.
b) Significant restrictions Cash and bank balances held in foreign countries are subject to local exchange control
regulations. These regulations provide for restrictions on exporting capital from these countries, other than through normal dividends. The carrying amount of these assets included within the consolidated financial statements to which these restrictions apply is Rupees 195.842 million (2016: Rupees 211.471 million).
2 SUMMARY OF SIGNIFICANT ACCOUNTING POLICIES The significant accounting policies applied in the preparation of these consolidated financial
statements are set out below. These policies have been consistently applied to all years presented, unless otherwise stated:
Notes to the Consolidated Financial Statements For the year ended June 30, 2017
115Nishat Mills Limited and its Subsidiaries
2.1 Basis of preparation a) Statement of compliance These consolidated financial statements have been prepared in accordance with approved
accounting standards as applicable in Pakistan. Approved accounting standards comprise of such International Financial Reporting Standards (IFRS) issued by the International Accounting Standards Board as are notified under the repealed Companies Ordinance, 1984, provisions of and directives issued under the repealed Companies Ordinance, 1984. In case requirements differ, the provisions or directives of the repealed Companies Ordinance, 1984 shall prevail.
The Companies Ordinance, 1984 has been repealed after the enactment of the Companies Act, 2017 on 30 May 2017. SECP vide its Circular 17 of 2017 and its press release dated 20 July 2017 has clarified that the companies whose financial year, including quarterly and other interim period, closes on or before 30 June 2017 shall prepare their financial statements in accordance with the provisions of the repealed Companies Ordinance, 1984. The Companies Act, 2017 requires enhanced disclosures about Group’s operations and has also enhanced the definition of related parties.
b) Accounting convention These consolidated financial statements have been prepared under the historical cost convention
except for the certain financial instruments carried at fair value. c) Critical accounting estimates and judgments The preparation of these consolidated financial statements in conformity with the approved
accounting standards requires the use of certain critical accounting estimates. It also requires the management to exercise its judgment in the process of applying accounting policies. Estimates and judgments are continually evaluated and are based on historical experience and other factors, including expectations of future events that are believed to be reasonable under the circumstances. The areas where various assumptions and estimates are significant to the consolidated financial statements or where judgments were exercised in application of accounting policies are as follows:
Financial instruments The fair value of financial instruments that are not traded in an active market is determined by
using valuation techniques based on assumptions that are dependent on conditions existing at balance sheet date.
Useful lives, patterns of economic benefits and impairments Estimates with respect to residual values and useful lives and pattern of flow of economic benefits
are based on the analysis of the management. Further, the Group reviews the value of assets for possible impairment on an annual basis. Any change in the estimates in the future might affect the carrying amount of respective item of property, plant and equipment, with a corresponding effect on the depreciation charge and impairment.
Inventories Net realizable value of inventories is determined with reference to currently prevailing selling
prices less estimated expenditure to make sales.
116116 CONSOLIDATED ANNUAL REPORT 2016-17
Taxation In making the estimates for income tax currently payable, the management takes into account the
current income tax law and the decisions of appellate authorities on certain issues in the past. Provision for doubtful debts The Group reviews its receivable against any provision required for any doubtful balances on an
ongoing basis. The provision is made while taking into consideration expected recoveries, if any.
Impairment of investments in equity method accounted for associated companies
In making an estimate of recoverable amount of the Group’s investments in equity method accounted for associated companies, the management considers future cash flows.
d) Amendments to published approved accounting standards that are effective in current year and are relevant to the Group
The following amendments to published approved accounting standards are mandatory for the
Group’s accounting periods beginning on or after 01 July 2016: IAS 1 (Amendments) ‘Presentation of Financial Statements’ (effective for annual periods
beginning on or after 01 January 2016). Amendments have been made to address perceived impediments to preparers exercising their judgement in presenting their financial reports by making the following changes: clarification that information should not be obscured by aggregating or by providing immaterial information, materiality consideration apply to the all parts of the financial statements, and even when a standard requires a specific disclosure, materiality consideration do apply; clarification that the list of the line items to be presented in these statements can be disaggregated and aggregated as relevant and additional guidance on subtotals in these statements and clarification that an entity’s share of other comprehensive income of equity-accounted associates and joint ventures should be presented in aggregate as single line items based on whether or not it will subsequently be reclassified to profit or loss; and additional examples of possible ways of ordering the notes to clarify that understandability and comparability should be considered when determining the order of the notes and to demonstrate that the notes need not be presented in the order so far listed in IAS 1.
IAS 16 (Amendments) ‘Property, Plant and Equipment’ (effective for annual periods beginning on
or after 01 January 2016). The amendments clarify that a depreciation method which is based on revenue, generated by an activity by using of an asset is not appropriate for property, plant and equipment; and add guidance that expected future reductions in the selling price of an item that was produced using an asset could indicate the expectation of technological or commercial obsolescence of the asset, which, in turn, might reflect a reduction of the future economic benefits embodied in the asset.
IAS 27 (Amendments) ‘Separate Financial Statements’ (effective for annual periods beginning on
or after 01 January 2016). The amendments have been made to permit investments in subsidiaries, joint ventures and associates to be optionally accounted for using the equity method in separate financial statements. However, the Group has not availed this option.
IAS 34 (Amendments) ‘Interim Financial Reporting’ (effective for annual periods beginning on or
after 01 January 2016). This amendment clarifies what is meant by the reference in the standard to ‘information disclosed elsewhere in the interim financial report’. The amendment also amends IAS 34 to require a cross-reference from the interim financial statements to the location of that information.
Notes to the Consolidated Financial Statements For the year ended June 30, 2017
117Nishat Mills Limited and its Subsidiaries
The application of the above amendments does not result in any impact on consolidated profit or loss, consolidated other comprehensive income and consolidated total comprehensive income.
e) Amendments to published approved accounting standards that are effective in current year but not relevant to the Group
There are other amendments to published approved accounting standards that are mandatory
for accounting periods beginning on or after 01 July 2016 but are considered not to be relevant or do not have any significant impact on the Group’s financial statements and are therefore not detailed in these financial statements.
f) Standards, interpretations and amendments to published approved accounting standards
that are not yet effective but relevant to the Group Following standards, interpretations and amendments to existing standards have been published
and are mandatory for the Group’s accounting periods beginning on or after 01 July 2017 or later periods:
IFRS 9 ‘Financial Instruments’ (effective for annual periods beginning on or after 01 January
2018). A finalized version of IFRS 9 which contains accounting requirements for financial instruments, replacing IAS 39 ‘Financial Instruments: Recognition and Measurement’. Financial assets are classified by reference to the business model within which they are held and their contractual cash flow characteristics. The 2014 version of IFRS 9 introduces a ‘fair value through other comprehensive income’ category for certain debt instruments. Financial liabilities are classified in a similar manner to under IAS 39, however there are differences in the requirements applying to the measurement of an entity’s own credit risk. The 2014 version of IFRS 9 introduces an ‘expected credit loss’ model for the measurement of the impairment of financial assets, so it is no longer necessary for a credit event to have occurred before a credit loss is recognized. It introduces a new hedge accounting model that is designed to be more closely aligned with how entities undertake risk management activities when hedging financial and non-financial risk exposures. The requirements for the derecognition of financial assets and liabilities are carried forward from IAS 39. The management of the Group is in the process of evaluating the impacts of the aforesaid standard on the Group’s consolidated financial statements.
IFRS 15 ‘Revenue from Contracts with Customers’ (effective for annual periods beginning on or
after 01 January 2018). IFRS 15 provides a single, principles based five-step model to be applied to all contracts with customers. The five steps in the model are: identify the contract with the customer; identify the performance obligations in the contract; determine the transaction price; allocate the transaction price to the performance obligations in the contracts; and recognize revenue when (or as) the entity satisfies a performance obligation. Guidance is provided on topics such as the point in which revenue is recognized, accounting for variable consideration, costs of fulfilling and obtaining a contract and various related matters. New disclosures about revenue are also introduced. IFRS 15 replaces IAS 11 ‘Construction Contracts’, IAS 18 ‘Revenue’, IFRIC 13 ‘Customer Loyalty Programmes’, IFRIC 15 ‘Agreements for Construction of Real Estate’, IFRIC 18 ‘Transfer of Assets from Customers’ and SIC 31’ Revenue-Barter Transactions Involving Advertising Services. The aforesaid standard is not expected to have a material impact on the Group’s consolidated financial statements.
IFRS 16 ‘Lease’ (effective for annual periods beginning on or after 01 January 2019). IFRS 16
specifies how an entity will recognize, measure, present and disclose leases. The standard provides a single lessee accounting model, requiring lessees to recognize assets and liabilities for all leases unless the lease term is 12 months or less or the underlying asset has a low value. Lessors continue to classify leases as operating or finance, with IFRS 16 approach to lessor accounting substantially unchanged from its predecessor, IAS 17 ‘Leases’. IFRS 16 replaces IAS 17 ‘Leases’, IFRIC 4 ‘Determining Whether an Arrangement Contains a Lease’, SIC-15 ‘Operating
118118 CONSOLIDATED ANNUAL REPORT 2016-17
Leases–Incentives’ and SIC-27 ‘Evaluating the Substance of Transactions Involving the Legal Form of a Lease’. The management of the Group is in the process of evaluating the impacts of the aforesaid standard on the Group’s consolidated financial statements.
IFRIC 22 ‘Foreign Currency Transactions and Advance Consideration’ (effective for annual
periods beginning on or after 01 January 2018). IFRIC 22 clarifies which date should be used for translation when a foreign currency transaction involves payment or receipt in advance of the item it relates to. The related item is translated using the exchange rate on the date the advance foreign currency is received or paid and the prepayment or deferred income is recognized. The date of the transaction for the purpose of determining the exchange rate to use on initial recognition of the related asset, expense or income (or part of it) would remain the date on which receipt of payment from advance consideration was recognized. If there are multiple payments or receipts in advance, the entity shall determine a date of the transaction for each payment or receipt of advance consideration. The interpretation is not expected to have a material impact on the Group’s consolidated financial statements.
IFRIC 23 ‘Uncertainty over Income Tax Treatments’ (effective for annual periods beginning on
or after 01 January 2019). The interpretation addresses the determination of taxable profit (tax loss), tax bases, unused tax losses, unused tax credits and tax rates, when there is uncertainty over income tax treatments under IAS 12 ‘Income Taxes’. It specifically considers: whether tax treatments should be considered collectively; assumptions for taxation authorities’ examinations; the determination of taxable profit (tax loss), tax bases, unused tax losses, unused tax credits and tax rates; and the effect of changes in facts and circumstances. The interpretation is not expected to have a material impact on the Group’s consolidated financial statements.
IFRS 15 (Amendments), ‘Revenue from Contracts with Customers’ (effective for annual periods beginning on or after 01 January 2018). Amendments clarify three aspects of the standard (identifying performance obligations, principal versus agent considerations, and licensing) and to provide some transition relief for modified contracts and completed contracts. The aforesaid amendments are not expected to have a material impact on the Group’s consolidated financial statements.
IAS 7 (Amendments), ‘Statement of Cash Flows’ (effective for annual periods beginning on or after
01 January 2017). Amendments have been made to clarify that entities shall provide disclosures that enable users of financial statements to evaluate changes in liabilities arising from financing activities. The aforesaid amendments will result in certain additional disclosures in the Group’s consolidated financial statements.
IAS 12 (Amendments), ‘Income Taxes’ (effective for annual periods beginning on or after 01 January
2017). The amendments clarify that the existence of a deductible temporary difference depends solely on a comparison of the carrying amount of an asset and its tax base at the end of the reporting period, and is not affected by possible future changes in the carrying amount or expected manner of recovery of the asset. The amendments further clarify that when calculating deferred tax asset in respect of insufficient taxable temporary differences, the future taxable profit excludes tax deductions resulting from the reversal of those deductible temporary differences. The amendments are not likely to have significant impact on Group’s consolidated financial statements.
IAS 40 (Amendments), ‘Investment Property’ (effective for annual periods beginning on or after 01
January 2018). Amendments have been made to state that an entity shall transfer a property to, or from, investment property when, and only when, there is evidence of a change in use. A change of use occurs if property meets, or ceases to meet, the definition of investment property. A change in management’s intentions for the use of a property by itself does not constitute evidence of a change in use. The list of examples of evidence in paragraph 57(a) – (d) is now presented as a non-exhaustive list of examples instead of the previous exhaustive list. The amendment is not likely to have a significant impact on the Group’s consolidated financial statements.
Notes to the Consolidated Financial Statements For the year ended June 30, 2017
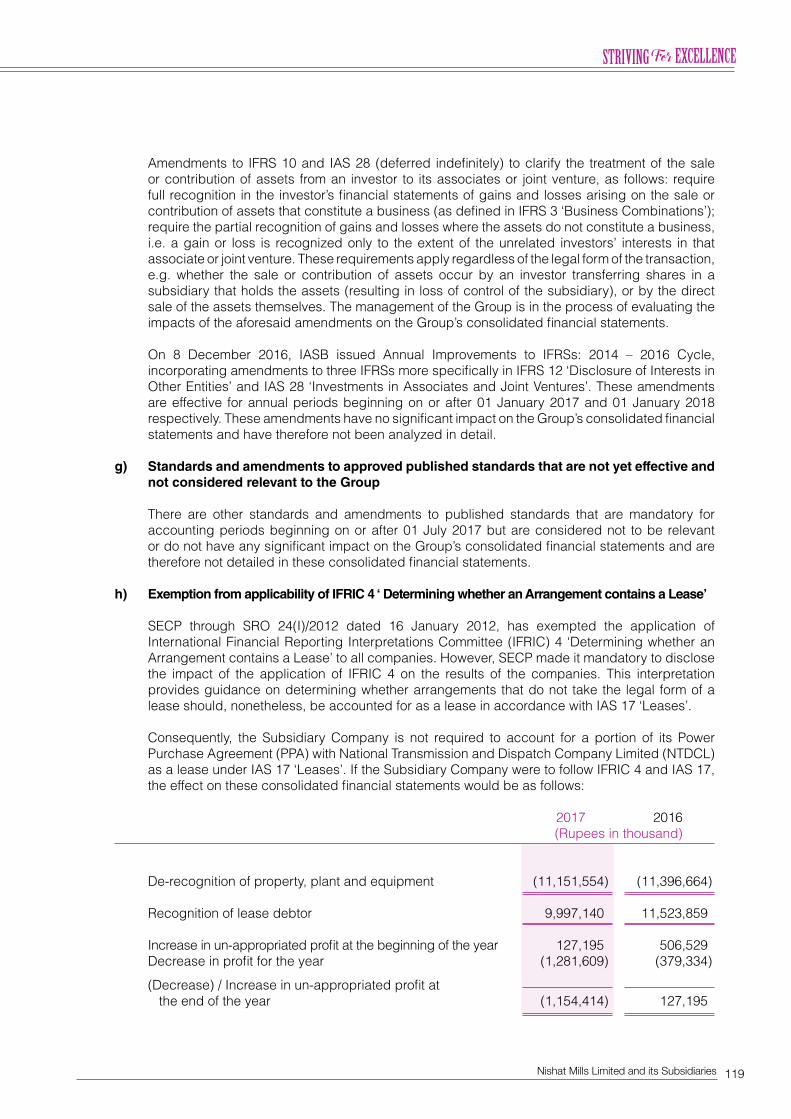
119Nishat Mills Limited and its Subsidiaries
Amendments to IFRS 10 and IAS 28 (deferred indefinitely) to clarify the treatment of the sale or contribution of assets from an investor to its associates or joint venture, as follows: require full recognition in the investor’s financial statements of gains and losses arising on the sale or contribution of assets that constitute a business (as defined in IFRS 3 ‘Business Combinations’); require the partial recognition of gains and losses where the assets do not constitute a business, i.e. a gain or loss is recognized only to the extent of the unrelated investors’ interests in that associate or joint venture. These requirements apply regardless of the legal form of the transaction, e.g. whether the sale or contribution of assets occur by an investor transferring shares in a subsidiary that holds the assets (resulting in loss of control of the subsidiary), or by the direct sale of the assets themselves. The management of the Group is in the process of evaluating the impacts of the aforesaid amendments on the Group’s consolidated financial statements.
On 8 December 2016, IASB issued Annual Improvements to IFRSs: 2014 – 2016 Cycle, incorporating amendments to three IFRSs more specifically in IFRS 12 ‘Disclosure of Interests in Other Entities’ and IAS 28 ‘Investments in Associates and Joint Ventures’. These amendments are effective for annual periods beginning on or after 01 January 2017 and 01 January 2018 respectively. These amendments have no significant impact on the Group’s consolidated financial statements and have therefore not been analyzed in detail.
g) Standards and amendments to approved published standards that are not yet effective and
not considered relevant to the Group There are other standards and amendments to published standards that are mandatory for
accounting periods beginning on or after 01 July 2017 but are considered not to be relevant or do not have any significant impact on the Group’s consolidated financial statements and are therefore not detailed in these consolidated financial statements.
h) Exemption from applicability of IFRIC 4 ‘ Determining whether an Arrangement contains a Lease’ SECP through SRO 24(I)/2012 dated 16 January 2012, has exempted the application of
International Financial Reporting Interpretations Committee (IFRIC) 4 ‘Determining whether an Arrangement contains a Lease’ to all companies. However, SECP made it mandatory to disclose the impact of the application of IFRIC 4 on the results of the companies. This interpretation provides guidance on determining whether arrangements that do not take the legal form of a lease should, nonetheless, be accounted for as a lease in accordance with IAS 17 ‘Leases’.
Consequently, the Subsidiary Company is not required to account for a portion of its Power Purchase Agreement (PPA) with National Transmission and Dispatch Company Limited (NTDCL) as a lease under IAS 17 ‘Leases’. If the Subsidiary Company were to follow IFRIC 4 and IAS 17, the effect on these consolidated financial statements would be as follows:
2017 2016 (Rupees in thousand) De-recognition of property, plant and equipment (11,151,554) (11,396,664) Recognition of lease debtor 9,997,140 11,523,859
Increase in un-appropriated profit at the beginning of the year 127,195 506,529 Decrease in profit for the year (1,281,609) (379,334)
(Decrease) / Increase in un-appropriated profit at the end of the year (1,154,414) 127,195
120120 CONSOLIDATED ANNUAL REPORT 2016-17
2.2 Consolidation a) Subsidiaries Subsidiaries are all entities over which the Group has control. The Group controls an
entity when the Group is exposed to, or has rights to, variable returns from its involvement with the entity and has the ability to affect those returns through its power to direct the activities of the entity. Subsidiaries are fully consolidated from the date on which control is transferred to the Group. They are deconsolidated from the date that control ceases.
The assets and liabilities of Subsidiary Companies have been consolidated on a line by line basis and carrying value of investments held by the Holding Company is eliminated against Holding Company’s share in paid up capital of the Subsidiary Companies.
Intragroup balances and transactions have been eliminated. Non-controlling interests are that part of net results of the operations and of net assets
of Subsidiary Companies attributable to interest which are not owned by the Holding Company. Non-controlling interests are presented as separate item in the consolidated financial statements.
b) Associates Associates are the entities over which the group has significant influence but not control,
generally accompanying a shareholding of between 20% and 50% of the voting rights. Investments in these associates are accounted for using the equity method of accounting and are initially recognized at cost. The Group’s investment in associate includes goodwill identified on acquisition, net of any accumulated impairment loss, if any.
The Group’s share of its associate’s post-acquisition profits or losses, movement in other comprehensive income, and its share of post-acquisition movements in reserves is recognized in the consolidated profit and loss account, consolidated statement of comprehensive income and reserves respectively. The cumulative post-acquisition movements are adjusted against the carrying amount of the investment. Distributions received from an associate reduce the carrying amount of the investment. Investments in equity method accounted for associates are tested for impairment in accordance with the provision of IAS 36 `Impairment of Assets`.
c) Translation of the financial statements of foreign subsidiary The financial statements of foreign subsidiaries of which the functional currency is different
from that used in preparing the Group’s consolidated financial statements are translated in functional currency of the Group. Balance sheet items are translated at the exchange rate at the balance sheet date and profit and loss account items are converted at the average rate for the period. Any resulting translation differences are recognized under exchange translation reserve in consolidated reserves.
2.3 Employee benefit The Group operates approved funded provident fund scheme covering all permanent employees.
Equal monthly contributions are made both by the employer and employees to the fund. The employer’s contributions to the fund are charged to consolidated profit and loss account.
Notes to the Consolidated Financial Statements For the year ended June 30, 2017
121Nishat Mills Limited and its Subsidiaries
2.4 Taxation Current Provision for current tax is based on the taxable income for the year determined in accordance
with the prevailing law for taxation of income. The charge for current tax is calculated using prevailing tax rates or tax rates expected to apply to the profit for the year if enacted. The charge for current tax also includes adjustments, where considered necessary, to provision for tax made in previous years arising from assessments framed during the year for such years.
The profits and gains of Nishat Power Limited - Subsidiary Company derived from electric power generation are exempt from tax in terms of Clause (132) of Part I of the Second Schedule to the Income Tax Ordinance, 2001, subject to the conditions and limitations provided therein. Under Clause 11(v) of Part IV of the Second Schedule to the Income Tax Ordinance, 2001, the Subsidiary Company is also exempt from levy of minimum tax on ‘turnover’ under section 113 of the Income Tax Ordinance, 2001. However, full provision is made in the profit and loss account on income from sources not covered under the above clauses at current rates of taxation after taking into account, tax credits and rebates available, if any.
Provision for income tax on the income of foreign subsidiary - Nishat USA, Inc. is computed in
accordance with the tax legislation in force in the country where the income is taxable.
Deferred Deferred tax is accounted for using the balance sheet liability method in respect of all temporary
differences arising from differences between the carrying amount of assets and liabilities in the consolidated financial statements and the corresponding tax bases used in the computation of the taxable profit. Deferred tax liabilities are generally recognized for all taxable temporary differences and deferred tax assets to the extent that it is probable that taxable profits will be available against which the deductible temporary differences, unused tax losses and tax credits can be utilized.
Deferred tax is calculated at the rates that are expected to apply to the period when the
differences reverse based on tax rates that have been enacted or substantively enacted by the balance sheet date. Deferred tax is charged or credited in the consolidated profit and loss account, except to the extent that it relates to items recognized in other comprehensive income or directly in equity. In this case the tax is also recognized in other comprehensive income or directly in equity, respectively.
Nishat Power Limited - Subsidiary Company has not made provision for deferred tax as the
Subsidiary Company’s management believes that the temporary differences will not reverse in the foreseeable future due to the fact that the profits and gains of the Company derived from electric power generation are exempt from tax subject to the conditions and limitations provided for in terms of Clause 132 of Part I of the Second Schedule to the Income Tax Ordinance, 2001.
2.5 Goodwill Goodwill represents the excess of the cost of an acquisition over the fair value of the Group’s
share of the identifiable net assets acquired. Goodwill is tested annually for impairment and carried at cost less accumulated impairment losses. Any impairment is recognized immediately through the consolidated profit and loss account and is not subsequently reversed.
Negative goodwill is recognized directly in consolidated profit and loss account in the year of acquisition.
122122 CONSOLIDATED ANNUAL REPORT 2016-17
2.6 Foreign currencies These consolidated financial statements are presented in Pak Rupees, which is the Group’s
functional currency. All monetary assets and liabilities denominated in foreign currencies are translated into Pak Rupees at the rates of exchange prevailing at the balance sheet date, while the transactions in foreign currencies (except the results of foreign operation which are translated to Pak Rupees at the average rate of exchange for the year) during the year are initially recorded in functional currency at the rates of exchange prevailing at the transaction date. All non-monetary items are translated into Pak Rupees at exchange rates prevailing on the date of transaction or on the date when fair values are determined. Exchange gains and losses are recorded in the consolidated profit and loss account.
2.7 Property, plant, equipment and depreciation Owned Property, plant and equipment except freehold land and capital work-in-progress are stated
at cost less accumulated depreciation and accumulated impairment losses (if any). Cost of property, plant and equipment consists of historical cost, borrowing cost pertaining to erection / construction period of qualifying assets and other directly attributable costs of bringing the asset to working condition. Freehold land and capital work-in-progress are stated at cost less any recognized impairment loss.
Subsequent costs are included in the asset’s carrying amount or recognized as a separate asset,
as appropriate, only when it is probable that future economic benefits associated with the item will flow to the Group and the cost of the item can be measured reliably. All other repair and maintenance costs are charged to consolidated profit and loss account during the period in which they are incurred. Major spare parts and stand-by equipment qualify as property, plant and equipment when an entity expects to use them for more than one year. Transfers are made to relevant operating fixed assets category as and when such items are available for use.
Leased Leases where the Group has substantially all the risk and rewards of ownership are classified as
finance lease. Assets subject to finance lease are capitalized at the commencement of the lease term at the lower of present value of minimum lease payments under the lease agreements and the fair value of the leased assets, each determined at the inception of the lease.
The related rental obligation net of finance cost is included in liabilities against assets subject to finance lease. The liabilities are classified as current and long term depending upon the timing of payments.
Each lease payment is allocated between the liability and finance cost so as to achieve a
constant rate on the balance outstanding. The finance cost is charged to consolidated profit and loss account over the lease term.
Depreciation of assets subject to finance lease is recognized in the same manner as for owned
assets. Depreciation of the leased assets is charged to consolidated profit and loss account. Depreciation Depreciation on property, plant and equipment is charged to consolidated profit and loss account
applying the reducing balance method, except in case of Nishat Power Limited and Nishat Linen Trading LLC (Subsidiary Companies), where this accounting estimate is based on straight line method, so as to write off the cost / depreciable amount of the assets over their estimated useful
Notes to the Consolidated Financial Statements For the year ended June 30, 2017
123Nishat Mills Limited and its Subsidiaries
lives at the rates given in Note 13.1. The depreciation is charged on additions from the date when the asset is available for use and on deletions upto the date when the asset is de-recognized. The residual values and useful lives are reviewed by the management, at each financial year end and adjusted if impact on depreciation is significant.
De-recognition An item of property, plant and equipment is de-recognized upon disposal or when no future
economic benefits are expected from its use or disposal. Any gain or loss arising on de-recognition of the asset is included in the consolidated profit and loss account in the year the asset is de-recognized.
2.8 Investment properties Land and buildings held for capital appreciation or to earn rental income are classified as
investment properties. Investment properties except land, are stated at cost less accumulated depreciation and any recognized impairment loss. Land is stated at cost less any recognized impairment loss (if any). Depreciation is charged to consolidated profit and loss account applying the reducing balance method so as to write off the cost of buildings over its estimated useful lives at a rate of 10% per annum.
2.9 Intangible assets Amortization on additions to intangible assets is charged from the date when the asset is acquired
or capitalized upto the date when the asset is de-recognized. 2.10 Leases The Group Companies are the lessee: a) Operating leases Leases where a significant portion of the risks and rewards of ownership are retained by
the lessor are classified as operating leases. Payments made under operating leases (net of any incentives received from the lessor) are charged to consolidated profit and loss account on a straight line basis over the lease term.
2.11 Investments Classification of an investment is made on the basis of intended purpose for holding such
investment. Management determines the appropriate classification of its investments at the time of purchase and re-evaluates such designation on regular basis.
Investments are initially measured at fair value plus transaction costs directly attributable to
acquisition, except for “Investment at fair value through profit or loss” which is measured initially at fair value.
The Group assesses at the end of each reporting period whether there is any objective evidence
that investments are impaired. If any such evidence exists, the provisions of IAS 39 ‘Financial Instruments: Recognition and Measurement’ are applicable to all investments.
124124 CONSOLIDATED ANNUAL REPORT 2016-17
a) Investment at fair value through profit or loss Investments classified as held-for-trading and those designated as such are included in this
category. Investments are classified as held-for-trading if these are acquired for the purpose of selling in the short term. Gains or losses on investments held-for-trading are recognized in consolidated profit and loss account.
b) Held-to-maturity Investments with fixed or determinable payments and fixed maturity are classified as held-to-
maturity when there is positive intention and ability to hold to maturity. Investments intended to be held for an undefined period are not included in this classification. Other long-term investments that are intended to be held to maturity are subsequently measured at amortized cost. This cost is computed as the amount initially recognized minus principal repayments, plus or minus the cumulative amortization, using the effective interest method, of any difference between the initially recognized amount and the maturity amount. For investments carried at amortized cost, gains and losses are recognized in consolidated profit and loss account when the investments are de-recognized or impaired, as well as through the amortization process.
c) Available-for-sale Investments intended to be held for an indefinite period of time, which may be sold in response to
need for liquidity, or changes to interest rates or equity prices are classified as available-for-sale. After initial recognition, investments which are classified as available-for-sale are measured at fair value. Gains or losses on available-for-sale investments are recognized directly in consolidated statement of other comprehensive income until the investment is sold, de-recognized or is determined to be impaired, at which time the cumulative gain or loss previously reported in consolidated statement of other comprehensive income is included in consolidated profit and loss account. These are sub-categorized as under:
Quoted For investments that are actively traded in organized capital markets, fair value is determined
with reference to stock exchange quoted market bids at the close of business on the balance sheet date.
Unquoted Fair value of unquoted investments is determined on the basis of appropriate valuation techniques
as allowed by IAS 39 ‘Financial Instruments: Recognition and Measurement’. 2.12 Inventories Inventories, except for stock in transit and waste stock / rags are stated at lower of cost and net
realizable value. Cost is determined as follows: Stores, spare parts and loose tools Useable stores, spare parts and loose tools are valued principally at moving average cost, while
items considered obsolete are carried at nil value. Items in transit are valued at cost comprising invoice value plus other charges paid thereon.
Notes to the Consolidated Financial Statements For the year ended June 30, 2017
125Nishat Mills Limited and its Subsidiaries
Stock-in-trade Cost of raw material, work-in-process and finished goods is determined as follows:
i) For raw materials: Annual average basis. ii) For work-in-process and finished goods: Average manufacturing cost including a portion of production overheads. Materials in transit are valued at cost comprising invoice value plus other charges paid thereon.
Waste stock / rags are valued at net realizable value. Net realizable value signifies the estimated selling price in the ordinary course of business less
the estimated costs of completion and the estimated costs necessary to make a sale.
2.13 Trade and other receivables Trade debts and other receivables are carried at original invoice value less an estimate made
for doubtful debts based on a review of all outstanding amounts at the year end. Bad debts are written off when identified.
2.14 Non–current assets (or disposal groups) held for sale Non-current assets (or disposal groups) are classified as assets held for sale when their carrying
amount is to be recovered principally through a sale transaction and a sale is considered highly probable. They are stated at the lower of carrying amount and fair value less costs to sell.
2.15 Borrowings Borrowings are recognized initially at fair value and are subsequently stated at amortized cost.
Any difference between the proceeds and the redemption value is recognized in the consolidated profit and loss account over the period of the borrowings using the effective interest method.
2.16 Borrowing cost Interest, mark-up and other charges on finances are capitalized up to the date of commissioning
of respective qualifying assets acquired out of the proceeds of such finances. All other interest, mark-up and other charges are recognized in consolidated profit and loss account.
2.17 Share capital Ordinary shares are classified as equity and recognized at their face value. Incremental costs
directly attributable to the issuance of new shares are shown in equity as a deduction, net of tax, if any.
2.18 Trade and other payables Liabilities for trade and other amounts payable are initially recognized at fair value, which is
normally the transaction cost. 2.19 Revenue recognition Revenue from different sources is recognized as under: - Revenue from sale of goods is recognized on dispatch of goods to customers.
- Revenue on account of energy is recognized at the time of transmission whereas on
account of capacity is recognized when due.
126126 CONSOLIDATED ANNUAL REPORT 2016-17
- The share of profits or losses of the associated companies after tax is included in the consolidated profit and loss account to recognize the post acquisition changes in the share of the net assets of the investees. Dividend from associated companies is recognized as reduction in cost of investments as prescribed by International Accounting Standard (IAS) 28 ‘Investments in Associates’.
- Dividend on other equity investments is recognized when right to receive the dividend is
established. - Operating lease rentals are recorded in profit and loss account on a time proportion basis
over the term of the lease arrangements. - Profit on deposits with banks is recognized on time proportion basis taking into account
the amounts outstanding and rates applicable thereon. - Revenue from hotel business is generally recognized as services are performed. Hotel
revenue primarily represents room rentals and other minor hotel revenues.
2.20 Financial instruments Financial instruments carried on the balance sheet include investments, deposits, trade debts,
loans and advances, other receivables, cash and bank balances, long-term financing, short-term borrowings, accrued mark-up and trade and other payables etc. Financial assets and liabilities are recognized when the Group becomes a party to the contractual provisions of instrument. Initial recognition is made at fair value plus transaction costs directly attributable to acquisition, except for “financial instruments at fair value through profit or loss” which is initially measured at fair value.
Financial assets are de-recognized when the Group loses control of the contractual rights that
comprise the financial asset. The Group loses such control if it realizes the rights to benefits specified in contract, the rights expire or the Group surrenders those rights. Financial liabilities are de-recognized when the obligation specified in the contract is discharged, cancelled or expired. Any gain or loss on subsequent measurement (except available for sale investments) and de-recognition is charged to the consolidated profit or loss currently. The particular measurement methods adopted are disclosed in the individual policy statements associated with each item and in the accounting policy of investments.
2.21 Provisions Provisions are recognized when the Group has a legal or constructive obligation as a result of
past events and it is probable that an outflow of resources embodying economic benefits will be required to settle the obligations and a reliable estimate of the amount can be made.
2.22 Impairment a) Financial assets A financial asset is considered to be impaired if objective evidence indicate that one or more
events had a negative effect on the estimated future cash flows of that asset. An impairment loss in respect of a financial asset measured at amortized cost is calculated as
a difference between its carrying amount and the present value of estimated future cash flows discounted at the original effective interest rate. An impairment loss in respect of available for sale financial asset is calculated with reference to its current fair value.
Notes to the Consolidated Financial Statements For the year ended June 30, 2017
127Nishat Mills Limited and its Subsidiaries
Individually significant financial assets are tested for impairment on an individual basis. The remaining financial assets are assessed collectively in groups that share similar credit risk characteristics.
b) Non-financial assets The carrying amounts of the non-financial assets are reviewed at each balance sheet date to
determine whether there is any indication of impairment. If such indication exists, the recoverable amount of such asset is estimated. An impairment loss is recognized wherever the carrying amount of the asset exceeds its recoverable amount. Impairment losses are recognized in consolidated profit and loss account. A previously recognized impairment loss is reversed only if there has been a change in the estimates used to determine the asset’s recoverable amount since the last impairment loss was recognized. If that is the case, the carrying amount of the asset is increased to its recoverable amount. That increased amount cannot exceed the carrying amount that would have been determined, net of depreciation, had no impairment loss been recognized for the asset in prior years. Such reversal is recognized in consolidated profit and loss account.
2.23 Derivative financial instruments Derivative that do not qualify for hedge accounting are recognized in the consolidated balance
sheet at estimated fair value with corresponding effect to consolidated profit and loss account. Derivative financial instruments are carried as assets when fair value is positive and liabilities when fair value is negative.
2.24 Off setting Financial assets and financial liabilities are set off and the net amount is reported in the
consolidated financial statements when there is a legal enforceable right to set off and the management intends either to settle on a net basis or to realize the assets and to settle the liabilities simultaneously.
2.25 Cash and cash equivalents Cash and cash equivalents comprise cash in hand, cash at banks on current, saving and deposit
accounts and other short term highly liquid instruments that are readily convertible into known amounts of cash and which are subject to insignificant risk of changes in values.
2.26 Segment reporting Segment reporting is based on the operating (business) segments of the Group. An operating
segment is a component of the Group that engages in business activities from which it may earn revenues and incur expenses, including revenues and expenses that relate to the transactions with any of the Group’s other components. An operating segment’s operating results are reviewed regularly by the Group’s chief operating decision makers to make decisions about resources to be allocated to the segment and assess its performance, and for which discrete financial information is available.
Segment results that are reported to the chief operating decision makers include items directly
attributable to a segment as well as those that can be allocated on a reasonable basis. Those incomes, expenses, assets, liabilities and other balances which can not be allocated to a particular segment on a reasonable basis are reported as unallocated.
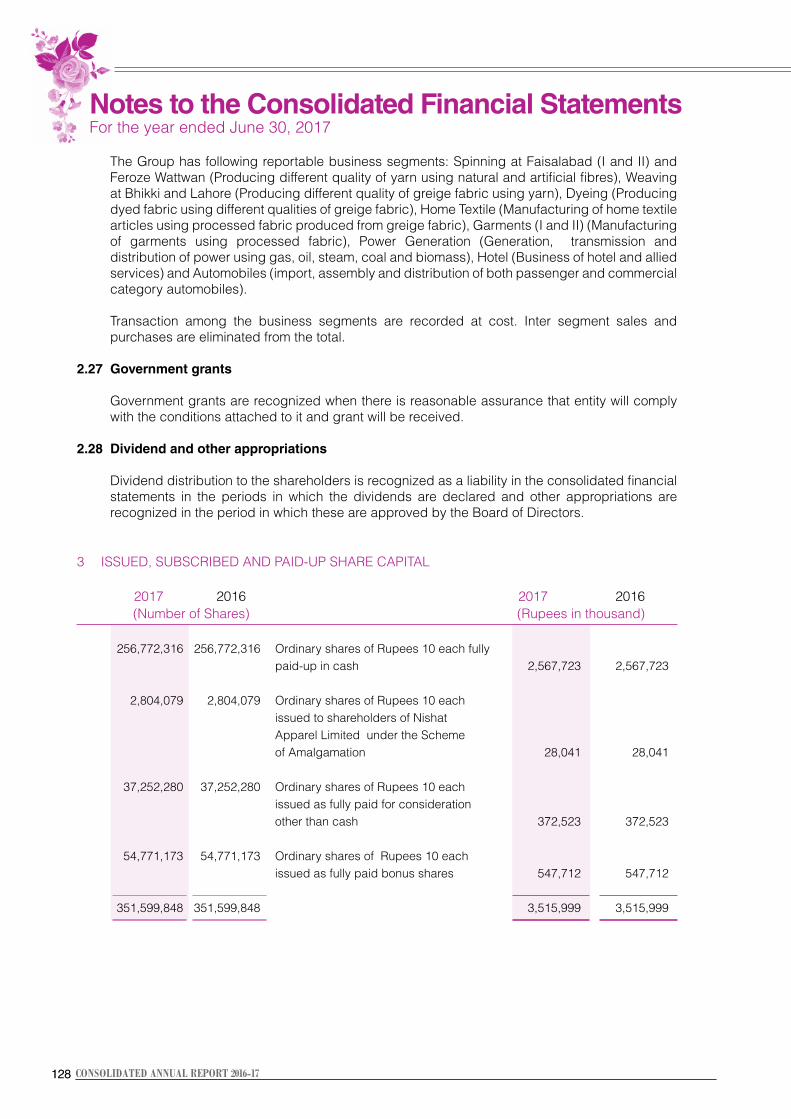
128128 CONSOLIDATED ANNUAL REPORT 2016-17
The Group has following reportable business segments: Spinning at Faisalabad (I and II) and Feroze Wattwan (Producing different quality of yarn using natural and artificial fibres), Weaving at Bhikki and Lahore (Producing different quality of greige fabric using yarn), Dyeing (Producing dyed fabric using different qualities of greige fabric), Home Textile (Manufacturing of home textile articles using processed fabric produced from greige fabric), Garments (I and II) (Manufacturing of garments using processed fabric), Power Generation (Generation, transmission and distribution of power using gas, oil, steam, coal and biomass), Hotel (Business of hotel and allied services) and Automobiles (import, assembly and distribution of both passenger and commercial category automobiles).
Transaction among the business segments are recorded at cost. Inter segment sales and
purchases are eliminated from the total. 2.27 Government grants Government grants are recognized when there is reasonable assurance that entity will comply
with the conditions attached to it and grant will be received. 2.28 Dividend and other appropriations Dividend distribution to the shareholders is recognized as a liability in the consolidated financial
statements in the periods in which the dividends are declared and other appropriations are recognized in the period in which these are approved by the Board of Directors.
3 ISSUED, SUBSCRIBED AND PAID-UP SHARE CAPITAL 2017 2016 2017 2016 (Number of Shares) (Rupees in thousand)
256,772,316 256,772,316 Ordinary shares of Rupees 10 each fully paid-up in cash 2,567,723 2,567,723 2,804,079 2,804,079 Ordinary shares of Rupees 10 each issued to shareholders of Nishat Apparel Limited under the Scheme of Amalgamation 28,041 28,041 37,252,280 37,252,280 Ordinary shares of Rupees 10 each issued as fully paid for consideration other than cash 372,523 372,523 54,771,173 54,771,173 Ordinary shares of Rupees 10 each issued as fully paid bonus shares 547,712 547,712 351,599,848 351,599,848 3,515,999 3,515,999
Notes to the Consolidated Financial Statements For the year ended June 30, 2017
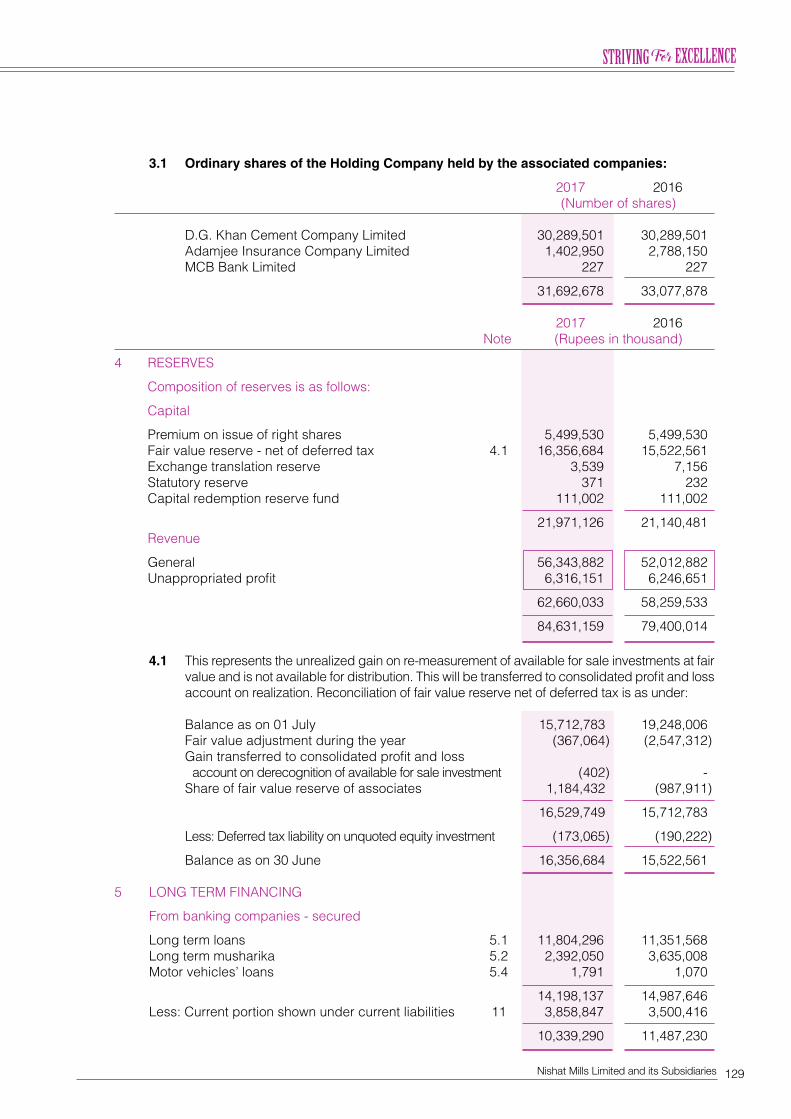
129Nishat Mills Limited and its Subsidiaries
3.1 Ordinary shares of the Holding Company held by the associated companies: 2017 2016 (Number of shares) D.G. Khan Cement Company Limited 30,289,501 30,289,501 Adamjee Insurance Company Limited 1,402,950 2,788,150 MCB Bank Limited 227 227 31,692,678 33,077,878
2017 2016 Note (Rupees in thousand) 4 RESERVES Composition of reserves is as follows: Capital Premium on issue of right shares 5,499,530 5,499,530 Fair value reserve - net of deferred tax 4.1 16,356,684 15,522,561 Exchange translation reserve 3,539 7,156 Statutory reserve 371 232 Capital redemption reserve fund 111,002 111,002 21,971,126 21,140,481 Revenue General 56,343,882 52,012,882 Unappropriated profit 6,316,151 6,246,651 62,660,033 58,259,533 84,631,159 79,400,014 4.1 This represents the unrealized gain on re-measurement of available for sale investments at fair
value and is not available for distribution. This will be transferred to consolidated profit and loss account on realization. Reconciliation of fair value reserve net of deferred tax is as under:
Balance as on 01 July 15,712,783 19,248,006 Fair value adjustment during the year (367,064) (2,547,312) Gain transferred to consolidated profit and loss account on derecognition of available for sale investment (402) - Share of fair value reserve of associates 1,184,432 (987,911) 16,529,749 15,712,783 Less: Deferred tax liability on unquoted equity investment (173,065) (190,222) Balance as on 30 June 16,356,684 15,522,561 5 LONG TERM FINANCING From banking companies - secured Long term loans 5.1 11,804,296 11,351,568 Long term musharika 5.2 2,392,050 3,635,008 Motor vehicles’ loans 5.4 1,791 1,070 14,198,137 14,987,646 Less: Current portion shown under current liabilities 11 3,858,847 3,500,416 10,339,290 11,487,230
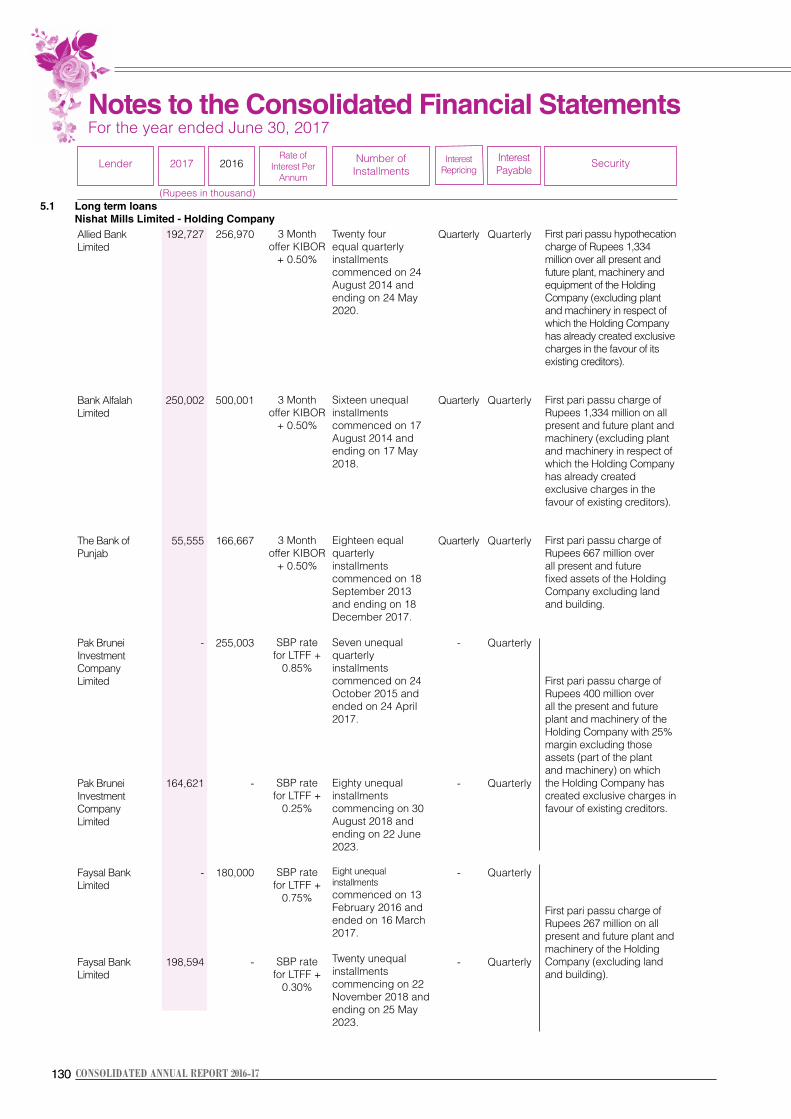
130130 CONSOLIDATED ANNUAL REPORT 2016-17
Allied Bank Limited
Bank Alfalah Limited
The Bank of Punjab
Pak Brunei InvestmentCompany Limited
Pak Brunei InvestmentCompany Limited
Faysal Bank Limited
Faysal Bank Limited
192,727
250,002
55,555
-
164,621
-
198,594
256,970
500,001
166,667
255,003
-
180,000
-
Quarterly
Quarterly
Quarterly
-
-
-
-
Quarterly
Quarterly
Quarterly
Quarterly
Quarterly
Quarterly
Quarterly
3 Month offer KIBOR
+ 0.50%
3 Month offer KIBOR
+ 0.50%
3 Month offer KIBOR
+ 0.50%
SBP rate for LTFF +
0.85%
SBP rate for LTFF +
0.25%
SBP rate for LTFF +
0.75%
SBP rate for LTFF +
0.30%
Twenty four equal quarterly installments commenced on 24 August 2014 and ending on 24 May 2020.
Sixteen unequal installments commenced on 17 August 2014 and ending on 17 May 2018.
Eighteen equal quarterly installments commenced on 18 September 2013 and ending on 18 December 2017. Seven unequal quarterly installments commenced on 24 October 2015 and ended on 24 April 2017.
Eighty unequal installments commencing on 30 August 2018 and ending on 22 June 2023. Eight unequal installments commenced on 13 February 2016 and ended on 16 March 2017. Twenty unequal installments commencing on 22 November 2018 and ending on 25 May 2023.
First pari passu hypothecation charge of Rupees 1,334 million over all present and future plant, machinery and equipment of the Holding Company (excluding plant and machinery in respect of which the Holding Company has already created exclusive charges in the favour of its existing creditors).
First pari passu charge of Rupees 1,334 million on all present and future plant and machinery (excluding plant and machinery in respect of which the Holding Company has already created exclusive charges in the favour of existing creditors).
First pari passu charge of Rupees 667 million over all present and future fixed assets of the Holding Company excluding land and building.
First pari passu charge of Rupees 400 million over all the present and future plant and machinery of the Holding Company with 25% margin excluding those assets (part of the plant and machinery) on which the Holding Company has created exclusive charges in favour of existing creditors.
First pari passu charge of Rupees 267 million on all present and future plant and machinery of the Holding Company (excluding land and building).
Lender 2017 2016 InterestRepricing
InterestPayable
Rate ofInterest Per
Annum
Number ofInstallments
Security
(Rupees in thousand)5.1 Long term loans Nishat Mills Limited - Holding Company
Notes to the Consolidated Financial Statements For the year ended June 30, 2017
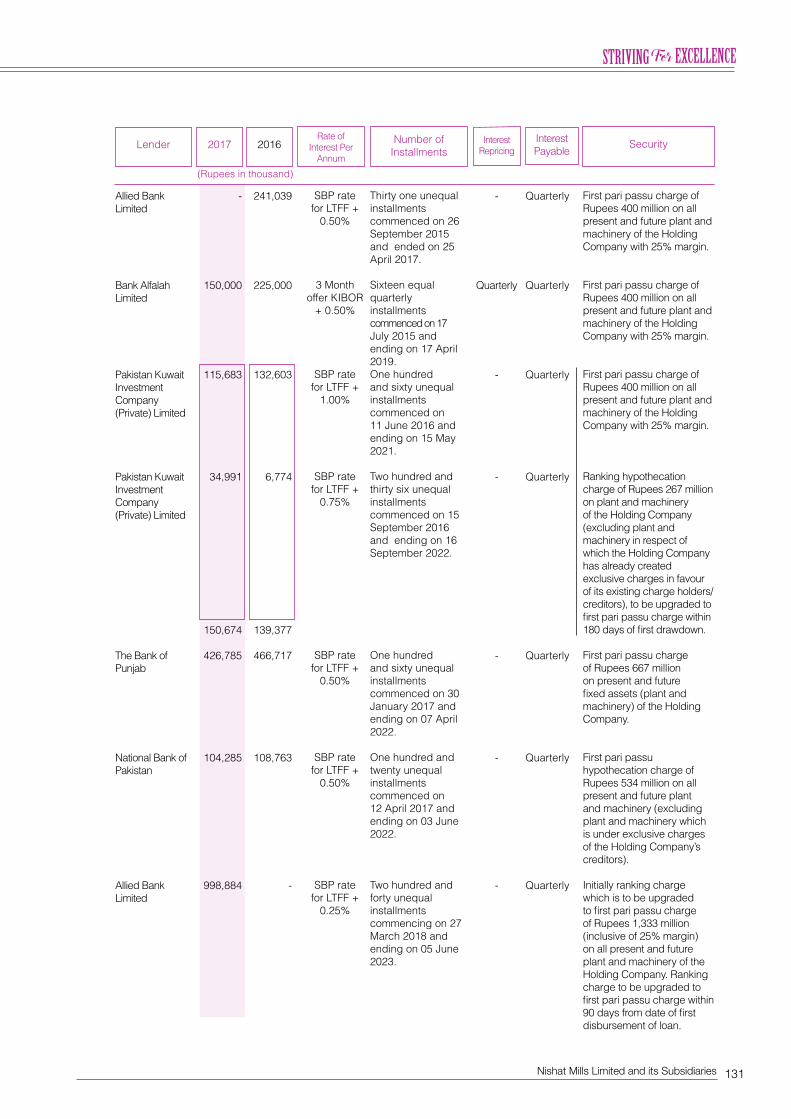
131Nishat Mills Limited and its Subsidiaries
Allied Bank Limited
Bank Alfalah Limited
Pakistan Kuwait InvestmentCompany (Private) Limited
Pakistan Kuwait InvestmentCompany (Private) Limited
The Bank of Punjab
National Bank of Pakistan
Allied Bank Limited
-
150,000
115,683
34,991
150,674
426,785
104,285
998,884
241,039
225,000
132,603
6,774
139,377
466,717
108,763
-
-
Quarterly
-
-
-
-
-
Quarterly
Quarterly
Quarterly
Quarterly
Quarterly
Quarterly
Quarterly
SBP rate for LTFF +
0.50%
3 Month offer KIBOR
+ 0.50%
SBP rate for LTFF +
1.00%
SBP rate for LTFF +
0.75%
SBP rate for LTFF +
0.50%
SBP rate for LTFF +
0.50%
SBP rate for LTFF +
0.25%
Thirty one unequal installments commenced on 26 September 2015 and ended on 25 April 2017. Sixteen equal quarterly installments commenced on 17 July 2015 and ending on 17 April 2019. One hundred and sixty unequal installments commenced on 11 June 2016 and ending on 15 May 2021. Two hundred and thirty six unequal installments commenced on 15 September 2016 and ending on 16 September 2022.
One hundred and sixty unequal installments commenced on 30 January 2017 and ending on 07 April 2022. One hundred and twenty unequal installments commenced on 12 April 2017 and ending on 03 June 2022. Two hundred and forty unequal installments commencing on 27 March 2018 and ending on 05 June 2023.
First pari passu charge of Rupees 400 million on all present and future plant and machinery of the Holding Company with 25% margin. First pari passu charge of Rupees 400 million on all present and future plant and machinery of the Holding Company with 25% margin. First pari passu charge of Rupees 400 million on all present and future plant and machinery of the Holding Company with 25% margin.
Ranking hypothecation charge of Rupees 267 million on plant and machinery of the Holding Company (excluding plant and machinery in respect of which the Holding Company has already created exclusive charges in favour of its existing charge holders/creditors), to be upgraded to first pari passu charge within 180 days of first drawdown. First pari passu charge of Rupees 667 million on present and future fixed assets (plant and machinery) of the Holding Company.
First pari passu hypothecation charge of Rupees 534 million on all present and future plant and machinery (excluding plant and machinery which is under exclusive charges of the Holding Company’s creditors). Initially ranking charge which is to be upgraded to first pari passu charge of Rupees 1,333 million (inclusive of 25% margin) on all present and future plant and machinery of the Holding Company. Ranking charge to be upgraded to first pari passu charge within 90 days from date of first disbursement of loan.
Lender 2017 2016 InterestRepricing
InterestPayable
Rate ofInterest Per
Annum
Number ofInstallments
Security
(Rupees in thousand)
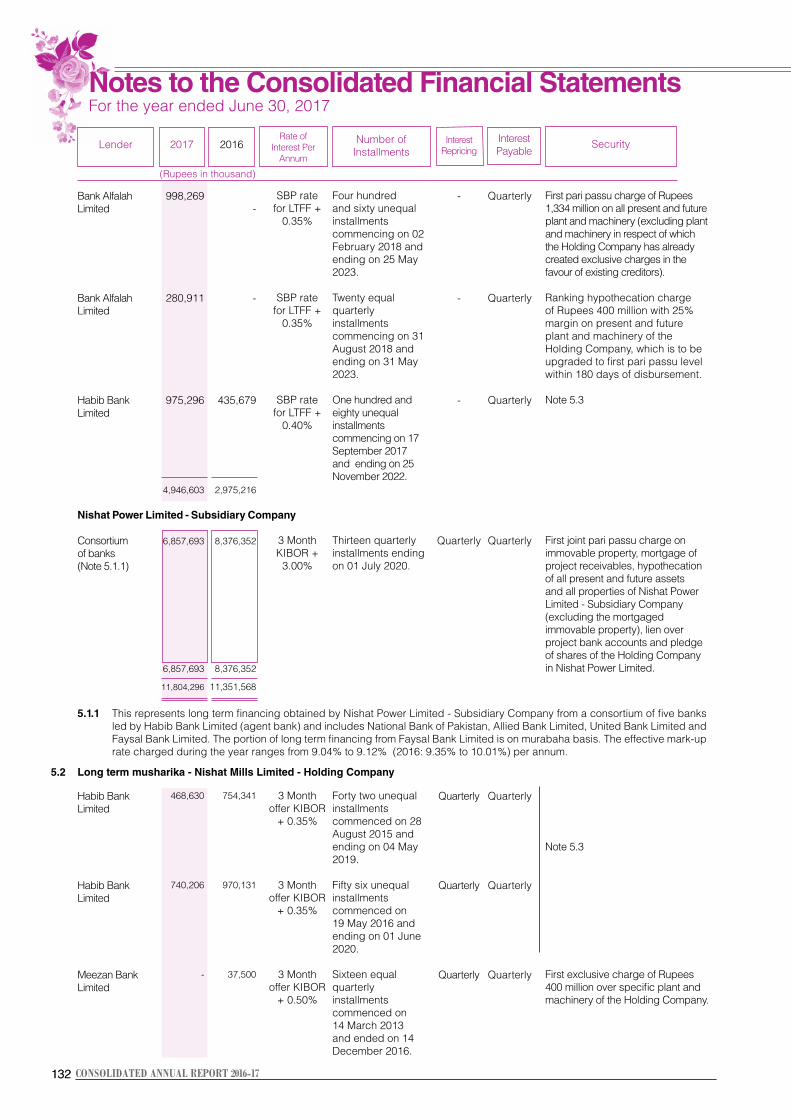
132132 CONSOLIDATED ANNUAL REPORT 2016-17
Bank Alfalah Limited
Bank Alfalah Limited
Habib Bank Limited
Consortium of banks (Note 5.1.1)
Habib Bank Limited
Habib Bank Limited
Meezan Bank Limited
998,269
280,911
975,296
4,946,603
6,857,693
6,857,693
11,804,296
468,630
740,206
-
-
-
435,679
2,975,216
8,376,352
8,376,352
11,351,568
754,341
970,131
37,500
-
-
-
Quarterly
Quarterly
Quarterly
Quarterly
Quarterly
Quarterly
Quarterly
Quarterly
Quarterly
Quarterly
Quarterly
SBP rate for LTFF +
0.35%
SBP rate for LTFF +
0.35%
SBP rate for LTFF +
0.40%
3 Month KIBOR +
3.00%
3 Month offer KIBOR
+ 0.35%
3 Month offer KIBOR
+ 0.35%
3 Month offer KIBOR
+ 0.50%
Four hundred and sixty unequal installments commencing on 02 February 2018 and ending on 25 May 2023.
Twenty equal quarterly installments commencing on 31 August 2018 and ending on 31 May 2023. One hundred and eighty unequal installments commencing on 17 September 2017 and ending on 25 November 2022. Thirteen quarterly installments ending on 01 July 2020.
Forty two unequal installments commenced on 28 August 2015 and ending on 04 May 2019. Fifty six unequal installments commenced on 19 May 2016 and ending on 01 June 2020. Sixteen equal quarterly installments commenced on 14 March 2013 and ended on 14 December 2016.
First pari passu charge of Rupees 1,334 million on all present and future plant and machinery (excluding plant and machinery in respect of which the Holding Company has already created exclusive charges in the favour of existing creditors). Ranking hypothecation charge of Rupees 400 million with 25% margin on present and future plant and machinery of the Holding Company, which is to be upgraded to first pari passu level within 180 days of disbursement. Note 5.3
First joint pari passu charge on immovable property, mortgage of project receivables, hypothecation of all present and future assets and all properties of Nishat Power Limited - Subsidiary Company (excluding the mortgaged immovable property), lien over project bank accounts and pledge of shares of the Holding Company in Nishat Power Limited.
Note 5.3
First exclusive charge of Rupees 400 million over specific plant and machinery of the Holding Company.
Nishat Power Limited - Subsidiary Company
5.2 Long term musharika - Nishat Mills Limited - Holding Company
Lender 2017 2016 InterestRepricing
InterestPayable
Rate ofInterest Per
Annum
Number ofInstallments
Security
(Rupees in thousand)
5.1.1 This represents long term financing obtained by Nishat Power Limited - Subsidiary Company from a consortium of five banks led by Habib Bank Limited (agent bank) and includes National Bank of Pakistan, Allied Bank Limited, United Bank Limited and Faysal Bank Limited. The portion of long term financing from Faysal Bank Limited is on murabaha basis. The effective mark-up rate charged during the year ranges from 9.04% to 9.12% (2016: 9.35% to 10.01%) per annum.
Notes to the Consolidated Financial Statements For the year ended June 30, 2017
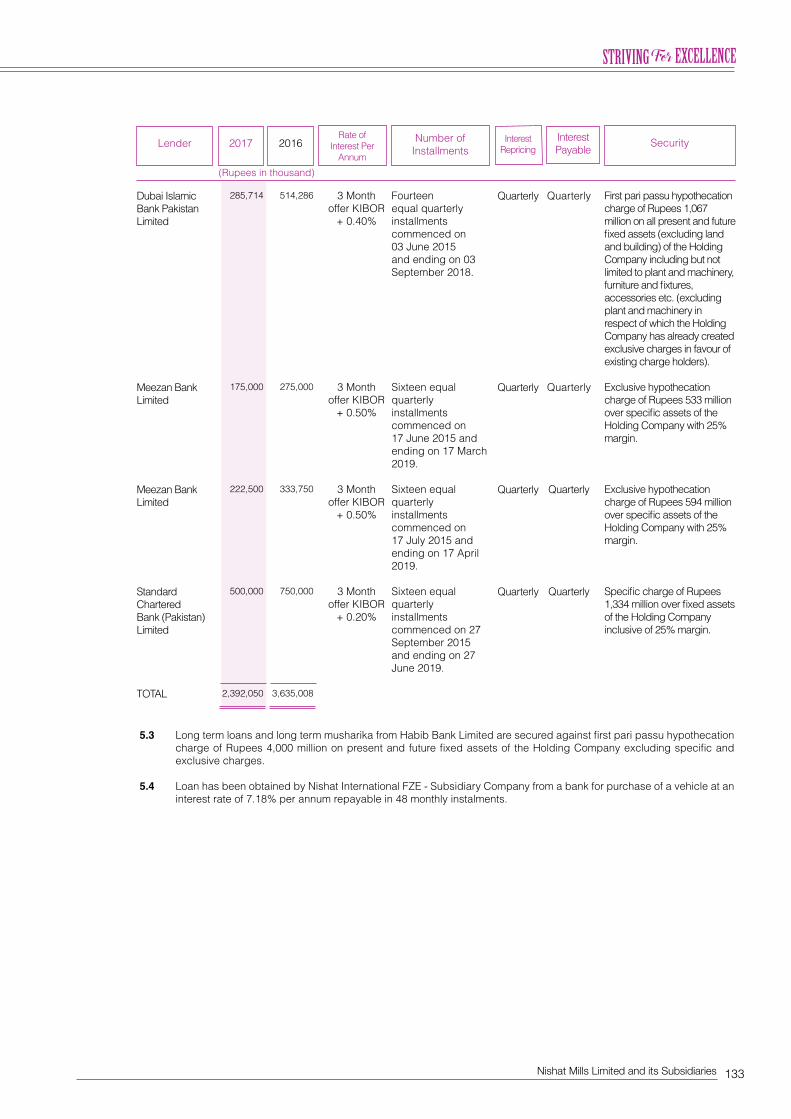
133Nishat Mills Limited and its Subsidiaries
Dubai Islamic Bank Pakistan Limited
Meezan Bank Limited
Meezan Bank Limited
Standard Chartered Bank (Pakistan) Limited
TOTAL
285,714
175,000
222,500
500,000
2,392,050
514,286
275,000
333,750
750,000
3,635,008
Quarterly
Quarterly
Quarterly
Quarterly
Quarterly
Quarterly
Quarterly
Quarterly
3 Month offer KIBOR
+ 0.40%
3 Month offer KIBOR
+ 0.50%
3 Month offer KIBOR
+ 0.50%
3 Month offer KIBOR
+ 0.20%
Fourteen equal quarterly installments commenced on 03 June 2015 and ending on 03 September 2018.
Sixteen equal quarterly installments commenced on 17 June 2015 and ending on 17 March 2019. Sixteen equal quarterly installments commenced on 17 July 2015 and ending on 17 April 2019. Sixteen equal quarterly installments commenced on 27 September 2015 and ending on 27 June 2019.
First pari passu hypothecation charge of Rupees 1,067 million on all present and future fixed assets (excluding land and building) of the Holding Company including but not limited to plant and machinery, furniture and fixtures, accessories etc. (excluding plant and machinery in respect of which the Holding Company has already created exclusive charges in favour of existing charge holders). Exclusive hypothecation charge of Rupees 533 million over specific assets of the Holding Company with 25% margin.
Exclusive hypothecation charge of Rupees 594 million over specific assets of the Holding Company with 25% margin.
Specific charge of Rupees 1,334 million over fixed assets of the Holding Company inclusive of 25% margin.
5.3 Long term loans and long term musharika from Habib Bank Limited are secured against first pari passu hypothecation charge of Rupees 4,000 million on present and future fixed assets of the Holding Company excluding specific and exclusive charges.
5.4 Loan has been obtained by Nishat International FZE - Subsidiary Company from a bank for purchase of a vehicle at an interest rate of 7.18% per annum repayable in 48 monthly instalments.
Lender 2017 2016 InterestRepricing
InterestPayable
Rate ofInterest Per
Annum
Number ofInstallments
Security
(Rupees in thousand)
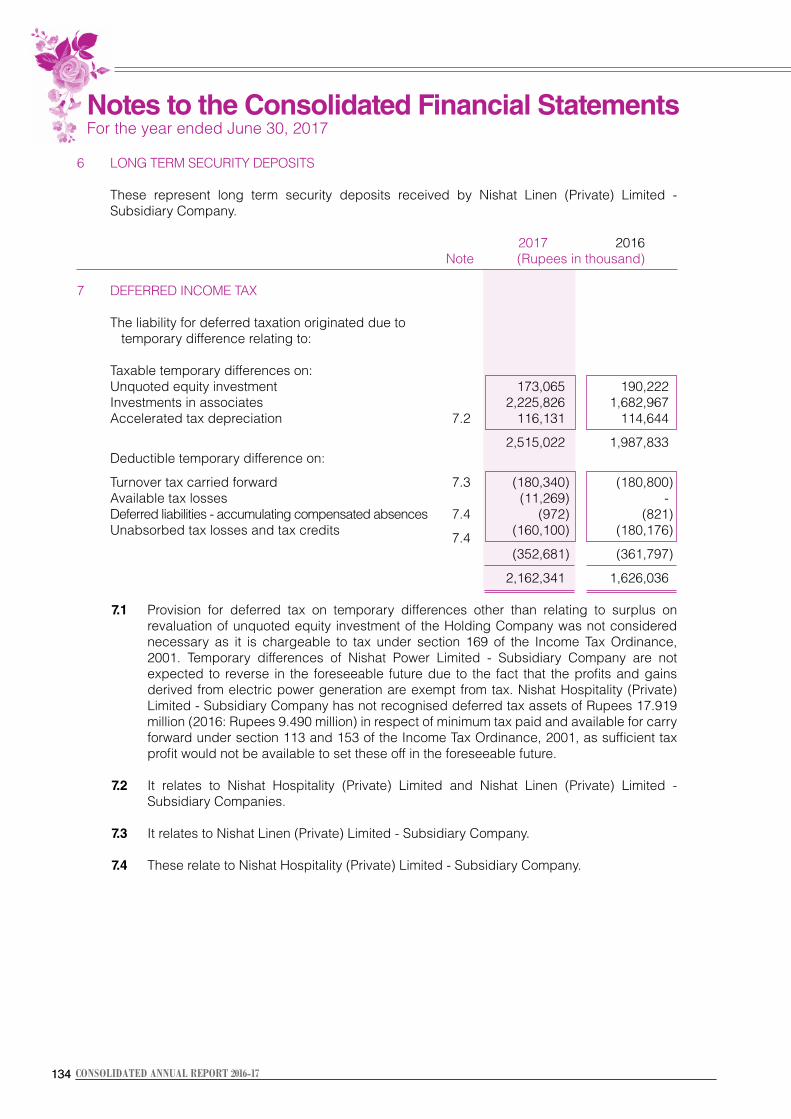
134134 CONSOLIDATED ANNUAL REPORT 2016-17
6 LONG TERM SECURITY DEPOSITS These represent long term security deposits received by Nishat Linen (Private) Limited -
Subsidiary Company. 2017 2016 Note (Rupees in thousand) 7 DEFERRED INCOME TAX The liability for deferred taxation originated due to temporary difference relating to:
Taxable temporary differences on: Unquoted equity investment 173,065 190,222 Investments in associates 2,225,826 1,682,967 Accelerated tax depreciation 7.2 116,131 114,644 2,515,022 1,987,833 Deductible temporary difference on: Turnover tax carried forward 7.3 (180,340) (180,800) Available tax losses (11,269) - Deferred liabilities - accumulating compensated absences 7.4 (972) (821) Unabsorbed tax losses and tax credits (160,100) (180,176) 7.4 (352,681) (361,797) 2,162,341 1,626,036
7.1 Provision for deferred tax on temporary differences other than relating to surplus on revaluation of unquoted equity investment of the Holding Company was not considered necessary as it is chargeable to tax under section 169 of the Income Tax Ordinance, 2001. Temporary differences of Nishat Power Limited - Subsidiary Company are not expected to reverse in the foreseeable future due to the fact that the profits and gains derived from electric power generation are exempt from tax. Nishat Hospitality (Private) Limited - Subsidiary Company has not recognised deferred tax assets of Rupees 17.919 million (2016: Rupees 9.490 million) in respect of minimum tax paid and available for carry forward under section 113 and 153 of the Income Tax Ordinance, 2001, as sufficient tax profit would not be available to set these off in the foreseeable future.
7.2 It relates to Nishat Hospitality (Private) Limited and Nishat Linen (Private) Limited -
Subsidiary Companies. 7.3 It relates to Nishat Linen (Private) Limited - Subsidiary Company. 7.4 These relate to Nishat Hospitality (Private) Limited - Subsidiary Company.
Notes to the Consolidated Financial Statements For the year ended June 30, 2017
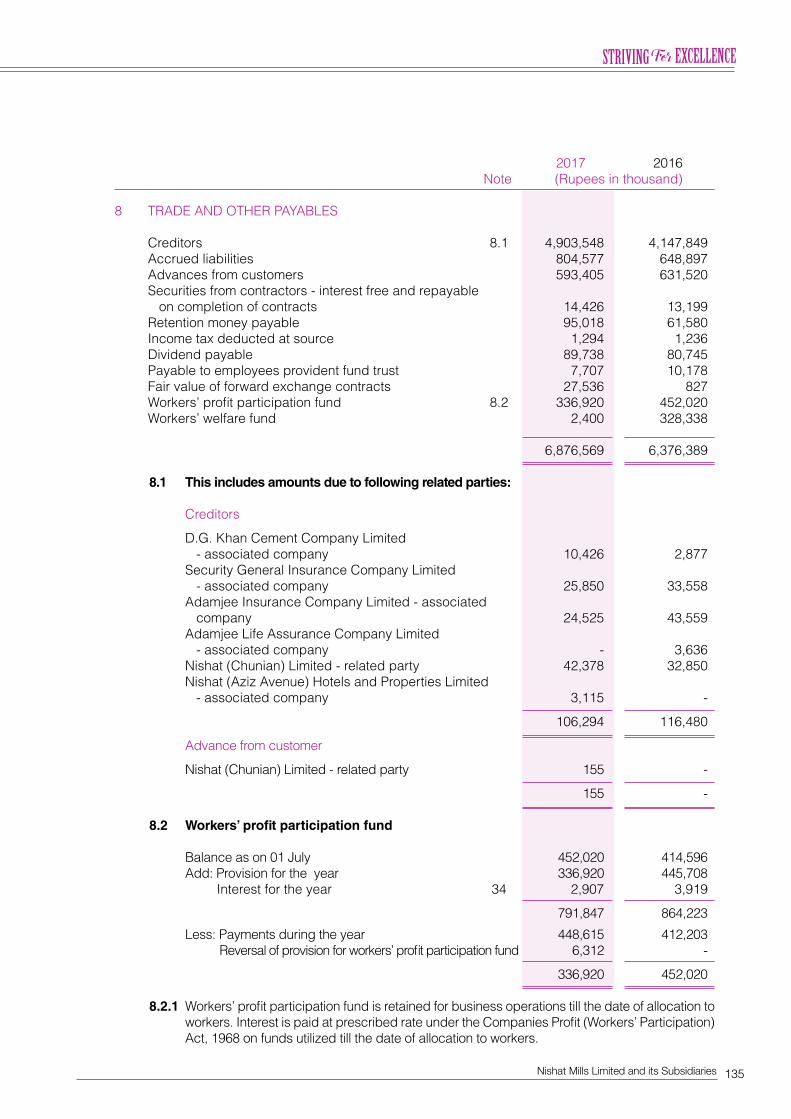
135Nishat Mills Limited and its Subsidiaries
2017 2016 Note (Rupees in thousand)
8 TRADE AND OTHER PAYABLES Creditors 8.1 4,903,548 4,147,849 Accrued liabilities 804,577 648,897 Advances from customers 593,405 631,520 Securities from contractors - interest free and repayable on completion of contracts 14,426 13,199 Retention money payable 95,018 61,580 Income tax deducted at source 1,294 1,236 Dividend payable 89,738 80,745 Payable to employees provident fund trust 7,707 10,178 Fair value of forward exchange contracts 27,536 827 Workers’ profit participation fund 8.2 336,920 452,020 Workers’ welfare fund 2,400 328,338 6,876,569 6,376,389
8.1 This includes amounts due to following related parties:
Creditors D.G. Khan Cement Company Limited - associated company 10,426 2,877 Security General Insurance Company Limited - associated company 25,850 33,558 Adamjee Insurance Company Limited - associated company 24,525 43,559 Adamjee Life Assurance Company Limited - associated company - 3,636 Nishat (Chunian) Limited - related party 42,378 32,850 Nishat (Aziz Avenue) Hotels and Properties Limited - associated company 3,115 - 106,294 116,480 Advance from customer Nishat (Chunian) Limited - related party 155 - 155 - 8.2 Workers’ profit participation fund Balance as on 01 July 452,020 414,596 Add: Provision for the year 336,920 445,708 Interest for the year 34 2,907 3,919 791,847 864,223 Less: Payments during the year 448,615 412,203 Reversal of provision for workers’ profit participation fund 6,312 - 336,920 452,020 8.2.1 Workers’ profit participation fund is retained for business operations till the date of allocation to
workers. Interest is paid at prescribed rate under the Companies Profit (Workers’ Participation) Act, 1968 on funds utilized till the date of allocation to workers.
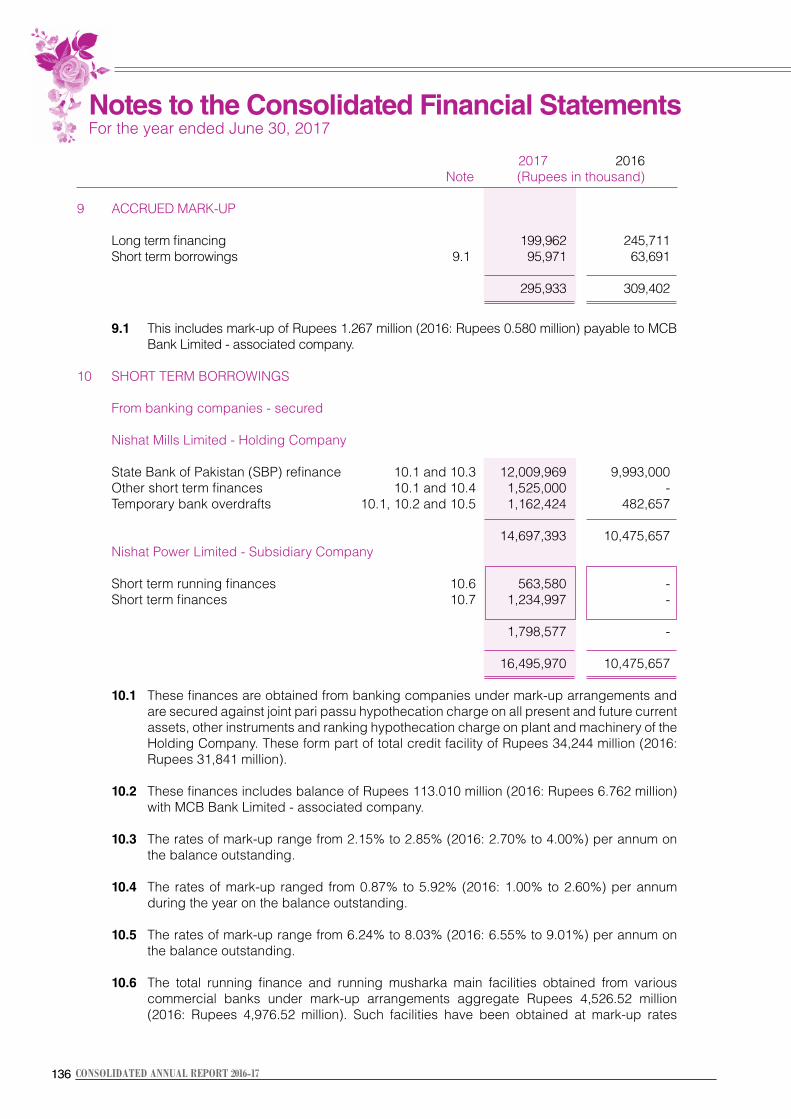
136136 CONSOLIDATED ANNUAL REPORT 2016-17
2017 2016 Note (Rupees in thousand)
9 ACCRUED MARK-UP Long term financing 199,962 245,711 Short term borrowings 9.1 95,971 63,691
295,933 309,402
9.1 This includes mark-up of Rupees 1.267 million (2016: Rupees 0.580 million) payable to MCB Bank Limited - associated company.
10 SHORT TERM BORROWINGS From banking companies - secured
Nishat Mills Limited - Holding Company State Bank of Pakistan (SBP) refinance 10.1 and 10.3 12,009,969 9,993,000 Other short term finances 10.1 and 10.4 1,525,000 - Temporary bank overdrafts 10.1, 10.2 and 10.5 1,162,424 482,657
14,697,393 10,475,657 Nishat Power Limited - Subsidiary Company Short term running finances 10.6 563,580 - Short term finances 10.7 1,234,997 -
1,798,577 -
16,495,970 10,475,657 10.1 These finances are obtained from banking companies under mark-up arrangements and
are secured against joint pari passu hypothecation charge on all present and future current assets, other instruments and ranking hypothecation charge on plant and machinery of the Holding Company. These form part of total credit facility of Rupees 34,244 million (2016: Rupees 31,841 million).
10.2 These finances includes balance of Rupees 113.010 million (2016: Rupees 6.762 million)
with MCB Bank Limited - associated company. 10.3 The rates of mark-up range from 2.15% to 2.85% (2016: 2.70% to 4.00%) per annum on
the balance outstanding. 10.4 The rates of mark-up ranged from 0.87% to 5.92% (2016: 1.00% to 2.60%) per annum
during the year on the balance outstanding. 10.5 The rates of mark-up range from 6.24% to 8.03% (2016: 6.55% to 9.01%) per annum on
the balance outstanding. 10.6 The total running finance and running musharka main facilities obtained from various
commercial banks under mark-up arrangements aggregate Rupees 4,526.52 million (2016: Rupees 4,976.52 million). Such facilities have been obtained at mark-up rates
Notes to the Consolidated Financial Statements For the year ended June 30, 2017
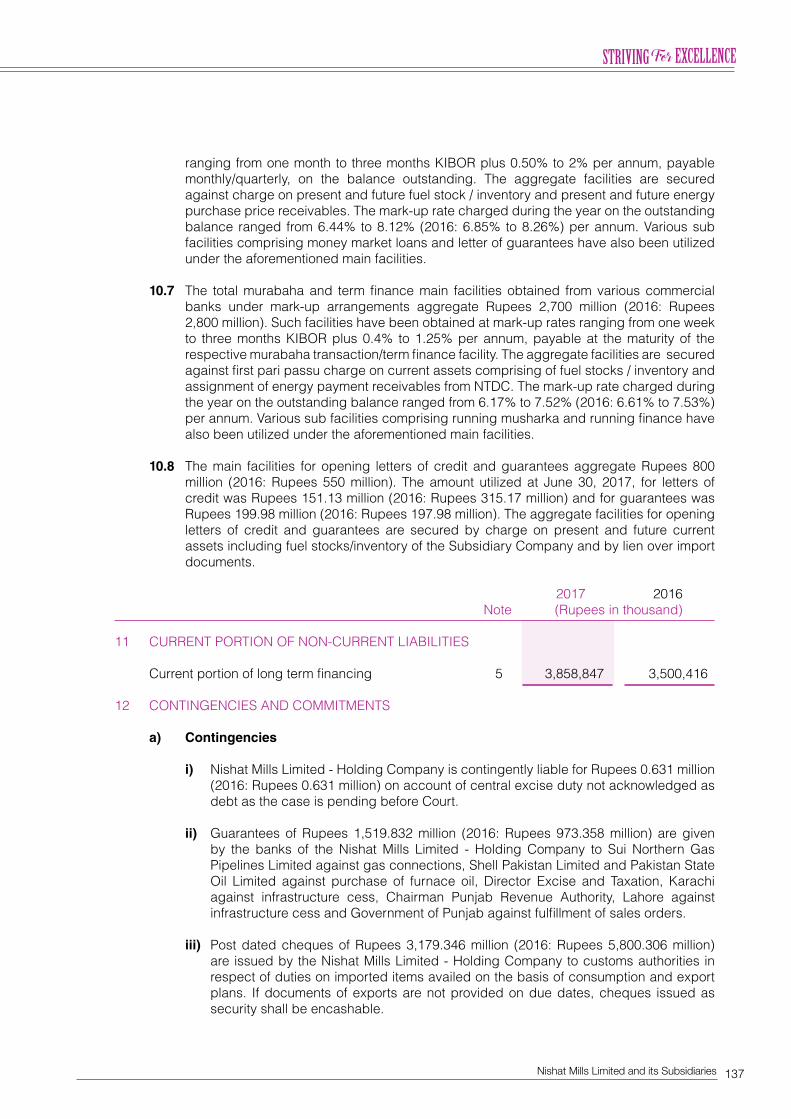
137Nishat Mills Limited and its Subsidiaries
ranging from one month to three months KIBOR plus 0.50% to 2% per annum, payable monthly/quarterly, on the balance outstanding. The aggregate facilities are secured against charge on present and future fuel stock / inventory and present and future energy purchase price receivables. The mark-up rate charged during the year on the outstanding balance ranged from 6.44% to 8.12% (2016: 6.85% to 8.26%) per annum. Various sub facilities comprising money market loans and letter of guarantees have also been utilized under the aforementioned main facilities.
10.7 The total murabaha and term finance main facilities obtained from various commercial
banks under mark-up arrangements aggregate Rupees 2,700 million (2016: Rupees 2,800 million). Such facilities have been obtained at mark-up rates ranging from one week to three months KIBOR plus 0.4% to 1.25% per annum, payable at the maturity of the respective murabaha transaction/term finance facility. The aggregate facilities are secured against first pari passu charge on current assets comprising of fuel stocks / inventory and assignment of energy payment receivables from NTDC. The mark-up rate charged during the year on the outstanding balance ranged from 6.17% to 7.52% (2016: 6.61% to 7.53%) per annum. Various sub facilities comprising running musharka and running finance have also been utilized under the aforementioned main facilities.
10.8 The main facilities for opening letters of credit and guarantees aggregate Rupees 800
million (2016: Rupees 550 million). The amount utilized at June 30, 2017, for letters of credit was Rupees 151.13 million (2016: Rupees 315.17 million) and for guarantees was Rupees 199.98 million (2016: Rupees 197.98 million). The aggregate facilities for opening letters of credit and guarantees are secured by charge on present and future current assets including fuel stocks/inventory of the Subsidiary Company and by lien over import documents.
2017 2016 Note (Rupees in thousand)
11 CURRENT PORTION OF NON-CURRENT LIABILITIES Current portion of long term financing 5 3,858,847 3,500,416 12 CONTINGENCIES AND COMMITMENTS a) Contingencies i) Nishat Mills Limited - Holding Company is contingently liable for Rupees 0.631 million
(2016: Rupees 0.631 million) on account of central excise duty not acknowledged as debt as the case is pending before Court.
ii) Guarantees of Rupees 1,519.832 million (2016: Rupees 973.358 million) are given
by the banks of the Nishat Mills Limited - Holding Company to Sui Northern Gas Pipelines Limited against gas connections, Shell Pakistan Limited and Pakistan State Oil Limited against purchase of furnace oil, Director Excise and Taxation, Karachi against infrastructure cess, Chairman Punjab Revenue Authority, Lahore against infrastructure cess and Government of Punjab against fulfillment of sales orders.
iii) Post dated cheques of Rupees 3,179.346 million (2016: Rupees 5,800.306 million)
are issued by the Nishat Mills Limited - Holding Company to customs authorities in respect of duties on imported items availed on the basis of consumption and export plans. If documents of exports are not provided on due dates, cheques issued as security shall be encashable.
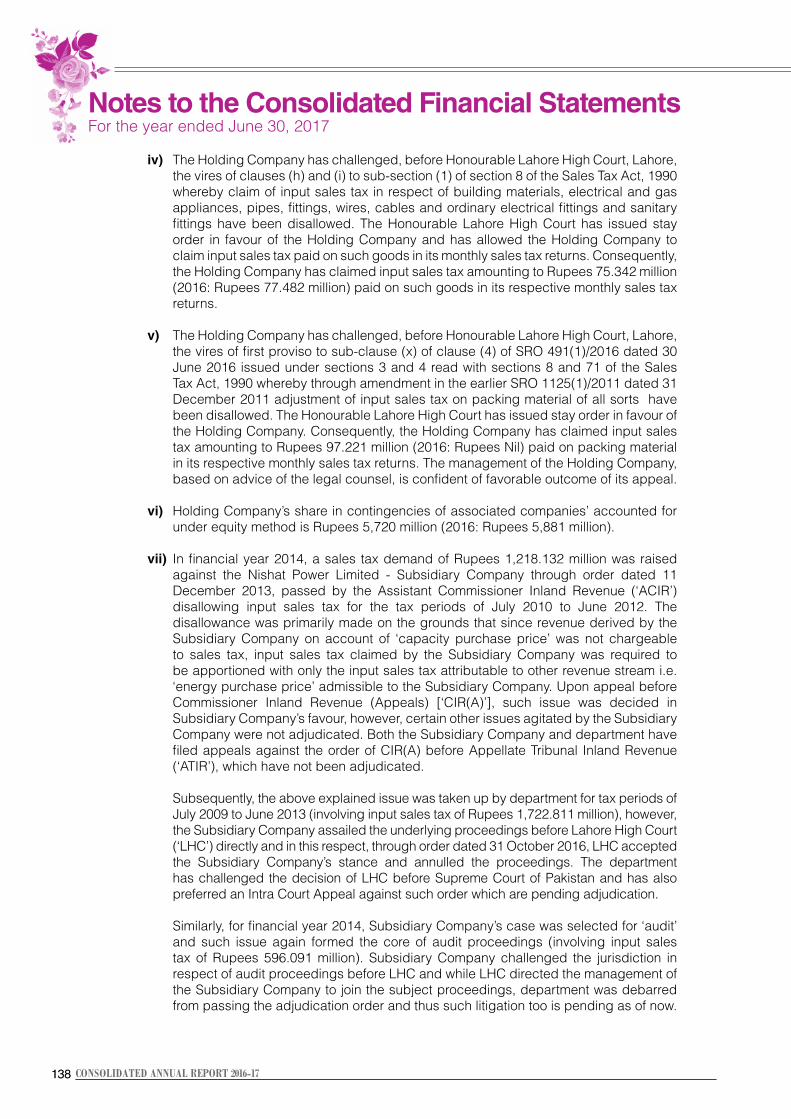
138138 CONSOLIDATED ANNUAL REPORT 2016-17
iv) The Holding Company has challenged, before Honourable Lahore High Court, Lahore, the vires of clauses (h) and (i) to sub-section (1) of section 8 of the Sales Tax Act, 1990 whereby claim of input sales tax in respect of building materials, electrical and gas appliances, pipes, fittings, wires, cables and ordinary electrical fittings and sanitary fittings have been disallowed. The Honourable Lahore High Court has issued stay order in favour of the Holding Company and has allowed the Holding Company to claim input sales tax paid on such goods in its monthly sales tax returns. Consequently, the Holding Company has claimed input sales tax amounting to Rupees 75.342 million (2016: Rupees 77.482 million) paid on such goods in its respective monthly sales tax returns.
v) The Holding Company has challenged, before Honourable Lahore High Court, Lahore,
the vires of first proviso to sub-clause (x) of clause (4) of SRO 491(1)/2016 dated 30 June 2016 issued under sections 3 and 4 read with sections 8 and 71 of the Sales Tax Act, 1990 whereby through amendment in the earlier SRO 1125(1)/2011 dated 31 December 2011 adjustment of input sales tax on packing material of all sorts have been disallowed. The Honourable Lahore High Court has issued stay order in favour of the Holding Company. Consequently, the Holding Company has claimed input sales tax amounting to Rupees 97.221 million (2016: Rupees Nil) paid on packing material in its respective monthly sales tax returns. The management of the Holding Company, based on advice of the legal counsel, is confident of favorable outcome of its appeal.
vi) Holding Company’s share in contingencies of associated companies’ accounted for
under equity method is Rupees 5,720 million (2016: Rupees 5,881 million). vii) In financial year 2014, a sales tax demand of Rupees 1,218.132 million was raised
against the Nishat Power Limited - Subsidiary Company through order dated 11 December 2013, passed by the Assistant Commissioner Inland Revenue (‘ACIR’) disallowing input sales tax for the tax periods of July 2010 to June 2012. The disallowance was primarily made on the grounds that since revenue derived by the Subsidiary Company on account of ‘capacity purchase price’ was not chargeable to sales tax, input sales tax claimed by the Subsidiary Company was required to be apportioned with only the input sales tax attributable to other revenue stream i.e. ‘energy purchase price’ admissible to the Subsidiary Company. Upon appeal before Commissioner Inland Revenue (Appeals) [‘CIR(A)’], such issue was decided in Subsidiary Company’s favour, however, certain other issues agitated by the Subsidiary Company were not adjudicated. Both the Subsidiary Company and department have filed appeals against the order of CIR(A) before Appellate Tribunal Inland Revenue (‘ATIR’), which have not been adjudicated.
Subsequently, the above explained issue was taken up by department for tax periods of
July 2009 to June 2013 (involving input sales tax of Rupees 1,722.811 million), however, the Subsidiary Company assailed the underlying proceedings before Lahore High Court (‘LHC’) directly and in this respect, through order dated 31 October 2016, LHC accepted the Subsidiary Company’s stance and annulled the proceedings. The department has challenged the decision of LHC before Supreme Court of Pakistan and has also preferred an Intra Court Appeal against such order which are pending adjudication.
Similarly, for financial year 2014, Subsidiary Company’s case was selected for ‘audit’
and such issue again formed the core of audit proceedings (involving input sales tax of Rupees 596.091 million). Subsidiary Company challenged the jurisdiction in respect of audit proceedings before LHC and while LHC directed the management of the Subsidiary Company to join the subject proceedings, department was debarred from passing the adjudication order and thus such litigation too is pending as of now.
Notes to the Consolidated Financial Statements For the year ended June 30, 2017
139Nishat Mills Limited and its Subsidiaries
Since, the issue has already been decided in Subsidiary Company’s favour on merits
by LHC, no provision on these accounts have been made in these consolidated financial statements.
viii) The banks have issued the following on behalf of Nishat Power Limited - Subsidiary
Company: a) Letter of guarantee of Rupees 9 million (2016: Rupees 7.5 million) in favour of Director,
Excise and Taxation, Karachi under direction of Sindh High Court in respect of suit filed for levy of infrastructure cess.
b) Letter of guarantee of Rupees 190.484 million (2016 : Rupees 190.484 million ) in
favour of fuel suppliers. c) Letter of guarantee of Rupees 0.5 million (2016: Nil) in favour of Punjab Revenue
Authority, Lahore. ix) Nishat Hospitality (Private) Limited - Subsidiary Company has issued letter of
guarantees of Rupees 1.085 million (2016: Rupees 1.085 million) in favour of Director, Excise and Taxation, Karachi under the order of Sindh High Court in respect of the suit filed for levy of infrastructure cess.
x) Post dated cheques furnished by Nishat Hospitality (Private) Limited - Subsidiary
Company in favour of the Collector of Customs to cover import levies against imports aggregating to Rupees Nil (2016: Rupees 2.945 million).
xi) Guarantee of Rupees 19 million (2016: Rupees 6 million) is given by the bank of Nishat
Linen (Private) Limited - Subsidiary Company to Director Excise and Taxation, Karachi against infrastructure cess.
xii) Guarantee of Rupees 1 million (2016: Rupees Nil) is given by the bank of Nishat
Linen (Private) Limited - Subsidiary Company to Chairman, Punjab Revenue Authority, Lahore against infrastructure cess.
xiii) Commissioner Inland Revenue (CIR) made certain additions to taxable income
of the Nishat Linen (Private) Limited - Subsidiary Company for the tax year 2012 assessing the taxable income at Rupees 188.772 million against declared taxable income of Rupees 116.934 million. The Subsidiary Company filed an appeal before the Commissioner Inland Revenue (Appeals) against the order of CIR which was partially allowed. The Subsidiary Company filed an appeal before Appellate Tribunal Inland Revenue (ATIR) against the order of CIR (Appeals) which was not allowed. The Subsidiary Company has filed an appeal against the order of ATIR with Honorable Lahore High Court, Lahore which suspended the operation of order passed by the ATIR. The Subsidiary Company expects a favourable outcome of the appeal as it has strong grounds of appeal. Hence, no provision there against has been made in these consolidated financial statements.
xiv) Nishat Linen (Private) Limited - Subsidiary Company is contesting sales tax demands
of Rupees 5.534 million (2016: Rupees 5.534 million) before CIR (Appeals) and ATIR. No provision against these demands has been made in these consolidated financial statements as the legal advisor of the Subsidiary Company expects a favourable outcome of appeals.
140140 CONSOLIDATED ANNUAL REPORT 2016-17
xv) Nishat Linen (Private) Limited - Subsidiary Company has challenged, before Honourable Lahore High Court, Lahore, the vires of clauses (h) and (i) to sub-section (1) of section 8 of the Sales Tax Act, 1990 whereby claim of input sales tax in respect of building materials, electrical and gas appliances, pipes, fittings, wires, cables and ordinary electrical fittings and sanitary fittings have been disallowed. The Honourable Lahore High Court has issued stay order in favour of the Subsidiary Company and has allowed the Subsidiary Company to claim input sales tax paid on such goods in its monthly sales tax returns. Consequently, the Subsidiary Company has claimed input sales tax amounting to Rupees 0.104 million (2016: Rupees 0.765 million) paid on such goods in its respective monthly sales tax returns.
xvi) Guarantee of Rupees 1.4 million (2016: Rupees 1.1 million) is given by the bank of
Nishat Commodities (Private) Limited - Subsidiary Company in favour of Director Excise and Taxation to cover the disputed amount of infrastructure cess.
b) Commitments i) Contracts for capital expenditure of the Group are approximately of Rupees 791.636
million (2016: Rupees 1,040.070 million). ii) Letters of credit other than for capital expenditure of the Group are of Rupees 1,244.252
million (2016: Rupees 938.350 million). iii) Outstanding foreign currency forward contracts of Rupees 444.689 million (2016:
Rupees 3,345.460 million). iv) The amount of future payments under operating lease and the period in which these
payments will become due from Nishat Power Limited - Subsidiary Company are as follows:
2017 2016 Note (Rupees in thousand) Not later than one year 13,759 12,461 Later than one year and not later than five years 67,824 60,490 81,583 72,951
13 PROPERTY, PLANT AND EQUIPMENT Operating fixed assets - owned 13.1 36,737,466 36,136,234 Capital work in progress 13.2 4,301,039 1,818,733 Major spare parts and standby equipment 13.3 92,688 142,218
41,131,193 38,097,185
Notes to the Consolidated Financial Statements For the year ended June 30, 2017
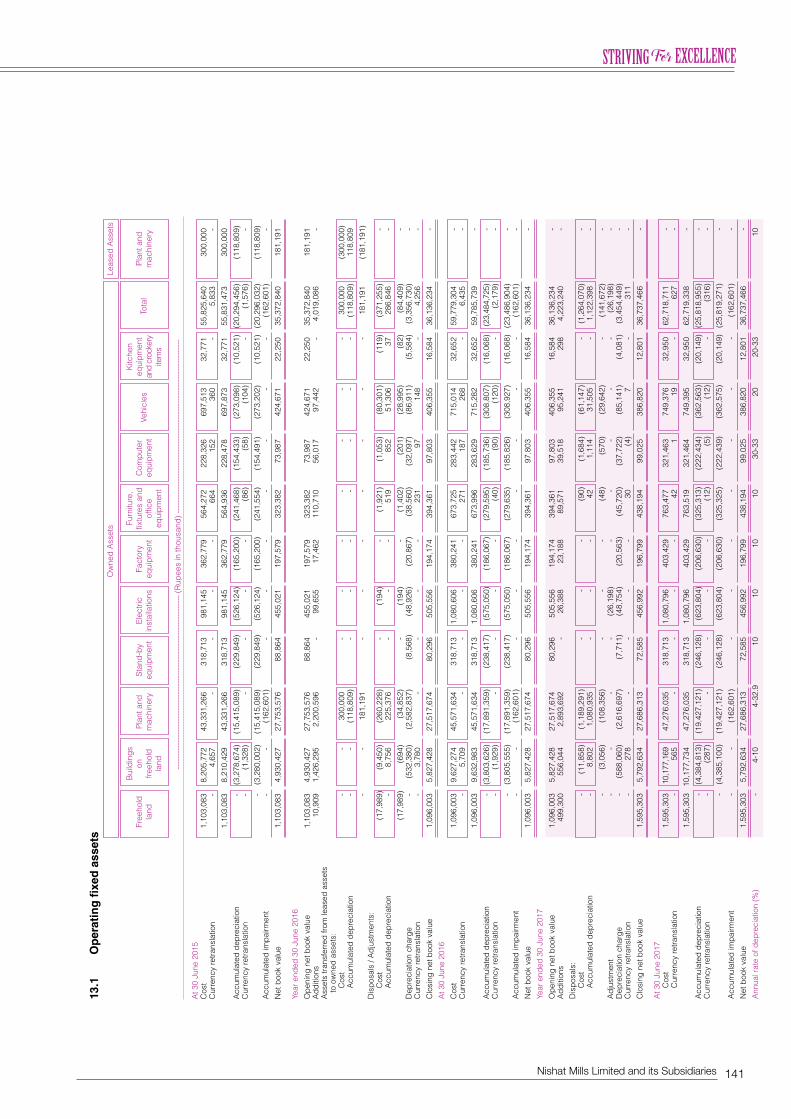
141Nishat Mills Limited and its Subsidiaries
Ow
ned
Ass
ets
Le
ased
Ass
ets
Bui
ldin
gs
Furn
iture
,
K
itche
n
Free
hold
on
Pl
ant a
nd
Stan
d-by
El
ectri
c Fa
ctor
y fix
ture
s an
d C
ompu
ter
Vehi
cles
eq
uipm
ent
Tota
l Pl
ant a
nd
land
fre
ehol
d m
achi
nery
eq
uipm
ent
inst
alla
tions
eq
uipm
ent
offic
e eq
uipm
ent
an
d cr
ocke
ry
m
achi
nery
land
eq
uipm
ent
item
s
--
----
----
----
----
----
----
----
----
----
----
----
----
----
----
----
--- (
Rup
ees
in th
ousa
nd) -
----
----
----
----
----
----
----
----
----
----
----
----
----
----
----
----
At 3
0 Ju
ne 2
015
C
ost
1,1
03,0
83
8,2
05,7
72
43,
331,
266
3
18,7
13
981
,145
3
62,7
79
564
,272
2
28,3
26
697
,513
3
2,77
1
55,
825,
640
3
00,0
00
Cur
renc
y re
trans
latio
n
-
4,6
57
-
-
-
-
664
1
52
360
-
5
,833
-
1
,103
,083
8
,210
,429
4
3,33
1,26
6
318
,713
9
81,1
45
362
,779
5
64,9
36
228
,478
6
97,8
73
32,
771
5
5,83
1,47
3
300
,000
Acc
umul
ated
dep
reci
atio
n -
(3
,278
,674
) (1
5,41
5,08
9)
(229
,849
) (5
26,1
24)
(165
,200
) (2
41,4
68)
(154
,433
) (2
73,0
98)
(10,
521)
(2
0,29
4,45
6)
(118
,809
)C
urre
ncy
retra
nsla
tion
-
(1,3
28)
-
-
-
-
(86)
(5
8)
(104
) -
(1
,576
) -
-
(3
,280
,002
) (1
5,41
5,08
9)
(229
,849
) (5
26,1
24)
(165
,200
) (2
41,5
54)
(154
,491
) (2
73,2
02)
(10,
521)
(2
0,29
6,03
2)
(118
,809
)A
ccum
ulat
ed im
pairm
ent
-
-
(162
,601
) -
-
-
-
-
-
-
(1
62,6
01)
-
Net
boo
k va
lue
1,1
03,0
83
4,9
30,4
27
27,
753,
576
8
8,86
4
455
,021
1
97,5
79
323
,382
7
3,98
7
424
,671
2
2,25
0
35,
372,
840
1
81,1
91
Year
end
ed 3
0 Ju
ne 2
016
Ope
ning
net
boo
k va
lue
1
,103
,083
4
,930
,427
2
7,75
3,57
6
88,
864
4
55,0
21
197
,579
3
23,3
82
73,
987
4
24,6
71
22,
250
3
5,37
2,84
0
181
,191
A
dditi
ons
10,
909
1
,426
,295
2
,200
,596
-
9
9,65
5
17,
462
1
10,7
10
56,
017
9
7,44
2
-
4,0
19,0
86
-
Ass
ets
trans
ferr
ed fr
om le
ased
ass
ets
to
ow
ned
asse
ts:
Cos
t -
-
3
00,0
00
-
-
-
-
-
-
-
300
,000
(3
00,0
00)
A
ccum
ulat
ed d
epre
ciat
ion
-
-
(118
,809
) -
-
-
-
-
-
-
(1
18,8
09)
118
,809
-
-
1
81,1
91
-
-
-
-
-
-
-
181
,191
(1
81,1
91)
Dis
posa
ls /
Adj
ustm
ents
:
C
ost
(17,
989)
(9
,450
) (2
60,2
28)
-
(194
) -
(1
,921
) (1
,053
) (8
0,30
1)
(119
) (3
71,2
55)
-
Acc
umul
ated
dep
reci
atio
n -
8
,756
2
25,3
76
-
-
-
519
8
52
51,
306
3
7
286
,846
-
(1
7,98
9)
(694
) (3
4,85
2)
-
(194
) -
(1
,402
) (2
01)
(28,
995)
(8
2)
(84,
409)
-
D
epre
ciat
ion
char
ge
-
(532
,380
) (2
,582
,837
) (8
,568
) (4
8,92
6)
(20,
867)
(3
8,56
0)
(32,
097)
(8
6,91
1)
(5,5
84)
(3,3
56,7
30)
-
Cur
renc
y re
trans
latio
n -
3
,780
-
-
-
-
2
31
97
1
48
-
4,2
56
-
Clo
sing
net
boo
k va
lue
1
,096
,003
5
,827
,428
2
7,51
7,67
4
80,
296
5
05,5
56
194
,174
3
94,3
61
97,
803
4
06,3
55
16,
584
3
6,13
6,23
4
-
At 3
0 Ju
ne 2
016
Cos
t 1
,096
,003
9
,627
,274
4
5,57
1,63
4
318
,713
1
,080
,606
3
80,2
41
673
,725
2
83,4
42
715
,014
3
2,65
2
59,
779,
304
-
C
urre
ncy
retra
nsla
tion
-
5
,709
-
-
-
-
2
71
187
2
68
-
6,4
35
-
1
,096
,003
9
,632
,983
4
5,57
1,63
4
318
,713
1
,080
,606
3
80,2
41
673
,996
2
83,6
29
715
,282
3
2,65
2
59,
785,
739
-
Acc
umul
ated
dep
reci
atio
n -
(3
,803
,626
) (1
7,89
1,35
9)
(238
,417
) (5
75,0
50)
(186
,067
) (2
79,5
95)
(185
,736
) (3
08,8
07)
(16,
068)
(2
3,48
4,72
5)
-
Cur
renc
y re
trans
latio
n -
(1
,929
) -
-
-
-
(4
0)
(90)
(1
20)
-
(2,1
79)
-
-
(3
,805
,555
) (1
7,89
1,35
9)
(238
,417
) (5
75,0
50)
(186
,067
) (2
79,6
35)
(185
,826
) (3
08,9
27)
(16,
068)
(2
3,48
6,90
4)
-
Acc
umul
ated
impa
irmen
t -
-
(1
62,6
01)
-
-
-
-
-
-
-
(162
,601
) -
Net
boo
k va
lue
1,0
96,0
03
5,8
27,4
28
27,
517,
674
8
0,29
6
505
,556
1
94,1
74
394
,361
9
7,80
3
406
,355
1
6,58
4
36,
136,
234
-
Year
end
ed 3
0 Ju
ne 2
017
Ope
ning
net
boo
k va
lue
1
,096
,003
5
,827
,428
2
7,51
7,67
4
80,
296
5
05,5
56
194
,174
3
94,3
61
97,
803
4
06,3
55
16,
584
3
6,13
6,23
4
-
Add
ition
s 4
99,3
00
556
,044
2
,893
,692
-
2
6,38
8
23,
188
8
9,57
1
39,
518
9
5,24
1
298
4
,223
,240
-
Dis
posa
ls:
Cos
t -
(1
1,85
8)
(1,1
89,2
91)
-
-
-
(90)
(1
,684
) (6
1,14
7)
-
(1,2
64,0
70)
-
A
ccum
ulat
ed d
epre
ciat
ion
-
8,8
02
1,0
80,9
35
-
-
-
42
1
,114
3
1,50
5
-
1,1
22,3
98
-
-
(3
,056
) (1
08,3
56)
-
-
-
(48)
(5
70)
(29,
642)
-
(1
41,6
72)
-
Adj
ustm
ent
-
-
-
-
(26,
198)
-
-
-
-
-
(2
6,19
8)
-
Dep
reci
atio
n ch
arge
-
(5
88,0
60)
(2,6
16,6
97)
(7,7
11)
(48,
754)
(2
0,56
3)
(45,
720)
(3
7,72
2)
(85,
141)
(4
,081
) (3
,454
,449
) -
C
urre
ncy
retra
nsla
tion
-
278
-
-
-
-
3
0
(4)
7
-
311
-
Clo
sing
net
boo
k va
lue
1
,595
,303
5
,792
,634
2
7,68
6,31
3
72,
585
4
56,9
92
196
,799
4
38,1
94
99,
025
3
86,8
20
12,
801
3
6,73
7,46
6
-
At 3
0 Ju
ne 2
017
Cos
t 1
,595
,303
1
0,17
7,16
9
47,
276,
035
3
18,7
13
1,0
80,7
96
403
,429
7
63,4
77
321
,463
7
49,3
76
32,
950
6
2,71
8,71
1
-
C
urre
ncy
retra
nsla
tion
-
5
65
-
-
-
-
42
1
1
9
-
627
-
1
,595
,303
10
,177
,734
4
7,27
6,03
5
318
,713
1
,080
,796
4
03,4
29
763
,519
3
21,4
64
749
,395
3
2,95
0
62,
719,
338
-
Acc
umul
ated
dep
reci
atio
n -
(4
,384
,813
) (1
9,42
7,12
1)
(246
,128
) (6
23,8
04)
(206
,630
) (3
25,3
13)
(222
,434
) (3
62,5
63)
(20,
149)
(2
5,81
8,95
5)
-
Cur
renc
y re
trans
latio
n -
(2
87)
-
-
-
-
(12)
(5
) (1
2)
-
(316
) -
-
(4
,385
,100
) (1
9,42
7,12
1)
(246
,128
) (6
23,8
04)
(206
,630
) (3
25,3
25)
(222
,439
) (3
62,5
75)
(20,
149)
(2
5,81
9,27
1)
-
Acc
umul
ated
impa
irmen
t -
-
(1
62,6
01)
-
-
-
-
-
-
-
(162
,601
) -
Net
boo
k va
lue
1,5
95,3
03
5,7
92,6
34
27,
686,
313
7
2,58
5
456
,992
1
96,7
99
438
,194
9
9,02
5
386
,820
1
2,80
1
36,
737,
466
-
Ann
ual r
ate
of d
epre
ciat
ion
(%)
-
4-1
0
4-3
2.9
1
0
10
1
0
10
3
0-33
2
0
20-
33
1
0
13.1
Op
erat
ing
fixe
d a
sset
s
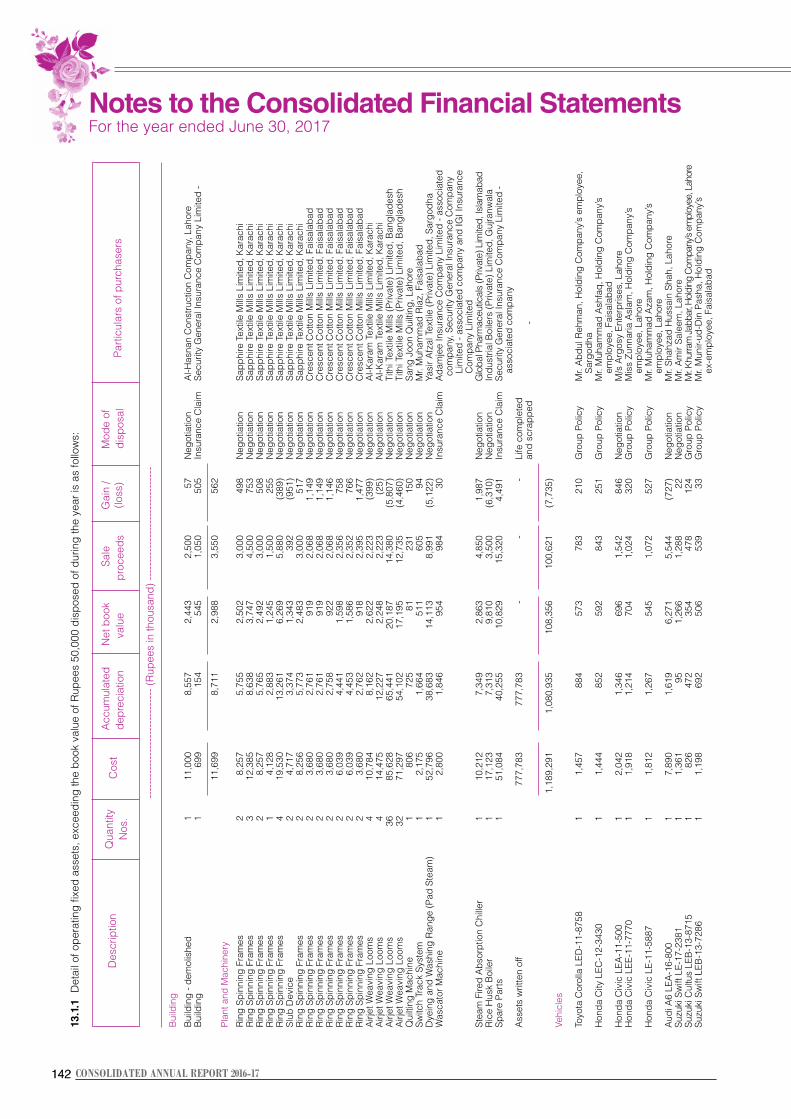
142142 CONSOLIDATED ANNUAL REPORT 2016-17
13.1
.1
Det
ail o
f ope
ratin
g fix
ed a
sset
s, e
xcee
ding
the
book
val
ue o
f Rup
ees
50,0
00 d
ispo
sed
of d
urin
g th
e ye
ar is
as
follo
ws:
Des
crip
tion
Acc
umul
ated
N
et b
ook
S
ale
Gai
n /
Mod
e of
Part
icul
ars
of p
urch
aser
s
Qua
ntity
C
ost
depr
ecia
tion
va
lue
proc
eeds
(lo
ss)
disp
osal
Nos
.
----
----
----
----
----
----
----
--- (
Rup
ees
in th
ousa
nd) -
----
----
----
----
----
----
----
---
Bui
ldin
g
Bui
ldin
g - d
emol
ishe
d 1
11,0
00
8,55
7
2,44
3
2,50
0
57
Neg
otia
tion
A
l-Has
nan
Con
stru
ctio
n C
ompa
ny, L
ahor
eB
uild
ing
1 69
9
154
54
5
1,05
0
505
In
sura
nce
Cla
im
Secu
rity
Gen
eral
Insu
ranc
e C
ompa
ny L
imite
d -
11,6
99
8,71
1
2,98
8
3,55
0
562
Plan
t and
Mac
hine
ry
R
ing
Spin
ning
Fra
mes
2
8,25
7
5,75
5
2,50
2
3,00
0
498
N
egot
iatio
n
Sapp
hire
Tex
tile
Mill
s Li
mite
d, K
arac
hiR
ing
Spin
ning
Fra
mes
3
12,3
85
8,63
8
3,74
7
4,50
0
753
N
egot
iatio
n
Sapp
hire
Tex
tile
Mill
s Li
mite
d, K
arac
hiR
ing
Spin
ning
Fra
mes
2
8,25
7
5,76
5
2,49
2
3,00
0
508
N
egot
iatio
n
Sapp
hire
Tex
tile
Mill
s Li
mite
d, K
arac
hiR
ing
Spin
ning
Fra
mes
1
4,12
8
2,88
3
1,24
5
1,50
0
255
N
egot
iatio
n
Sapp
hire
Tex
tile
Mill
s Li
mite
d, K
arac
hiR
ing
Spin
ning
Fra
mes
4
19,5
30
13,2
61
6,26
9
5,88
0
(389
) N
egot
iatio
n
Sapp
hire
Tex
tile
Mill
s Li
mite
d, K
arac
hiSl
ub D
evic
e 2
4,71
7
3,37
4
1,34
3
392
(9
51)
Neg
otia
tion
Sa
pphi
re T
extil
e M
ills
Lim
ited,
Kar
achi
Rin
g Sp
inni
ng F
ram
es
2 8,
256
5,
773
2,
483
3,
000
51
7
Neg
otia
tion
Sa
pphi
re T
extil
e M
ills
Lim
ited,
Kar
achi
Rin
g Sp
inni
ng F
ram
es
2 3,
680
2,
761
91
9
2,06
8
1,14
9
Neg
otia
tion
C
resc
ent C
otto
n M
ills
Lim
ited,
Fai
sala
bad
Rin
g Sp
inni
ng F
ram
es
2 3,
680
2,
761
91
9
2,06
8
1,14
9
Neg
otia
tion
C
resc
ent C
otto
n M
ills
Lim
ited,
Fai
sala
bad
Rin
g Sp
inni
ng F
ram
es
2 3,
680
2,
758
92
2
2,06
8
1,14
6
Neg
otia
tion
C
resc
ent C
otto
n M
ills
Lim
ited,
Fai
sala
bad
Rin
g Sp
inni
ng F
ram
es
2 6,
039
4,
441
1,
598
2,
356
75
8
Neg
otia
tion
C
resc
ent C
otto
n M
ills
Lim
ited,
Fai
sala
bad
Rin
g Sp
inni
ng F
ram
es
2 6,
039
4,
453
1,
586
2,
352
76
6
Neg
otia
tion
C
resc
ent C
otto
n M
ills
Lim
ited,
Fai
sala
bad
Rin
g Sp
inni
ng F
ram
es
2 3,
680
2,
762
91
8
2,39
5
1,47
7
Neg
otia
tion
C
resc
ent C
otto
n M
ills
Lim
ited,
Fai
sala
bad
Airj
et W
eavi
ng L
oom
s 4
10,7
84
8,16
2
2,62
2
2,22
3
(399
) N
egot
iatio
n
Al-K
aram
Tex
tile
Mill
s Li
mite
d, K
arac
hiA
irjet
Wea
ving
Loo
ms
4 14
,475
12
,227
2,
248
2,
223
(2
5)
Neg
otia
tion
A
l-Kar
am T
extil
e M
ills
Lim
ited,
Kar
achi
Airj
et W
eavi
ng L
oom
s 36
85
,628
65
,441
20
,187
14
,380
(5
,807
) N
egot
iatio
n
Tith
i Tex
tile
Mill
s (P
rivat
e) L
imite
d, B
angl
ades
hA
irjet
Wea
ving
Loo
ms
32
71,2
97
54,1
02
17,1
95
12,7
35
(4,4
60)
Neg
otia
tion
Ti
thi T
extil
e M
ills
(Priv
ate)
Lim
ited,
Ban
glad
esh
Qui
lting
Mac
hine
1
806
72
5
81
231
15
0
Neg
otia
tion
Sa
ng J
oon
Qui
lting
, Lah
ore
Switc
h Tr
ack
Syst
em
1 2,
175
1,
664
51
1
605
94
N
egot
iatio
n
Mr.
Muh
amm
ad R
iaz,
Fai
sala
bad
Dye
ing
and
Was
hing
Ran
ge (P
ad S
team
) 1
52,7
96
38,6
83
14,1
13
8,99
1
(5,1
22)
Neg
otia
tion
Ya
sir A
fzal
Tex
tile
(Priv
ate)
Lim
ited,
Sar
godh
aW
asca
tor M
achi
ne
1 2,
800
1,
846
95
4
984
30
In
sura
nce
Cla
im
Ada
mje
e In
sura
nce
Com
pany
Lim
ited
- ass
ocia
ted
com
pany
, Sec
urity
Gen
eral
Insu
ranc
e C
ompa
ny
Lim
ited
- ass
ocia
ted
com
pany
and
IGI I
nsur
ance
C
ompa
ny L
imite
dSt
eam
Fire
d A
bsor
ptio
n C
hille
r 1
10,2
12
7,34
9
2,86
3
4,85
0
1,98
7
Neg
otia
tion
G
loba
l Pha
rmac
eutic
als
(Priv
ate)
Lim
ited,
Isla
mab
adR
ice
Hus
k B
oile
r 1
17,1
23
7,31
3
9,81
0
3,50
0
(6,3
10)
Neg
otia
tion
In
dust
rial B
oile
rs (P
rivat
e) L
imite
d, G
ujra
nwal
aSp
are
Part
s 1
51,0
84
40,2
55
10,8
29
15,3
20
4,49
1
Insu
ranc
e C
laim
Se
curit
y G
ener
al In
sura
nce
Com
pany
Lim
ited
-
asso
ciat
ed c
ompa
nyA
sset
s w
ritte
n of
f
777,
783
77
7,78
3
-
-
-
Life
com
plet
ed
an
d sc
rapp
ed
-
1,18
9,29
1
1,08
0,93
5
108,
356
10
0,62
1
(7,7
35)
Ve
hicl
es
To
yota
Cor
olla
LED
-11-
8758
1
1,45
7
884
57
3
783
21
0
Gro
up P
olic
y
Mr.
Abd
ul R
ehm
an, H
oldi
ng C
ompa
ny’s
em
ploy
ee,
Sa
rgod
haH
onda
City
LEC
-12-
3430
1
1,44
4
852
59
2
843
25
1
Gro
up P
olic
y
Mr.
Muh
amm
ad A
shfa
q, H
oldi
ng C
ompa
ny’s
em
ploy
ee, F
aisa
laba
dH
onda
Civ
ic L
EA-1
1-50
0 1
2,04
2
1,34
6
696
1,
542
84
6
Neg
otia
tion
M
/s A
rgos
y En
terp
rises
, Lah
ore
Hon
da C
ivic
LEE
-11-
7770
1
1,91
8
1,21
4
704
1,
024
32
0
Gro
up P
olic
y
Mis
s Zu
nnar
ia A
slam
, Hol
ding
Com
pany
’s
em
ploy
ee, L
ahor
eH
onda
Civ
ic L
E-11
-588
7 1
1,81
2
1,26
7
545
1,
072
52
7
Gro
up P
olic
y
Mr.
Muh
amm
ad A
zam
, Hol
ding
Com
pany
’s
em
ploy
ee, L
ahor
eA
udi A
6 LE
A-1
6-80
0 1
7,89
0
1,61
9
6,27
1
5,54
4
(727
) N
egot
iatio
n
Mr.
Shah
zad
Hus
sain
Sha
h, L
ahor
eSu
zuki
Sw
ift L
E-17
-238
1 1
1,36
1
95
1,26
6
1,28
8
22
Neg
otia
tion
M
r. A
mir
Sale
em, L
ahor
eSu
zuki
Cul
tus
LEB
-13-
8715
1
826
47
2
354
47
8
124
G
roup
Pol
icy
M
r. Kh
urra
m J
abba
r, H
oldi
ng C
ompa
ny’s
empl
oyee
, Lah
ore
Suzu
ki S
wift
LEB
-13-
7286
1
1,19
8
692
50
6
539
33
G
roup
Pol
icy
M
r. M
unir-
ud-D
in P
asha
, Hol
ding
Com
pany
’s
ex
-em
ploy
ee, F
aisa
laba
d
Notes to the Consolidated Financial Statements For the year ended June 30, 2017
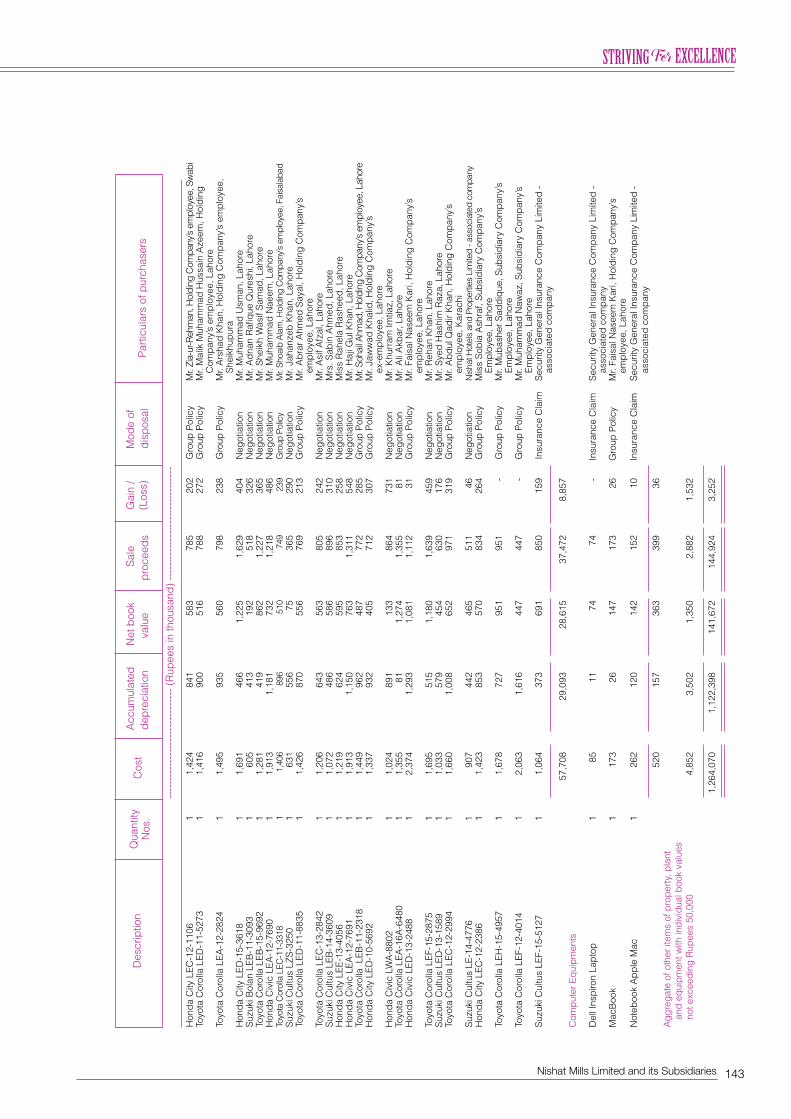
143Nishat Mills Limited and its Subsidiaries
Hon
da C
ity L
EC-1
2-11
06
1 1,
424
84
1
583
78
5
202
G
roup
Pol
icy
M
r. Zi
a-ur
-Reh
man
, Hol
ding
Com
pany
’s em
ploy
ee, S
wab
iTo
yota
Cor
olla
LED
-11-
5273
1
1,41
6
900
51
6
788
27
2
Gro
up P
olic
y
Mr.
Mal
ik M
uham
mad
Hus
sain
Aze
em, H
oldi
ng
Com
pany
’s e
mpl
oyee
, Lah
ore
Toyo
ta C
orol
la L
EA-1
2-28
24
1 1,
495
93
5
560
79
8
238
G
roup
Pol
icy
M
r. A
rsha
d K
han,
Hol
ding
Com
pany
’s e
mpl
oyee
,
Shei
khup
ura
Hon
da C
ity L
ED-1
5-36
18
1 1,
691
46
6
1,22
5
1,62
9
404
N
egot
iatio
n
Mr.
Muh
amm
ad U
sman
, Lah
ore
Suzu
ki B
olan
LEB
-11-
3093
1
605
41
3
192
51
8
326
N
egot
iatio
n
Mr.
Adn
an R
afiqu
e Q
ures
hi, L
ahor
eTo
yota
Cor
olla
LEB
-15-
9692
1
1,28
1
419
86
2
1,22
7
365
N
egot
iatio
n
Mr.
Shei
kh W
asif
Sam
ad, L
ahor
eH
onda
Civ
ic L
EA-1
2-76
90
1 1,
913
1,
181
73
2
1,21
8
486
N
egot
iatio
n
Mr.
Muh
amm
ad N
aeem
, Lah
ore
Toyo
ta C
orol
la L
EC-1
1-33
18
1 1,
406
89
6
510
74
9
239
G
roup
Pol
icy
M
r. Sh
oaib
Ala
m, H
oldi
ng C
ompa
ny’s
empl
oyee
, Fai
sala
bad
Suzu
ki C
ultu
s LZ
S-32
50
1 63
1
556
75
36
5
290
N
egot
iatio
n
Mr.
Jaha
nzeb
Kha
n, L
ahor
eTo
yota
Cor
olla
LED
-11-
8835
1
1,42
6
870
55
6
769
21
3
Gro
up P
olic
y
Mr.
Abr
ar A
hmed
Say
al, H
oldi
ng C
ompa
ny’s
empl
oyee
, Lah
ore
Toyo
ta C
orol
la L
EC-1
3-28
42
1 1,
206
64
3
563
80
5
242
N
egot
iatio
n
Mr.
Asi
f Afz
al, L
ahor
eSu
zuki
Cul
tus
LEB
-14-
3609
1
1,07
2
486
58
6
896
31
0
Neg
otia
tion
M
rs. S
abin
Ahm
ed, L
ahor
eH
onda
City
LEE
-13-
4056
1
1,21
9
624
59
5
853
25
8
Neg
otia
tion
M
iss
Rah
ela
Ras
heed
, Lah
ore
Hon
da C
ivic
LEA
-12-
7691
1
1,91
3
1,15
0
763
1,
311
54
8
Neg
otia
tion
M
r. H
aji G
ul K
han,
Lah
ore
Toyo
ta C
orol
la L
EB-1
1-23
18
1 1,
449
96
2
487
77
2
285
G
roup
Pol
icy
M
r. So
hail A
hmad
, Hol
ding
Com
pany
’s em
ploy
ee, L
ahor
eH
onda
City
LED
-10-
5692
1
1,33
7
932
40
5
712
30
7
Gro
up P
olic
y
Mr.
Jaw
wad
Kha
lid, H
oldi
ng C
ompa
ny’s
ex-e
mpl
oyee
, Lah
ore
Hon
da C
ivic
LW
A-8
802
1 1,
024
89
1
133
86
4
731
N
egot
iatio
n
Mr.
Khu
rram
Imtia
z, L
ahor
eTo
yota
Cor
olla
LEA
-16A
-648
0 1
1,35
5
81
1,27
4
1,35
5
81
Neg
otia
tion
M
r. A
li A
kbar
, Lah
ore
Hon
da C
ivic
LED
-13-
2488
1
2,37
4
1,29
3
1,08
1
1,11
2
31
Gro
up P
olic
y
Mr.
Fais
al N
asee
m K
ari,
Hol
ding
Com
pany
’s
em
ploy
ee, L
ahor
eTo
yota
Cor
olla
LEF
-15-
2875
1
1,69
5
515
1,
180
1,
639
45
9
Neg
otia
tion
M
r. R
ehan
Kha
n, L
ahor
eSu
zuki
Cul
tus
LED
-13-
1589
1
1,03
3
579
45
4
630
17
6
Neg
otia
tion
M
r. Sy
ed H
ashi
m R
aza,
Lah
ore
Toyo
ta C
orol
la L
EC-1
2-29
94
1 1,
660
1,
008
65
2
971
31
9
Gro
up P
olic
y
Mr.
Abd
ul Q
adir
Kha
n, H
oldi
ng C
ompa
ny’s
empl
oyee
, Kar
achi
Suzu
ki C
ultu
s LE
-14-
4776
1
907
44
2
465
51
1
46
Neg
otia
tion
N
isha
t Hot
els
and
Prop
ertie
s Li
mite
d - a
ssoc
iate
d co
mpa
nyH
onda
City
LEC
-12-
2386
1
1,42
3
853
57
0
834
26
4
Gro
up P
olic
y
Mis
s So
bia
Ash
raf,
Subs
idia
ry C
ompa
ny’s
Empl
oyee
, Lah
ore
Toyo
ta C
orol
la L
EH-1
5-49
57
1 1,
678
72
7
951
95
1
-
Gro
up P
olic
y
Mr.
Mub
ashe
r Sad
diqu
e, S
ubsi
diar
y C
ompa
ny’s
Empl
oyee
, Lah
ore
Toyo
ta C
orol
la L
EF-1
2-40
14
1 2,
063
1,
616
44
7
447
-
G
roup
Pol
icy
M
r. M
uham
mad
Naw
az, S
ubsi
diar
y C
ompa
ny’s
Empl
oyee
, Lah
ore
Suzu
ki C
ultu
s LE
F-15
-512
7 1
1,06
4
373
69
1
850
15
9
Insu
ranc
e C
laim
Se
curit
y G
ener
al In
sura
nce
Com
pany
Lim
ited
-
asso
ciat
ed c
ompa
ny
57
,708
29
,093
28
,615
37
,472
8,
857
Com
pute
r Equ
ipm
ents
Del
l Ins
piro
n La
ptop
1
85
11
74
74
-
Insu
ranc
e C
laim
Se
curit
y G
ener
al In
sura
nce
Com
pany
Lim
ited
-
asso
ciat
ed c
ompa
nyM
acB
ook
1
173
26
147
17
3 26
G
roup
Pol
icy
M
r. Fa
isal
Nas
eem
Kar
i, H
oldi
ng C
ompa
ny’s
empl
oyee
, Lah
ore
Not
eboo
k A
pple
Mac
1
262
120
142
15
2 10
In
sura
nce
Cla
im
Secu
rity
Gen
eral
Insu
ranc
e C
ompa
ny L
imite
d -
as
soci
ated
com
pany
520
15
7
363
39
9
36
A
ggre
gate
of o
ther
item
s of
pro
pert
y, p
lant
and
equi
pmen
t with
indi
vidu
al b
ook
valu
es
no
t exc
eedi
ng R
upee
s 50
,000
4,8
52
3,5
02
1,35
0
2,88
2
1,53
2
1,
264,
070
1,
122,
398
14
1,67
2
144,
924
3,
252
Des
crip
tion
Acc
umul
ated
N
et b
ook
S
ale
Gai
n /
Mod
e of
Part
icul
ars
of p
urch
aser
s
Qua
ntity
C
ost
depr
ecia
tion
va
lue
proc
eeds
(L
oss)
di
spos
al
N
os.
----
----
----
----
----
----
----
--- (
Rup
ees
in th
ousa
nd) -
----
----
----
----
----
----
----
---
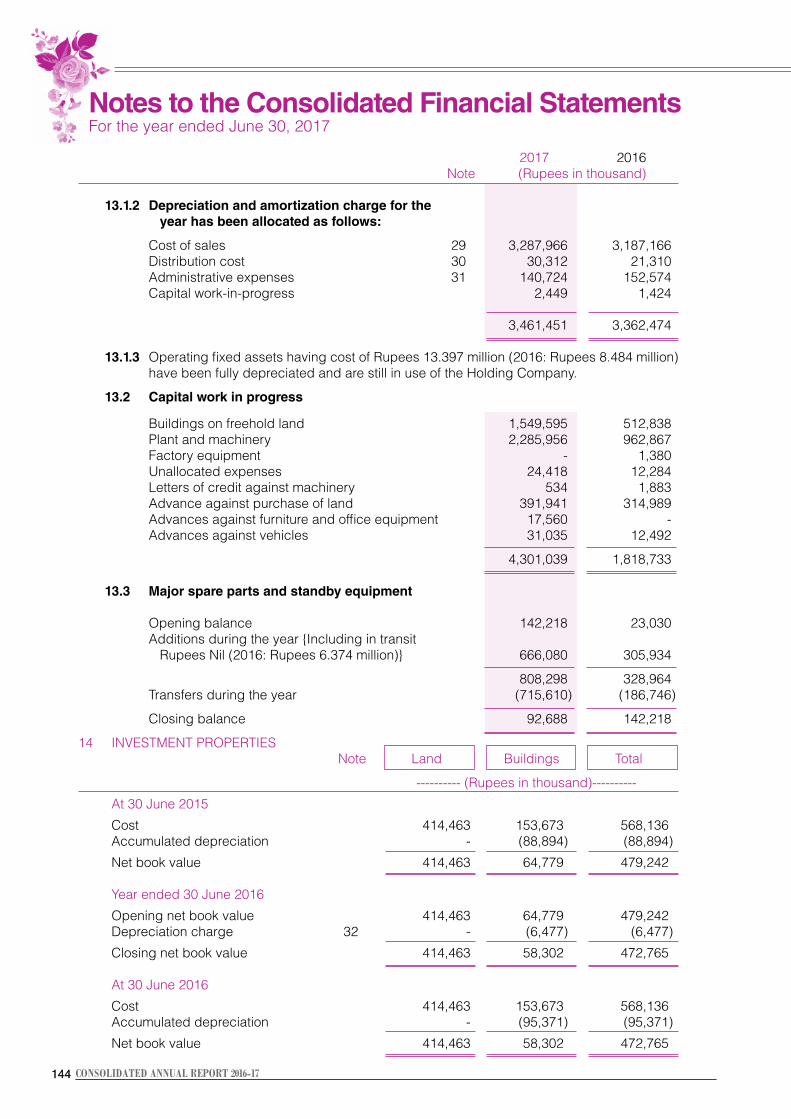
144144 CONSOLIDATED ANNUAL REPORT 2016-17
2017 2016 Note (Rupees in thousand)
13.1.2 Depreciation and amortization charge for the year has been allocated as follows: Cost of sales 29 3,287,966 3,187,166 Distribution cost 30 30,312 21,310 Administrative expenses 31 140,724 152,574 Capital work-in-progress 2,449 1,424 3,461,451 3,362,474 13.1.3 Operating fixed assets having cost of Rupees 13.397 million (2016: Rupees 8.484 million)
have been fully depreciated and are still in use of the Holding Company. 13.2 Capital work in progress
Buildings on freehold land 1,549,595 512,838 Plant and machinery 2,285,956 962,867 Factory equipment - 1,380 Unallocated expenses 24,418 12,284 Letters of credit against machinery 534 1,883 Advance against purchase of land 391,941 314,989 Advances against furniture and office equipment 17,560 - Advances against vehicles 31,035 12,492
4,301,039 1,818,733
13.3 Major spare parts and standby equipment Opening balance 142,218 23,030 Additions during the year {Including in transit Rupees Nil (2016: Rupees 6.374 million)} 666,080 305,934
808,298 328,964 Transfers during the year (715,610) (186,746)
Closing balance 92,688 142,218 14 INVESTMENT PROPERTIES Note Land Buildings Total ---------- (Rupees in thousand)----------
At 30 June 2015 Cost 414,463 153,673 568,136 Accumulated depreciation - (88,894) (88,894) Net book value 414,463 64,779 479,242 Year ended 30 June 2016 Opening net book value 414,463 64,779 479,242 Depreciation charge 32 - (6,477) (6,477) Closing net book value 414,463 58,302 472,765 At 30 June 2016 Cost 414,463 153,673 568,136 Accumulated depreciation - (95,371) (95,371) Net book value 414,463 58,302 472,765
Notes to the Consolidated Financial Statements For the year ended June 30, 2017
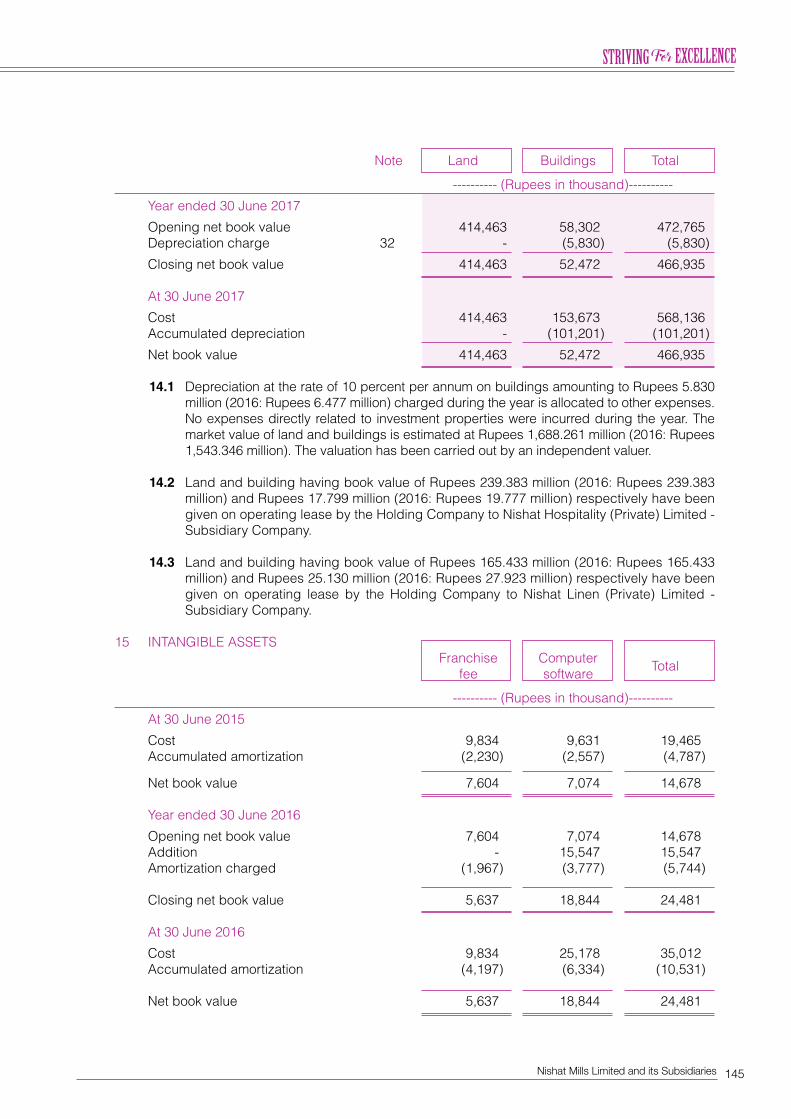
145Nishat Mills Limited and its Subsidiaries
Note Land Buildings Total ---------- (Rupees in thousand)----------
Year ended 30 June 2017 Opening net book value 414,463 58,302 472,765 Depreciation charge 32 - (5,830) (5,830) Closing net book value 414,463 52,472 466,935 At 30 June 2017 Cost 414,463 153,673 568,136 Accumulated depreciation - (101,201) (101,201) Net book value 414,463 52,472 466,935 14.1 Depreciation at the rate of 10 percent per annum on buildings amounting to Rupees 5.830
million (2016: Rupees 6.477 million) charged during the year is allocated to other expenses. No expenses directly related to investment properties were incurred during the year. The market value of land and buildings is estimated at Rupees 1,688.261 million (2016: Rupees 1,543.346 million). The valuation has been carried out by an independent valuer.
14.2 Land and building having book value of Rupees 239.383 million (2016: Rupees 239.383
million) and Rupees 17.799 million (2016: Rupees 19.777 million) respectively have been given on operating lease by the Holding Company to Nishat Hospitality (Private) Limited - Subsidiary Company.
14.3 Land and building having book value of Rupees 165.433 million (2016: Rupees 165.433
million) and Rupees 25.130 million (2016: Rupees 27.923 million) respectively have been given on operating lease by the Holding Company to Nishat Linen (Private) Limited - Subsidiary Company.
15 INTANGIBLE ASSETS Franchise Computer Total fee software ---------- (Rupees in thousand)----------
At 30 June 2015 Cost 9,834 9,631 19,465 Accumulated amortization (2,230) (2,557) (4,787) Net book value 7,604 7,074 14,678 Year ended 30 June 2016 Opening net book value 7,604 7,074 14,678 Addition - 15,547 15,547 Amortization charged (1,967) (3,777) (5,744) Closing net book value 5,637 18,844 24,481 At 30 June 2016 Cost 9,834 25,178 35,012 Accumulated amortization (4,197) (6,334) (10,531) Net book value 5,637 18,844 24,481
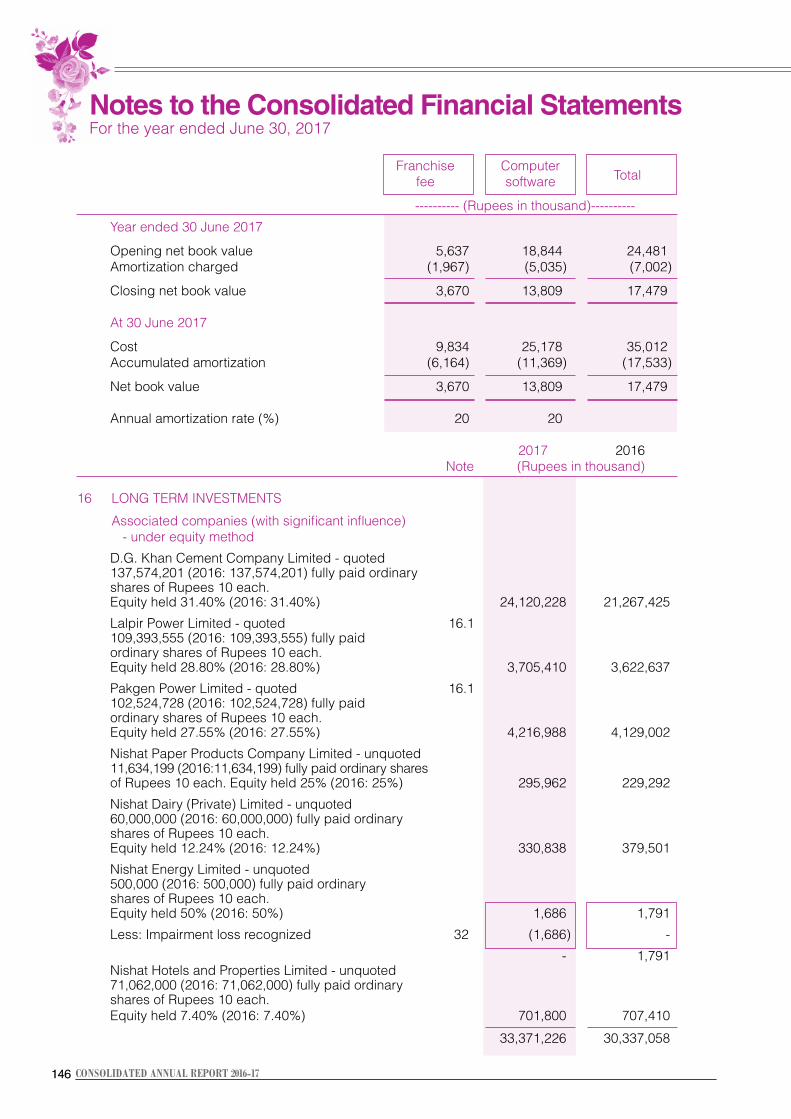
146146 CONSOLIDATED ANNUAL REPORT 2016-17
Franchise Computer Total fee software
---------- (Rupees in thousand)----------
Year ended 30 June 2017 Opening net book value 5,637 18,844 24,481 Amortization charged (1,967) (5,035) (7,002) Closing net book value 3,670 13,809 17,479 At 30 June 2017 Cost 9,834 25,178 35,012 Accumulated amortization (6,164) (11,369) (17,533) Net book value 3,670 13,809 17,479 Annual amortization rate (%) 20 20 2017 2016 Note (Rupees in thousand)
16 LONG TERM INVESTMENTS Associated companies (with significant influence) - under equity method D.G. Khan Cement Company Limited - quoted 137,574,201 (2016: 137,574,201) fully paid ordinary shares of Rupees 10 each. Equity held 31.40% (2016: 31.40%) 24,120,228 21,267,425 Lalpir Power Limited - quoted 16.1 109,393,555 (2016: 109,393,555) fully paid ordinary shares of Rupees 10 each. Equity held 28.80% (2016: 28.80%) 3,705,410 3,622,637 Pakgen Power Limited - quoted 16.1 102,524,728 (2016: 102,524,728) fully paid ordinary shares of Rupees 10 each. Equity held 27.55% (2016: 27.55%) 4,216,988 4,129,002 Nishat Paper Products Company Limited - unquoted 11,634,199 (2016:11,634,199) fully paid ordinary shares of Rupees 10 each. Equity held 25% (2016: 25%) 295,962 229,292 Nishat Dairy (Private) Limited - unquoted 60,000,000 (2016: 60,000,000) fully paid ordinary shares of Rupees 10 each. Equity held 12.24% (2016: 12.24%) 330,838 379,501 Nishat Energy Limited - unquoted 500,000 (2016: 500,000) fully paid ordinary shares of Rupees 10 each. Equity held 50% (2016: 50%) 1,686 1,791 Less: Impairment loss recognized 32 (1,686) - - 1,791 Nishat Hotels and Properties Limited - unquoted 71,062,000 (2016: 71,062,000) fully paid ordinary shares of Rupees 10 each. Equity held 7.40% (2016: 7.40%) 701,800 707,410 33,371,226 30,337,058
Notes to the Consolidated Financial Statements For the year ended June 30, 2017
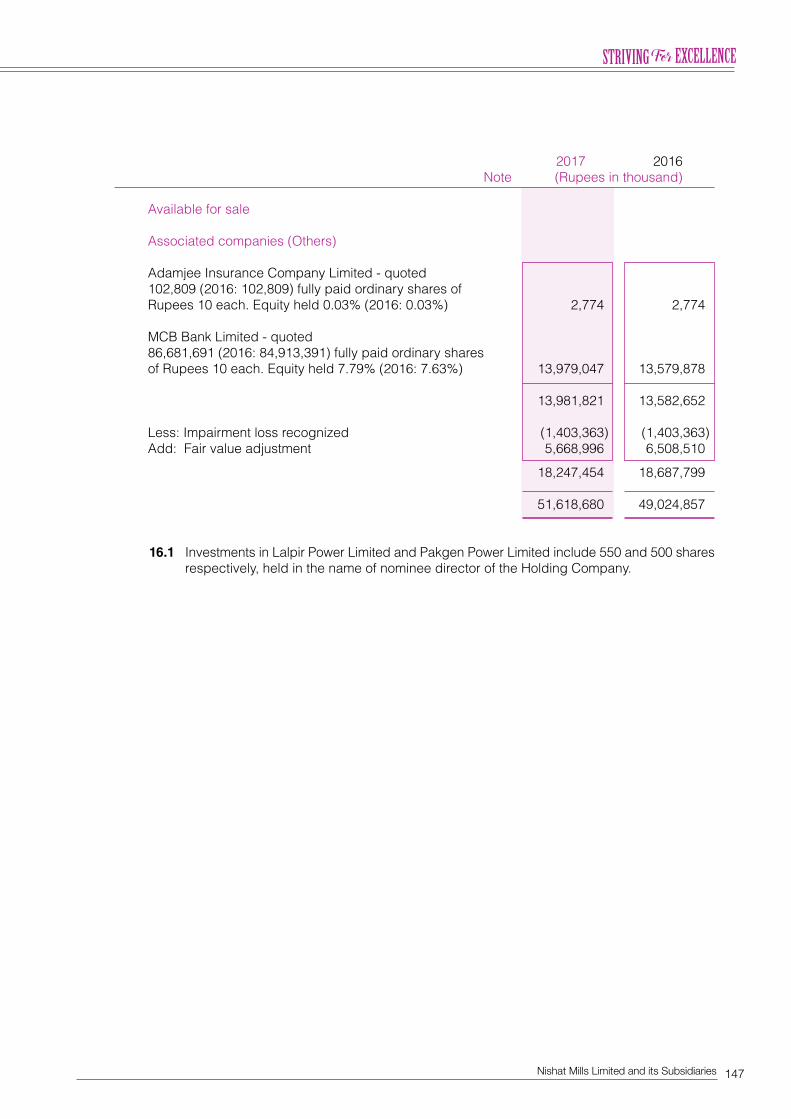
147Nishat Mills Limited and its Subsidiaries
2017 2016 Note (Rupees in thousand)
Available for sale Associated companies (Others) Adamjee Insurance Company Limited - quoted 102,809 (2016: 102,809) fully paid ordinary shares of Rupees 10 each. Equity held 0.03% (2016: 0.03%) 2,774 2,774 MCB Bank Limited - quoted 86,681,691 (2016: 84,913,391) fully paid ordinary shares of Rupees 10 each. Equity held 7.79% (2016: 7.63%) 13,979,047 13,579,878 13,981,821 13,582,652 Less: Impairment loss recognized (1,403,363) (1,403,363) Add: Fair value adjustment 5,668,996 6,508,510
18,247,454 18,687,799 51,618,680 49,024,857 16.1 Investments in Lalpir Power Limited and Pakgen Power Limited include 550 and 500 shares
respectively, held in the name of nominee director of the Holding Company.
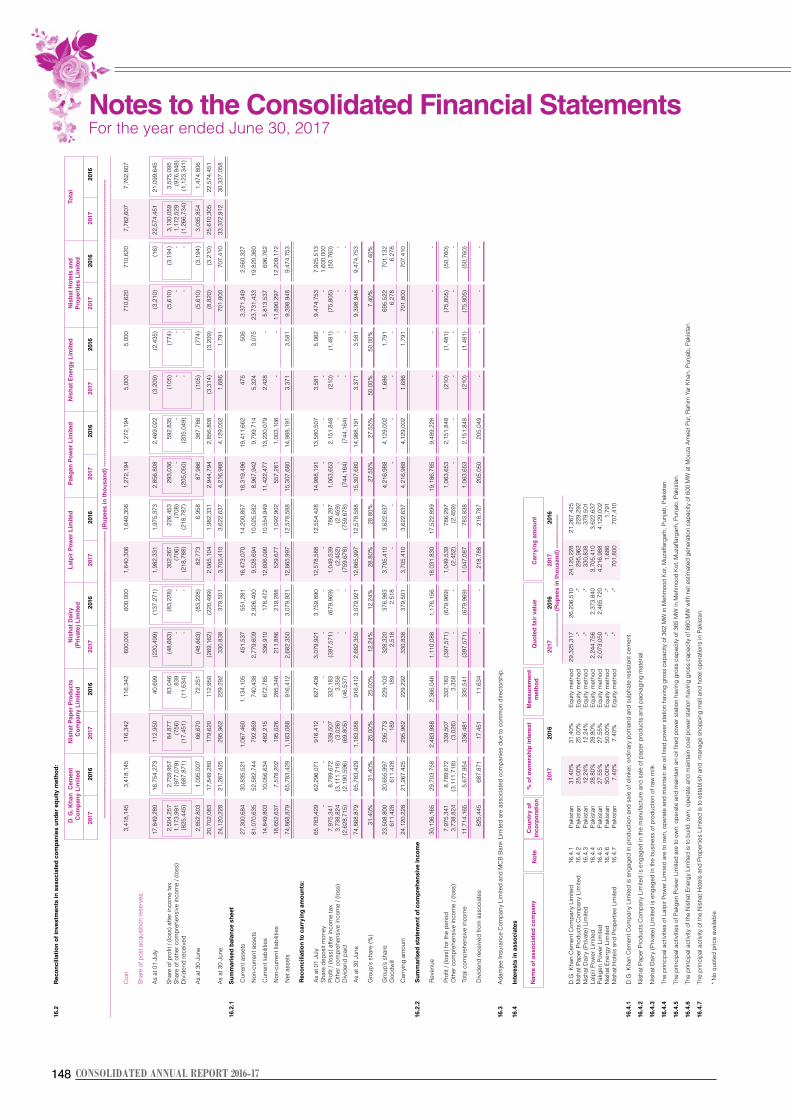
148148 CONSOLIDATED ANNUAL REPORT 2016-17
16.2
R
eco
nci
liati
on
of
inve
stm
ents
in a
sso
ciat
ed c
om
pan
ies
un
der
eq
uit
y m
eth
od
:
D. G
. Kh
an C
emen
t N
ish
at P
aper
Pro
du
cts
Nis
hat
Dai
ry
Lal
pir
Po
wer
Lim
ited
P
akg
en P
ow
er L
imit
ed
Nis
hat
En
ergy
Lim
ited
N
ish
at H
ote
ls a
nd
To
tal
Co
mp
any
Lim
ited
C
om
pan
y L
imit
ed
(Pri
vate
) L
imit
ed
P
rop
erti
es L
imit
ed
2017
20
16
2017
20
16
2017
20
16
2017
20
16
2017
20
16
2017
20
16
2017
20
16
2017
20
16
----
----
----
----
----
----
----
----
----
----
----
----
----
----
----
----
----
----
----
----
----
----
----
----
----
----
----
----
----
----
----
----
----
----
----
----
(R
up
ees
in t
ho
usa
nd
) --
----
----
----
----
----
----
----
----
----
----
----
----
----
----
----
----
----
----
----
----
----
----
----
----
----
----
----
----
----
----
----
----
----
----
----
--
C
ost
3,4
18,1
45
3,4
18,1
45
116
,342
1
16,3
42
600
,000
6
00,0
00
1,6
40,3
06
1,6
40,3
06
1,2
72,1
94
1,2
72,1
94
5,0
00
5,0
00
710
,620
7
10,6
20
7,7
62,6
07
7,7
62,6
07
Shar
e of
pos
t acq
uisi
tion
rese
rves
:
As
at 0
1 Ju
ly
17,
849,
280
1
6,75
4,27
3
112
,950
4
0,69
9
(220
,499
) (1
37,2
71)
1,9
82,3
31
1,9
75,3
73
2,8
56,8
08
2,4
69,0
22
(3,2
09)
(2,4
35)
(3,2
10)
(16)
2
2,57
4,45
1
21,
099,
645
Shar
e of
pro
fit /
(loss
) afte
r inc
ome
tax
2,5
04,2
57
2,7
59,9
57
84,
877
8
3,04
6
(48,
663)
(8
3,22
8)
302
,267
2
26,4
53
293
,036
5
92,8
35
(105
) (7
74)
(5,6
10)
(3,1
94)
3,1
30,0
59
3,5
75,0
95
Sh
are
of o
ther
com
preh
ensi
ve in
com
e / (
loss
) 1
,173
,991
(9
77,0
79)
(756
) 8
39
-
-
(706
) (7
08)
-
-
-
-
-
-
1,1
72,5
29
(976
,948
)
Div
iden
d re
ceiv
ed
(825
,445
) (6
87,8
71)
(17,
451)
(1
1,63
4)
-
-
(218
,788
) (2
18,7
87)
(205
,050
) (2
05,0
49)
-
-
-
-
(1,2
66,7
34)
(1,1
23,3
41)
As
at 3
0 Ju
ne
2,8
52,8
03
1,0
95,0
07
66,
670
7
2,25
1
(48,
663)
(8
3,22
8)
82,
773
6
,958
8
7,98
6
387
,786
(1
05)
(774
) (5
,610
) (3
,194
) 3
,035
,854
1
,474
,806
20,
702,
083
1
7,84
9,28
0
179
,620
1
12,9
50
(269
,162
) (2
20,4
99)
2,0
65,1
04
1,9
82,3
31
2,9
44,7
94
2,8
56,8
08
(3,3
14)
(3,2
09)
(8,8
20)
(3,2
10)
25,
610,
305
2
2,57
4,45
1
A
s at
30
June
2
4,12
0,22
8
21,
267,
425
2
95,9
62
229
,292
3
30,8
38
379
,501
3
,705
,410
3
,622
,637
4
,216
,988
4
,129
,002
1
,686
1
,791
7
01,8
00
707
,410
3
3,37
2,91
2
30,
337,
058
16.2
.1
Su
mm
aris
ed b
alan
ce s
hee
t
C
urre
nt a
sset
s
27,
300,
684
3
0,83
5,52
1
1,0
67,4
60
1,1
34,1
05
451
,537
5
51,2
81
16,
473,
070
1
4,20
0,85
7
18,
319,
496
1
9,41
1,66
2
475
5
06
3,3
71,3
49
2,5
60,3
27
N
on-c
urre
nt a
sset
s
81,
070,
635
5
2,58
2,74
4
792
,869
7
40,4
38
2,7
79,6
09
2,9
26,4
00
9,5
28,6
94
10,
025,
582
8
,967
,942
9
,799
,714
5
,324
3
,075
2
3,73
1,43
3
19,
820,
360
Cur
rent
liab
ilitie
s
14,
849,
803
1
0,05
6,63
4
482
,215
6
72,7
85
336
,910
1
78,4
72
12,
606,
090
1
0,55
4,94
9
11,
422,
477
1
3,22
0,07
9
2,4
28
-
5,8
13,5
37
696
,762
Non
-cur
rent
liab
ilitie
s
18,
652,
637
7
,578
,202
1
95,0
26
285
,346
2
11,8
86
219
,288
5
29,6
77
1,0
92,9
02
557
,281
1
,003
,106
-
-
1
1,89
0,29
7
12,
209,
172
Net
ass
ets
7
4,86
8,87
9
65,
783,
429
1
,183
,088
9
16,4
12
2,6
82,3
50
3,0
79,9
21
12,
865,
997
1
2,57
8,58
8
15,
307,
680
1
4,98
8,19
1
3,3
71
3,5
81
9,3
98,9
48
9,4
74,7
53
R
eco
nci
liati
on
to c
arry
ing
am
ou
nts
:
As
at 0
1 Ju
ly
65,
783,
429
6
2,29
6,07
1
916
,412
6
27,4
08
3,0
79,9
21
3,7
59,8
90
12,
578,
588
1
2,55
4,42
8
14,
988,
191
1
3,58
0,50
7
3,5
81
5,0
62
9,4
74,7
53
7,9
25,5
13
Sha
re d
epos
it m
oney
-
-
-
-
-
-
-
-
-
-
-
-
-
1
,600
,000
P
rofit
/ (lo
ss) a
fter i
ncom
e ta
x
7,9
75,3
41
8,7
89,6
72
339
,507
3
32,1
83
(397
,571
) (6
79,9
69)
1,0
49,5
39
786
,297
1
,063
,653
2
,151
,848
(2
10)
(1,4
81)
(75,
805)
(5
0,76
0)
Oth
er c
ompr
ehen
sive
inco
me
/ (lo
ss)
3,7
38,8
24
(3,1
11,7
18)
(3,0
26)
3,3
58
-
-
(2,4
52)
(2,4
59)
-
-
-
-
-
-
Div
iden
d pa
id
(2,6
28,7
15)
(2,1
90,5
96)
(69,
805)
(4
6,53
7)
-
-
(759
,678
) (7
59,6
78)
(744
,164
) (7
44,1
64)
-
-
-
-
A
s at
30
June
7
4,86
8,87
9
65,
783,
429
1
,183
,088
9
16,4
12
2,6
82,3
50
3,0
79,9
21
12,
865,
997
1
2,57
8,58
8
15,
307,
680
1
4,98
8,19
1
3,3
71
3,5
81
9,3
98,9
48
9,4
74,7
53
G
roup
’s s
hare
(%)
31.4
0%
31.4
0%
25.0
0%
25.0
0%
12.2
4%
12.2
4%
28.8
0%
28.8
0%
27.5
5%
27.5
5%
50.0
0%
50.0
0%
7.40
%
7.40
%
G
roup
’s s
hare
2
3,50
8,80
0
20,
655,
997
2
95,7
73
229
,103
3
28,3
20
376
,983
3
,705
,410
3
,622
,637
4
,216
,988
4
,129
,002
1
,686
1
,791
6
95,5
22
701
,132
G
oodw
ill
611
,428
6
11,4
28
189
1
89
2,5
18
2,5
18
-
-
-
-
-
-
6,2
78
6,2
78
C
arry
ing
amou
nt
24,
120,
228
2
1,26
7,42
5
295
,962
2
29,2
92
330
,838
3
79,5
01
3,7
05,4
10
3,6
22,6
37
4,2
16,9
88
4,1
29,0
02
1,6
86
1,7
91
701
,800
7
07,4
10
16.2
.2
Su
mm
aris
ed s
tate
men
t o
f co
mp
reh
ensi
ve in
com
e
R
even
ue
30,
136,
165
2
9,70
3,75
8
2,4
83,9
88
2,3
66,0
46
1,1
10,0
88
1,1
76,1
56
18,
031,
830
1
7,52
2,89
9
19,
186,
785
9
,489
,228
-
-
-
-
Pro
fit /
(loss
) for
the
perio
d
7,9
75,3
41
8,7
89,6
72
339
,507
3
32,1
83
(397
,571
) (6
79,9
69)
1,0
49,5
39
786
,297
1
,063
,653
2
,151
,848
(2
10)
(1,4
81)
(75,
805)
(5
0,76
0)
Oth
er c
ompr
ehen
sive
inco
me
/ (lo
ss)
3,7
38,8
24
(3,1
11,7
18)
(3,0
26)
3,3
58
-
-
(2,4
52)
(2,4
59)
-
-
-
-
-
-
T
otal
com
preh
ensi
ve in
com
e
11,
714,
165
5
,677
,954
3
36,4
81
335
,541
(3
97,5
71)
(679
,969
) 1
,047
,087
7
83,8
38
1,0
63,6
53
2,1
51,8
48
(210
) (1
,481
) (7
5,80
5)
(50,
760)
Div
iden
d re
ceiv
ed fr
om a
ssoc
iate
s
825
,445
6
87,8
71
17,
451
1
1,63
4
-
-
218
,788
2
18,7
87
205
,050
2
05,0
49
-
-
-
-
16
.3
Ada
mje
e In
sura
nce
Com
pany
Lim
ited
and
MC
B B
ank
Lim
ited
are
asso
ciat
ed c
ompa
nies
due
to c
omm
on d
irect
orsh
ip.
16
.4
Inte
rest
s in
ass
oci
ates
Nam
e o
f as
soci
ated
co
mp
any
No
te
Co
un
try
of
% o
f o
wn
ersh
ip in
tere
st
Mea
sure
men
t
Q
uo
ted
fai
r va
lue
Car
ryin
g a
mo
un
t
in
corp
ora
tio
n
met
ho
d
20
17
2016
2017
20
16
2017
20
16
--
----
----
----
---
(Ru
pee
s in
th
ou
san
d)
----
----
----
----
-
D
.G. K
han
Cem
ent C
ompa
ny L
imite
d 16
.4.1
Pa
kist
an
31.4
0%
31.4
0%
Equ
ity m
etho
d
29,
325,
317
2
6,20
6,51
0
24,
120,
228
2
1,26
7,42
5
Nis
hat P
aper
Pro
duct
s C
ompa
ny L
imite
d
16.4
.2
Paki
stan
25
.00%
25
.00%
E
quity
met
hod
-*
-*
2
95,9
62
229
,292
N
isha
t Dai
ry (P
rivat
e) L
imite
d 16
.4.3
Pa
kist
an
12.2
4%
12.2
4%
Equ
ity m
etho
d
-*
-*
330
,838
3
79,5
01
Lalp
ir Po
wer
Lim
ited
16.4
.4
Paki
stan
28
.80%
28
.80%
E
quity
met
hod
2
,244
,756
2
,373
,840
3
,705
,410
3
,622
,637
Pa
kgen
Pow
er L
imite
d 16
.4.5
Pa
kist
an
27.5
5%
27.5
5%
Equ
ity m
etho
d
2,0
73,0
50
2,4
65,7
20
4,2
16,9
88
4,1
29,0
02
Nis
hat E
nerg
y Li
mite
d 16
.4.6
Pa
kist
an
50.0
0%
50.0
0%
Equ
ity m
etho
d
-*
-*
1,6
86
1,7
91
Nis
hat H
otel
s an
d Pr
oper
ties
Lim
ited
16.4
.7
Paki
stan
7.
40%
7.
40%
E
quity
met
hod
-*
-*
7
01,8
00
707
,410
16
.4.1
D
.G. K
han
Cem
ent C
ompa
ny L
imite
d is
eng
aged
in p
rodu
ctio
n an
d sa
le o
f clin
ker,
ordi
nary
por
tland
and
sul
phat
e re
sist
ant c
emen
t.
16.4
.2
Nis
hat P
aper
Pro
duct
s C
ompa
ny L
imite
d is
eng
aged
in th
e m
anuf
actu
re a
nd s
ale
of p
aper
pro
duct
s an
d pa
ckag
ing
mat
eria
l.
16
.4.3
N
isha
t Dai
ry (P
rivat
e) L
imite
d is
eng
aged
in th
e bu
sine
ss o
f pro
duct
ion
of ra
w m
ilk.
16.4
.4
The
prin
cipa
l act
iviti
es o
f Lal
pir P
ower
Lim
ited
are
to o
wn,
ope
rate
and
mai
ntai
n an
oil
fired
pow
er s
tatio
n ha
ving
gro
ss c
apac
ity o
f 362
MW
in M
ehm
ood
Kot
, Muz
affa
rgar
h, P
unja
b, P
akis
tan.
16
.4.5
Th
e pr
inci
pal a
ctiv
ities
of P
akge
n Po
wer
Lim
ited
are
to o
wn,
ope
rate
and
mai
ntai
n an
oil
fired
pow
er s
tatio
n ha
ving
gro
ss c
apac
ity o
f 365
MW
in M
ehm
ood
Kot
, Muz
affa
rgar
h, P
unja
b, P
akis
tan.
16.4
.6
The
prin
cipa
l act
ivity
of t
he N
isha
t Ene
rgy
Lim
ited
is to
bui
ld, o
wn,
ope
rate
and
mai
ntai
n co
al p
ower
sta
tion
havi
ng g
ross
cap
acity
of 6
60 M
W w
ith n
et e
stim
ated
gen
erat
ion
capa
city
of 6
00 M
W a
t Mou
za A
mee
r Pur
, Rah
im Y
ar K
han,
Pun
jab,
Pak
ista
n.
16.4
.7
The
prin
cipa
l act
ivity
of t
he N
isha
t Hot
els
and
Prop
ertie
s Li
mite
d is
to e
stab
lish
and
man
age
shop
ping
mal
l and
hot
el o
pera
tions
in P
akis
tan.
*
No
quot
ed p
rice
avai
labl
e.
Notes to the Consolidated Financial Statements For the year ended June 30, 2017
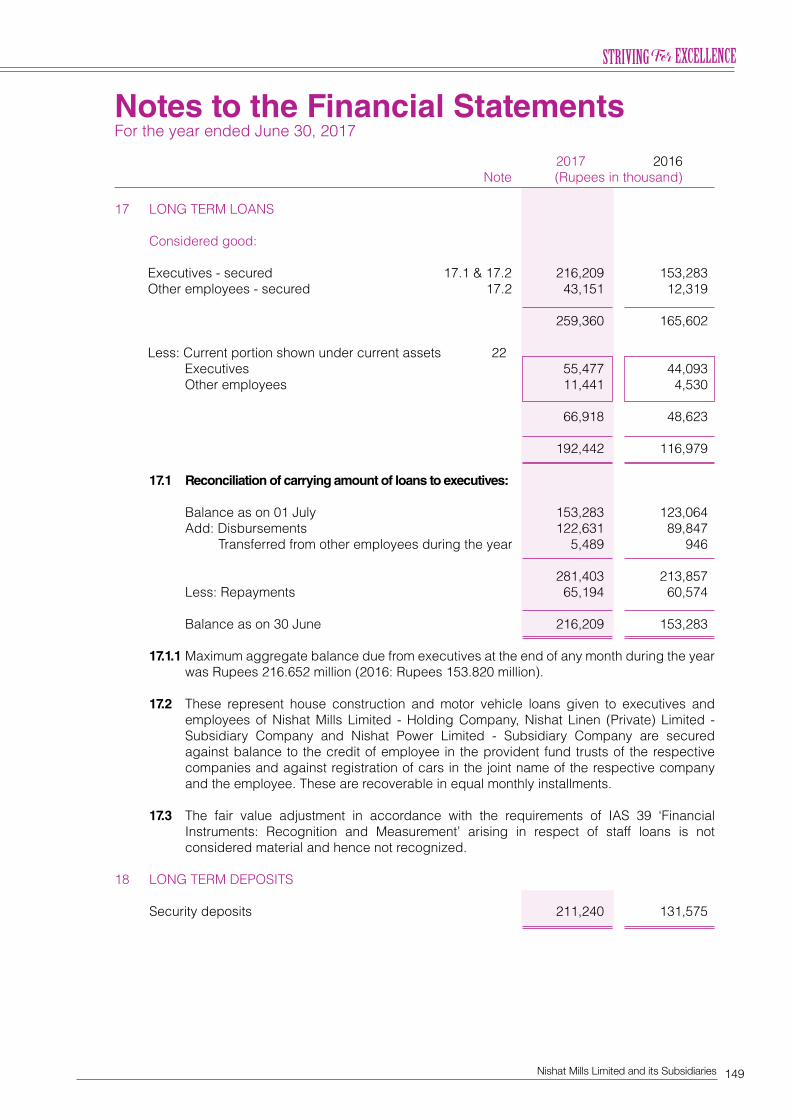
149Nishat Mills Limited and its Subsidiaries
2017 2016 Note (Rupees in thousand)
17 LONG TERM LOANS Considered good: Executives - secured 17.1 & 17.2 216,209 153,283 Other employees - secured 17.2 43,151 12,319
259,360 165,602 Less: Current portion shown under current assets 22
Executives 55,477 44,093 Other employees 11,441 4,530 66,918 48,623 192,442 116,979
17.1 Reconciliation of carrying amount of loans to executives:
Balance as on 01 July 153,283 123,064 Add: Disbursements 122,631 89,847 Transferred from other employees during the year 5,489 946 281,403 213,857 Less: Repayments 65,194 60,574 Balance as on 30 June 216,209 153,283 17.1.1 Maximum aggregate balance due from executives at the end of any month during the year
was Rupees 216.652 million (2016: Rupees 153.820 million). 17.2 These represent house construction and motor vehicle loans given to executives and
employees of Nishat Mills Limited - Holding Company, Nishat Linen (Private) Limited - Subsidiary Company and Nishat Power Limited - Subsidiary Company are secured against balance to the credit of employee in the provident fund trusts of the respective companies and against registration of cars in the joint name of the respective company and the employee. These are recoverable in equal monthly installments.
17.3 The fair value adjustment in accordance with the requirements of IAS 39 ‘Financial
Instruments: Recognition and Measurement’ arising in respect of staff loans is not considered material and hence not recognized.
18 LONG TERM DEPOSITS Security deposits 211,240 131,575
Notes to the Financial Statements For the year ended June 30, 2017
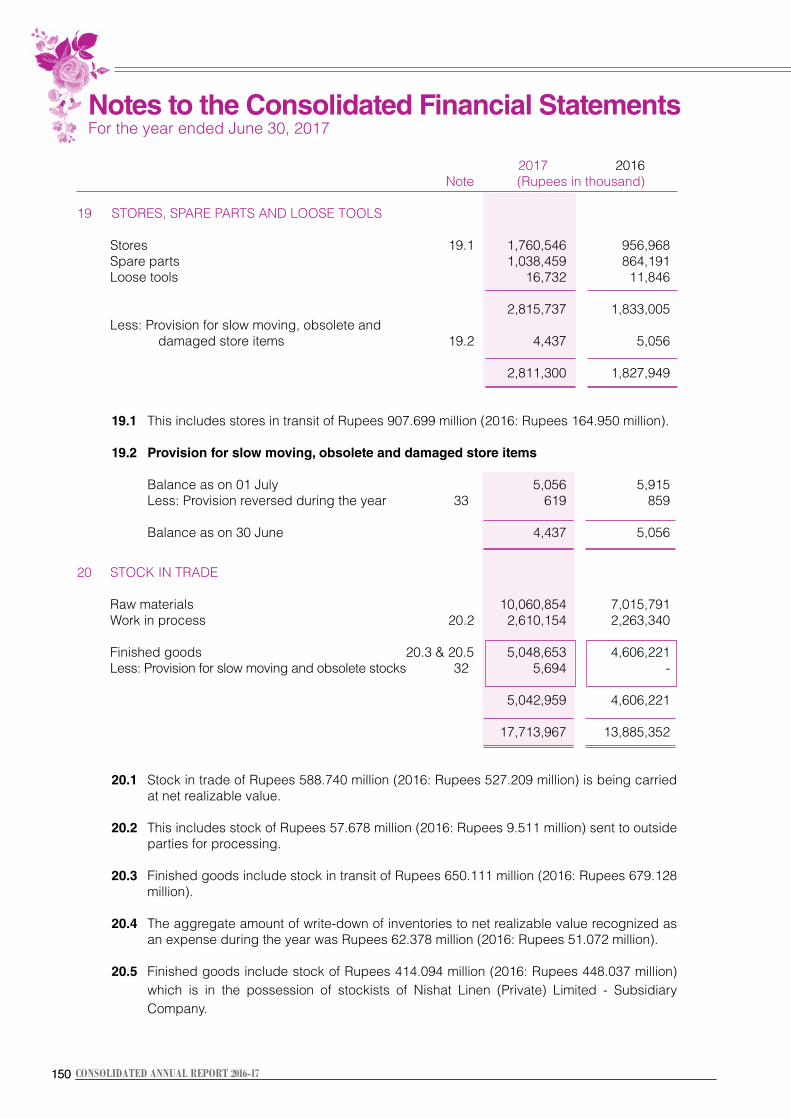
150150 CONSOLIDATED ANNUAL REPORT 2016-17
2017 2016 Note (Rupees in thousand)
19 STORES, SPARE PARTS AND LOOSE TOOLS Stores 19.1 1,760,546 956,968 Spare parts 1,038,459 864,191 Loose tools 16,732 11,846
2,815,737 1,833,005 Less: Provision for slow moving, obsolete and damaged store items 19.2 4,437 5,056 2,811,300 1,827,949
19.1 This includes stores in transit of Rupees 907.699 million (2016: Rupees 164.950 million).
19.2 Provision for slow moving, obsolete and damaged store items
Balance as on 01 July 5,056 5,915 Less: Provision reversed during the year 33 619 859
Balance as on 30 June 4,437 5,056 20 STOCK IN TRADE Raw materials 10,060,854 7,015,791 Work in process 20.2 2,610,154 2,263,340 Finished goods 20.3 & 20.5 5,048,653 4,606,221 Less: Provision for slow moving and obsolete stocks 32 5,694 -
5,042,959 4,606,221 17,713,967 13,885,352 20.1 Stock in trade of Rupees 588.740 million (2016: Rupees 527.209 million) is being carried
at net realizable value. 20.2 This includes stock of Rupees 57.678 million (2016: Rupees 9.511 million) sent to outside
parties for processing. 20.3 Finished goods include stock in transit of Rupees 650.111 million (2016: Rupees 679.128
million). 20.4 The aggregate amount of write-down of inventories to net realizable value recognized as
an expense during the year was Rupees 62.378 million (2016: Rupees 51.072 million). 20.5 Finished goods include stock of Rupees 414.094 million (2016: Rupees 448.037 million)
which is in the possession of stockists of Nishat Linen (Private) Limited - Subsidiary Company.
Notes to the Consolidated Financial Statements For the year ended June 30, 2017
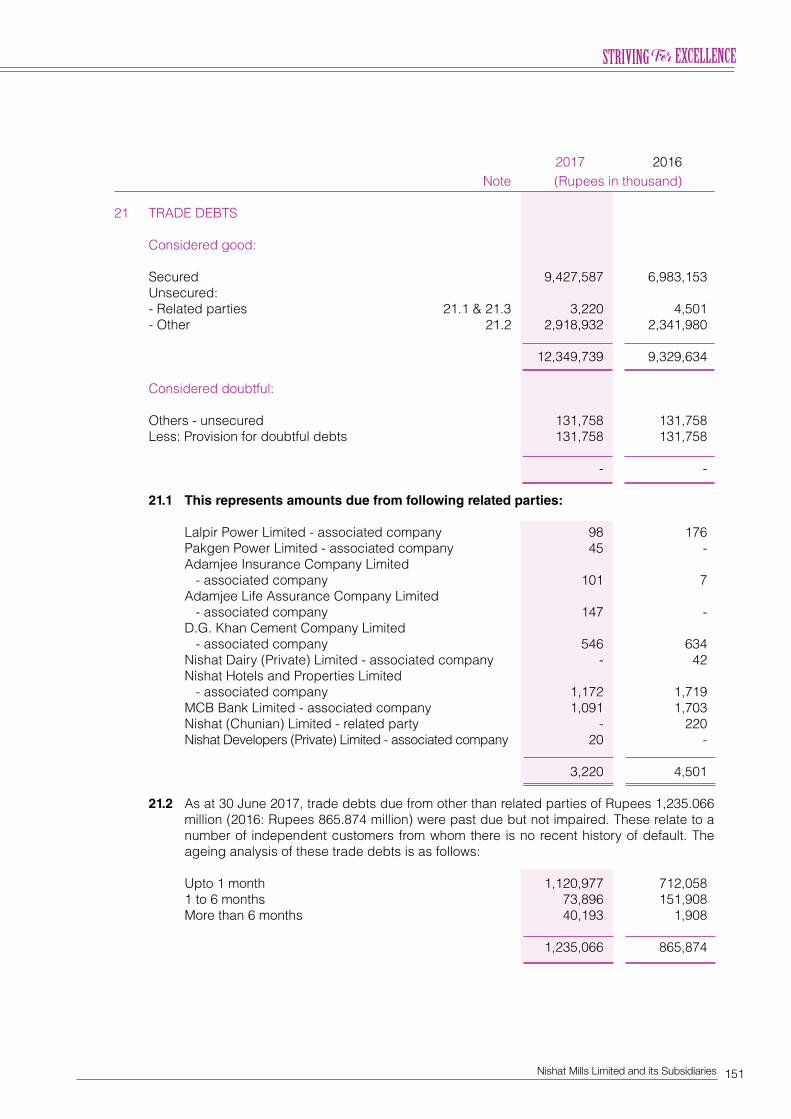
151Nishat Mills Limited and its Subsidiaries
2017 2016 Note (Rupees in thousand)
21 TRADE DEBTS Considered good: Secured 9,427,587 6,983,153 Unsecured: - Related parties 21.1 & 21.3 3,220 4,501 - Other 21.2 2,918,932 2,341,980 12,349,739 9,329,634 Considered doubtful: Others - unsecured 131,758 131,758 Less: Provision for doubtful debts 131,758 131,758 - - 21.1 This represents amounts due from following related parties:
Lalpir Power Limited - associated company 98 176 Pakgen Power Limited - associated company 45 - Adamjee Insurance Company Limited - associated company 101 7 Adamjee Life Assurance Company Limited - associated company 147 - D.G. Khan Cement Company Limited - associated company 546 634 Nishat Dairy (Private) Limited - associated company - 42 Nishat Hotels and Properties Limited - associated company 1,172 1,719 MCB Bank Limited - associated company 1,091 1,703 Nishat (Chunian) Limited - related party - 220 Nishat Developers (Private) Limited - associated company 20 - 3,220 4,501 21.2 As at 30 June 2017, trade debts due from other than related parties of Rupees 1,235.066
million (2016: Rupees 865.874 million) were past due but not impaired. These relate to a number of independent customers from whom there is no recent history of default. The ageing analysis of these trade debts is as follows:
Upto 1 month 1,120,977 712,058 1 to 6 months 73,896 151,908 More than 6 months 40,193 1,908 1,235,066 865,874
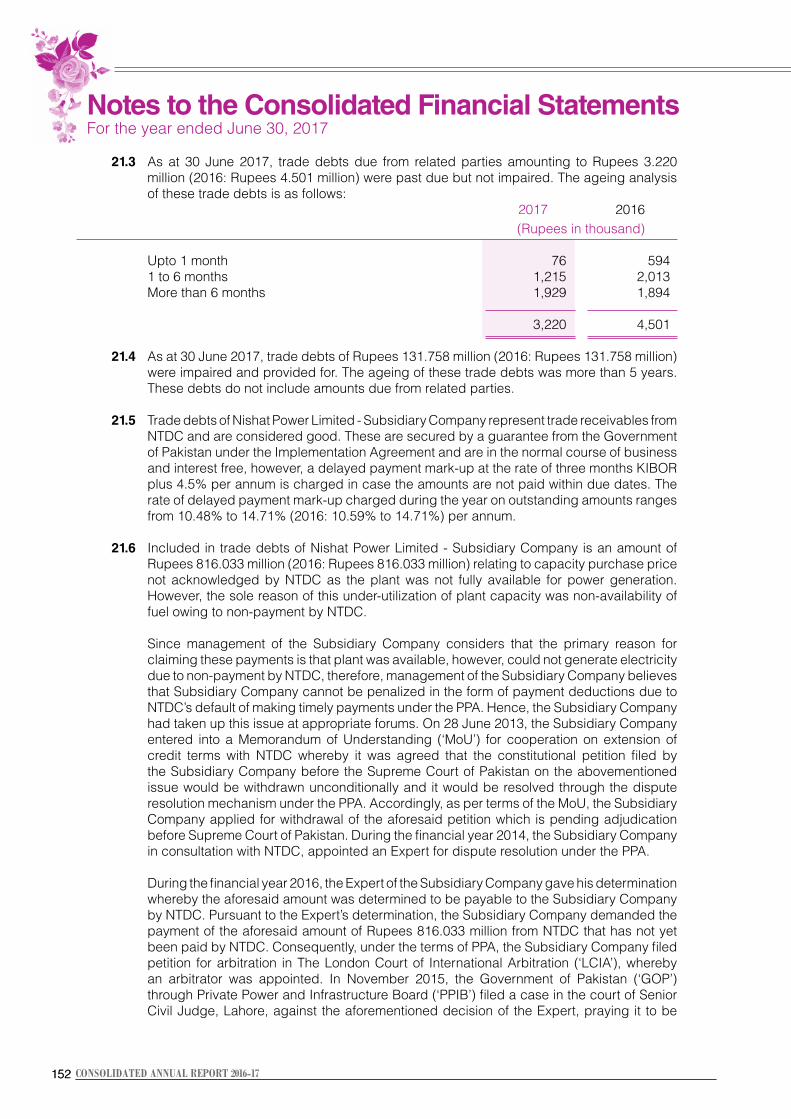
152152 CONSOLIDATED ANNUAL REPORT 2016-17
21.3 As at 30 June 2017, trade debts due from related parties amounting to Rupees 3.220 million (2016: Rupees 4.501 million) were past due but not impaired. The ageing analysis of these trade debts is as follows:
2017 2016 (Rupees in thousand) Upto 1 month 76 594 1 to 6 months 1,215 2,013 More than 6 months 1,929 1,894 3,220 4,501 21.4 As at 30 June 2017, trade debts of Rupees 131.758 million (2016: Rupees 131.758 million)
were impaired and provided for. The ageing of these trade debts was more than 5 years. These debts do not include amounts due from related parties.
21.5 Trade debts of Nishat Power Limited - Subsidiary Company represent trade receivables from
NTDC and are considered good. These are secured by a guarantee from the Government of Pakistan under the Implementation Agreement and are in the normal course of business and interest free, however, a delayed payment mark-up at the rate of three months KIBOR plus 4.5% per annum is charged in case the amounts are not paid within due dates. The rate of delayed payment mark-up charged during the year on outstanding amounts ranges from 10.48% to 14.71% (2016: 10.59% to 14.71%) per annum.
21.6 Included in trade debts of Nishat Power Limited - Subsidiary Company is an amount of
Rupees 816.033 million (2016: Rupees 816.033 million) relating to capacity purchase price not acknowledged by NTDC as the plant was not fully available for power generation. However, the sole reason of this under-utilization of plant capacity was non-availability of fuel owing to non-payment by NTDC.
Since management of the Subsidiary Company considers that the primary reason for
claiming these payments is that plant was available, however, could not generate electricity due to non-payment by NTDC, therefore, management of the Subsidiary Company believes that Subsidiary Company cannot be penalized in the form of payment deductions due to NTDC’s default of making timely payments under the PPA. Hence, the Subsidiary Company had taken up this issue at appropriate forums. On 28 June 2013, the Subsidiary Company entered into a Memorandum of Understanding (‘MoU’) for cooperation on extension of credit terms with NTDC whereby it was agreed that the constitutional petition filed by the Subsidiary Company before the Supreme Court of Pakistan on the abovementioned issue would be withdrawn unconditionally and it would be resolved through the dispute resolution mechanism under the PPA. Accordingly, as per terms of the MoU, the Subsidiary Company applied for withdrawal of the aforesaid petition which is pending adjudication before Supreme Court of Pakistan. During the financial year 2014, the Subsidiary Company in consultation with NTDC, appointed an Expert for dispute resolution under the PPA.
During the financial year 2016, the Expert of the Subsidiary Company gave his determination
whereby the aforesaid amount was determined to be payable to the Subsidiary Company by NTDC. Pursuant to the Expert’s determination, the Subsidiary Company demanded the payment of the aforesaid amount of Rupees 816.033 million from NTDC that has not yet been paid by NTDC. Consequently, under the terms of PPA, the Subsidiary Company filed petition for arbitration in The London Court of International Arbitration (‘LCIA’), whereby an arbitrator was appointed. In November 2015, the Government of Pakistan (‘GOP’) through Private Power and Infrastructure Board (‘PPIB’) filed a case in the court of Senior Civil Judge, Lahore, against the aforementioned decision of the Expert, praying it to be
Notes to the Consolidated Financial Statements For the year ended June 30, 2017
153Nishat Mills Limited and its Subsidiaries
illegal, which is pending adjudication. Furthermore, NTDC filed a stay application in the LCIA before the Arbitrator to stay the arbitration proceedings. In response to NTDC’s stay application, the Arbitrator through his order dated 08 July 2016, has declared that the arbitration shall proceed and has denied NTDC’s request for a stay. Also, the Arbitrator has ordered NTDC to withdraw the abovementioned case filed in the court of Senior Civil Judge, Lahore and has refrained it from taking any further steps therein to disrupt the arbitration proceedings.
Consequently, notices of arbitration were issued to the relevant parties including PPIB.
In response to the aforementioned Arbitrator’s order dated 08 July 2016, the Subsidiary Company and PPIB filed separate applications before the Civil Judge, Lahore. In its application, the Subsidiary Company prayed that the Civil Court, Lahore lacks the jurisdiction in respect of the case against the Expert’s determination. Meanwhile, PPIB, through its application, requested the Civil Court to grant interim relief in respect of the Expert’s determination, notice of arbitration issued and interim orders of the Arbitrator. In respect of the aforementioned applications, through its interim orders dated 18 April 2017, the Civil Court, Lahore rejected the Subsidiary Company’s application and granted the plea of PPIB whereby, the court suspended the arbitration proceedings and restrained the parties from participating in the arbitration proceedings till the final decision of the aforementioned case before the Senior Civil Judge, Lahore against the Expert’s determination. Being aggrieved, the Subsidiary Company filed an application before the Additional District Judge, Lahore against the aforementioned orders of the Civil Court and continued to take part in the arbitration proceedings, while NTDC and PPIB did not participate in any subsequent arbitration proceedings pursuant to the decisions of the Civil Court, Lahore dated 18 April 2017. Furthermore, in response to the Subsidiary Company’s continued participation in the arbitration proceedings, PPIB filed a contempt petition before Lahore High Court (‘LHC’) in respect of the decision of the Civil Court, Lahore.
LHC decided the matter in the Subsidiary Company’s favour through its order dated 31
May 2017 whereby the aforementioned order of the Civil Judge, Lahore in respect of the suspension of arbitration proceedings was suspended and the arbitration proceedings were restored. As a consequence of the aforementioned order of LHC, the Arbitrator on 08 June 2017, declared his Partial Final Award wherein he decided the matter principally in the Subsidiary Company’s favour and declared that the above mentioned Expert’s determination is final and binding on all parties. However, the matter of determining the appropriate quantum and form of the Subsidiary Company’s claim, has been deferred by the Arbitrator for consideration at a further hearing which is scheduled for 01 October 2017. Furthermore, subsequent to the year end, the District Judge, Lahore through his order dated 08 July 2017 has set-aside the aforementioned orders of the Civil Judge, Lahore dated 18 April 2017 and has accepted Subsidiary Company’s appeals for further proceedings. Meanwhile, the Subsidiary Company also filed a writ petition before LHC whereby, it again challenged the jurisdiction of Civil and District Courts (herein after referred to as ‘Trial Courts’) with respect to the matters relating to the aforesaid arbitration proceedings. LHC, through its order dated 07 September 2017, has suspended the aforesaid interim orders and proceedings of the Trial Courts till the final decision of LHC that is pending adjudication.
Based on the advice of the Subsidiary Company’s legal counsel, Expert’s determination and
Arbitration Award, management of the Subsidiary Company strongly feels that under the terms of the PPA and Implementation Agreement, there are meritorious grounds to support the Subsidiary Company’s stance the amount is likely to be recovered. Consequently, no provision for the above mentioned amount has been made in these consolidated financial statements.
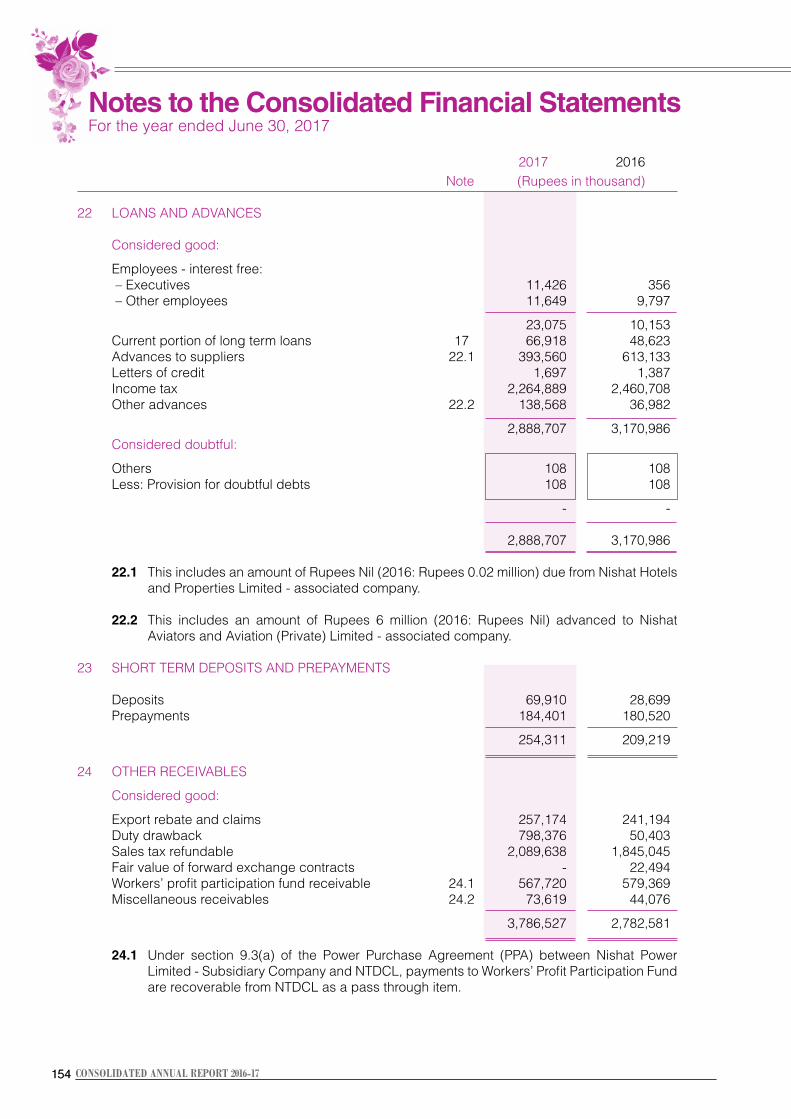
154154 CONSOLIDATED ANNUAL REPORT 2016-17
2017 2016 Note (Rupees in thousand)
22 LOANS AND ADVANCES Considered good: Employees - interest free: – Executives 11,426 356 – Other employees 11,649 9,797
23,075 10,153 Current portion of long term loans 17 66,918 48,623 Advances to suppliers 22.1 393,560 613,133 Letters of credit 1,697 1,387 Income tax 2,264,889 2,460,708 Other advances 22.2 138,568 36,982
2,888,707 3,170,986 Considered doubtful: Others 108 108 Less: Provision for doubtful debts 108 108
- -
2,888,707 3,170,986 22.1 This includes an amount of Rupees Nil (2016: Rupees 0.02 million) due from Nishat Hotels
and Properties Limited - associated company. 22.2 This includes an amount of Rupees 6 million (2016: Rupees Nil) advanced to Nishat
Aviators and Aviation (Private) Limited - associated company. 23 SHORT TERM DEPOSITS AND PREPAYMENTS Deposits 69,910 28,699 Prepayments 184,401 180,520
254,311 209,219 24 OTHER RECEIVABLES
Considered good:
Export rebate and claims 257,174 241,194 Duty drawback 798,376 50,403 Sales tax refundable 2,089,638 1,845,045 Fair value of forward exchange contracts - 22,494 Workers’ profit participation fund receivable 24.1 567,720 579,369 Miscellaneous receivables 24.2 73,619 44,076
3,786,527 2,782,581 24.1 Under section 9.3(a) of the Power Purchase Agreement (PPA) between Nishat Power
Limited - Subsidiary Company and NTDCL, payments to Workers’ Profit Participation Fund are recoverable from NTDCL as a pass through item.
Notes to the Consolidated Financial Statements For the year ended June 30, 2017
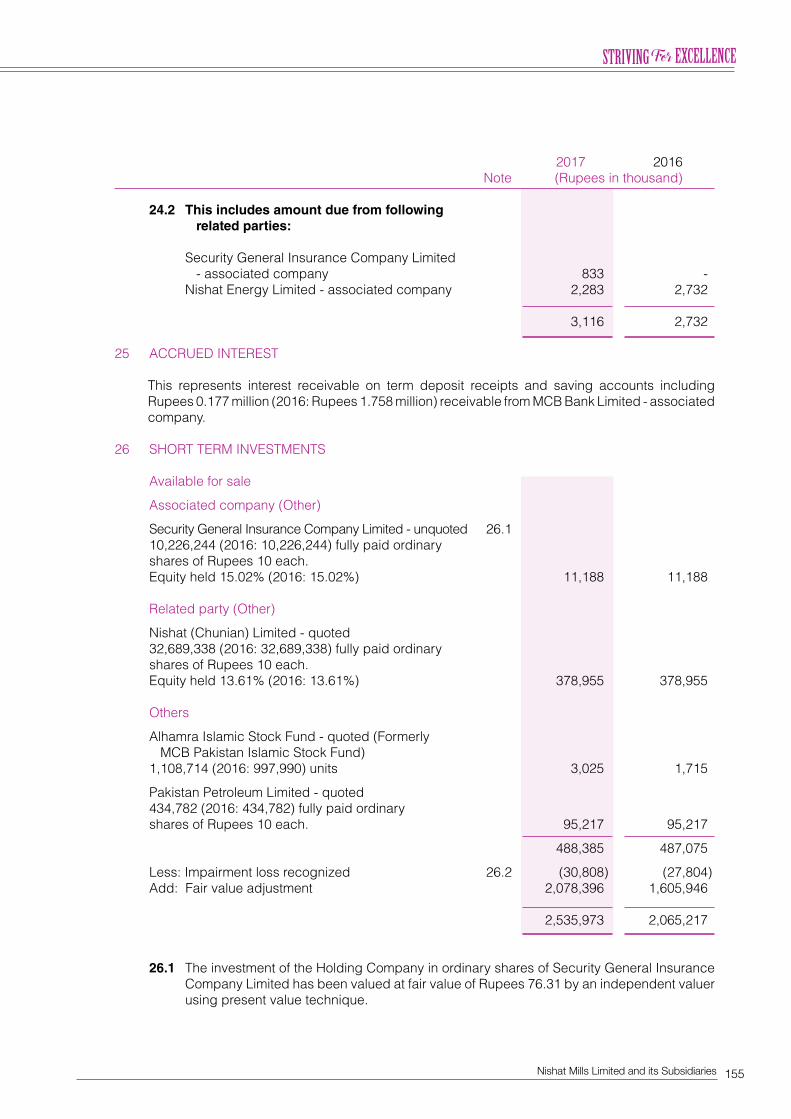
155Nishat Mills Limited and its Subsidiaries
2017 2016 Note (Rupees in thousand)
24.2 This includes amount due from following related parties: Security General Insurance Company Limited - associated company 833 - Nishat Energy Limited - associated company 2,283 2,732
3,116 2,732 25 ACCRUED INTEREST This represents interest receivable on term deposit receipts and saving accounts including
Rupees 0.177 million (2016: Rupees 1.758 million) receivable from MCB Bank Limited - associated company.
26 SHORT TERM INVESTMENTS Available for sale Associated company (Other) Security General Insurance Company Limited - unquoted 26.1 10,226,244 (2016: 10,226,244) fully paid ordinary shares of Rupees 10 each. Equity held 15.02% (2016: 15.02%) 11,188 11,188 Related party (Other) Nishat (Chunian) Limited - quoted 32,689,338 (2016: 32,689,338) fully paid ordinary shares of Rupees 10 each. Equity held 13.61% (2016: 13.61%) 378,955 378,955 Others Alhamra Islamic Stock Fund - quoted (Formerly MCB Pakistan Islamic Stock Fund) 1,108,714 (2016: 997,990) units 3,025 1,715 Pakistan Petroleum Limited - quoted 434,782 (2016: 434,782) fully paid ordinary shares of Rupees 10 each. 95,217 95,217 488,385 487,075 Less: Impairment loss recognized 26.2 (30,808) (27,804) Add: Fair value adjustment 2,078,396 1,605,946 2,535,973 2,065,217 26.1 The investment of the Holding Company in ordinary shares of Security General Insurance
Company Limited has been valued at fair value of Rupees 76.31 by an independent valuer using present value technique.
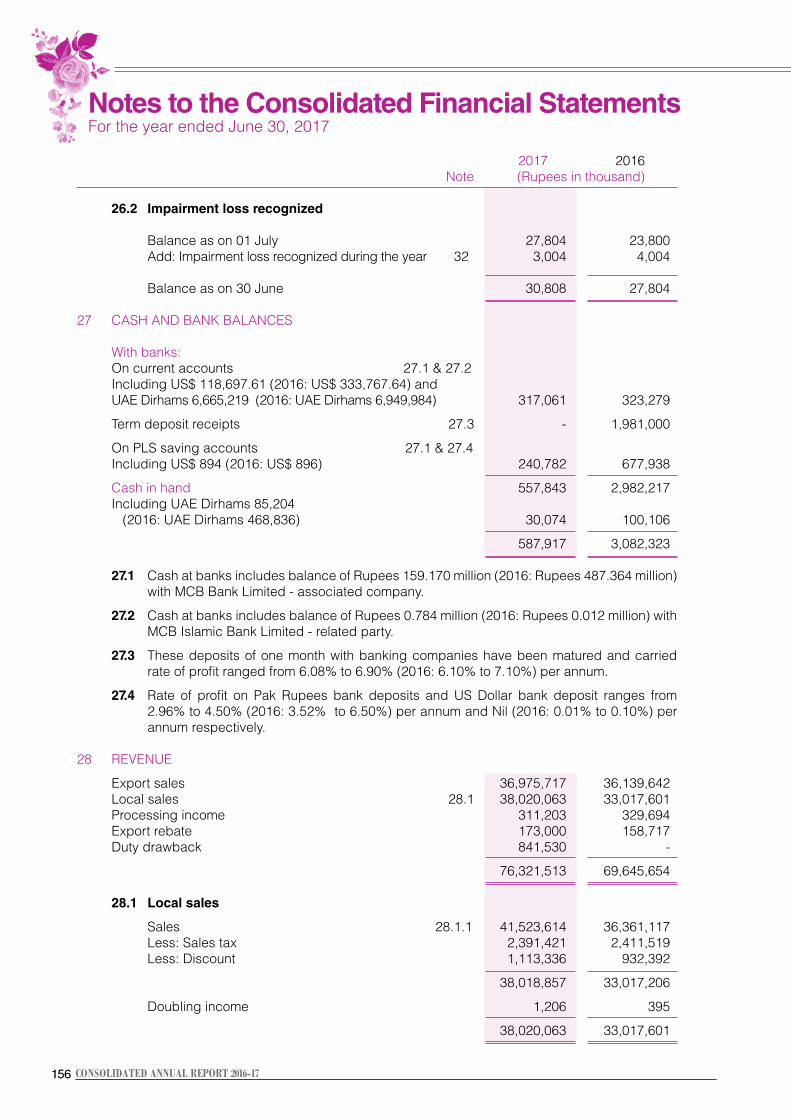
156156 CONSOLIDATED ANNUAL REPORT 2016-17
2017 2016 Note (Rupees in thousand) 26.2 Impairment loss recognized Balance as on 01 July 27,804 23,800 Add: Impairment loss recognized during the year 32 3,004 4,004 Balance as on 30 June 30,808 27,804 27 CASH AND BANK BALANCES With banks: On current accounts 27.1 & 27.2 Including US$ 118,697.61 (2016: US$ 333,767.64) and UAE Dirhams 6,665,219 (2016: UAE Dirhams 6,949,984) 317,061 323,279 Term deposit receipts 27.3 - 1,981,000 On PLS saving accounts 27.1 & 27.4 Including US$ 894 (2016: US$ 896) 240,782 677,938 Cash in hand 557,843 2,982,217 Including UAE Dirhams 85,204 (2016: UAE Dirhams 468,836) 30,074 100,106 587,917 3,082,323 27.1 Cash at banks includes balance of Rupees 159.170 million (2016: Rupees 487.364 million)
with MCB Bank Limited - associated company. 27.2 Cash at banks includes balance of Rupees 0.784 million (2016: Rupees 0.012 million) with
MCB Islamic Bank Limited - related party. 27.3 These deposits of one month with banking companies have been matured and carried
rate of profit ranged from 6.08% to 6.90% (2016: 6.10% to 7.10%) per annum. 27.4 Rate of profit on Pak Rupees bank deposits and US Dollar bank deposit ranges from
2.96% to 4.50% (2016: 3.52% to 6.50%) per annum and Nil (2016: 0.01% to 0.10%) per annum respectively.
28 REVENUE Export sales 36,975,717 36,139,642 Local sales 28.1 38,020,063 33,017,601 Processing income 311,203 329,694 Export rebate 173,000 158,717 Duty drawback 841,530 - 76,321,513 69,645,654 28.1 Local sales Sales 28.1.1 41,523,614 36,361,117 Less: Sales tax 2,391,421 2,411,519 Less: Discount 1,113,336 932,392 38,018,857 33,017,206 Doubling income 1,206 395 38,020,063 33,017,601
Notes to the Consolidated Financial Statements For the year ended June 30, 2017
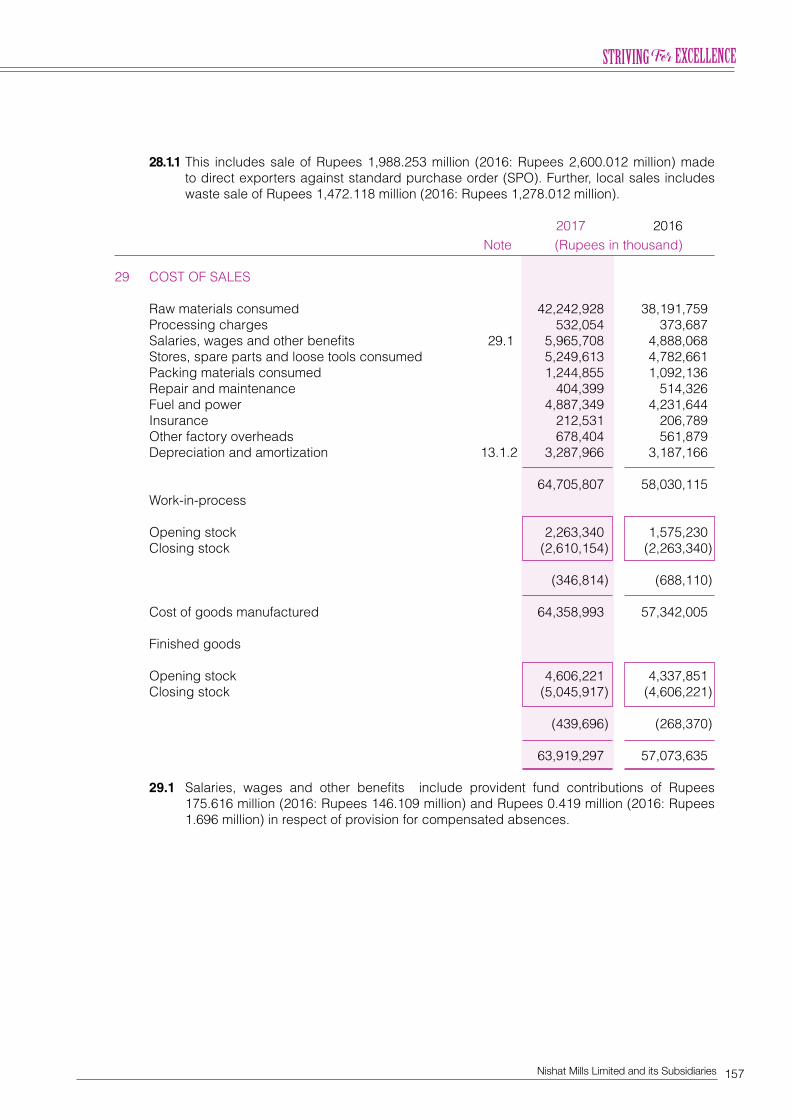
157Nishat Mills Limited and its Subsidiaries
28.1.1 This includes sale of Rupees 1,988.253 million (2016: Rupees 2,600.012 million) made to direct exporters against standard purchase order (SPO). Further, local sales includes waste sale of Rupees 1,472.118 million (2016: Rupees 1,278.012 million).
2017 2016 Note (Rupees in thousand)
29 COST OF SALES Raw materials consumed 42,242,928 38,191,759 Processing charges 532,054 373,687 Salaries, wages and other benefits 29.1 5,965,708 4,888,068 Stores, spare parts and loose tools consumed 5,249,613 4,782,661 Packing materials consumed 1,244,855 1,092,136 Repair and maintenance 404,399 514,326 Fuel and power 4,887,349 4,231,644 Insurance 212,531 206,789 Other factory overheads 678,404 561,879 Depreciation and amortization 13.1.2 3,287,966 3,187,166
64,705,807 58,030,115 Work-in-process Opening stock 2,263,340 1,575,230 Closing stock (2,610,154) (2,263,340)
(346,814) (688,110)
Cost of goods manufactured 64,358,993 57,342,005 Finished goods Opening stock 4,606,221 4,337,851 Closing stock (5,045,917) (4,606,221)
(439,696) (268,370)
63,919,297 57,073,635 29.1 Salaries, wages and other benefits include provident fund contributions of Rupees
175.616 million (2016: Rupees 146.109 million) and Rupees 0.419 million (2016: Rupees 1.696 million) in respect of provision for compensated absences.
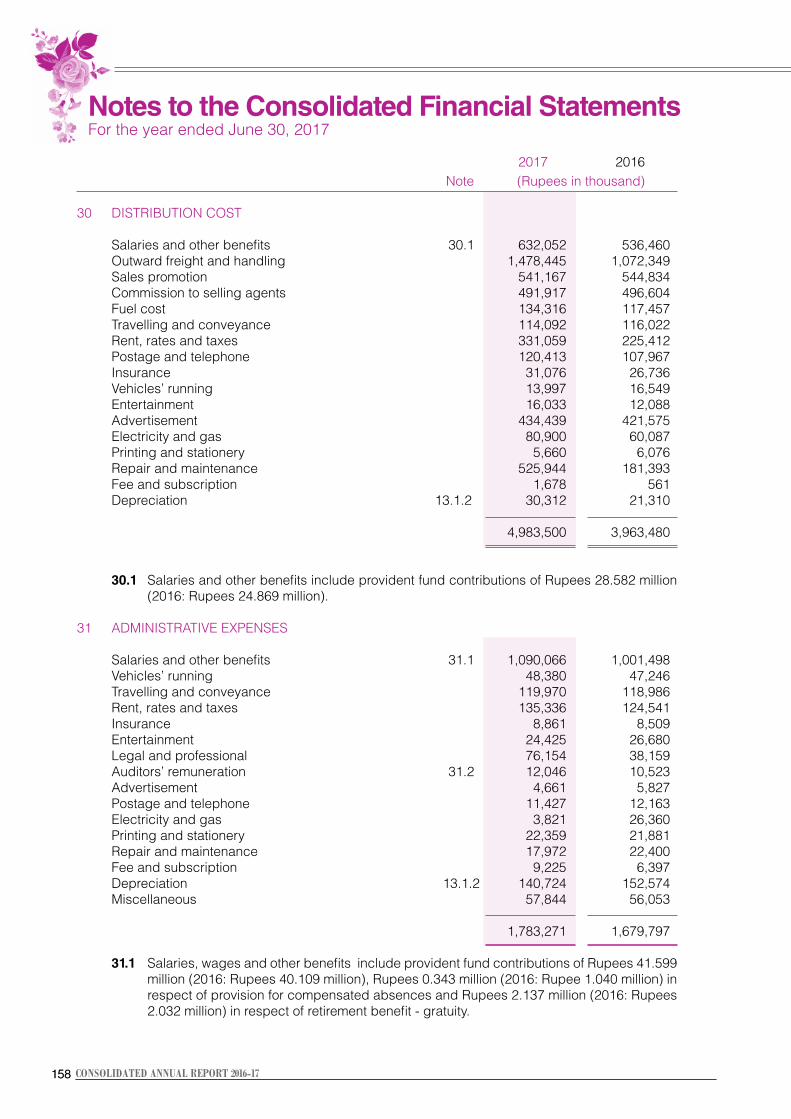
158158 CONSOLIDATED ANNUAL REPORT 2016-17
2017 2016 Note (Rupees in thousand)
30 DISTRIBUTION COST Salaries and other benefits 30.1 632,052 536,460 Outward freight and handling 1,478,445 1,072,349 Sales promotion 541,167 544,834 Commission to selling agents 491,917 496,604 Fuel cost 134,316 117,457 Travelling and conveyance 114,092 116,022 Rent, rates and taxes 331,059 225,412 Postage and telephone 120,413 107,967 Insurance 31,076 26,736 Vehicles’ running 13,997 16,549 Entertainment 16,033 12,088 Advertisement 434,439 421,575 Electricity and gas 80,900 60,087 Printing and stationery 5,660 6,076 Repair and maintenance 525,944 181,393 Fee and subscription 1,678 561 Depreciation 13.1.2 30,312 21,310
4,983,500 3,963,480
30.1 Salaries and other benefits include provident fund contributions of Rupees 28.582 million (2016: Rupees 24.869 million).
31 ADMINISTRATIVE EXPENSES Salaries and other benefits 31.1 1,090,066 1,001,498 Vehicles’ running 48,380 47,246 Travelling and conveyance 119,970 118,986 Rent, rates and taxes 135,336 124,541 Insurance 8,861 8,509 Entertainment 24,425 26,680 Legal and professional 76,154 38,159 Auditors’ remuneration 31.2 12,046 10,523 Advertisement 4,661 5,827 Postage and telephone 11,427 12,163 Electricity and gas 3,821 26,360 Printing and stationery 22,359 21,881 Repair and maintenance 17,972 22,400 Fee and subscription 9,225 6,397 Depreciation 13.1.2 140,724 152,574 Miscellaneous 57,844 56,053 1,783,271 1,679,797 31.1 Salaries, wages and other benefits include provident fund contributions of Rupees 41.599
million (2016: Rupees 40.109 million), Rupees 0.343 million (2016: Rupee 1.040 million) in respect of provision for compensated absences and Rupees 2.137 million (2016: Rupees 2.032 million) in respect of retirement benefit - gratuity.
Notes to the Consolidated Financial Statements For the year ended June 30, 2017
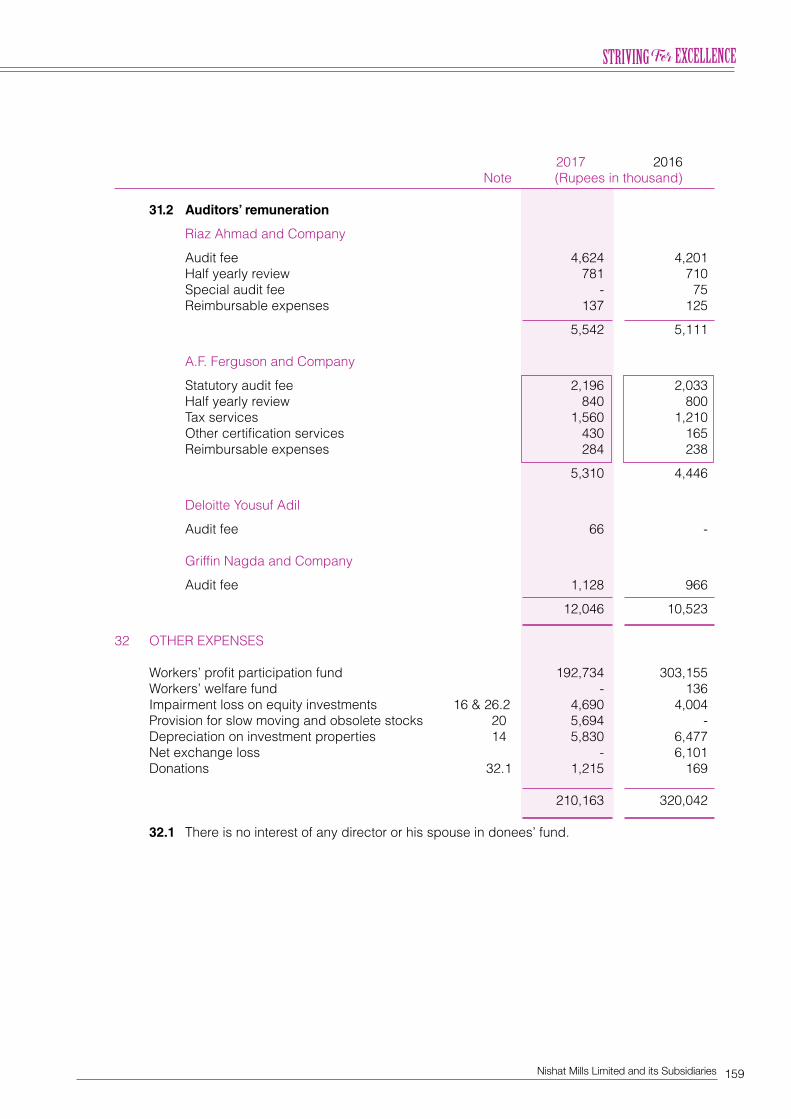
159Nishat Mills Limited and its Subsidiaries
2017 2016 Note (Rupees in thousand)
31.2 Auditors’ remuneration Riaz Ahmad and Company Audit fee 4,624 4,201 Half yearly review 781 710 Special audit fee - 75 Reimbursable expenses 137 125 5,542 5,111 A.F. Ferguson and Company Statutory audit fee 2,196 2,033 Half yearly review 840 800 Tax services 1,560 1,210 Other certification services 430 165 Reimbursable expenses 284 238 5,310 4,446 Deloitte Yousuf Adil Audit fee 66 - Griffin Nagda and Company Audit fee 1,128 966 12,046 10,523 32 OTHER EXPENSES Workers’ profit participation fund 192,734 303,155 Workers’ welfare fund - 136 Impairment loss on equity investments 16 & 26.2 4,690 4,004 Provision for slow moving and obsolete stocks 20 5,694 - Depreciation on investment properties 14 5,830 6,477 Net exchange loss - 6,101 Donations 32.1 1,215 169
210,163 320,042 32.1 There is no interest of any director or his spouse in donees’ fund.
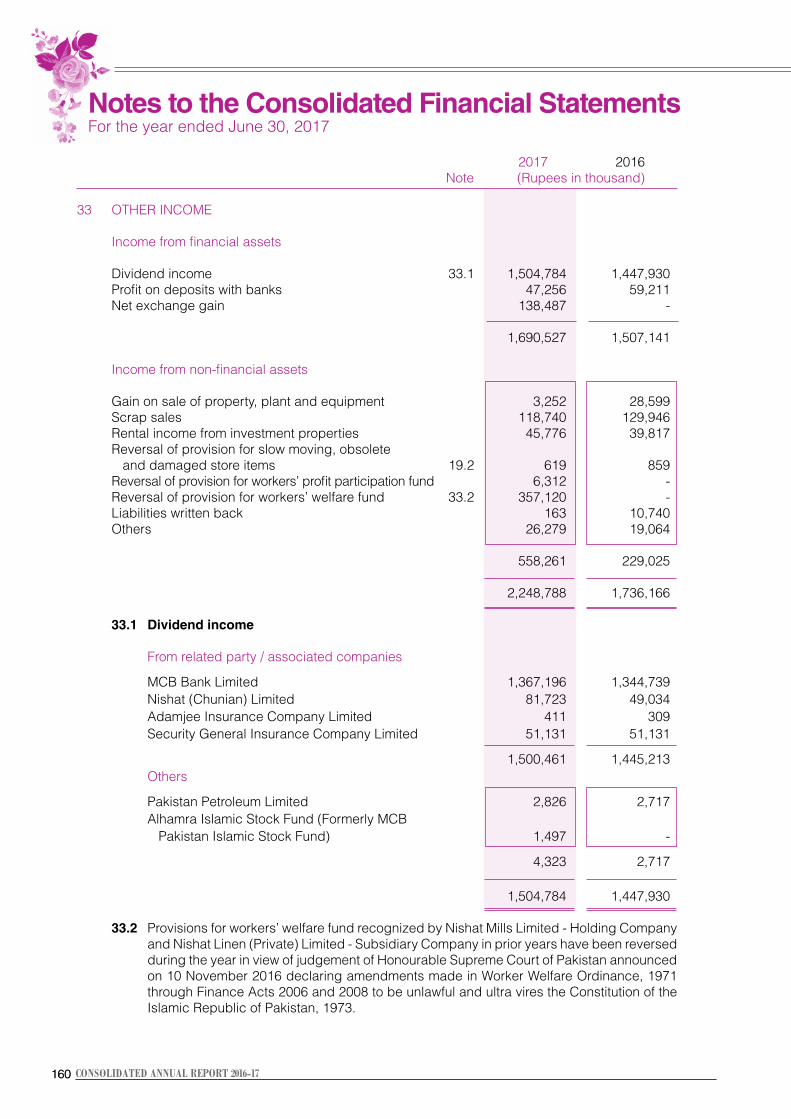
160160 CONSOLIDATED ANNUAL REPORT 2016-17
2017 2016 Note (Rupees in thousand)
33 OTHER INCOME Income from financial assets Dividend income 33.1 1,504,784 1,447,930 Profit on deposits with banks 47,256 59,211 Net exchange gain 138,487 - 1,690,527 1,507,141 Income from non-financial assets Gain on sale of property, plant and equipment 3,252 28,599 Scrap sales 118,740 129,946 Rental income from investment properties 45,776 39,817 Reversal of provision for slow moving, obsolete and damaged store items 19.2 619 859 Reversal of provision for workers’ profit participation fund 6,312 - Reversal of provision for workers’ welfare fund 33.2 357,120 - Liabilities written back 163 10,740 Others 26,279 19,064
558,261 229,025
2,248,788 1,736,166 33.1 Dividend income From related party / associated companies MCB Bank Limited 1,367,196 1,344,739 Nishat (Chunian) Limited 81,723 49,034 Adamjee Insurance Company Limited 411 309 Security General Insurance Company Limited 51,131 51,131 1,500,461 1,445,213 Others Pakistan Petroleum Limited 2,826 2,717 Alhamra Islamic Stock Fund (Formerly MCB Pakistan Islamic Stock Fund) 1,497 - 4,323 2,717
1,504,784 1,447,930 33.2 Provisions for workers’ welfare fund recognized by Nishat Mills Limited - Holding Company
and Nishat Linen (Private) Limited - Subsidiary Company in prior years have been reversed during the year in view of judgement of Honourable Supreme Court of Pakistan announced on 10 November 2016 declaring amendments made in Worker Welfare Ordinance, 1971 through Finance Acts 2006 and 2008 to be unlawful and ultra vires the Constitution of the Islamic Republic of Pakistan, 1973.
Notes to the Consolidated Financial Statements For the year ended June 30, 2017
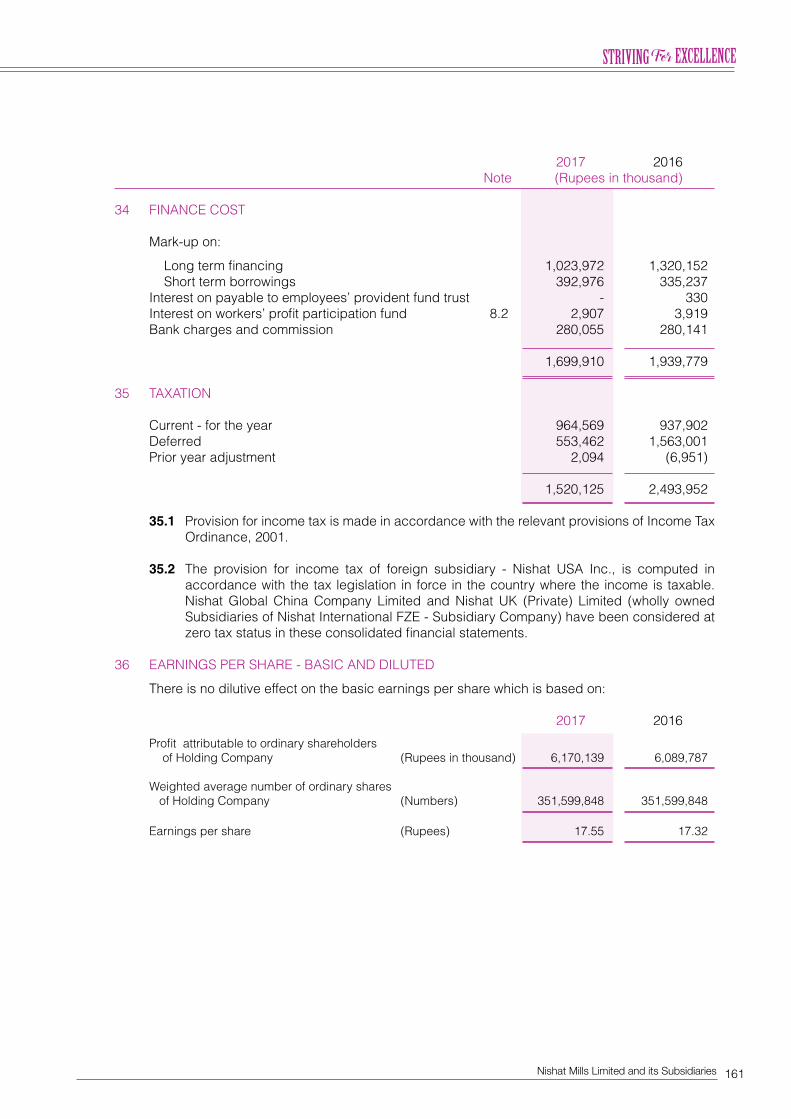
161Nishat Mills Limited and its Subsidiaries
2017 2016 Note (Rupees in thousand)
34 FINANCE COST Mark-up on: Long term financing 1,023,972 1,320,152 Short term borrowings 392,976 335,237 Interest on payable to employees’ provident fund trust - 330 Interest on workers’ profit participation fund 8.2 2,907 3,919 Bank charges and commission 280,055 280,141
1,699,910 1,939,779 35 TAXATION Current - for the year 964,569 937,902 Deferred 553,462 1,563,001 Prior year adjustment 2,094 (6,951)
1,520,125 2,493,952 35.1 Provision for income tax is made in accordance with the relevant provisions of Income Tax
Ordinance, 2001. 35.2 The provision for income tax of foreign subsidiary - Nishat USA Inc., is computed in
accordance with the tax legislation in force in the country where the income is taxable. Nishat Global China Company Limited and Nishat UK (Private) Limited (wholly owned Subsidiaries of Nishat International FZE - Subsidiary Company) have been considered at zero tax status in these consolidated financial statements.
36 EARNINGS PER SHARE - BASIC AND DILUTED There is no dilutive effect on the basic earnings per share which is based on:
2017 2016 Profit attributable to ordinary shareholders of Holding Company (Rupees in thousand) 6,170,139 6,089,787 Weighted average number of ordinary shares of Holding Company (Numbers) 351,599,848 351,599,848 Earnings per share (Rupees) 17.55 17.32
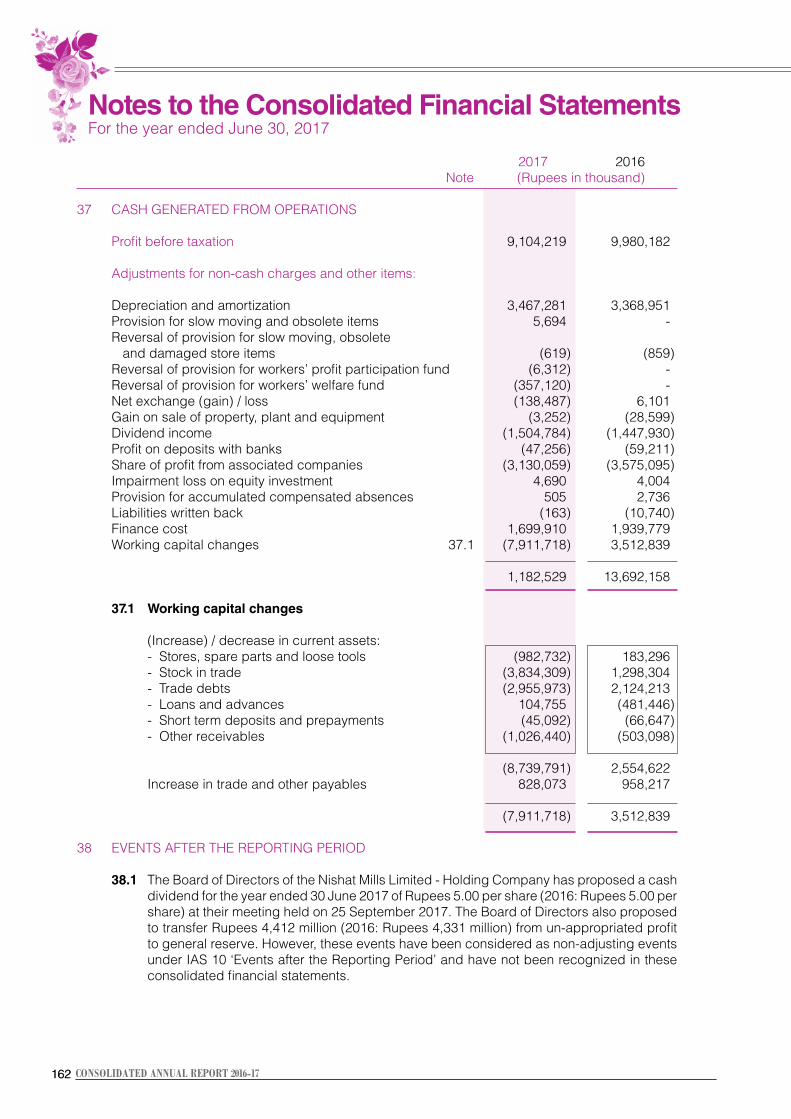
162162 CONSOLIDATED ANNUAL REPORT 2016-17
2017 2016 Note (Rupees in thousand)
37 CASH GENERATED FROM OPERATIONS Profit before taxation 9,104,219 9,980,182 Adjustments for non-cash charges and other items: Depreciation and amortization 3,467,281 3,368,951 Provision for slow moving and obsolete items 5,694 - Reversal of provision for slow moving, obsolete and damaged store items (619) (859) Reversal of provision for workers’ profit participation fund (6,312) - Reversal of provision for workers’ welfare fund (357,120) - Net exchange (gain) / loss (138,487) 6,101 Gain on sale of property, plant and equipment (3,252) (28,599) Dividend income (1,504,784) (1,447,930) Profit on deposits with banks (47,256) (59,211) Share of profit from associated companies (3,130,059) (3,575,095) Impairment loss on equity investment 4,690 4,004 Provision for accumulated compensated absences 505 2,736 Liabilities written back (163) (10,740) Finance cost 1,699,910 1,939,779 Working capital changes 37.1 (7,911,718) 3,512,839 1,182,529 13,692,158 37.1 Working capital changes
(Increase) / decrease in current assets: - Stores, spare parts and loose tools (982,732) 183,296 - Stock in trade (3,834,309) 1,298,304 - Trade debts (2,955,973) 2,124,213 - Loans and advances 104,755 (481,446) - Short term deposits and prepayments (45,092) (66,647) - Other receivables (1,026,440) (503,098)
(8,739,791) 2,554,622 Increase in trade and other payables 828,073 958,217
(7,911,718) 3,512,839 38 EVENTS AFTER THE REPORTING PERIOD
38.1 The Board of Directors of the Nishat Mills Limited - Holding Company has proposed a cash dividend for the year ended 30 June 2017 of Rupees 5.00 per share (2016: Rupees 5.00 per share) at their meeting held on 25 September 2017. The Board of Directors also proposed to transfer Rupees 4,412 million (2016: Rupees 4,331 million) from un-appropriated profit to general reserve. However, these events have been considered as non-adjusting events under IAS 10 ‘Events after the Reporting Period’ and have not been recognized in these consolidated financial statements.
Notes to the Consolidated Financial Statements For the year ended June 30, 2017
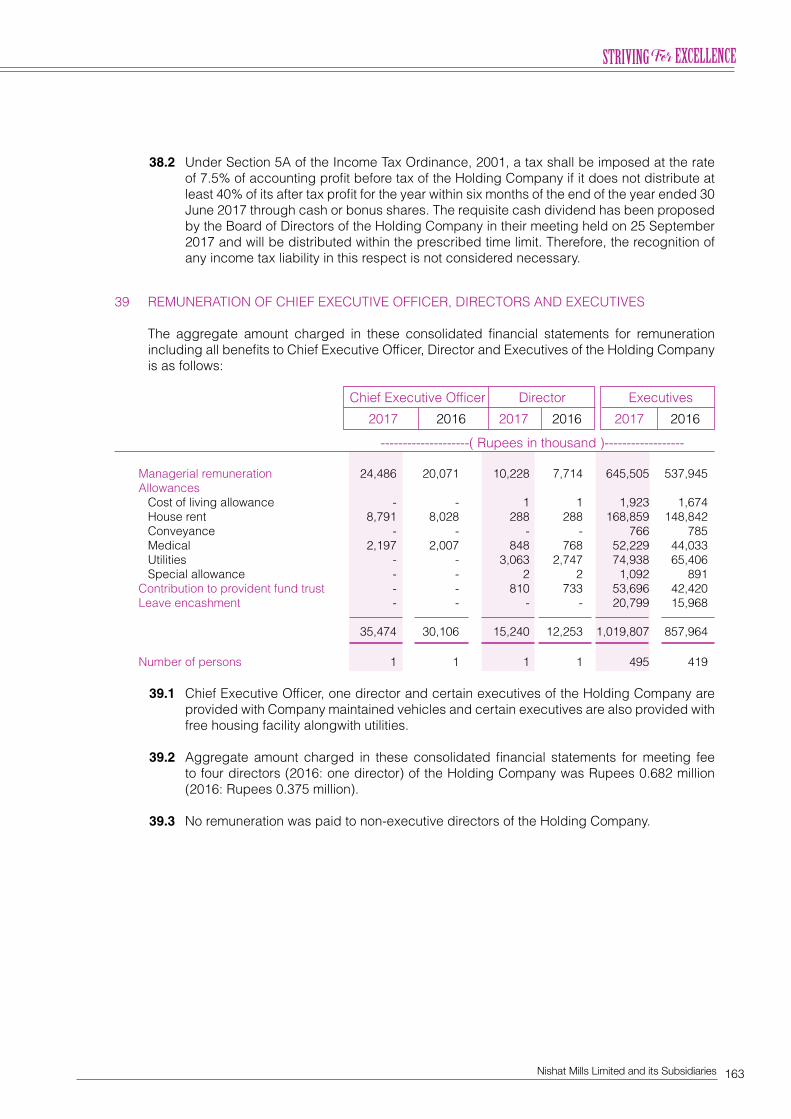
163Nishat Mills Limited and its Subsidiaries
38.2 Under Section 5A of the Income Tax Ordinance, 2001, a tax shall be imposed at the rate of 7.5% of accounting profit before tax of the Holding Company if it does not distribute at least 40% of its after tax profit for the year within six months of the end of the year ended 30 June 2017 through cash or bonus shares. The requisite cash dividend has been proposed by the Board of Directors of the Holding Company in their meeting held on 25 September 2017 and will be distributed within the prescribed time limit. Therefore, the recognition of any income tax liability in this respect is not considered necessary.
39 REMUNERATION OF CHIEF EXECUTIVE OFFICER, DIRECTORS AND EXECUTIVES
The aggregate amount charged in these consolidated financial statements for remuneration including all benefits to Chief Executive Officer, Director and Executives of the Holding Company is as follows:
Chief Executive Officer Director Executives
2017 2016 2017 2016 2017 2016 --------------------( Rupees in thousand )------------------
Managerial remuneration 24,486 20,071 10,228 7,714 645,505 537,945 Allowances Cost of living allowance - - 1 1 1,923 1,674 House rent 8,791 8,028 288 288 168,859 148,842 Conveyance - - - - 766 785 Medical 2,197 2,007 848 768 52,229 44,033 Utilities - - 3,063 2,747 74,938 65,406 Special allowance - - 2 2 1,092 891 Contribution to provident fund trust - - 810 733 53,696 42,420 Leave encashment - - - - 20,799 15,968 35,474 30,106 15,240 12,253 1,019,807 857,964 Number of persons 1 1 1 1 495 419
39.1 Chief Executive Officer, one director and certain executives of the Holding Company are provided with Company maintained vehicles and certain executives are also provided with free housing facility alongwith utilities.
39.2 Aggregate amount charged in these consolidated financial statements for meeting fee
to four directors (2016: one director) of the Holding Company was Rupees 0.682 million (2016: Rupees 0.375 million).
39.3 No remuneration was paid to non-executive directors of the Holding Company.
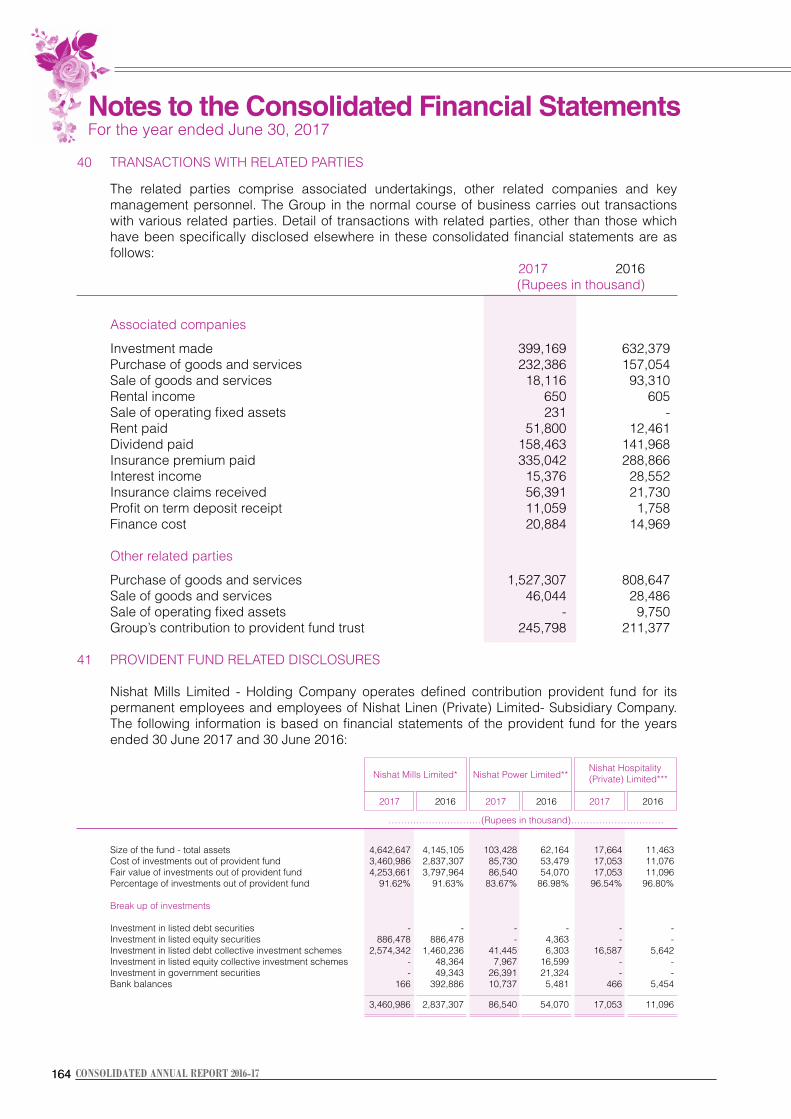
164164 CONSOLIDATED ANNUAL REPORT 2016-17
40 TRANSACTIONS WITH RELATED PARTIES The related parties comprise associated undertakings, other related companies and key
management personnel. The Group in the normal course of business carries out transactions with various related parties. Detail of transactions with related parties, other than those which have been specifically disclosed elsewhere in these consolidated financial statements are as follows:
2017 2016 (Rupees in thousand)
Associated companies Investment made 399,169 632,379 Purchase of goods and services 232,386 157,054 Sale of goods and services 18,116 93,310 Rental income 650 605 Sale of operating fixed assets 231 - Rent paid 51,800 12,461 Dividend paid 158,463 141,968 Insurance premium paid 335,042 288,866 Interest income 15,376 28,552 Insurance claims received 56,391 21,730 Profit on term deposit receipt 11,059 1,758 Finance cost 20,884 14,969 Other related parties Purchase of goods and services 1,527,307 808,647 Sale of goods and services 46,044 28,486 Sale of operating fixed assets - 9,750 Group’s contribution to provident fund trust 245,798 211,377
41 PROVIDENT FUND RELATED DISCLOSURES
Nishat Mills Limited - Holding Company operates defined contribution provident fund for its permanent employees and employees of Nishat Linen (Private) Limited- Subsidiary Company. The following information is based on financial statements of the provident fund for the years ended 30 June 2017 and 30 June 2016:
Nishat Mills Limited* Nishat Power Limited**
Nishat Hospitality (Private) Limited***
2017 2016 2017 2016 2017 2016
…………………………(Rupees in thousand)…………………………
Size of the fund - total assets 4,642,647 4,145,105 103,428 62,164 17,664 11,463
Cost of investments out of provident fund 3,460,986 2,837,307 85,730 53,479 17,053 11,076 Fair value of investments out of provident fund 4,253,661 3,797,964 86,540 54,070 17,053 11,096 Percentage of investments out of provident fund 91.62% 91.63% 83.67% 86.98% 96.54% 96.80% Break up of investments Investment in listed debt securities - - - - - - Investment in listed equity securities 886,478 886,478 - 4,363 - - Investment in listed debt collective investment schemes 2,574,342 1,460,236 41,445 6,303 16,587 5,642 Investment in listed equity collective investment schemes - 48,364 7,967 16,599 - - Investment in government securities - 49,343 26,391 21,324 - - Bank balances 166 392,886 10,737 5,481 466 5,454 3,460,986 2,837,307 86,540 54,070 17,053 11,096
Notes to the Consolidated Financial Statements For the year ended June 30, 2017
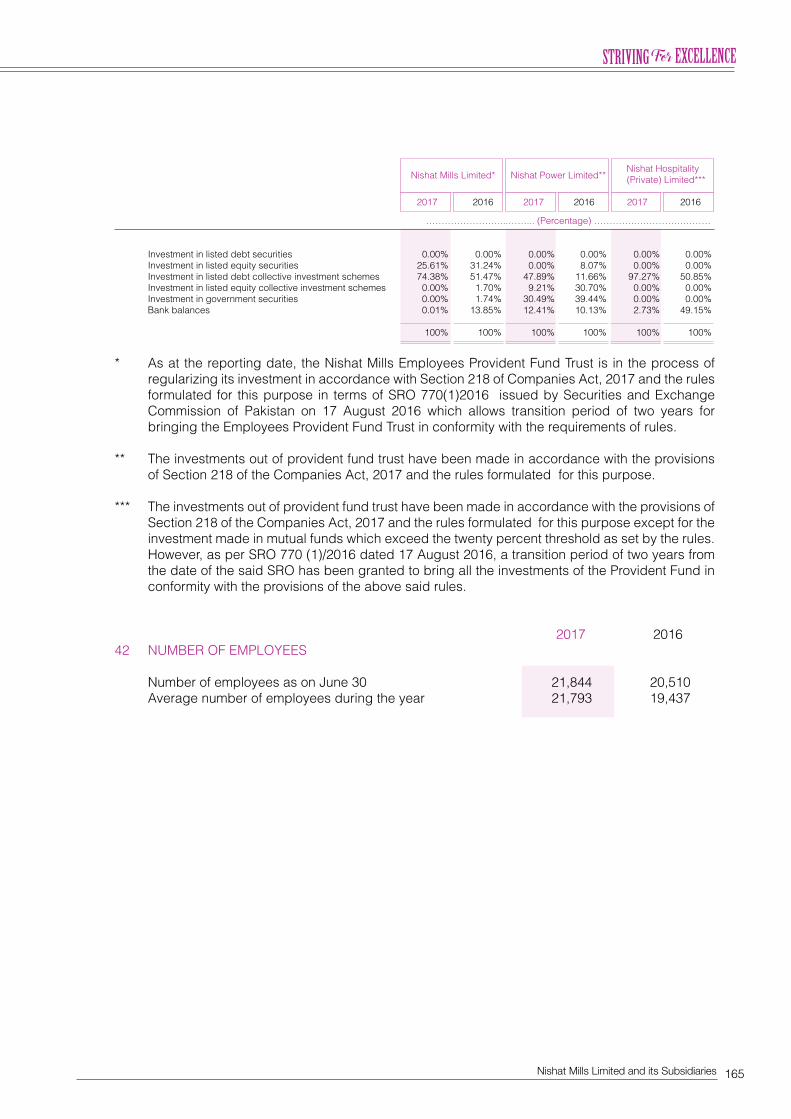
165Nishat Mills Limited and its Subsidiaries
Nishat Mills Limited* Nishat Power Limited**
Nishat Hospitality (Private) Limited***
2017 2016 2017 2016 2017 2016
……………………...……... (Percentage) ………….…………….……… Investment in listed debt securities 0.00% 0.00% 0.00% 0.00% 0.00% 0.00% Investment in listed equity securities 25.61% 31.24% 0.00% 8.07% 0.00% 0.00% Investment in listed debt collective investment schemes 74.38% 51.47% 47.89% 11.66% 97.27% 50.85% Investment in listed equity collective investment schemes 0.00% 1.70% 9.21% 30.70% 0.00% 0.00% Investment in government securities 0.00% 1.74% 30.49% 39.44% 0.00% 0.00% Bank balances 0.01% 13.85% 12.41% 10.13% 2.73% 49.15%
100% 100% 100% 100% 100% 100%
* As at the reporting date, the Nishat Mills Employees Provident Fund Trust is in the process of
regularizing its investment in accordance with Section 218 of Companies Act, 2017 and the rules formulated for this purpose in terms of SRO 770(1)2016 issued by Securities and Exchange Commission of Pakistan on 17 August 2016 which allows transition period of two years for bringing the Employees Provident Fund Trust in conformity with the requirements of rules.
** The investments out of provident fund trust have been made in accordance with the provisions of Section 218 of the Companies Act, 2017 and the rules formulated for this purpose.
*** The investments out of provident fund trust have been made in accordance with the provisions of Section 218 of the Companies Act, 2017 and the rules formulated for this purpose except for the investment made in mutual funds which exceed the twenty percent threshold as set by the rules. However, as per SRO 770 (1)/2016 dated 17 August 2016, a transition period of two years from the date of the said SRO has been granted to bring all the investments of the Provident Fund in conformity with the provisions of the above said rules.
2017 201642 NUMBER OF EMPLOYEES Number of employees as on June 30 21,844 20,510 Average number of employees during the year 21,793 19,437
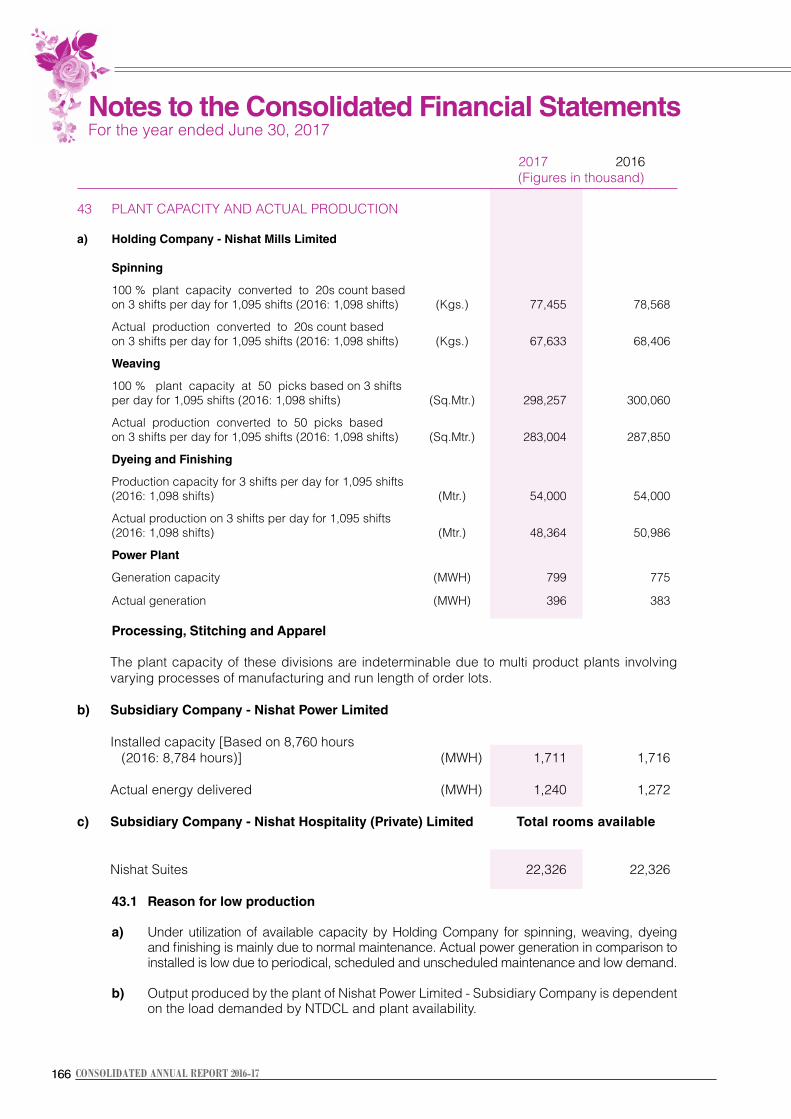
166166 CONSOLIDATED ANNUAL REPORT 2016-17
2017 2016 (Figures in thousand) 43 PLANT CAPACITY AND ACTUAL PRODUCTION a) Holding Company - Nishat Mills Limited
Spinning 100 % plant capacity converted to 20s count based on 3 shifts per day for 1,095 shifts (2016: 1,098 shifts) (Kgs.) 77,455 78,568 Actual production converted to 20s count based on 3 shifts per day for 1,095 shifts (2016: 1,098 shifts) (Kgs.) 67,633 68,406 Weaving 100 % plant capacity at 50 picks based on 3 shifts per day for 1,095 shifts (2016: 1,098 shifts) (Sq.Mtr.) 298,257 300,060 Actual production converted to 50 picks based on 3 shifts per day for 1,095 shifts (2016: 1,098 shifts) (Sq.Mtr.) 283,004 287,850 Dyeing and Finishing Production capacity for 3 shifts per day for 1,095 shifts (2016: 1,098 shifts) (Mtr.) 54,000 54,000 Actual production on 3 shifts per day for 1,095 shifts (2016: 1,098 shifts) (Mtr.) 48,364 50,986 Power Plant Generation capacity (MWH) 799 775 Actual generation (MWH) 396 383 Processing, Stitching and Apparel The plant capacity of these divisions are indeterminable due to multi product plants involving
varying processes of manufacturing and run length of order lots.
b) Subsidiary Company - Nishat Power Limited Installed capacity [Based on 8,760 hours (2016: 8,784 hours)] (MWH) 1,711 1,716 Actual energy delivered (MWH) 1,240 1,272 c) Subsidiary Company - Nishat Hospitality (Private) Limited Total rooms available
Nishat Suites 22,326 22,326
43.1 Reason for low production a) Under utilization of available capacity by Holding Company for spinning, weaving, dyeing
and finishing is mainly due to normal maintenance. Actual power generation in comparison to installed is low due to periodical, scheduled and unscheduled maintenance and low demand.
b) Output produced by the plant of Nishat Power Limited - Subsidiary Company is dependent
on the load demanded by NTDCL and plant availability.
Notes to the Consolidated Financial Statements For the year ended June 30, 2017
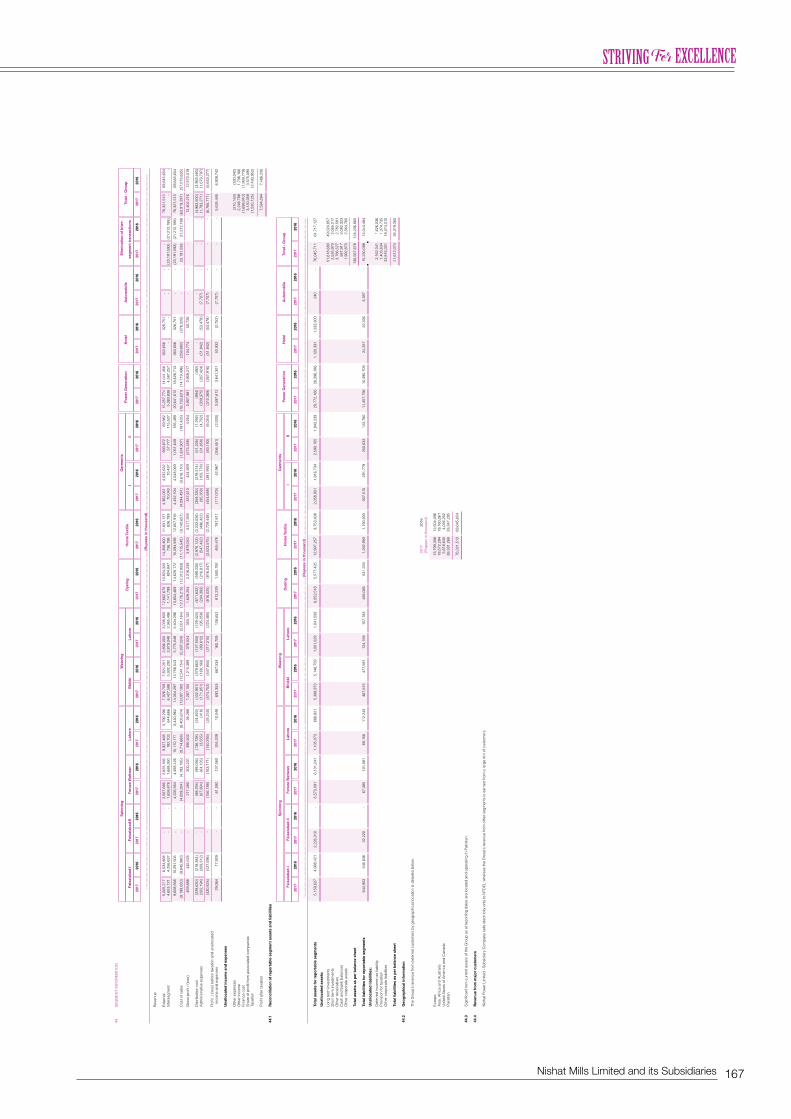
167Nishat Mills Limited and its Subsidiaries
44.
SEG
MEN
T IN
FOR
MAT
ION
Sp
inn
ing
W
eavi
ng
Gar
men
ts
E
limin
atio
n o
f In
ter-
F
aisa
lab
ad-I
Fais
alab
ad-I
I
Fer
oze
Wat
twan
L
aho
re
Bh
ikki
Lah
ore
D
yein
g
H
om
e Te
xtile
I
II
Po
wer
Gen
erat
ion
H
ote
l
Au
tom
ob
ile
seg
men
t tr
ansa
ctio
ns
Tota
l - G
rou
p
201
7
201
6
201
7
201
6
201
7
201
6
201
7
201
6
201
7
201
6
201
7
201
6
201
7
201
6
201
7
201
6
201
7
201
6
201
7
201
6
201
7
201
6
201
7
201
6
201
7
201
6
201
7
201
6
201
7
201
6
……
……
……
……
……
……
……
……
…...
......
......
......
......
......
......
......
......
..….…
……
……
……
…...
......
......
......
......
......
.....…
……
……
……
…...
......
......
......
......
......
.....…
…...
……
……
……
……
……
……
……
……
…..
(Ru
pee
s in
th
ou
san
d)
……
……
……
……
……
……
……
……
…...
......
......
......
......
......
......
......
......
..….…
……
……
……
…...
......
......
......
......
......
.....…
……
……
……
…...
......
......
......
......
......
.....…
…...
……
……
……
……
……
……
……
……
…..
Rev
enue
Exte
rnal
5
,005
,217
6
,034
,868
-
-
2
,567
,686
2
,825
,166
9
,927
,468
5
,796
,296
7
,926
,709
7
,824
,251
2
,896
,000
3
,038
,800
1
2,66
2,67
0
13,
824,
325
1
4,35
8,40
0
11,
831,
127
4
,362
,061
4
,032
,632
9
93,8
72
69,
982
1
5,25
7,77
4
14,
041,
456
3
63,6
56
326
,751
-
-
-
-
7
6,32
1,51
3
69,
645,
654
In
ters
egm
ent
4,6
53,7
21
4,2
56,6
37
-
-
1,6
58,8
78
1,6
68,2
60
182
,703
6
44,6
66
6,4
27,5
88
5,9
32,2
92
2,8
79,0
48
2,3
65,4
96
1,1
41,7
99
804
,847
7
36,1
98
826
,789
7
0,04
3
10,
437
5
7,77
7
115
,507
5
,383
,838
4
,587
,257
-
-
-
-
(2
3,19
1,59
3)
(21,
212,
188)
-
-
9,6
58,9
38
10,
291,
505
-
-
4
,226
,564
4
,493
,426
1
0,11
0,17
1
6,4
40,9
62
14,
354,
297
1
3,75
6,54
3
5,7
75,0
48
5,4
04,2
96
13,
804,
469
1
4,62
9,17
2
15,
094,
598
1
2,65
7,91
6
4,4
32,1
04
4,0
43,0
69
1,0
51,6
49
185
,489
2
0,64
1,61
2
18,
628,
713
3
63,6
56
326
,751
-
-
(2
3,19
1,59
3)
(21,
212,
188)
7
6,32
1,51
3
69,
645,
654
C
ost o
f sal
es
(9,1
99,0
50)
(9,8
45,9
80)
-
-
(4,0
09,2
84)
(4,1
93,1
95)
(9,7
14,6
69)
(6,4
05,6
74)
(13,
087,
192)
(1
2,54
1,15
4)
(5,3
97,0
24)
(5,0
51,1
64)
(12,
176,
215)
(1
2,31
2,93
3)
(11,
115,
545)
(9
,140
,657
) (4
,094
,491
) (3
,618
,110
) (1
,324
,907
) (1
81,4
35)
(16,
733,
631)
(1
4,71
9,49
6)
(258
,882
) (2
76,0
25)
-
-
23,
191,
593
2
1,21
2,18
8 (
63,9
19,2
97)
(57,
073,
635)
G
ross
pro
fit /
(loss
) 4
59,8
88
445
,525
-
-
2
17,2
80
300
,231
3
95,5
02
35,
288
1
,267
,105
1
,215
,389
3
78,0
24
353
,132
1
,628
,254
2
,316
,239
3
,979
,053
3
,517
,259
3
37,6
13
424
,959
(2
73,2
58)
4,0
54
3,9
07,9
81
3,9
09,2
17
104
,774
5
0,72
6
-
-
-
-
12,
402,
216
1
2,57
2,01
9
D
istri
butio
n co
st
(228
,630
) (2
18,2
84)
-
-
(88,
294)
(9
9,03
6)
(136
,738
) (2
4,82
2)
(402
,901
) (3
79,6
62)
(127
,503
) (1
29,4
22)
(611
,632
) (5
99,2
30)
(2,9
76,1
43)
(2,2
33,0
26)
(359
,330
) (2
78,2
14)
(51,
335)
(1
,292
) (9
94)
(492
) -
-
-
-
-
-
(4
,983
,500
) (3
,963
,480
)
Adm
inis
trativ
e ex
pens
es
(202
,194
) (2
09,3
12)
-
-
(67,
894)
(6
4,13
5)
(3,5
55)
(418
) (1
71,8
51)
(168
,193
) (8
9,81
2)
(95,
058)
(2
04,3
93)
(216
,817
) (5
47,4
32)
(496
,422
) (9
5,35
8)
(103
,778
) (3
1,85
8)
(4,7
62)
(309
,375
) (2
67,4
24)
(51,
842)
(5
3,47
8)
(7,7
07)
-
-
-
(1,7
83,2
71)
(1,6
79,7
97)
(430
,824
) (4
27,5
96)
-
-
(156
,188
) (1
63,1
71)
(140
,293
) (2
5,24
0)
(574
,752
) (5
47,8
55)
(217
,315
) (2
24,4
80)
(816
,025
) (8
16,0
47)
(3,5
23,5
75)
(2,7
29,4
48)
(454
,688
) (3
81,9
92)
(83,
193)
(6
,054
) (3
10,3
69)
(267
,916
) (5
1,84
2)
(53,
478)
(7
,707
) -
-
-
(6
,766
,771
) (5
,643
,277
)
Profi
t / (
loss
) bef
ore
taxa
tion
and
unal
loca
ted
inco
me
and
expe
nses
2
9,06
4
17,
929
-
-
6
1,09
2
137
,060
2
55,2
09
10,
048
6
92,3
53
667
,534
1
60,7
09
128
,652
8
12,2
29
1,5
00,1
92
455
,478
7
87,8
11
(117
,075
) 4
2,96
7
(356
,451
) (2
,000
) 3
,597
,612
3
,641
,301
5
2,93
2
(2,7
52)
(7,7
07)
-
-
-
5,6
35,4
45
6,9
28,7
42
Un
allo
cate
d in
com
e an
d e
xpen
ses
O
ther
exp
ense
s
(2
10,1
63)
(320
,042
)
Oth
er in
com
e
2
,248
,788
1
,736
,166
Fina
nce
cost
(1
,699
,910
) (1
,939
,779
)
Shar
e of
pro
fit fr
om a
ssoc
iate
d co
mpa
nies
3
,130
,059
3
,575
,095
Taxa
tion
(1,5
20,1
25)
(2,4
93,9
52)
Pr
ofit a
fter t
axat
ion
7,5
84,0
94
7,4
86,2
30
44
.1
Rec
on
cilia
tio
n o
f re
po
rtab
le s
egm
ent
asse
ts a
nd
liab
iliti
es
Sp
inn
ing
W
eavi
ng
Gar
men
ts
F
aisa
lab
ad-I
Fais
alab
ad-I
I
Fer
oze
Wat
twan
L
aho
re
Bh
ikki
Lah
ore
D
yein
g
H
om
e Te
xtile
I
II
Po
wer
Gen
erat
ion
H
ote
l
Au
tom
ob
ile
T
ota
l - G
rou
p
201
7
201
6
201
7
201
6
201
7
201
6
201
7
201
6
201
7
201
6
201
7
201
6
201
7
201
6
201
7
201
6
201
7
201
6
201
7
201
6
201
7
201
6
201
7
201
6
201
7
201
6
201
7
201
6
……
……
……
……
……
……
……
……
…...
......
......
......
......
......
......
......
......
......
......
......
.....…
.……
……
……
……
......
......
......
......
......
......
..……
……
……
……
......
......
......
......
......
......
..……
...…
……
……
……
(R
up
ees
in t
ho
usa
nd
) …
……
……
……
……
……
……
……
……
......
......
......
......
......
......
......
......
......
......
......
......
..….…
……
……
……
…...
......
......
......
......
......
.....…
……
……
……
…...
......
......
......
......
......
.....…
…...
……
……
……
…
To
tal a
sset
s fo
r re
po
rtab
le s
egm
ents
5
,159
,627
4
,988
,421
2
,226
,310
-
6
,573
,091
6
,131
,241
1
,105
,073
6
86,8
21
5,3
88,9
73
5,1
48,7
59
1,0
01,0
29
1,0
41,5
93
6,0
52,5
18
5,5
77,4
25
12,
997,
257
9
,753
,408
2
,058
,931
1
,816
,734
2
,590
,105
1
,943
,239
2
9,77
2,16
6
26,
396,
186
1
,120
,391
1
,233
,300
2
40
-
76,
045,
711
6
4,71
7,12
7
U
nal
loca
ted
ass
ets:
Lo
ng te
rm in
vest
men
ts
51,
618,
680
4
9,02
4,85
7
Shor
t ter
m in
vest
men
ts
2,53
5,97
3
2,0
65,2
17
Oth
er re
ceiv
able
s
3
,786
,527
2
,782
,581
C
ash
and
bank
bal
ance
s
5
87,9
17
3,0
82,3
23
Oth
er c
orpo
rate
ass
ets
1,9
92,8
70
2,5
64,7
60
To
tal a
sset
s as
per
bal
ance
sh
eet
136
,567
,678
1
24,2
36,8
65
To
tal l
iab
iliti
es fo
r re
po
rtab
le s
egm
ents
6
44,9
03
545
,636
3
2,22
0
-
67,
385
1
01,0
81
89,
156
1
12,2
43
467
,615
4
77,5
81
124
,158
1
57,1
83
468
,085
5
31,2
33
1,2
92,9
93
1,1
90,9
33
307
,510
2
91,7
79
250
,633
1
23,7
80
11,
457,
796
1
0,49
0,70
9
24,
257
2
2,32
6
3,3
87
-
15,
230,
098
1
4,04
4,48
4
U
nal
loca
ted
liab
iliti
es:
D
efer
red
inco
me
tax
liabi
lity
2,1
62,3
41
1,6
26,0
36
Prov
isio
n fo
r tax
atio
n
1
,403
,634
1
,374
,735
O
ther
cor
pora
te li
abili
ties
22,
816,
001
1
8,27
4,01
0
To
tal l
iab
iliti
es a
s p
er b
alan
ce s
hee
t
4
1,61
2,07
4
35,
319,
265
44
.2
Geo
gra
ph
ical
info
rmat
ion
The
Gro
up’s
reve
nue
from
ext
erna
l cus
tom
ers
by g
eogr
aphi
cal l
ocat
ion
is d
etai
led
belo
w:
20
17
2016
(Rup
ees
in th
ousa
nd)
Euro
pe
13,
799,
308
1
2,50
4,09
6
Asi
a, A
frica
and
Aus
tralia
1
8,57
2,29
4
19,
760,
061
U
nite
d St
ates
of A
mer
ica
and
Can
ada
5,6
18,6
45
4,0
34,2
02
Paki
stan
3
8,33
1,26
6
33,
347,
295
7
6,32
1,51
3
69,
645,
654
44
.3
Sign
ifica
nt n
on-c
urre
nt a
sset
s of
the
Gro
up a
s at
repo
rtin
g da
tes
are
loca
ted
and
oper
atin
g in
Pak
ista
n.
44
.4
Rev
enu
e fr
om
maj
or
cust
om
ers
N
isha
t Pow
er L
imite
d - S
ubsi
diar
y C
ompa
ny s
ells
ele
ctric
ity o
nly
to N
TDC
L w
here
as th
e G
roup
’s re
venu
e fro
m o
ther
seg
men
ts is
ear
ned
from
a la
rge
mix
of c
usto
mer
s.
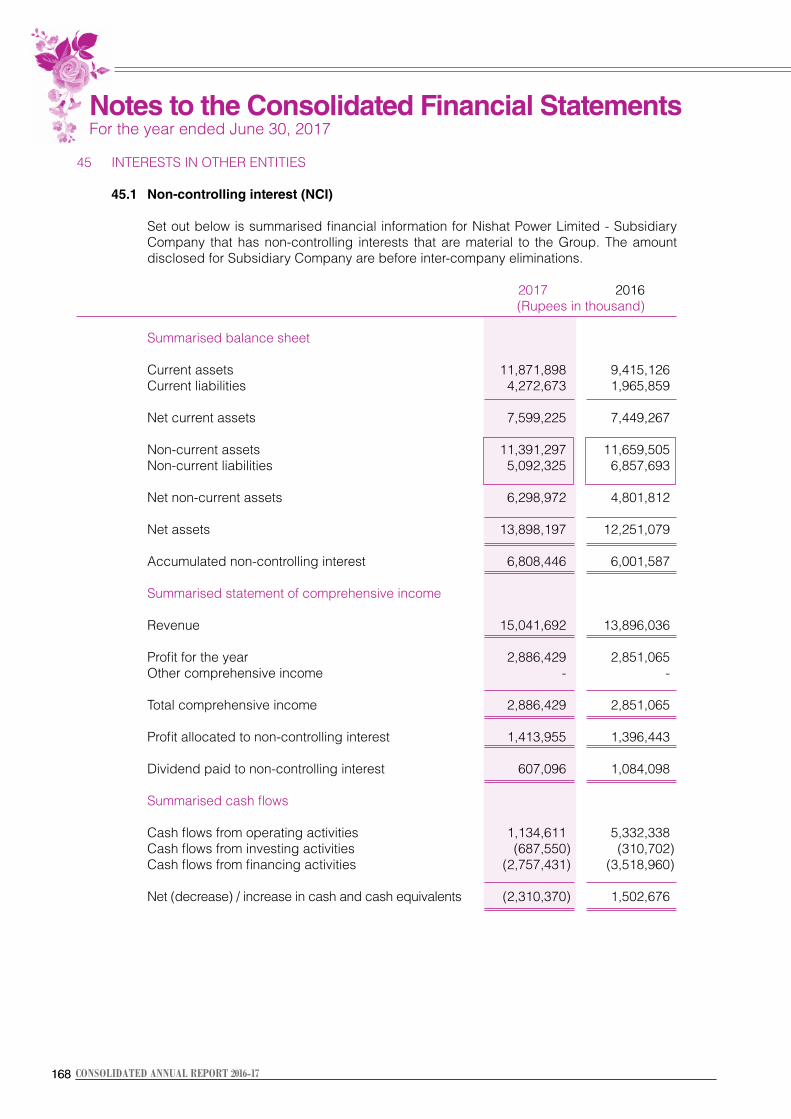
168168 CONSOLIDATED ANNUAL REPORT 2016-17
45 INTERESTS IN OTHER ENTITIES 45.1 Non-controlling interest (NCI) Set out below is summarised financial information for Nishat Power Limited - Subsidiary
Company that has non-controlling interests that are material to the Group. The amount disclosed for Subsidiary Company are before inter-company eliminations.
2017 2016 (Rupees in thousand) Summarised balance sheet Current assets 11,871,898 9,415,126 Current liabilities 4,272,673 1,965,859 Net current assets 7,599,225 7,449,267 Non-current assets 11,391,297 11,659,505 Non-current liabilities 5,092,325 6,857,693
Net non-current assets 6,298,972 4,801,812 Net assets 13,898,197 12,251,079 Accumulated non-controlling interest 6,808,446 6,001,587 Summarised statement of comprehensive income Revenue 15,041,692 13,896,036 Profit for the year 2,886,429 2,851,065 Other comprehensive income - -
Total comprehensive income 2,886,429 2,851,065 Profit allocated to non-controlling interest 1,413,955 1,396,443 Dividend paid to non-controlling interest 607,096 1,084,098 Summarised cash flows Cash flows from operating activities 1,134,611 5,332,338 Cash flows from investing activities (687,550) (310,702) Cash flows from financing activities (2,757,431) (3,518,960) Net (decrease) / increase in cash and cash equivalents (2,310,370) 1,502,676
Notes to the Consolidated Financial Statements For the year ended June 30, 2017
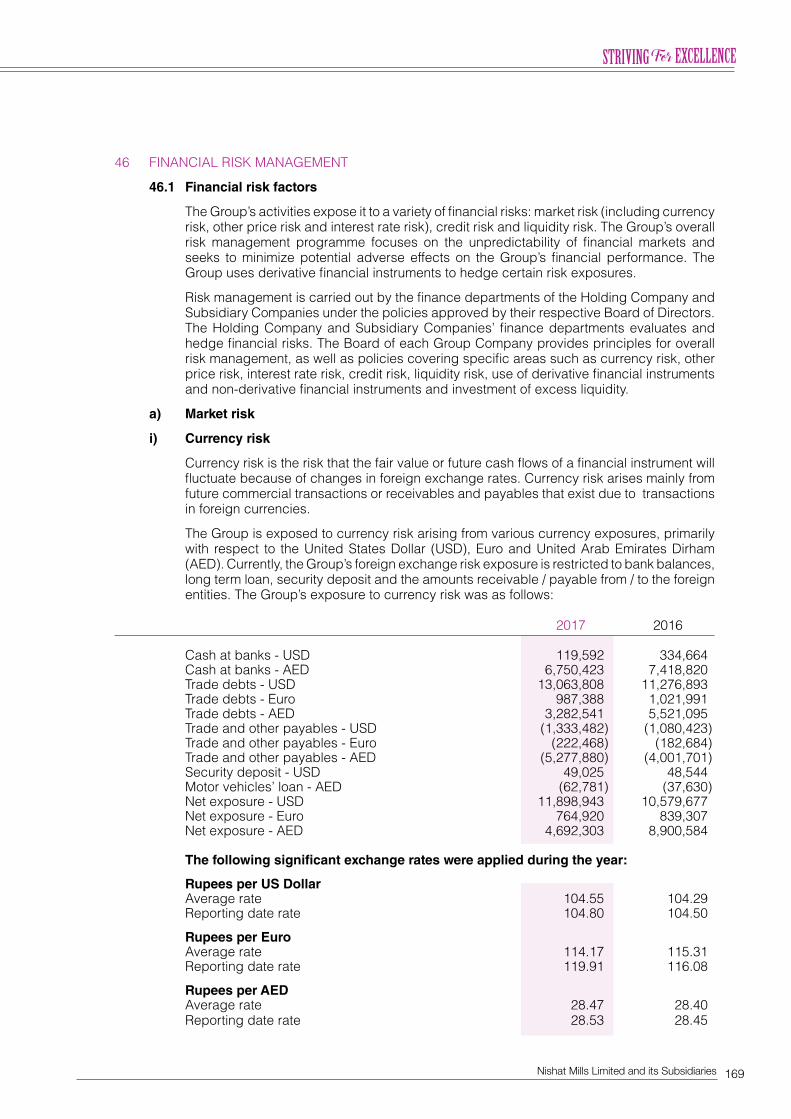
169Nishat Mills Limited and its Subsidiaries
46 FINANCIAL RISK MANAGEMENT
46.1 Financial risk factors The Group’s activities expose it to a variety of financial risks: market risk (including currency
risk, other price risk and interest rate risk), credit risk and liquidity risk. The Group’s overall risk management programme focuses on the unpredictability of financial markets and seeks to minimize potential adverse effects on the Group’s financial performance. The Group uses derivative financial instruments to hedge certain risk exposures.
Risk management is carried out by the finance departments of the Holding Company and
Subsidiary Companies under the policies approved by their respective Board of Directors. The Holding Company and Subsidiary Companies’ finance departments evaluates and hedge financial risks. The Board of each Group Company provides principles for overall risk management, as well as policies covering specific areas such as currency risk, other price risk, interest rate risk, credit risk, liquidity risk, use of derivative financial instruments and non-derivative financial instruments and investment of excess liquidity.
a) Market risk i) Currency risk Currency risk is the risk that the fair value or future cash flows of a financial instrument will
fluctuate because of changes in foreign exchange rates. Currency risk arises mainly from future commercial transactions or receivables and payables that exist due to transactions in foreign currencies.
The Group is exposed to currency risk arising from various currency exposures, primarily
with respect to the United States Dollar (USD), Euro and United Arab Emirates Dirham (AED). Currently, the Group’s foreign exchange risk exposure is restricted to bank balances, long term loan, security deposit and the amounts receivable / payable from / to the foreign entities. The Group’s exposure to currency risk was as follows:
2017 2016 Cash at banks - USD 119,592 334,664 Cash at banks - AED 6,750,423 7,418,820 Trade debts - USD 13,063,808 11,276,893 Trade debts - Euro 987,388 1,021,991 Trade debts - AED 3,282,541 5,521,095 Trade and other payables - USD (1,333,482) (1,080,423) Trade and other payables - Euro (222,468) (182,684) Trade and other payables - AED (5,277,880) (4,001,701) Security deposit - USD 49,025 48,544 Motor vehicles’ loan - AED (62,781) (37,630) Net exposure - USD 11,898,943 10,579,677 Net exposure - Euro 764,920 839,307 Net exposure - AED 4,692,303 8,900,584 The following significant exchange rates were applied during the year:
Rupees per US Dollar Average rate 104.55 104.29 Reporting date rate 104.80 104.50 Rupees per Euro Average rate 114.17 115.31 Reporting date rate 119.91 116.08 Rupees per AED Average rate 28.47 28.40 Reporting date rate 28.53 28.45
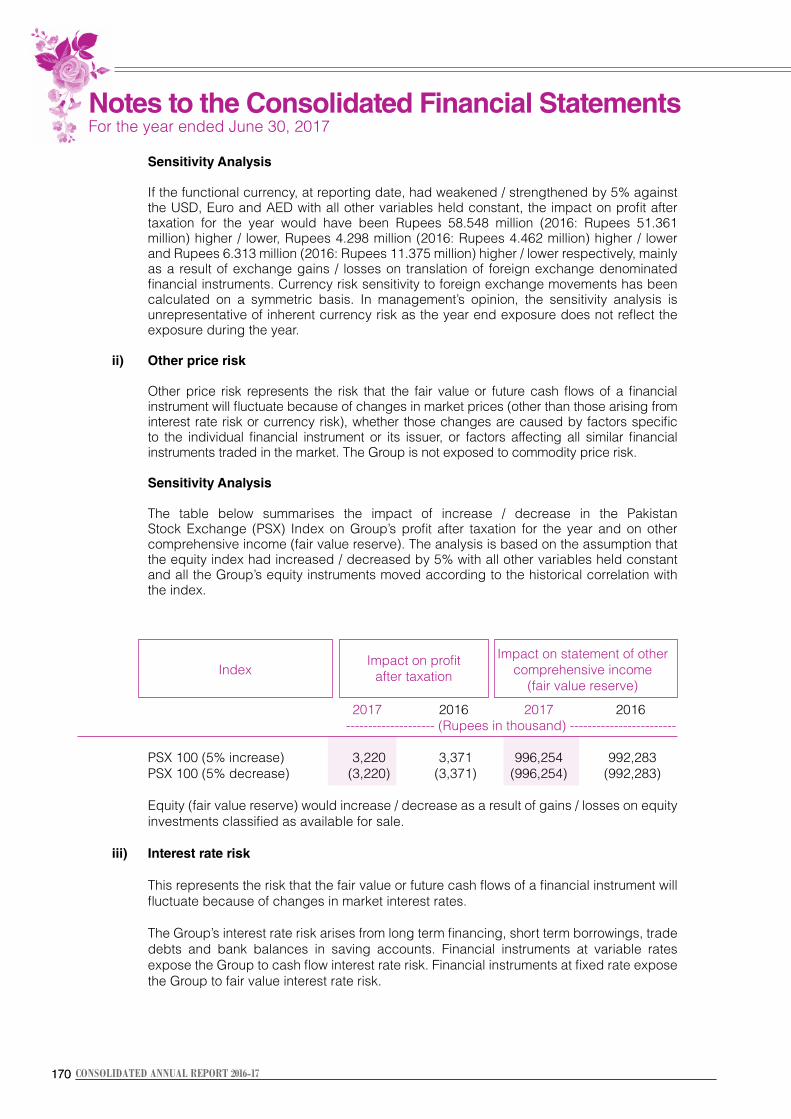
170170 CONSOLIDATED ANNUAL REPORT 2016-17
Sensitivity Analysis If the functional currency, at reporting date, had weakened / strengthened by 5% against
the USD, Euro and AED with all other variables held constant, the impact on profit after taxation for the year would have been Rupees 58.548 million (2016: Rupees 51.361 million) higher / lower, Rupees 4.298 million (2016: Rupees 4.462 million) higher / lower and Rupees 6.313 million (2016: Rupees 11.375 million) higher / lower respectively, mainly as a result of exchange gains / losses on translation of foreign exchange denominated financial instruments. Currency risk sensitivity to foreign exchange movements has been calculated on a symmetric basis. In management’s opinion, the sensitivity analysis is unrepresentative of inherent currency risk as the year end exposure does not reflect the exposure during the year.
ii) Other price risk Other price risk represents the risk that the fair value or future cash flows of a financial
instrument will fluctuate because of changes in market prices (other than those arising from interest rate risk or currency risk), whether those changes are caused by factors specific to the individual financial instrument or its issuer, or factors affecting all similar financial instruments traded in the market. The Group is not exposed to commodity price risk.
Sensitivity Analysis The table below summarises the impact of increase / decrease in the Pakistan
Stock Exchange (PSX) Index on Group’s profit after taxation for the year and on other comprehensive income (fair value reserve). The analysis is based on the assumption that the equity index had increased / decreased by 5% with all other variables held constant and all the Group’s equity instruments moved according to the historical correlation with the index.
Index
Impact on profit Impact on statement of other after taxation comprehensive income (fair value reserve)
2017 2016 2017 2016 -------------------- (Rupees in thousand) ------------------------ PSX 100 (5% increase) 3,220 3,371 996,254 992,283 PSX 100 (5% decrease) (3,220) (3,371) (996,254) (992,283)
Equity (fair value reserve) would increase / decrease as a result of gains / losses on equity investments classified as available for sale.
iii) Interest rate risk This represents the risk that the fair value or future cash flows of a financial instrument will
fluctuate because of changes in market interest rates. The Group’s interest rate risk arises from long term financing, short term borrowings, trade
debts and bank balances in saving accounts. Financial instruments at variable rates expose the Group to cash flow interest rate risk. Financial instruments at fixed rate expose the Group to fair value interest rate risk.
Notes to the Consolidated Financial Statements For the year ended June 30, 2017
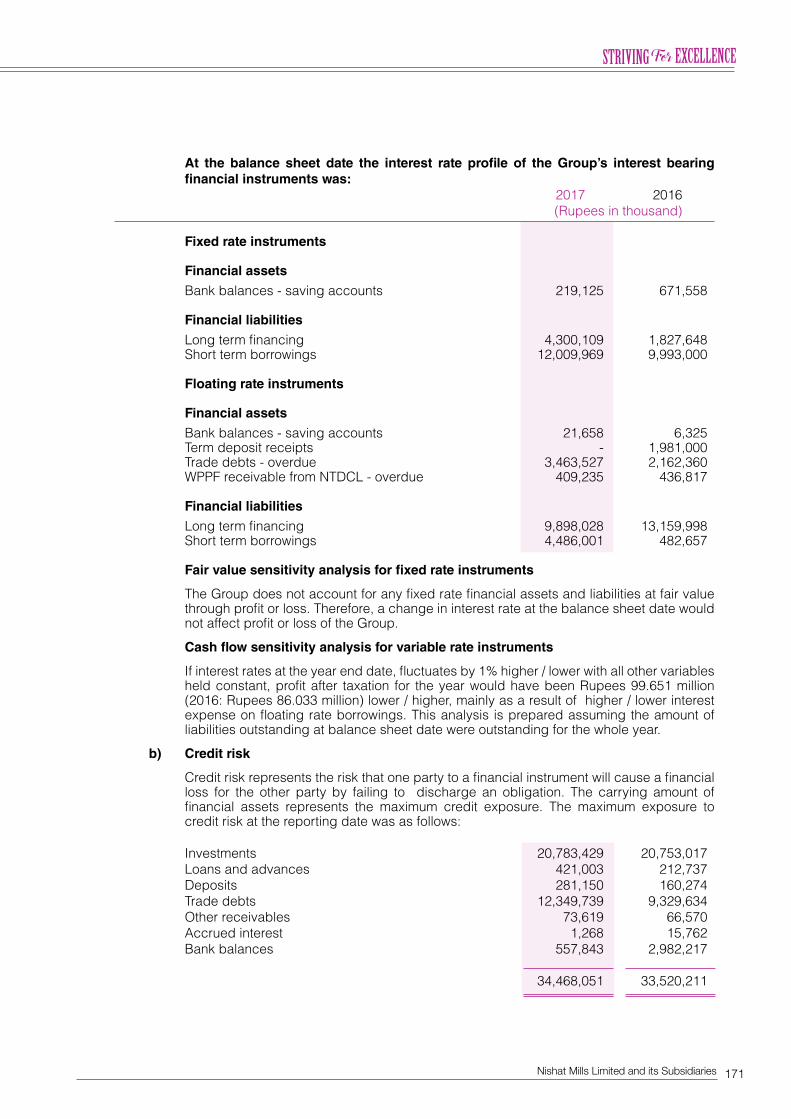
171Nishat Mills Limited and its Subsidiaries
At the balance sheet date the interest rate profile of the Group’s interest bearing financial instruments was:
2017 2016 (Rupees in thousand)
Fixed rate instruments Financial assets
Bank balances - saving accounts 219,125 671,558 Financial liabilities Long term financing 4,300,109 1,827,648 Short term borrowings 12,009,969 9,993,000 Floating rate instruments Financial assets Bank balances - saving accounts 21,658 6,325 Term deposit receipts - 1,981,000 Trade debts - overdue 3,463,527 2,162,360 WPPF receivable from NTDCL - overdue 409,235 436,817 Financial liabilities Long term financing 9,898,028 13,159,998 Short term borrowings 4,486,001 482,657 Fair value sensitivity analysis for fixed rate instruments
The Group does not account for any fixed rate financial assets and liabilities at fair value
through profit or loss. Therefore, a change in interest rate at the balance sheet date would not affect profit or loss of the Group.
Cash flow sensitivity analysis for variable rate instruments If interest rates at the year end date, fluctuates by 1% higher / lower with all other variables
held constant, profit after taxation for the year would have been Rupees 99.651 million (2016: Rupees 86.033 million) lower / higher, mainly as a result of higher / lower interest expense on floating rate borrowings. This analysis is prepared assuming the amount of liabilities outstanding at balance sheet date were outstanding for the whole year.
b) Credit risk Credit risk represents the risk that one party to a financial instrument will cause a financial
loss for the other party by failing to discharge an obligation. The carrying amount of financial assets represents the maximum credit exposure. The maximum exposure to credit risk at the reporting date was as follows:
Investments 20,783,429 20,753,017 Loans and advances 421,003 212,737 Deposits 281,150 160,274 Trade debts 12,349,739 9,329,634 Other receivables 73,619 66,570 Accrued interest 1,268 15,762 Bank balances 557,843 2,982,217
34,468,051 33,520,211
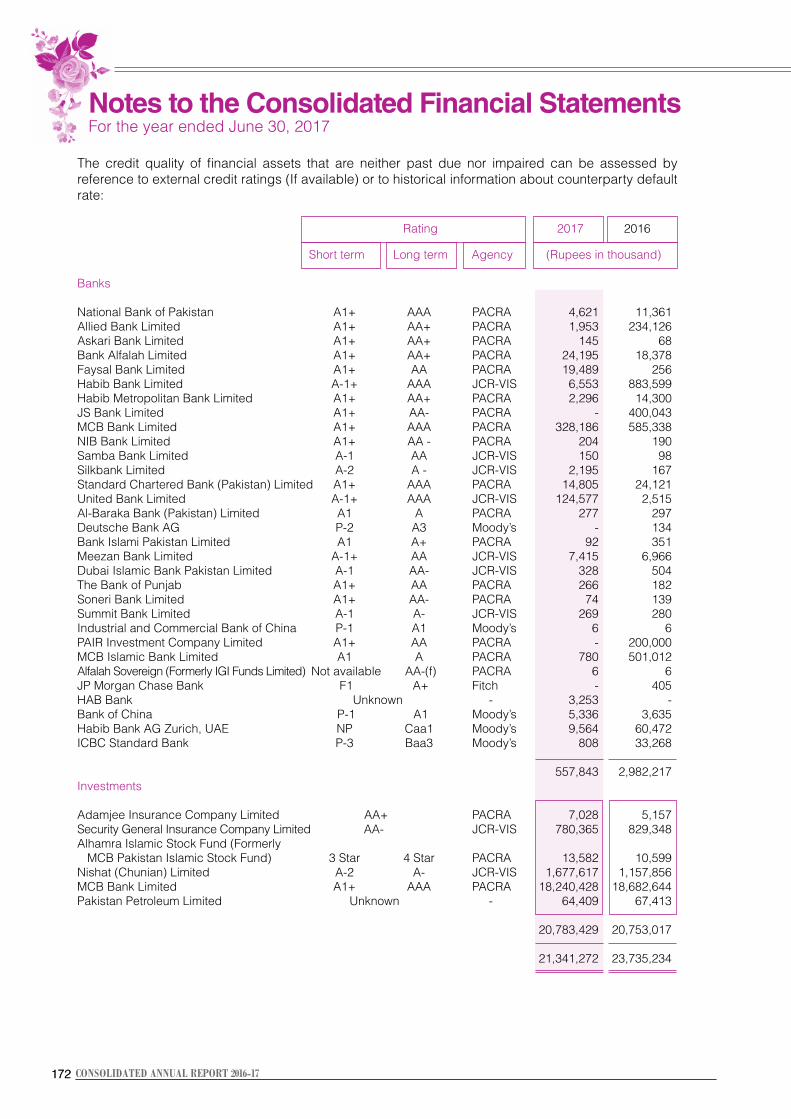
172172 CONSOLIDATED ANNUAL REPORT 2016-17
The credit quality of financial assets that are neither past due nor impaired can be assessed by reference to external credit ratings (If available) or to historical information about counterparty default rate:
Rating 2017 2016
Short term Long term Agency (Rupees in thousand)
Banks National Bank of Pakistan A1+ AAA PACRA 4,621 11,361 Allied Bank Limited A1+ AA+ PACRA 1,953 234,126 Askari Bank Limited A1+ AA+ PACRA 145 68 Bank Alfalah Limited A1+ AA+ PACRA 24,195 18,378 Faysal Bank Limited A1+ AA PACRA 19,489 256 Habib Bank Limited A-1+ AAA JCR-VIS 6,553 883,599 Habib Metropolitan Bank Limited A1+ AA+ PACRA 2,296 14,300 JS Bank Limited A1+ AA- PACRA - 400,043 MCB Bank Limited A1+ AAA PACRA 328,186 585,338 NIB Bank Limited A1+ AA - PACRA 204 190 Samba Bank Limited A-1 AA JCR-VIS 150 98 Silkbank Limited A-2 A - JCR-VIS 2,195 167 Standard Chartered Bank (Pakistan) Limited A1+ AAA PACRA 14,805 24,121 United Bank Limited A-1+ AAA JCR-VIS 124,577 2,515 Al-Baraka Bank (Pakistan) Limited A1 A PACRA 277 297 Deutsche Bank AG P-2 A3 Moody’s - 134 Bank Islami Pakistan Limited A1 A+ PACRA 92 351 Meezan Bank Limited A-1+ AA JCR-VIS 7,415 6,966 Dubai Islamic Bank Pakistan Limited A-1 AA- JCR-VIS 328 504 The Bank of Punjab A1+ AA PACRA 266 182 Soneri Bank Limited A1+ AA- PACRA 74 139 Summit Bank Limited A-1 A- JCR-VIS 269 280 Industrial and Commercial Bank of China P-1 A1 Moody’s 6 6 PAIR Investment Company Limited A1+ AA PACRA - 200,000 MCB Islamic Bank Limited A1 A PACRA 780 501,012 Alfalah Sovereign (Formerly IGI Funds Limited) Not available AA-(f) PACRA 6 6 JP Morgan Chase Bank F1 A+ Fitch - 405 HAB Bank Unknown - 3,253 - Bank of China P-1 A1 Moody’s 5,336 3,635 Habib Bank AG Zurich, UAE NP Caa1 Moody’s 9,564 60,472 ICBC Standard Bank P-3 Baa3 Moody’s 808 33,268
557,843 2,982,217 Investments Adamjee Insurance Company Limited AA+ PACRA 7,028 5,157 Security General Insurance Company Limited AA- JCR-VIS 780,365 829,348 Alhamra Islamic Stock Fund (Formerly MCB Pakistan Islamic Stock Fund) 3 Star 4 Star PACRA 13,582 10,599 Nishat (Chunian) Limited A-2 A- JCR-VIS 1,677,617 1,157,856 MCB Bank Limited A1+ AAA PACRA 18,240,428 18,682,644 Pakistan Petroleum Limited Unknown - 64,409 67,413 20,783,429 20,753,017
21,341,272 23,735,234
Notes to the Consolidated Financial Statements For the year ended June 30, 2017
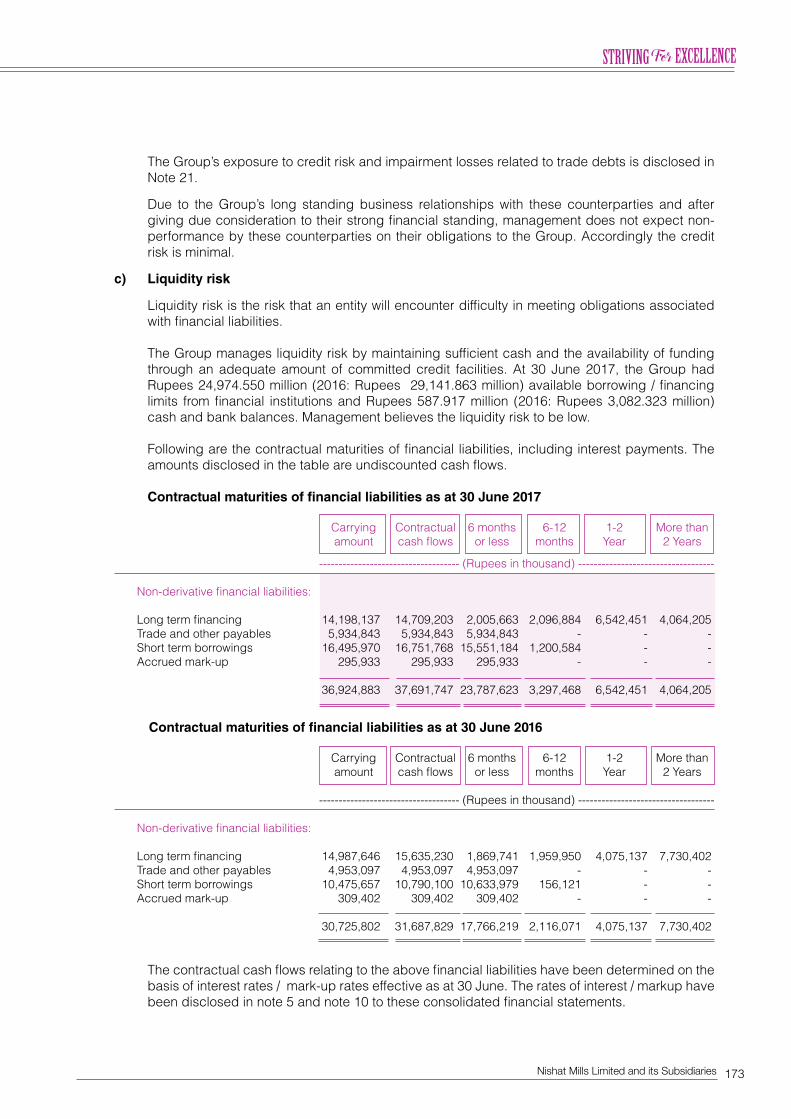
173Nishat Mills Limited and its Subsidiaries
The Group’s exposure to credit risk and impairment losses related to trade debts is disclosed in Note 21.
Due to the Group’s long standing business relationships with these counterparties and after giving due consideration to their strong financial standing, management does not expect non-performance by these counterparties on their obligations to the Group. Accordingly the credit risk is minimal.
c) Liquidity risk
Liquidity risk is the risk that an entity will encounter difficulty in meeting obligations associated with financial liabilities.
The Group manages liquidity risk by maintaining sufficient cash and the availability of funding through an adequate amount of committed credit facilities. At 30 June 2017, the Group had Rupees 24,974.550 million (2016: Rupees 29,141.863 million) available borrowing / financing limits from financial institutions and Rupees 587.917 million (2016: Rupees 3,082.323 million) cash and bank balances. Management believes the liquidity risk to be low.
Following are the contractual maturities of financial liabilities, including interest payments. The amounts disclosed in the table are undiscounted cash flows.
Contractual maturities of financial liabilities as at 30 June 2017
Carrying Contractual 6 months 6-12 1-2 More than amount cash flows or less months Year 2 Years
------------------------------------ (Rupees in thousand) -----------------------------------
Non-derivative financial liabilities: Long term financing 14,198,137 14,709,203 2,005,663 2,096,884 6,542,451 4,064,205 Trade and other payables 5,934,843 5,934,843 5,934,843 - - - Short term borrowings 16,495,970 16,751,768 15,551,184 1,200,584 - - Accrued mark-up 295,933 295,933 295,933 - - - 36,924,883 37,691,747 23,787,623 3,297,468 6,542,451 4,064,205
Contractual maturities of financial liabilities as at 30 June 2016
Carrying Contractual 6 months 6-12 1-2 More than amount cash flows or less months Year 2 Years
------------------------------------ (Rupees in thousand) -----------------------------------
Non-derivative financial liabilities: Long term financing 14,987,646 15,635,230 1,869,741 1,959,950 4,075,137 7,730,402 Trade and other payables 4,953,097 4,953,097 4,953,097 - - - Short term borrowings 10,475,657 10,790,100 10,633,979 156,121 - - Accrued mark-up 309,402 309,402 309,402 - - - 30,725,802 31,687,829 17,766,219 2,116,071 4,075,137 7,730,402
The contractual cash flows relating to the above financial liabilities have been determined on the basis of interest rates / mark-up rates effective as at 30 June. The rates of interest / markup have been disclosed in note 5 and note 10 to these consolidated financial statements.
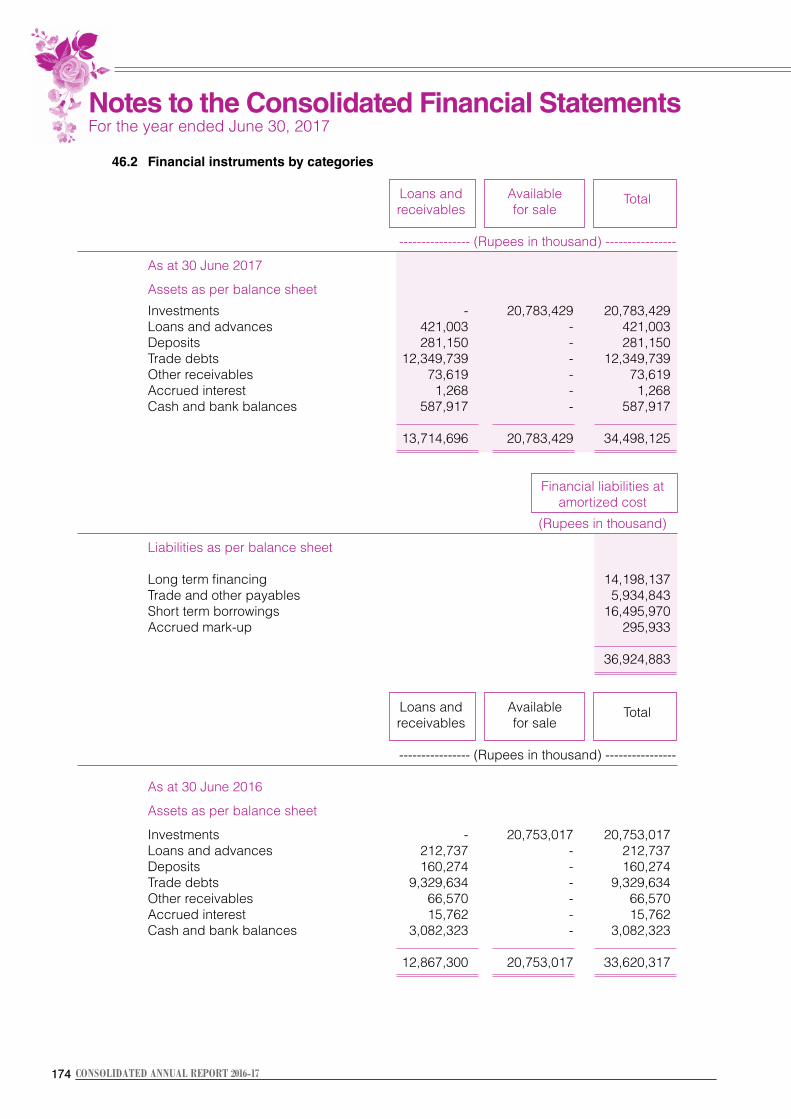
174174 CONSOLIDATED ANNUAL REPORT 2016-17
46.2 Financial instruments by categories Loans and Available Total receivables for sale ---------------- (Rupees in thousand) ----------------
As at 30 June 2017 Assets as per balance sheet
Investments - 20,783,429 20,783,429 Loans and advances 421,003 - 421,003 Deposits 281,150 - 281,150 Trade debts 12,349,739 - 12,349,739 Other receivables 73,619 - 73,619 Accrued interest 1,268 - 1,268 Cash and bank balances 587,917 - 587,917 13,714,696 20,783,429 34,498,125
Financial liabilities at amortized cost
(Rupees in thousand) Liabilities as per balance sheet Long term financing 14,198,137 Trade and other payables 5,934,843 Short term borrowings 16,495,970 Accrued mark-up 295,933
36,924,883
Loans and Available Total receivables for sale ---------------- (Rupees in thousand) ----------------
As at 30 June 2016 Assets as per balance sheet Investments - 20,753,017 20,753,017 Loans and advances 212,737 - 212,737 Deposits 160,274 - 160,274 Trade debts 9,329,634 - 9,329,634 Other receivables 66,570 - 66,570 Accrued interest 15,762 - 15,762 Cash and bank balances 3,082,323 - 3,082,323 12,867,300 20,753,017 33,620,317
Notes to the Consolidated Financial Statements For the year ended June 30, 2017
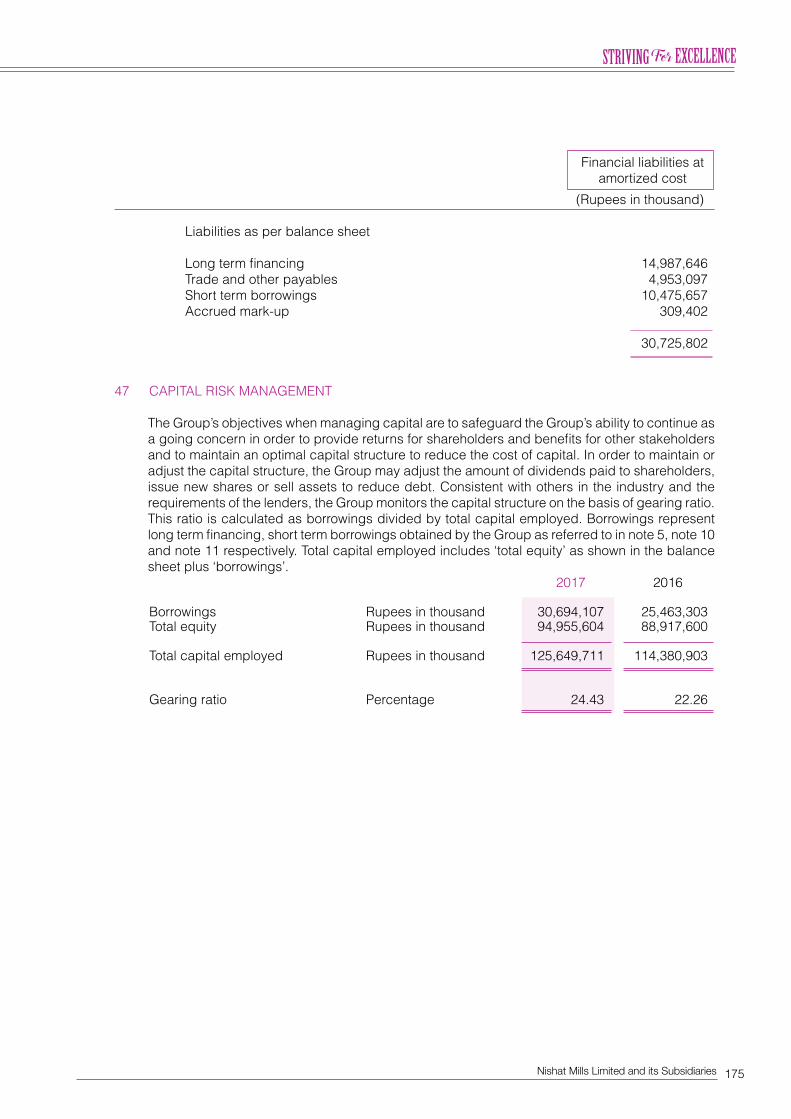
175Nishat Mills Limited and its Subsidiaries
Financial liabilities at amortized cost
(Rupees in thousand)
Liabilities as per balance sheet Long term financing 14,987,646 Trade and other payables 4,953,097 Short term borrowings 10,475,657 Accrued mark-up 309,402 30,725,802
47 CAPITAL RISK MANAGEMENT The Group’s objectives when managing capital are to safeguard the Group’s ability to continue as
a going concern in order to provide returns for shareholders and benefits for other stakeholders and to maintain an optimal capital structure to reduce the cost of capital. In order to maintain or adjust the capital structure, the Group may adjust the amount of dividends paid to shareholders, issue new shares or sell assets to reduce debt. Consistent with others in the industry and the requirements of the lenders, the Group monitors the capital structure on the basis of gearing ratio. This ratio is calculated as borrowings divided by total capital employed. Borrowings represent long term financing, short term borrowings obtained by the Group as referred to in note 5, note 10 and note 11 respectively. Total capital employed includes ‘total equity’ as shown in the balance sheet plus ‘borrowings’.
2017 2016
Borrowings Rupees in thousand 30,694,107 25,463,303 Total equity Rupees in thousand 94,955,604 88,917,600
Total capital employed Rupees in thousand 125,649,711 114,380,903
Gearing ratio Percentage 24.43 22.26
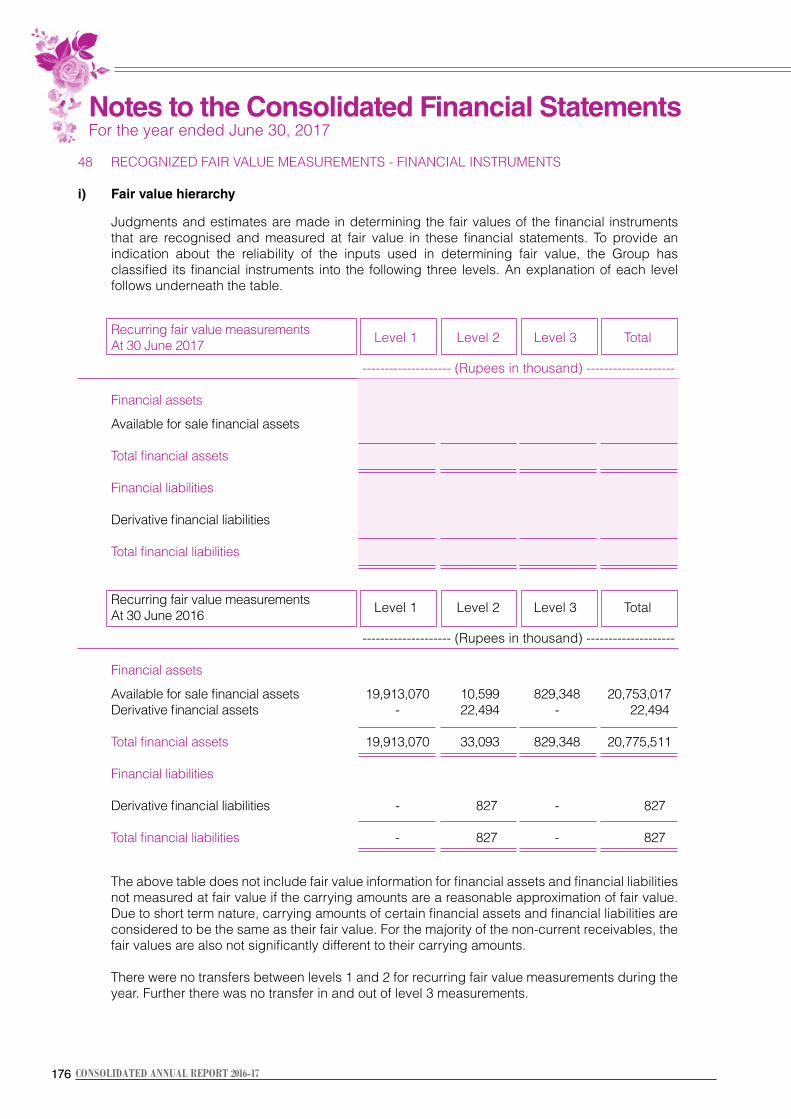
176176 CONSOLIDATED ANNUAL REPORT 2016-17
48 RECOGNIZED FAIR VALUE MEASUREMENTS - FINANCIAL INSTRUMENTS i) Fair value hierarchy
Judgments and estimates are made in determining the fair values of the financial instruments that are recognised and measured at fair value in these financial statements. To provide an indication about the reliability of the inputs used in determining fair value, the Group has classified its financial instruments into the following three levels. An explanation of each level follows underneath the table.
Recurring fair value measurements Level 1 Level 2 Level 3 Total At 30 June 2017
-------------------- (Rupees in thousand) -------------------- Financial assets Available for sale financial assets 19,989,482 13,582 780,365 20,783,429 Total financial assets 19,989,482 13,582 780,365 20,783,429 Financial liabilities Derivative financial liabilities - 27,536 - 27,536 Total financial liabilities - 27,536 - 27,536
Recurring fair value measurements Level 1 Level 2 Level 3 Total At 30 June 2016
-------------------- (Rupees in thousand) --------------------
Financial assets Available for sale financial assets 19,913,070 10,599 829,348 20,753,017 Derivative financial assets - 22,494 - 22,494 Total financial assets 19,913,070 33,093 829,348 20,775,511 Financial liabilities Derivative financial liabilities - 827 - 827
Total financial liabilities - 827 - 827
The above table does not include fair value information for financial assets and financial liabilities not measured at fair value if the carrying amounts are a reasonable approximation of fair value. Due to short term nature, carrying amounts of certain financial assets and financial liabilities are considered to be the same as their fair value. For the majority of the non-current receivables, the fair values are also not significantly different to their carrying amounts.
There were no transfers between levels 1 and 2 for recurring fair value measurements during the
year. Further there was no transfer in and out of level 3 measurements.
Notes to the Consolidated Financial Statements For the year ended June 30, 2017
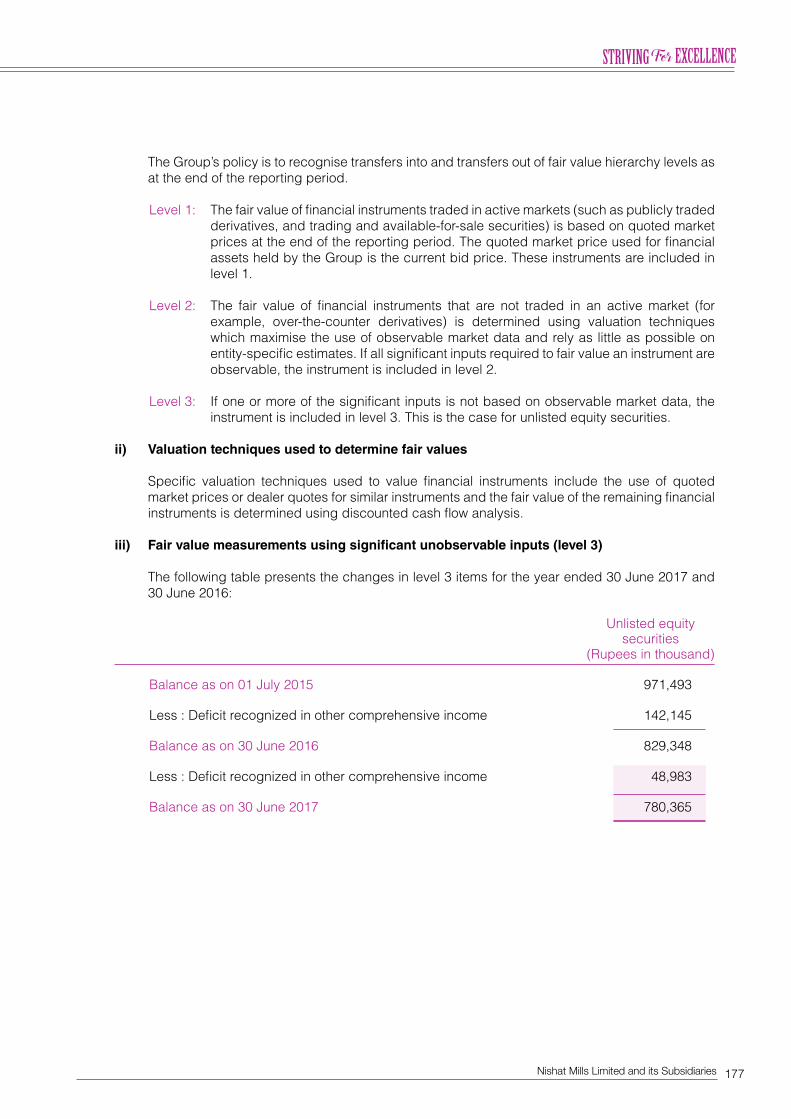
177Nishat Mills Limited and its Subsidiaries
The Group’s policy is to recognise transfers into and transfers out of fair value hierarchy levels as at the end of the reporting period.
Level 1: The fair value of financial instruments traded in active markets (such as publicly traded derivatives, and trading and available-for-sale securities) is based on quoted market prices at the end of the reporting period. The quoted market price used for financial assets held by the Group is the current bid price. These instruments are included in level 1.
Level 2: The fair value of financial instruments that are not traded in an active market (for
example, over-the-counter derivatives) is determined using valuation techniques which maximise the use of observable market data and rely as little as possible on entity-specific estimates. If all significant inputs required to fair value an instrument are observable, the instrument is included in level 2.
Level 3: If one or more of the significant inputs is not based on observable market data, the
instrument is included in level 3. This is the case for unlisted equity securities. ii) Valuation techniques used to determine fair values Specific valuation techniques used to value financial instruments include the use of quoted
market prices or dealer quotes for similar instruments and the fair value of the remaining financial instruments is determined using discounted cash flow analysis.
iii) Fair value measurements using significant unobservable inputs (level 3) The following table presents the changes in level 3 items for the year ended 30 June 2017 and
30 June 2016: Unlisted equity securities (Rupees in thousand) Balance as on 01 July 2015 971,493 Less : Deficit recognized in other comprehensive income 142,145 Balance as on 30 June 2016 829,348 Less : Deficit recognized in other comprehensive income 48,983 Balance as on 30 June 2017 780,365
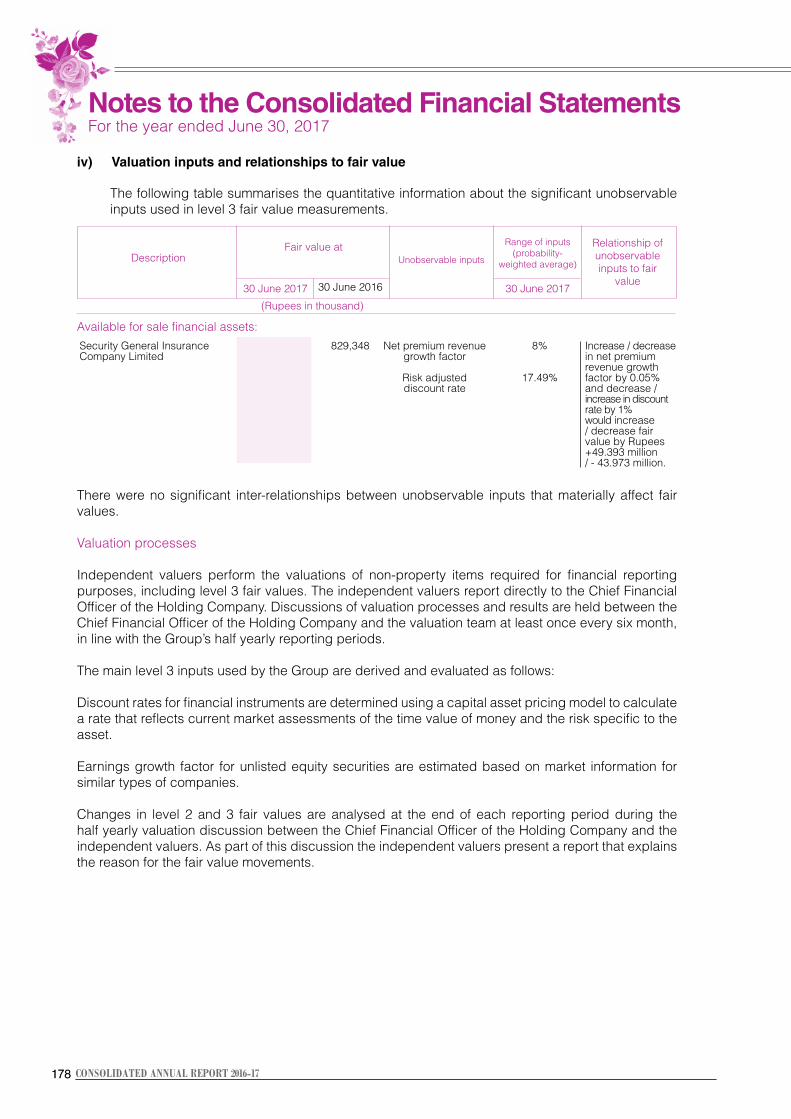
178178 CONSOLIDATED ANNUAL REPORT 2016-17
iv) Valuation inputs and relationships to fair value The following table summarises the quantitative information about the significant unobservable
inputs used in level 3 fair value measurements.
(Rupees in thousand)
Available for sale financial assets:
Security General Insurance 780,365 829,348 Net premium revenue 8% Increase / decreaseCompany Limited growth factor in net premium
revenue growth Risk adjusted 17.49% factor by 0.05% discount rate and decrease /
increase in discount rate by 1% would increase / decrease fair value by Rupees +49.393 million
/ - 43.973 million.
There were no significant inter-relationships between unobservable inputs that materially affect fair values.
Valuation processes
Independent valuers perform the valuations of non-property items required for financial reporting purposes, including level 3 fair values. The independent valuers report directly to the Chief Financial Officer of the Holding Company. Discussions of valuation processes and results are held between the Chief Financial Officer of the Holding Company and the valuation team at least once every six month, in line with the Group’s half yearly reporting periods.
The main level 3 inputs used by the Group are derived and evaluated as follows:
Discount rates for financial instruments are determined using a capital asset pricing model to calculate a rate that reflects current market assessments of the time value of money and the risk specific to the asset.
Earnings growth factor for unlisted equity securities are estimated based on market information for similar types of companies.
Changes in level 2 and 3 fair values are analysed at the end of each reporting period during the half yearly valuation discussion between the Chief Financial Officer of the Holding Company and the independent valuers. As part of this discussion the independent valuers present a report that explains the reason for the fair value movements.
DescriptionFair value at
Unobservable inputs
Range of inputs (probability-
weighted average)
Relationship of unobservable inputs to fair
value30 June 2017 30 June 201730 June 2016
Notes to the Consolidated Financial Statements For the year ended June 30, 2017
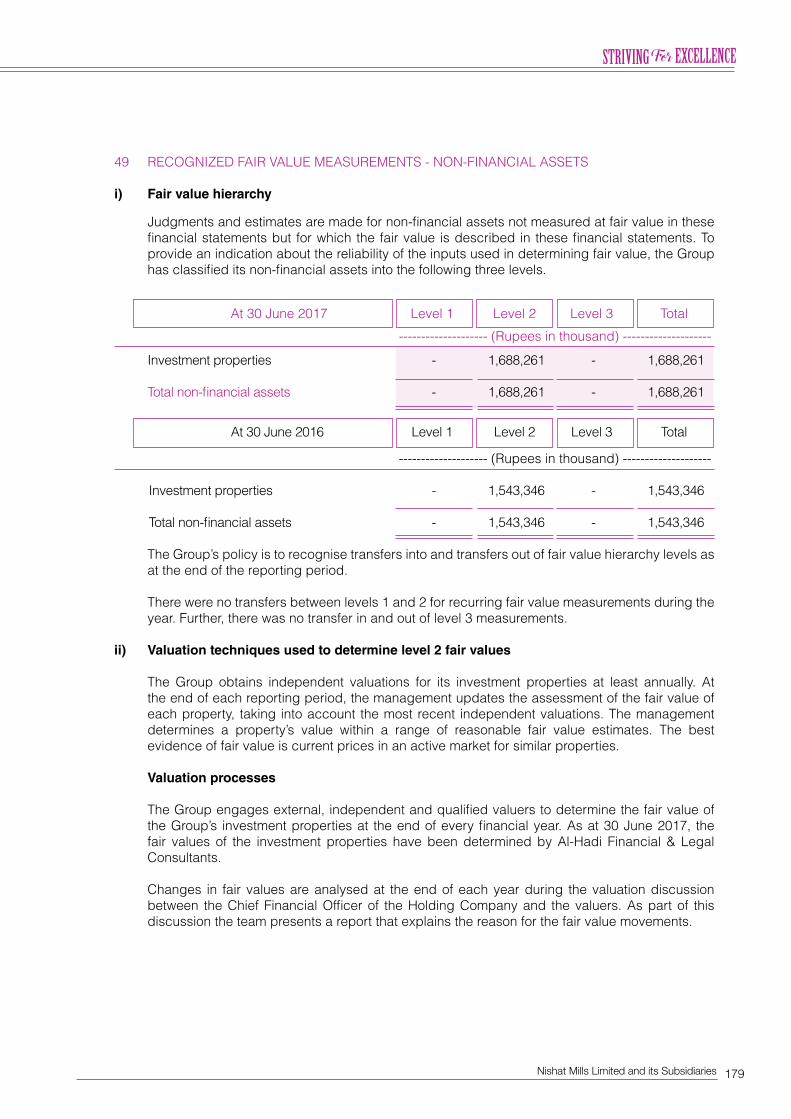
179Nishat Mills Limited and its Subsidiaries
49 RECOGNIZED FAIR VALUE MEASUREMENTS - NON-FINANCIAL ASSETS i) Fair value hierarchy
Judgments and estimates are made for non-financial assets not measured at fair value in these financial statements but for which the fair value is described in these financial statements. To provide an indication about the reliability of the inputs used in determining fair value, the Group has classified its non-financial assets into the following three levels.
At 30 June 2017 Level 1 Level 2 Level 3 Total
-------------------- (Rupees in thousand) -------------------- Investment properties - 1,688,261 - 1,688,261 Total non-financial assets - 1,688,261 - 1,688,261
At 30 June 2016 Level 1 Level 2 Level 3 Total
-------------------- (Rupees in thousand) -------------------- Investment properties - 1,543,346 - 1,543,346 Total non-financial assets - 1,543,346 - 1,543,346
The Group’s policy is to recognise transfers into and transfers out of fair value hierarchy levels as at the end of the reporting period.
There were no transfers between levels 1 and 2 for recurring fair value measurements during the
year. Further, there was no transfer in and out of level 3 measurements. ii) Valuation techniques used to determine level 2 fair values The Group obtains independent valuations for its investment properties at least annually. At
the end of each reporting period, the management updates the assessment of the fair value of each property, taking into account the most recent independent valuations. The management determines a property’s value within a range of reasonable fair value estimates. The best evidence of fair value is current prices in an active market for similar properties.
Valuation processes The Group engages external, independent and qualified valuers to determine the fair value of
the Group’s investment properties at the end of every financial year. As at 30 June 2017, the fair values of the investment properties have been determined by Al-Hadi Financial & Legal Consultants.
Changes in fair values are analysed at the end of each year during the valuation discussion
between the Chief Financial Officer of the Holding Company and the valuers. As part of this discussion the team presents a report that explains the reason for the fair value movements.
180180 CONSOLIDATED ANNUAL REPORT 2016-17
50 DATE OF AUTHORIZATION FOR ISSUE These consolidated financial statements were authorized for issue on 25 September 2017 by the
Board of Directors. 51 CORRESPONDING FIGURES Corresponding figures have been re-arranged, wherever necessary, for the purpose of comparison.
However, no significant re-arrangements have been made. 52 GENERAL Figures have been rounded off to the nearest thousand of Rupees unless otherwise stated.
Notes to the Consolidated Financial Statements For the year ended June 30, 2017
CHIEF EXECUTIVE OFFICER CHIEF FINANCIAL OFFICER DIRECTOR
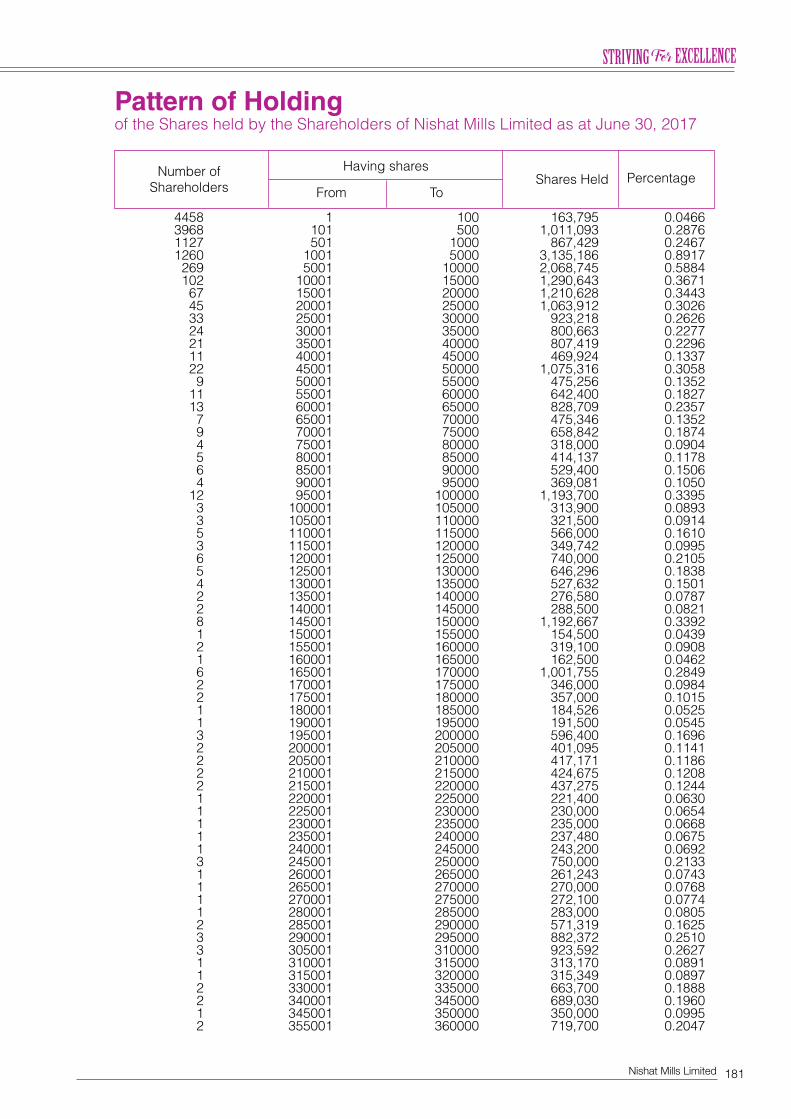
181Nishat Mills Limited
Number of Having shares Percentage Shareholders From To Shares Held
4458 1 100 163,795 0.0466 3968 101 500 1,011,093 0.2876 1127 501 1000 867,429 0.2467 1260 1001 5000 3,135,186 0.8917 269 5001 10000 2,068,745 0.5884 102 10001 15000 1,290,643 0.3671 67 15001 20000 1,210,628 0.3443 45 20001 25000 1,063,912 0.3026 33 25001 30000 923,218 0.2626 24 30001 35000 800,663 0.2277 21 35001 40000 807,419 0.2296 11 40001 45000 469,924 0.1337 22 45001 50000 1,075,316 0.3058 9 50001 55000 475,256 0.1352 11 55001 60000 642,400 0.1827 13 60001 65000 828,709 0.2357 7 65001 70000 475,346 0.1352 9 70001 75000 658,842 0.1874 4 75001 80000 318,000 0.0904 5 80001 85000 414,137 0.1178 6 85001 90000 529,400 0.1506 4 90001 95000 369,081 0.1050 12 95001 100000 1,193,700 0.3395 3 100001 105000 313,900 0.0893 3 105001 110000 321,500 0.0914 5 110001 115000 566,000 0.1610 3 115001 120000 349,742 0.0995 6 120001 125000 740,000 0.2105 5 125001 130000 646,296 0.1838 4 130001 135000 527,632 0.1501 2 135001 140000 276,580 0.0787 2 140001 145000 288,500 0.0821 8 145001 150000 1,192,667 0.3392 1 150001 155000 154,500 0.0439 2 155001 160000 319,100 0.0908 1 160001 165000 162,500 0.0462 6 165001 170000 1,001,755 0.2849 2 170001 175000 346,000 0.0984 2 175001 180000 357,000 0.1015 1 180001 185000 184,526 0.0525 1 190001 195000 191,500 0.0545 3 195001 200000 596,400 0.1696 2 200001 205000 401,095 0.1141 2 205001 210000 417,171 0.1186 2 210001 215000 424,675 0.1208 2 215001 220000 437,275 0.1244 1 220001 225000 221,400 0.0630 1 225001 230000 230,000 0.0654 1 230001 235000 235,000 0.0668 1 235001 240000 237,480 0.0675 1 240001 245000 243,200 0.0692 3 245001 250000 750,000 0.2133 1 260001 265000 261,243 0.0743 1 265001 270000 270,000 0.0768 1 270001 275000 272,100 0.0774 1 280001 285000 283,000 0.0805 2 285001 290000 571,319 0.1625 3 290001 295000 882,372 0.2510 3 305001 310000 923,592 0.2627 1 310001 315000 313,170 0.0891 1 315001 320000 315,349 0.0897 2 330001 335000 663,700 0.1888 2 340001 345000 689,030 0.1960 1 345001 350000 350,000 0.0995 2 355001 360000 719,700 0.2047
Pattern of Holdingof the Shares held by the Shareholders of Nishat Mills Limited as at June 30, 2017
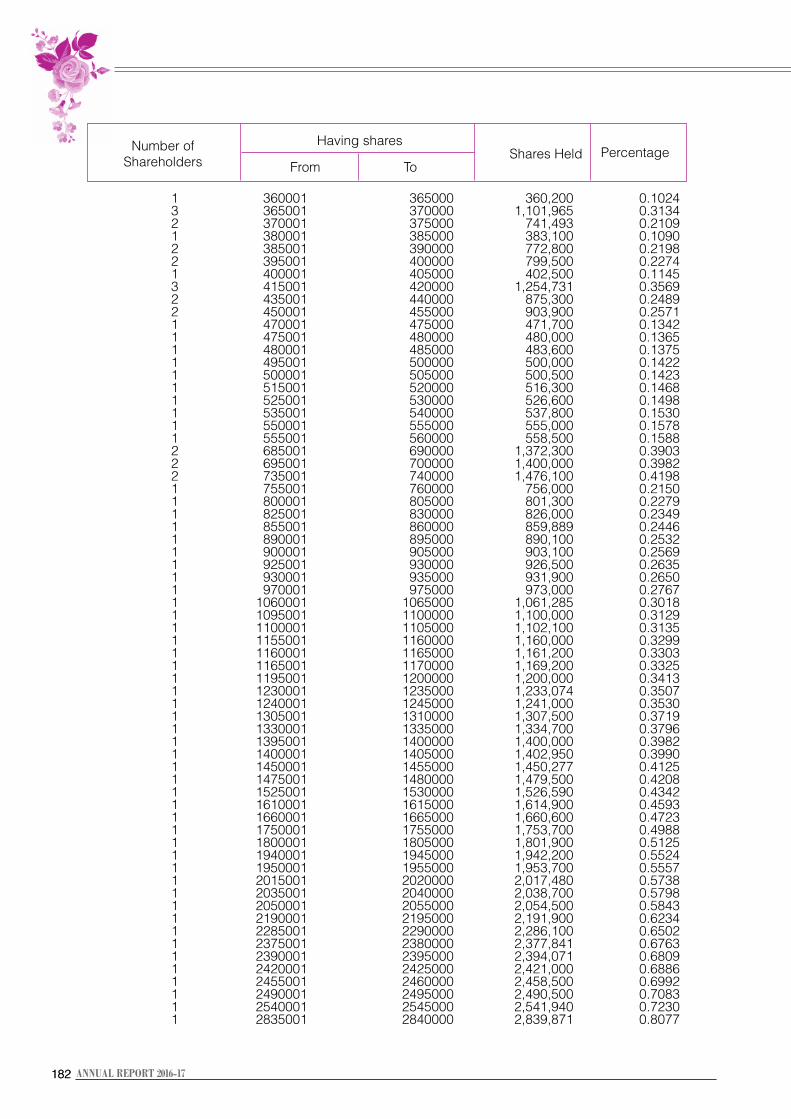
182182 ANNUAL REPORT 2016-17
1 360001 365000 360,200 0.1024 3 365001 370000 1,101,965 0.3134 2 370001 375000 741,493 0.2109 1 380001 385000 383,100 0.1090 2 385001 390000 772,800 0.2198 2 395001 400000 799,500 0.2274 1 400001 405000 402,500 0.1145 3 415001 420000 1,254,731 0.3569 2 435001 440000 875,300 0.2489 2 450001 455000 903,900 0.2571 1 470001 475000 471,700 0.1342 1 475001 480000 480,000 0.1365 1 480001 485000 483,600 0.1375 1 495001 500000 500,000 0.1422 1 500001 505000 500,500 0.1423 1 515001 520000 516,300 0.1468 1 525001 530000 526,600 0.1498 1 535001 540000 537,800 0.1530 1 550001 555000 555,000 0.1578 1 555001 560000 558,500 0.1588 2 685001 690000 1,372,300 0.3903 2 695001 700000 1,400,000 0.3982 2 735001 740000 1,476,100 0.4198 1 755001 760000 756,000 0.2150 1 800001 805000 801,300 0.2279 1 825001 830000 826,000 0.2349 1 855001 860000 859,889 0.2446 1 890001 895000 890,100 0.2532 1 900001 905000 903,100 0.2569 1 925001 930000 926,500 0.2635 1 930001 935000 931,900 0.2650 1 970001 975000 973,000 0.2767 1 1060001 1065000 1,061,285 0.3018 1 1095001 1100000 1,100,000 0.3129 1 1100001 1105000 1,102,100 0.3135 1 1155001 1160000 1,160,000 0.3299 1 1160001 1165000 1,161,200 0.3303 1 1165001 1170000 1,169,200 0.3325 1 1195001 1200000 1,200,000 0.3413 1 1230001 1235000 1,233,074 0.3507 1 1240001 1245000 1,241,000 0.3530 1 1305001 1310000 1,307,500 0.3719 1 1330001 1335000 1,334,700 0.3796 1 1395001 1400000 1,400,000 0.3982 1 1400001 1405000 1,402,950 0.3990 1 1450001 1455000 1,450,277 0.4125 1 1475001 1480000 1,479,500 0.4208 1 1525001 1530000 1,526,590 0.4342 1 1610001 1615000 1,614,900 0.4593 1 1660001 1665000 1,660,600 0.4723 1 1750001 1755000 1,753,700 0.4988 1 1800001 1805000 1,801,900 0.5125 1 1940001 1945000 1,942,200 0.5524 1 1950001 1955000 1,953,700 0.5557 1 2015001 2020000 2,017,480 0.5738 1 2035001 2040000 2,038,700 0.5798 1 2050001 2055000 2,054,500 0.5843 1 2190001 2195000 2,191,900 0.6234 1 2285001 2290000 2,286,100 0.6502 1 2375001 2380000 2,377,841 0.6763 1 2390001 2395000 2,394,071 0.6809 1 2420001 2425000 2,421,000 0.6886 1 2455001 2460000 2,458,500 0.6992 1 2490001 2495000 2,490,500 0.7083 1 2540001 2545000 2,541,940 0.7230 1 2835001 2840000 2,839,871 0.8077
Number of Having shares Percentage Shareholders From To Shares Held
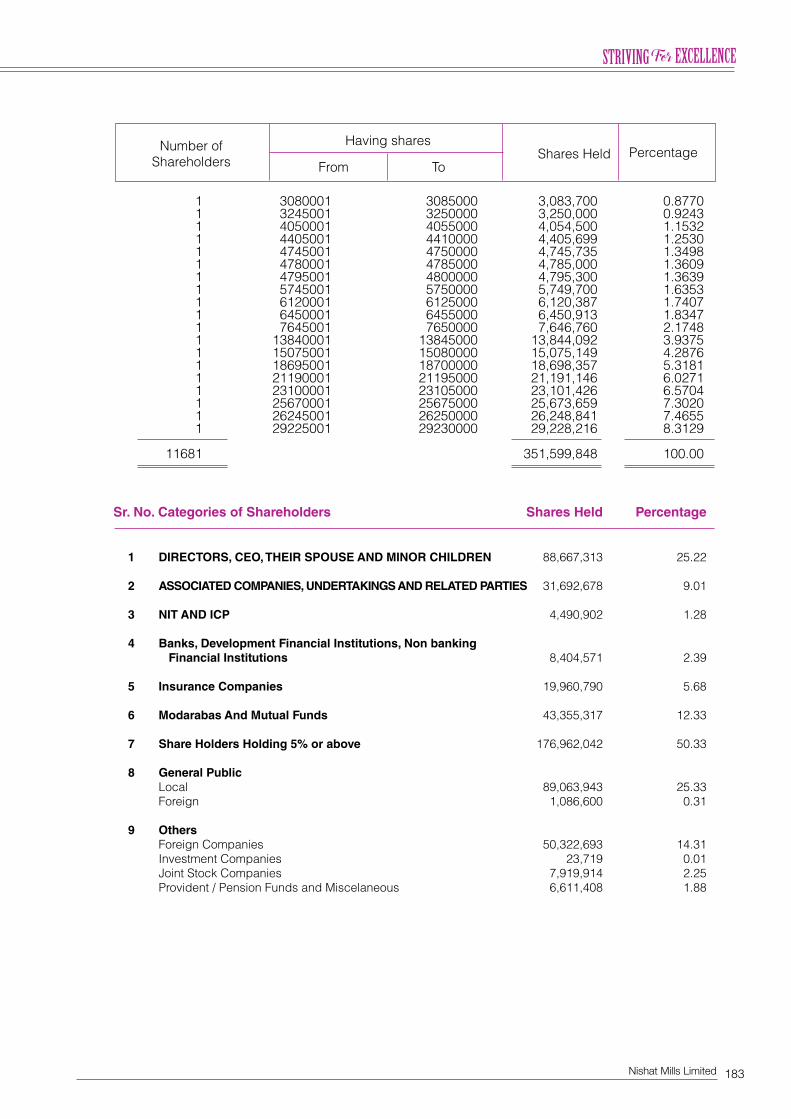
183Nishat Mills Limited
Number of Having shares Percentage Shareholders From To Shares Held
1 3080001 3085000 3,083,700 0.8770 1 3245001 3250000 3,250,000 0.9243 1 4050001 4055000 4,054,500 1.1532 1 4405001 4410000 4,405,699 1.2530 1 4745001 4750000 4,745,735 1.3498 1 4780001 4785000 4,785,000 1.3609 1 4795001 4800000 4,795,300 1.3639 1 5745001 5750000 5,749,700 1.6353 1 6120001 6125000 6,120,387 1.7407 1 6450001 6455000 6,450,913 1.8347 1 7645001 7650000 7,646,760 2.1748 1 13840001 13845000 13,844,092 3.9375 1 15075001 15080000 15,075,149 4.2876 1 18695001 18700000 18,698,357 5.3181 1 21190001 21195000 21,191,146 6.0271 1 23100001 23105000 23,101,426 6.5704 1 25670001 25675000 25,673,659 7.3020 1 26245001 26250000 26,248,841 7.4655 1 29225001 29230000 29,228,216 8.3129
11681 351,599,848 100.00
Sr. No. Categories of Shareholders Shares Held Percentage
1 DIRECTORS, CEO, THEIR SPOUSE AND MINOR CHILDREN 88,667,313 25.22 2 ASSOCIATED COMPANIES, UNDERTAKINGS AND RELATED PARTIES 31,692,678 9.01 3 NIT AND ICP 4,490,902 1.28 4 Banks, Development Financial Institutions, Non banking Financial Institutions 8,404,571 2.39
5 Insurance Companies 19,960,790 5.68 6 Modarabas And Mutual Funds 43,355,317 12.33 7 Share Holders Holding 5% or above 176,962,042 50.33 8 General Public Local 89,063,943 25.33 Foreign 1,086,600 0.31 9 Others Foreign Companies 50,322,693 14.31 Investment Companies 23,719 0.01 Joint Stock Companies 7,919,914 2.25 Provident / Pension Funds and Miscelaneous 6,611,408 1.88
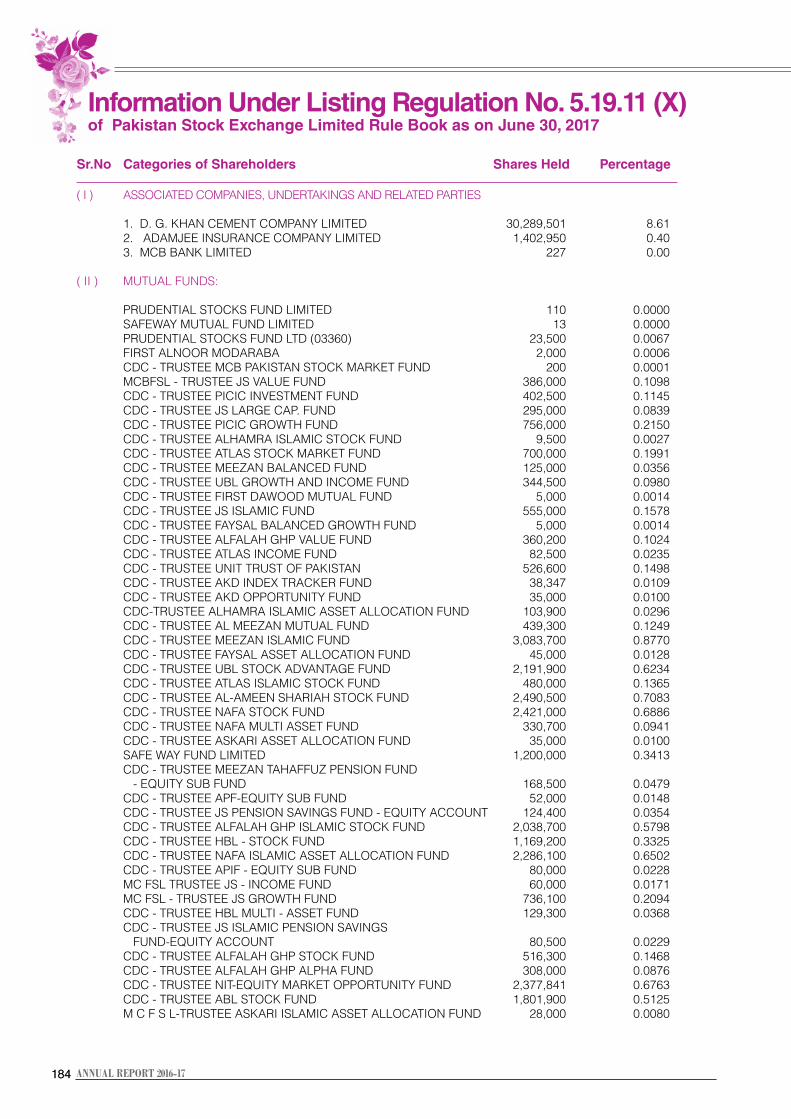
184184 ANNUAL REPORT 2016-17
Sr.No Categories of Shareholders Shares Held Percentage ( I ) ASSOCIATED COMPANIES, UNDERTAKINGS AND RELATED PARTIES
1. D. G. KHAN CEMENT COMPANY LIMITED 30,289,501 8.61 2. ADAMJEE INSURANCE COMPANY LIMITED 1,402,950 0.40 3. MCB BANK LIMITED 227 0.00
( II ) MUTUAL FUNDS: PRUDENTIAL STOCKS FUND LIMITED 110 0.0000 SAFEWAY MUTUAL FUND LIMITED 13 0.0000 PRUDENTIAL STOCKS FUND LTD (03360) 23,500 0.0067 FIRST ALNOOR MODARABA 2,000 0.0006 CDC - TRUSTEE MCB PAKISTAN STOCK MARKET FUND 200 0.0001 MCBFSL - TRUSTEE JS VALUE FUND 386,000 0.1098 CDC - TRUSTEE PICIC INVESTMENT FUND 402,500 0.1145 CDC - TRUSTEE JS LARGE CAP. FUND 295,000 0.0839 CDC - TRUSTEE PICIC GROWTH FUND 756,000 0.2150 CDC - TRUSTEE ALHAMRA ISLAMIC STOCK FUND 9,500 0.0027 CDC - TRUSTEE ATLAS STOCK MARKET FUND 700,000 0.1991 CDC - TRUSTEE MEEZAN BALANCED FUND 125,000 0.0356 CDC - TRUSTEE UBL GROWTH AND INCOME FUND 344,500 0.0980 CDC - TRUSTEE FIRST DAWOOD MUTUAL FUND 5,000 0.0014 CDC - TRUSTEE JS ISLAMIC FUND 555,000 0.1578 CDC - TRUSTEE FAYSAL BALANCED GROWTH FUND 5,000 0.0014 CDC - TRUSTEE ALFALAH GHP VALUE FUND 360,200 0.1024 CDC - TRUSTEE ATLAS INCOME FUND 82,500 0.0235 CDC - TRUSTEE UNIT TRUST OF PAKISTAN 526,600 0.1498 CDC - TRUSTEE AKD INDEX TRACKER FUND 38,347 0.0109 CDC - TRUSTEE AKD OPPORTUNITY FUND 35,000 0.0100 CDC-TRUSTEE ALHAMRA ISLAMIC ASSET ALLOCATION FUND 103,900 0.0296 CDC - TRUSTEE AL MEEZAN MUTUAL FUND 439,300 0.1249 CDC - TRUSTEE MEEZAN ISLAMIC FUND 3,083,700 0.8770 CDC - TRUSTEE FAYSAL ASSET ALLOCATION FUND 45,000 0.0128 CDC - TRUSTEE UBL STOCK ADVANTAGE FUND 2,191,900 0.6234 CDC - TRUSTEE ATLAS ISLAMIC STOCK FUND 480,000 0.1365 CDC - TRUSTEE AL-AMEEN SHARIAH STOCK FUND 2,490,500 0.7083 CDC - TRUSTEE NAFA STOCK FUND 2,421,000 0.6886 CDC - TRUSTEE NAFA MULTI ASSET FUND 330,700 0.0941 CDC - TRUSTEE ASKARI ASSET ALLOCATION FUND 35,000 0.0100 SAFE WAY FUND LIMITED 1,200,000 0.3413 CDC - TRUSTEE MEEZAN TAHAFFUZ PENSION FUND - EQUITY SUB FUND 168,500 0.0479 CDC - TRUSTEE APF-EQUITY SUB FUND 52,000 0.0148 CDC - TRUSTEE JS PENSION SAVINGS FUND - EQUITY ACCOUNT 124,400 0.0354 CDC - TRUSTEE ALFALAH GHP ISLAMIC STOCK FUND 2,038,700 0.5798 CDC - TRUSTEE HBL - STOCK FUND 1,169,200 0.3325 CDC - TRUSTEE NAFA ISLAMIC ASSET ALLOCATION FUND 2,286,100 0.6502 CDC - TRUSTEE APIF - EQUITY SUB FUND 80,000 0.0228 MC FSL TRUSTEE JS - INCOME FUND 60,000 0.0171 MC FSL - TRUSTEE JS GROWTH FUND 736,100 0.2094 CDC - TRUSTEE HBL MULTI - ASSET FUND 129,300 0.0368 CDC - TRUSTEE JS ISLAMIC PENSION SAVINGS FUND-EQUITY ACCOUNT 80,500 0.0229 CDC - TRUSTEE ALFALAH GHP STOCK FUND 516,300 0.1468 CDC - TRUSTEE ALFALAH GHP ALPHA FUND 308,000 0.0876 CDC - TRUSTEE NIT-EQUITY MARKET OPPORTUNITY FUND 2,377,841 0.6763 CDC - TRUSTEE ABL STOCK FUND 1,801,900 0.5125 M C F S L-TRUSTEE ASKARI ISLAMIC ASSET ALLOCATION FUND 28,000 0.0080
Information Under Listing Regulation No. 5.19.11 (X) of Pakistan Stock Exchange Limited Rule Book as on June 30, 2017
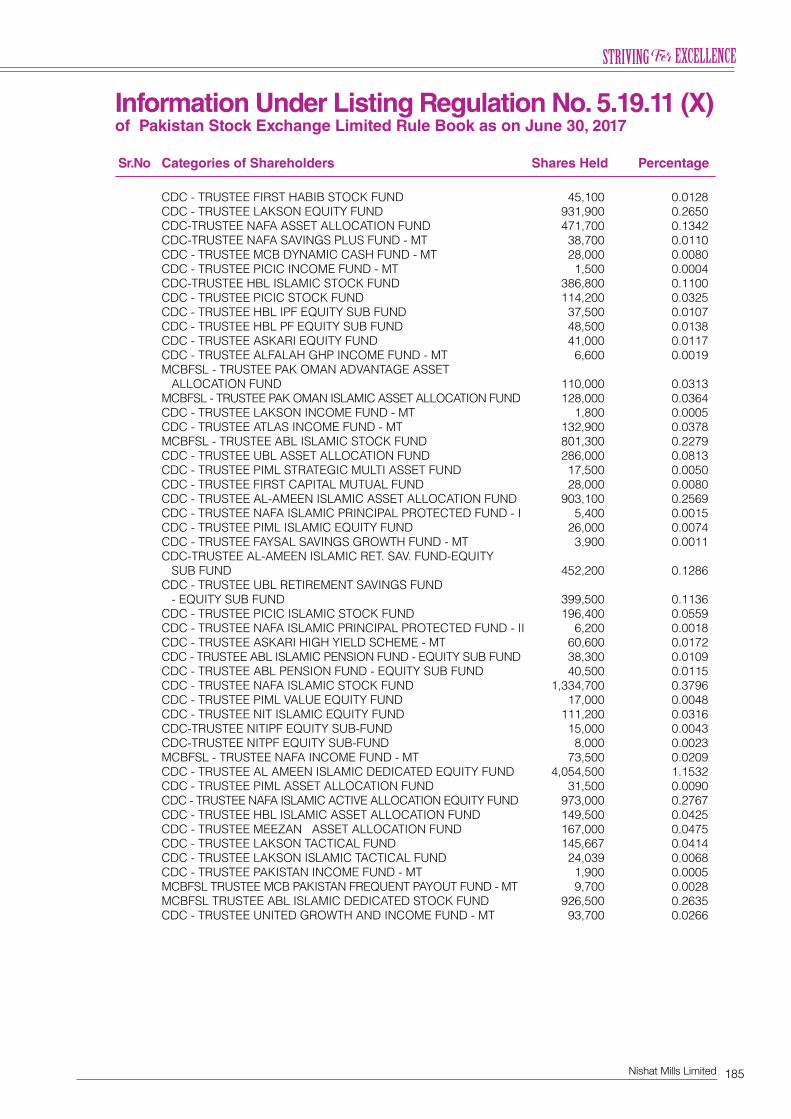
185Nishat Mills Limited
CDC - TRUSTEE FIRST HABIB STOCK FUND 45,100 0.0128 CDC - TRUSTEE LAKSON EQUITY FUND 931,900 0.2650 CDC-TRUSTEE NAFA ASSET ALLOCATION FUND 471,700 0.1342 CDC-TRUSTEE NAFA SAVINGS PLUS FUND - MT 38,700 0.0110 CDC - TRUSTEE MCB DYNAMIC CASH FUND - MT 28,000 0.0080 CDC - TRUSTEE PICIC INCOME FUND - MT 1,500 0.0004 CDC-TRUSTEE HBL ISLAMIC STOCK FUND 386,800 0.1100 CDC - TRUSTEE PICIC STOCK FUND 114,200 0.0325 CDC - TRUSTEE HBL IPF EQUITY SUB FUND 37,500 0.0107 CDC - TRUSTEE HBL PF EQUITY SUB FUND 48,500 0.0138 CDC - TRUSTEE ASKARI EQUITY FUND 41,000 0.0117 CDC - TRUSTEE ALFALAH GHP INCOME FUND - MT 6,600 0.0019 MCBFSL - TRUSTEE PAK OMAN ADVANTAGE ASSET ALLOCATION FUND 110,000 0.0313 MCBFSL - TRUSTEE PAK OMAN ISLAMIC ASSET ALLOCATION FUND 128,000 0.0364 CDC - TRUSTEE LAKSON INCOME FUND - MT 1,800 0.0005 CDC - TRUSTEE ATLAS INCOME FUND - MT 132,900 0.0378 MCBFSL - TRUSTEE ABL ISLAMIC STOCK FUND 801,300 0.2279 CDC - TRUSTEE UBL ASSET ALLOCATION FUND 286,000 0.0813 CDC - TRUSTEE PIML STRATEGIC MULTI ASSET FUND 17,500 0.0050 CDC - TRUSTEE FIRST CAPITAL MUTUAL FUND 28,000 0.0080 CDC - TRUSTEE AL-AMEEN ISLAMIC ASSET ALLOCATION FUND 903,100 0.2569 CDC - TRUSTEE NAFA ISLAMIC PRINCIPAL PROTECTED FUND - I 5,400 0.0015 CDC - TRUSTEE PIML ISLAMIC EQUITY FUND 26,000 0.0074 CDC - TRUSTEE FAYSAL SAVINGS GROWTH FUND - MT 3,900 0.0011 CDC-TRUSTEE AL-AMEEN ISLAMIC RET. SAV. FUND-EQUITY SUB FUND 452,200 0.1286 CDC - TRUSTEE UBL RETIREMENT SAVINGS FUND - EQUITY SUB FUND 399,500 0.1136 CDC - TRUSTEE PICIC ISLAMIC STOCK FUND 196,400 0.0559 CDC - TRUSTEE NAFA ISLAMIC PRINCIPAL PROTECTED FUND - II 6,200 0.0018 CDC - TRUSTEE ASKARI HIGH YIELD SCHEME - MT 60,600 0.0172 CDC - TRUSTEE ABL ISLAMIC PENSION FUND - EQUITY SUB FUND 38,300 0.0109 CDC - TRUSTEE ABL PENSION FUND - EQUITY SUB FUND 40,500 0.0115 CDC - TRUSTEE NAFA ISLAMIC STOCK FUND 1,334,700 0.3796 CDC - TRUSTEE PIML VALUE EQUITY FUND 17,000 0.0048 CDC - TRUSTEE NIT ISLAMIC EQUITY FUND 111,200 0.0316 CDC-TRUSTEE NITIPF EQUITY SUB-FUND 15,000 0.0043 CDC-TRUSTEE NITPF EQUITY SUB-FUND 8,000 0.0023 MCBFSL - TRUSTEE NAFA INCOME FUND - MT 73,500 0.0209 CDC - TRUSTEE AL AMEEN ISLAMIC DEDICATED EQUITY FUND 4,054,500 1.1532 CDC - TRUSTEE PIML ASSET ALLOCATION FUND 31,500 0.0090 CDC - TRUSTEE NAFA ISLAMIC ACTIVE ALLOCATION EQUITY FUND 973,000 0.2767 CDC - TRUSTEE HBL ISLAMIC ASSET ALLOCATION FUND 149,500 0.0425 CDC - TRUSTEE MEEZAN ASSET ALLOCATION FUND 167,000 0.0475 CDC - TRUSTEE LAKSON TACTICAL FUND 145,667 0.0414 CDC - TRUSTEE LAKSON ISLAMIC TACTICAL FUND 24,039 0.0068 CDC - TRUSTEE PAKISTAN INCOME FUND - MT 1,900 0.0005 MCBFSL TRUSTEE MCB PAKISTAN FREQUENT PAYOUT FUND - MT 9,700 0.0028 MCBFSL TRUSTEE ABL ISLAMIC DEDICATED STOCK FUND 926,500 0.2635 CDC - TRUSTEE UNITED GROWTH AND INCOME FUND - MT 93,700 0.0266
Sr.No Categories of Shareholders Shares Held Percentage
Information Under Listing Regulation No. 5.19.11 (X) of Pakistan Stock Exchange Limited Rule Book as on June 30, 2017
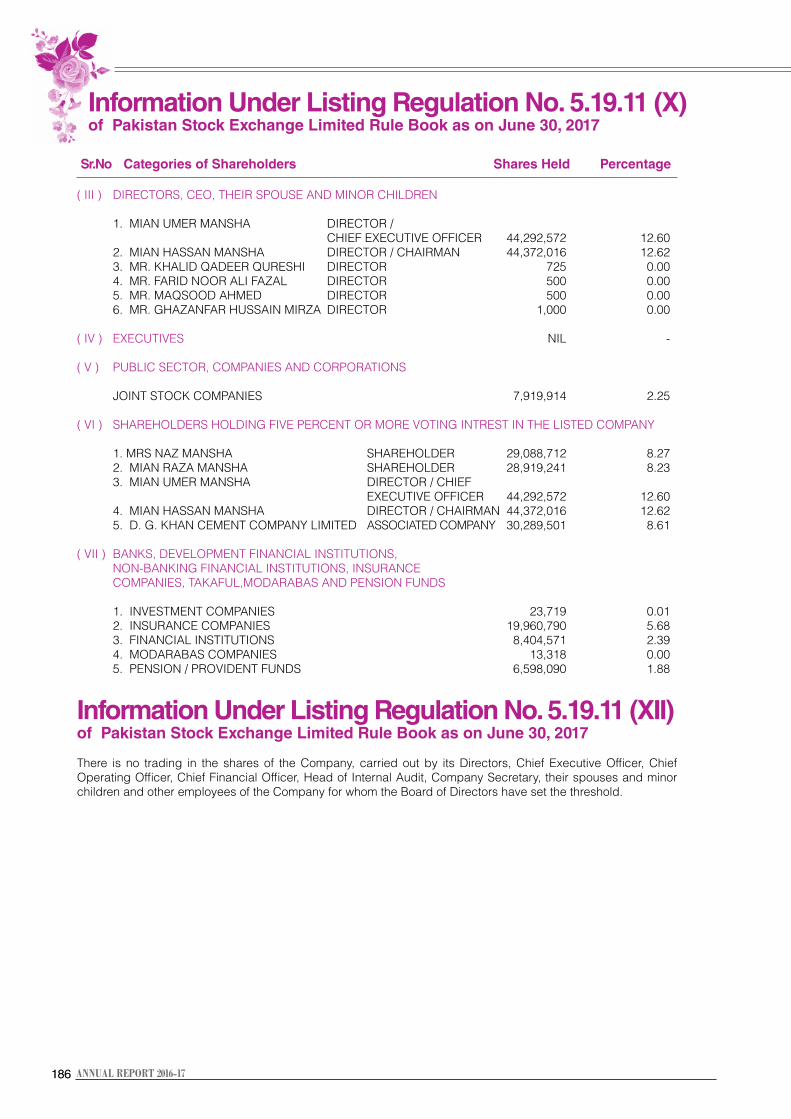
186186 ANNUAL REPORT 2016-17
( III ) DIRECTORS, CEO, THEIR SPOUSE AND MINOR CHILDREN 1. MIAN UMER MANSHA DIRECTOR / CHIEF EXECUTIVE OFFICER 44,292,572 12.60 2. MIAN HASSAN MANSHA DIRECTOR / CHAIRMAN 44,372,016 12.62 3. MR. KHALID QADEER QURESHI DIRECTOR 725 0.00 4. MR. FARID NOOR ALI FAZAL DIRECTOR 500 0.00 5. MR. MAQSOOD AHMED DIRECTOR 500 0.00 6. MR. GHAZANFAR HUSSAIN MIRZA DIRECTOR 1,000 0.00 ( IV ) EXECUTIVES NIL - ( V ) PUBLIC SECTOR, COMPANIES AND CORPORATIONS
JOINT STOCK COMPANIES 7,919,914 2.25 ( VI ) SHAREHOLDERS HOLDING FIVE PERCENT OR MORE VOTING INTREST IN THE LISTED COMPANY
1. MRS NAZ MANSHA SHAREHOLDER 29,088,712 8.27 2. MIAN RAZA MANSHA SHAREHOLDER 28,919,241 8.23 3. MIAN UMER MANSHA DIRECTOR / CHIEF EXECUTIVE OFFICER 44,292,572 12.60 4. MIAN HASSAN MANSHA DIRECTOR / CHAIRMAN 44,372,016 12.62 5. D. G. KHAN CEMENT COMPANY LIMITED ASSOCIATED COMPANY 30,289,501 8.61 ( VII ) BANKS, DEVELOPMENT FINANCIAL INSTITUTIONS,
NON-BANKING FINANCIAL INSTITUTIONS, INSURANCE COMPANIES, TAKAFUL,MODARABAS AND PENSION FUNDS
1. INVESTMENT COMPANIES 23,719 0.01 2. INSURANCE COMPANIES 19,960,790 5.68 3. FINANCIAL INSTITUTIONS 8,404,571 2.39 4. MODARABAS COMPANIES 13,318 0.00 5. PENSION / PROVIDENT FUNDS 6,598,090 1.88
Information Under Listing Regulation No. 5.19.11 (XII) of Pakistan Stock Exchange Limited Rule Book as on June 30, 2017 There is no trading in the shares of the Company, carried out by its Directors, Chief Executive Officer, Chief Operating Officer, Chief Financial Officer, Head of Internal Audit, Company Secretary, their spouses and minor children and other employees of the Company for whom the Board of Directors have set the threshold.
Sr.No Categories of Shareholders Shares Held Percentage
Information Under Listing Regulation No. 5.19.11 (X) of Pakistan Stock Exchange Limited Rule Book as on June 30, 2017
187Nishat Mills Limited and its Subsidiaries
188188 ANNUAL REPORT 2016-17
189Nishat Mills Limited
190190 ANNUAL REPORT 2016-17
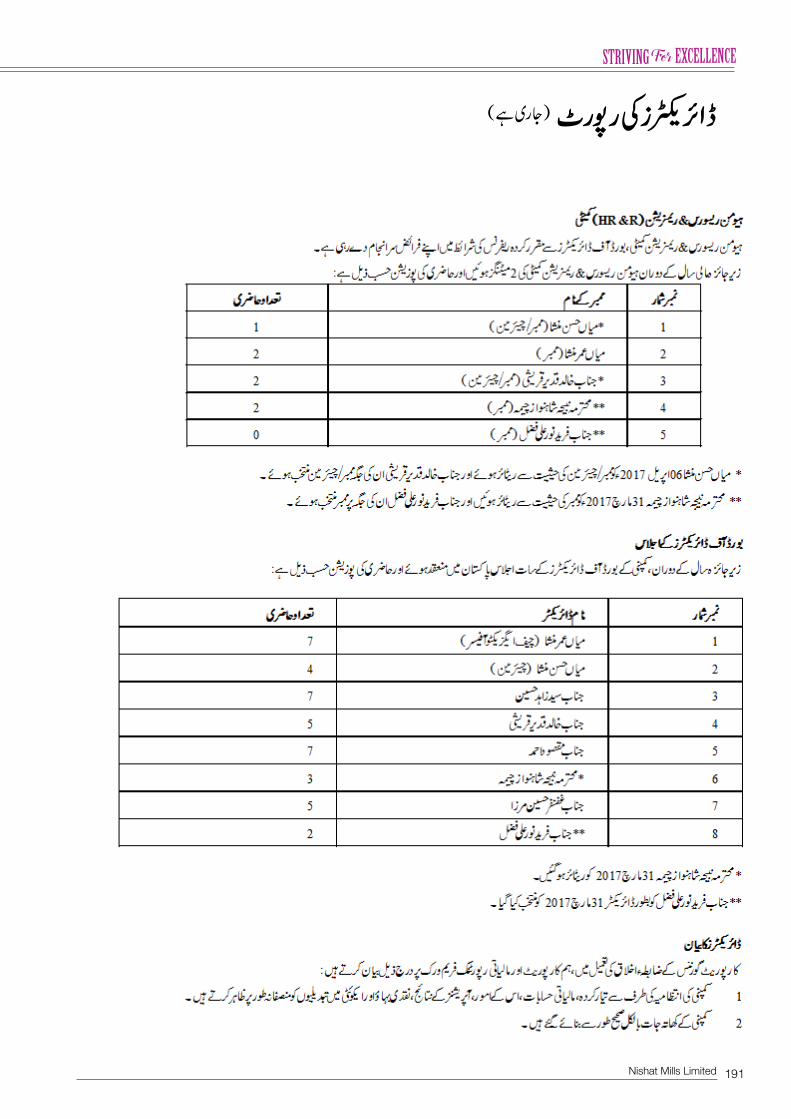
191Nishat Mills Limited
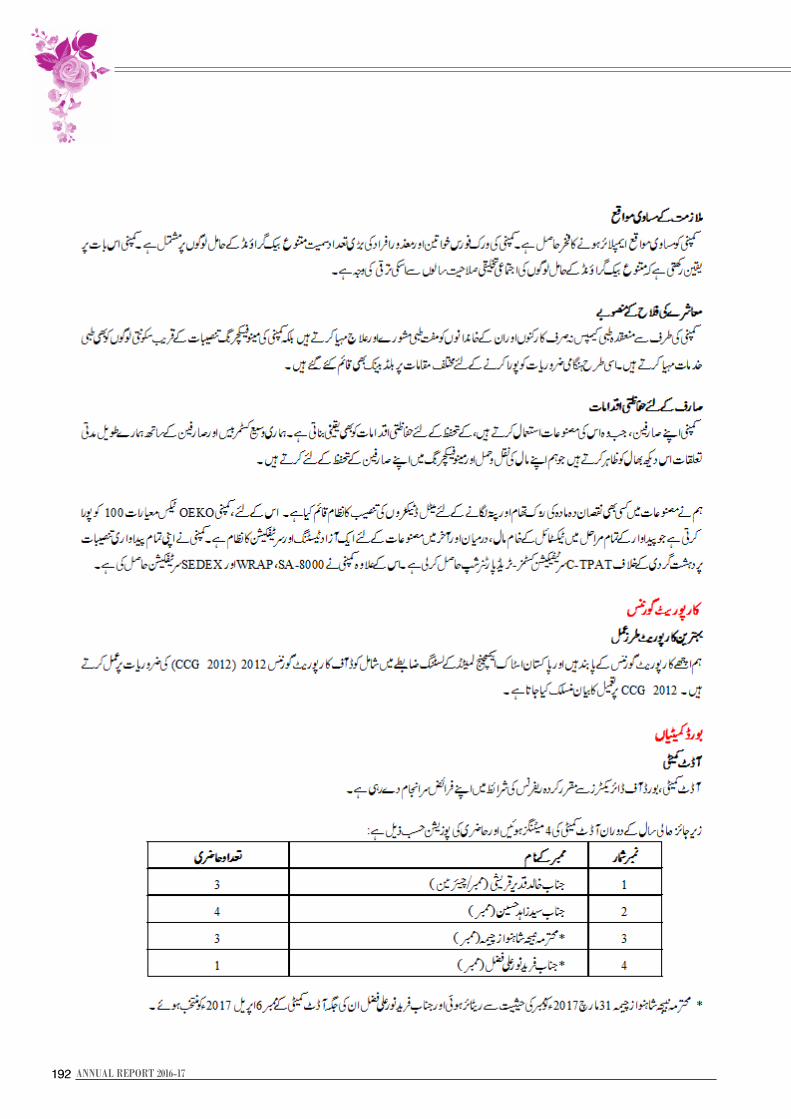
192192 ANNUAL REPORT 2016-17
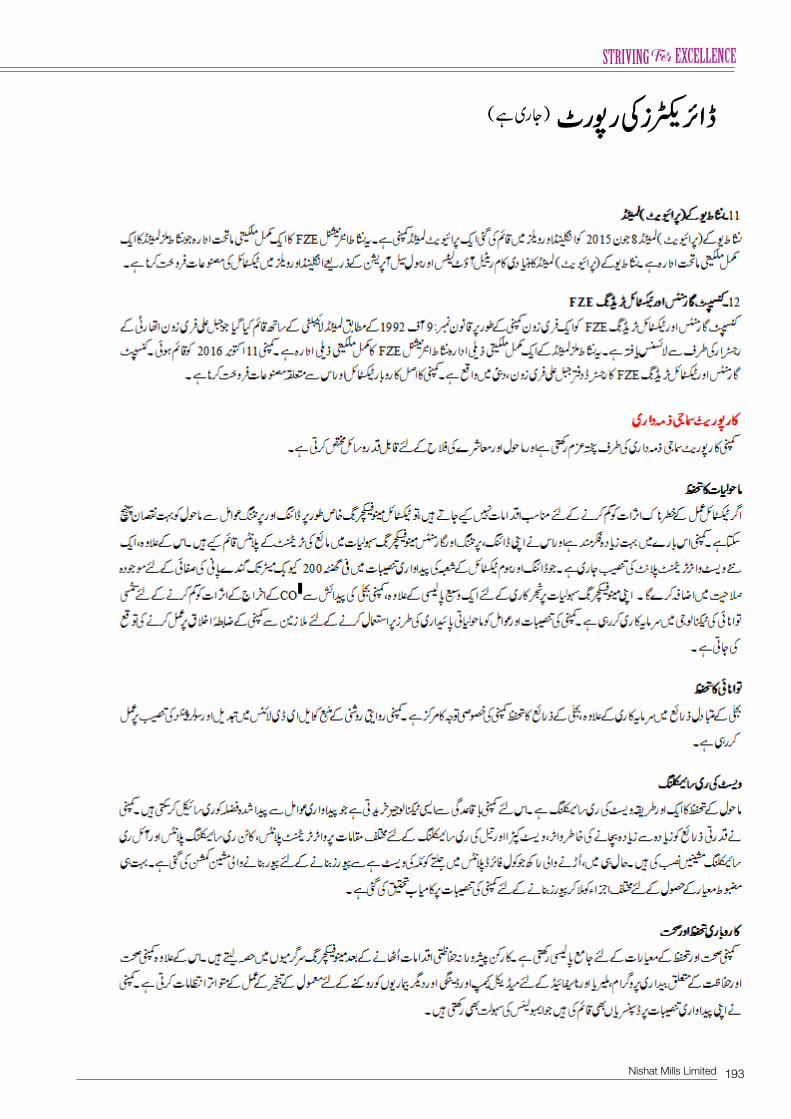
193Nishat Mills Limited
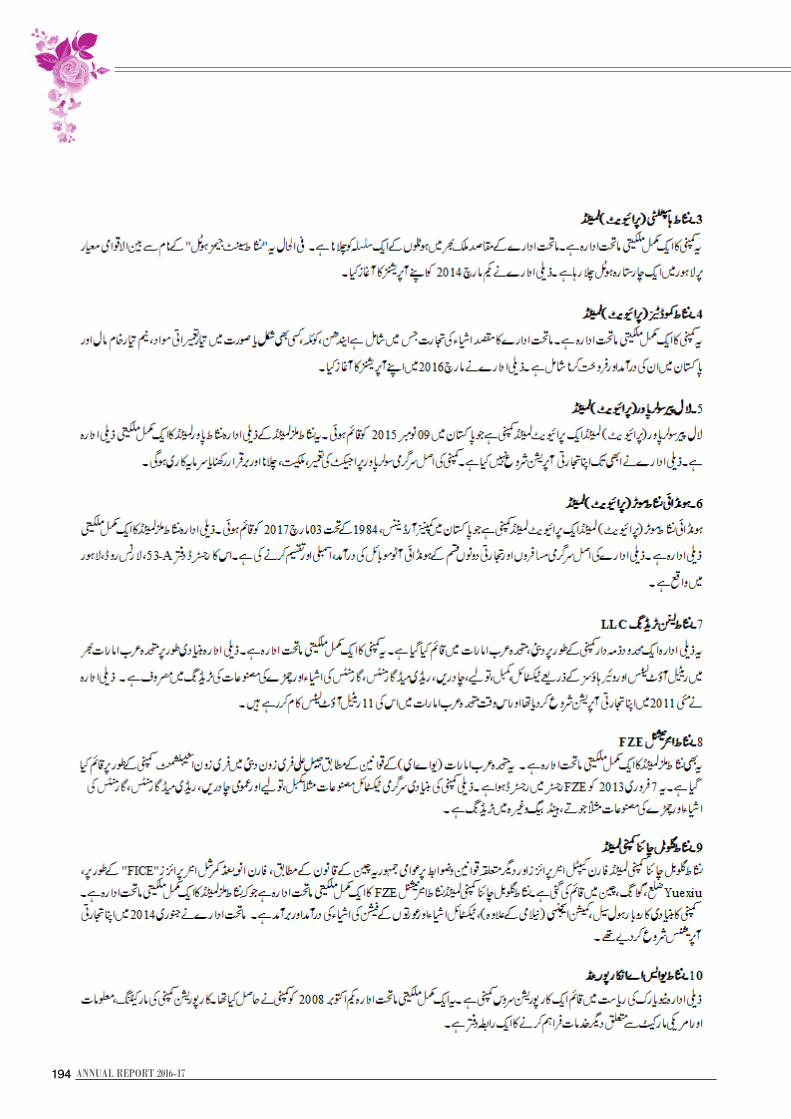
194194 ANNUAL REPORT 2016-17
195Nishat Mills Limited
196196 ANNUAL REPORT 2016-17
197Nishat Mills Limited
198198 ANNUAL REPORT 2016-17
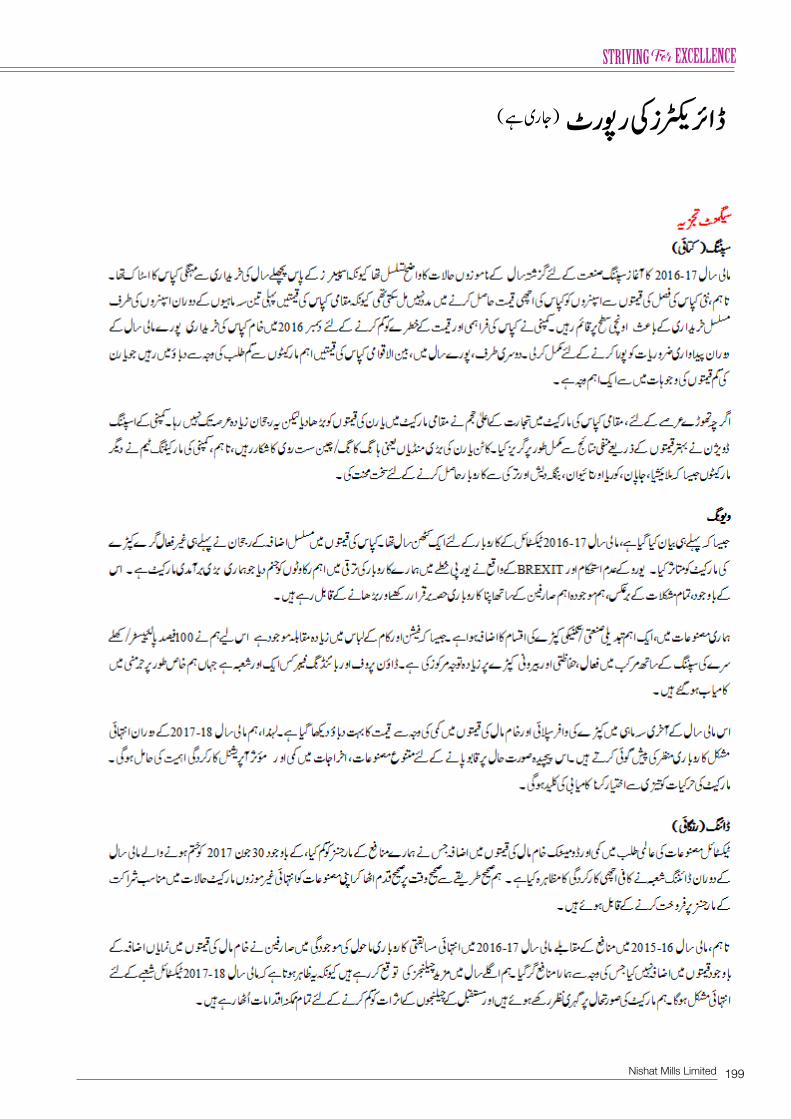
199Nishat Mills Limited

200200 ANNUAL REPORT 2016-17
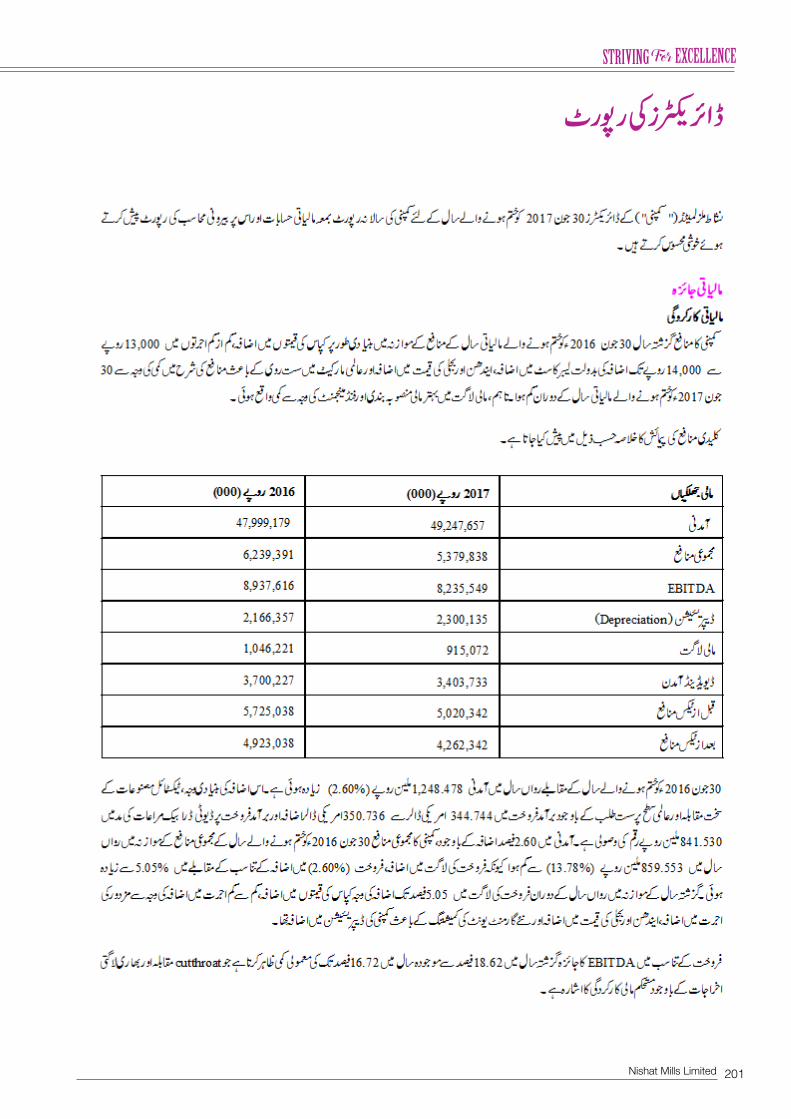
201Nishat Mills Limited

202202
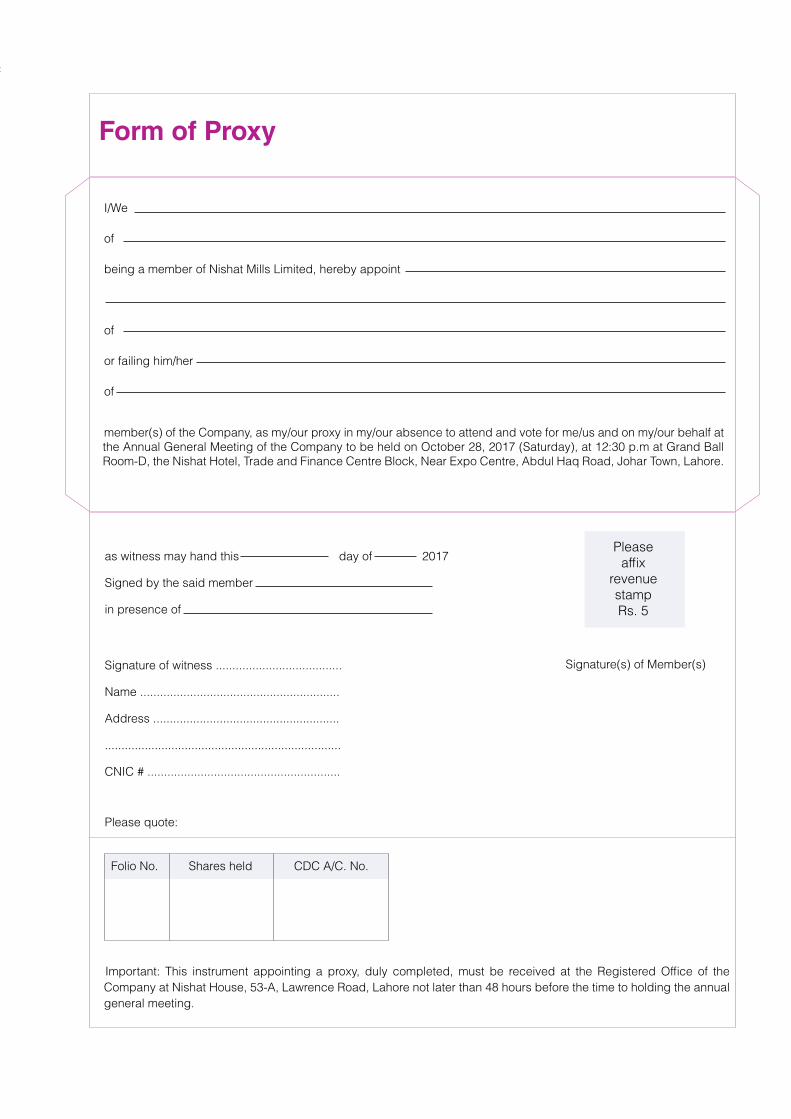
I/We
of
being a member of Nishat Mills Limited, hereby appoint
of
or failing him/her
of
member(s) of the Company, as my/our proxy in my/our absence to attend and vote for me/us and on my/our behalf at the Annual General Meeting of the Company to be held on October 28, 2017 (Saturday), at 12:30 p.m at Grand Ball Room-D, the Nishat Hotel, Trade and Finance Centre Block, Near Expo Centre, Abdul Haq Road, Johar Town, Lahore.
as witness may hand this day of 2017
Signed by the said member
in presence of
Signature of witness ......................................
Name ............................................................
Address ........................................................
.......................................................................
CNIC # ..........................................................
Please quote:
Pleaseaffix
revenuestampRs. 5
Signature(s) of Member(s)
Folio No. Shares held CDC A/C. No.
Important: This instrument appointing a proxy, duly completed, must be received at the Registered Office of the Company at Nishat House, 53-A, Lawrence Road, Lahore not later than 48 hours before the time to holding the annual general meeting.
Form of Proxy
The Company Secretary
nishat Mills liMitedNishat House,53 - A, Lawrence Road, Lahore.Tel: 042 - 36360154UAN: 042 - 111 113 333
aFFiXCORReCtPOstaGe
The Company Secretary
nishat Mills liMitedNishat House,53 - A, Lawrence Road, Lahore.Tel: 042 - 36360154UAN: 042 - 111 113 333
aFFiXCORReCtPOstaGe