
Mirko Lorenz Data Driven Journalism Overview Seminar Ordine dei Giornalisti del Veneto European...
85
A DEEPER LOOK FOR BETTER STORIES DATA DRIVEN JOURNALISM SEMINAR ORDINE DEI GIORNALISTA • VENEZIA 2015 • EUROPEAN JOURNALISM CENTER
-
Upload
massimiliano-crosato -
Category
Data & Analytics
-
view
93 -
download
1
Transcript of Mirko Lorenz Data Driven Journalism Overview Seminar Ordine dei Giornalisti del Veneto European...

A D E E P E R L O O K F O R B E T T E R S T O R I E S
D A TA D R I V E N J O U R N A L I S M S E M I N A RO R D I N E D E I G I O R N A L I S TA • V E N E Z I A 2 0 1 5 • E U R O P E A N J O U R N A L I S M C E N T E R
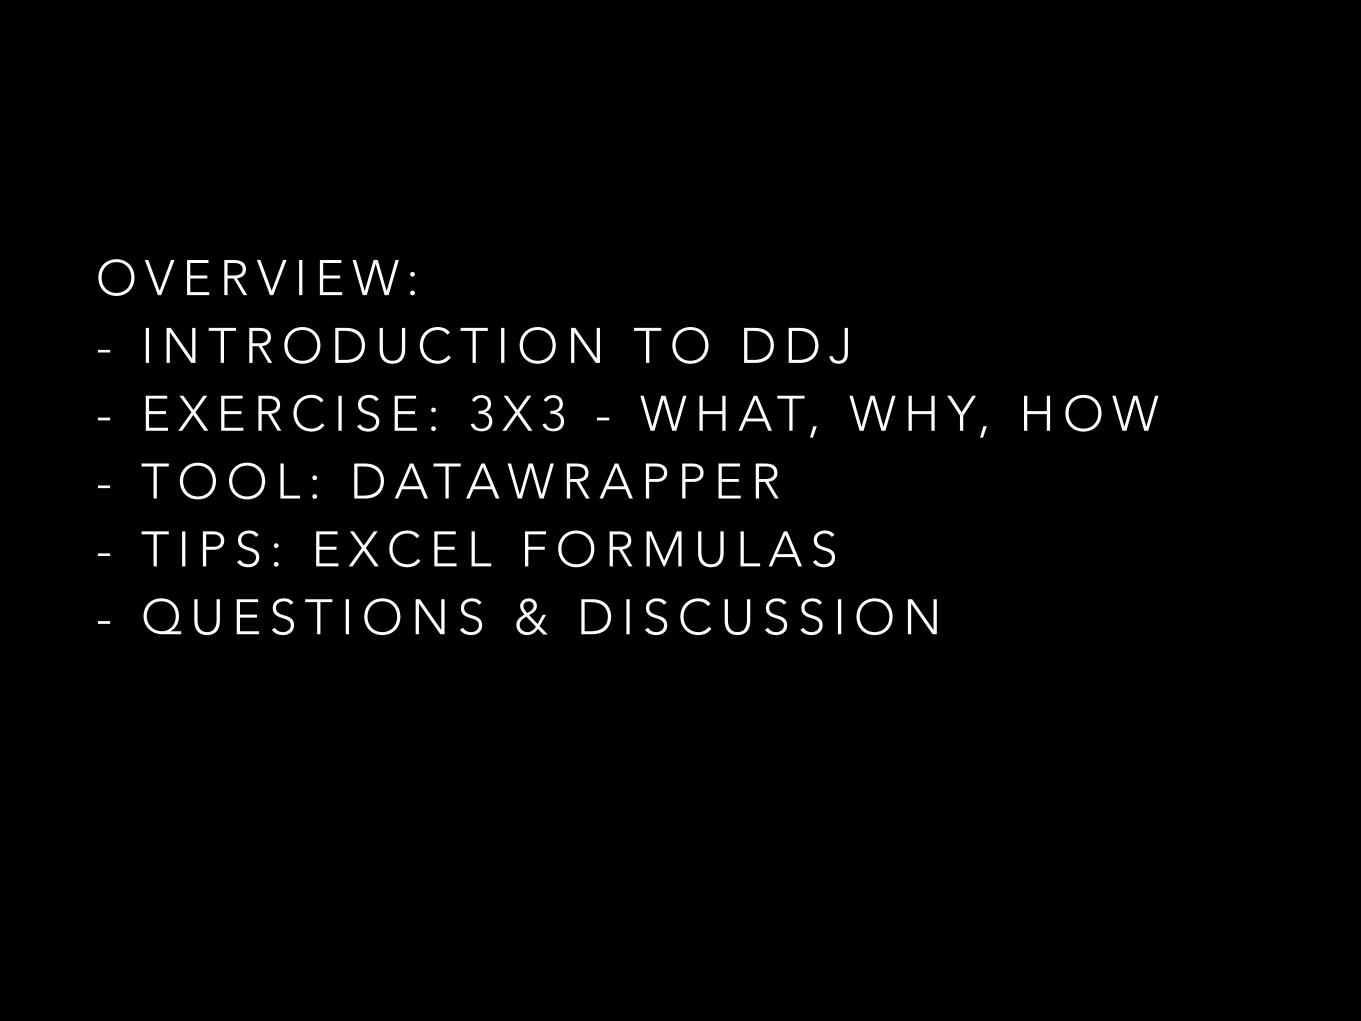
O V E R V I E W : - I N T R O D U C T I O N T O D D J - E X E R C I S E : 3 X 3 - W H AT, W H Y, H O W - T O O L : D ATA W R A P P E R - T I P S : E X C E L F O R M U L A S - Q U E S T I O N S & D I S C U S S I O N

@ M I R K O L O R E N ZJ O U R N A L I S T / I N F O R M AT I O N A R C H I T E C T F O C U S : C R O S S M E D I A / D ATA - D R I V E N J O U R N A L I S M D ATA W R A P P E R D ATA D R I V E N J O U R N A L I S M . N E T D E U T S C H E W E L L E I N N O VAT I O N T E A M
Brief introduction

B I G D ATA S M A L L D ATAR E L E VA N T D ATA

W H AT I S D ATA - D R I V E N J O U R N A L I S M ?
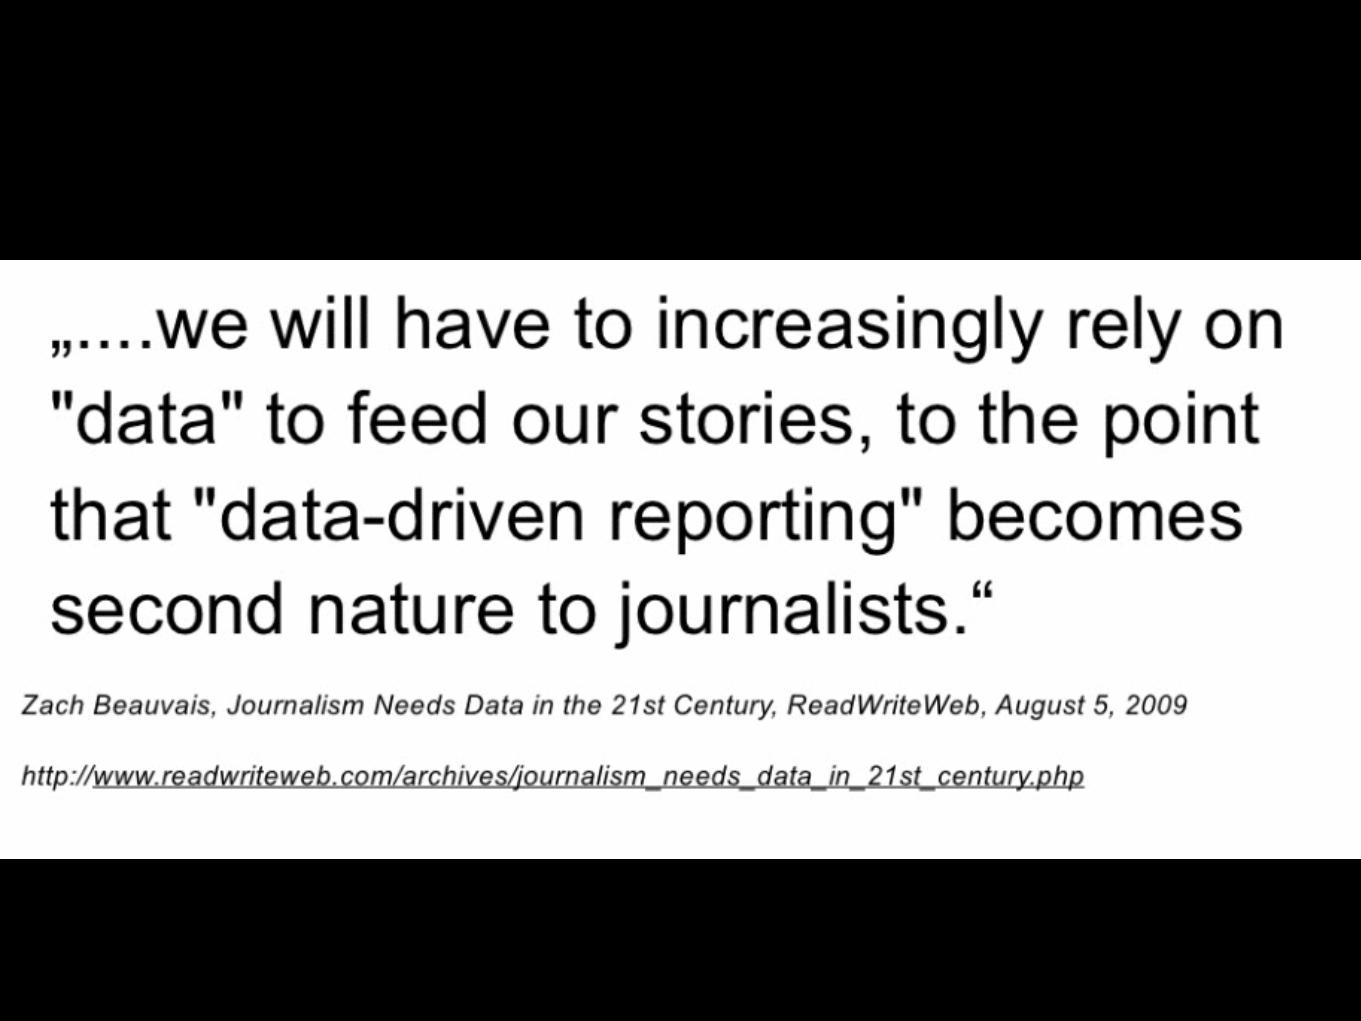

DEF: DATA-DRIVEN JOURNALISM = WORKFLOW
‣ Tasks are to collect, clean, visualize and report‣ Data-driven journalism is a process

Data is a new camera (Replace as many stock photos with charts as you can)
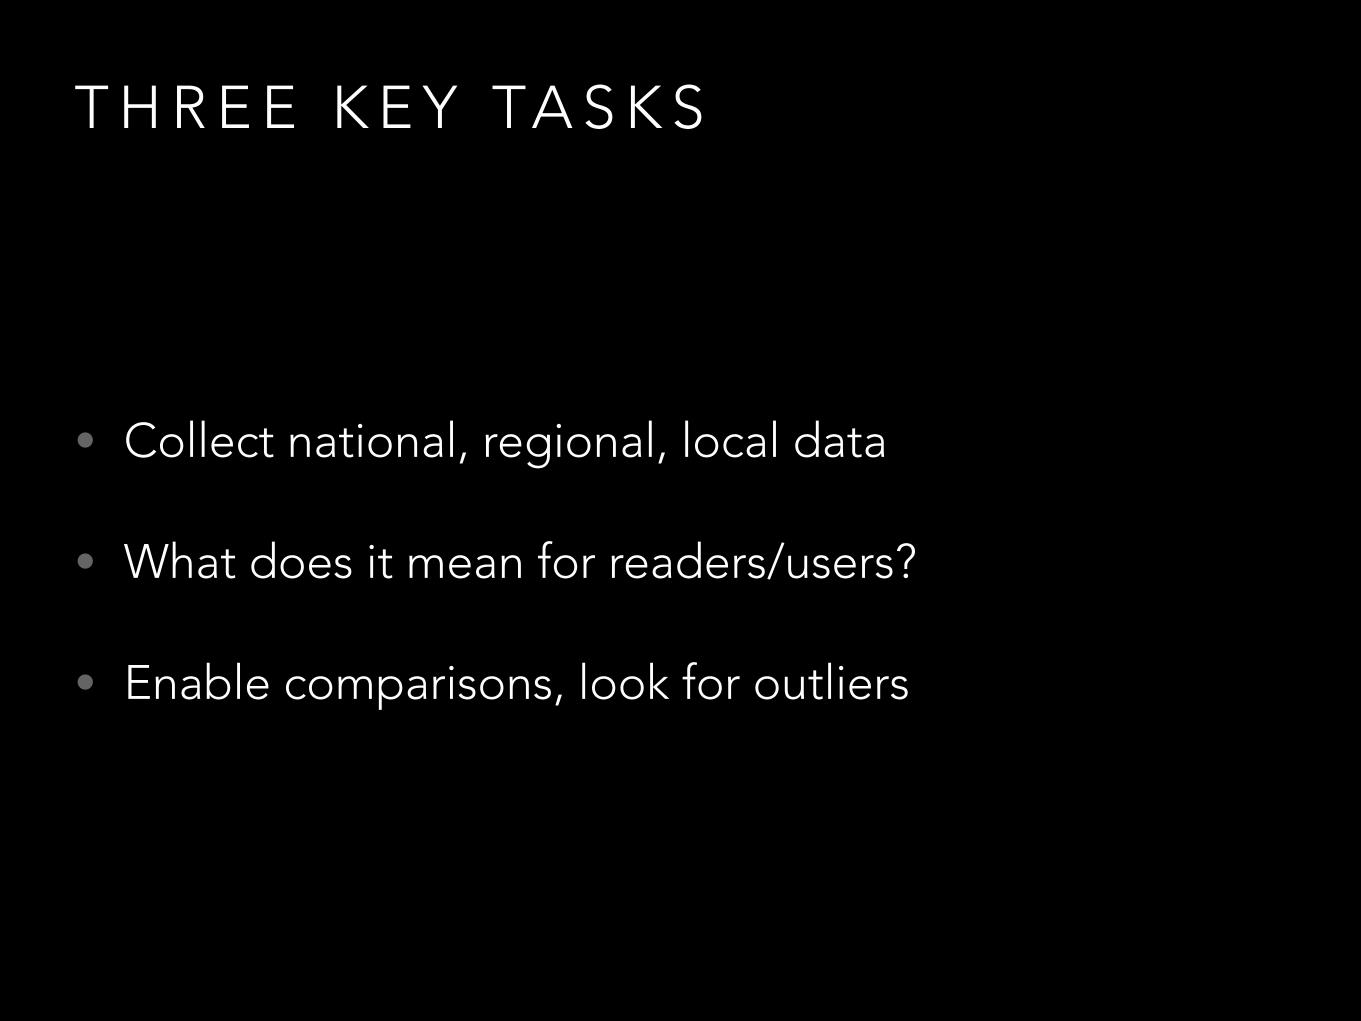
T H R E E K E Y TA S K S
• Collect national, regional, local data
• What does it mean for readers/users?
• Enable comparisons, look for outliers

S E E : W I K I P E D I A „ D ATA - D R I V E N J O U R N A L I S M “
data-driven journalism
S E E : D ATA J O U R N A L I S M H A N D B O O K ( F R E E )
Tipp: #ddj (Twitter)
#ddj examples
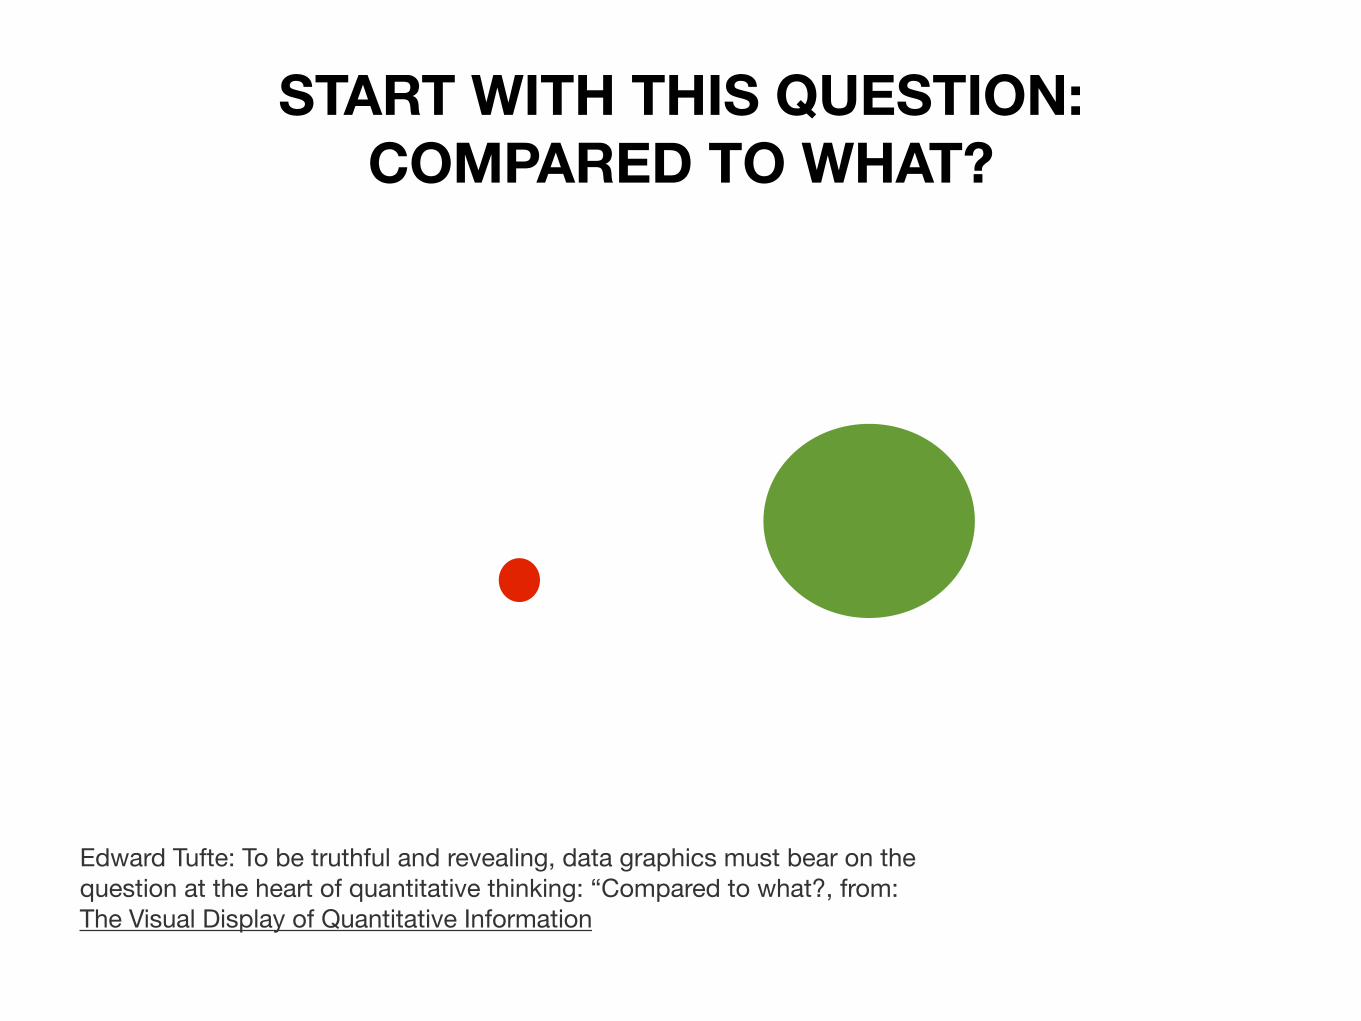
Edward Tufte: To be truthful and revealing, data graphics must bear on thequestion at the heart of quantitative thinking: “Compared to what?, from: The Visual Display of Quantitative Information
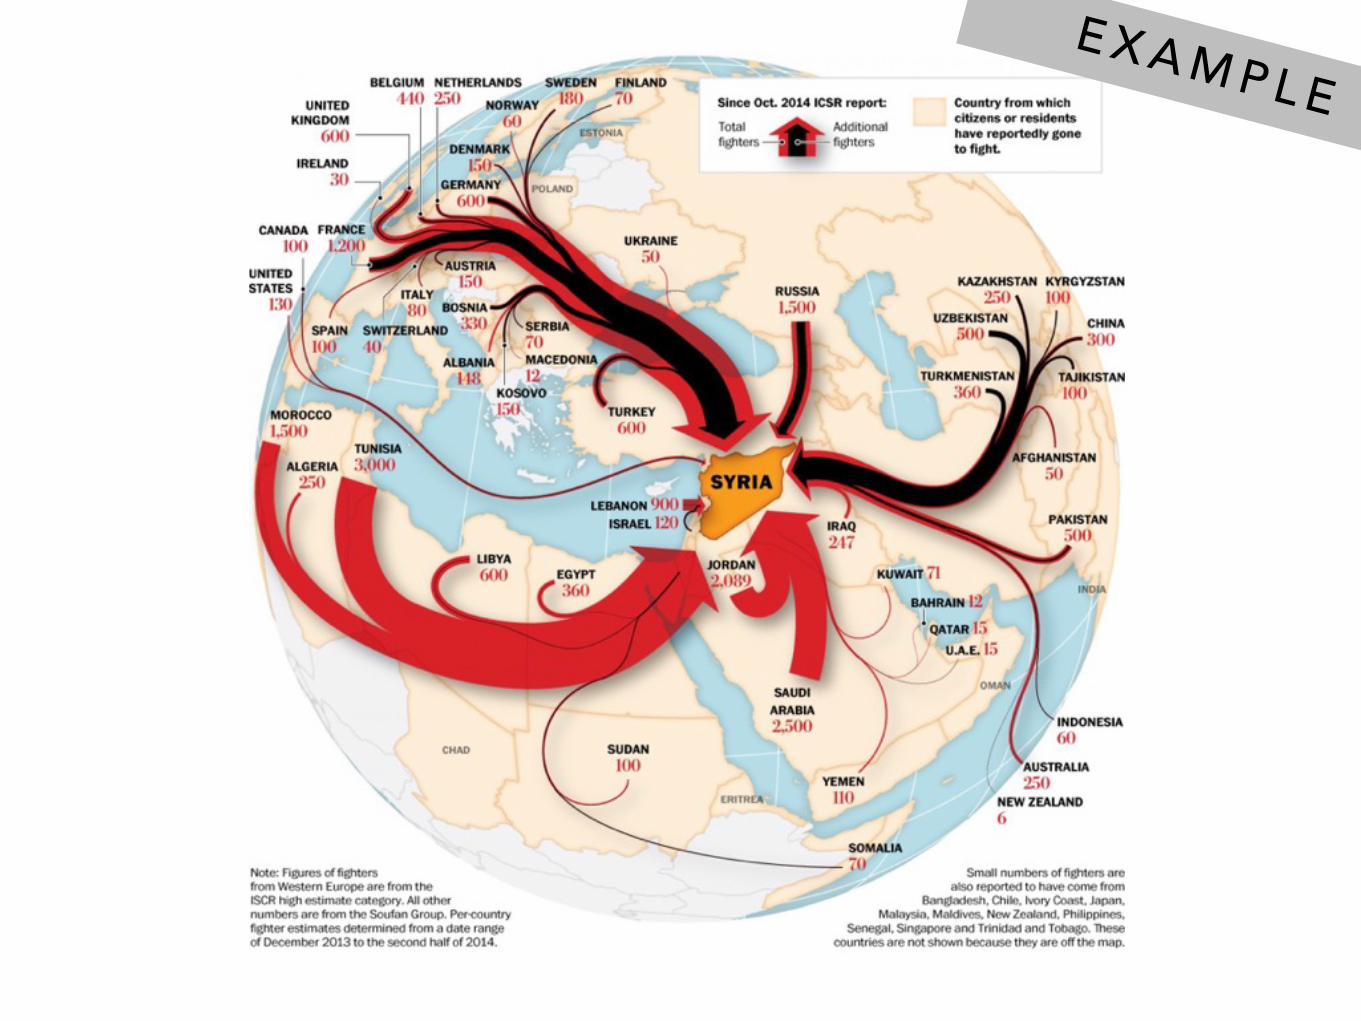
START WITH THIS QUESTION:COMPARED TO WHAT?
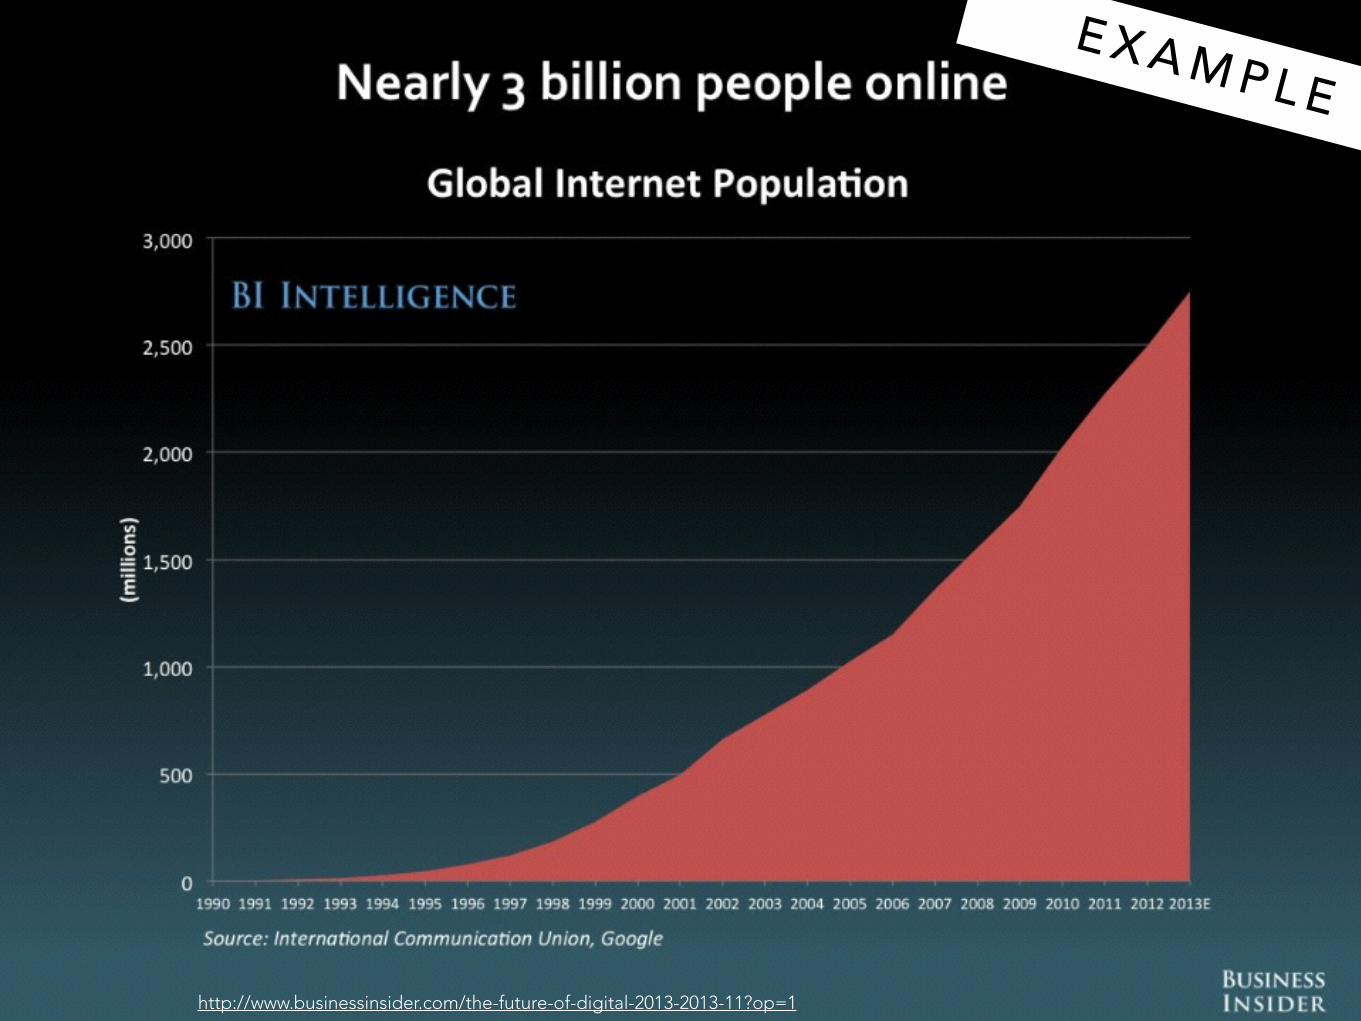
http://www.businessinsider.com/the-future-of-digital-2013-2013-11?op=1
E X A M P L E

E X A M P L E
E X A M P L E
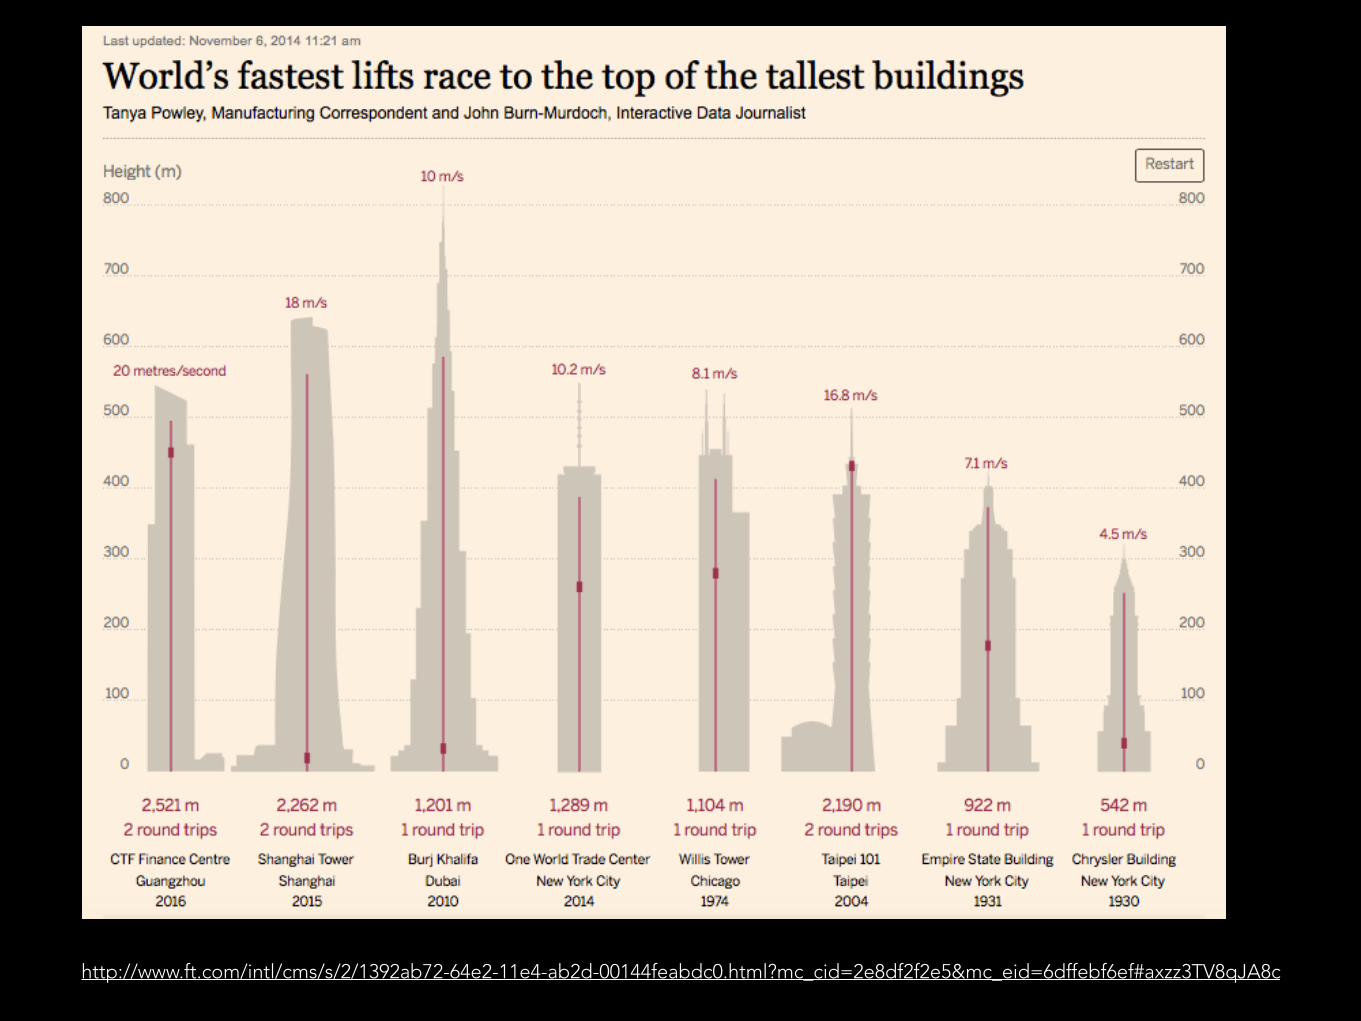
http://www.ft.com/intl/cms/s/2/1392ab72-64e2-11e4-ab2d-00144feabdc0.html?mc_cid=2e8df2f2e5&mc_eid=6dffebf6ef#axzz3TV8qJA8c
W H Y D ATA - D R I V E N J O U R N A L I S M ?
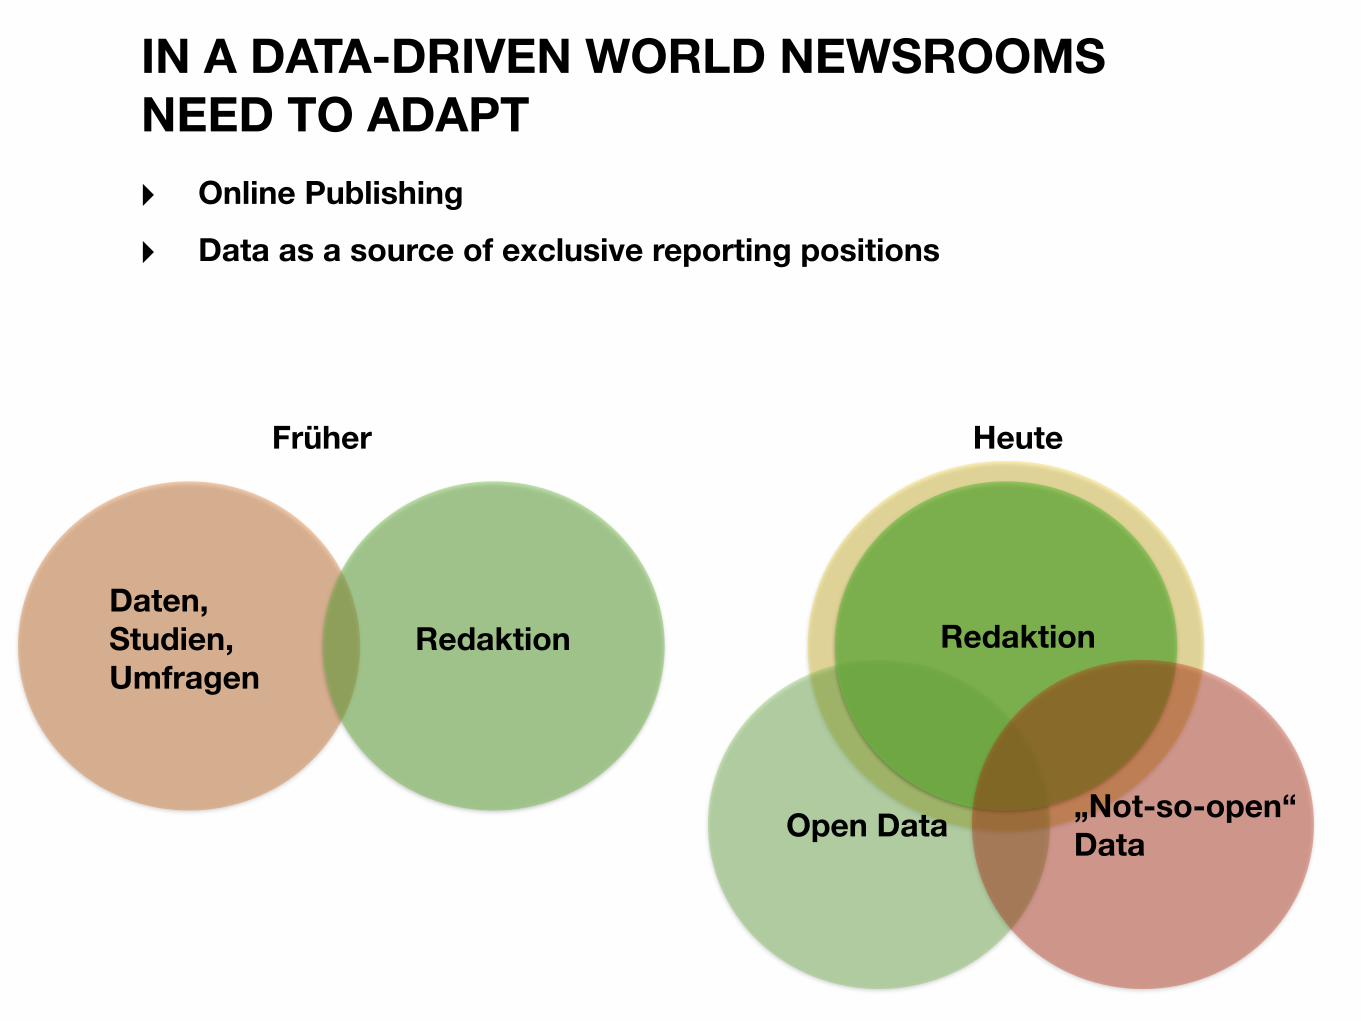
IN A DATA-DRIVEN WORLD NEWSROOMS NEED TO ADAPT‣ Online Publishing
‣ Data as a source of exclusive reporting positions
Früher
Daten, Studien,Umfragen
Redaktion
Heute
Redaktion
Open Data „Not-so-open“Data
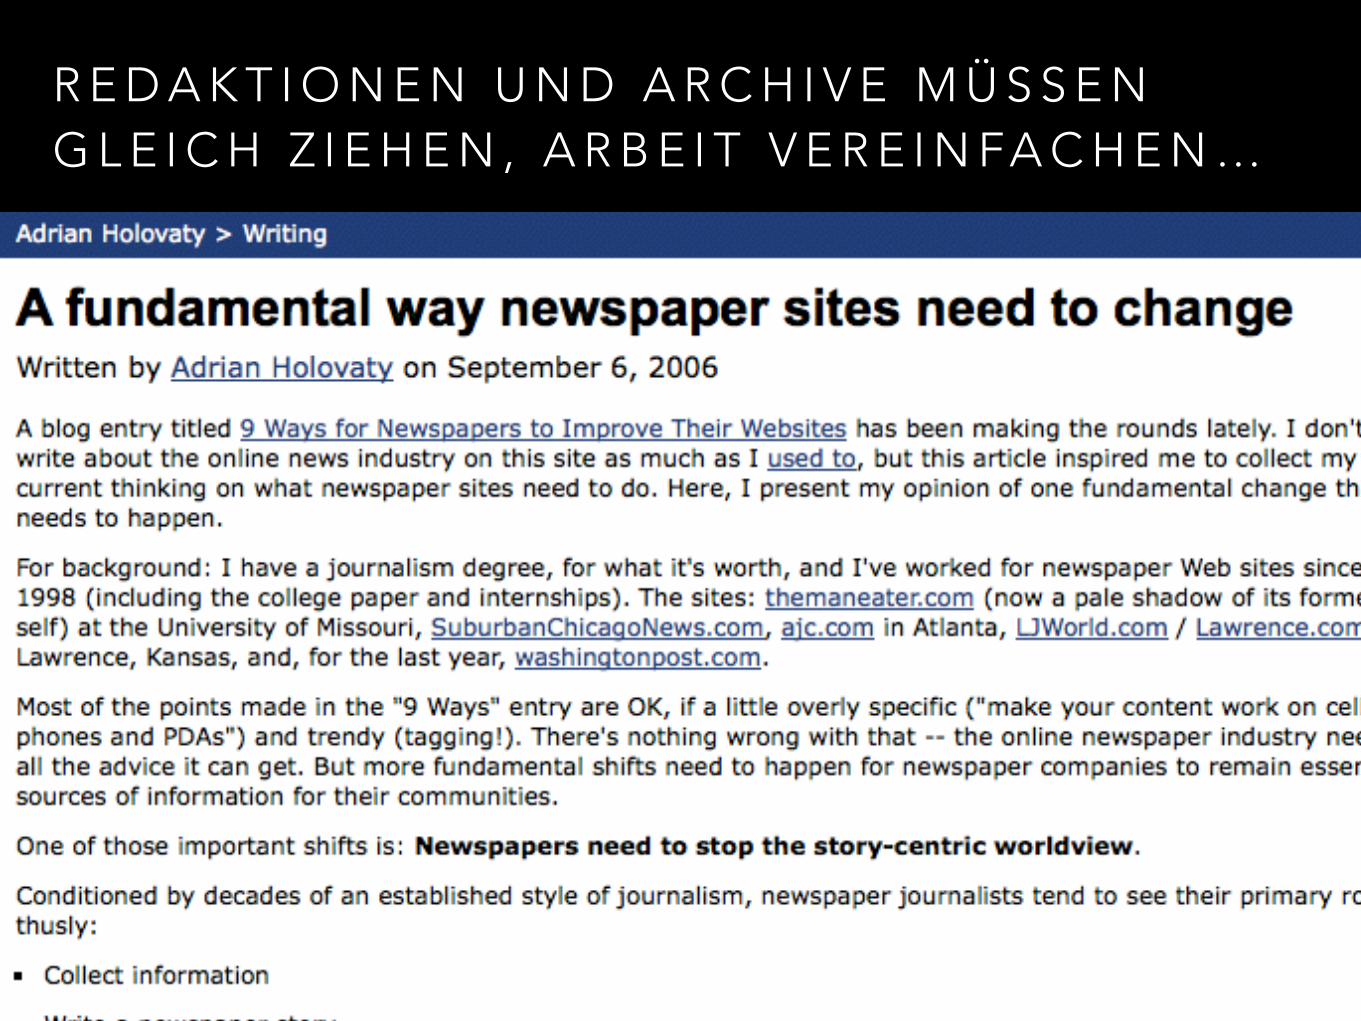
R E D A K T I O N E N U N D A R C H I V E M Ü S S E N G L E I C H Z I E H E N , A R B E I T V E R E I N FA C H E N …

Q U E L L E : V I S U A L LY - H T T P S : / / W W W. Y O U T U B E . C O M / WAT C H ? V = A I V K F N E R B P Q

Q U E L L E : V I S U A L LY - H T T P S : / / W W W. Y O U T U B E . C O M / WAT C H ? V = A I V K F N E R B P Q

A LIST OF REASONS FOR DATA-DRIVEN WORK:
‣ Help our readers to make important decisions in life:
Election, Economy, Education/Profession, Real Estate, Retirement, Health
‣ Users expect competent support and guidance
‣ Investivative projects to tackle corruption and big issues
‣ Chance to build a unique regional reporting position
‣ Services for trust and decision making to complement reporting
‣ Outlook: From Attention to Trust

BIG OPPORTUNITIES
Let people search less
Reduce the time they need to search
Help to make decisions
Detect big changes/issues earlier
Be part of trust economy
A R E A S O F A P P L I C AT I O NT E L L I N G S T O R I E S B A S E D O N D ATA
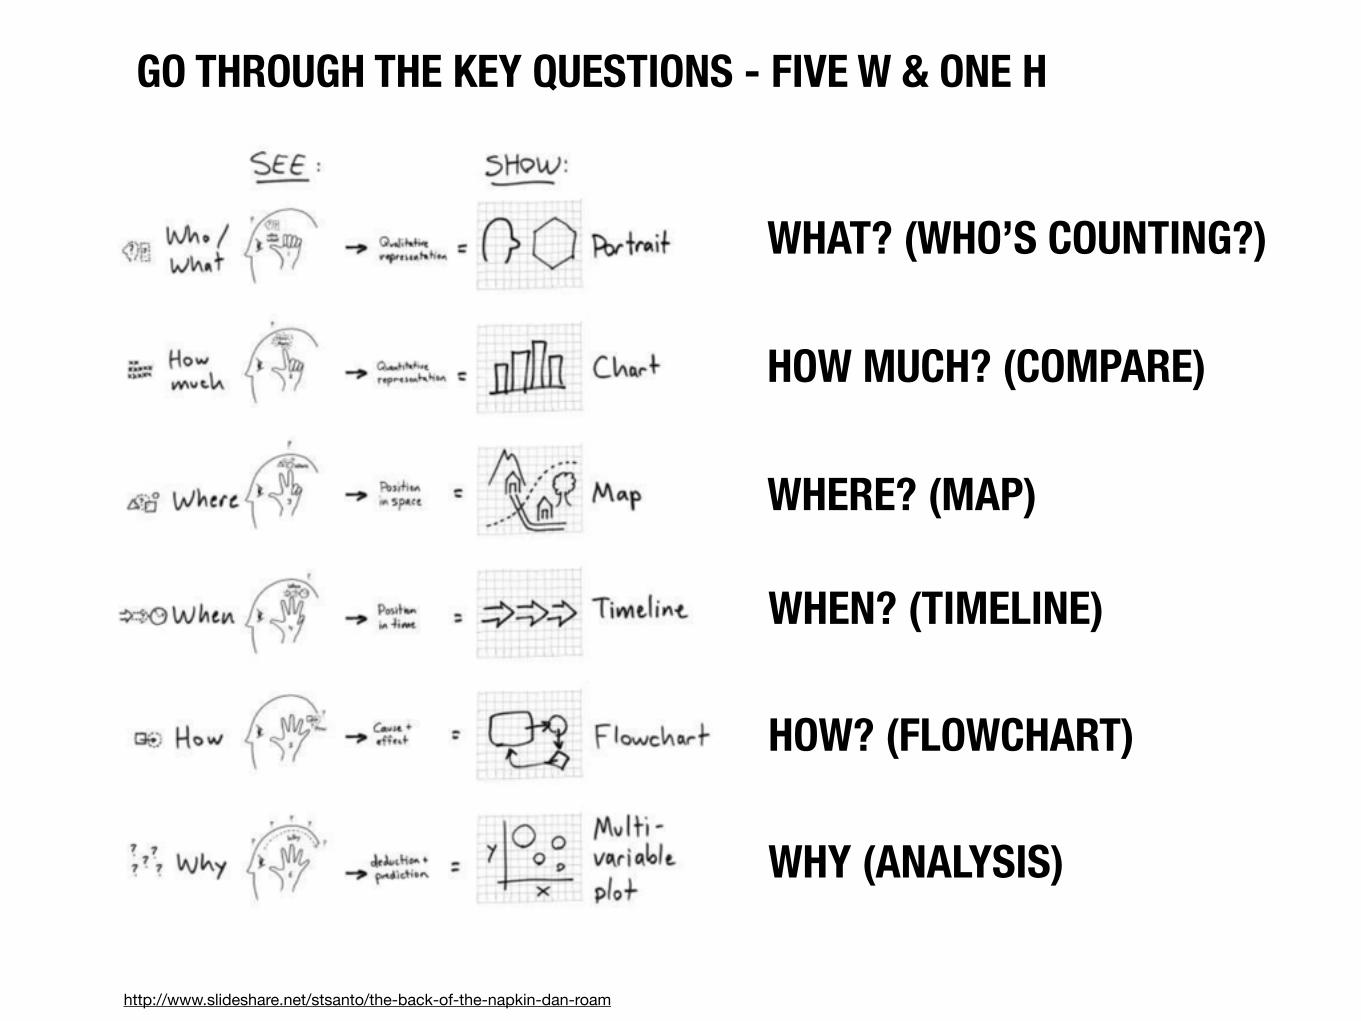
GO THROUGH THE KEY QUESTIONS - FIVE W & ONE H
http://www.slideshare.net/stsanto/the-back-of-the-napkin-dan-roam
WHAT? (WHO’S COUNTING?)
HOW MUCH? (COMPARE)
WHERE? (MAP)
WHEN? (TIMELINE)
HOW? (FLOWCHART)
WHY (ANALYSIS)

– C H R I S T I A N B A U E R
„Zitat hier eingeben.“
D ATA R E S E A R C H L E A D T O T H I S S T O R Y
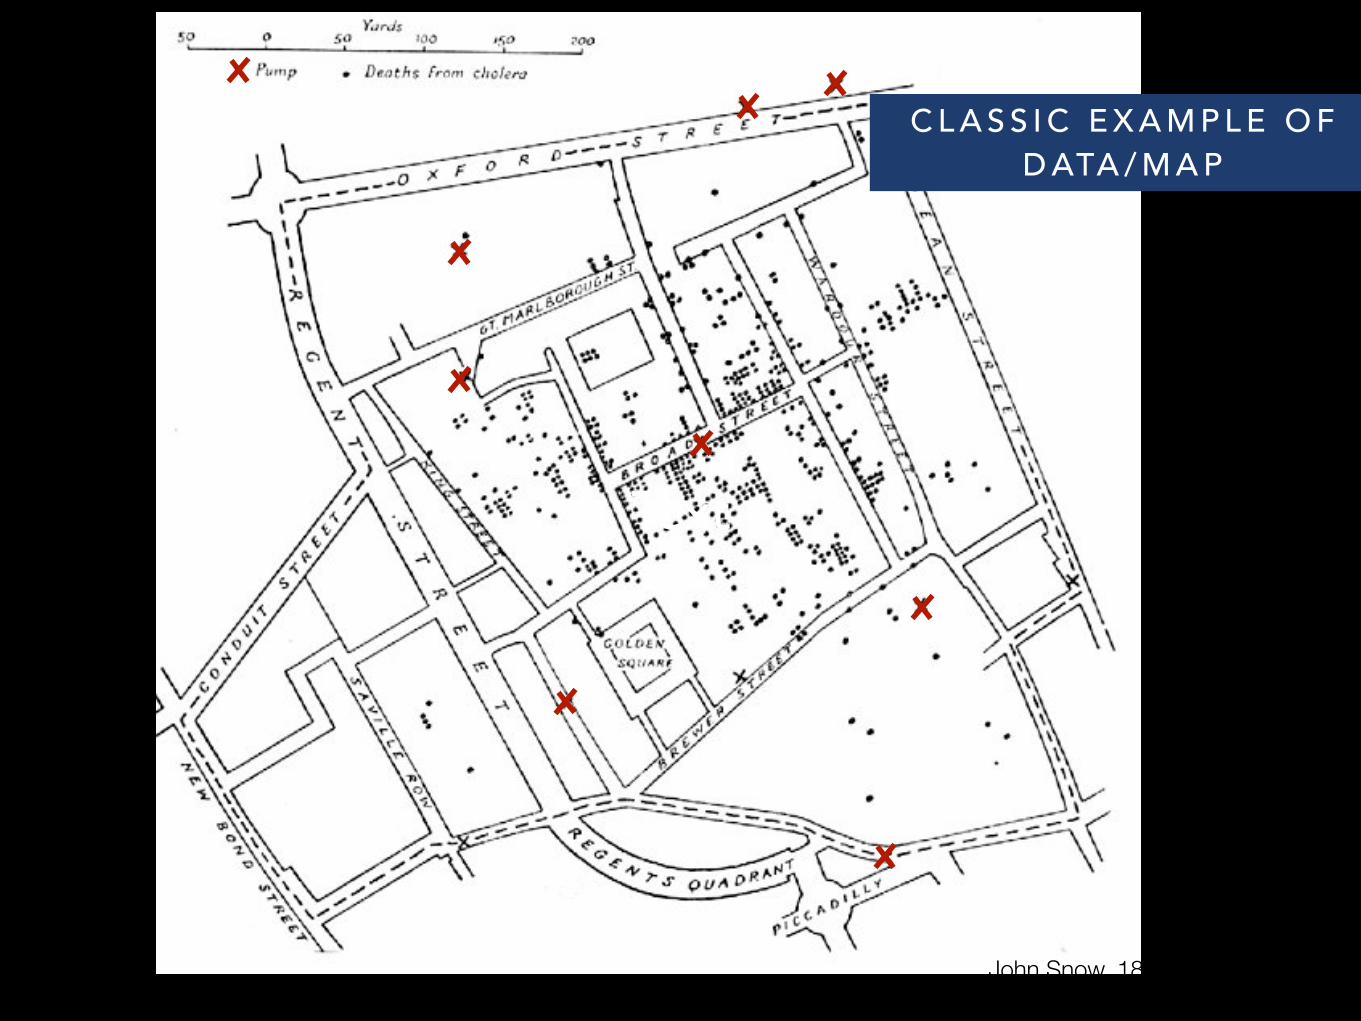
John Snow, 1854
Text
C L A S S I C E X A M P L E O F D ATA / M A P

http://www.heise.de/newsticker/meldung/Umsatzsteigerung-und-Gewinnrueckgang-bei-Amazon-1285944.html
T H E C A S E F O R C O L L E C T I N G T H E N U M B E R S O V E R T I M E
C O L L E C T I N G R E L E VA N T, L O C A L N U M B E R S O V E R T I M E
C R E AT E S VA L U E …

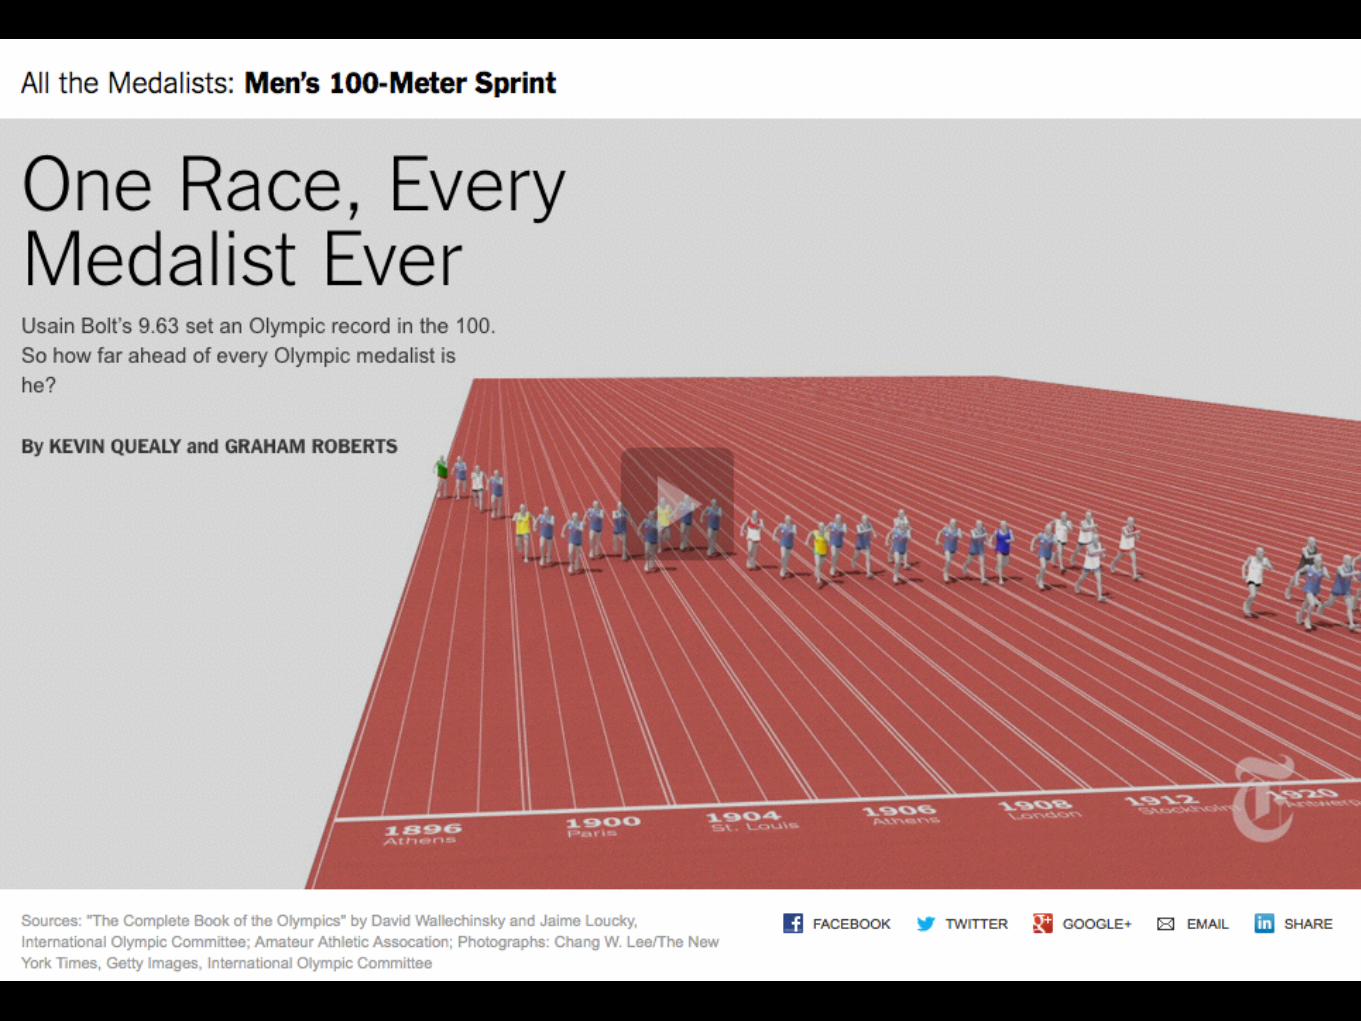
Quelle: New York Times
S I M P L E B A R , B I G S T O R Y

– C H R I S T I A N B A U E R
„Zitat hier eingeben.“
D ATA - D R I V E N S T O R Y / L O C A L N E W S PA P E R

„Zitat hier eingeben.“
The project is an excellent example of journalists intervening to put a largely neglected issue on the political agenda, and providing decision-makers and the public with the evidence they need to
take action to stop these tens of thousands of deaths at Europe’s borders. This is data journalism at its best. We need more projects
like this.
B I G I N V E S T I G AT I O N , M U LT I - P U B L I C AT I O N A C R O S S
E U R O P E

– C H R I S T I A N B A U E R
„Zitat hier eingeben.“
I M P R E S S I V E I N T E R A C T I V E , D O N E B Y L O C A L
N E W S R O O M

H O W ?
T H E T H I N K I N G B E H I N D N O TA B L E D ATA P R O J E C T S

Quelle: Alan McLean, NYT//Amsterdam, 2010

Quelle: Alan McLean, NYT//Amsterdam, 2010

1. Data Story 2. Data Special 3. Data App
Find Small datasets Complex data Big data
Clean Excel Open Refine Database
Visualize Line, Bar, Pie Interaction & Filters Dashboards
Publish Embed Special URL App or service
Who? Journalist Journalist + Designer Journalist + Designer + Developer
THREE TYPES OF PROJECTS

TEAMS NEEDED
Journalisten/Dokumentation
DeveloperDesigner
Ideas and Questions Search and data verification Project management
Visual quality Clarity Depth Surprise
SimplifyingAutomating Automatisierung Presentation Agility Innovation
CC-BY: Mirko Lorenz, 2012

E X A M P L E : F I N D I N G T H E C H E AT E R S I N T H E N E W Y O R K M A R AT H O N

D ATA S T O R Y T H I N K I N G
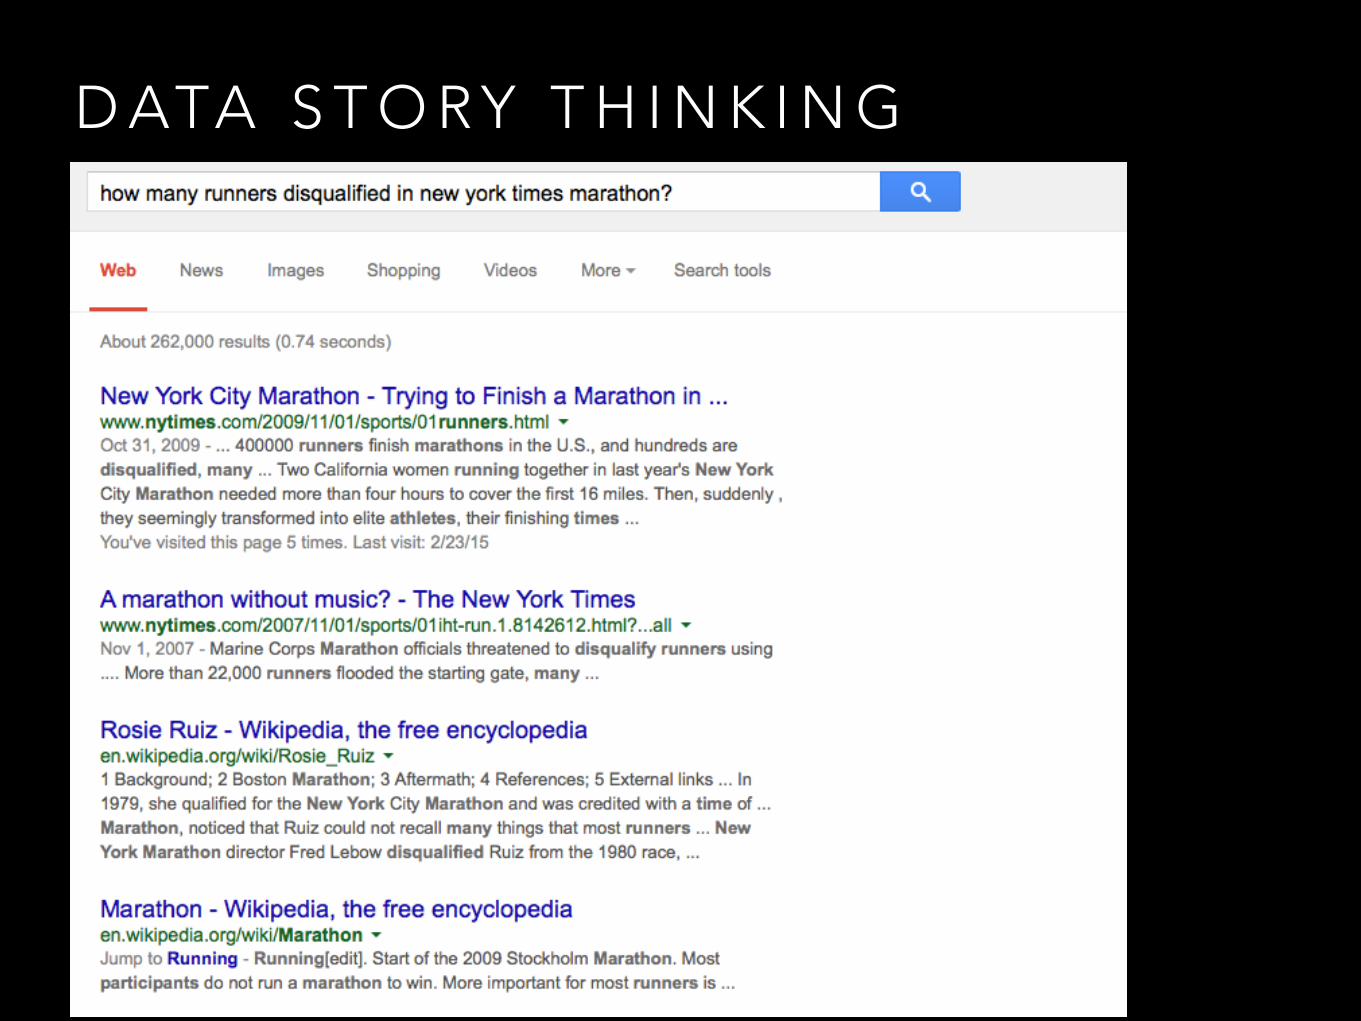
D ATA S T O R Y T H I N K I N G
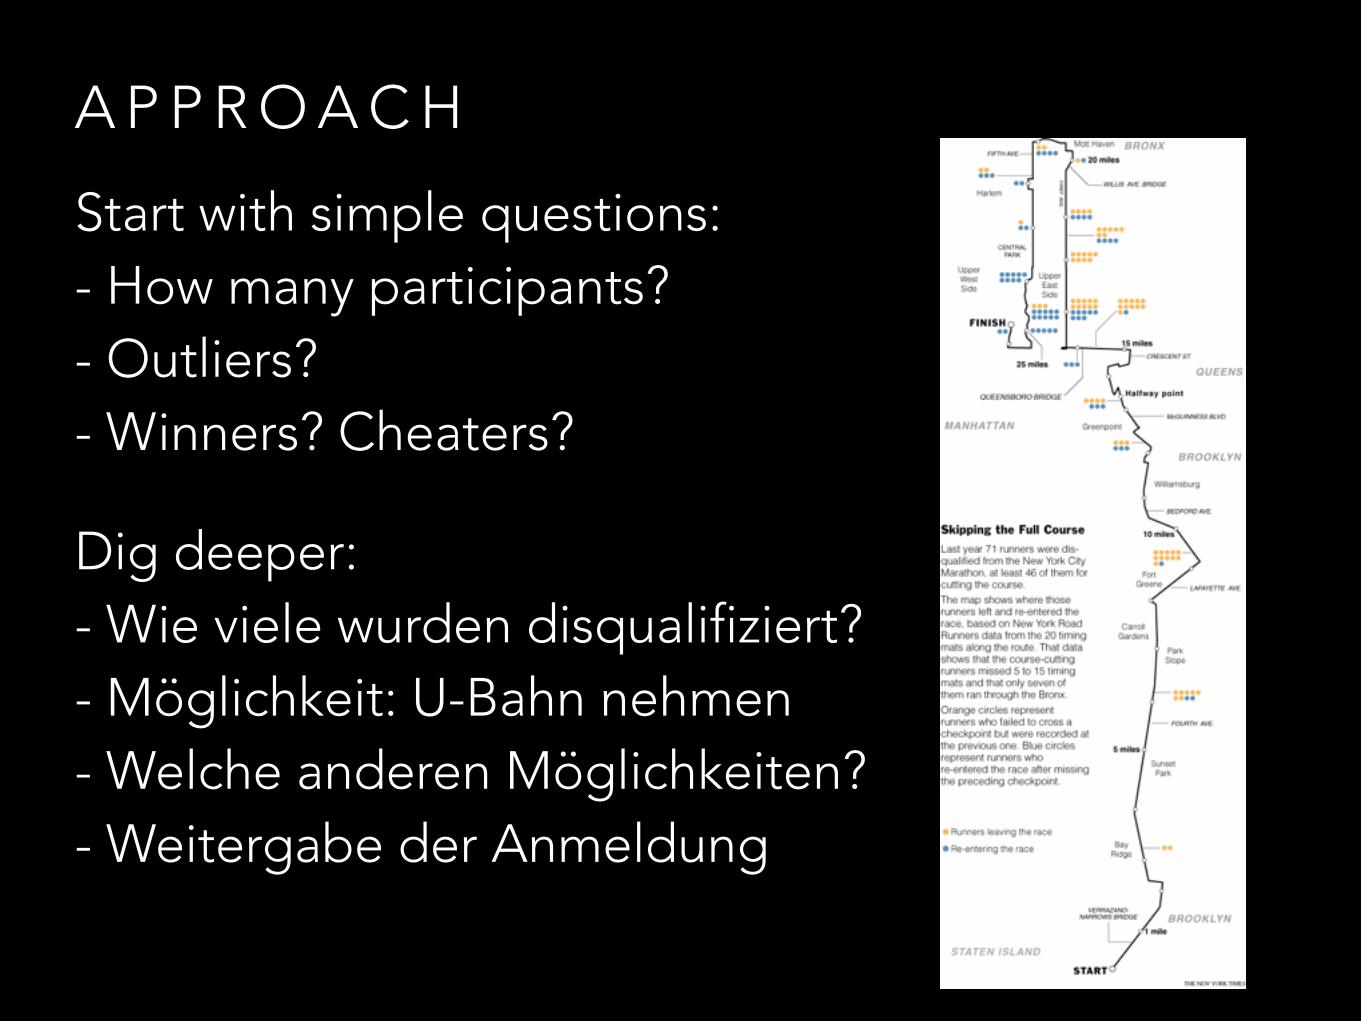
A P P R O A C H
Start with simple questions: - How many participants? - Outliers? - Winners? Cheaters?
Dig deeper: - Wie viele wurden disqualifiziert? - Möglichkeit: U-Bahn nehmen - Welche anderen Möglichkeiten? - Weitergabe der Anmeldung

W H E N U S I N G D ATA : G O F I N D A L A N M I L L E R
Source: Andy Lehren, The New York Times
Die Geschichte: Alan Miller
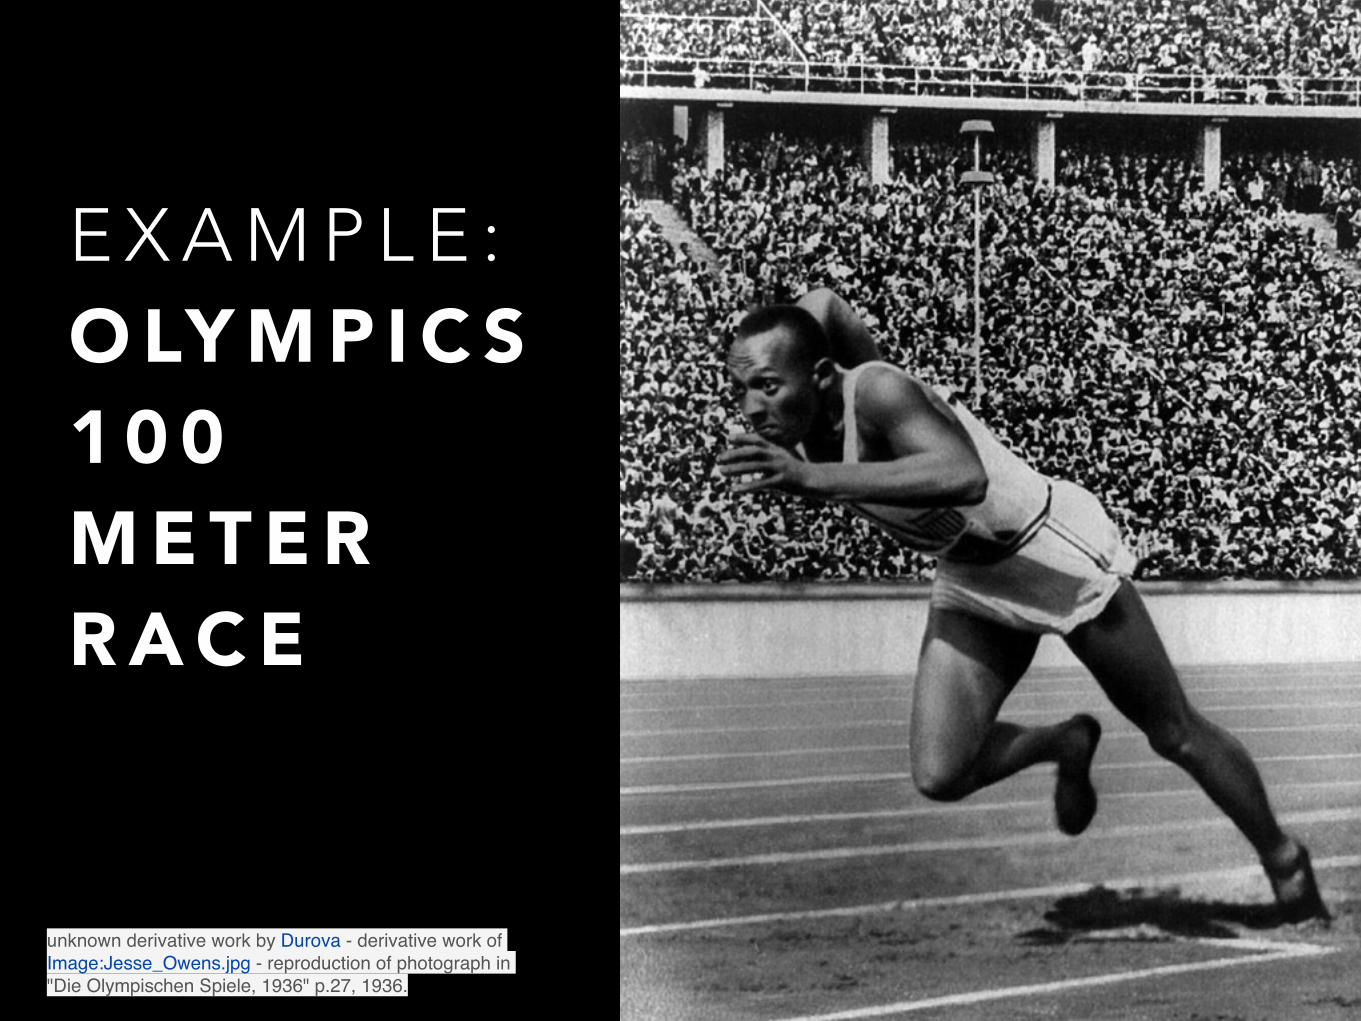
E X A M P L E : O LY M P I C S 1 0 0 M E T E R R A C E
unknown derivative work by Durova - derivative work of Image:Jesse_Owens.jpg - reproduction of photograph in "Die Olympischen Spiele, 1936" p.27, 1936.
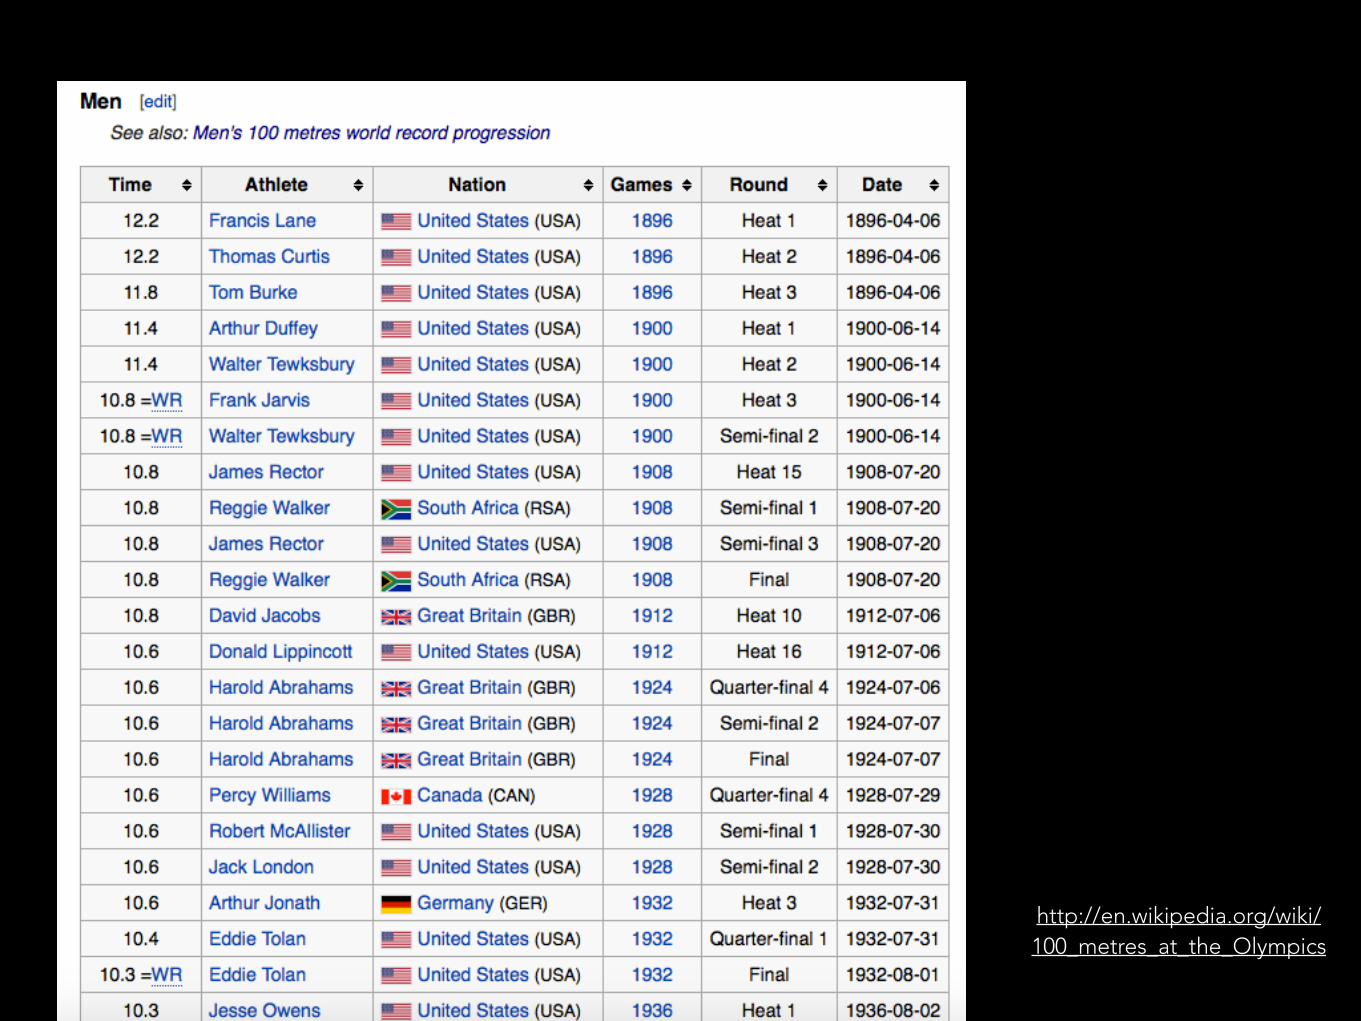
http://en.wikipedia.org/wiki/100_metres_at_the_Olympics

W I E I S T D I E G E S C H I C H T E A U F G E B A U T ? PROTAGONIST
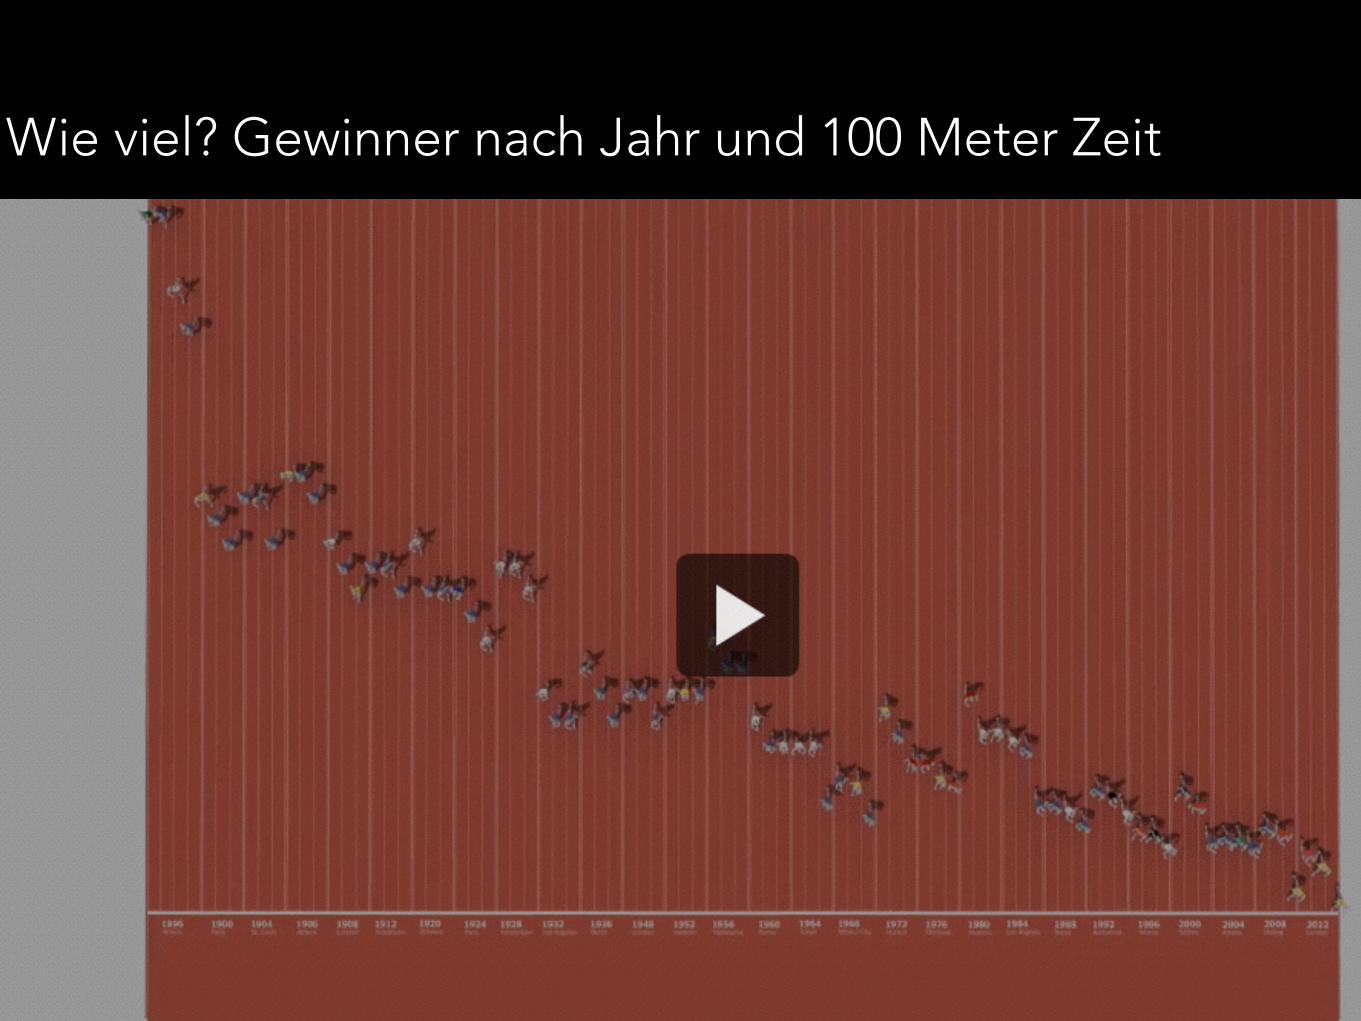
Wie viel? Gewinner nach Jahr und 100 Meter Zeit

Antagonist: Carl Lewis
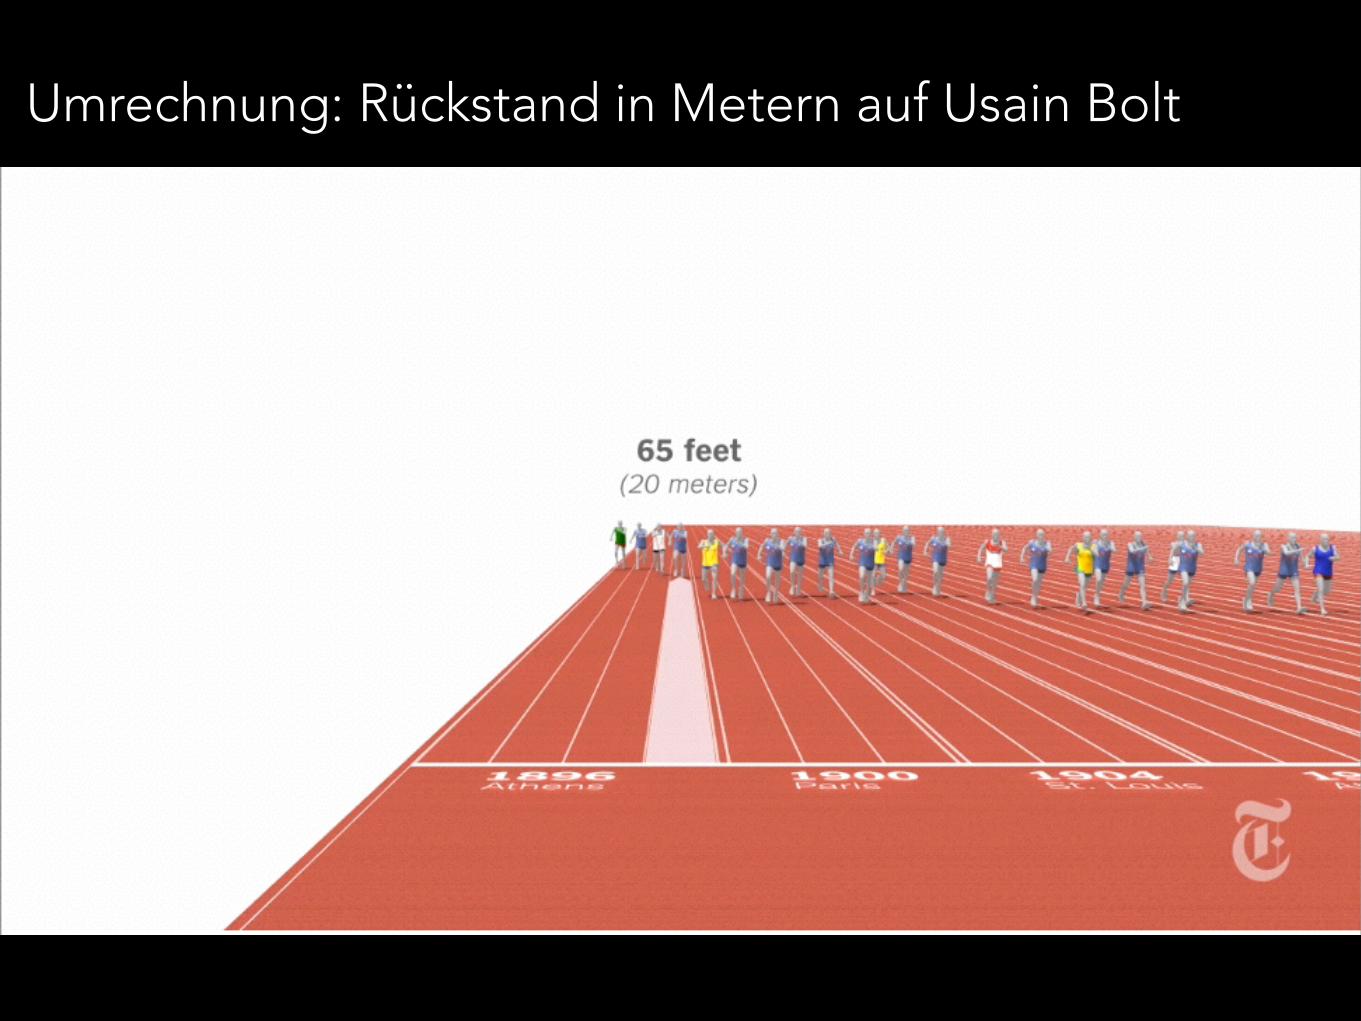
Umrechnung: Rückstand in Metern auf Usain Bolt

Vergleich von 116 Medaillen-Gewinnern

Analyse: Gewinner nach Nationalität.
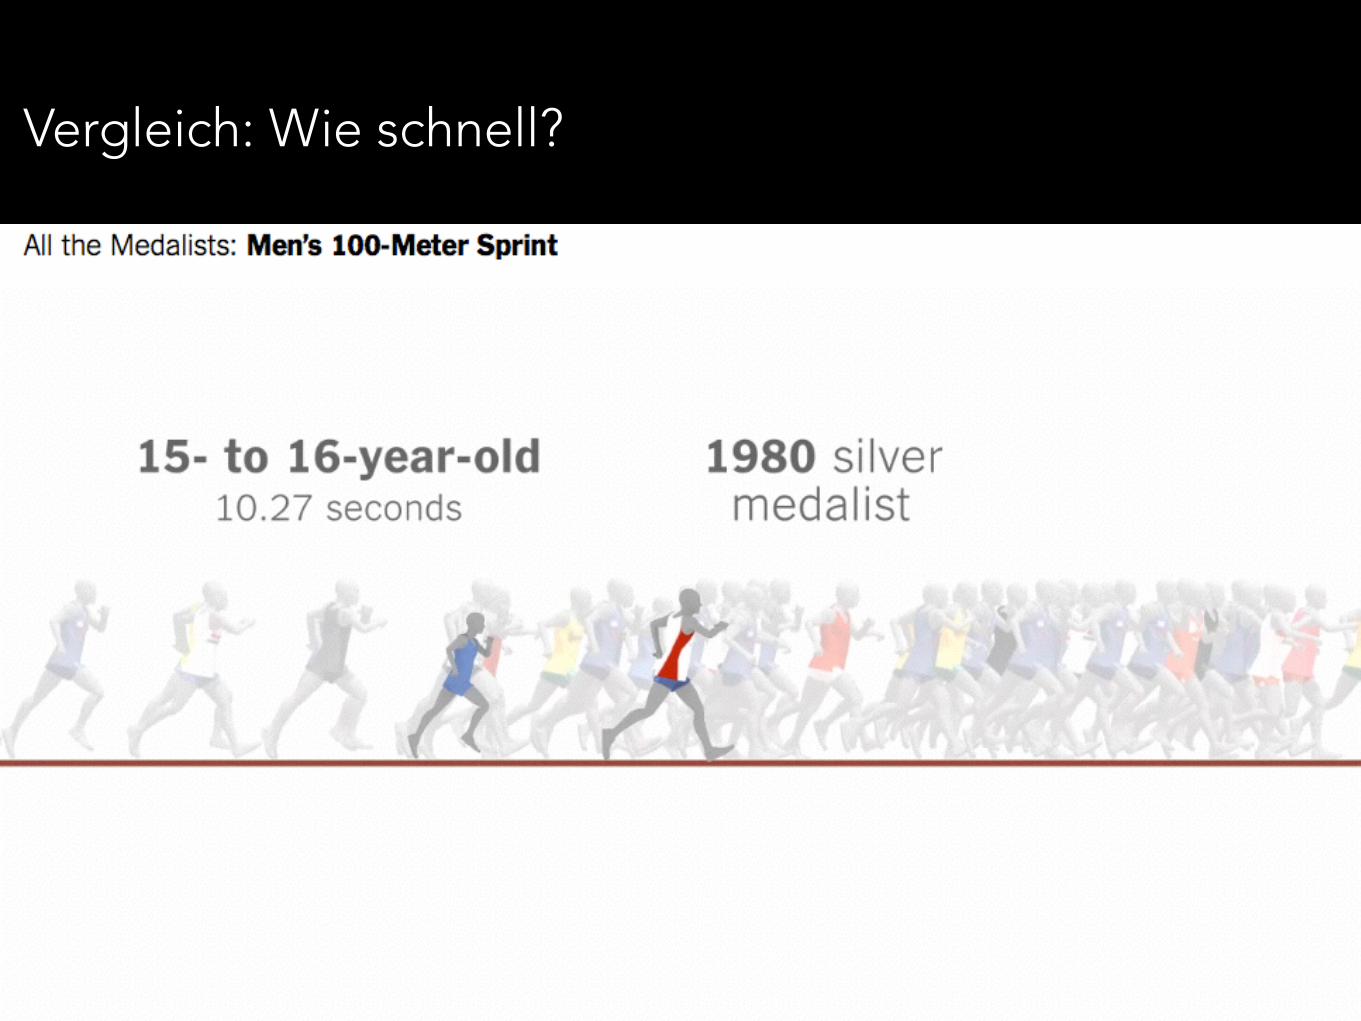
Vergleich: Wie schnell?

Überraschung: Laufzeiten heute (nach Alter)?

Ende: Differenz zwischen 1896 und 2012?
<— 3 Sekunden —>

http://konigi.com/book/sketch-book/why-we-sketch
From idea to completion: Not a straight line.

http://konigi.com/book/sketch-book/why-we-sketch
Geschichten skizzieren - Komplexität entwirren
http://konigi.com/book/sketch-book/why-we-sketch
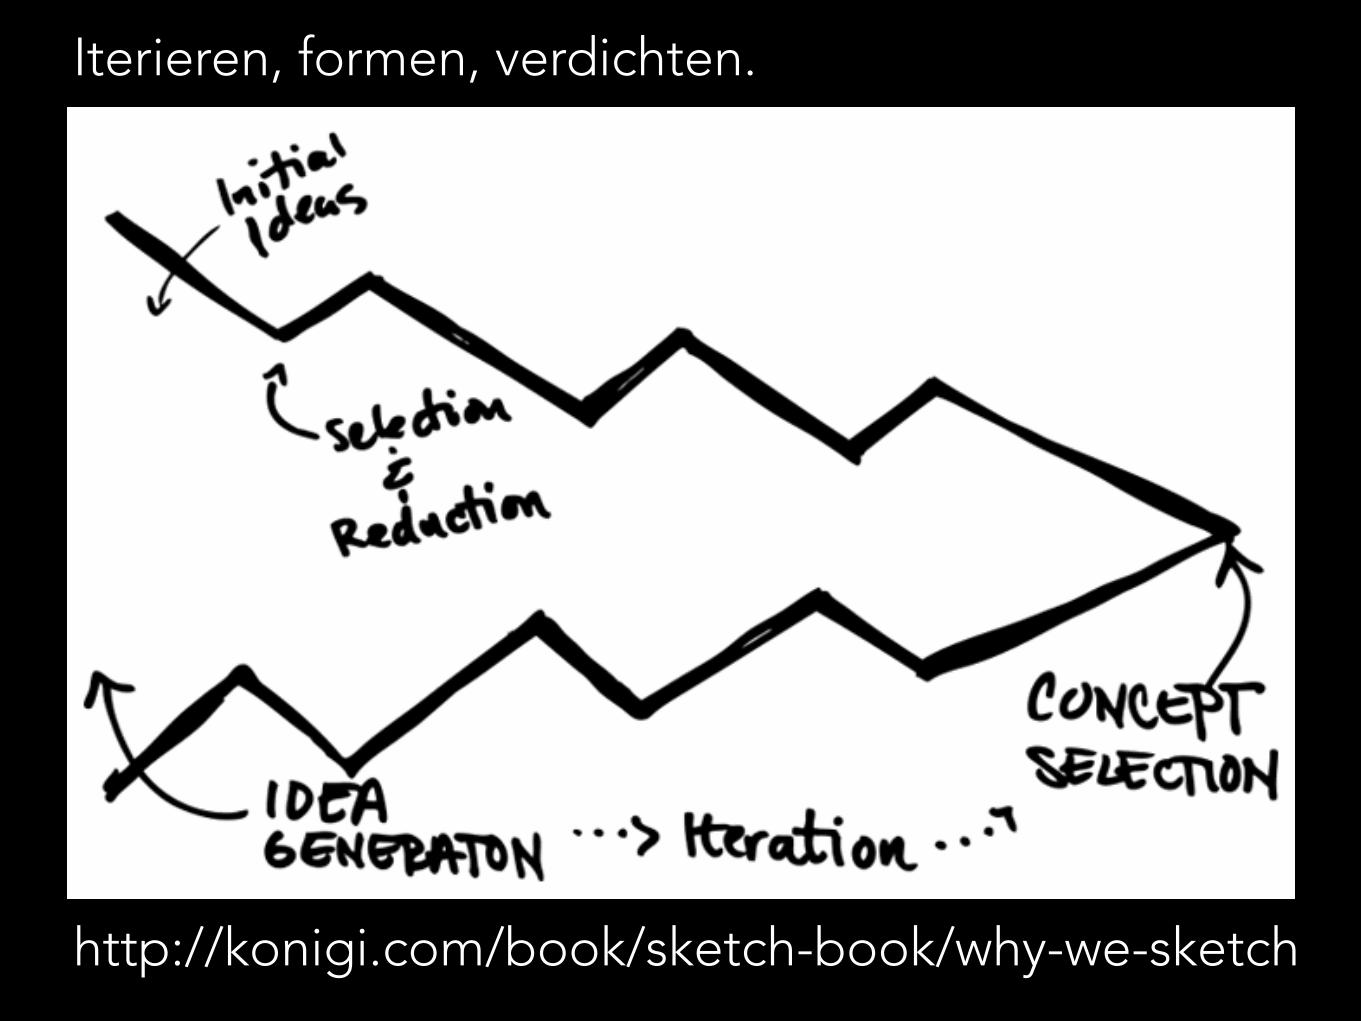
Iterieren, formen, verdichten.

http://konigi.com/book/sketch-book/why-we-sketch
Persönlich machen: Protagonist als Spiegel/Bezugspunkt.

T O O L S

D AT E N : E X C E L G O O G L E S H E E T S O P E N R E F I N E S C R A P E R F O R M E L N ( Z . B . I N F L AT I O N , A R B E I T S M I N U T E )
V I S U A L I S I E R E N : D 3 . J S J U I C E L A B S C H A R T C H O O S E R D ATA W R A P P E R


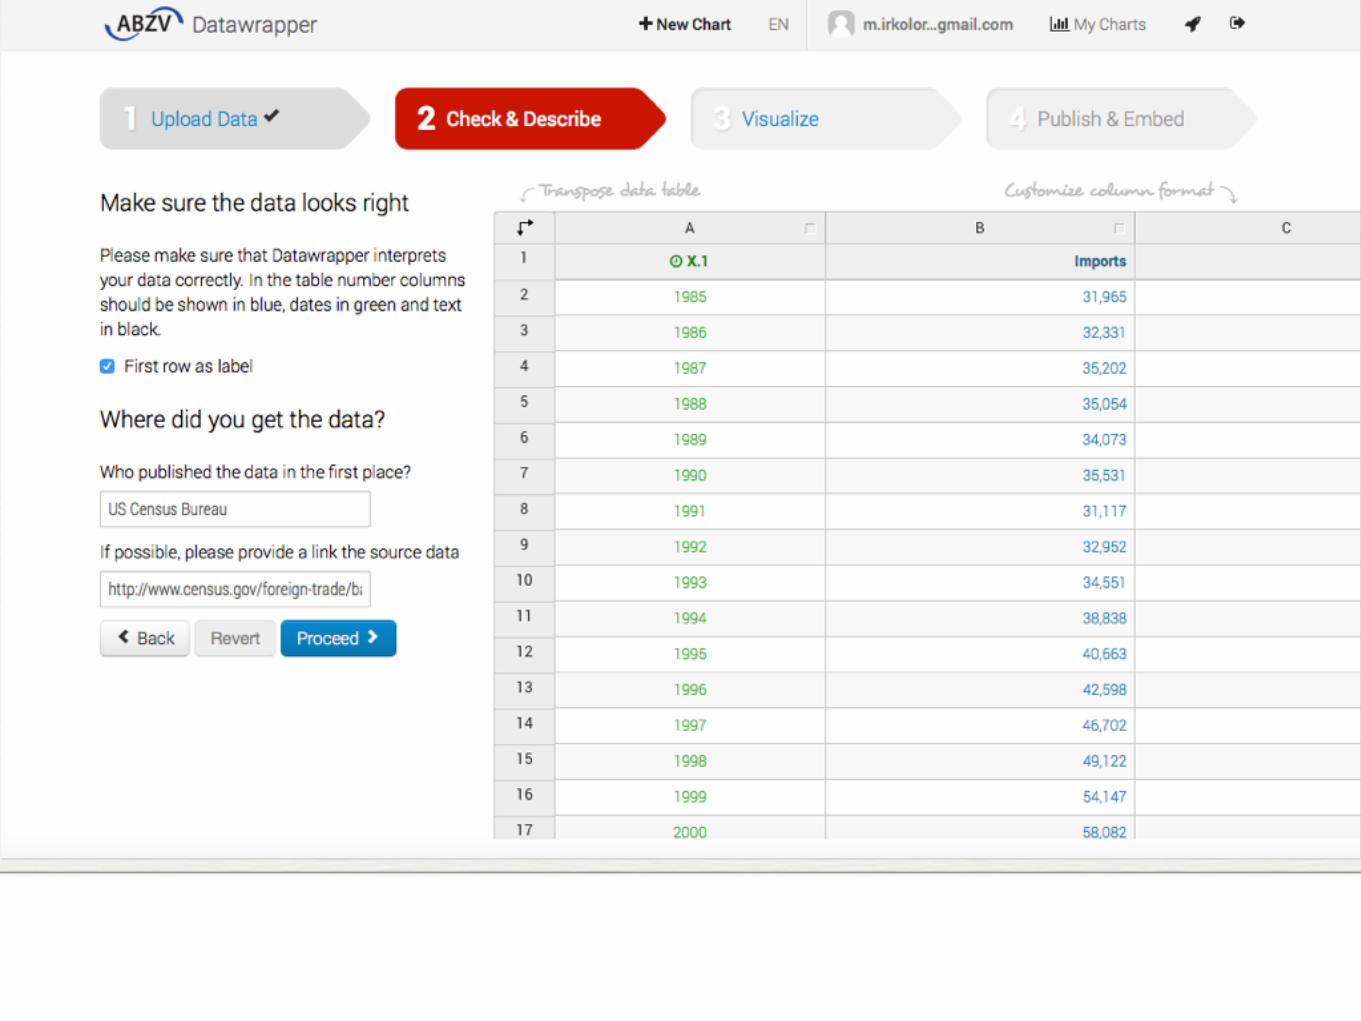


Many rules and recommendations built into the tool.
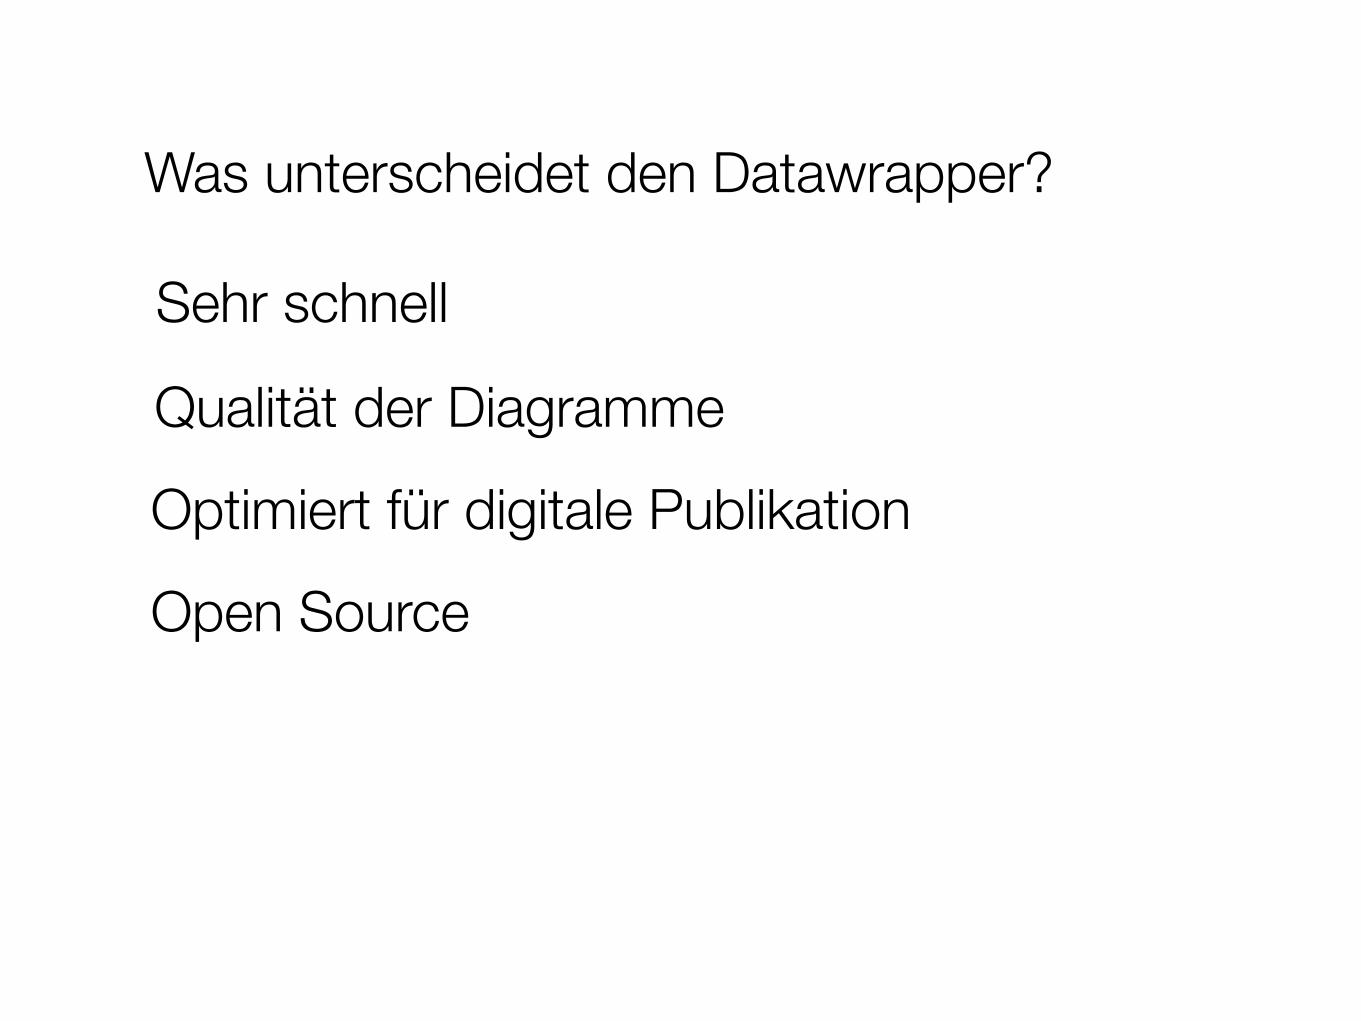
Was unterscheidet den Datawrapper?
Sehr schnell
Open Source
Qualität der Diagramme
Optimiert für digitale Publikation

Example: Good data-to-ink ratio
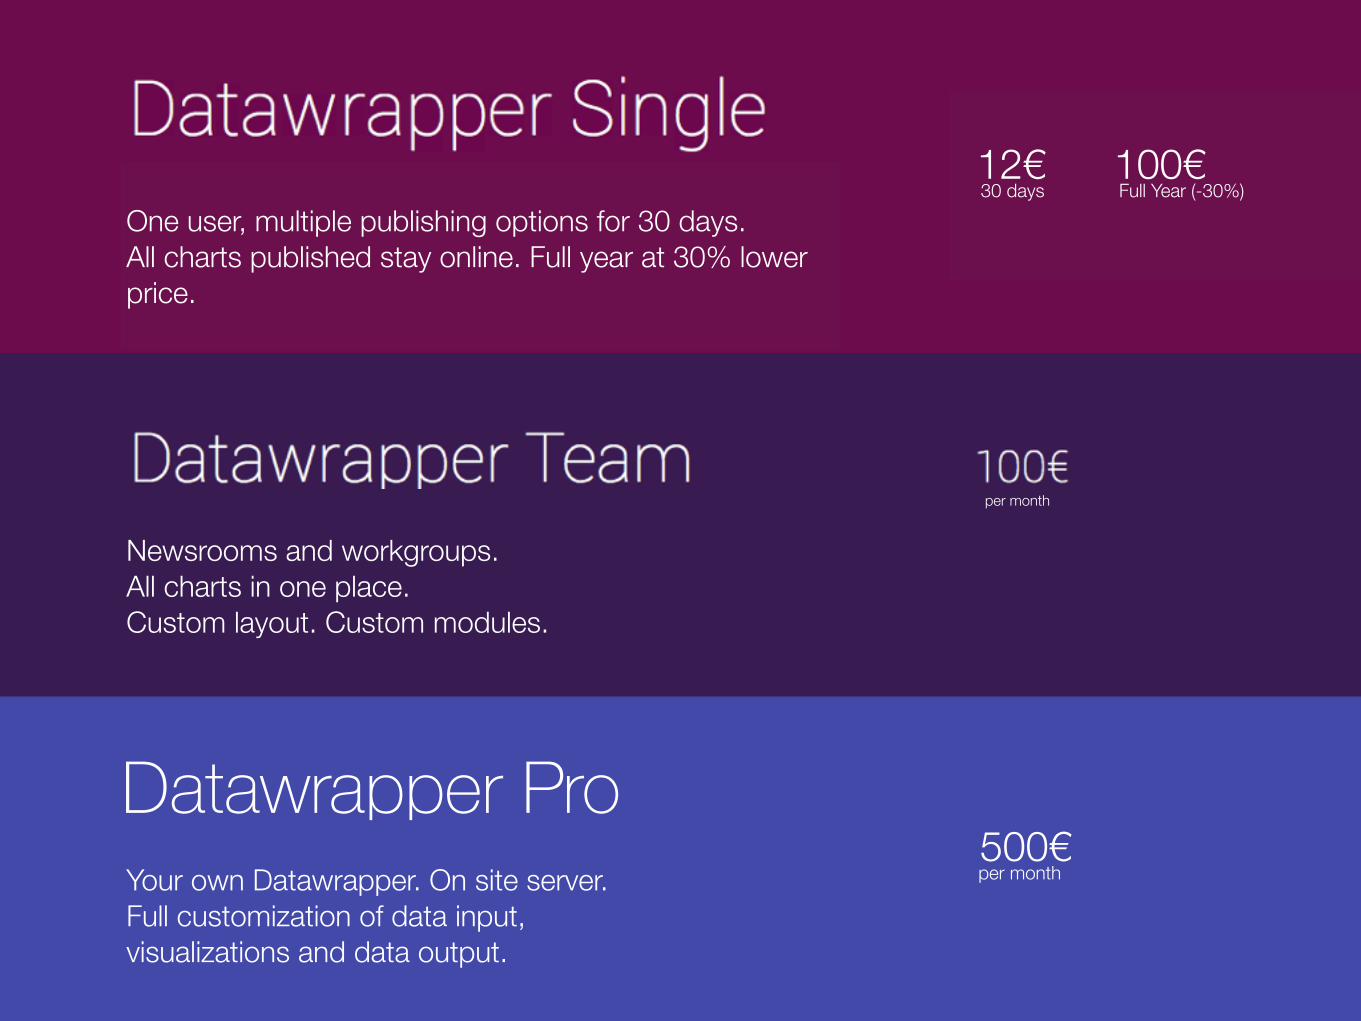
One user, multiple publishing options for 30 days. All charts published stay online. Full year at 30% lower price.
Datawrapper ProYour own Datawrapper. On site server. Full customization of data input, visualizations and data output.
Newsrooms and workgroups. All charts in one place. Custom layout. Custom modules.
per month
500€per month
12€30 days
100€Full Year (-30%)
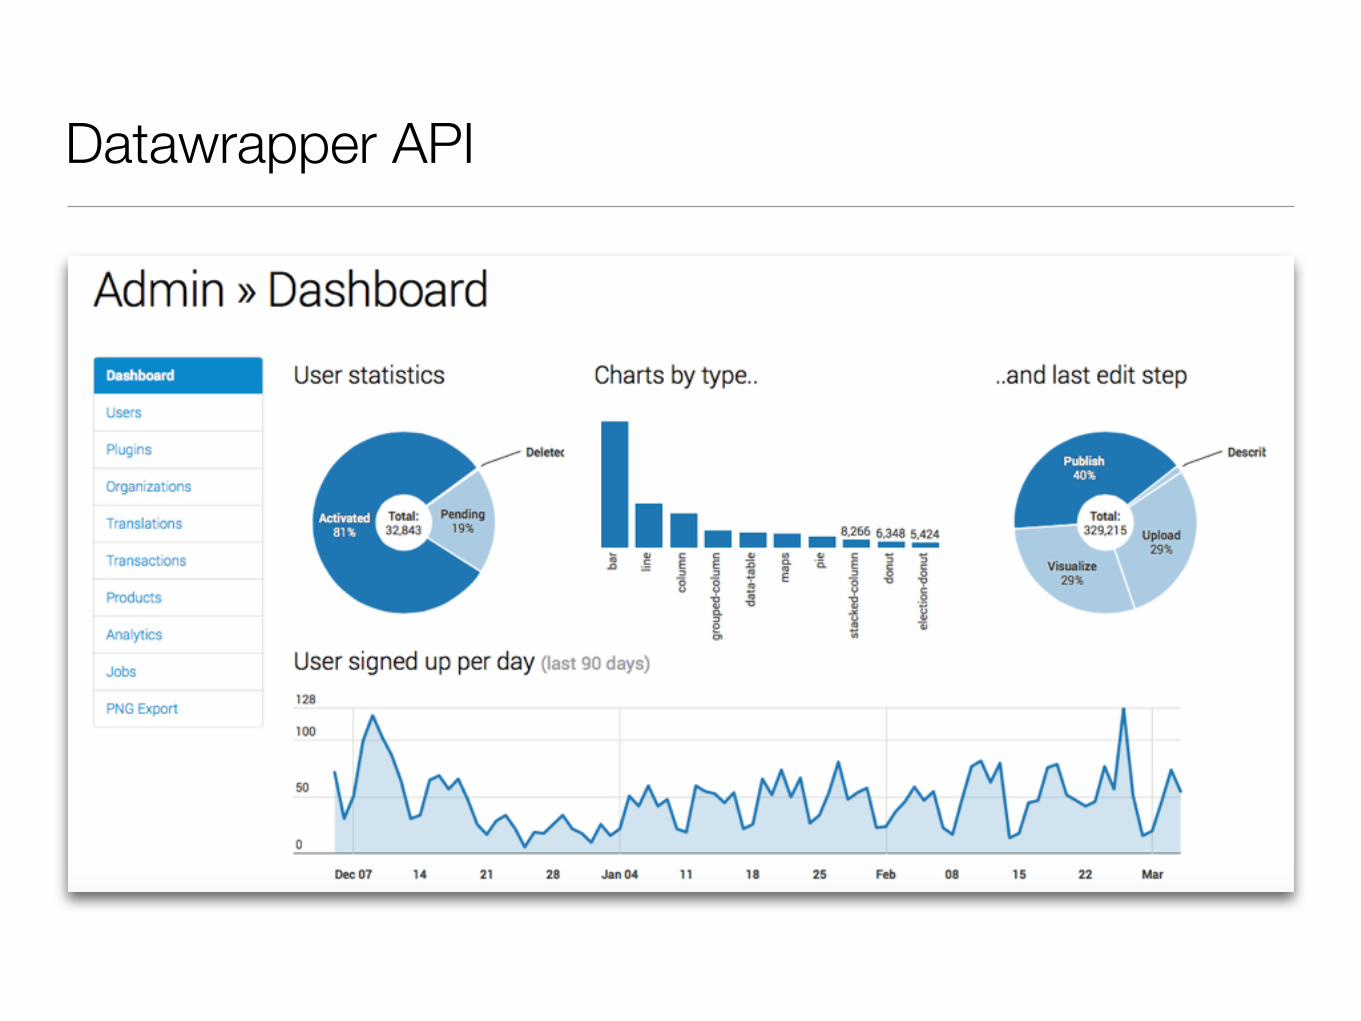
Datawrapper API

• Coming features:
• Scatterplot
• Tables
• Double Y-Axis
• Datawrapper Source
E X E R C I S E : H O W T O S TA RT A S T O RY Y O U R S E L F

https://medium.com/@tomcavill/3x3-d6202ef7d077
Use the 3x3 rule for better story structure.

W H AT ? W H Y ? H O W ?
https://medium.com/@tomcavill/3x3-d6202ef7d077
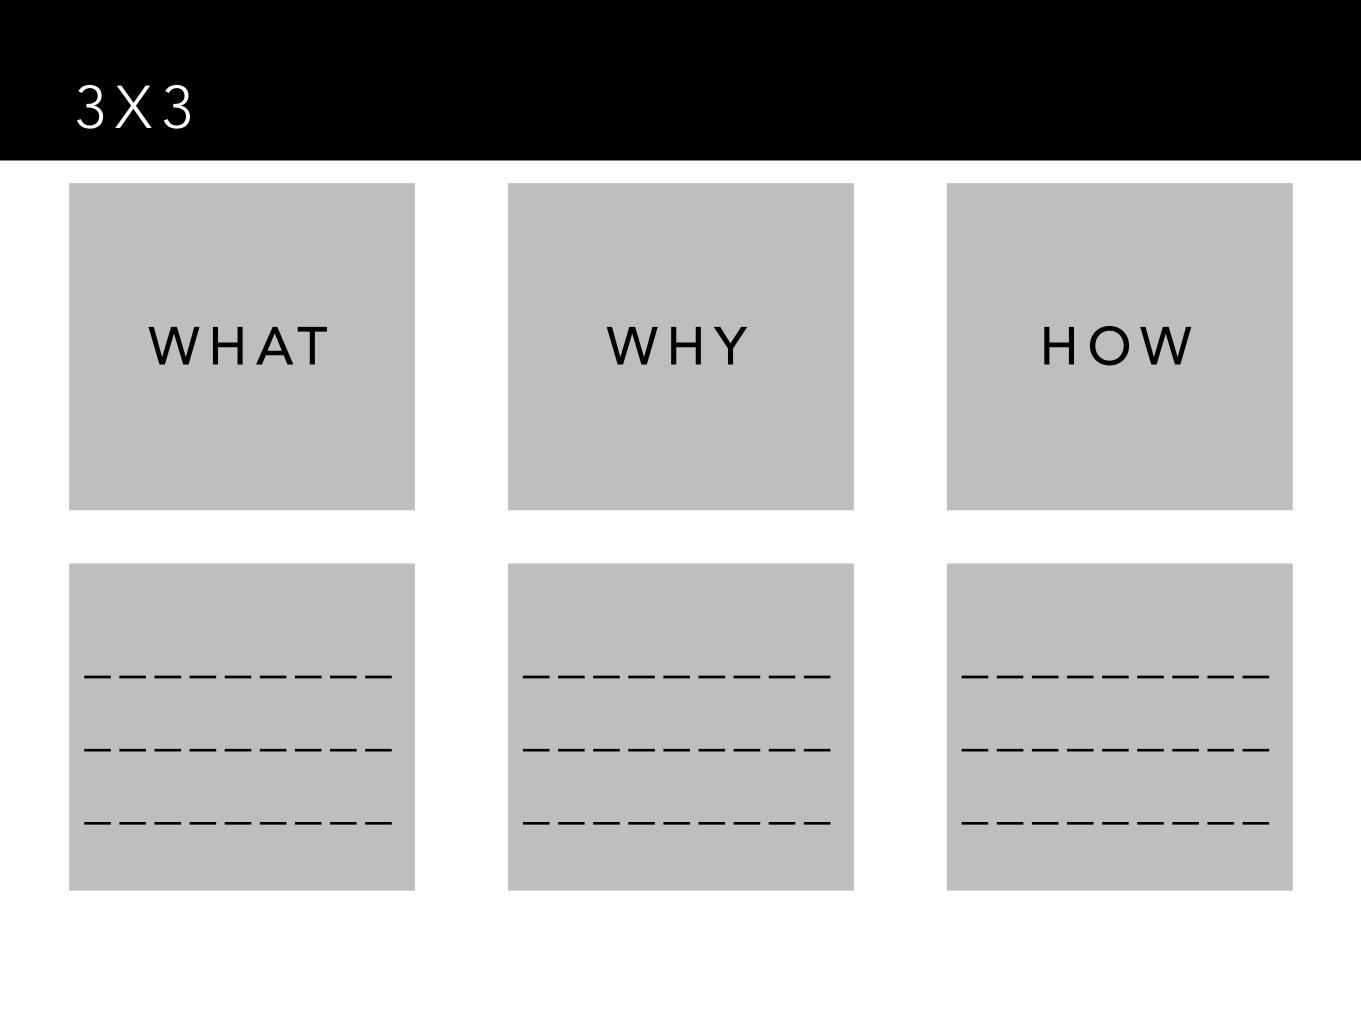
3 X 3
W H AT W H Y H O W
_ _ _ _ _ _ _ _ _ _ _ _ _ _ _ _ _ _ _ _ _ _ _ _ _ _ _
_ _ _ _ _ _ _ _ _ _ _ _ _ _ _ _ _ _ _ _ _ _ _ _ _ _ _
_ _ _ _ _ _ _ _ _ _ _ _ _ _ _ _ _ _ _ _ _ _ _ _ _ _ _


T H A N K Y O U