MIRA VARIABLES: AN INFORMAL REVIEW - NASA · were able to construct a self-consistent picture...
34
MIRA VARIABLES: AN INFORMAL REVIEW ROBERT F. WING Astronomy Department, Ohio State University The Mira variables can be either fascinating or frustrating -- depending on whether one is content to watch them go through their changes or whether one insists on understanding them. Virtually every observable property of the Miras, including each detail of their extraordinarily complex spectra, is strongly time-dependent. Most of the changes are cyclic with a period equal to that of the light variation. It is well known, however, that the lengths of individual light cycles often differ noticeably from the star's mean period, the differences typically amounting to several percent. And if you observe Miras -- no matter what kind of observation you make -- your work is never done, because none of their observable properties repeats exactly from cycle to cycle. The structure of Mira variables can perhaps best be described as loose. They are enormous, distended stars, and it is clear that many differ- ent atmospheric layers contribute to the spectra (and photometric colors) that we observe. As we shall see, these layers can have greatly differing temperatures, and the cyclical temperature variations of the various layers are to some extent independent of one another. Here no doubt is the source of many of the apparent inconsistencies in the observational data, as well as the phase lags between light curves in different colors. But when speaking of "layers" in the atmosphere, we should remember that they merge into one another, and that layers that are spectroscopically distinct by virtue of thelrvertical motions may in fact be momentarily at the same height in the atmosphere. 533 https://ntrs.nasa.gov/search.jsp?R=19800016762 2018-07-12T15:26:36+00:00Z
Transcript of MIRA VARIABLES: AN INFORMAL REVIEW - NASA · were able to construct a self-consistent picture...

MIRA VARIABLES: AN INFORMAL REVIEW
ROBERT F. WING
Astronomy Department, Ohio State University
The Mira variables can be either fascinating or frustrating --
depending on whether one is content to watch them go through their changes
or whether one insists on understanding them. Virtually every observable
property of the Miras, including each detail of their extraordinarily complex
spectra, is strongly time-dependent. Most of the changes are cyclic with a
period equal to that of the light variation. It is well known, however, that
the lengths of individual light cycles often differ noticeably from the star's
mean period, the differences typically amounting to several percent. And if
you observe Miras -- no matter what kind of observation you make -- your work
is never done, because none of their observable properties repeats exactly
from cycle to cycle.
The structure of Mira variables can perhaps best be described as
loose. They are enormous, distended stars, and it is clear that many differ-
ent atmospheric layers contribute to the spectra (and photometric colors)
that we observe. As we shall see, these layers can have greatly differing
temperatures, and the cyclical temperature variations of the various layers
are to some extent independent of one another. Here no doubt is the source
of many of the apparent inconsistencies in the observational data, as well as
the phase lags between light curves in different colors. But when speaking
of "layers" in the atmosphere, we should remember that they merge into one
another, and that layers that are spectroscopically distinct by virtue of
thelrvertical motions may in fact be momentarily at the same height in the
atmosphere.
533
https://ntrs.nasa.gov/search.jsp?R=19800016762 2018-07-12T15:26:36+00:00Z
I sometimes find it helpful to think of Miras as jellyfish. As they
move through the water, their general oscillatory motion can be expected to
continue, but it is impossible to predict all the details of their changes
in shape and appearance; if you tweek a jellyfish on one side, you don't
know if, when, and with what amplitude the disturbance will reach the other.
If you think of Miras this way, you will stop worrying about their failure
to repeat exactly in their variations.
No one has ever called Miras a theoretician's delight. Certainly
they have not been very useful in testing theories of stellar pulsation.
There is just too much going on -- it's hard to know which observable pro-
perties are even relevant to pulsation. In fact the question has sometimes
been raised as to whether the Miras are pulsating at all. _rrill (1955)
wrote that "the evidence for volume pulsation is so meagre that skepticism
is warranted", and Wallerstein (1977) has proposed that the apparent radius
changes in Miras are caused not by the outward movement of the gas but simply
by changes in the atmospheric opacity. Recent results from infrared spectro-
scopy (Hinkle 1978) have clarified the picture considerably, basically by
allowing us to look more deeply into the atmosphere, and I think that the
last doubts that Mira variables are pulsating have finally been laid to rest.
A scheme has recentlybeen devised by Cahn and Wyatt (1978) by which
one can estimate the masses and luminosities (and hence ages) of individual
Miras from two readily observable quantities, the mean period and the mean
spectral type at maximum. This scheme is based on the assumption that Miras
are pulsating stars, more specifically that they are pulsating in the first
overtone. Since we have few opportunities of determine masses and lumino-
sities of individual Miras directly, it will be difficult to decide obser-
vationally whether this picture is correct. At this stage the question is
not whether the relations of Cahn and Wyatt will eventually need recalibra-
ting, but whether they exist at all. However, the fact that Cahn and Wyatt
were able to construct a self-consistent picture suggests that they may be
on the right track, and that it may indeed be possible to understand the
gross observable properties of individual Miras, such as surface temperature
and mean period, in terms of their masses and evolutionary states.
534

In describing to you the observed behavior of Miras, I will attempt
to select those particular observations that have a bearing on the question
of pulsation -- although, as I have already indicated, it is not always ob-
vious which observations these are. The discussion will be centered around
the sizes of these stars, or more particularly the evidence for chan_es in
size. No mention will be made of their absolute magnitudes, ages, chemical
compositions, population types, galactic distribution, statistical proper-
ties, or other matters not directly related to pulsation. Rather, we will
be concerned with the variations of individual stars, and with some spectro-
scopic peculiarities that are related to the enormous sizes of their atmos-
pheres.
As soon as we try totalk about the sizes of Mira variables, we run
into a serious problem. The reason that we can see so many different atmos-
pheric layers at the same time is that the continuous opacity -- between the
spectral lines and bands -- is extremely low. A Mira is about as translucent
as a Jellyfish: you can practically see right through it. Some regions con-
tributing to the spectrum are much farther from the center of the star than
others, and this is all within the region we call the "photosphere". In
order to speak of the size of a Mira, we must specify the wavelength pre-
cisely. Furthermore, there may be no real discontinuity between the photo-
sphere and the clrcumstellar shell that contributes zero-volt absorption lines
and infrared emission, since presumably the shell consists of material which
has drifted away from the star, and which may receive new contributions with
every light cycle. In this respect, Miras are worse than jellyfish. Although
the radius of a Jellyfish is both time-dependent and angle-dependent, at least
there is a membrane to show us where the Jellyfish ends and the ocean begins.
The size of a jellyfish is certainly difficult to measure, but at least the
creature has a size.
The methods that can be used to determine the sizes of Miras fall
into three classes:
(i) Direct. Angular diameters of Miras have been measured directly
with Michelson interferometers, by observations of lunar occultations, and
by speckle interferometry. The distance must be known to calculate the ab-
535
!I!!
solute size, but useful information about chanses in size can be obtained
directly from the observed changes in angular diameter.
(2) Photometric. If you know the luminosity L (or equivalently the
absolute bolometric magnitude Mbol) and the effective temperature Te, you
can calculate the size of the emitting surface area and hence the stellar
radius R, since L = 4_R2oT2 . If you don't know the distance and have only
the apparent bolometric magnitude mbol, you can still calculate the change
in radius from the observed changes in Te and mbo I.
(3) Spectroscopic. Measurements of radial velocities of absorption
and emission lines give information about vertical motions in the atmosphere.
Integration of the radial velocity curve then gives the distance moved by
the gas producing the lines.
All of these methods are clear-cut in concept, and all of them are
known to "work" in the sense that they give reasonable results for the sizes
of other kinds of stars. But all of them get into trouble when they are
applied to the Miras, and in general the results from the three methods are
in poor agreement.
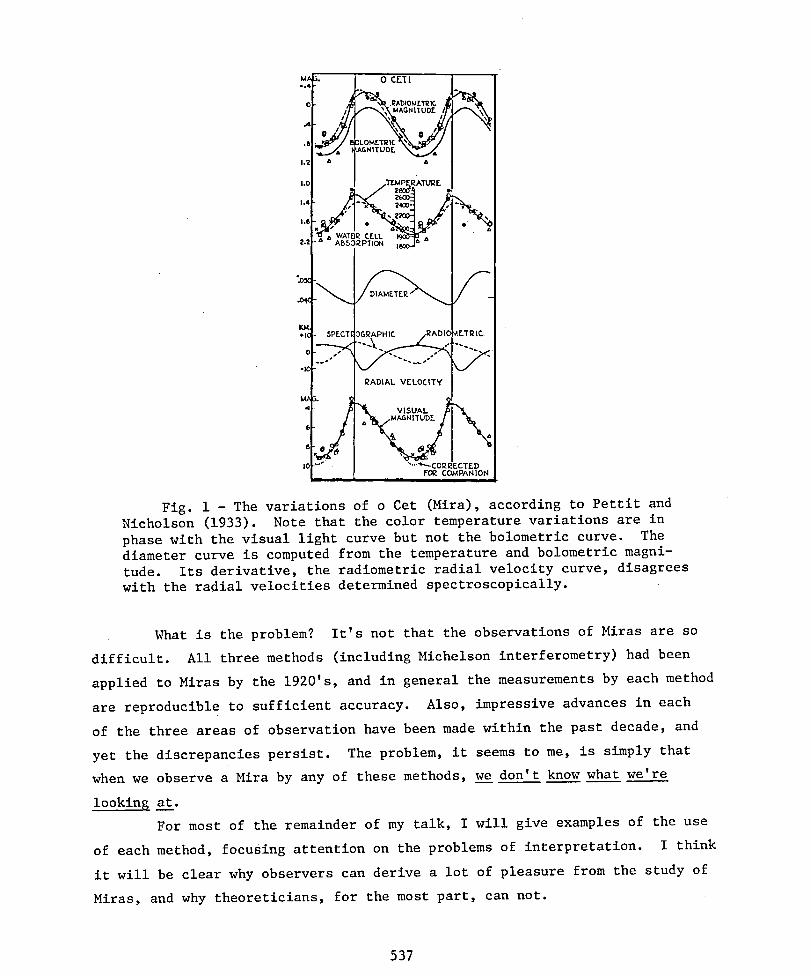
For example, Figure 1 shows a famous illustration from the paper by
Pettit and Nicholson (1933). From the variations in bolometric magnitude
(obtained from the observed radiometric magnitudes, with crude corrections
for absorption by the earth's atmosphere) and temperature (from a very broad-
band color index, which compares the radiation shortward and longward of
1.3 _), they computed the variation in the angular diameter of Mira (o Cet).
Differentiation of the diameter curve then gave the "radiometric radial
velocity curve", which is compared to the radial velocity curve measured
spectroscopically by Joy (1926) for the mean absorption spectrum of Mira.
The two curves have similar amplitude but are badly out of phase -- in fact,
they are nearly mirror images of one another. Similar comparisons for three
other Miras have recently been published by Wallerstein (1977); the higher
quality of the data used in his analysis did not make the discrepancy go
away.
536
M_. 0 CEIl-,4 -
x\J/1.2 _ A
I.€ _TI_MP,_2 A'I'U_ E
I.'; • "_ _#_0 , - _,
t.; ASSO_PTION i/_3._ = -
•,'I( - 5PF..CTI)G_APHIC /IZADI _IE.TI_IC..
€ -"--'_,- " _ -'><..o °
-14 _.J
_ADIAL VELOCtTY
IC -- ..... "_--..-CO_I_ECTEDFOR CG _PANION
i
Fig. i - The variations of o Cet (Mira), according to Pettit andNicholson (1933). Note that the color temperature variations are in
phase with the visual light curve but not the bolometric curve. Thediameter curve is computed from the temperature and bolometric magni-tude. Its derivative, the radiometric radial velocity curve, disagreeswith the radial velocities determined spectroscopically.
What is the problem? It's not that the observations of Miras are so
difficult. All three methods (including Michelson interferometry) had been
applied to Miras by the 1920's, and in general the measurements by each method
are reproducibl e to sufficient accuracy. Also, impressive advances in each
of the three areas of observation have been made within the past decade, and
yet the discrepancies persist. The problem, it seems to me, is simply that
when we observe a Mira by any of these methods, we don't know what we're
looking at.
For most of the remainder of my talk, I will give examples of the use
of each method, focusing attention on the problems of interpretation. I think
it will be clear why observers can derive a lot of pleasure from the study of
Miras, and why theoreticians, for the most part, can not.
537
I!I

THE DIRECT APPROACH
The basic problem wlththe direct approach to measuring the sizes
of Miras is that it really is not very direct. We don't measure the size
of an image with a ruler. Rather, we observe some optical phenomenon that
is related to the size of the star -- the visibility of interference frin-
ges at different mirror separations, or the degree of degradation of the
diffraction pattern as the star disappears behind the moon, or the char-
acter of the speckles in the seeing disk. In each case, a model for the
distribution of light in the true stellar image must be assumed before the
observed quantity can be related to image size. _
How much limb darkening (or brightening) is there? Is the star
round? Does it have spots on it? If the answer assumed for any of these
questions is wrong, so is the angular diameter that we get. Nevertheless,
the results obtained by these techniques have certainly been instructive.
The main problem with using these results is that there haven't been enoughof them.
The angular diameter of Mira was measured with a Michelson inter-
ferometer in January 1925 by Pease at Mount Wilson (see Kuiper 1938). Un-
fortunately, the method could be employed only when the variable was at
maximum light.
Diameter measurements of Miras by lunar occultation observations
are a rather recent innovation, since a time resolution of a few milli-
seconds is needed to resolve the diffraction pattern. A few years ago
Nather and Wild (1973) succeeded in observing an occultation of R Leo at
V = 8 on the declining branch. Its phase was estimated to be 0.27, so
that it should have been very nearly at its maximum diameter if the dia-
meter curve of Pettit and Nicholson (Figure i) is valid. The light curve
of this event is shown in Figure 2. Anyone whohas seen occultation data
for just about any other star will recognize that R Leo is enormous. The
. diffraction pattern is completely smeared out. From the slope of the de-
cline, Nather and Wild computed a uniform-disk diameter of 0.067 arcsec.
For stars as large as this, the occultation technique runs into a
538

t ! ! 8 ! !• ooo •1.0 .e-.--,..,
o_o • • • • o o • o_,_%
Oeo
o_
o
I I I I I0 Io0 200 30o 400 _o0
TIME (MS)
Fig. 2 - Light curve of the occultation of R Leo on 19 May 1972,
as measured by Nather and Wild (1973). The computed angular diameteris 0.067 arcsec.
snag, as Nather and Wild point out. Since there is no diffraction pattern,
there is no information as to the slope of the lunar limb at the point of
contact. One rock could spoil the result. Fortunately this problem can be
overcome by planning simultaneous observations at different observatories.
It does not arise if the star is, say, one-quarter to one-tenth the size of
R Leo; there are many Miras in this range of angular size, but of course they
are correspondingly fainter, and photon noise becomes a problem.
Occultation observations of Miras are now being pursued vigorously
by Ridgway and his colleagues at Kitt Peak (Ridgway, Wells, and Joyce 1977).
Most of their measurements are being made at 2 _ in the infrared, so that
daytime observations are possible. Since it is impossible to control the
motion of the moon, this method will never produce a true diameter curve for
any single star. However, even a simple pair of observations of the same
Mira could be useful in indicating whether the spectroscopic or the photo-
metric diameter curve tends to be confirmed by the direct method. Occultation
measurements of U Ori were recorded by Ridgway, Wells, and Joyce in two dif-
ferent lunations, and they indicate that the diameter is several percent
larger at phase 0.36 than at phase 0.99. This result appears to confirm the
photometric diameter curve, but unfortunately no conclusion can be drawn.
The two observations were made with different filters, one in the continuum
539
and one in an H20 band, and it is quite possible that the measured change in
diameter has more to do with wavelength dependence than with time dependence.
Exciting results obtained by speckle interferometry have recently been
published by Labeyrle, Koechlin, Bonneau, Blazit, and Foy (1977). R Leo and
o Cet were found to be twice as large at wavelengths affected by strong TiO
bands as they are at continuum wavelengths. Information about changes in dia-
meter with phase is still very limited, but the indications are that changes
with wavelength at a given phase are much more dramatic than changes with
phase at a given wavelength. The acquisition of further speckle data, espe-
cially if timed to cover a substantial portion of the light cycle of a single
Mira, would be enormously valuable.
THE PHOTOMETRIC APPROACH
The formula L = 4_R2aT_ is straightforward enough, but the Miras
are not. One problem is that the formula assumes the stars are round -- not
shaped llke jellyfish. We now examine the problems associated with determin-
ing L and Te.
Observationally, it takes a lot of work to determine L, or even the
apparent quantity mbo I. But at least mbo I -- the total radiation from the
star reaching the top of our atmosphere -- is a well-deflned quantity. Since
the time of Pettit and Nicholson (1933), much more sophisticated methods have
been applied to the determination of mb01, including the use of Stratoscope
scans to interpolate between the various infrared magnitudes measured from
the ground (Smak 1966). A few observations of Miras have also been made from
high-altitude aircraft (Strecker, Erickson, and Witteborn 1978). I am cur-
rently collaborating with J. Smak on the determination of mbo I for a large
set of Miras from extensive wide- and narrow-band photometry. My impression
is that if you are willing to do the work and are careful about the photo-
metric calibrations, you can determine mbo I to an accuracy of a few percent.
Recent work on this problem has not changed the character of the bolometric
light curves derived by Pettit and Nicholson. In other words, I don't think
540

errors in the determinationof mboI can be responsiblefor the discrepanciesmentionedabove.
Light curvesmeasured at carefully-chosencontinuumpoints in the
infraredcan give a good approximationto the bolometriclight curve. Lock-
wood and Wing (1971)have publishedlight curvesfor 25 Miras in I(i04),
measuredphotoelectricallywith a narrow bandpassat 10400 _, and they were
found to have the same amplitudesand phasingas the bolometrlclight curves
of Pettit and Nicholson. Since I(I04) is very much easier to measure than
mbol, it is nice to know that it providesessentiallythe same information.
The I(104) light curveshave proved quite interesting,especially
since each measurementof magnitudehas been part of a set of narrow-band
photometrywhich also gives the spectraltype (fromthe strengthsof TiO and
VO bands) and the near-lnfraredcontinuumcolor. When I started this work
in 1965, my hope was that the I(i04) curve of any Mira would repeat so well
from cycle to cycle that its characteristicscould be establishedonce and
for all. SeveralMiras were followedthroughtwo or three cycles to test
this idea, and the first resultsseemedpromising. Figure 3 shows the visual
and I(i04) curves for W Peg in two successivecycles. The V curves,measured
photoelectricallywith a UBV photometer,show typicalcycle-to-cyclediffer-
ences: one maximumis 0.3 mag brighter than the other,and it occurredahead
of schedule;the slopes on the decliningbranchesare also different. On the
other hand, the I(104)magnitudesfollowedthe same curve in both cycles. I
would like to be able to tell you that the differencesin the visual maxima
were caused by differencesin blanketingof the visual region by TiO, but the
fact of the matter is that W Peg attainedthe same spectraltype, M7.0, at
both maxima.
These observationsof W Peg, from 1965 and 1966, were made with a
spectrumscanner. Since 1969 I have been using a set of eight interference
filtersto obtain similarinformation. In addition,Lockwood (1972)has pub-
lishedextensivephotometryof Miras on a five-colorsystem in the same near-
infraredspectralregion. These three systemshave enough in common that it
has been possible to work out the transformationsbetween them (Lockwoodand
Wing 1971; Wing and Lockwood1973); in particular,all three measure I(i04).
541

i - ' ' ' ' I ° ° ' _ I ' ' a _ I ' ' t ' 1 '
W Peg
/°f°"%.'_ " M6e-M8e
P. 44'.o8
\ x i,,5O_O • 1916
,o V \x\II , , , , I , , , , I , , , , I , , , , I i
0 50 I00 150 2 O0
DAYS
Fig. 3 - Photoelectric light curves in V and 1(104) for W Peg, a
typical Mira variable, during the accessible portions of two consecu-tive cycles. In this case the differences in the visual curves are
not reflected in the 1(104) curve. Note also that the infrared maxi-
mum occurs well after the visual maximum. From Wing (1967).
When Lockwood and I combined our data tO form IIi04) light curves for
several Miras over a number of cycles, it became clear that cycle-to-cycle
differences do occur in the 1(104) curves quite commonly, and that the nice
behavior shown by W Peg in Figure 3 is the exception rather than the rule.
Several of these 1(104) light curves are shown in Figure 4, where different
542

4 R CAM_., _ $3,7e X CYG
5 "8"# _,_"_ ?.71.3 0 ,,-. 405.sST'2e
I
M6.5o
Ih _ %, 292.?. 3 - RCYGw :_" S HER $3,9eo ..J M5,Se ,,, ,, 428.4:D 305.6 a JJI- .. _4"
./p "-. R LEO z:E 1,_" " M7e O' R CASMTe
309.3 _; "_" 425.6
,,_€ M6.Se328.0
3 _ _.,_=_.,,.,,. :"i R AUR
i MG.5eli.,,,,i,, _ ,,,_....t_/,f_.,,3t L.. M6.5eX329.70PH 453.2! I I I I I I I I I I I I ! • I I ! I ! ! I I I ! ! ! I .
0 0.5 LO 0 0.5 1.0PHASE PHASE
Fig. 4 - Light curves in I(i04), an infrared continuum point, forMiras of relatively short period (left) and long period (right). Belowthe name of each star is its mean spectral type at maximum light (Keenan1966) and the mean period used in calculating the phases. From Lockwoodand Wing (1971).
symbols have been used to distinguish the different cycles. The stars of
relatively short period usually repeat fairly well, while the large-amplltude,
400-day Miras show more substantial cycle-to-cycle differences. From an
analysis of these differences in terms of the simultaneously measured spectral
types and color temperatures, we were forced to conclude that cycle-to-cycle
differences affect the bolometric curves as well.
Several of the stars in Figure 4 show humps on the rising branch, at
about phase 0.7. Similar humps have long been known to occur in the visual
light curves of certain Miras, and it was not known whether they are caused
by superficial changes in spectroscopic features or by more basic changes in
the continuum radiation. Now we see that the humps are present in the con-
tinuum radiation; blanketing changes do not affect the 1(104) magnitude, and
543

in any case the spectral types were observed to remain constant, at their
latest value, throughout the interval from phase 0.6 to 0.8, whether or not
a hump occurred in the light curve. The TiO and VO bands used for spectral
classification are evidently formed very far from the layer emitting the
continuum; these molecules do not start to dissociate until a month or two
after the photospheric temperature has started to rise.
The infrared data show that humps on the rising branch are quite
common: most stars observed in two or more cycles show a hump in at least
one cycle. On the other hand, few stars seem to have humps in every cycle.
It is difficult to avoid the conclusion that humps also occur in
the bolometric light curve, whenever they occur in 1(104). If we know the
shape of the bolometric curve, we can use the color temperatures measured
in the infrared continuum, along with the usual formula, to inquire how the
radius changes when a hump occurs. Interestingly, the color temperatures
are observed to increase smoothly and monotonically, from minimum to visual
maximum, no matter whether a hump occurs in the light curve or not; there
is never a hump in the temperature curve. Thus the leveling-off or decrease
in luminosity following a hump must be the result of a rapid decrease in
radius prior to maximum light. Lockwood and I suggested that the occurrence
(or not) of a hump of the rising branch is simply the result of the interplay
between rising temperature and decreasing radius during this part of the
cycle.
This brings us to the question of what temperature is really appro-
priate to use in the formula L = 4=R2_T_. The fundamental problem with
applying this formula to the Mira variables, it seems to me, is that the
effective temperature Te is defined by this formula and has meaning only
if we can attach a meaning to the radius R. Since the star has no membrane,
we have to think of the radius as the distance from the center of the star
at which the optical depth takes on some value, such as unity; as we have
seen, the radius is then strongly wavelength-dependent and may vary by as
much as a factor of two over the width of a strong spectral feature. Some
kind of averaging is needed, but it is not clear what kind of mean opacity,
or mean radius, corresponds to the "effective" temperature. There are
544

innumerableways of estimatingthe temperatureof a Mira spectroscopically
or photometrically,but differentmethods often give substantiallydifferent
results, in part because they refer to differentlayers of the atmosphere
which really do have differenttemperatures,and in part becausemost line
ratios and photometriccolor indicesare not pure indicatorsof temperature.
So what do we do? The usual responseis to go ahead and use the for-
mula anyway. That is, we determinemboI as best we can, estimateTe from a
color index that we hope is representative(orworse, from the spectraltype),
and bravelyplug them into the formulato computethe size. This gives us a
number,but we really don't know how this number is relatedto the size of
the star.
Applicationsof the photometricmethod to Mira variablesdo at least
give internallyconsistentresults,as exemplifiedby Pettit and Nicholson's
diametercurve in the center of Figure i. The size (or rather, this number)
is smallestnear the time of visualmaximum, and it increasesmost rapidly
between the times of visual maximumand bolometricmaximum,which occurs one
or two months later. Nearly all spectroscopicand photometrictemperature
indicatorsagree that the highest temperatureoccursvery close to the time
of visual maximum; if the temperaturereally drops during the followingmonth
or so, a rapid increasein the size of the emittingregion is needed to ac-
count for the increasein bolometricflux.
There are three furtherresultsfrom the narrow-bandphotometryof
Miras which, althoughnot clearlyrelatedto radius variatlons,do tell us
a good deal about the structureand extent of their atmospheres:(i) the
temperaturesmeasuredin the continuumare usuallymuch higher thanwould
be expected from the spectraltype; (2) spectraltypes determinedfrom dif-
ferentTiO bands are often grosslydiscordant;and (3) the variationsin
spectraltype are only looselycoupledto the variationsin color tempera-
ture. While each of these findingscame as a surprise,I believe they are
all manifestationsof the same thing,namely the great stratificationof
these stars' atmospheres.
Color temperaturesthat are abnormallyhigh for the spectraltype
do not always occur -- as a consequenceof the loose couplingindicatedin
545

the third result above, the effect can go either way -- but most Miras have
high temperatures for their spectral types at most phases. The effect is
most conspicuous (and best established) in the early-type Miras near maximum
light, when the near-infrared color temperatures are completely free from
blanketing effects. For example, R Tri at its 1965 maximum attained a color
temperature as high as that of a normal K4 giant, but its spectral type was
never earlier than M3 (Spinrad and Wing 1969). I interpret this as meaning
simply that the continuum and the absorption spectrum are formed very far
apart, in regions of very different temperature. In other words, the atmo-
sphere of a Mira is more stratified than that of a normal giant (Wing 1967).
A recent study of hydrodynamlcal phenomena in Mira variables (Willson
and Hill 1979) lends credence to the conclusion that their atmospheres may
be more distended than those of non-varlable M giants of the same luminosity.
There is simply not enough time for the atmosphere to recover from the effects
of one shock wave before the next shock starts to propagate through it. The
atmosphere is thus never in a "normal" state, and although the star has the
energy output of a giant, the physical characteristics of its atmosphere,
such as density and temperature structure, may more closely resemble those of
a supergiant. Indeed, Mira variables seem spectroscopically to have the luml-
nosities of superglants, if their pressure-sensitivellne ratios are inter-
preted in the usual way. For this reason, Keenan has always refrained from
assigning luminosity classes to Mira variables (Keenan 1966; Keenan, Garrison,
and Deutsch 1974). Unfortunately, not all investigators have exercised such
restraint, and superglant luminosity classifications have been published for
several Miras, leading to possible confusion as to their actual luminosities.
The second of the results from narrow-band photometry mentioned above
refers to the assignment of temperature classes. For the Miras, temperature
classification becomes ambiguous as soon as we consider two different classi-
fication criteria -- even if they are just different bands of the same mole-
cule. In Figure 5, we see that the relative strengths of the TiO bands mea-
sured by filters i and 3 on the elght-color system are not the same in the
Mira as they are in the giant. For the giant we get the same spectral type
from both TiO bands and from the continuum color, while for the Mira we get
546

i _ l ' I ' i ' i JJ i ' i ' i ' i ' i
T /56 Leo U Cel1.0 M5.8 "[][ 1969 Nov.5Mag _' Mira variable
_L TiO 12,3) Filler I _ M6.0Filler 3 _ M4.5
- T_O (0,0)
I , I ,, I , I , I J_ I , I , I , I , I0.7 0.8 0.9 1.0 I.I 0.?' 0.8 0.9 1.0 I. I
x(#)Fig. 5 - Eight-color photometry for 56 Leo, a normal, unreddened
giant, and U Cet, a Mira variable. The two stars have nearly the same
TiO strength at filter i but different TiO strengths at filter 3 and
very different color temperatures. From Wing (1974).
M6 from the zero-volt TiO band, M4.5 from the excited TiO band, and M3 from
the color. Clearly we must be careful in using spectral classifications of
Miras; in particular, we should not use them to infer the temperature of the
photosphere. At the same time, these results encourage me to hope that the
infrared color temperature from the eight-color photometry may indeed be
suitable to use in calculations of the radius, since it appears to refer to
the same deep layer from which most of the total flux is emitted.
The loose coupling between color temperature and band strength is
illustrated in Figure 6. The loops executed by Miras are really enormous --
the band strengths can differ by a factor of two or more between phases of
the same color temperature. Because of this, bolometric corrections for
Miras must betabulated as two-dimensional functions of band strength and
color, rather than as one-dimensional functions of spectral type as have
always been used in the past. Another consequence of these loops is that
they render the band-strength data virtually useless for abundance deter-
minations.
547

50
o1.5 2.0 2.5 3.0 3,5 4_ 4.5
O
Fig. 6 - An index of molecular band strength is plotted againstthe reciprocal color temperature (5040/T), both measured in the near
infrared with a scanner (Wing 1967). Normal giants define the heavyline ending in the box labeled RX Boo, whereas Mira variables execute
large loops. See Spinrad and Wing (1969) for details.
These loops can be interpreted in the same way as the other phenomena
we have discussed -- the band strengths and the continuum color refer to
widely separated regions, the temperature variations in which are out of
phase. This behavior could be modeled if all Miras showed loops that were
at least qualitatively similar, but they're all different! In Figure 6,
X Cyg goes clockwise while U Her goes counter-clockwise. In fact, the loops
shown by the same star in different cycles are not necessarily any more simi-
lar than the loops of two different stars.
Well, what do you expect of a jellyfish? Remember that the layers
contributing to the spectra are near-perfect vacua separated by millions of
miles, and you will be able to excuse their poorly-coordinated performance.
548

THE SPECTROSCOPICAPPROACH
Thespectra of Miras are incredibly complex. They are dominated in
the ultraviolet and blue regions by atomic absorption lines, in the visual
and near infrared by bands of metallic oxide molecules, and in the infrared
beyond 1.5 B by innumerable lines from the rotatlon-vlbratlon transitions of
CO and H20. In addition to these absorption features, emission lines of vari-
ous descriptions are present. Hydrogen lines of the Balmer, Paschen, and
Brackett series are strong in emission during more than half the cycle, from
just before maximum to approximately the time of minimum light; since absorp-
tion lines can be seen (and identified) within the broad emission profiles of
the Balmer lines, it is clear that the hydrogen emission is produced in a
deep layer of the atmosphere (Joy 1947). Some of the weaker emission lines
are known to be produced by fluorescence, and although I will not discuss
these particular lines further here, I should mention that the careful study
of fluorescence mechanisms in Miras can provide important information about
the structures and motions of their atmospheres (Wing 1964; Willson 1976).
In fact, the very fact that fluorescence mechanisms are operative shows that
these atmospheres are so rarefied that the populations of excited levels in
atoms are governed by radiative processes rather than by collisions. Other
metallic emission lines seem to be produced by recombination, some remain un-
identified, and still other emission lines have been found to have molecular
origins. Interesting reviews of the line spectra of Miras have been published
by Merrill (1960) and Willson (1976).
Recent observations of Miras have revealed additional emission lines.
Just six weeks ago, the first emission lines to be detected in the ultraviolet
spectrum of a Mira variable below the atmospheric cut-off were recorded in
R Leo with the IUE satellite (Wing and Carpenter 1978). At the other end of
the spectrum, lines emitted by OH, H20 , SiO, and CO have been detected in the
microwave region.
Spectroscopic studies of the pulsational properties of Miras are based
on the measurement of radial velocities. Unfortunately, an accurate measure-
ment is not enough; there are three problems with which we must deal before
549
IIIII
the radial-velocitydata can be convertedinto informationabout the expan-
sion and contractionof the atmosphere. First,becauseof projectioneffects,
the measured radialvelocitydoes not tell us immediatelythe motion of the
surfaceof the star; we must apply a very uncertaincorrectionfor geometry
and limb darkening. Emission lines are particularlydifficultto use, since
they may be either limb-darkenedor llmb-brightened,dependingon the depth of
their formation. This problemhas been discussedrecentlyby Wallerstein
(1977). A more importantproblem,also discussedby Wallerstein,is that it
is not sufficientto know the absolutemotion of the surface;we must also
know the radial velocityof the center of mass of the star before we can tell
whether the surfaceis moving up or down. Finally,when we find that different
spectralfeatureshave differentradialvelocities,we must somehowdecide
which featureto use as an indicatorof the photosphericvelocity.
For many years, most of the radial-velocitywork on Miras was done at
Mount Wilson Observatory,mainly by Merrilland Joy. The spectroscopic
radial-velocitycurve shown in Figure 1 was taken from an early study of Mira
by Joy (1926);28 years later Joy (1954)publisheda second study of Mira,
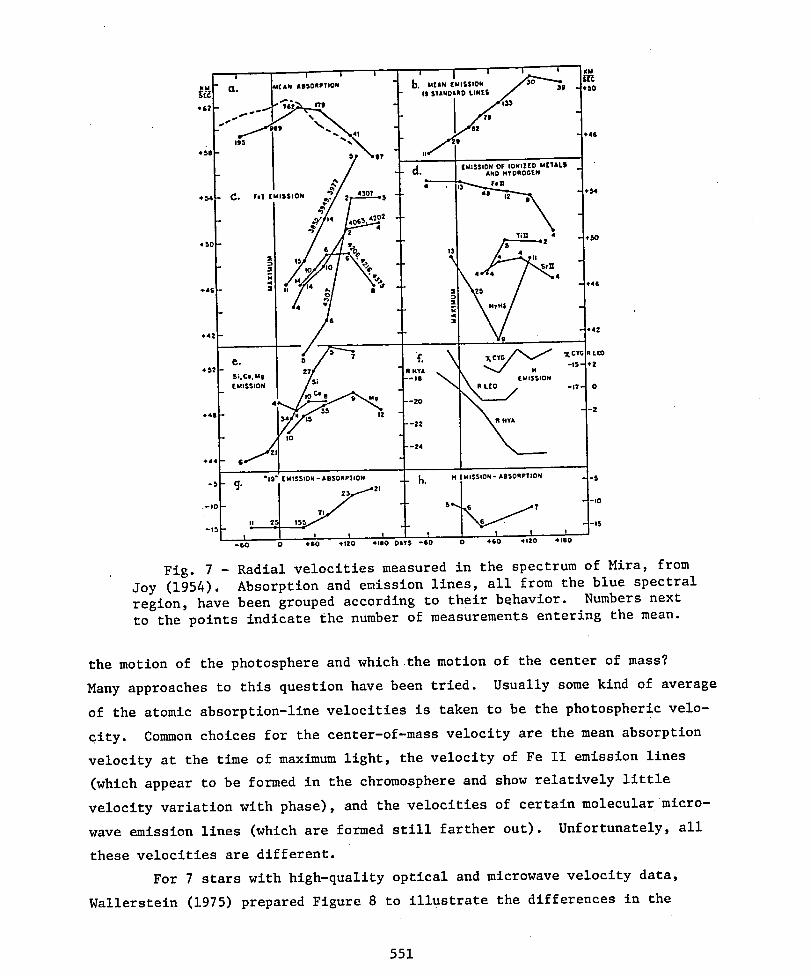
from which Figure 7 was taken. Quite generally,the emissionlines show
smallerradial velocitiesthan absorptionlines, i.e. the emittingregions
are moving outwardand/or the absorbingregionsare fallinginward. [The only
red-shlftedemissionlines that have been identifiedin Miras are certain
fluorescentlines that are excitedby off-centercoincidences(Wing 1964)].
Differentemission lines,however,displayvery differentbehavior:note in
particularthe curves for Joy's "standard"metallic emissionlines, the Fe II
lines, and the hydrogenlines in panels (b) and (d) of Figure 7. The be-
havior of the absorptionspectrumis also rather complex:Merrill, in several
papers,reportedthat the radialvelocitiesof absorptionlines show a de-
pendenceupon excitationpotential-- anotherindicationof extremestrati-
fication. In addition,a few instancesof doubling of atomic lines have been
reported,and evidenceof incipientllne doubling (fuzzyor irregularline
profiles)is rather common.
Faced with the many differentvelocitiesthat are present in the
spectrumat any given phase, how can we decide which velocitybest represents
55O
i | I I I j I I I KM
NM - (1 M(AN ABSORPTION 1'1. M[AN (MISSION _"_'_39
* ,_" |1 SIANOARO LIN(S _ -- " ..0
" I 41 _ - II
+$8 - / _9? .- u.'J I (MISSIONANDOFHyDROGtNIONIZtDMt1AIS . "
*_4- C. r.,(-,ss,o. Z_ _ 43o,s "" ..
I \_SO --
i; 13 / ,
4-46 - _ * 4"46
.4z - I
- I / '°°'B/";'_.1 \_-_/
'Jo . 22
4"44 Ee _'_I --24
-5 - €_. "19" (MISSION-ABSORPTION -- h. H (MISSION- ABSORPTION -S
-I0
.-sO - ?I
II ___ IS -IS
-'_- I * i I I I I I-60 0 *SO 4'120 4100 OaTS -SO 0 4&O _120 ,4"180
Fig. 7 - Radial velocities measured in the spectrum of Mira, from
Joy (1954). Absorption and emission lines, all from the blue spectral
region, have been grouped according to their behavior. Numbers next
to the points indicate [he number of measurements entering the mean.
the motion of the photosphere and whlchthe motion of the center of mass?
Many approaches to this question have been tried. Usually some kind of average
of the atomic absorption-line velocities is taken to be the photospheric velo-
City. Common choices for the center-of-mass velocity are the mean absorption
velocity at the time of maximum light, the velocity of Fe II emission lines
(which appear to be formed in the chromosphere and show relatively little
velocity variation with phase), and the velocities of certain molecularmicro-
wave emission lines (which are formed still farther out). Unfortunately , all
these velocities are different.
For 7 stars with hlgh-quality optical and microwave velocity data,
Wallerstein (1975) prepared Figure 8 to illustrate the differences in the
551

R Aql 284 days U Ori 572 daysI-O 2-1-I---- SiO v=l I I SiO v=l
2-1-H-- H20 I H20
-.---- OH 1665,7 I I I OH.1665,7
_n,n "_" OH 1612 _: _s Pi OH 1612OPTICAL _ , :-" - OPTICALI , , , I , I , t t I 1 I I ! i I _ I
R Leo 313 days W Hyo 382 daysI To I-O I-0
2/i SiO v=2 I SiO v=22-1_ SiO v= I -.----__ SiO V=I
I H20 I-O I H20I OH 1665,7 I I OH 1665,7
E CS P CS E PI I I OPTICAL I I I OPTICAL
! , I I I w , , I I I , I I I , t , IS Cr B :560 days R Hya 588 days
•.,,- -- -- -;'0 I-0-Lr----,- SiO v=l - _ , SiO v=l
I H20 _isE PI I OPTICAL
I I OH 1665,7 UIH" ' ,.,v_"l.... ,I OH 1612 =r 4 daysE ..CS P 2-I 2-II I OPTICAL _ -,t-," SiO v=l
I ! ' ' I , , , I , I -_) I-0 H20
-16 -8 0 ElI cs p OH 1665,7-_- I OPTICAL
! , , , ! w i , I-16 -8 0
Fig. 8 - Radial velocitiesof variousopticaland radio linesplottedrelative to the velocityobtainedfrom high-excltationabsorp-tion lines (labeledP for "photospheric")for 7 well-studiedMira var-iables. Characteristicvelocitiesof opticalemission (E) and circum-stellar (CS) lines are plottedas well as the velocitiesof radio lines
of SiO, H20, and OH. From Wallerstein(1975).
variousobservedvelocitieswhich might be consideredto representthe motion
of the centerof mass. Also includedare the characteristicvelocitiesof
optical emissionlines and circumstellarabsorptioncomponents. The reference
velocity in each case is that of the absorptionspectrumand is labeledP
for "photospheric". Because of the dependenceof the absorption-linevelocity
upon excitationpotential,Wallersteinused only high-excltationlines, which
are formed in deeper layers than the low-excitationlines, in the determina-
tion of P. Even with this precaution,however, it is doubtfulwhether this
velocityrefers to a layer as deep as the true photosphere,and in fact the
results from the infraredCO lines discussedbelow seem to show that it does
not.
552

Since Figure 8 was originally drawn, thermal (as opposed to maser)
SiO emission has been detected from several Miras. Since this emission must
arise in a large, low-density region, it should indicate fairly directly
the center-of-mass velocity of the star. According to Reid and Dickinson
(1976), the circumstellar emitting region has a modest velocity of expansion
(as inferred from the SiO line profile), and the center-of-mass velocity is
smaller than the velocity derived from atomic absorption lines at bright
phases, i.e. the gas producing the absorption is seen falling back in.
Once the necessary decisions have been made, the radial-velocity
curve can be integrated to determine the distance moved by the gas producing
the measured lines. The corresponding change in surface area can then be
calculated and compared to that obtained by the photometric method. When-
ever this exercise has been carried out, as for example by Pettlt and Nichol-
son (see Figure i) and more recently by Wallerstein (1977), it has revealed
a disturbing discrepancy: the motion of the gas inferred from the photometry
is simply not confirmed by the measured radial velocities. In fact, Waller-
stein showed that a discrepancy exists no matter what value is assumed for
the center-of-mass velocity, since part of the problem is that the amplitude
of the radial-veloclty variations -- at least for atomic lines in the blue --
is much too small to correspond to the photometric variations.
If, like Wallerstein, we choose to assume that the atomic absorption-
llne velocities are indicating the actual motion of the photosphere, then we
are forced to look for an error in the interpretation of the photometry.
Wallerstein's (1977) suggestion is that we have been fooled by an opacity
effect: the apparent increase in size between the times of visual and bolo-
metric maxima is not due to an actual outward movement of the gas but is
simply the result of an increase in the atmospheric opacity as the tempera-
ture drops and molecules and grains form. However, this explanation has a
fatal flaw. Although an increase in opacity can indeed cause an increase
in the apparent size as measured directly (say by an interferometer of some
kind), there is no way that it can produce an increase in size as "seen" by
a photometer, since an increase in opacity cannot make the star become bolo-
metrically brighter.
553

If, on the other hand, we assume that there is nothing basically
wrong with the conventional interpretation of the photometry, we must con-
clude that the atomic absorption lines seen in the blue spectral region,
even those of high excitation, do not arise in the photosphere, i.e. the
layer producing most of the bolometric radiation seen by a photometer.
This could be the case if the opacity is much greater in the blue than in
the infrared. Evidence in favor of this conclusion has finally been pro-
duced by studies of hlgh-resolution infrared spectra which show lines which
d__£ohave the radial velocities, and the large velocity amplitudes, that are
expected for the motion of the photosphere.
The real break-through/ it seems to me, came from investigations of
line doubling, particularly Maehara's (1968) study of the doubling of atomic
lines on near-infrared spectrograms of X Cyg, an S-type Mira. Instances of
line doubling in Miras had been reported earlier -- in the S star R And
(Merrill and Greenstein 1958; Spinrad and Wing 1969) and in the carbon star
R Lep (Phillips and Freedman 1969) -- but Maehara was the first to carry out
a spectroscopic analysis of each set of lines separately and to establish
that the blue component is produced in much hotter gas than the other. He
therefore was able to construct a reasonable model involving a layer of
shock-heated gas rising through a stratum of cooler gases.
Maehara also measured the velocities of the lines of TiO and CN on
his near-infrared plates of X Cyg. These were not doubled, but they didn't
have the same velocity, either. The CN lines were found to be formed in the
warm, rising layer, while the TiO lines were formed in the cooler layer. No
wonder it has been hard to interpret the molecular band strengths of Miras
in terms of a single-slab model!
With a two-component model, it is not difficult to see how the dis-
crepancy between the photometric and spectroscopic results might be resolved.
We must simply suppose that, during the maximum and post-maximum phases, most
of the light comes from the deep, rising layer -- which brightens bolometri-
cally as it swells and rises above the sources of continuous and molecular
opacity in the cooler, in-falling layer -- while most of the absorption lines
seen spectroscopically are produced in the in-falling layer.
554

It is only when double lines can be seen in the spectrum that we can
measure the temperatures and motions of both layers and thus obtain the infor-
mation we need to specify the parameters of a two-component model. Spectro-
grams of Miras in the blue region generally do not show double lines; evident-
ly the opacity in the blue is too great to allow the deep layer to be seen.
Rayleigh scattering, with its 1-4 dependence, is likely to contribute to the
opacity in the blue, along with TiO bands and the overlapping wings of atomic
lines. The advantage gained by Maehara (1968) in using the near-infrared and
by Spinrad and Wing (1969) in using the one-micron region is considerable. It
is also no mere coincidence that all reported instances of atomic line doub-
ling have been found in S- and C-type Miras, which have lower atmospheric opa-
cities than the much more common M-type Miras. [I do not count the doubled
lines reported in o Cet by Adams (1941), since the displaced components that
he saw were from an expanding circumstellar shell, rather than a deep layer
of rising gas].
Much more complete information about the two-component model has come
from the study of the infrared lines of carbon monoxide. The two-micron re-
gion where the first-overtone CO bands lie corresponds to the minimum opacity
due to H-, which in any case is seriously depleted at the cool temperatures
of Miras because of the shortage of free electrons. Although the CO lines
themselves are strong, they are not very densely packed, and it is possible
to see down to the photosphere between these lines. Furthermore, the CO mole-
cule is very stable and can exist at the high temperatures of the shock-heated
photosphere. Hence it is possible to see photospheric CO absorption lines
whenever the motion of the photosphere displaces them from the corresponding0
lines formed in the cool outer envelope.
Figures 9 and i0 show a section of the spectrum of X Cyg in the region
of the first-overtone CO bands on two different dates. They were obtained
with a Fourier-transform spectrometer at the Kitt Peak National Observatory.
Wavenumber increases from upper left to lower right. Most of the absorption
features visible in these spectra are due to CO, although telluric H20 lines
are also present. For orientation I have labeled the (3,1) and (2,0) band
heads of C12016 on the third and fourth strips, respectively, of Figure 9.
555

cbt €'nst 1176 Ji. 11
$,0
I
O JO 20 30
Fig. 9 - The spectrum of X Cyg from 4240 to 4360 cm-I (2.36 to
2.29 p) on 1976 Jan. 12_ when the star was at minimum light (phase
0.57). The (2,0) and (3,1) heads of C12016 and the (2,0) head of
C13016 are labeled, as are the rotational quantum numbers of some of
the lines of the (2,0) band (in the third strip). All CO features
are sharp and single. From an unpublished Kitt Peak spectrum (cour-
tesy D. N. B. Hall, S. T. Ridgway, and K. H. Hinkle).
The (4,2) head is in the left half of the first strip, where the spectrum is
messy because of H20 contamination, and the (2,0) head of the isotopic molecule
C13016 is clearly visible in the right half of the first strip. I have also
labeled, on the third strip, the rotational quantum numbers of some of the R-
branch lines of the (2,0) band of C12016; the two sequences can, of course, be
followed into the fourth strip, but they become blended together as they ap-
proach theband head, which occurs at about quantum number 50.
The spectrum shown in Figure 9 was taken at minimum light when the CO
lines are Sharp and single. The one shown in Figure i0 was obtained seven
556
i i I i l I i i i , i , , i i i
l_l A_ • fill_ _ .... III --I.i _ IIIi_ --II. I
0 l0 20 30
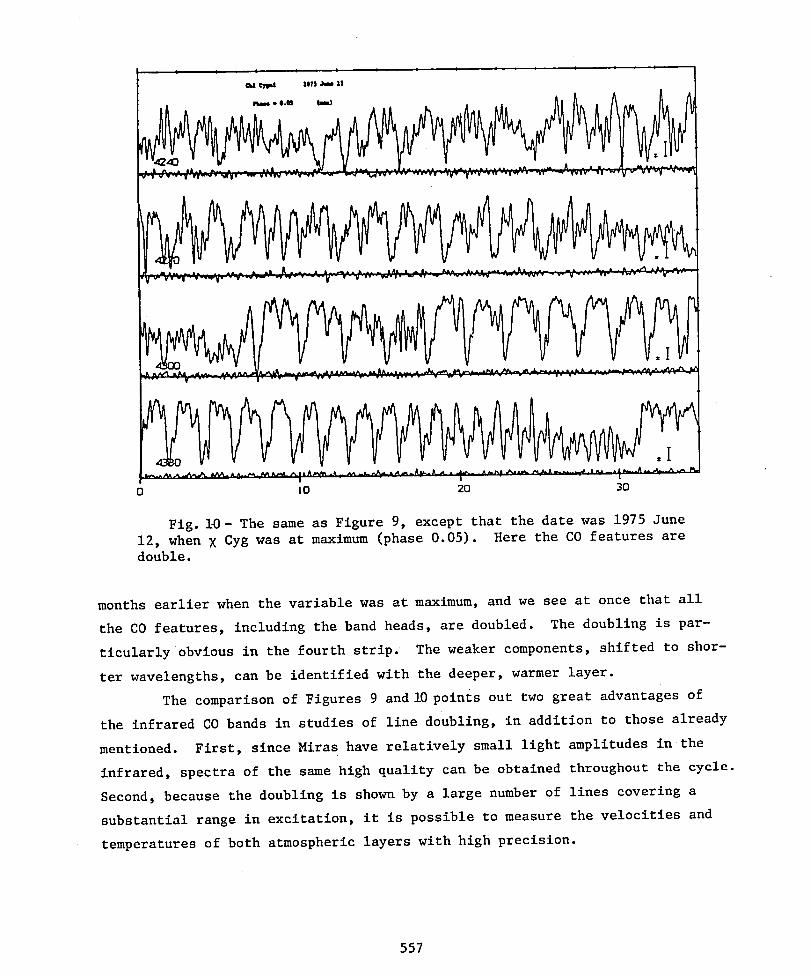
Fig. 10- The same as Figure 9, except that the date was 1975 June
12, when × Cyg was at maximum (phase 0.05). Here the CO features aredouble.
months earlier when the variable was at maximum, and we see at once that all
the CO features, including the band heads, are doubled. The doubling is par-
ticularly obvious in the fourth strip. The weaker components, shifted to shor-
ter wavelengths, can be identified with the deeper, warmer layer.
The comparison of Figures 9 and l0points out two great advantages of
the infrared CO bands in studies of line doubling, in addition to those already
mentioned. First, since Miras have relatively small light amplitudes in the
infrared, spectra of the same high quality can be obtained throughout the cycle.
Second, because the doubling is shown by a large number of lines covering a
substantial range in excitation, it is possible to measure the velocities and
temperatures of both atmospheric layers with high precision.
557

The first report of the doubling of CO lines in a Mira variable was
published by Maillard (1974), who described the spectrum of R Leo. Two ex-
tensive programs of infrared spectroscopy of Miras have also been undertaken:
one the recently-completed Ph.D. dissertation of K. H. Hinkle, supervised by
T. G. Barnes and D. L. Lambert, at the University of Texas, and the other an
on-going project at Kitt Peak National Observatory, where D. N. B. Hall and
S. T. Ridgway, who initiated it, have now been joined by Hinkle. The Texas
results for R Leo, the star observed most extensively, have been published
(Hinkle 1978 - CO and OH bands) or are in press (Hinkle and Barnes 1979 -
H20 bands). These papers are extremely illuminating, and I hope that the
brief summary I will give here will inspire you to read them. Results from
the Kitt Peak program have not yet been published, but since it uses even
higher spectral resolution and involves extensive coverage of several stars,
it may be expected to shed still more light on the Mira phenomenon.
From the positions and strengths of lines of both CO and OH measured
between 1.6 and 2.5 _ in the spectrum of R Leo at nine distinct phases, Hinkle
(1978) has been able to give a much clearer picture of the velocity and tem-
perature structure and the manner in which these quantities vary through the
cycle. Line doubling is most apparent just before maximum light, since at
that time we begin to see the blue-shifted components from the deep part of
the photosphere, which has just encountered the shock wave of a new cycle,
while the infalling material from the previous cycle has not yet faded from
visibility. In addition, Hinkle identified a third layer, a cool outer shell
which produces only low-excitation lines and is falling slowly back toward the
star; thus some of the infrared lines, at certain phases, were actually seen
as triple.
These results are shown in Figure ii, in which velocity is plotted
against phase. This figure is based on the first-overtone OH bands; similar
results were obtained for the first- and second-overtone CO bands. For the
purposes of the present discussion, two results stand out as being the most
important. (I) The velocities of the warm, blue-shifted component near maxi-
mum light are algebraically much smaller thanany previously seen in the ab-
sorption spectrum and are similar to those of the hydrogen emission lines;
558
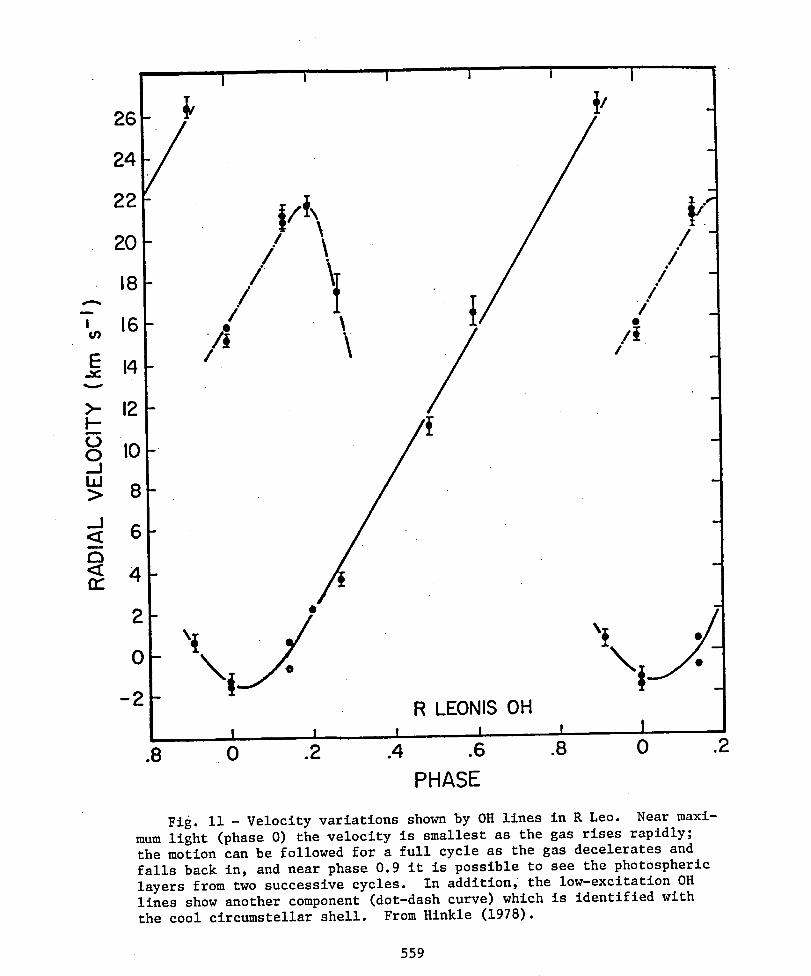
Fig. ii - Velocity variations shown by OH lines in R Leo. Near maxi-mum light (phase 0) the velocity is smallest as the gas rises rapidly;the motion can be followed for a full cycle as the gas decelerates andfalls back in, and near phase 0.9 it is possible to see the photosphericlayers from two successive cycles. In addition, the low-excitation OHlines show another component (dot-dash curve) which is identified withthe cool circums_ellar shell. From Hinkle (1978).
559
i
!!

this is, in fact, the sort of velocity required for the expanding photosphere
inferred from the photometry between the times of the visual and bolometric
maxima. (2) The amplitude of the velocity variation, 27 km s-1, is larger
than any previously found and is, for the first time, consistent with the
photometlic results. The same gas can be seen throughout a complete cycle
as it rises, decelerates, and falls back in.
Hinkle (1978) finds that a consistent pulsational model for R Leo can
be derived if the center-of-mass velocity is 8 ± i km s-I. This value is sig-
nificantly smaller than most of the absorption-line velocities measured in
the blue, which range from 7 to 15 km s-I as a function of pha@e (Merrill
1946, 1952). This displacement of the mean absorption velocity from the
center-of-mass velocity, which indicates that the absorbing material is
falling in, is consistent with the suggestion of Reid and Dickinson (1976)
discussed earlier.
Another molecule that produces a great many lines in the infrared
spectra of Miras is H20 , and its lines, too, are double throughout much of
the cYcle (Hinkle and Barnes 1979). The spectrum of H20 is so complicated
that the doubling of its lines might have gone unnoticed, were it not for the
fact that the H20 lines are sometimes sharp and single. The component that
is always present can be identified with the cool circumstellar layer which
also produces CO and OH lines of the same velocity. The other, which shows
a greater range in velocity, comes from the photosphere. The behavior of the
H20 spectrum is thus similar to that of CO and OH, but there is an interesting
difference. At maximum light, when the warm layer is moving rapidly outward
and the doubling of the CO and OH lines is easily seen, the H20 lines are
single. Hinkle and Barnes offer a simple explanation for this difference:
the H20 molecules are dissociated at the high temperatures of the photosphere
near maximum light, and they do not start to form in appreciable numbers
until about 0.i cycle later, when the photospheric temperature has dropped
sufficiently.
Figure 12 illustrates the doubling of H20 lines in R Leo. Nearly
all the absorption in this spectral interval is due to stellar H20. In the
upper spectrum, taken at maximum light, the lines are single and only the
56O
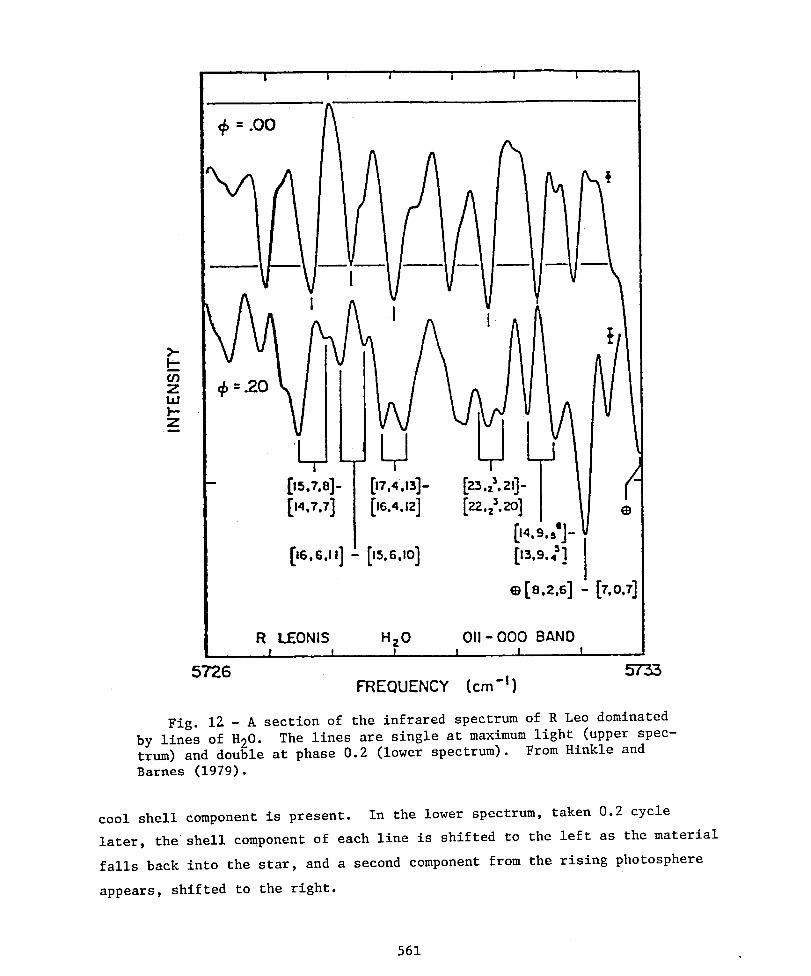
R LEONIS HzO 011-000 BANDI I I I I 1
57"26FFIEQUENCY (cm-I)
Fig. 12 - A section of the infrared spectrum of R Leo dominated
by lines of H20. The lines are single at maximum light (upper spec-trum) and double at phase 0.2 (lower spectrum). From Hinkle andBarnes (1979).
cool shell component is present. In the lower spectrum, taken 0.2 cycle
later, theshell component of each line is shifted to the left as the material
falls back into the star, and a second component from the rising photosphere
appears, shifted to the right.
561

Fig. 13 - Schematic representation of the outer atmosphere of a Miravariable at phases 0.6, 0.9, 0.0, and 0.3, based on infrared spectroscopyof R Leo. The arrows represent gas velocities. From Hinkle and Barnes(1979).
Hinkle and Barnes (1979) have summarized in Figure 13 the picture of
R Leo that they have put together from their infrared observations. At all
phases a cool clrcumstellar shell is present, contributing low-excltatlon lines.
The stellar photosphere pulsates and is at all times hotter than the tempera-
tures conventionally ascribed to Miras -- a result anticipated by narrow-band
photometry in the infrared (Wing 1967). Intermediate temperatures occur in the
star's upper atmosphere, where most of the atomic and molecular absorption lines
are formed and through which the shock wave propagates•
I find the recent results from infrared spectroscopy extremely encour-
aging. On the one hand they show that the spectroscopic approach can indeed
give information about the pulsational properties of Miras. At the same time
562

they show us how to construct a model which, at least in its broad outline,
is consistent with the photometric as well as the spectroscopic observations.
8
CONCLUDING REMARKS
This review has touched upon a wide variety of topics; the common
theme has been the great extent of the observable atmospheres of the Mira
variables. We have considered various methods for measuring the sizes of
these atmospheres, and more particularly the manner in which the size changes
through the cycle. The results obtained by different methods have been com-
pared, and the differences thus found have reminded us that observations of
Miras are not always easy to interpret.
I have emphasized the problems of interpretation because it seems to
me that these are not always given sufficient attention. I hope I have dis-
tinguished between the problems that are the star's fault (such as departures
from spherical symmetry) and those which, dear Brutus, are our own (such as
unwittingly combining results which refer to different parts of the star).
While the Miras will always be difficult objects to treat, some of the pro-
blems that have baffled astronomers for decades have recently disappeared.
In particular the famous discrepancy between the photometric and spectro-
scopic diameter curves turns out not to be a real discrepancy at all, since
the two methods are not looking at the same gas. The discrepancies between
molecular band strength and continuum color temperature can be accounted for
in the same way.
A simple model for the atmospheric structure and motions of Miras,
based on Hinkle's recent observations of the doubling of infrared molecular
lines, has been described. This model, consisting of two atmospheric layers
plus a circumstellar shell, has been remarkably successful in providing a
physically plausible picture of the atmosphere which is consistent with the
photometrically-measured magnitude and temperature variations as well as the
spectroscopic data. However, it is Of course muc_ too simple to account for
all the observations. For example, in Figure 13 the outer atmosphere is
563
represented by a large region at the uniform temperature of 1700°K, whereas
we have long known that temperature and velocity gradients must exist since
the measured velocities of absorption lines show a dependence on excitation
potential. In another paper at this conference, Pilachowskl, Wallerstein,
and Willson (1979) treat the absorption-line velocities as functions of ex-
citation potential, ionization potential, wavelength, and line strength;
their results for the outer atmosphere should now be combined with the
broader picture given by studies of line doubling to obtain a more complete
and realistic model for the atmosphere.
Much observational work on Miras remains to be done. In particular
I would like to encourage work in three areas. First, it is important to
find out how well the radial velocity variations of the infrared molecular
lines repeat from cycle to cycle. In the work done to date it has been ne-
cessary to combine observations from different cycles, and this procedure
generally has not been very successful with other kinds of observations of
Miras. The current program of infrared spectroscopy at Kitt Peak should
settle this point. Second, measurements of molecular band strengths and
photospheric color temperatures should be made around the cycle by narrow-
band photometry, but unlike previous measurements of this kind, they should
be accompanied by high-resolution spectroscopy so that the region of forma-
tion of each spectral feature can be identified from its radial velocity.
Such combined data could form the basis for a more detailed model of the
atmosphere. Finally, direct diameter measurements through as much of the
cycle as possible, by speckle interferometry in well-defined wavelength bands,
are badly needed. Now that it is possible to derive diameter curves from
photometry and spectroscopy that are at least qualitatively the same, we must
be brave and ask whether the same result can be obtained by direct measure-
men t.
I would like to thank Dr. Kenneth H. Hinkle for showing me his results
prior to publication, and for providing the Kitt Peak spectra shown in Figures
9 and i0. I also thank Dr. George Wallerstein for helpful correspondence.
564
REFERENCES
Adams, W. S. 1941, Ap. J. 93, ii.
Cahn, J. H., and Wyatt, S. P. 1978, Ap. J. 221, 163.
Hinkle,K. H. 1978,Ap. J. 220, 210.
Hinkle,K. H., and Barnes,T. G. 1979, Ap. J. (in press).
Joy, A. H. 1926, Ap. J. 63, 281.
Joy, A. H. 1947,Ap. J. 106, 288.
Joy, A. H. 1954,Ap. J. Suppl.!, 39.
Keenan,P. C. 1966,Ap. J. Suppl.13, 333.
Keenan,P. C., Garrison,R. F., and Deutsch,A. J. 1974,Ap. J. Suppl.28,
271.
Kulper,G. P. 1938, Ap. J. 88, 429.
Labeyrle,A., Koechlln,L., Bonneau,D., Blazit,A., and Foy, R. 1977,
Ap. J. (Letters)218, L75.
Lockwood,G. W. 1972, Ap. J. Suppl.24, 375.
Lockwood,G. W., and Wing, R. F. 1971, Ap. J. 169, 63.
Maehara, H. 1968, Publ. Astron.Soc. Japan 20, 77.
Maillard,J.-P. 1974, Highlightsof Astronom9_, 269.
Merrill,P. W. 1946, Ap. J. 103, 275.
Merrill, P. W. 1952, Ap. J. 116, 337.
Merrill, P. W. 1955, "Some QuestionsConcerningLong Period Variable Stars",
in Studiesof Long Period Variables,ed. L. Campbell (Cambridge:
Amer. Assoc. of VariableStar Observers),p. ix.
Merrill,P. W. 1960, in StellarAtmospheres,ed. J. L. Greensteln (Chicago:
Universityof ChicagoPress),p. 509.
Merrill,P. W., and Greenstein,J. L. 1958, Publ. Astron.Soc. Pacific70,
98.
NatHer,R. E., and Wild, P. A. T. 1973, Astron. J. 78, 628.
Pettlt,E., and Nicholson,S. B. 1933,Ap. J. 78, 320.
Phillips,J. G., and Freedman,R. S. 1969, Publ. Astron. Soc. Pacific81,
521.
565
I

Pilachowski,C., Wallerstein,G., and Willson,L. A. 1979, in Current
Problems in StellarPulsationInstabilities,ed. D. Fischel,
J. R. Lesh, and W. M. Sparks (NASA;in press).
Reid, M. J., and Dickinson,D. F. 1976,Ap. J. 209, 505.
Ridgway,S. T., Wells, D. C., and Joyce, R. R. 1977, Astron.J. 82, 414.
Smak, J. I. 1966, Ann. Rev. Astron.Ap. _, 19.
Spinrad,H., and Wing, R. F. 1969,Ann. Rev. Astron.Ap. _, 249.
Strecker,D. W., Erickson,E. F., and Witteborn,F. C. 1978, Astron.J.
83, 26.
Wallerstein,G. 1975,Ap. J. Suppl.29, 375.
Wallerstein,G. 1977, J. Roy. Astron. Soc. Canada71, 298.
Willson,L. A. 1976,Ap. J. 205, 172.
Willson,L. A., and Hill, S. J. 1979,Ap. J. (in press).
wing, R. F. 1964, Publ. Astron. Soc. Pacific76, 296.
Wing, R. F. 1967, Ph.D. dissertation,Universityof California,Berkeley.
Wing, R. F. 1974, Highlightsof Astronomy_, 285.
Wing, R. F., and Carpenter,K. G. 1978, Bull. Amer. Astron. Soc. iO, 444.
Wing, R. F., and Lockwood,G. W. 1973, Ap. J. 184, 873.
566