MIP System Field Test Results for High Level TPH-GRO · Subsampling the MC5 Cores for TPH-GRO Once...
12
MIP System Field Test Results for High Level TPH-GRO Salina, KS Summer 2011 Tom Christy and Blake Slater run MIP logs at local site in Salina, KS where gasoline contaminates the soil and groundwater. Release occurred over 10 years ago. This log is being run at the hi-level GRO test area. GRO = gasoline range organics TPH = total purgeable hydrocarbons
Transcript of MIP System Field Test Results for High Level TPH-GRO · Subsampling the MC5 Cores for TPH-GRO Once...

MIP System Field Test Results
for High Level TPH-GRO Salina, KS
Summer 2011
Tom Christy and Blake Slater run MIP logs at local site in Salina, KS where gasoline contaminates the soil and groundwater. Release occurred over 10 years ago. This log is being run at the hi-level GRO test area. GRO = gasoline range organics TPH = total purgeable hydrocarbons

Field Site Sketch Map Petroleum/Gasoline Range Organics
Bar
ney
St
Lincoln Ave
Service Bldg
N
MIP Log
MC5 soil core
Power tower
Not to Scale
Power pole
2
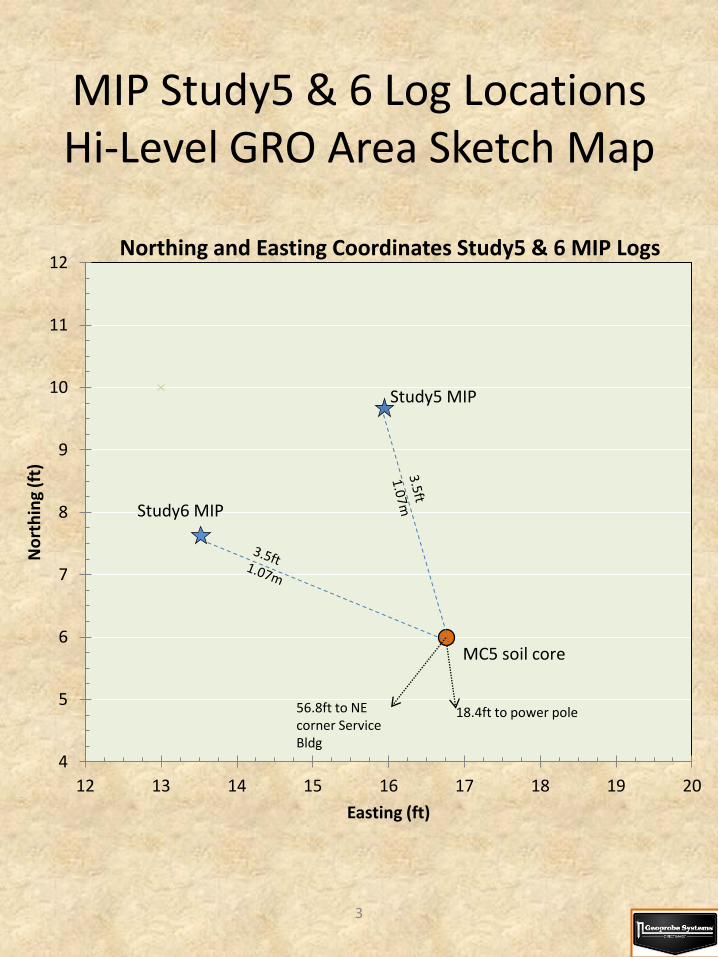
MIP Study5 & 6 Log Locations Hi-Level GRO Area Sketch Map
4
5
6
7
8
9
10
11
12
12 13 14 15 16 17 18 19 20
No
rth
ing
(ft)
Easting (ft)
Northing and Easting Coordinates Study5 & 6 MIP Logs
56.8ft to NE corner Service Bldg
18.4ft to power pole
MC5 soil core
Study5 MIP
Study6 MIP
3
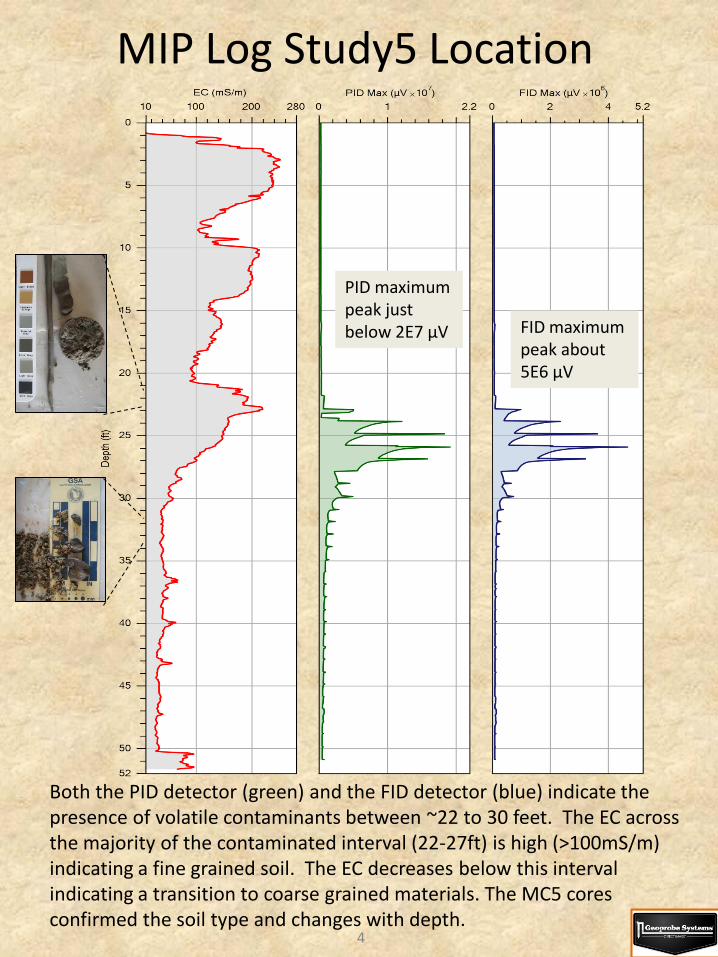
MIP Log Study5 Location
Both the PID detector (green) and the FID detector (blue) indicate the presence of volatile contaminants between ~22 to 30 feet. The EC across the majority of the contaminated interval (22-27ft) is high (>100mS/m) indicating a fine grained soil. The EC decreases below this interval indicating a transition to coarse grained materials. The MC5 cores confirmed the soil type and changes with depth.
PID maximum peak just below 2E7 µV FID maximum
peak about 5E6 µV
4

Overlay of Study5 & 6 MIP Logs
These logs were run one after the other about 3ft (1m) apart. Good overall agreement between the replicate logs indicates moderate to high level VOC contamination between ~22 to 30ft. Small detector peaks below 30ft here may represent carry-over of contaminants in the MIP probe and trunkline system. A heated trunkline was not used for these logs.
Study5 log = red Study6 log = blue dash
5

Macro Core MC5 Soil Sampling for TPH-GRO
MacroCore MC5 closed piston system equipped with a 5ft (1.52m) core barrel and PVC liner was used to collect 4ft (1.22m) long soil cores to a depth of 40ft (12.2m) adjacent to the replicate logs at the high-level GRO area. (See map above)
6
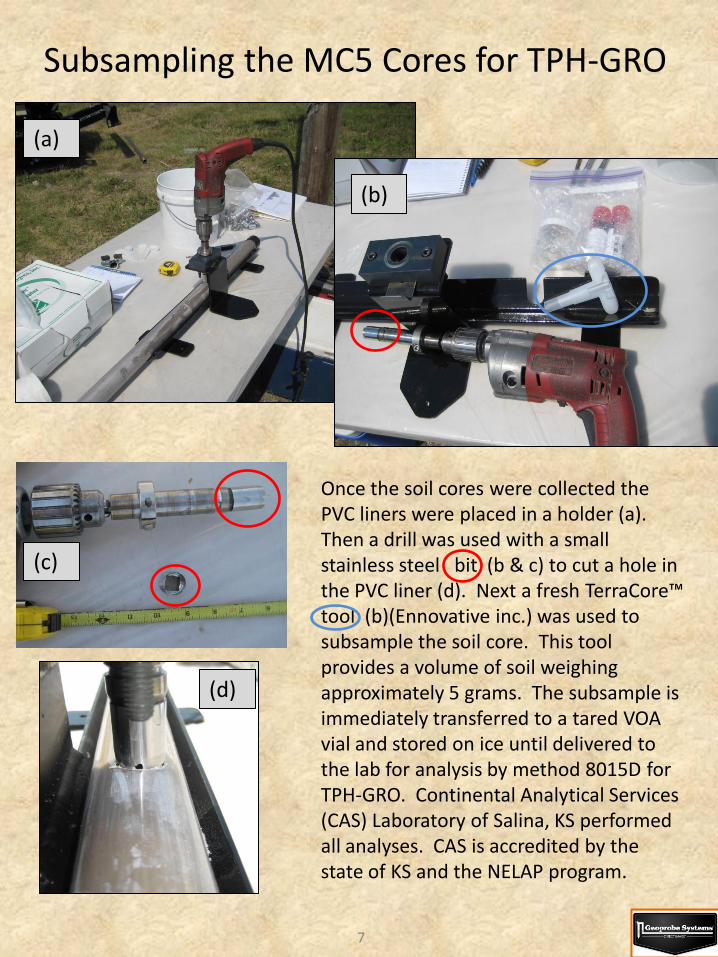
Subsampling the MC5 Cores for TPH-GRO
Once the soil cores were collected the PVC liners were placed in a holder (a). Then a drill was used with a small stainless steel bit (b & c) to cut a hole in the PVC liner (d). Next a fresh TerraCore™ tool (b)(Ennovative inc.) was used to subsample the soil core. This tool provides a volume of soil weighing approximately 5 grams. The subsample is immediately transferred to a tared VOA vial and stored on ice until delivered to the lab for analysis by method 8015D for TPH-GRO. Continental Analytical Services (CAS) Laboratory of Salina, KS performed all analyses. CAS is accredited by the state of KS and the NELAP program.
(a)
(b)
(c)
(d)
7

MC5 Soil Sample Analytical Results
Sample Number
Sample Depth (ft)
TPH-GRO (mg/kg)
ST5-14 14 ND 20
ST5-16 16 ND 24
ST5-18 18 ND 22
ST5-20 20 ND 22
ST5-22 22 ND 26
ST5-24 24 211
ST5-26 26 310
ST5-28 28 458
ST5-30 30 ND 19
ST5-32 32 ND 18
ST5-34 34 ND 19
ND = nondetect, the associated number is the method reporting limit for the sample. A PDF copy of the CAS lab analytical report is available on request.
8

0
5
10
15
20
25
30
35
40
45
50
0.0E+00 1.0E+07 2.0E+07 3.0E+07
De
pth
(ft
)
PID Detector (mV) : GRO (mg/kg)
Study5 & 6 MIP PID Logs with TPH-GRO
PID #6 (uV)
PID #5 (uV)
TPH GRO
GRO x-axis
100 500 mg/kg 400 300 200
Nondetect samples are plotted at their method reporting limit.
9

0
5
10
15
20
25
30
35
40
45
50
0.0E+00 1.0E+06 2.0E+06 3.0E+06 4.0E+06 5.0E+06 6.0E+06
De
pth
(ft
)
FID Detector (mV) : GRO (mg/kg)
Study5 & 6 MIP FID Logs with TPH-GRO
FID #6 (uV)
FID #5 (uV)
TPH GRO
GRO x-axis
400 mg/kg 300 200 100
Nondetect samples are plotted at their method reporting limit.
10

Summary: MIP and Hi Level GRO in Soil
• Replicate MIP logs with FID and PID detectors show generally good correspondence in detector response for mid-hi level GRO
• Macro Core MC5 closed piston sampling was used to collect soil cores across the zone of detector response
• Very good correspondence is observed between both the PID and FID detector responses and the GRO analytical results for the soil samples
• The soil GRO results are nondetect over the zones where the MIP detectors display very little or no response above the baseline
• The soil GRO results are positive detect over the interval where the MIP detectors show clear response in the replicate logs
• The MIP system with PID and FID detectors can routinely detect part per million gasoline range organic contamination when maintained and operated properly.
• Soil coring and sub-sampling technique for volatiles analysis can have a substantial impact on analytical results and correspondence between MIP results and soil sample results.
11

12
To learn more about the MIP system visit
http://geoprobe.com/mip
MIP System Specifications for this Study: Probe: Combined MIP-HPT Probe, PN MK6530 GC and Detectors: SRI Model 310C GC equipped with 10.6eV PID and FID detectors MIP Controller Model MP6505 Field Instrument Model FI6000 Carrier Gas: N2 at 40ml/min Trunkline equipped with an unheated 0.0625” OD x 0.04” ID stainless steel return gas line


![TPH Brochure[1]](https://static.fdocuments.us/doc/165x107/577d359a1a28ab3a6b90e6da/tph-brochure1.jpg)