Minor International - listed...
46
Minor International 2Q09 Analyst Meeting 17 August 2009 Pratana Mongkolkul, CFO
Transcript of Minor International - listed...

Minor International2Q09 Analyst Meeting
17 August 2009
Pratana Mongkolkul, CFO

Today’s Agenda
I. Key Issues & Business Performance
II. 2Q09 Financial Results
III. Key Strategic & Industry Update
IV. Pipeline Expansion & Cashflow Outlook
V. Q&A

I. Key Issues & Key Business Performance
New Developments in 2Q09
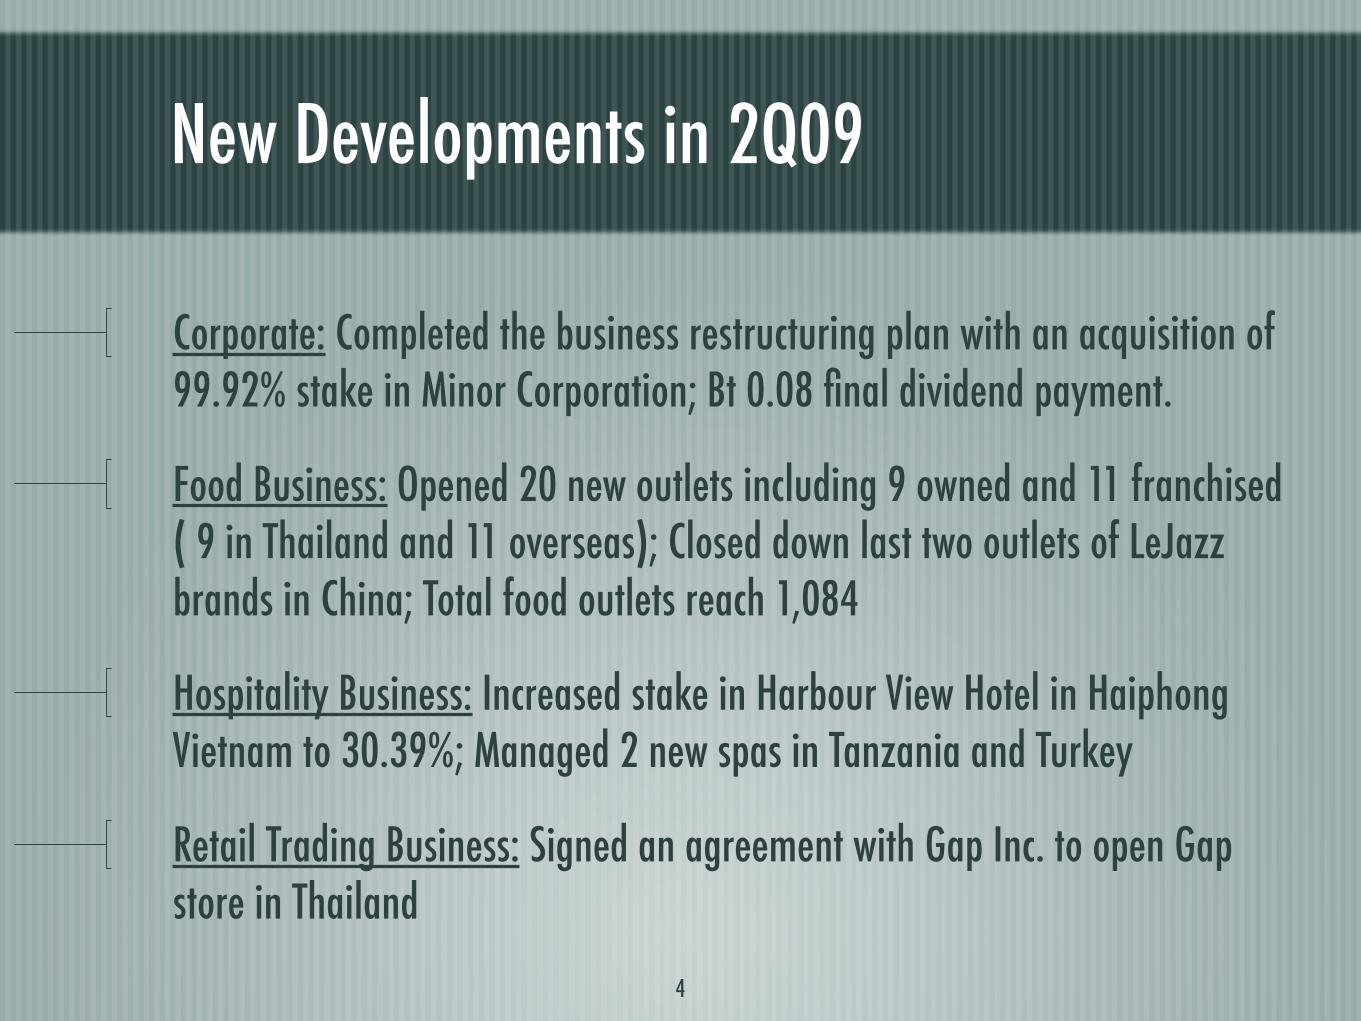
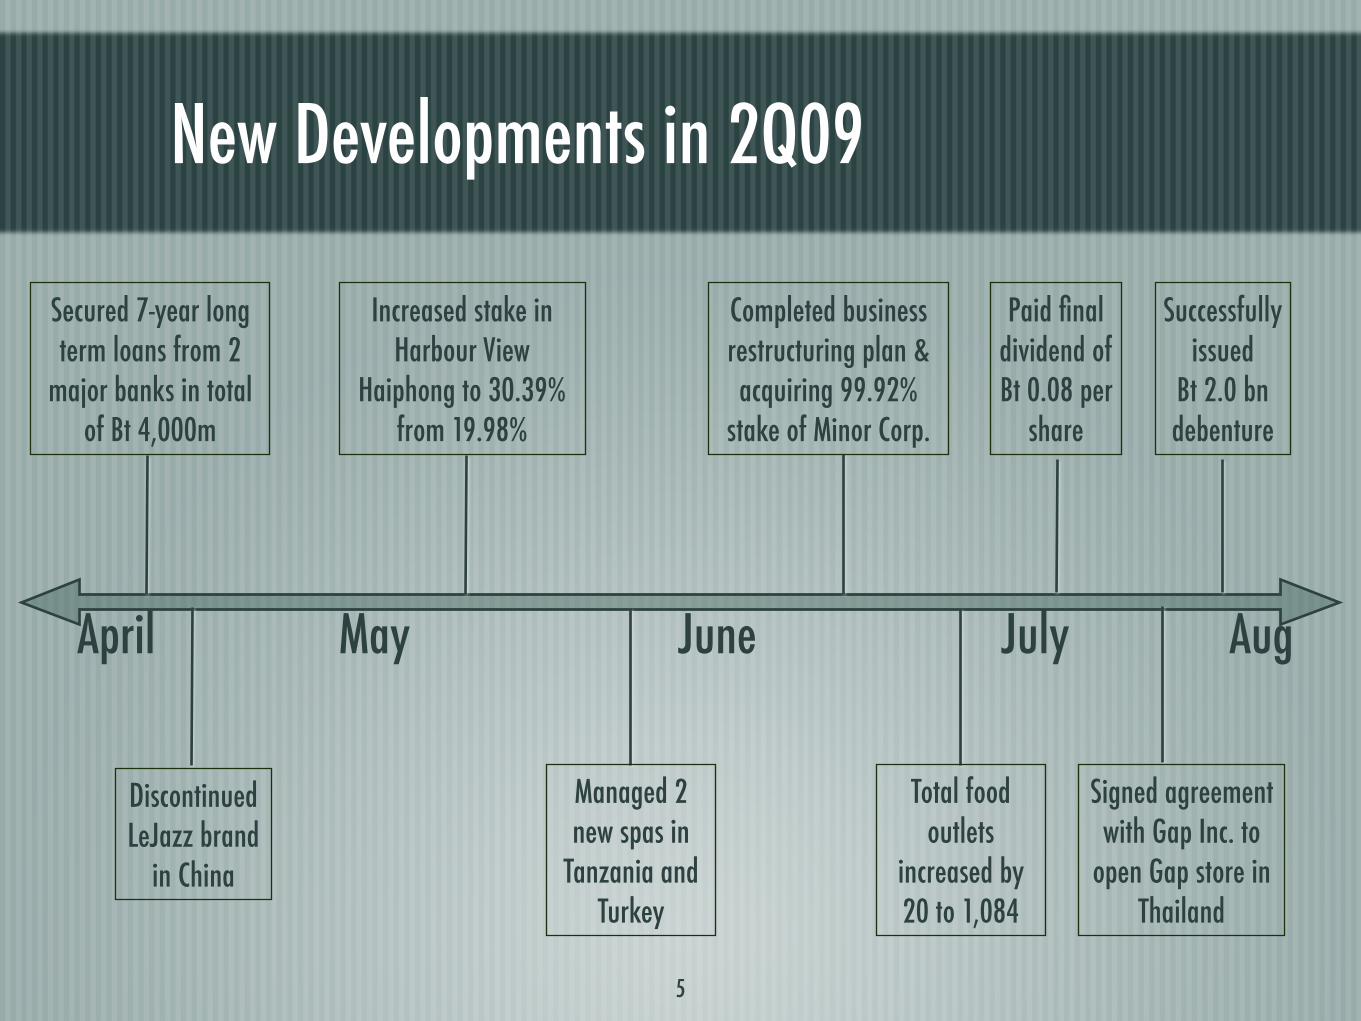
Corporate: Completed the business restructuring plan with an acquisition of 99.92% stake in Minor Corporation; Bt 0.08 final dividend payment.
Food Business: Opened 20 new outlets including 9 owned and 11 franchised ( 9 in Thailand and 11 overseas); Closed down last two outlets of LeJazz brands in China; Total food outlets reach 1,084
Hospitality Business: Increased stake in Harbour View Hotel in Haiphong Vietnam to 30.39%; Managed 2 new spas in Tanzania and Turkey
Retail Trading Business: Signed an agreement with Gap Inc. to open Gap store in Thailand
4
New Developments in 2Q09
5
April May June July
Discontinued LeJazz brand
in China
Successfully issued
Bt 2.0 bn debenture
Aug
Completed business restructuring plan & acquiring 99.92%
stake of Minor Corp.
Paid final dividend of Bt 0.08 per
share
Increased stake in Harbour View
Haiphong to 30.39% from 19.98%
Managed 2 new spas in
Tanzania and Turkey
Total food outlets
increased by 20 to 1,084
Signed agreement with Gap Inc. to
open Gap store in Thailand
Secured 7-year long term loans from 2
major banks in total of Bt 4,000m
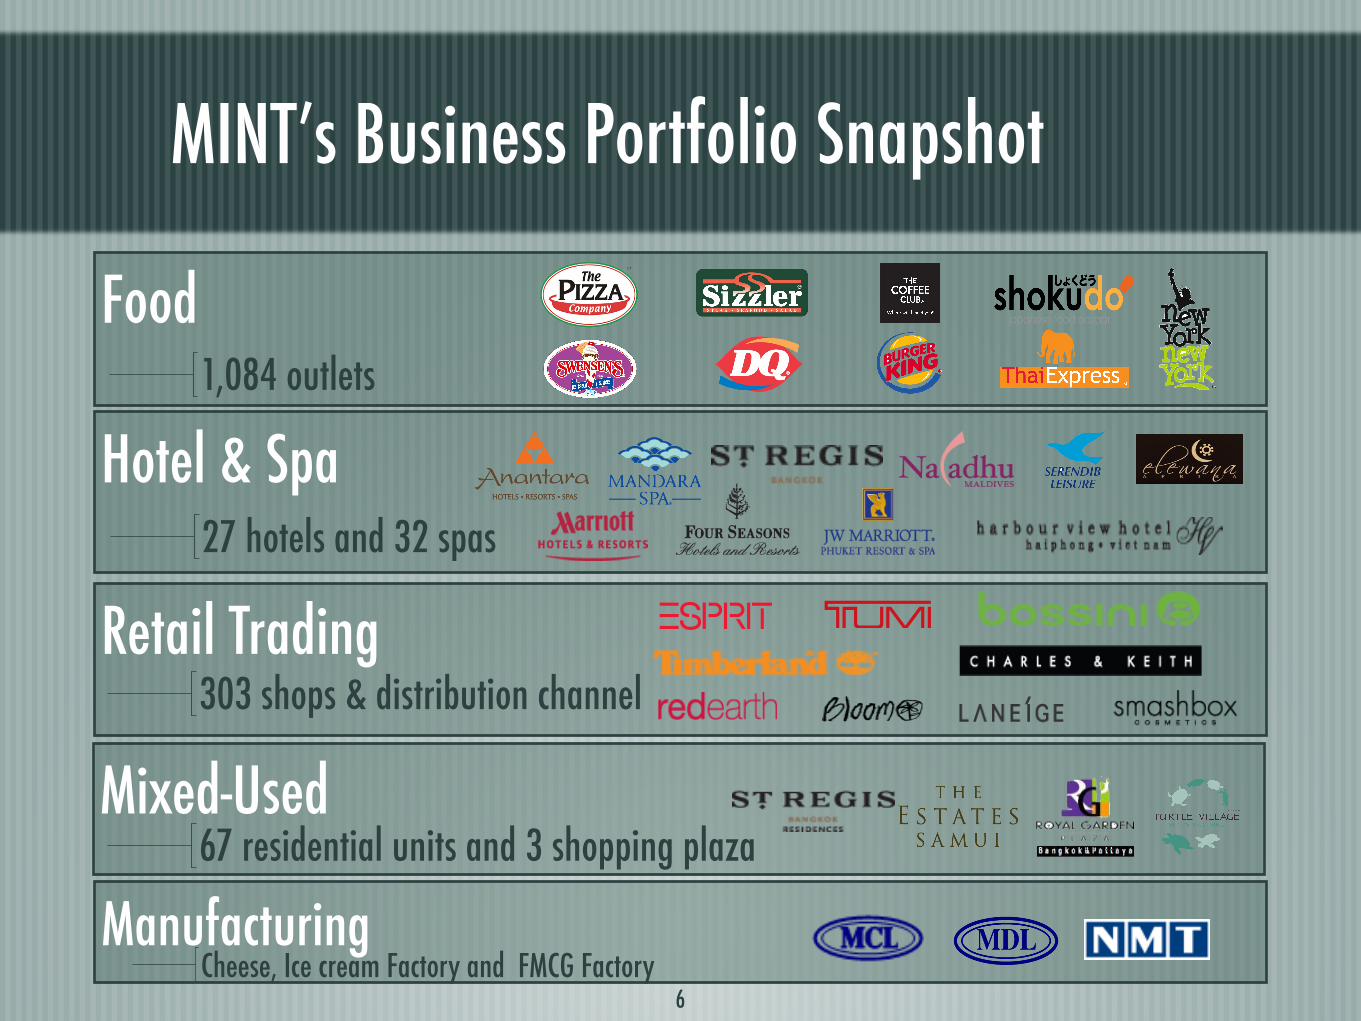
MINT’s Business Portfolio Snapshot
Food
Hotel & Spa
Mixed-Used
Manufacturing
Retail Trading
6
1,084 outlets
27 hotels and 32 spas
303 shops & distribution channel
67 residential units and 3 shopping plaza
Cheese, Ice cream Factory and FMCG Factory
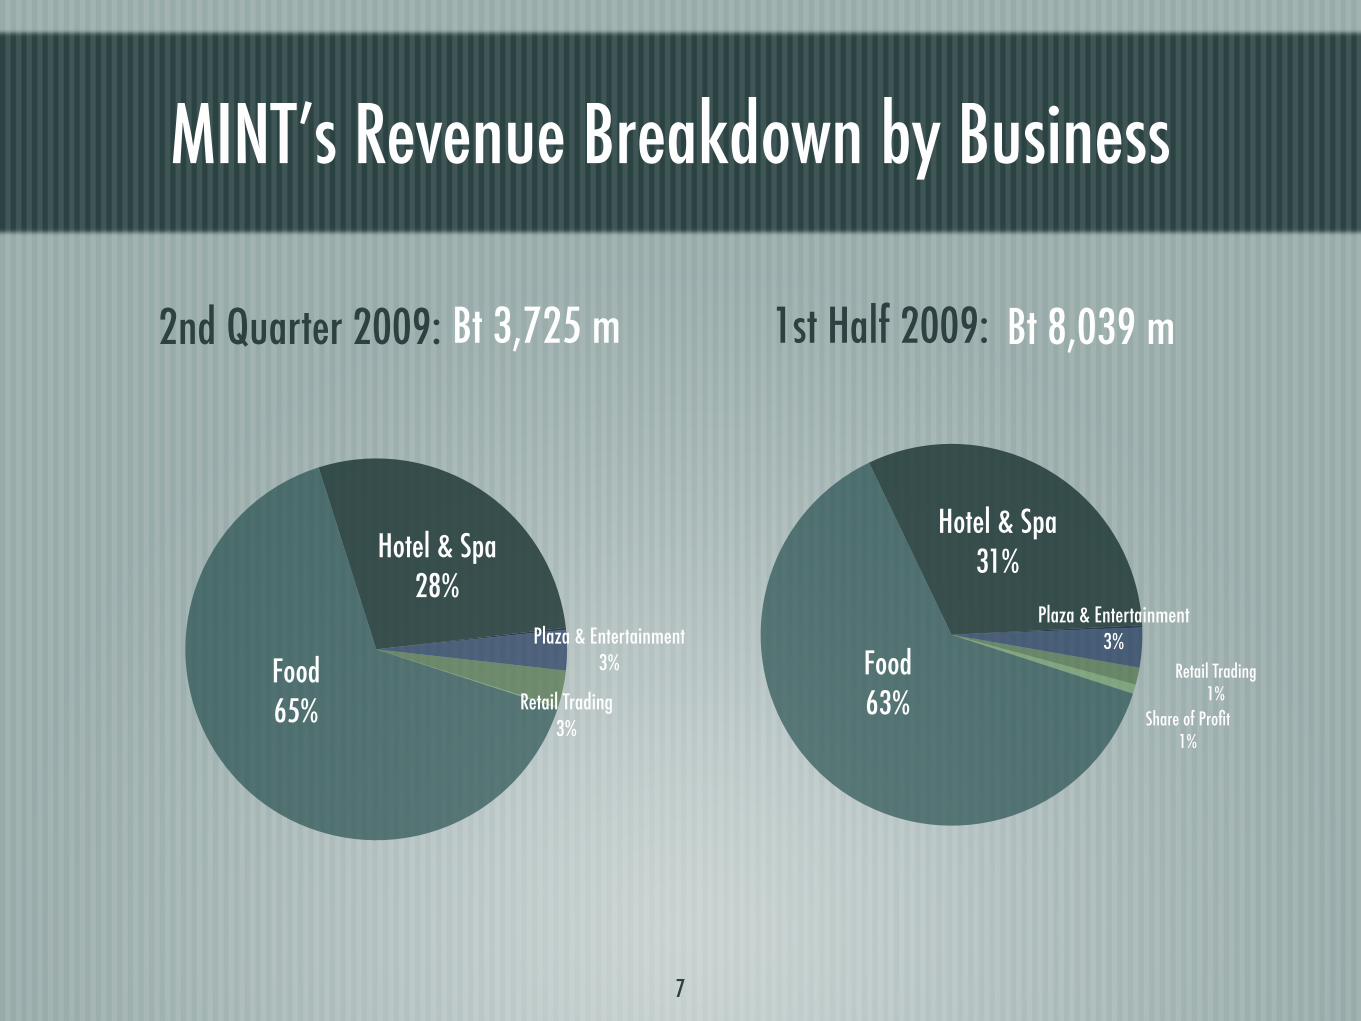
MINT’s Revenue Breakdown by Business
2nd Quarter 2009: Bt 3,725 m 1st Half 2009: Bt 8,039 m
Food63%
Hotel & Spa31%
Plaza & Entertainment3%
Retail Trading1%
Share of Profit1%
Food65%
Hotel & Spa28%
Plaza & Entertainment3%
Retail Trading3%
7
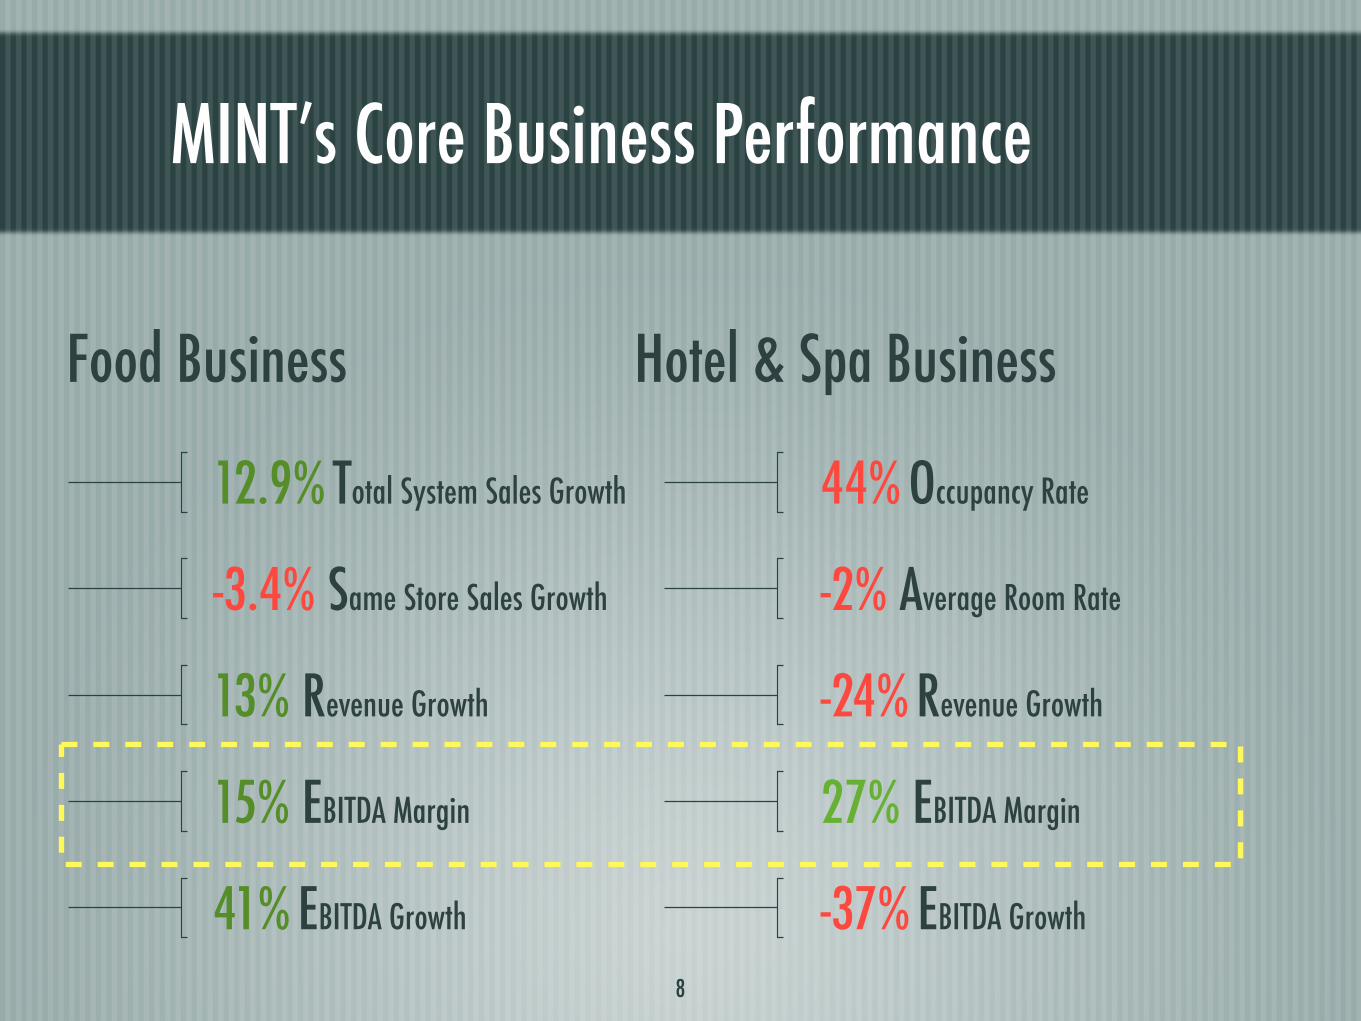
MINT’s Core Business Performance
12.9% Total System Sales Growth
-3.4% Same Store Sales Growth
13% Revenue Growth
15% EBITDA Margin
41% EBITDA Growth
8
Food Business
44% Occupancy Rate
-2% Average Room Rate
-24% Revenue Growth
27% EBITDA Margin
-37% EBITDA Growth
Hotel & Spa Business
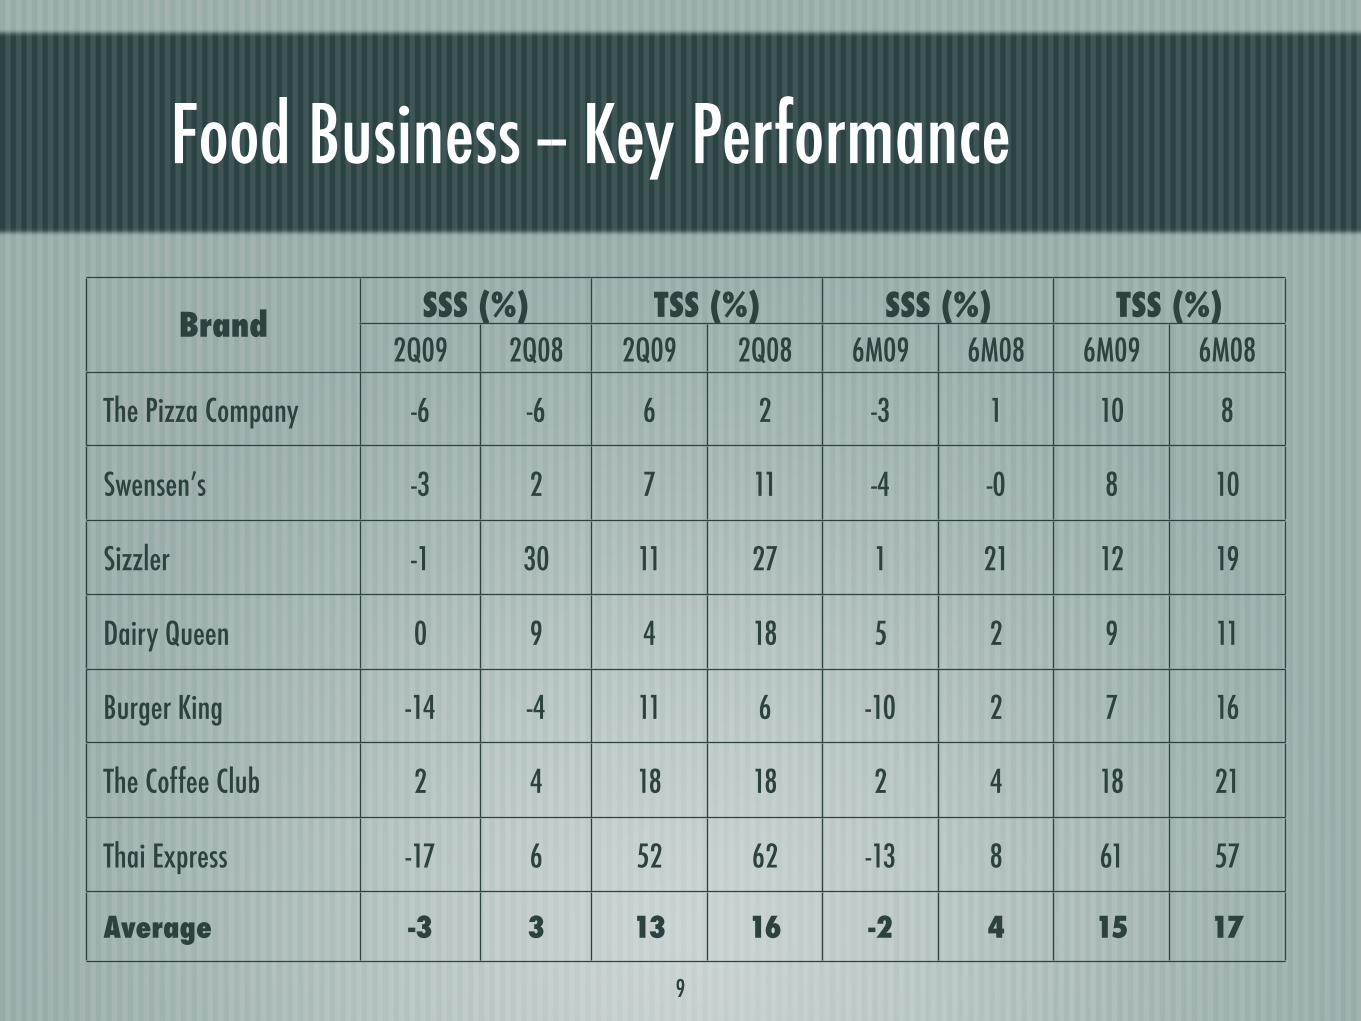
Food Business -- Key Performance
9
BrandSSS (%) TSS (%) SSS (%) TSS (%)
2Q09 2Q08 2Q09 2Q08 6M09 6M08 6M09 6M08
The Pizza Company -6 -6 6 2 -3 1 10 8
Swensen’s -3 2 7 11 -4 -0 8 10
Sizzler -1 30 11 27 1 21 12 19
Dairy Queen 0 9 4 18 5 2 9 11
Burger King -14 -4 11 6 -10 2 7 16
The Coffee Club 2 4 18 18 2 4 18 21
Thai Express -17 6 52 62 -13 8 61 57
Average -3 3 13 16 -2 4 15 17
Hotel Business -- Key Performance
10
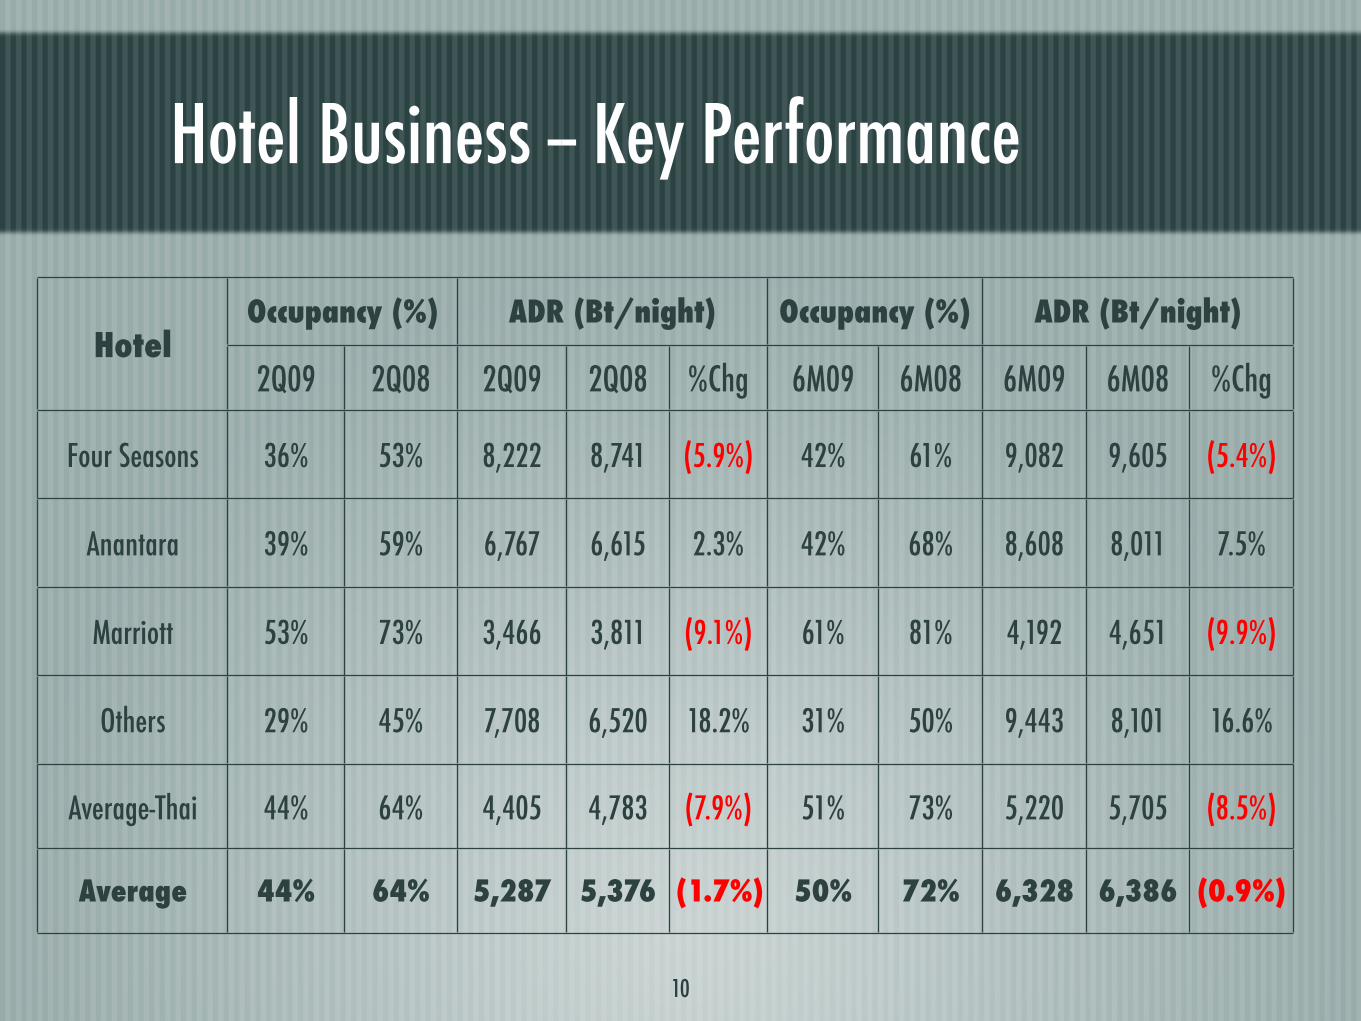
HotelOccupancy (%) ADR (Bt/night) Occupancy (%) ADR (Bt/night)
2Q09 2Q08 2Q09 2Q08 %Chg 6M09 6M08 6M09 6M08 %Chg
Four Seasons 36% 53% 8,222 8,741 (5.9%) 42% 61% 9,082 9,605 (5.4%)
Anantara 39% 59% 6,767 6,615 2.3% 42% 68% 8,608 8,011 7.5%
Marriott 53% 73% 3,466 3,811 (9.1%) 61% 81% 4,192 4,651 (9.9%)
Others 29% 45% 7,708 6,520 18.2% 31% 50% 9,443 8,101 16.6%
Average-Thai 44% 64% 4,405 4,783 (7.9%) 51% 73% 5,220 5,705 (8.5%)
Average 44% 64% 5,287 5,376 (1.7%) 50% 72% 6,328 6,386 (0.9%)
Hotel Business -- Key Performance
11
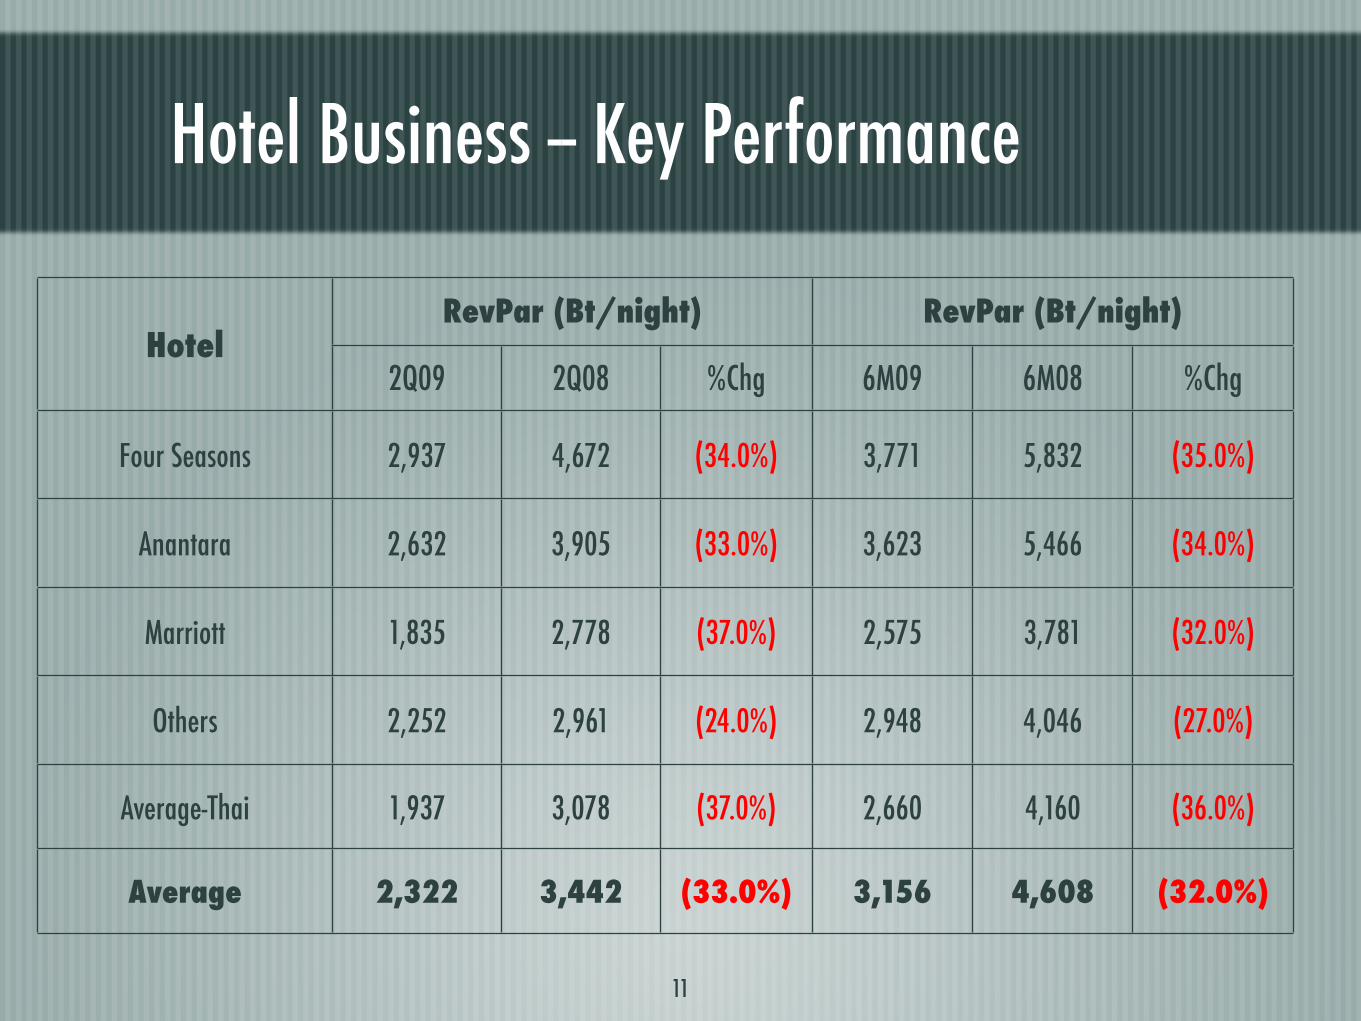
HotelRevPar (Bt/night) RevPar (Bt/night)
2Q09 2Q08 %Chg 6M09 6M08 %Chg
Four Seasons 2,937 4,672 (34.0%) 3,771 5,832 (35.0%)
Anantara 2,632 3,905 (33.0%) 3,623 5,466 (34.0%)
Marriott 1,835 2,778 (37.0%) 2,575 3,781 (32.0%)
Others 2,252 2,961 (24.0%) 2,948 4,046 (27.0%)
Average-Thai 1,937 3,078 (37.0%) 2,660 4,160 (36.0%)
Average 2,322 3,442 (33.0%) 3,156 4,608 (32.0%)
Retail Trading & Manufacturing Business
12
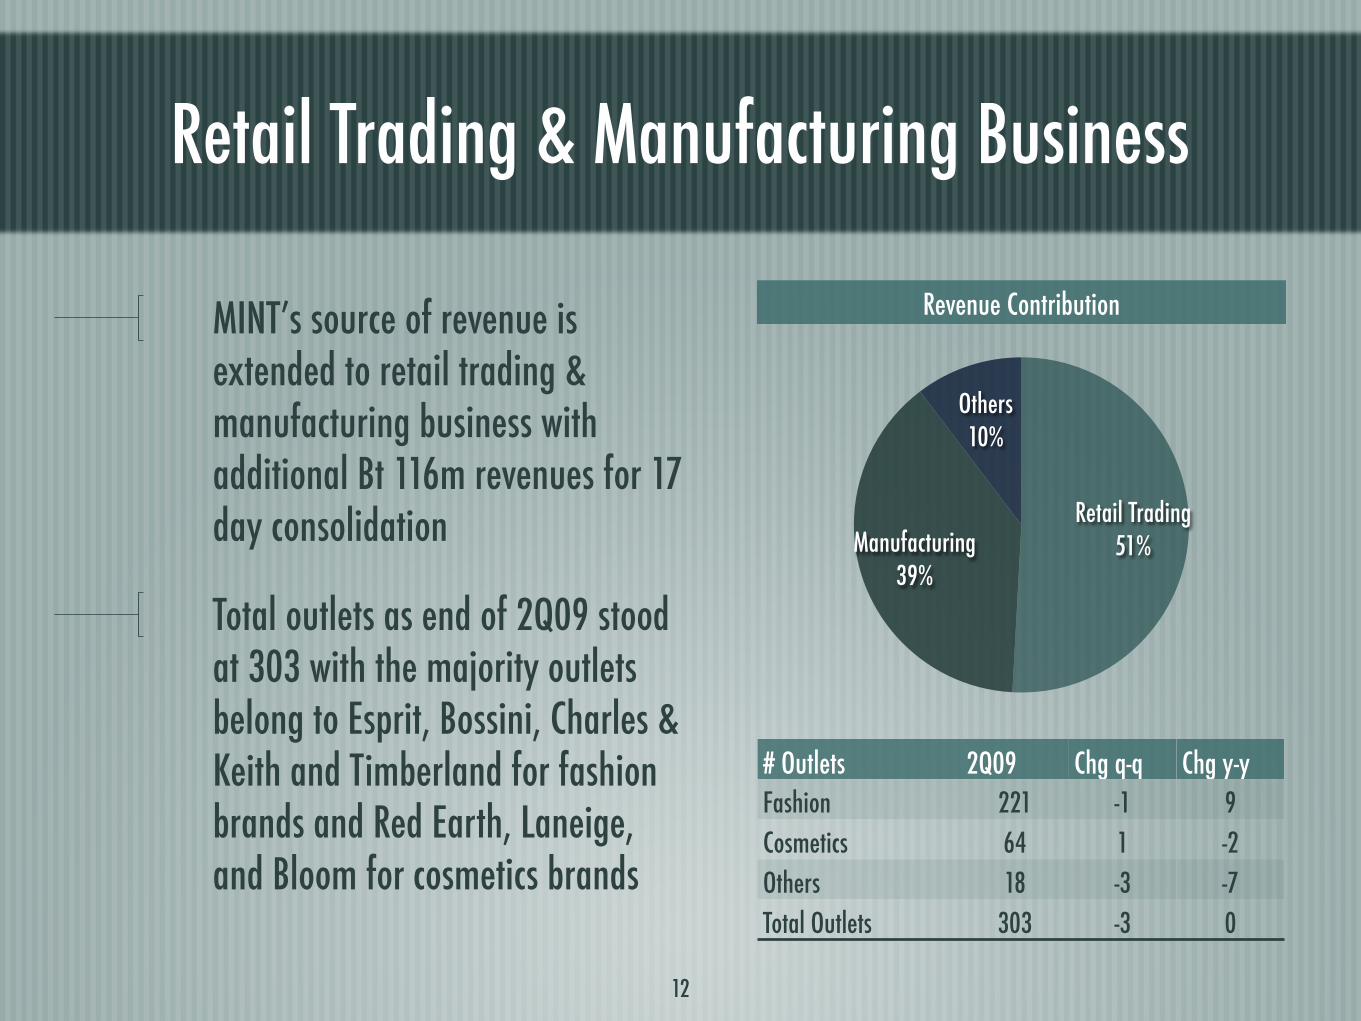
Others10%
Manufacturing39%
Retail Trading51%
# Outlets 2Q09 Chg q-q Chg y-y
Fashion 221 -1 9
Cosmetics 64 1 -2
Others 18 -3 -7
Total Outlets 303 -3 0
MINT’s source of revenue is extended to retail trading & manufacturing business with additional Bt 116m revenues for 17 day consolidation
Total outlets as end of 2Q09 stood at 303 with the majority outlets belong to Esprit, Bossini, Charles & Keith and Timberland for fashion brands and Red Earth, Laneige, and Bloom for cosmetics brands
Revenue Contribution
II. 2Q09 Financial Results
2nd Quarter Performance
14
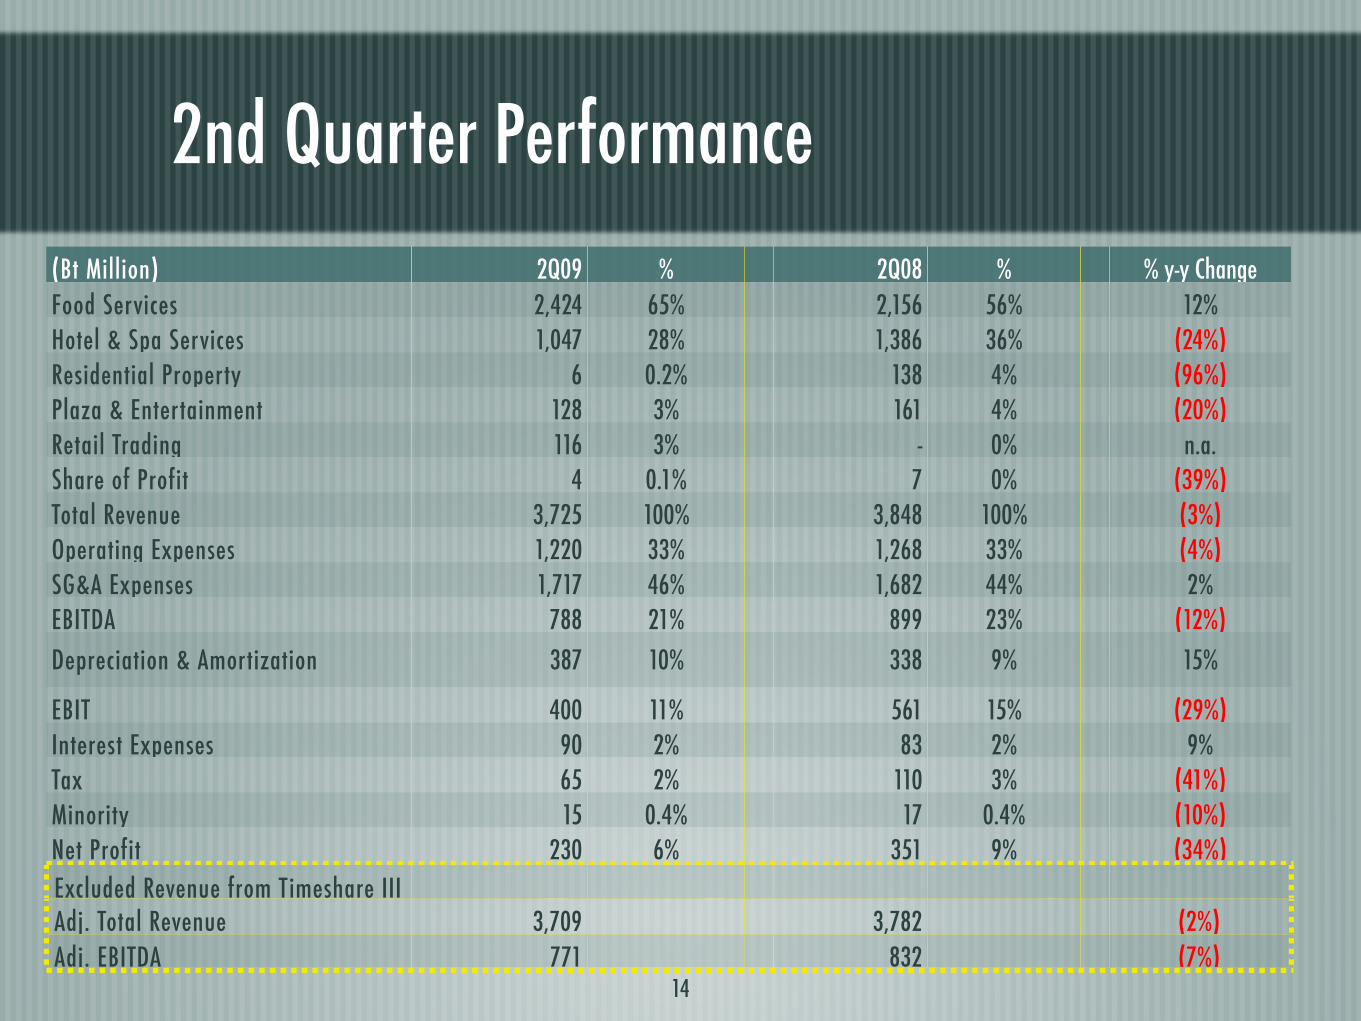
(Bt Million) 2Q09 % 2Q08 % % y-y Change
Food Services 2,424 65% 2,156 56% 12%Hotel & Spa Services 1,047 28% 1,386 36% (24%)Residential Property 6 0.2% 138 4% (96%)Plaza & Entertainment 128 3% 161 4% (20%)Retail Trading 116 3% - 0% n.a.Share of Profit 4 0.1% 7 0% (39%)Total Revenue 3,725 100% 3,848 100% (3%)Operating Expenses 1,220 33% 1,268 33% (4%)SG&A Expenses 1,717 46% 1,682 44% 2%EBITDA 788 21% 899 23% (12%)
Depreciation & Amortization 387 10% 338 9% 15%
EBIT 400 11% 561 15% (29%)Interest Expenses 90 2% 83 2% 9%Tax 65 2% 110 3% (41%)Minority 15 0.4% 17 0.4% (10%)Net Profit 230 6% 351 9% (34%)
Excluded Revenue from Timeshare IIIAdj. Total Revenue 3,709 3,782 (2%)
Adj. EBITDA 771 832 (7%)
2nd Quarter Performance
15
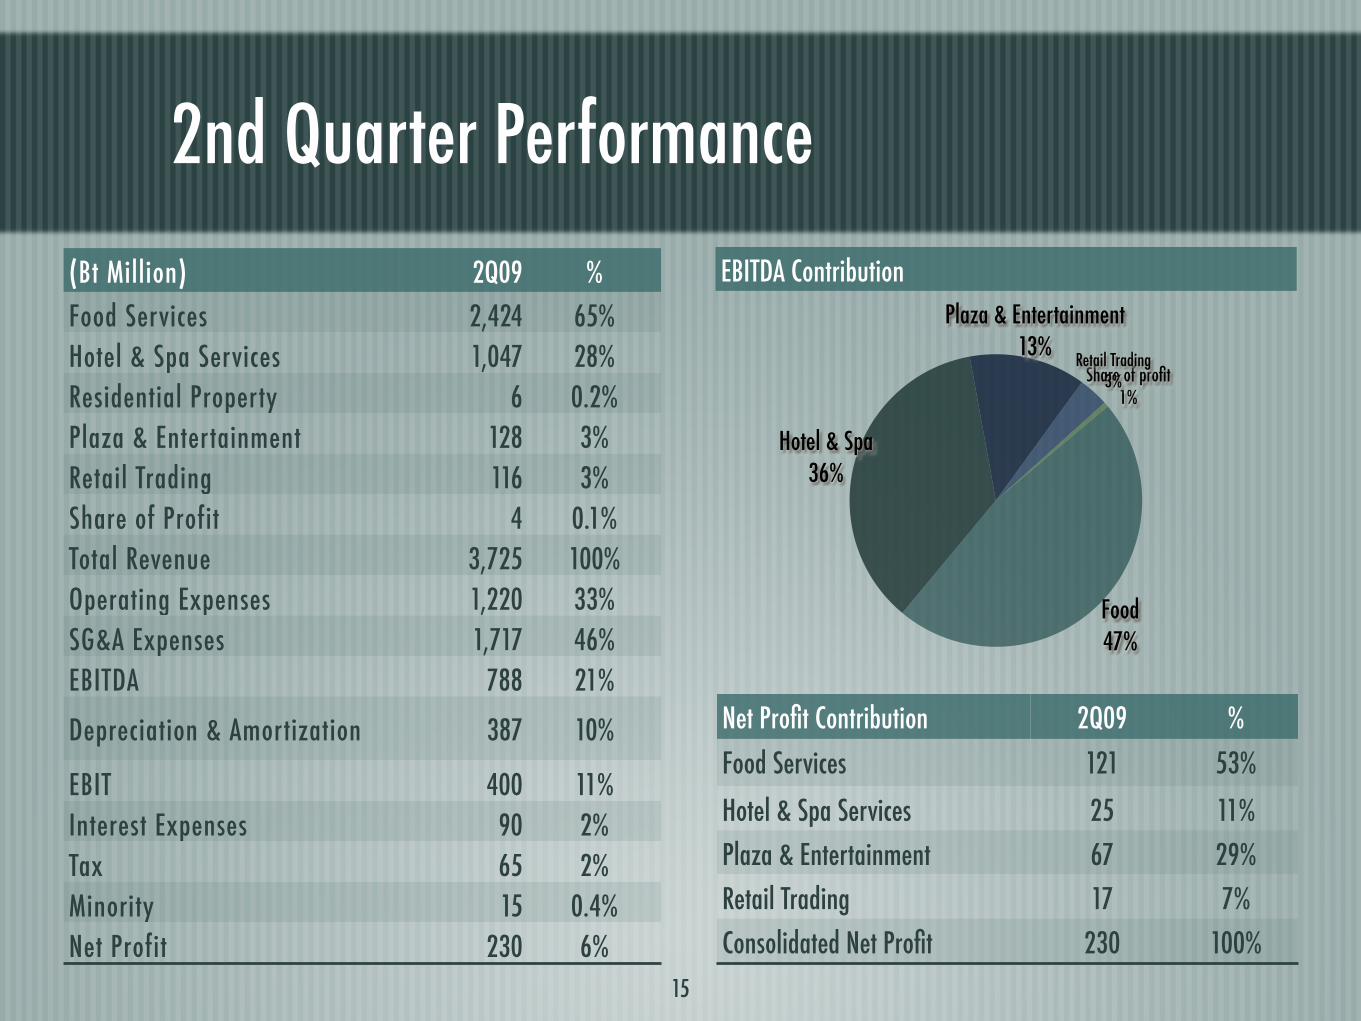
(Bt Million) 2Q09 %
Food Services 2,424 65%
Hotel & Spa Services 1,047 28%
Residential Property 6 0.2%
Plaza & Entertainment 128 3%
Retail Trading 116 3%
Share of Profit 4 0.1%
Total Revenue 3,725 100%
Operating Expenses 1,220 33%
SG&A Expenses 1,717 46%
EBITDA 788 21%
Depreciation & Amortization 387 10%
EBIT 400 11%
Interest Expenses 90 2%
Tax 65 2%
Minority 15 0.4%
Net Profit 230 6%
Share of profit1%
Retail Trading3%
Plaza & Entertainment13%
Hotel & Spa36%
Food 47%
Net Profit Contribution 2Q09 %
Food Services 121 53%
Hotel & Spa Services 25 11%
Plaza & Entertainment 67 29%
Retail Trading 17 7%
Consolidated Net Profit 230 100%
EBITDA Contribution
1st Half Performance
16
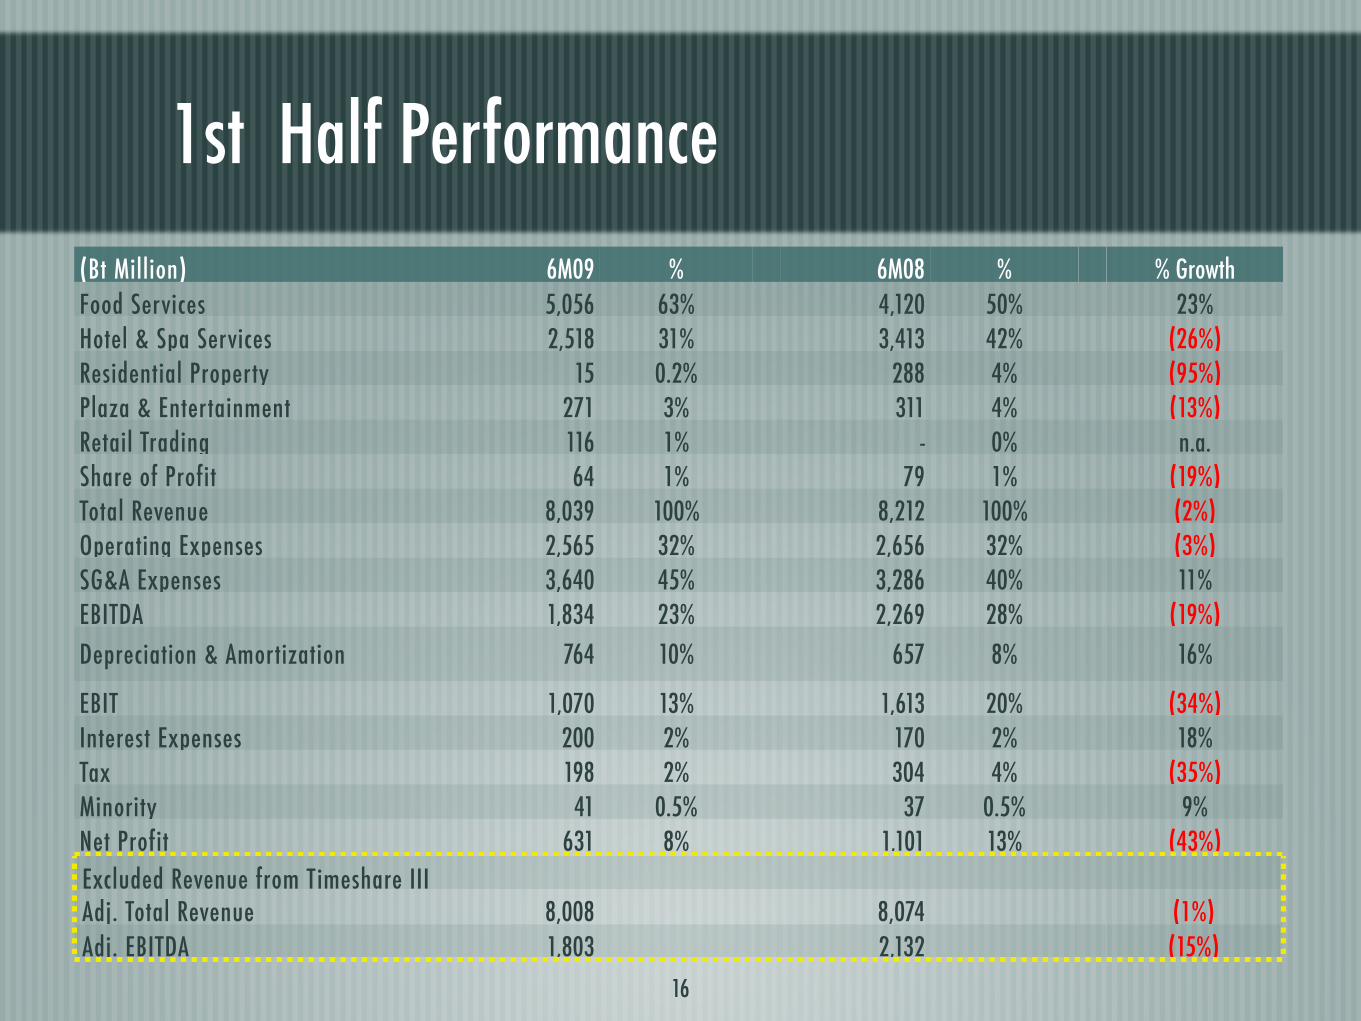
(Bt Million) 6M09 % 6M08 % % GrowthFood Services 5,056 63% 4,120 50% 23%Hotel & Spa Services 2,518 31% 3,413 42% (26%)Residential Property 15 0.2% 288 4% (95%)Plaza & Entertainment 271 3% 311 4% (13%)Retail Trading 116 1% - 0% n.a.Share of Profit 64 1% 79 1% (19%)Total Revenue 8,039 100% 8,212 100% (2%)Operating Expenses 2,565 32% 2,656 32% (3%)SG&A Expenses 3,640 45% 3,286 40% 11%EBITDA 1,834 23% 2,269 28% (19%)
Depreciation & Amortization 764 10% 657 8% 16%
EBIT 1,070 13% 1,613 20% (34%)Interest Expenses 200 2% 170 2% 18%Tax 198 2% 304 4% (35%)Minority 41 0.5% 37 0.5% 9%Net Profit 631 8% 1,101 13% (43%)
Excluded Revenue from Timeshare IIIAdj. Total Revenue 8,008 8,074 (1%)Adj. EBITDA 1,803 2,132 (15%)
1st Half Breakdown Performance
17
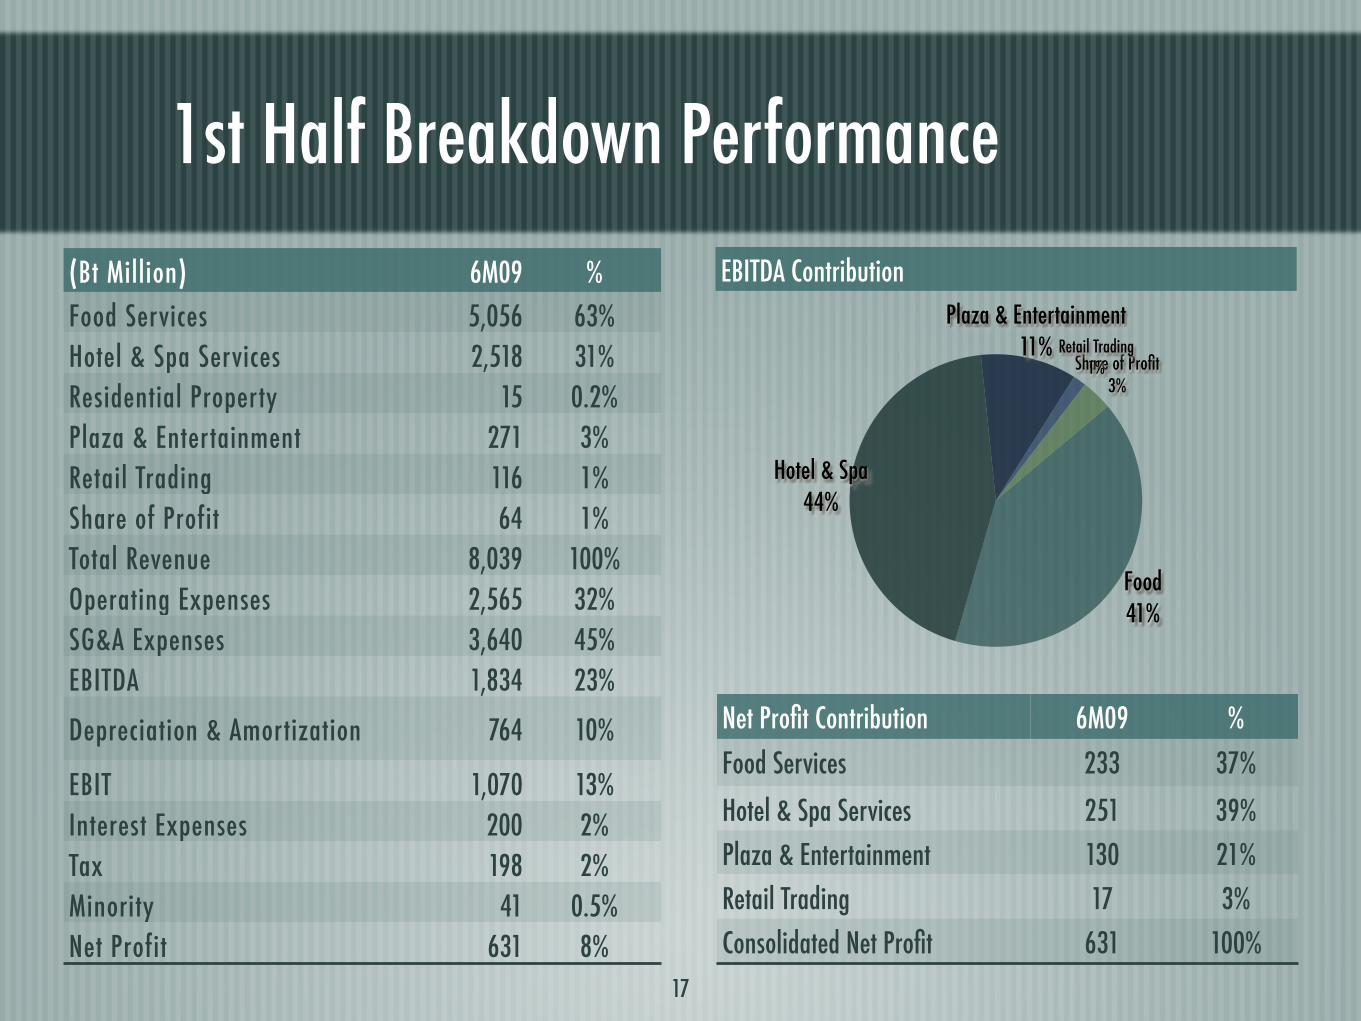
(Bt Million) 6M09 %
Food Services 5,056 63%
Hotel & Spa Services 2,518 31%
Residential Property 15 0.2%
Plaza & Entertainment 271 3%
Retail Trading 116 1%
Share of Profit 64 1%
Total Revenue 8,039 100%
Operating Expenses 2,565 32%
SG&A Expenses 3,640 45%
EBITDA 1,834 23%
Depreciation & Amortization 764 10%
EBIT 1,070 13%
Interest Expenses 200 2%
Tax 198 2%
Minority 41 0.5%
Net Profit 631 8%
Share of Profit3%
Retail Trading1%
Plaza & Entertainment11%
Hotel & Spa44%
Food 41%
Net Profit Contribution 6M09 %
Food Services 233 37%
Hotel & Spa Services 251 39%
Plaza & Entertainment 130 21%
Retail Trading 17 3%
Consolidated Net Profit 631 100%
EBITDA Contribution
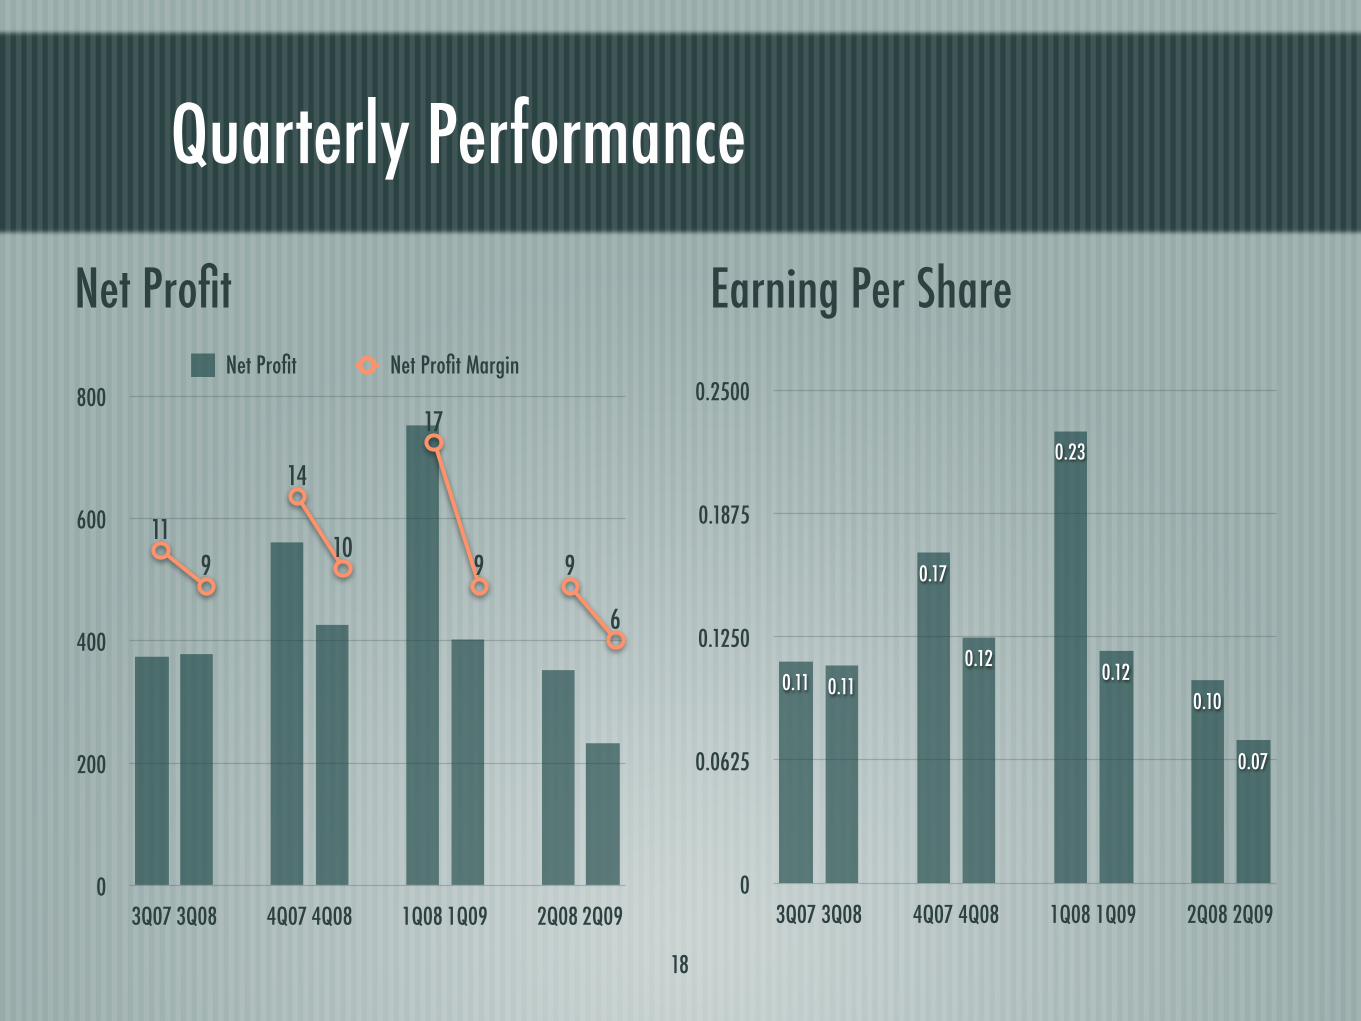
0
200
400
600
800
3Q07 3Q08 4Q07 4Q08 1Q08 1Q09 2Q08 2Q09
Net Profit
11
9
14
10
17
9 9
6
Net Profit Margin
0
0.0625
0.1250
0.1875
0.2500
3Q07 3Q08 4Q07 4Q08 1Q08 1Q09 2Q08 2Q09
0.07
0.10
0.12
0.23
0.12
0.17
0.110.11
18
Net Profit Earning Per Share
Quarterly Performance
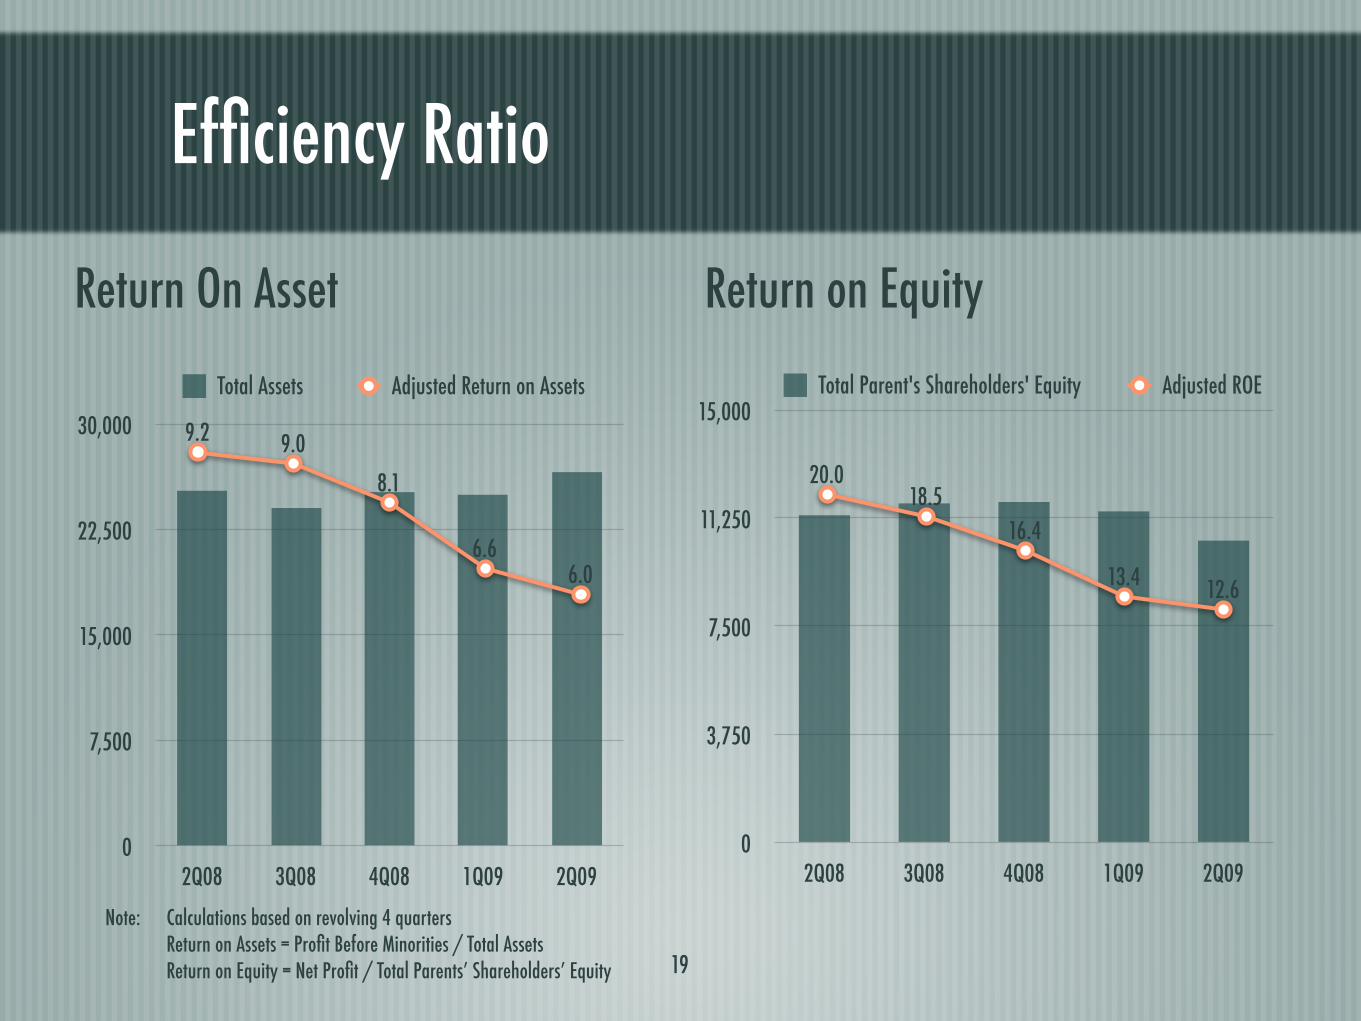
19
Return On Asset Return on Equity
0
7,500
15,000
22,500
30,000
2Q08 3Q08 4Q08 1Q09 2Q09
Total Assets
0
3,750
7,500
11,250
15,000
2Q08 3Q08 4Q08 1Q09 2Q09
Total Parent's Shareholders' Equity
Note:! Calculations based on revolving 4 quarters ! Return on Assets = Profit Before Minorities / Total Assets Return on Equity = Net Profit / Total Parents’ Shareholders’ Equity
9.2 9.0
8.1
6.66.0
Adjusted Return on Assets
20.018.5
16.4
13.4 12.6
Adjusted ROE
Efficiency Ratio
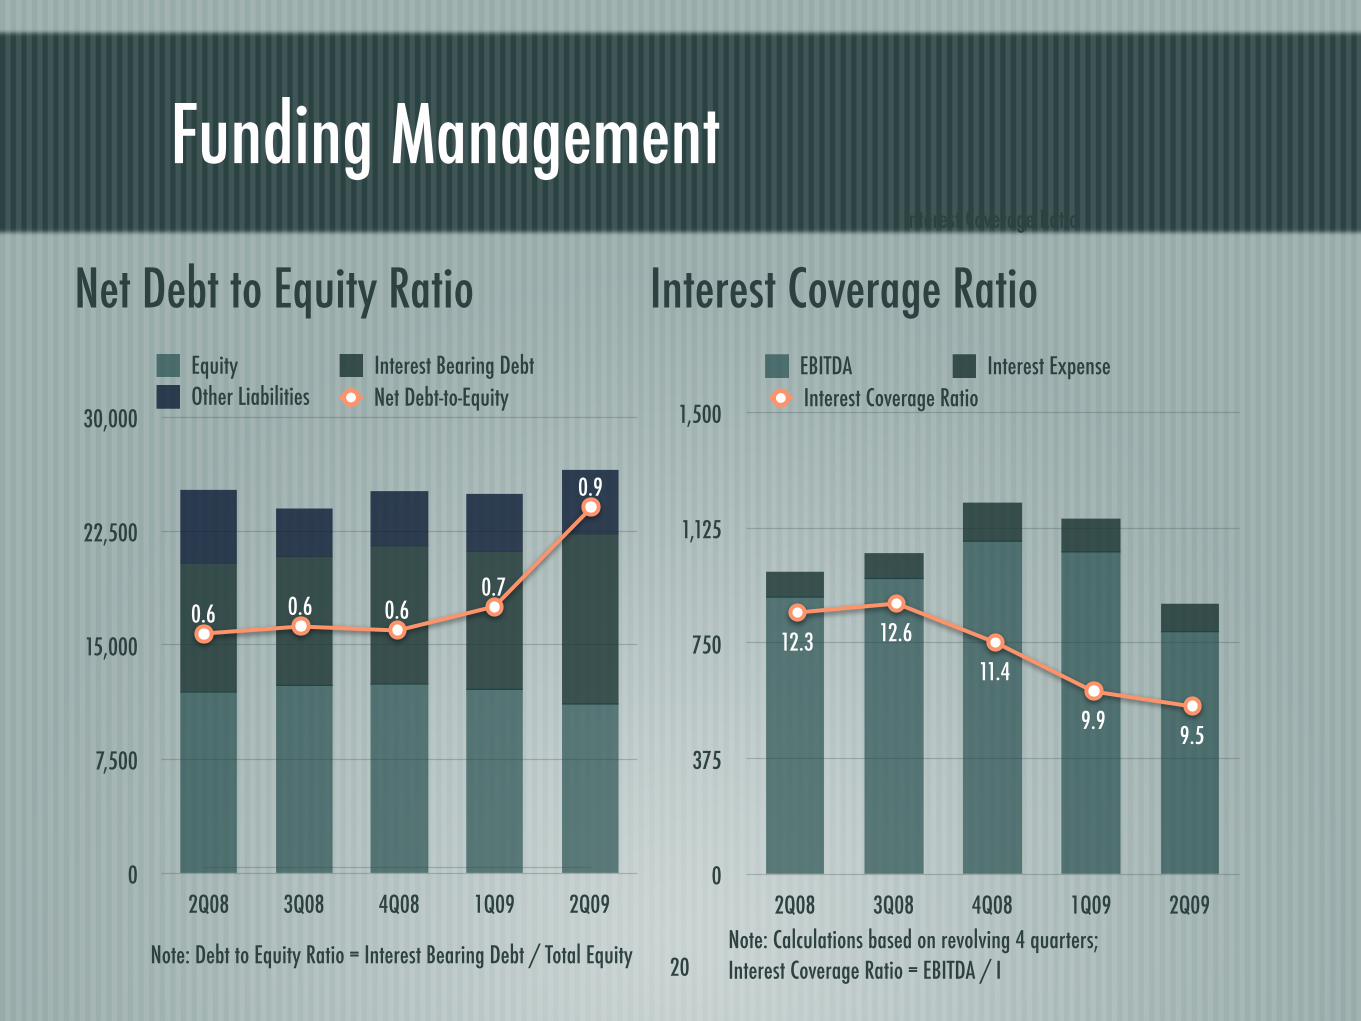
Funding Management
0
7,500
15,000
22,500
30,000
2Q08 3Q08 4Q08 1Q09 2Q09
0.6 0.6 0.60.7
0.9
Net Debt-to-Equity
Note: Debt to Equity Ratio = Interest Bearing Debt / Total Equity
Equity Interest Bearing DebtOther Liabilities
20
0
375
750
1,125
1,500
2Q08 3Q08 4Q08 1Q09 2Q09
EBITDA Interest Expense
Note: Calculations based on revolving 4 quarters; Interest Coverage Ratio = EBITDA / I
12.3 12.6
11.4
9.99.5
Interest Coverage Ratio
Interest Coverage Ratio
Net Debt to Equity Ratio Interest Coverage Ratio

III. Key Strategic & Industry Update (Food & Hotel Business)
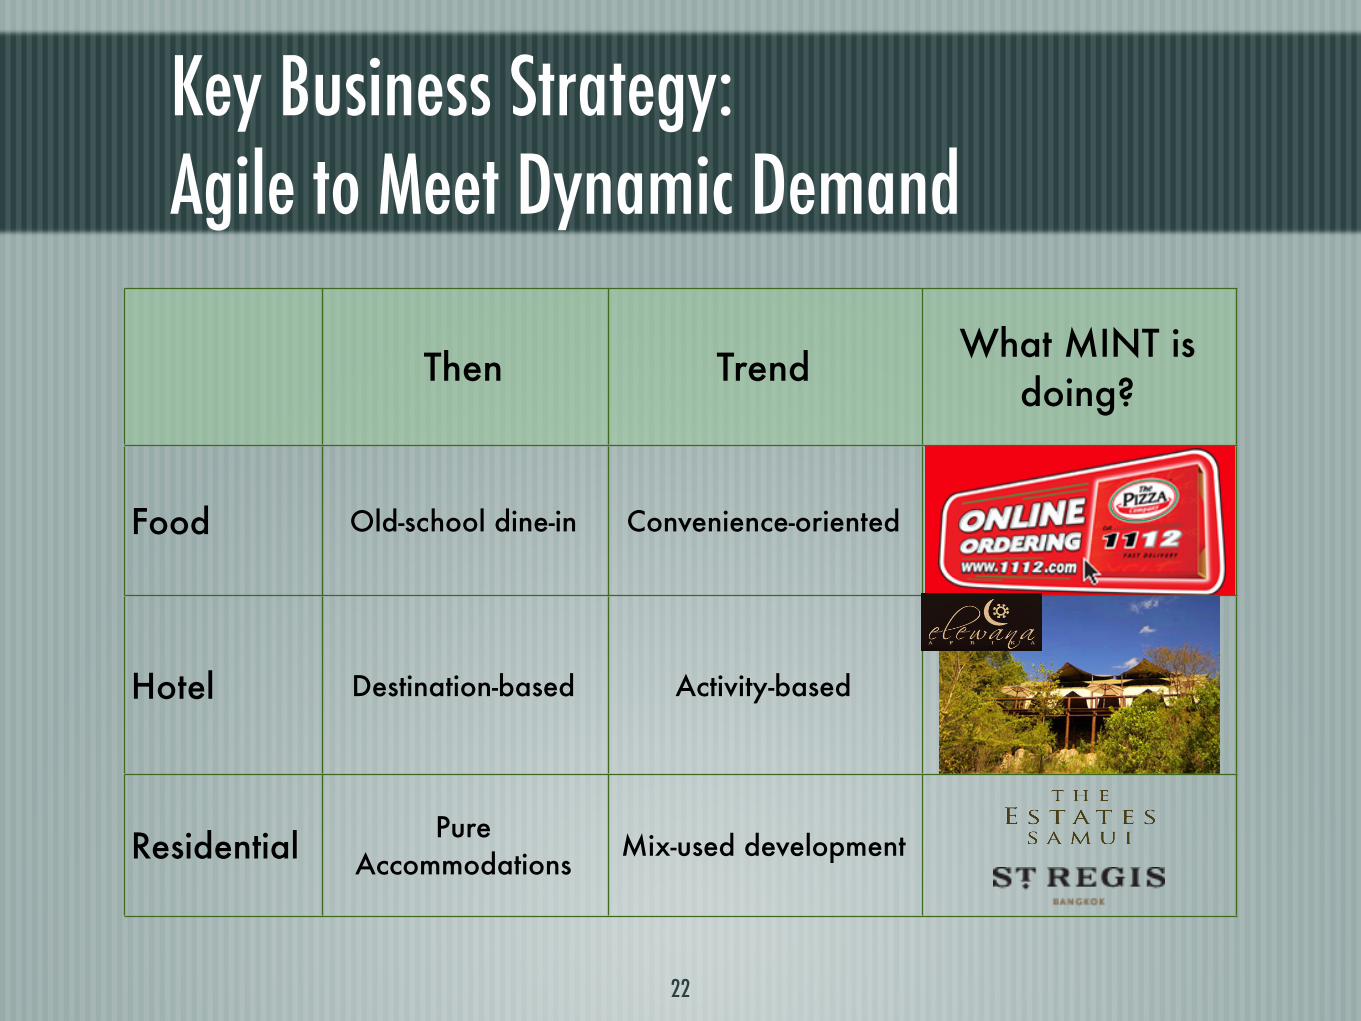
Key Business Strategy: Agile to Meet Dynamic Demand
22
Then TrendWhat MINT is
doing?
Food Old-school dine-in Convenience-oriented
Hotel Destination-based Activity-based
ResidentialPure
AccommodationsMix-used development

Food Service Industry

Food Business Trends
24
Growing health & wellness food segment
Consumers driven by convenient channel
Premium food concept/variety
Flavors added by international travelers demand
Demand for day parts (Breakfast/snacks)
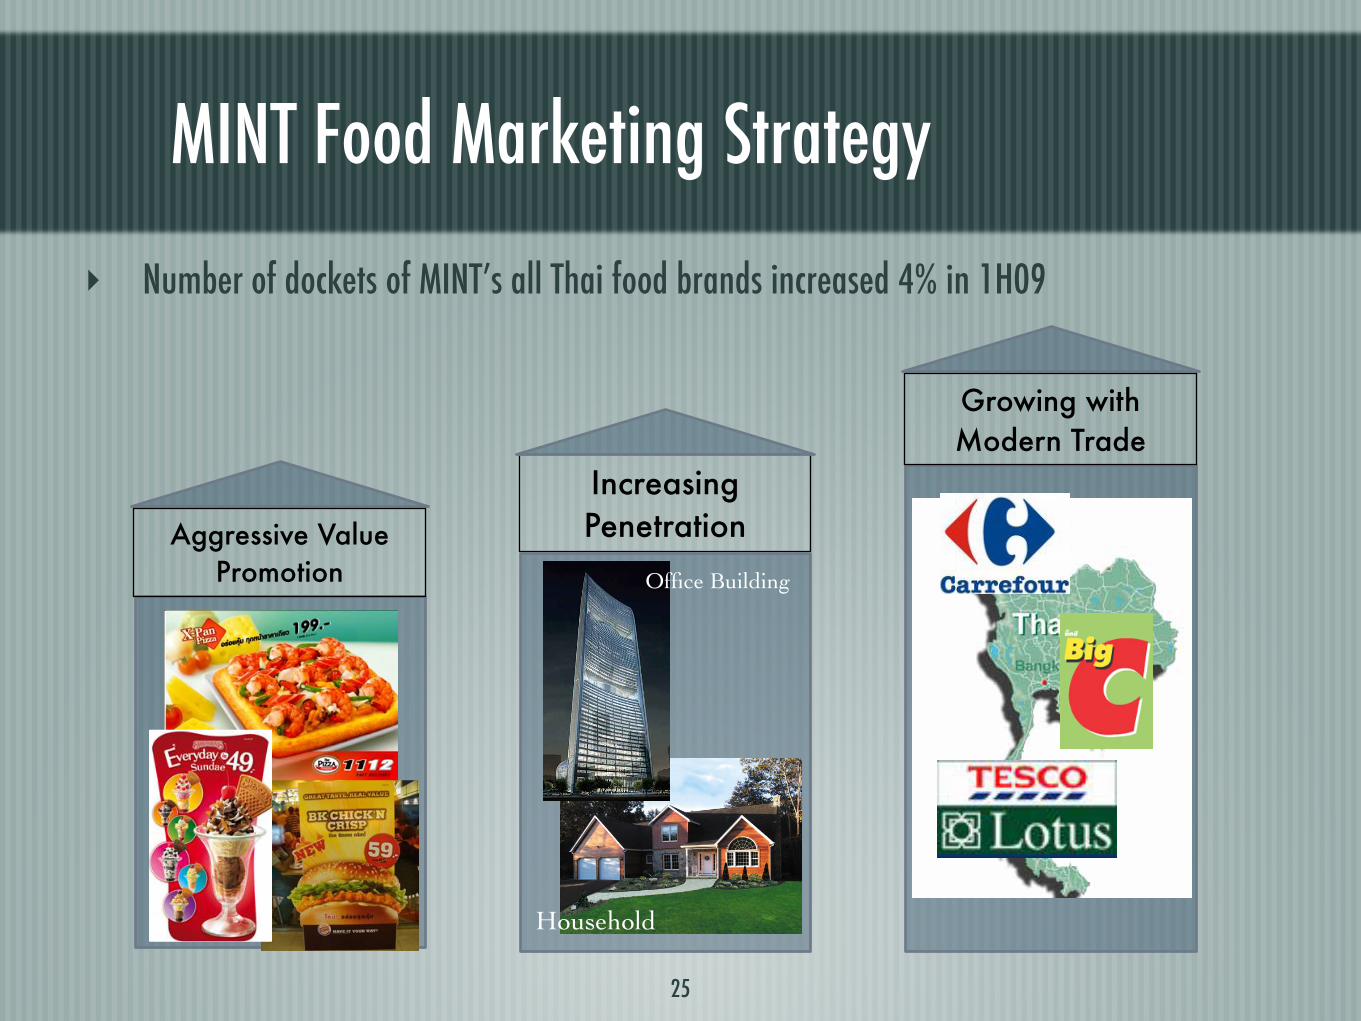
MINT Food Marketing Strategy
25
Increasing Penetration
Growing with Modern Trade
Aggressive Value Promotion Office Building
! Number of dockets of MINT’s all Thai food brands increased 4% in 1H09
Household
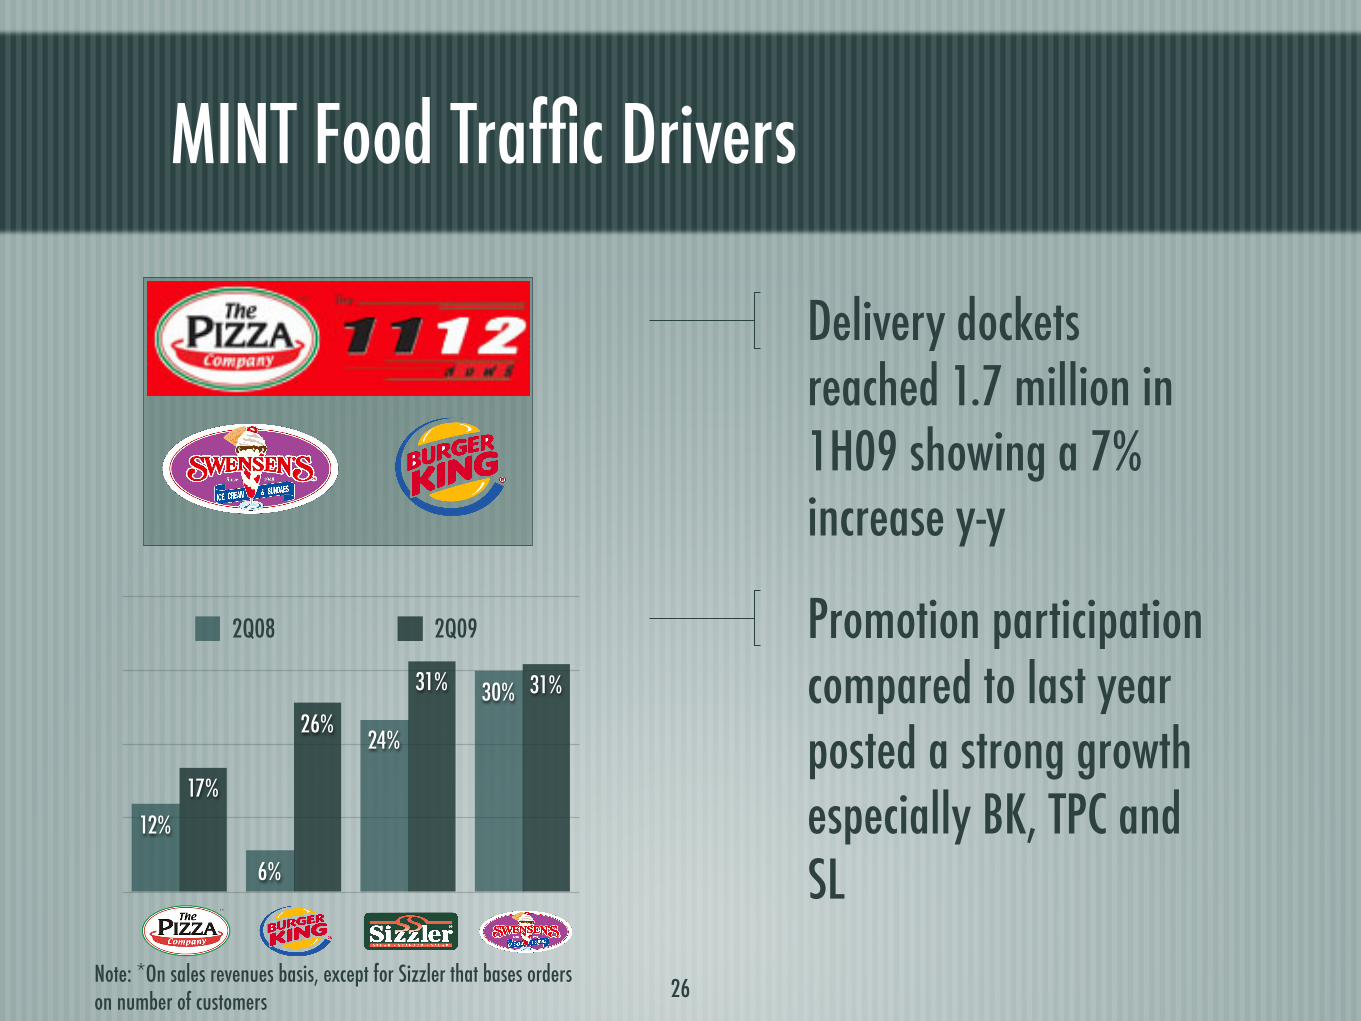
MINT Food Traffic Drivers
Delivery dockets reached 1.7 million in 1H09 showing a 7% increase y-y
Promotion participation compared to last year posted a strong growth especially BK, TPC and SL
26Note: *On sales revenues basis, except for Sizzler that bases orders on number of customers
TPC BK SL SW
31%31%
26%
17%
30%
24%
6%
12%
2Q08 2Q09

Tourism & Hotel Industry
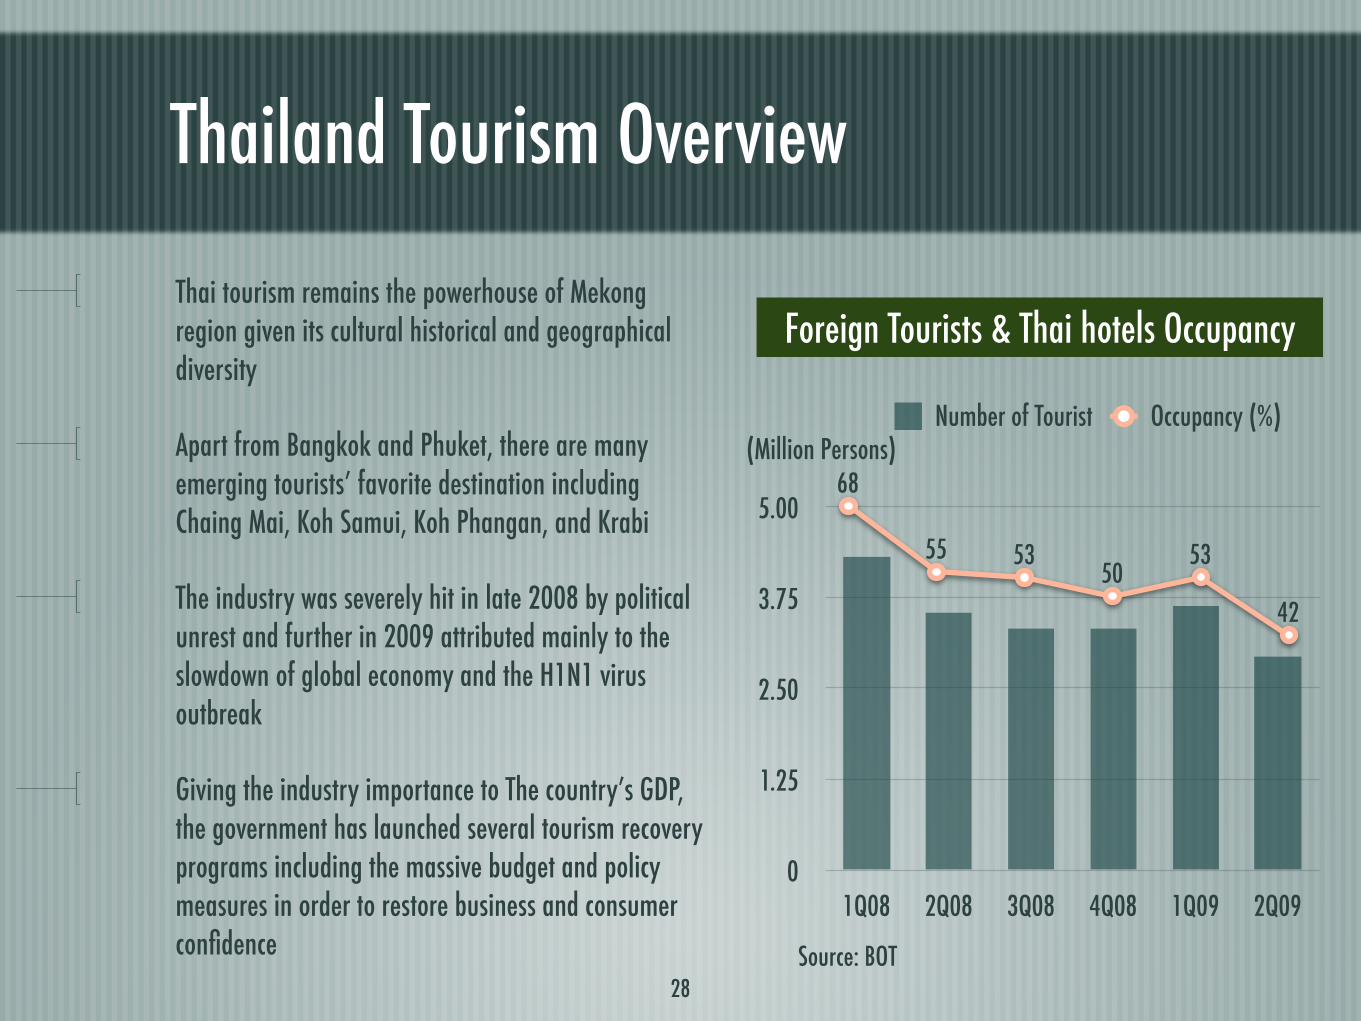
Thailand Tourism Overview
28
Thai tourism remains the powerhouse of Mekong region given its cultural historical and geographical diversity
Apart from Bangkok and Phuket, there are many emerging tourists’ favorite destination including Chaing Mai, Koh Samui, Koh Phangan, and Krabi
The industry was severely hit in late 2008 by political unrest and further in 2009 attributed mainly to the slowdown of global economy and the H1N1 virus outbreak
Giving the industry importance to The country’s GDP, the government has launched several tourism recovery programs including the massive budget and policy measures in order to restore business and consumer confidence
0
1.25
2.50
3.75
5.00
1Q08 2Q08 3Q08 4Q08 1Q09 2Q09
Number of Tourist
68
55 5350
53
42
Occupancy (%)(Million Persons)
Foreign Tourists & Thai hotels Occupancy
Source: BOT
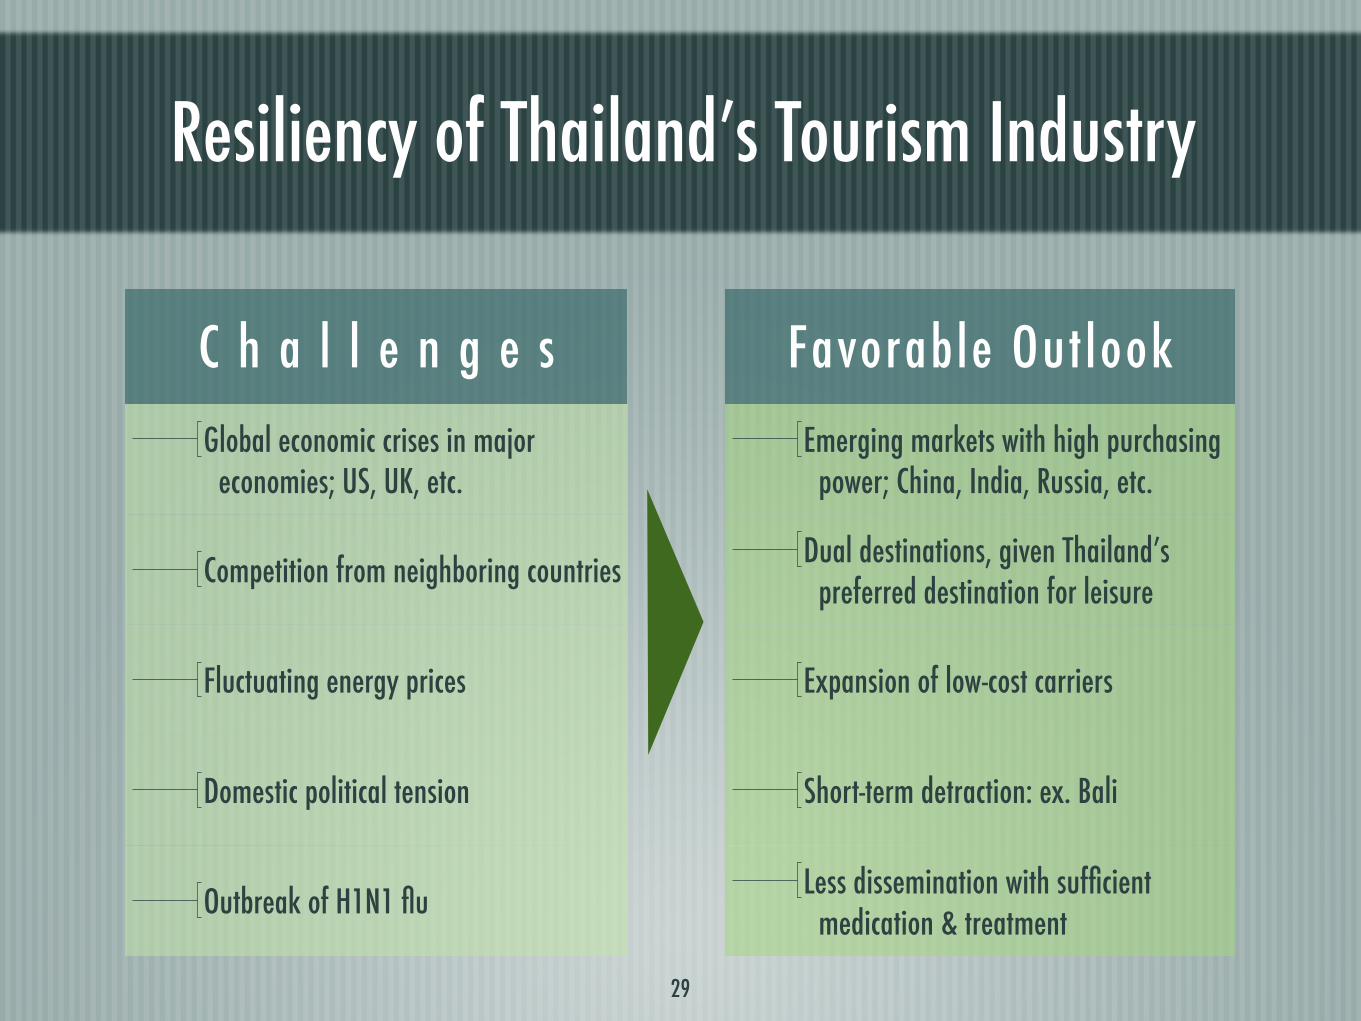
Resiliency of Thailand’s Tourism Industry
C h a l l e n g e s Favorable Outlook
Global economic crises in major economies; US, UK, etc.
Emerging markets with high purchasing power; China, India, Russia, etc.
Competition from neighboring countriesDual destinations, given Thailand’s
preferred destination for leisure
Fluctuating energy prices Expansion of low-cost carriers
Domestic political tension Short-term detraction: ex. Bali
Outbreak of H1N1 fluLess dissemination with sufficient
medication & treatment
29
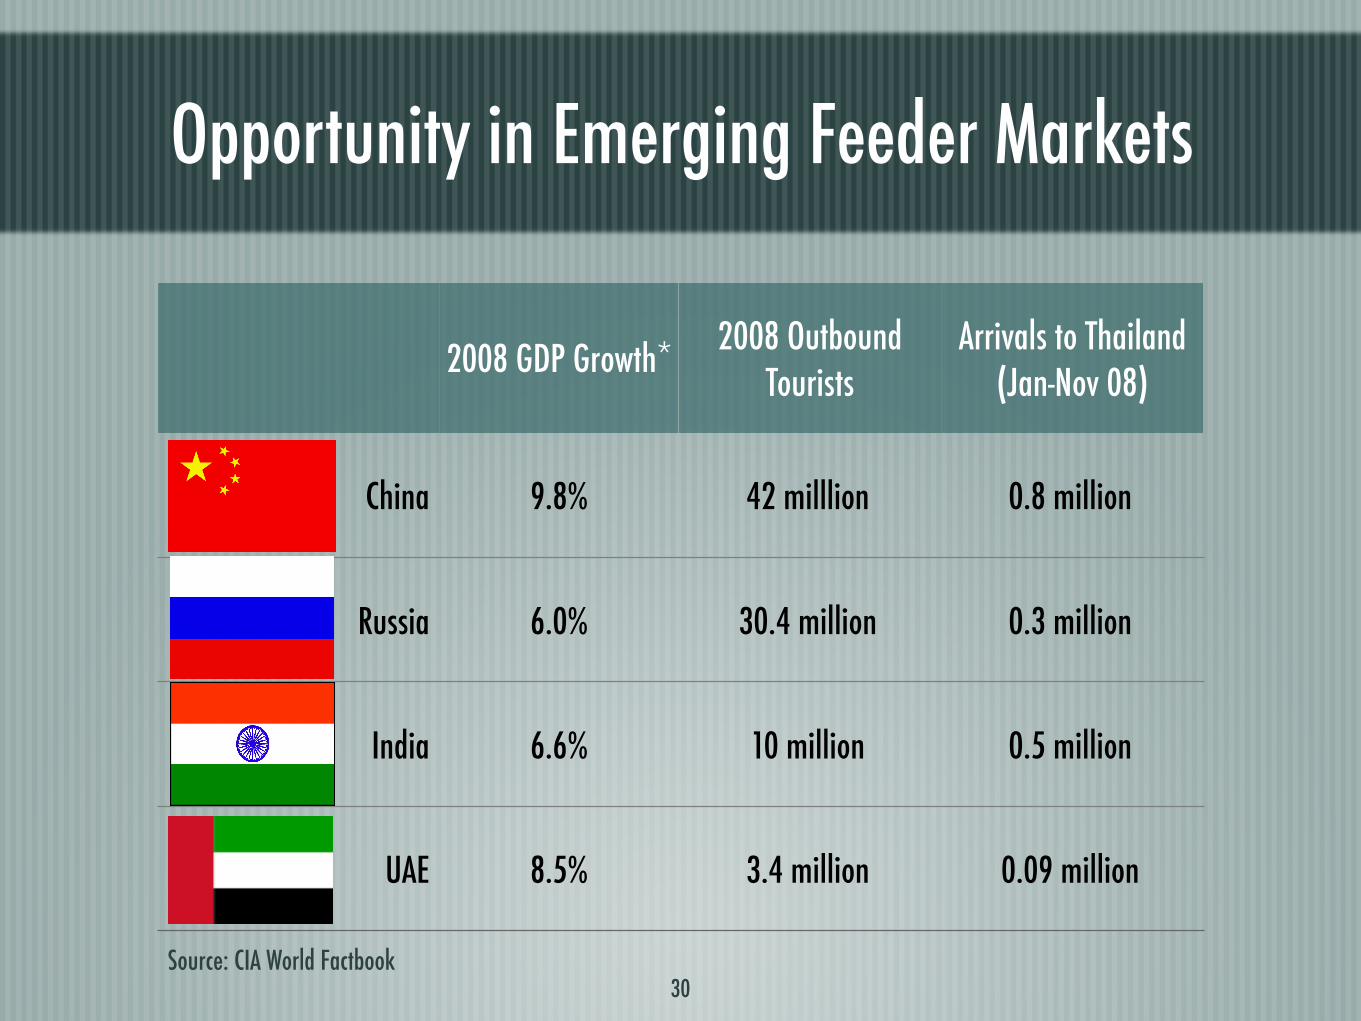
Opportunity in Emerging Feeder Markets
30
2008 GDP Growth*2008 Outbound
TouristsArrivals to Thailand
(Jan-Nov 08)
China 9.8% 42 milllion 0.8 million
Russia 6.0% 30.4 million 0.3 million
India 6.6% 10 million 0.5 million
UAE 8.5% 3.4 million 0.09 million
Source: CIA World Factbook
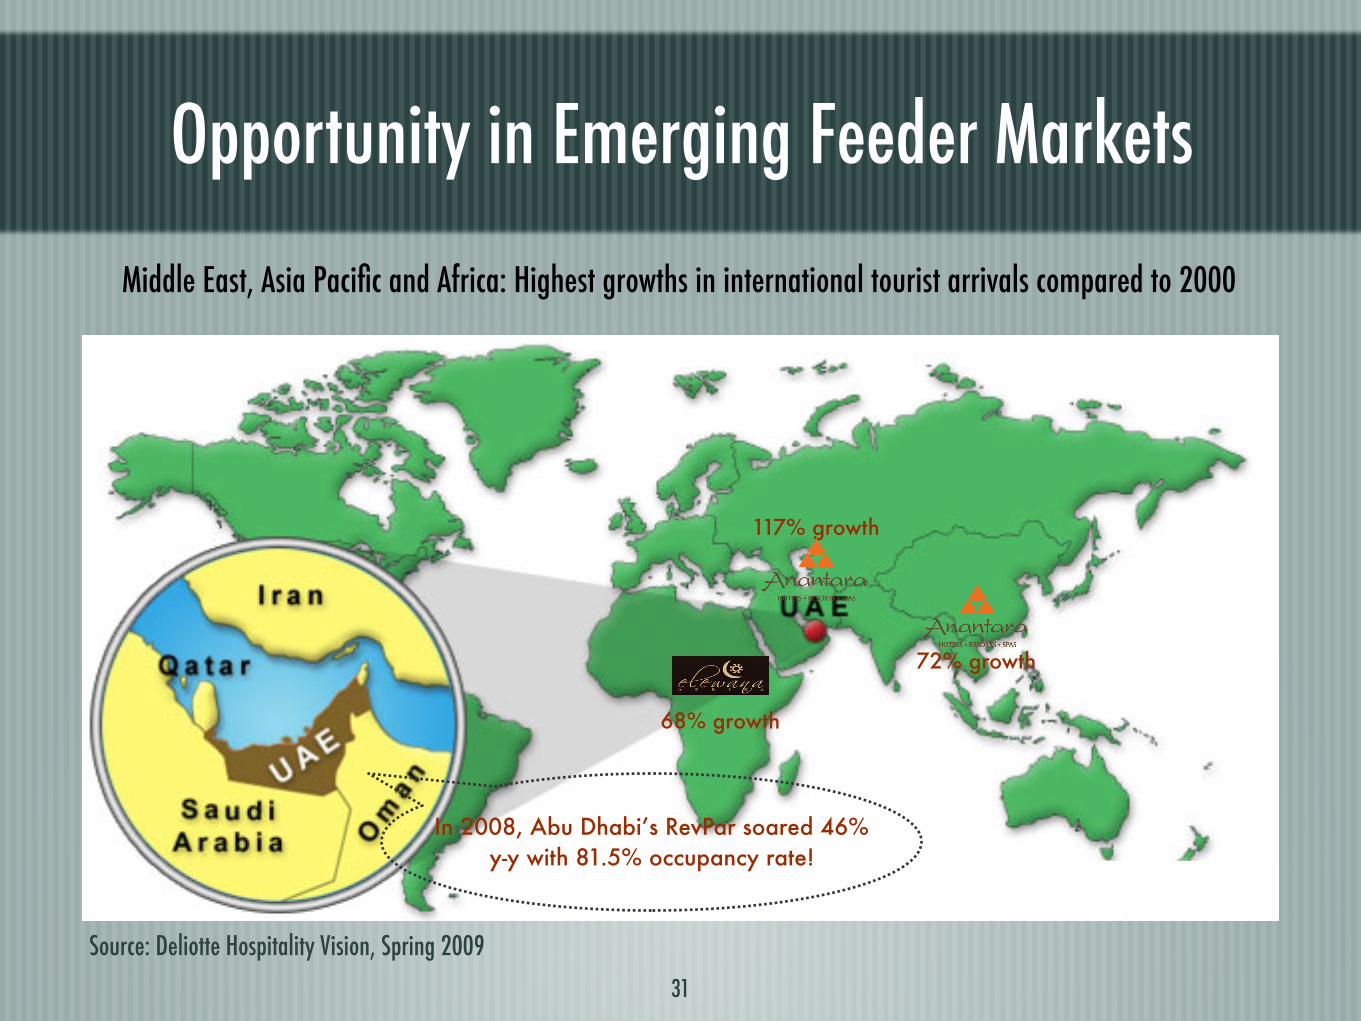
Opportunity in Emerging Feeder Markets
31
Source: Deliotte Hospitality Vision, Spring 2009
Middle East, Asia Pacific and Africa: Highest growths in international tourist arrivals compared to 2000
117% growth
68% growth
72% growth
In 2008, Abu Dhabi’s RevPar soared 46% y-y with 81.5% occupancy rate!

The World’s New Emerging Locations
Bushmans Kloof, Western Cape, South Africa
Oberoi Vanuavillas, India
Jade Mountain, St. Lucia
Sabi Sabi Private Game Reserve, South Africa
Inn at Manitou, Ontario, Canada
Top 10 Hotels Overall by Travel + Leisure
Singita Sabi Sand, South Africa
Four Seasons Tented Camp, Chiang Rai
Oberoi Udaivilas, India
Governors’ Camp, Kenya
Jack’s Camp Kalahari, Botswana
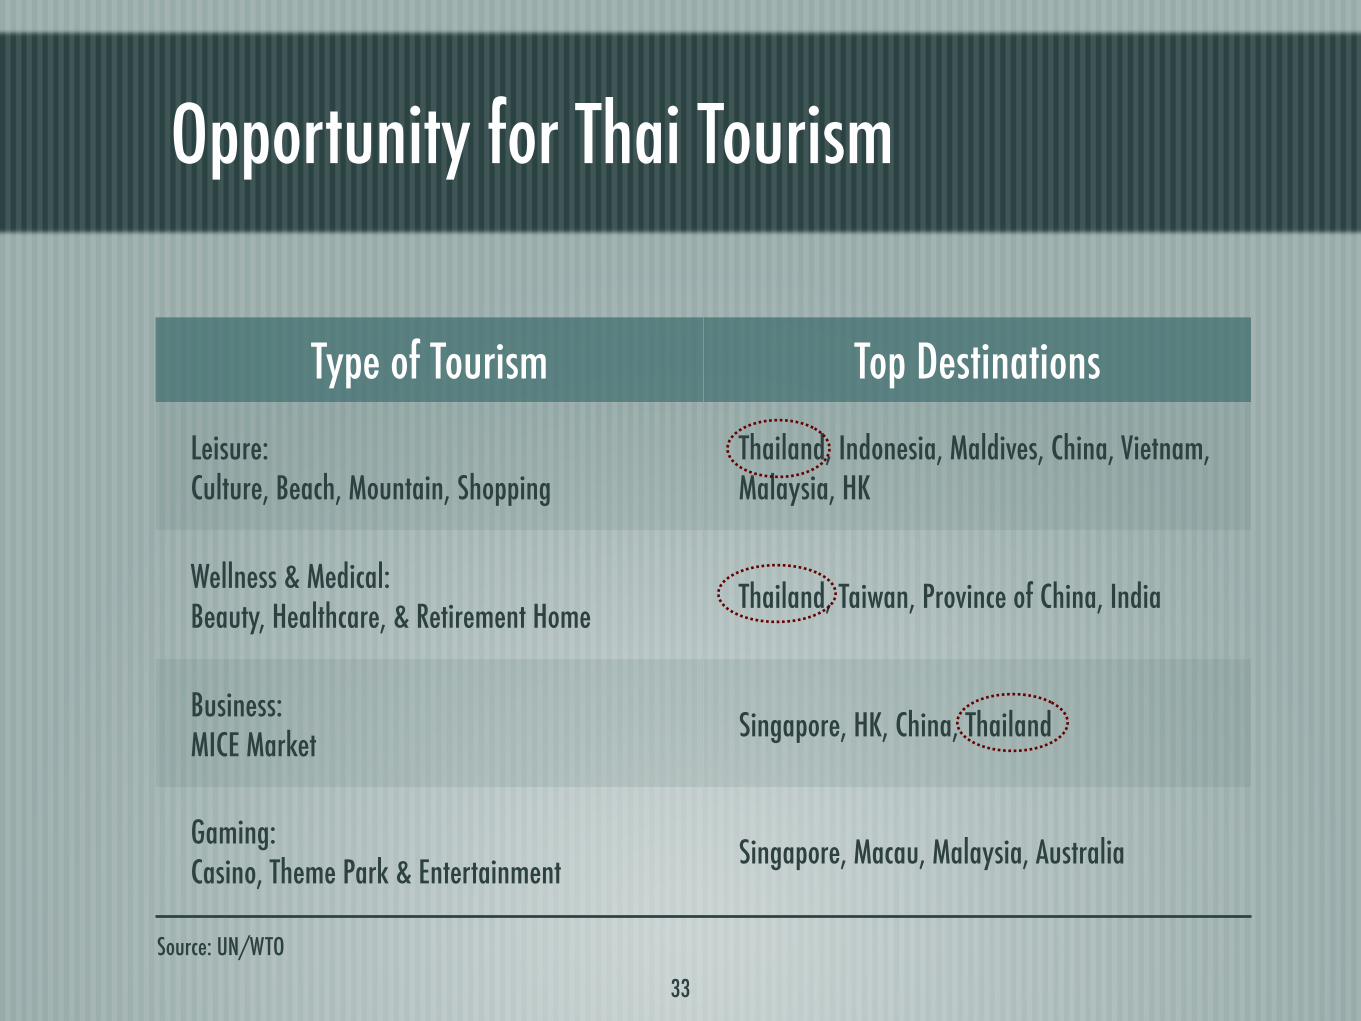
Opportunity for Thai Tourism
Source: UN/WTO
Type of Tourism Top Destinations
Leisure:Culture, Beach, Mountain, Shopping
Thailand, Indonesia, Maldives, China, Vietnam, Malaysia, HK
Wellness & Medical:Beauty, Healthcare, & Retirement Home
Thailand, Taiwan, Province of China, India
Business:MICE Market
Singapore, HK, China, Thailand
Gaming: Casino, Theme Park & Entertainment
Singapore, Macau, Malaysia, Australia
33
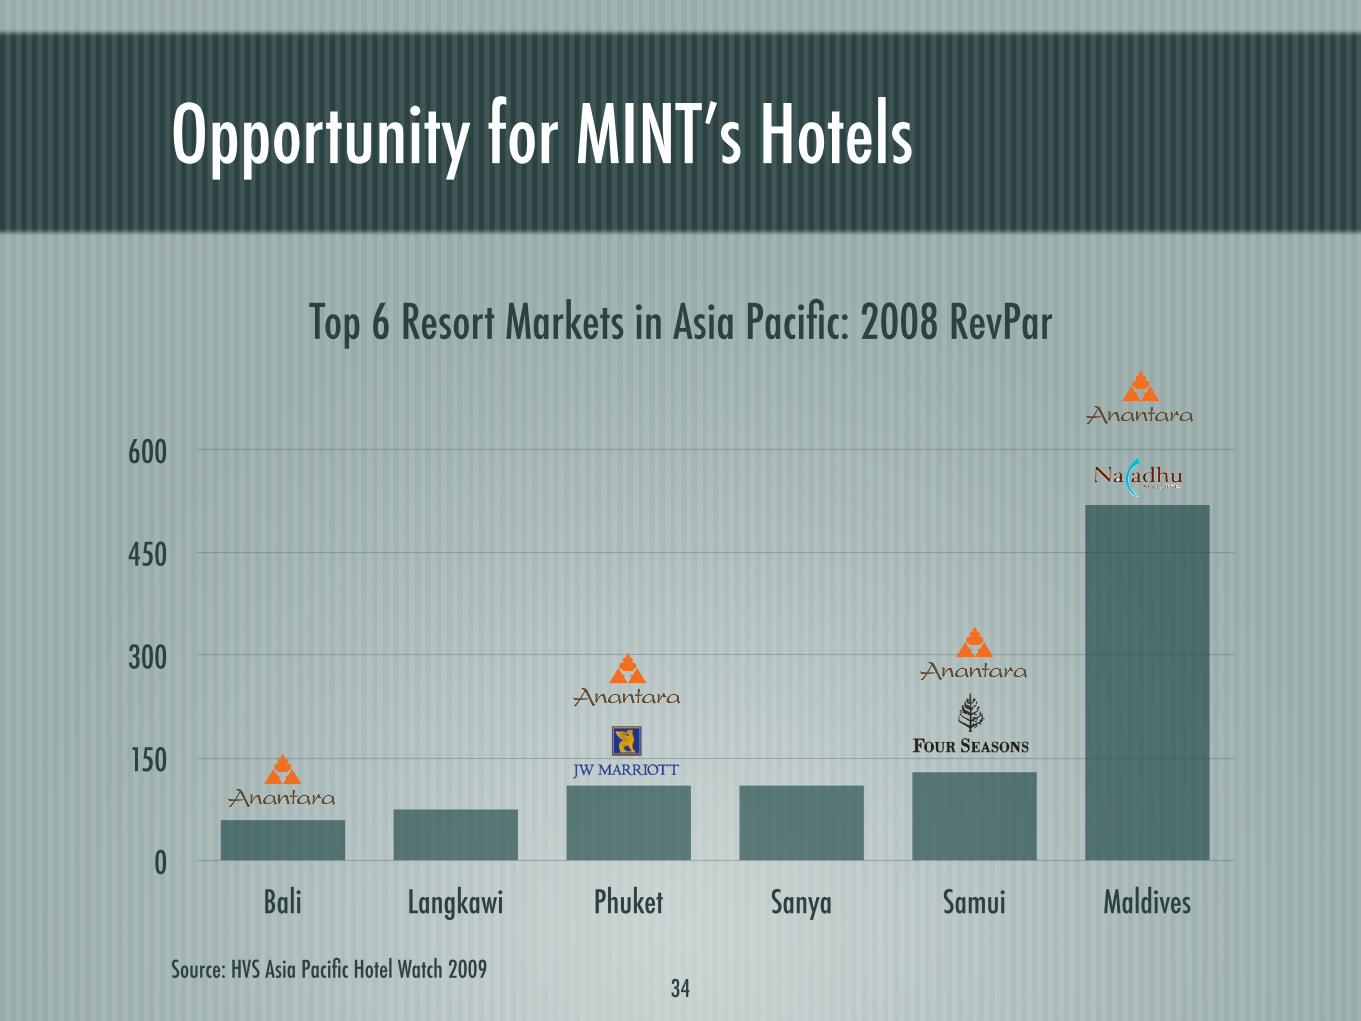
Opportunity for MINT’s Hotels
34Source: HVS Asia Pacific Hotel Watch 2009
0
150
300
450
600
Bali Langkawi Phuket Sanya Samui Maldives
Top 6 Resort Markets in Asia Pacific: 2008 RevPar
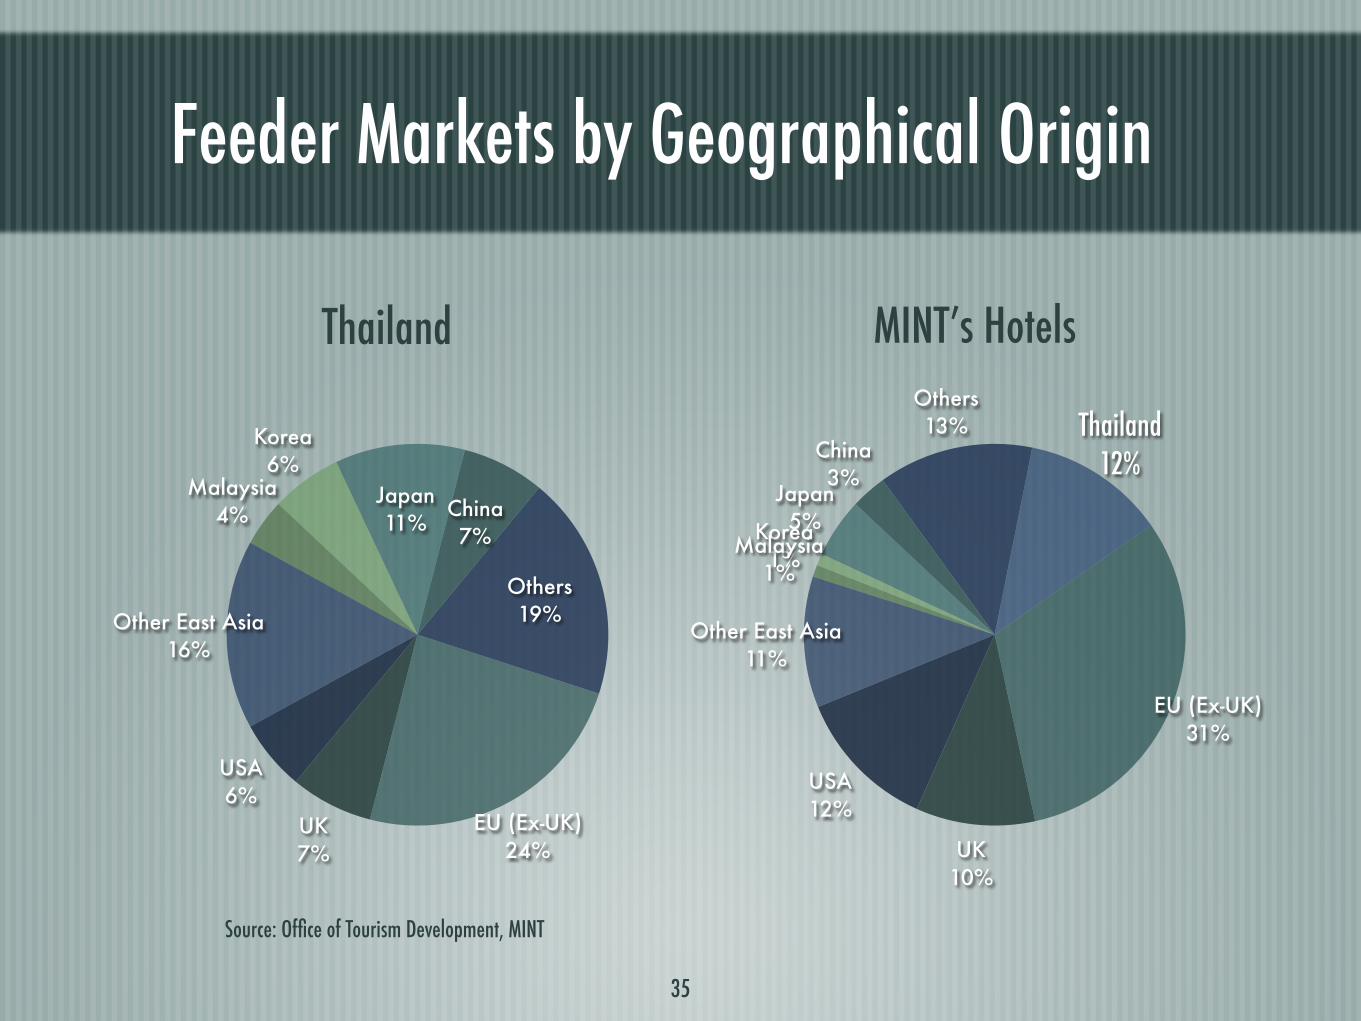
Feeder Markets by Geographical Origin
Thailand MINT’s Hotels
Others19%
China7%
Japan11%
Korea6%
Malaysia4%
Other East Asia16%
USA6%
UK7%
EU (Ex-UK)24%
Source: Office of Tourism Development, MINT
Thailand12%
Others13%
China3%
Japan5%Korea
1%Malaysia
1%
Other East Asia11%
USA12%
UK10%
EU (Ex-UK)31%
35
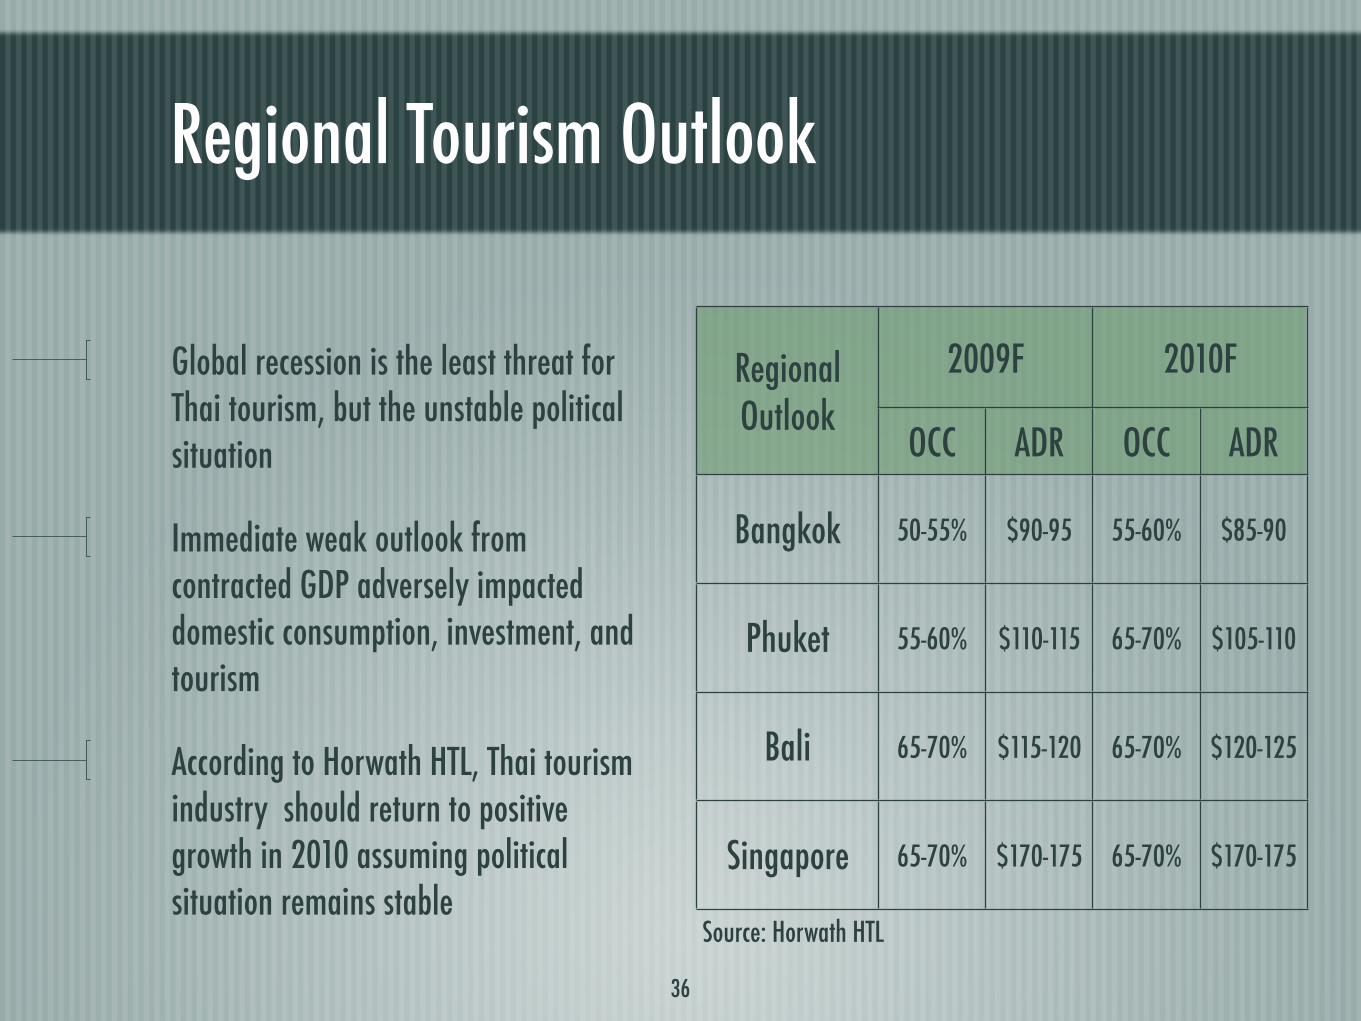
Regional Tourism Outlook
36
Global recession is the least threat for Thai tourism, but the unstable political situation
Immediate weak outlook from contracted GDP adversely impacted domestic consumption, investment, and tourism
According to Horwath HTL, Thai tourism industry should return to positive growth in 2010 assuming political situation remains stable
Regional Outlook
2009F 2010F
OCC ADR OCC ADR
Bangkok 50-55% $90-95 55-60% $85-90
Phuket 55-60% $110-115 65-70% $105-110
Bali 65-70% $115-120 65-70% $120-125
Singapore 65-70% $170-175 65-70% $170-175
Source: Horwath HTL

V. Expansion & Cashflow Outlook
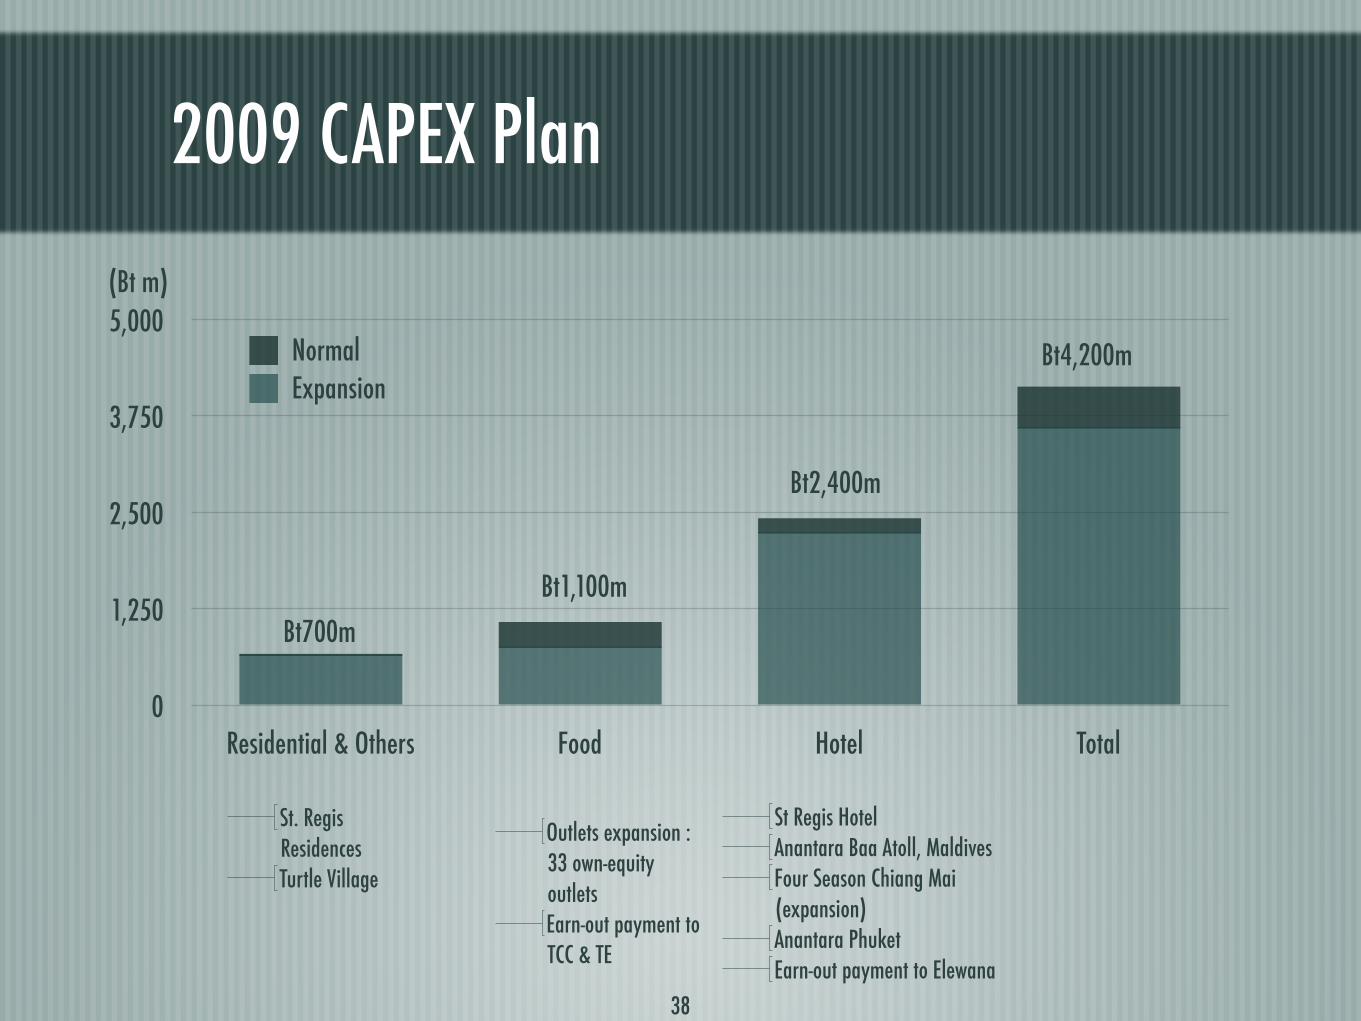
2009 CAPEX Plan
0
1,250
2,500
3,750
5,000
Residential & Others Food Hotel Total
ExpansionNormal
St. Regis ResidencesTurtle Village
Outlets expansion : 33 own-equity outlets Earn-out payment to TCC & TE
St Regis HotelAnantara Baa Atoll, MaldivesFour Season Chiang Mai (expansion)Anantara PhuketEarn-out payment to Elewana
(Bt m)
Bt1,100m
Bt700m
Bt2,400m
Bt4,200m
38
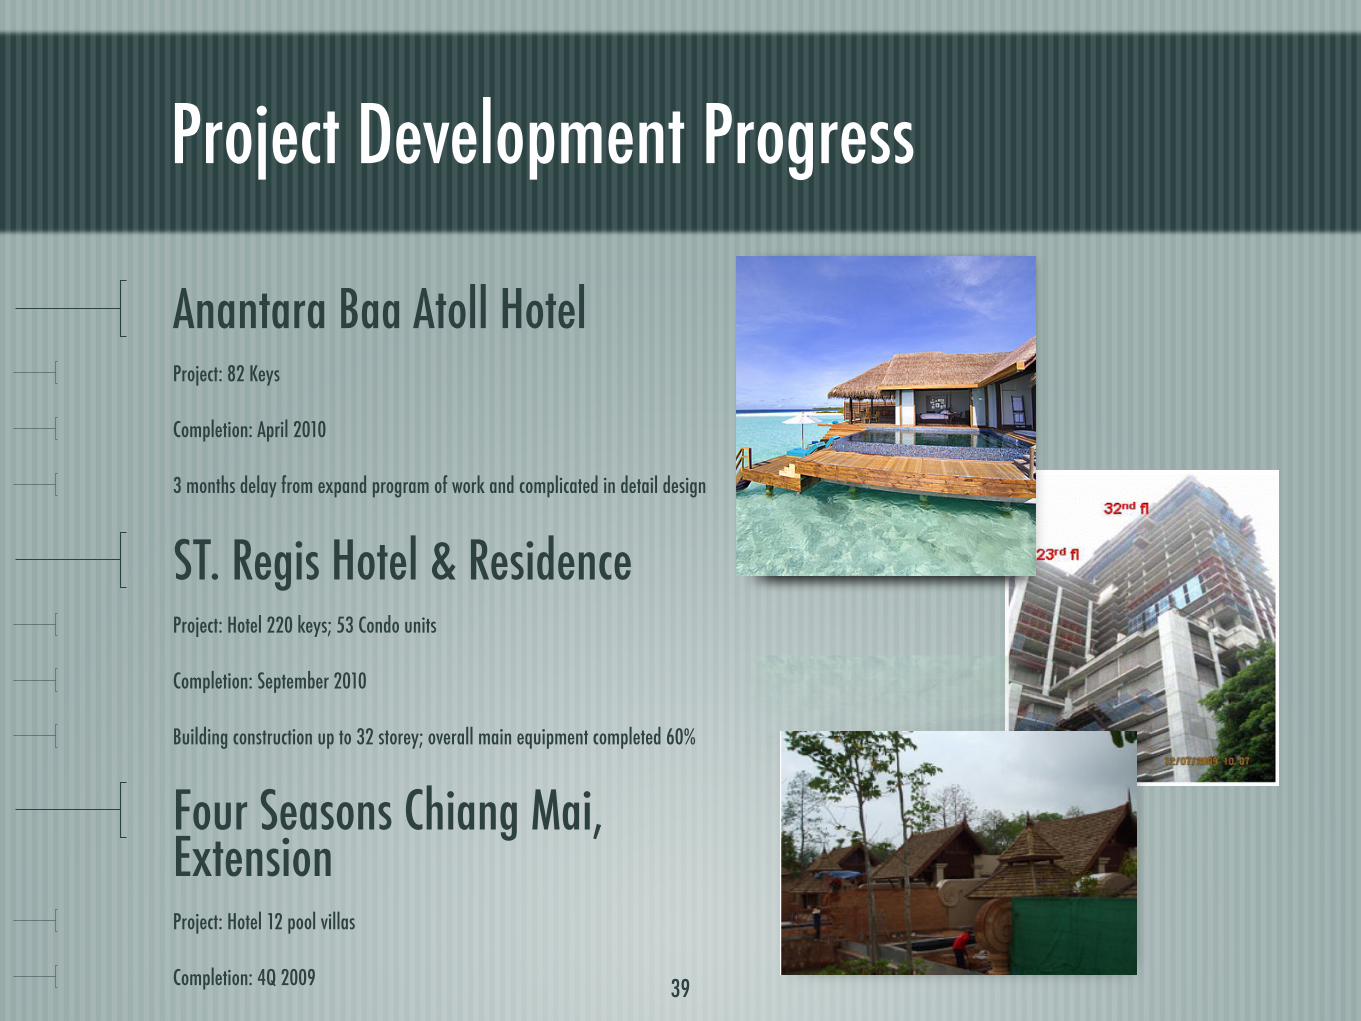
Project Development Progress
Anantara Baa Atoll HotelProject: 82 Keys
Completion: April 2010
3 months delay from expand program of work and complicated in detail design
ST. Regis Hotel & ResidenceProject: Hotel 220 keys; 53 Condo units
Completion: September 2010
Building construction up to 32 storey; overall main equipment completed 60%
Four Seasons Chiang Mai, ExtensionProject: Hotel 12 pool villas
Completion: 4Q 2009 39
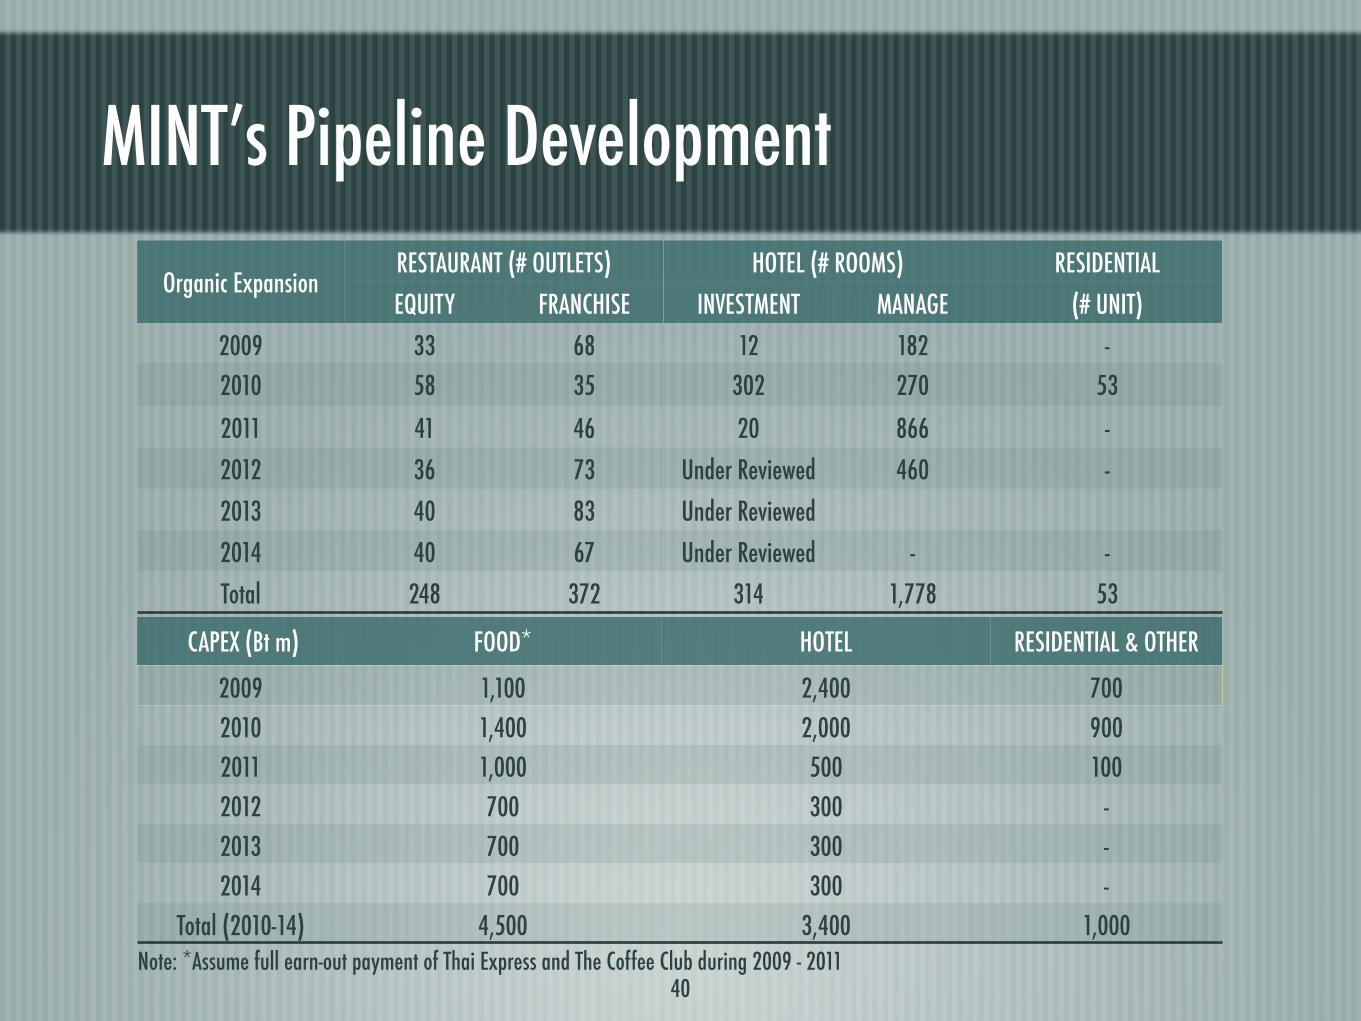
MINT’s Pipeline Development
Organic ExpansionRESTAURANT (# OUTLETS) HOTEL (# ROOMS) RESIDENTIAL
EQUITY FRANCHISE INVESTMENT MANAGE (# UNIT)
2009 33 68 12 182 -
2010 58 35 302 270 53
2011 41 46 20 866 -
2012 36 73 Under Reviewed 460 -
2013 40 83 Under Reviewed
2014 40 67 Under Reviewed - -
Total 248 372 314 1,778 53
CAPEX (Bt m) FOOD* HOTEL RESIDENTIAL & OTHER
2009 1,100 2,400 700
2010 1,400 2,000 900
2011 1,000 500 100
2012 700 300 -
2013 700 300 -
2014 700 300 -
Total (2010-14) 4,500 3,400 1,000
40Note: *Assume full earn-out payment of Thai Express and The Coffee Club during 2009 - 2011
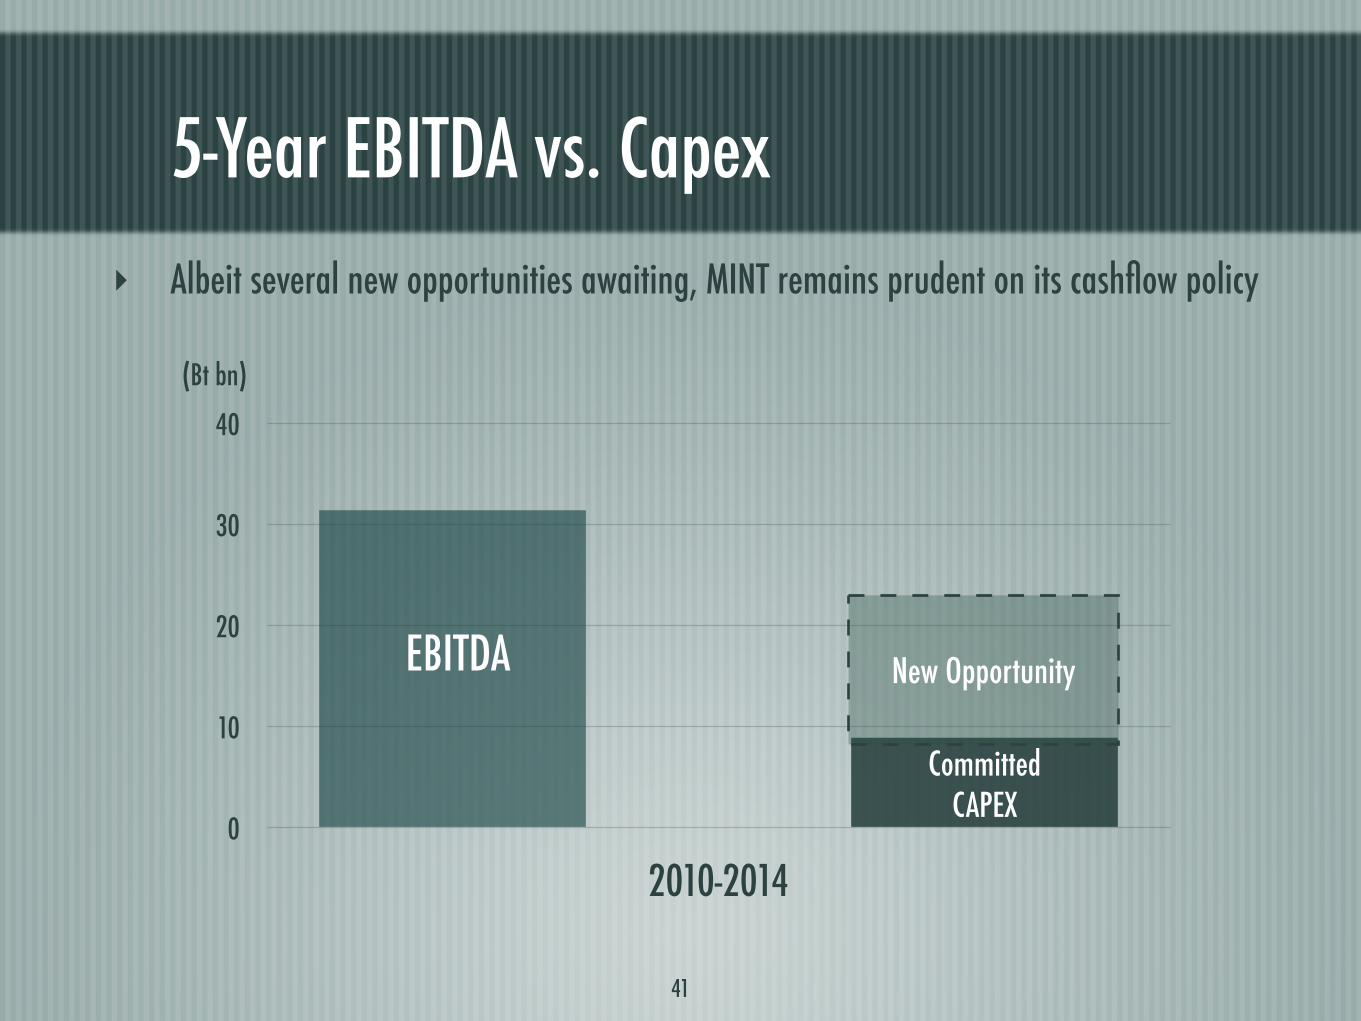
5-Year EBITDA vs. Capex
0
10
20
30
40
2010-2014
(Bt bn)
EBITDA
CommittedCAPEX
New Opportunity
41
! Albeit several new opportunities awaiting, MINT remains prudent on its cashflow policy
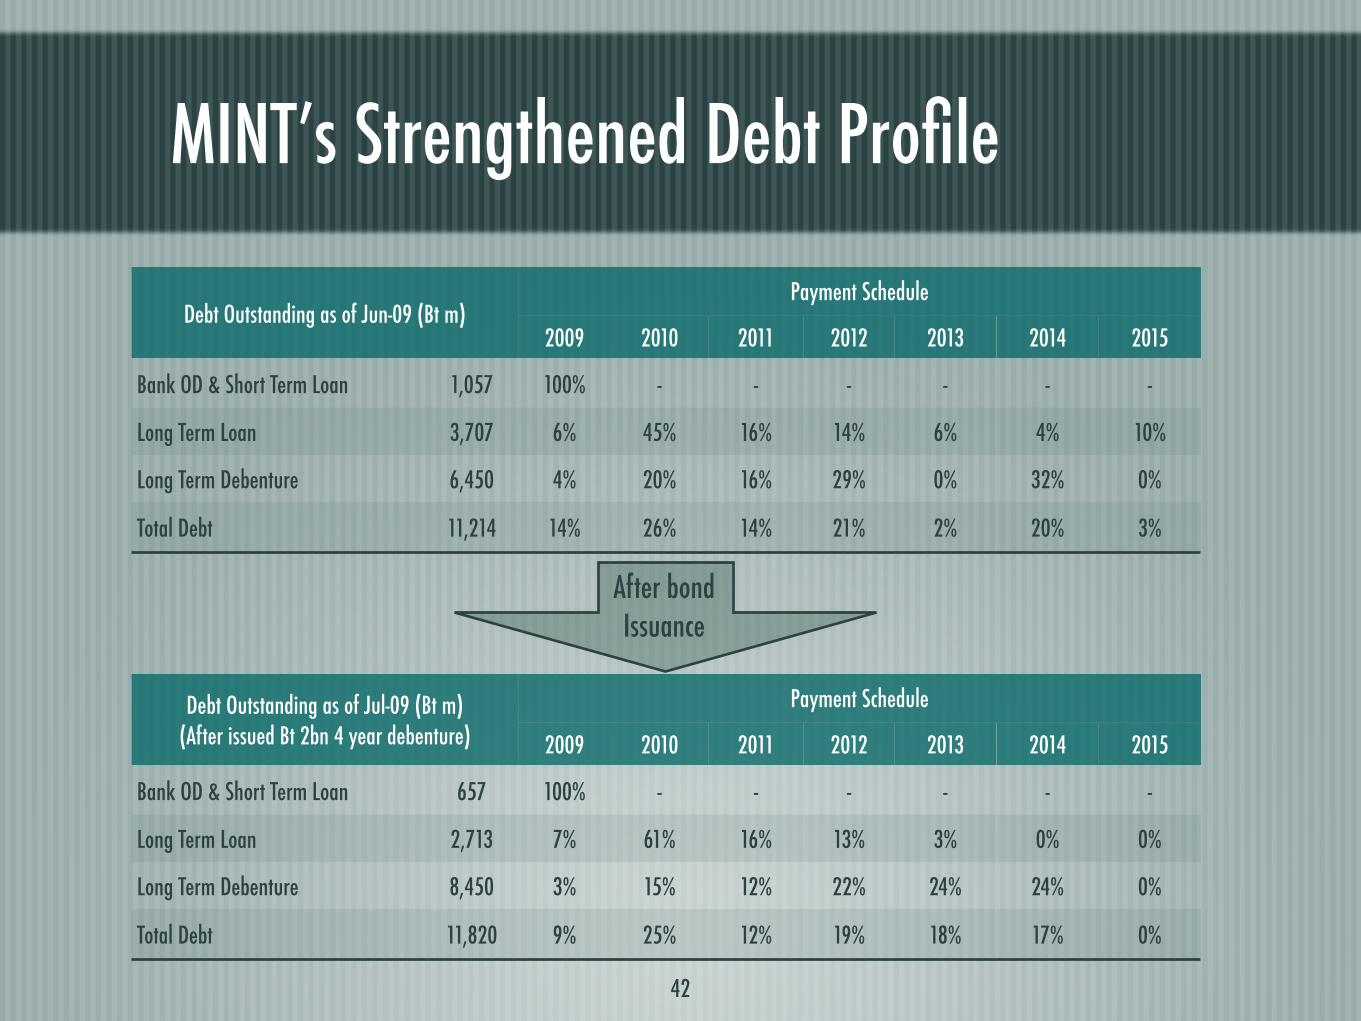
MINT’s Strengthened Debt Profile
42
Debt Outstanding as of Jun-09 (Bt m)Payment Schedule
2009 2010 2011 2012 2013 2014 2015
Bank OD & Short Term Loan 1,057 100% - - - - - -
Long Term Loan 3,707 6% 45% 16% 14% 6% 4% 10%
Long Term Debenture 6,450 4% 20% 16% 29% 0% 32% 0%
Total Debt 11,214 14% 26% 14% 21% 2% 20% 3%
Debt Outstanding as of Jul-09 (Bt m)(After issued Bt 2bn 4 year debenture)
Payment Schedule
2009 2010 2011 2012 2013 2014 2015
Bank OD & Short Term Loan 657 100% - - - - - -
Long Term Loan 2,713 7% 61% 16% 13% 3% 0% 0%
Long Term Debenture 8,450 3% 15% 12% 22% 24% 24% 0%
Total Debt 11,820 9% 25% 12% 19% 18% 17% 0%
After bond Issuance
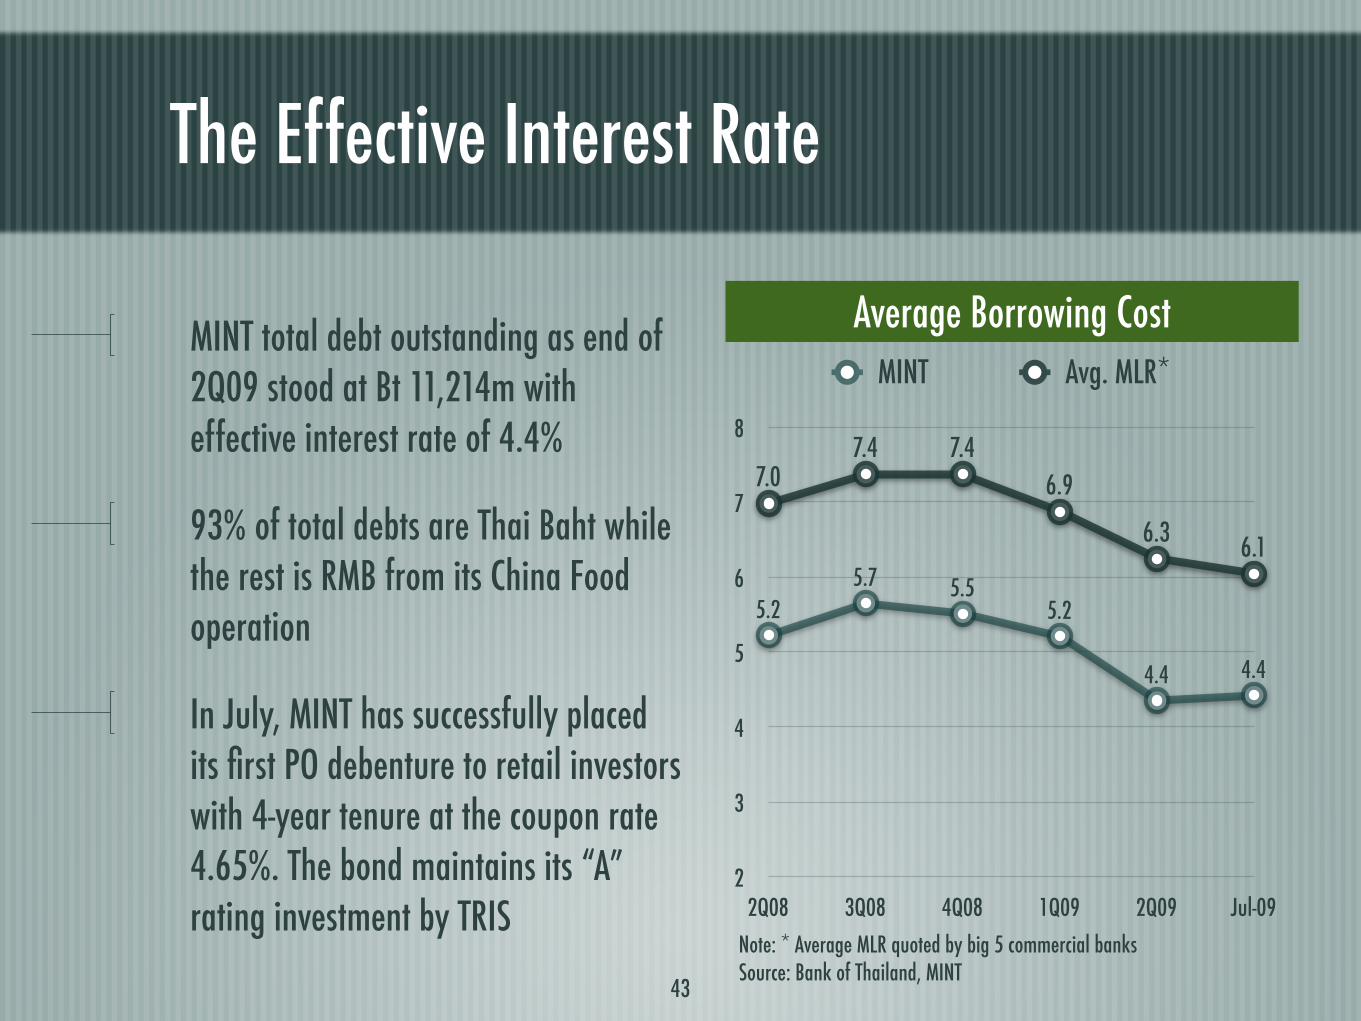
The Effective Interest Rate
2
3
4
5
6
7
8
2Q08 3Q08 4Q08 1Q09 2Q09 Jul-09
7.07.4 7.4
6.9
6.36.1
5.2
5.7 5.55.2
4.4 4.4
MINT total debt outstanding as end of 2Q09 stood at Bt 11,214m with effective interest rate of 4.4%
93% of total debts are Thai Baht while the rest is RMB from its China Food operation
In July, MINT has successfully placed its first PO debenture to retail investors with 4-year tenure at the coupon rate 4.65%. The bond maintains its “A” rating investment by TRIS
Average Borrowing Cost
43
MINT Avg. MLR*
Note: * Average MLR quoted by big 5 commercial banksSource: Bank of Thailand, MINT
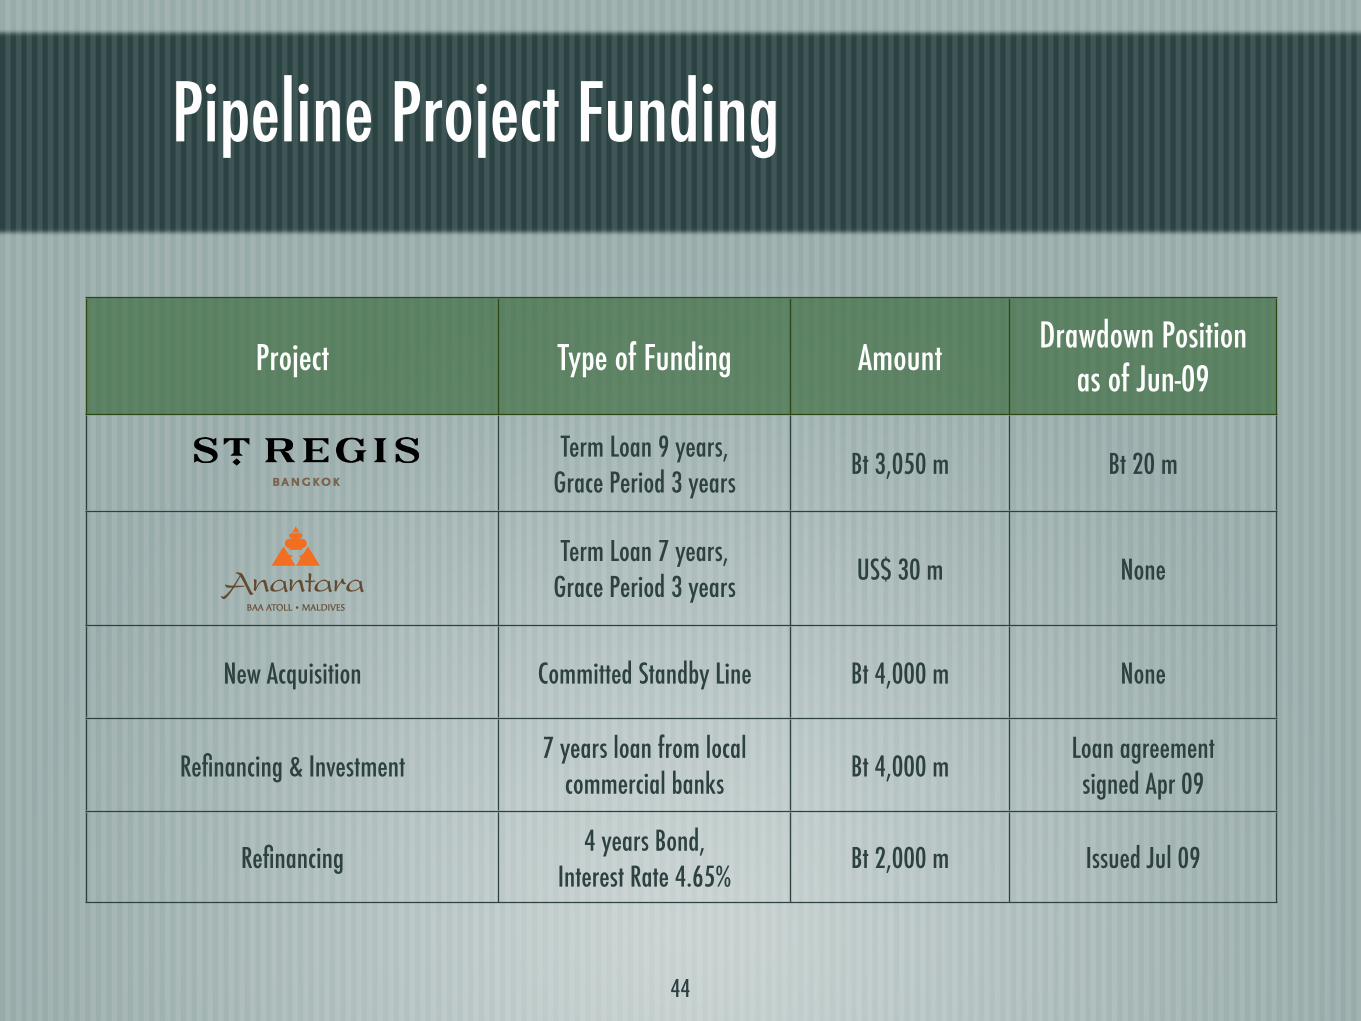
Pipeline Project Funding
Project Type of Funding AmountDrawdown Position
as of Jun-09
Term Loan 9 years, Grace Period 3 years
Bt 3,050 m Bt 20 m
Term Loan 7 years, Grace Period 3 years
US$ 30 m None
New Acquisition Committed Standby Line Bt 4,000 m None
Refinancing & Investment7 years loan from local
commercial banksBt 4,000 m
Loan agreement signed Apr 09
Refinancing 4 years Bond,
Interest Rate 4.65%Bt 2,000 m Issued Jul 09
44
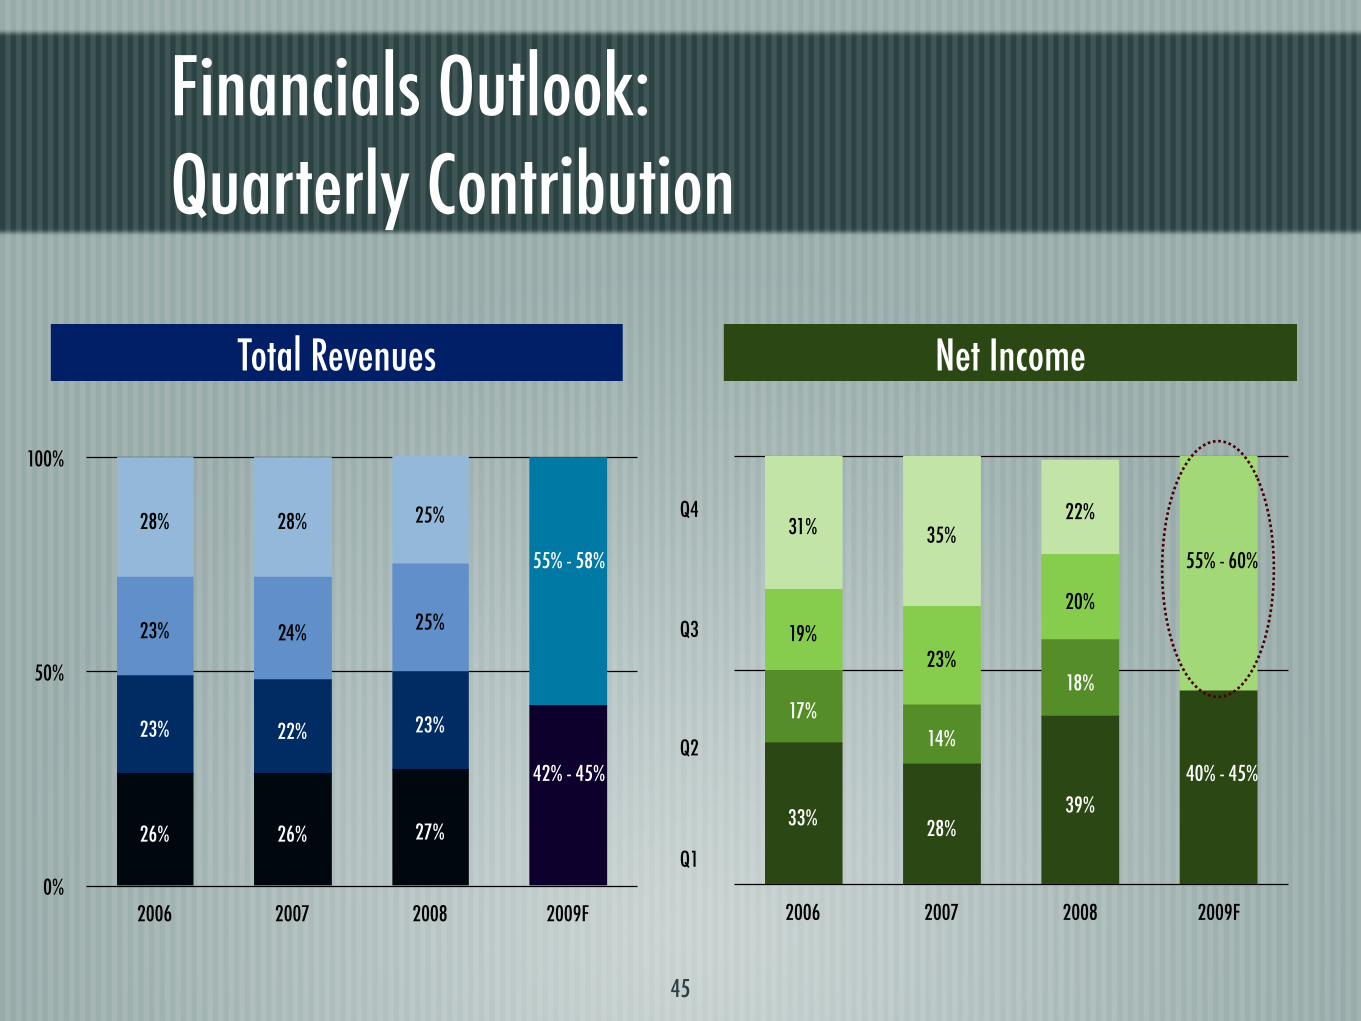
Financials Outlook: Quarterly Contribution
45
0%
50%
100%
2006 2007 2008 2009F
25%28%28%
25%24%23%
23%22%23%
27%26%26%
Q4
Q3
Q2
Q1
2006 2007 2008 2009F
22%35%31%
20%
23%19%
18%
14%17%
39%28%33%
Total Revenues Net Income
42% - 45%
55% - 58%
40% - 45%
55% - 60%

Q&A