Sites with Institutional Controls - Home - Minnesota Pollution

Non-point Source Pollution (NPS) Project Evaluation Practices in Minnesota: Summary Report
Karlyn Eckman and Rachel Walker, with Lilao Bouapao and Kimberly Nuckles
Water Resources Center University of Minnesota, Saint Paul
October 23 2008
Keywords: Evaluation research, program evaluation, social impact assessment, nonpoint source pollution (NPS), water quality projects, human dimensions.
Abstract This report summarizes the purpose, methods and findings of an Internet-based survey of nonpoint source pollution (NPS) and water quality projects in Minnesota. We surveyed 116 NPS projects between December 2007 and March 2008 to identify their current evaluation practices, gaps in those practices and their evaluation needs. Findings indicate that the majority of projects do not conduct baseline assessments, nor do they monitor or evaluate social outcomes such as adoption and maintenance of best management practices (BMPs). First, a majority of survey respondents (60%) do not measure social impacts and eight-six percent do not use social indicators for evaluation purposes. Second, project staff appear to monitor BMP success rates indirectly in nearly all cases through personal observation and discussion with staff implementing the BMPs. Third, some respondents are interested in learning ways to more accurately measure target audience BMP adoption rates, but lack specific training or effective tools. Finally, nearly 40% of projects in Minnesota have target audiences fewer than 500. In particular, few tools exist to assist such projects to measure impacts and outcomes such as adoption and maintenance of BMPs. We find ample interest, need and opportunity to build the capacities of project staff in monitoring and evaluating the social dimensions of water quality projects.
Background Federal, state and local agencies have invested heavily in nonpoint source pollution (NPS) programs in Minnesota through programs such as the Clean Water Act (1972), Minnesota’s Clean Water Legacy (CWLA 2006) funding, and state lottery funds. During evaluation, projects focus mainly on measuring biophysical changes (such as nutrient levels and temperature) and quantifying physical project outputs (such as the number of septic systems installed or buffer strip size). Public agencies have encouraged target audiences to adopt best management practices (BMPs) to improve water quality. These populations include, for example, farmers who contribute sediment from their fields to local streams, lakeshore residents who contribute lawn fertilizers to water bodies, and snowplow drivers who apply de-icing chemicals to streets and parking lots. While millions of dollars have been spent on NPS programs, the human dimensions (including impacts and outcomes) of these projects are not well understood in Minnesota. Social marketing approaches are sometimes used to promote BMPs, but how target audiences respond to social marketing, incentives, or other programs has not been well researched.

Anecdotal evidence from a number of rural and urban projects in Minnesota suggested that project staff are more comfortable with carrying out biophysical measurements than socio-economic assessment. Many staff members said that they are often unclear about how to motivate their target audiences to adopt BMPs, or how to determine whether people have actually changed their knowledge, behaviors and attitudes as a result of a project. Researchers at the University of Minnesota Water Resources Center (WRC) were interested to learn whether water quality project staff in Minnesota take into account social information and criteria when planning a project. Do they measure target audience awareness and knowledge of water quality before implementing a project? Do they examine people’s capacity and willingness to adopt BMPs? Do beliefs and attitudes change throughout a project’s implementation? Do projects consider possible constraints to BMP adoption, such as lack of interest, resources or time? Finally, we asked what kinds of resources NPS staff need to better assess the social dimensions of NPS projects. The Minnesota NPS evaluation study is linked to the social indicators planning and evaluation system (SIPES) project funded by Region 5 of the United States Environmental Protection Agency (USEPA). SIPES is intended to complement the environmental and administrative indicators already in place at the USEPA and state PCAs for evaluating NPS projects. SIPES is also meant to assist project staff in evaluating changes in attitudes, awareness, behaviors and capacities of populations targeted by Section 319 of the Clean Water Act. The SIPES initiative is composed of a six-state regional team (Illinois, Indiana, Michigan, Minnesota, Ohio and Wisconsin) organized in 2004. Since then, the team has drafted: 1. A “suite” of thirteen draft social indicators to measure attitudes, awareness, capacities and behaviors of target audiences; 2.Two standardized survey questionnaires for agricultural and non-farm audiences; 3. A social indicators data management and analysis (SIDMA) Internet-based software system for entering and analyzing survey data; 4. A draft handbook explaining the social indicators conceptual framework and the above tools. A description of this framework can be found at: http://www.uwex.edu/ces/regionalwater quality/Flagships/Indicators/htm. The team is now testing the social indicators system with local partners in some of the participating states. Each state has selected a few “pilot” NPS projects, whose staff will test the SIPES questionnaires and SIDMA system to evaluate the social dimensions of their projects. Each pilot will administer a survey questionnaire to its target audience at the project outset, and again at the termination of the project. The differences identified between the pre and post survey data should theoretically document changes in the knowledge, attitudes, awareness, behaviors and capacities of the target audience.
Until now, there has apparently not been research of actual evaluation practices in Region 5, or whether projects take into consideration social dimensions and outcomes in their
2
evaluation practices. The Minnesota NPS evaluation study described in this paper is an attempt to fill that information gap.
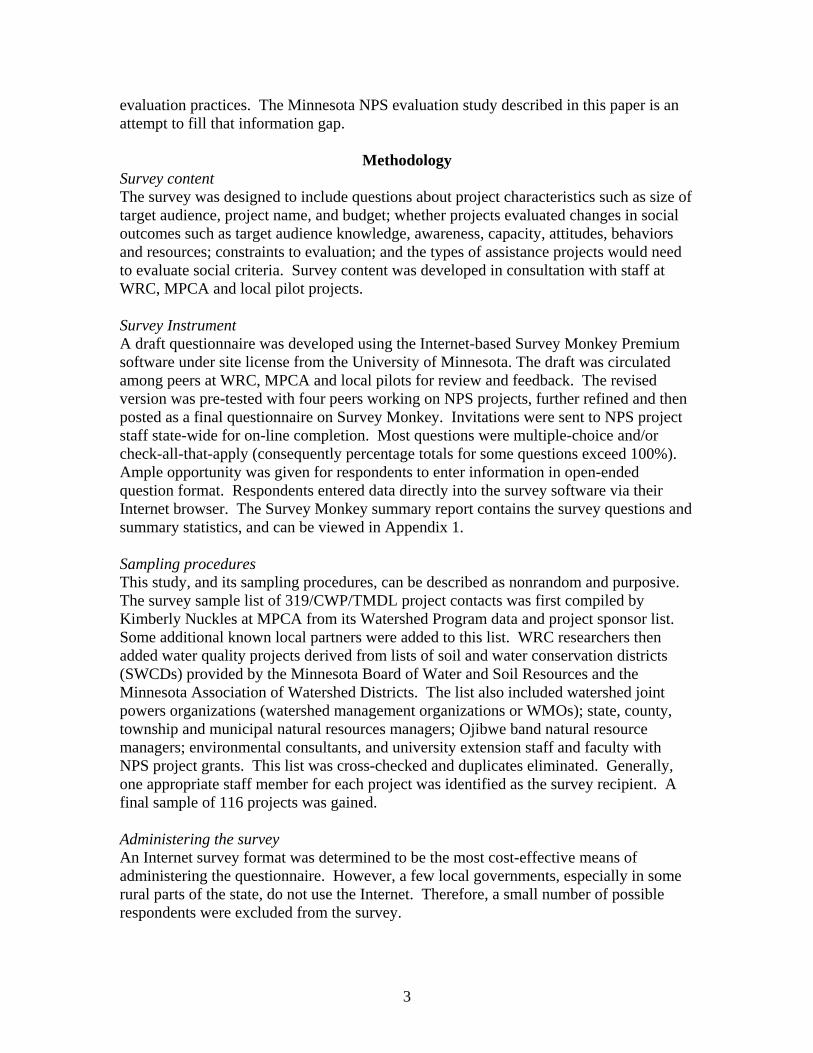
Methodology Survey content The survey was designed to include questions about project characteristics such as size of target audience, project name, and budget; whether projects evaluated changes in social outcomes such as target audience knowledge, awareness, capacity, attitudes, behaviors and resources; constraints to evaluation; and the types of assistance projects would need to evaluate social criteria. Survey content was developed in consultation with staff at WRC, MPCA and local pilot projects. Survey Instrument A draft questionnaire was developed using the Internet-based Survey Monkey Premium software under site license from the University of Minnesota. The draft was circulated among peers at WRC, MPCA and local pilots for review and feedback. The revised version was pre-tested with four peers working on NPS projects, further refined and then posted as a final questionnaire on Survey Monkey. Invitations were sent to NPS project staff state-wide for on-line completion. Most questions were multiple-choice and/or check-all-that-apply (consequently percentage totals for some questions exceed 100%). Ample opportunity was given for respondents to enter information in open-ended question format. Respondents entered data directly into the survey software via their Internet browser. The Survey Monkey summary report contains the survey questions and summary statistics, and can be viewed in Appendix 1. Sampling procedures This study, and its sampling procedures, can be described as nonrandom and purposive. The survey sample list of 319/CWP/TMDL project contacts was first compiled by Kimberly Nuckles at MPCA from its Watershed Program data and project sponsor list. Some additional known local partners were added to this list. WRC researchers then added water quality projects derived from lists of soil and water conservation districts (SWCDs) provided by the Minnesota Board of Water and Soil Resources and the Minnesota Association of Watershed Districts. The list also included watershed joint powers organizations (watershed management organizations or WMOs); state, county, township and municipal natural resources managers; Ojibwe band natural resource managers; environmental consultants, and university extension staff and faculty with NPS project grants. This list was cross-checked and duplicates eliminated. Generally, one appropriate staff member for each project was identified as the survey recipient. A final sample of 116 projects was gained. Administering the survey An Internet survey format was determined to be the most cost-effective means of administering the questionnaire. However, a few local governments, especially in some rural parts of the state, do not use the Internet. Therefore, a small number of possible respondents were excluded from the survey.
3
The survey was sent out by Internet on an invitation-only basis. Survey respondents entered data directly into Survey Monkey using a hot-link on the survey invitation email message. WRC staff contacted non-respondents encouraging them to take the survey. The completion rate was 85% of surveys (99 out of 116). Data analysis Survey Monkey software automatically calculated descriptive statistics and compiled a summary report. Lilao Bouapao carried out a content analysis of the open-ended narrative comments provided by survey respondents. Findings from both analyses are incorporated into the Results section below.
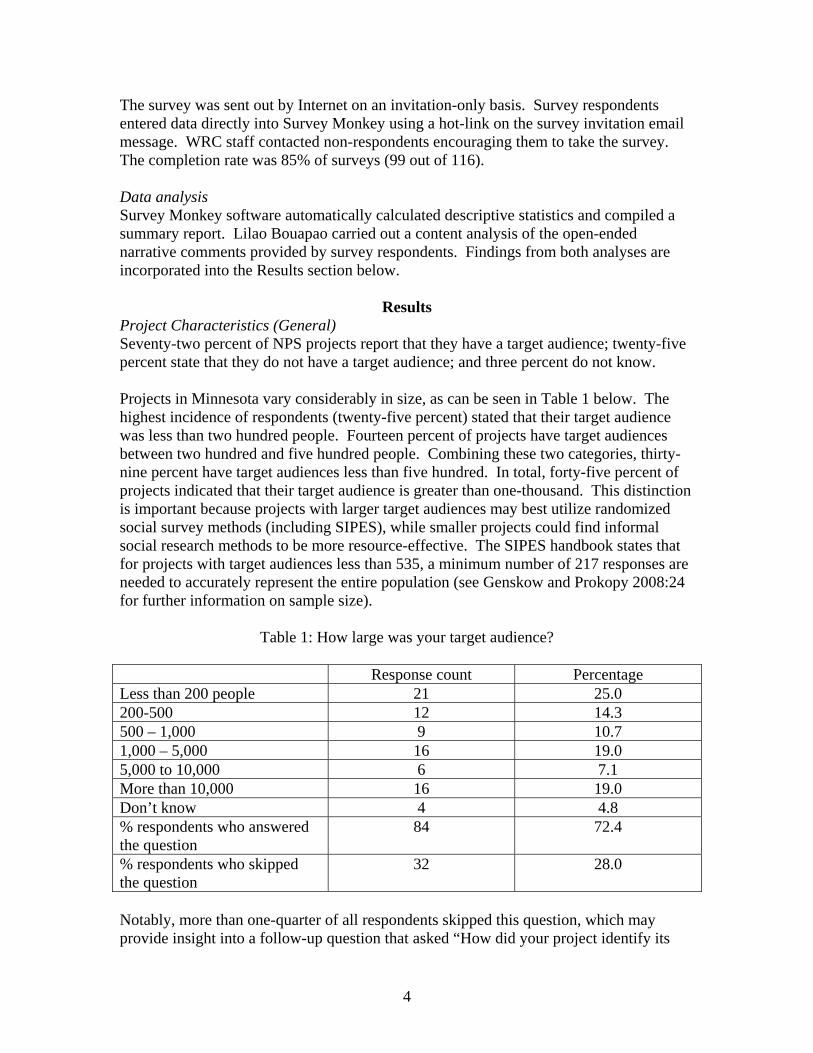
Results Project Characteristics (General) Seventy-two percent of NPS projects report that they have a target audience; twenty-five percent state that they do not have a target audience; and three percent do not know. Projects in Minnesota vary considerably in size, as can be seen in Table 1 below. The highest incidence of respondents (twenty-five percent) stated that their target audience was less than two hundred people. Fourteen percent of projects have target audiences between two hundred and five hundred people. Combining these two categories, thirty-nine percent have target audiences less than five hundred. In total, forty-five percent of projects indicated that their target audience is greater than one-thousand. This distinction is important because projects with larger target audiences may best utilize randomized social survey methods (including SIPES), while smaller projects could find informal social research methods to be more resource-effective. The SIPES handbook states that for projects with target audiences less than 535, a minimum number of 217 responses are needed to accurately represent the entire population (see Genskow and Prokopy 2008:24 for further information on sample size).
Table 1: How large was your target audience? Response count Percentage Less than 200 people 21 25.0 200-500 12 14.3 500 – 1,000 9 10.7 1,000 – 5,000 16 19.0 5,000 to 10,000 6 7.1 More than 10,000 16 19.0 Don’t know 4 4.8 % respondents who answered the question
84 72.4
% respondents who skipped the question
32 28.0
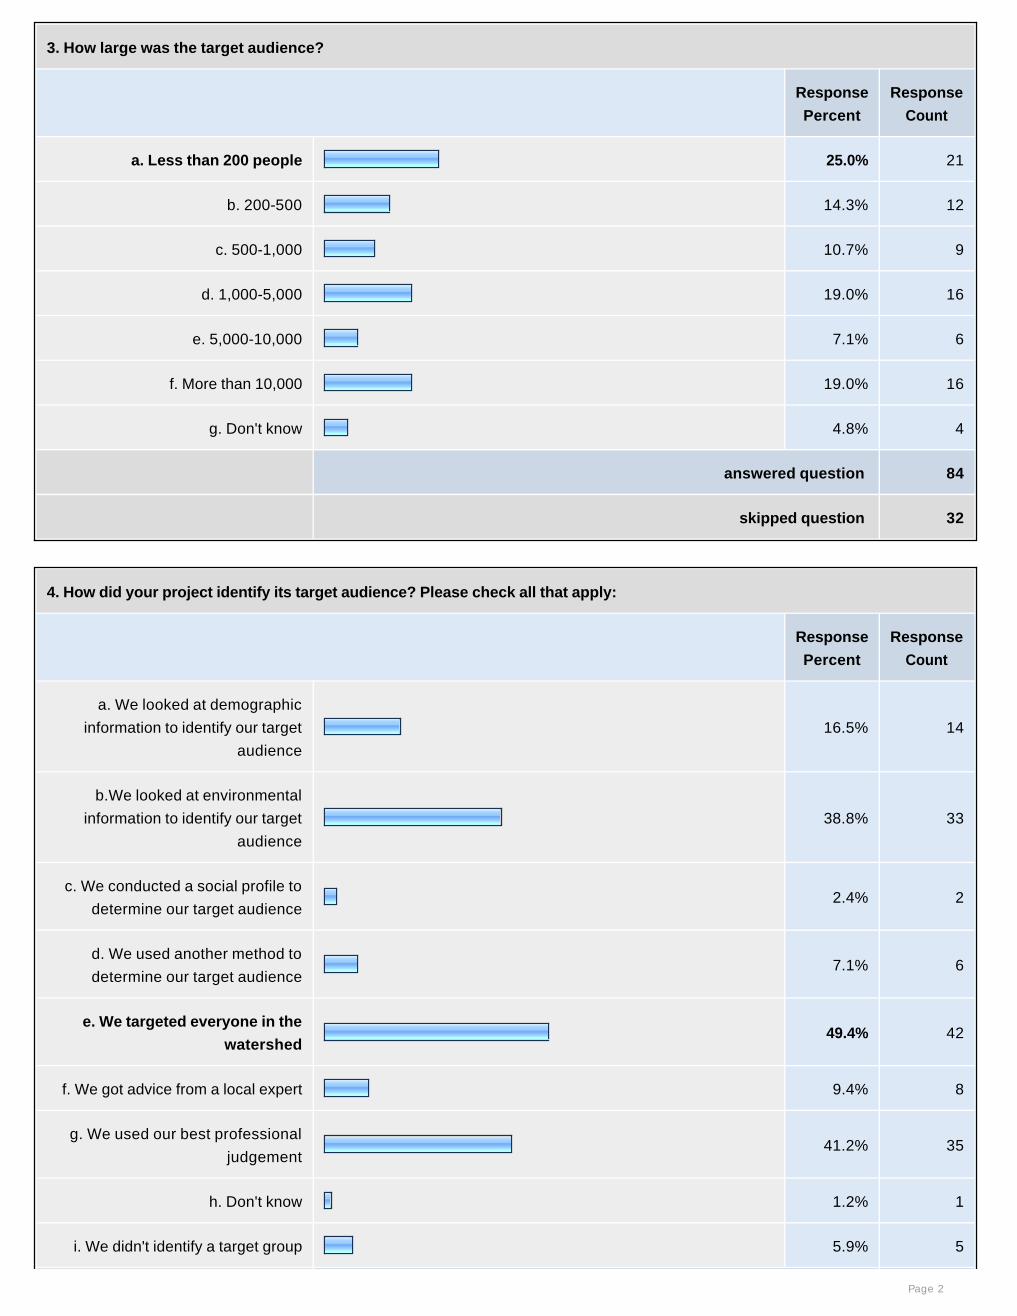
Notably, more than one-quarter of all respondents skipped this question, which may provide insight into a follow-up question that asked “How did your project identify its
4

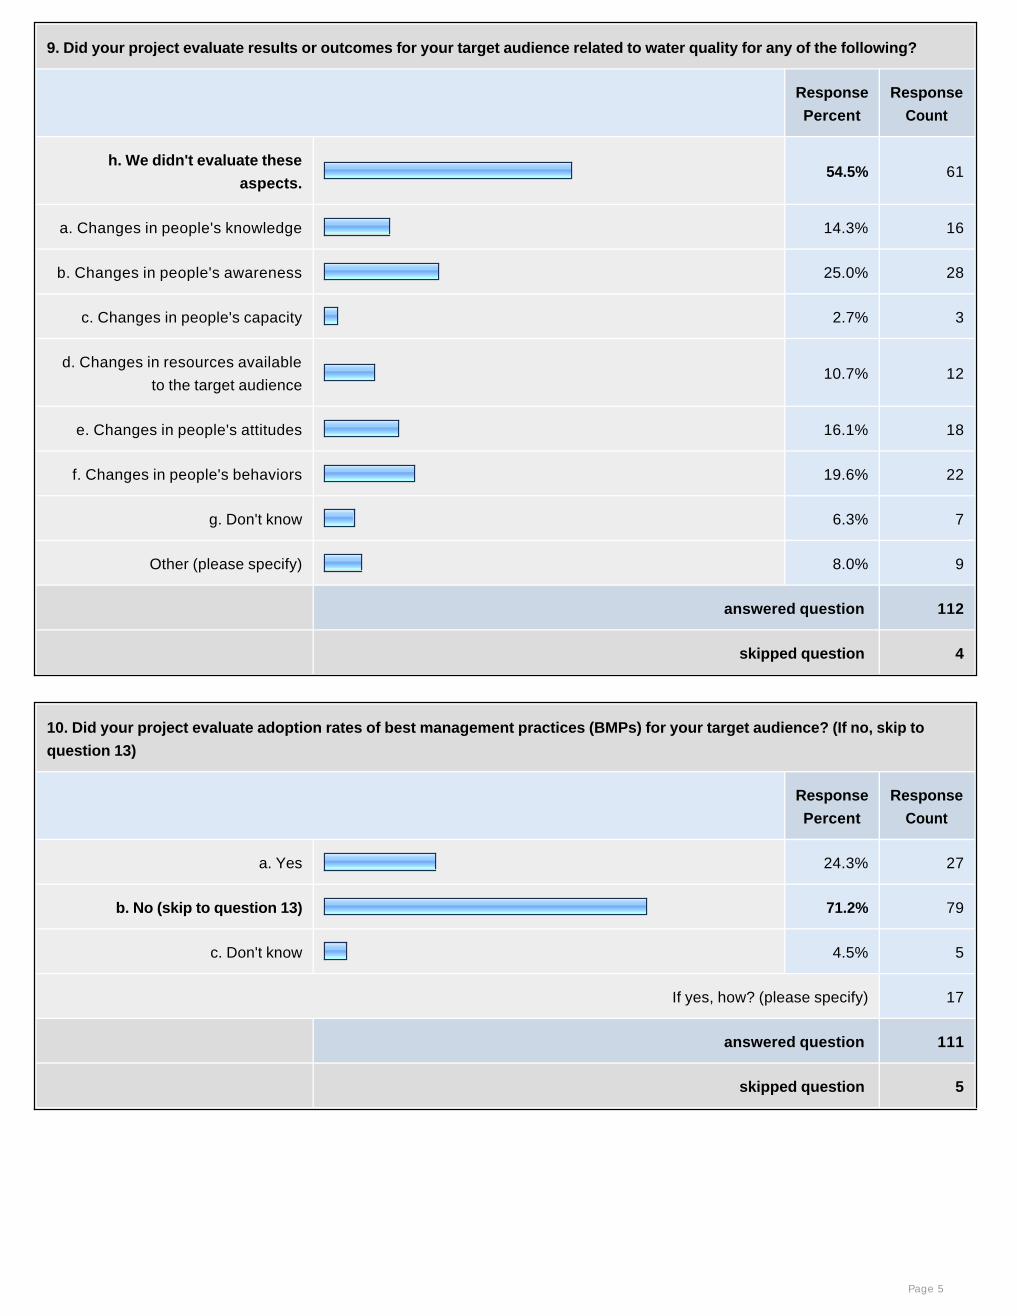
target audience?” Almost half of survey respondents said that they target everyone in the watershed. These responses may suggest that project staff may experience some uncertainty about the size and identity of a potential target audience. Do NPS projects in Minnesota evaluate social dimensions? Seventy-seven percent of respondents say they do not conduct baseline social surveys when implementing their projects. Seventy-one percent do not evaluate the adoption rates of project best management practices. Sixty-two percent do not look at potential constraints to BMP adoption, and fourteen percent are unsure whether they examine such constraints. Eighty-six percent do not develop or use indicators to measure social outcomes. Sixty percent do not measure social impacts (such as changes in target audience awareness or behavior over time), and nineteen percent are unsure whether they measure social impacts. Eighty-three and eighty-eight percent respectively do not examine whether their target audience has cultural or spiritual connections to water resources. Seventy-six percent do not evaluate their projects’ impact on human health and six percent are not sure. Who evaluates? Responsibility for evaluation rests primarily with project staff for seventy-two percent of projects. Fifteen percent of projects also use consultants, and another fifteen percent use volunteers. Project partners are involved in project evaluation for thirty-three percent of respondents. Seventeen percent of projects report that evaluation is not done. What dimensions are evaluated? The survey asked respondents how they identify their target audience. Forty-one percent said they use their “best professional judgment” to determine their target audience. Thirty-nine percent said they use “environmental information” to identify their target audience. While over fifty percent reported that they assess “demographic characteristics” of the project watershed, when asked in a later question whether they looked at demographic information to determine their target audience, fewer than eighteen percent responded positively. Seventy percent of projects evaluate criteria including water quality. Fifty-five percent include information and education in their project evaluations. Thirty-eight percent take into account “environmental changes” in their evaluations, thirty-three percent “physically inspect infrastructure related to projects,” and thirty-four percent evaluate “financial or administrative data.” Fifty-seven percent of respondents say they measure quantitative deliverables related to people and water quality such as number of training workshops conducted or number of rain gardens installed. Forty-five percent said they examine whether BMPs are maintained for periods greater than three years and thirty-eight percent are not sure. Available social assessment tools such as social impact assessment, KAP (knowledge, attitudes and practices) studies, social profiles and social evaluation (e.g. Wilbur 2006, University of Illinois 2001, USEPA 2005, Genskow and Prokopy 2008) are not well- known or used for NPS evaluation in Minnesota.
5

What is the evaluation information used for? Information gained from evaluation is used by thirty-six percent of respondents to prepare reports to donors. Twenty-five percent of projects use evaluation information to design new projects and to develop education and outreach programs. Such information is used by thirty-three percent to assist in watershed planning. Thirty-four percent use the information to assist local partners. Thirty-seven percent state that no evaluation report is done, and eight percent do not know what the information is used for. Social Outcomes Evaluation Fifty percent of respondents do not use any social evaluation methods in their projects. Fifteen percent said they use “participatory evaluation.” Thirteen percent said they use “professional or peer evaluation.” Eleven percent said they use “goal or objectives-based evaluation.” Fifty-five percent of respondents said they do not evaluate changes in people’s knowledge, awareness, capacity, attitudes, behavior, or resource availability in relation to their projects. But in response to posing individual questions regarding such changes, twenty-five percent said they evaluate “changes in peoples’ awareness,” sixteen percent evaluate “changes in people’s attitudes,” twenty percent cited evaluation of “changes in people’s behavior,” and eleven percent cited tracking “changes in people’s resource availability.” When asked how projects evaluate maintenance of BMPs, thirty-eight percent of respondents cited “personal observation,” twenty-three percent said that they “talk to agency personnel,” and thirty-eight percent cited other criteria. Respondents using other methods noted that they monitor the outflows of stormwater ponds for effectiveness; conduct five, ten and fifteen year spot checks; do phone surveys after the winter season to workshop participants; and track the number of on-site sewer systems repaired or replaced in a specific township. A large majority of projects did not consider cultural or spiritual connections of their target audience with water resources (eighty-three and eighty-eight percent respectively). Notably, those who did were project staffers working with bands of Ojibwe, or with Hmong, Somali, Cambodian, and Vietnamese ethnic minorities. While a large majority (eighty-three percent) of projects do not develop any type of project social indicators and sixty percent do not measure social impacts (nineteen percent were unsure), ten percent of projects gather data on some social criteria. For example, for shoreland BMPs, one respondent took into account the number of violation calls and visits versus the number of people who call to see the correct way to manage their shoreland. Another respondent conducts phone interviews with volunteers from a workshop. Another respondent reported that they tally the number of property owners who sought rebates toward on-site sewer system inspections. Constraints to evaluation of social dimensions When describing major constraints to evaluating project social outcomes, forty-eight
6

percent cite not enough time; fifty-five percent do not have enough staff; forty-five percent note that they have insufficient resources; thirty-nine percent cite a lack of knowledge about evaluation; thirty-six percent indicate a lack of familiarity (with evaluation methods); evaluation is not a priority for thirty percent; and knowledge of social outcomes is not considered important for thirty-two percent. Forty-eight percent of staff responsible for evaluation are not trained in monitoring or evaluation. Thirty-eight percent of respondents reported having received training and the remaining fourteen percent were not sure. While forty-six percent of respondents said that staff training met the needs of those who sought it or implemented it, thirty-six percent said they are not sure. In comment boxes, respondents said they did not evaluate social outcomes because they couldn’t obtain evaluation funding. Others noted that collecting useful information requires a variety of methods and that honest evaluation is perceived as negative. Other comments included:
- “We do not get involved in social issues that much. We base our funding on the most bang for the environmental buck;”
- “Social dimensions were not an apparent goal of this project. Stopping sediment transport from a gravel parking lot was;”
- “Boss was not supportive of efforts to evaluate, just wanted to see the work get done;”
- “We do not feel a need to socially impact anybody.” - “We evaluate what the resource needs are and do projects based on scientific
data;” - “Social outcomes are not considered important with respect to nonpoint source
pollution in agricultural areas. This is partly because farmers are all viewed as ‘the same’ and stereotypes apply to everyone. When distinctions are made, farmers are grouped into big or small farmers OR cattle, hog, and chicken farmers OR crop farmers and livestock producers.”
Suggestions for Incorporating Evaluation of Social Outcomes or Developing Social Indicators Respondents added commentary that additional training could assist them in tracking social outcomes, including professional help with surveys, training to assist personnel to interpret and store [social] data. Respondents also identified interest in additional funding and staff time to evaluate social outcomes. Respondents also indicated in comment boxes that “better understanding of the reasons to track social outcomes,” “more time allotted in grants for social evaluation,” and “more staff time to talk to citizens” would assist project coordinators to better track social outcomes. Respondents are interested in assistance to determine which social characteristics to track. One respondent noted that “data is often not available at the scale necessary temporally or spatially to effectively track outcomes. While water may flow across
7

political boundaries, socio-economic and demographic data is generally collected within political boundaries.” Comments that expressed key concerns of the respondents included:
- “I believe social indicators are important, and hope that they will become more accepted as a way of evaluating projects (rather than [only] pounds of phosphorus, tons of soil, etc.).”
- “Honest evaluation of social indicators and outcomes are avoided in some projects because the project managers strive to make their project appear to be progressing, as future funding for staff is tied to meeting project goals that may have been developed with little involvement by local partners or residents. Project managers also tend to refuse to accept political reality in impaired watersheds and choose to continue research to further prove a problem exists. They remain detached from what they perceive as negative land owners and residents instead of [attempting] to understand [target audience] views.”
Discussion and Conclusions
A slight majority of project staff (fifty-five percent) do not evaluate changes in people’s knowledge, awareness, capacity, attitudes, behavior, or resource availability prior to or during project implementation. A significant majority (seventy-one percent) fail to evaluate adoption rates for best management practices or maintenance of BMPs (sixty-percent). It is likely that most project managers cannot determine with certainty the impact of their projects on intended target audiences. Primary constraints to evaluation include lack of staff time, training, and resources. Project staff, however, appear open to learning about methods to assist them with more effective evaluation prior to and following project implementation. It appears that many project staff recognize that monitoring such change is potentially important. Some respondents seemed unclear about the definition of “social indicators” or what is meant by “social outcomes.” Some respondents believe that social information is tangential to project goals, whereas others believe that such information is fundamentally missing from projects. We note that few evaluation frameworks are available for projects with smaller target audiences. Therefore we are working on developing and testing practical evaluation tools for smaller NPS projects, based upon the findings and lessons learned from the survey data and interactions with our pilot project staff. One of these tools is a knowledge, attitudes and practices (KAP) study tool (Eckman forthcoming) which has been tested successfully in Duluth (Eckman and Walker 2008), and will be tested elsewhere in Minnesota in 2009. We conclude that existing evaluation practices in Minnesota are currently not adequate or cost-effective for effective project monitoring and evaluation. We further conclude that there is ample interest, need and opportunity to build the capacities of project staff in evaluating the social dimensions of water quality projects. The SIPES effort and ongoing work at WRC on developing supplemental evaluation tools may contribute to this need.
8

9
Acknowledgements The authors are grateful to all survey respondents for their willingness to share their views and opinions. We thank Jim Anderson, Faye Sleeper, Les Everett and Barb Liukkonen at the WRC for valuable feedback. Several colleagues pre-tested the Survey Monkey questionnaire or otherwise provided comments, including Val Brady (Sea Grant/NRRI), Kimberly Nuckles (MPCA), Doug Snyder (MWMO) and Jenny Winkelman (MWMO). Special thanks to Maria Juergens, Paul Brady and Tracy Thomas White for computer and administrative support. The study was funded by the USEPA and The Minnesota Pollution Control Agency (MPCA). Comments on this paper are welcome and should be sent to: Karlyn Eckman ([email protected]) and Rachel Walker ([email protected])
References Eckman, Karlyn. In process. Literature Review Report: The Potential of Knowledge, Attitudes and Practices (KAP) Methods to Evaluate Water Quality Projects in Minnesota. Saint Paul: Water Resources Center, University of Minnesota. 26 pages. Eckman, Karlyn and Rachel Walker. July 14 2008 Final Draft. Knowledge, Attitudes and Practice (KAP) Survey: SummaryReport for the Duluth Lakeside Stormwater Reduction Project (LSRP). Saint Paul: Water Resources Center, University of Minnesota. 14 pages. Genskow, Ken and Linda Prokopy (eds.). 2008. The Social Indicator Planning and Evaluation System (SIPES) for Nonpoint Source Pollution Management: A Handbook for Projects in USEPA Region 5. Great Lakes Regional Water Program. Publication Number: GLRWP-08-SI01 (169 pages). http://www.wrc.umn.edu/outreach/mnsocindicators/index.html http://www.uwex.edu/ces/regionalwater quality/Flagships/Indicators/html United States Environmental Protection Agency. October 2005. Handbook for Developing Watershed Plans to Restore and Protect our Waters (Draft). Washington: USEPA. University of Illinois. 2001. Step-by-Step Guide to Conducting a Social Profile for Watershed Planning. Urbana-Champaign: University of Illinois. Wilbur, Jack. 2006. Getting your Feet Wet with Social Marketing. Salt Lake City: Utah Department of Agriculture and Food. 133 pages.

MN NPS project evaluation practices
1. Did your NPS project assess the demographic characteristics of the watershed during the planning process?
Response
Percent
Response
Count
Yes 40.2% 45
No 52.7% 59
Don't know 7.1% 8
If yes, how? 24
answered question 112
skipped question 4
2. Did your project have a target audience?
Response
Percent
Response
Count
Yes 71.9% 82
No (skip to question 6) 24.6% 28
Don't know (skip to question 6) 3.5% 4
If yes, how would you describe them (mainly urban residents, suburban residents, rural farmers, etc.) 55
answered question 114
skipped question 2
Page 1
3. How large was the target audience?
Response
Percent
Response
Count
a. Less than 200 people 25.0% 21
b. 200-500 14.3% 12
c. 500-1,000 10.7% 9
d. 1,000-5,000 19.0% 16
e. 5,000-10,000 7.1% 6
f. More than 10,000 19.0% 16
g. Don't know 4.8% 4
answered question 84
skipped question 32
4. How did your project identify its target audience? Please check all that apply:
Response
Percent
Response
Count
a. We looked at demographic
information to identify our target
audience
16.5% 14
b.We looked at environmental
information to identify our target
audience
38.8% 33
c. We conducted a social profile to
determine our target audience2.4% 2
d. We used another method to
determine our target audience7.1% 6
e. We targeted everyone in the
watershed49.4% 42
f. We got advice from a local expert 9.4% 8
g. We used our best professional
judgement41.2% 35
h. Don't know 1.2% 1
i. We didn't identify a target group 5.9% 5
Page 2

answered question 85
skipped question 31
5. Did you conduct a baseline social survey of your target audience?
Response
Percent
Response
Count
Yes 16.7% 14
No 77.4% 65
Don't know 4.8% 4
answered question 84
skipped question 32
6. Did your project use any of the following resources? Please check all that apply:
Response
Percent
Response
Count
a. Step by Step Guide to Conducting
a Social Profile for Watershed
Planning (University of Illinois
Handbook)
0.9% 1
b. Handbook for Developing
Watershed Plans to Restore and
Protect our Waters (USEPA
Handbook)
6.3% 7
c. Community, Culture and the
Environment: Guide to
Understanding a Sense of Place
(USEPA publication)
0.9% 1
d. Getting your Feet Wet with Social
Marketing (by Jack Wilbur)0.9% 1
e. We did not use any of these
resources.80.2% 89
Other (please specify) 17.1% 19
answered question 111
skipped question 5
Page 3

7. Did your project evaluate any of the following? Please check all that apply:
Response
Percent
Response
Count
a. Environmental changes 37.5% 42
b. Water quality 69.6% 78
c. Ecological health 25.0% 28
d. Human health 10.7% 12
e. Physical inspection of
infrastructures related to the project33.0% 37
f. Training activities 17.9% 20
g. Education and information
activities54.5% 61
h. Social and cultural dimensions 13.4% 15
i. Financial or administrative data 33.9% 38
j. No evaluation has been done 13.4% 15
k. Don't know 2.7% 3
Other (please specify) 9.8% 11
answered question 112
skipped question 4
8. Did your project measure quantitative deliverables related to people and water quality? For example, the number of training
workshops conducted, or the number of rain gardens installed?
Response
Percent
Response
Count
Yes (see below) 57.1% 64
No 35.7% 40
Don't know 7.1% 8
If yes, please describe 45
answered question 112
skipped question 4
Page 4
9. Did your project evaluate results or outcomes for your target audience related to water quality for any of the following?
Response
Percent
Response
Count
h. We didn't evaluate these
aspects.54.5% 61
a. Changes in people's knowledge 14.3% 16
b. Changes in people's awareness 25.0% 28
c. Changes in people's capacity 2.7% 3
d. Changes in resources available
to the target audience10.7% 12
e. Changes in people's attitudes 16.1% 18
f. Changes in people's behaviors 19.6% 22
g. Don't know 6.3% 7
Other (please specify) 8.0% 9
answered question 112
skipped question 4
10. Did your project evaluate adoption rates of best management practices (BMPs) for your target audience? (If no, skip to
question 13)
Response
Percent
Response
Count
a. Yes 24.3% 27
b. No (skip to question 13) 71.2% 79
c. Don't know 4.5% 5
If yes, how? (please specify) 17
answered question 111
skipped question 5
Page 5

11. How did your project evaluate whether BMPs were maintained over time for your target audience? Please check all that
apply:
Response
Percent
Response
Count
a. We did a post-project survey of the
target audience7.5% 3
b. We conducted a post-project
focus group of the target audience2.5% 1
c. We talked with involved agency
personnel22.5% 9
d. Personal observation 37.5% 15
e. We didn't evaluate 15.0% 6
f. Don't know 10.0% 4
g. Other (please specify) 37.5% 15
answered question 40
skipped question 76
12. Over what period of time did your project ask if they were still maintaining the practice:
Response
Percent
Response
Count
a. Six months 5.0% 2
b. One year 12.5% 5
c. Two years 0.0% 0
d. Three or more years 45.0% 18
e. Don't know 37.5% 15
answered question 40
skipped question 76
Page 6

13. Did your project evaluate constraints to adoption of BMPs for your target audience?
Response
Percent
Response
Count
a. Yes 24.3% 26
b. No 61.7% 66
C. Don't know 14.0% 15
If yes, how (please specify)? 16
answered question 107
skipped question 9
14. Did your project evaluate impacts on human health in your watershed related to water quality?
Response
Percent
Response
Count
Yes 17.3% 19
No 76.4% 84
Don't know 6.4% 7
If yes, please specify or give an example 12
answered question 110
skipped question 6
15. Did your project evaluate whether your target audience claims cultural connections with water?
Response
Percent
Response
Count
Yes (see below) 8.9% 10
No 83.0% 93
Don't know 8.0% 9
If yes, please specify 9
answered question 112
skipped question 4
Page 7

16. Did your project evaluate whether your audience claims spiritual connections with water?
Response
Percent
Response
Count
Yes (see below) 6.3% 7
No 88.4% 99
Don't know 5.4% 6
If yes, please specify 7
answered question 112
skipped question 4
17. Some social evaluation methods are listed below. Did your project use any of these social evaluation methods? Please
check all that apply.
Response
Percent
Response
Count
a. Utilization-focused evaluation 0.0% 0
b. Goal or objective-based
evaluation10.7% 12
c. Goal-free evaluation 0.0% 0
d. Participatory evaluation 15.2% 17
e. Social impact assessment (SIA) 0.0% 0
f. Peer review or professional review 12.5% 14
g. We used an evaluation method
from another project0.9% 1
h. We designed our own evaluation
method9.8% 11
i. None of the above 50.0% 56
j. Don't know 16.1% 18
Other (please specify) 6.3% 7
answered question 112
skipped question 4
Page 8
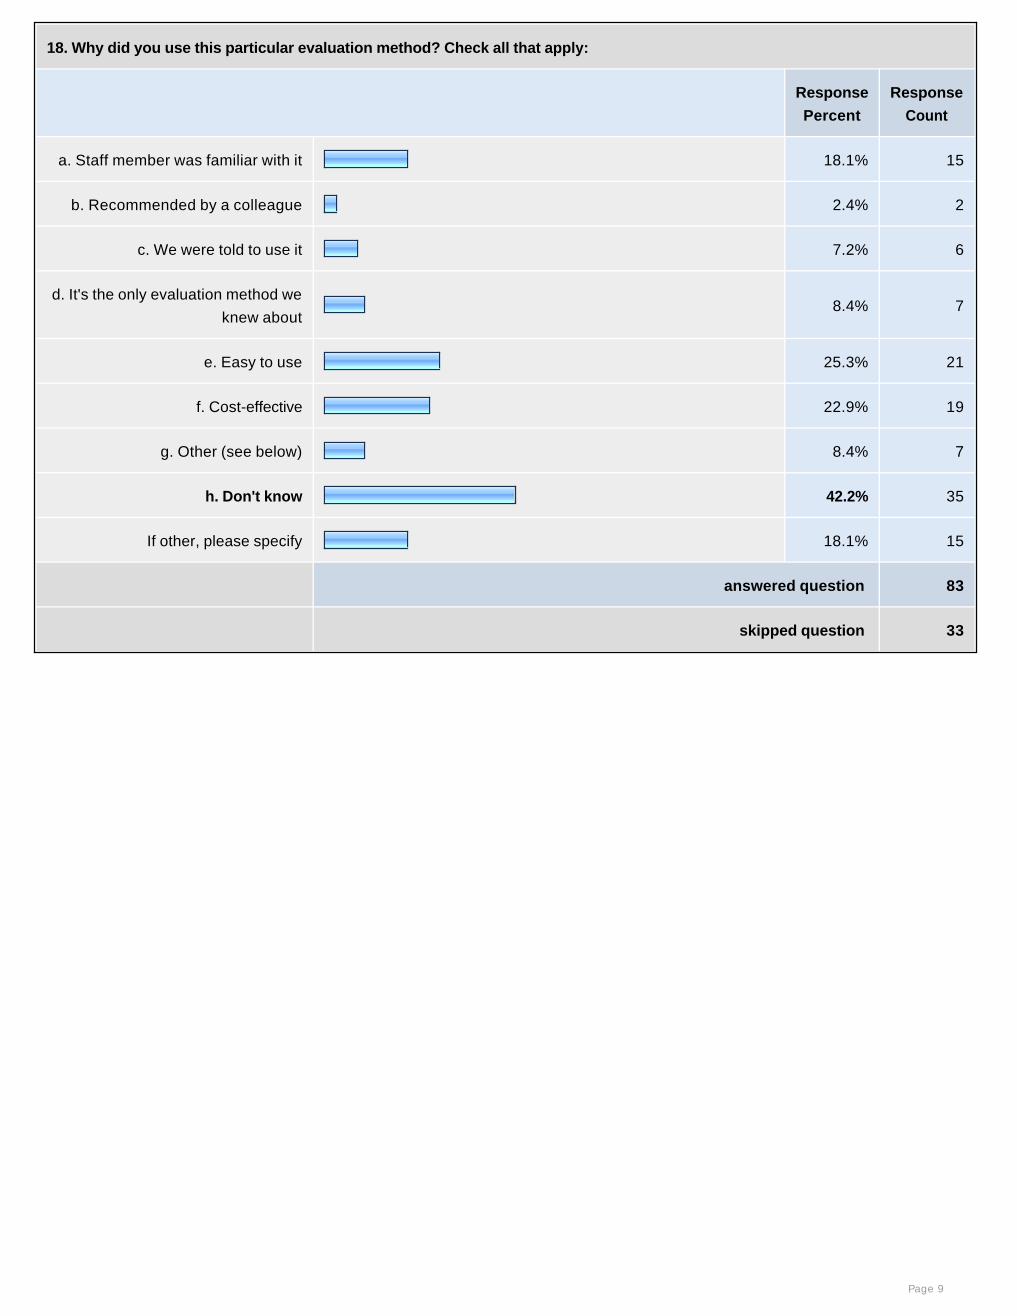
18. Why did you use this particular evaluation method? Check all that apply:
Response
Percent
Response
Count
a. Staff member was familiar with it 18.1% 15
b. Recommended by a colleague 2.4% 2
c. We were told to use it 7.2% 6
d. It's the only evaluation method we
knew about8.4% 7
e. Easy to use 25.3% 21
f. Cost-effective 22.9% 19
g. Other (see below) 8.4% 7
h. Don't know 42.2% 35
If other, please specify 18.1% 15
answered question 83
skipped question 33
Page 9

19. Below are some investigative tools that are used to evaluate the social aspects of environmental projects. Did your project
use any of these tools to evaluate social impacts? Please check all that apply:
Response
Percent
Response
Count
a. Delphi technique 0.0% 0
b. Focus groups 15.6% 17
c. Participant observation 18.3% 20
d. Survey sampling methods 10.1% 11
e. Semi-structured interviews 5.5% 6
f. Market research 0.9% 1
g. Community consultation or
workshop11.0% 12
h. Site visits and observations 32.1% 35
i. Key informant interviews 5.5% 6
j. Case studies 2.8% 3
k. KAP (knowledge, attitudes and
practices) study0.9% 1
l. Other (see below) 0.9% 1
m. None of the above 44.0% 48
n. Don't know 9.2% 10
If other, please specify 4.6% 5
answered question 109
skipped question 7
Page 10

20. Did your project develop and use any indicators to measure social outcomes?
Response
Percent
Response
Count
Yes (see below) 0.9% 1
No 85.5% 94
Don't know 13.6% 15
If yes, which ones did you develop? 4
answered question 110
skipped question 6
21. How did your project measure social impacts (such as a change in awareness or behavior of the target group) over time?
Response
Percent
Response
Count
We periodically repeated the same
measurements2.8% 3
We did a pre-implementation and
post-implementation survey of the
same target audience
8.3% 9
We did not measure change over
time60.2% 65
Don't know 18.5% 20
Other (please specify) 10.2% 11
answered question 108
skipped question 8
Page 11

22. Who is responsible for monitoring and evaluation in your organization? Check all that apply
Response
Percent
Response
Count
Project staff 72.6% 77
Consultants 15.1% 16
Project partners 33.0% 35
Volunteers 15.1% 16
Evaluation is not done 17.0% 18
Others (please specify) 7.5% 8
answered question 106
skipped question 10
23. Have they been trained in monitoring and evaluation?
Response
Percent
Response
Count
Yes 38.0% 41
No (skip to question 25) 48.1% 52
Don't know 13.9% 15
answered question 108
skipped question 8
Page 12

24. Who provided the training in monitoring and evaluation for your project? Check all that apply:
Response
Percent
Response
Count
Project staff 41.0% 25
Consultants 23.0% 14
Project partners 27.9% 17
Volunteers 6.6% 4
Evaluation is not done 8.2% 5
Don't know 18.0% 11
Other (please specify) 16.4% 10
answered question 61
skipped question 55
25. Did the training meet your needs?
Response
Percent
Response
Count
Yes 46.2% 36
No 17.9% 14
Don't know 35.9% 28
If no, why not? (please specify) 5
answered question 78
skipped question 38
Page 13

26. How was the evaluation report used by your project? Please check all that apply:
Response
Percent
Response
Count
To prepare reports to funding
sources (such as MPCA and
USEPA)
36.3% 37
To develop our education and
information activities25.5% 26
To help design new projects or
activities25.5% 26
For watershed planning activities 33.3% 34
To assist local partners (county
boards, DNR, SWCDs, etc.)34.3% 35
No report was done 36.3% 37
Don't know 7.8% 8
Other (please specify) 2.9% 3
answered question 102
skipped question 14
27. Do you think that your organization's evaluation practices adequately capture the social dimensions of your project?
Response
Percent
Response
Count
Yes 18.3% 19
No 41.3% 43
Don't know 40.4% 42
If not, why not? 29
answered question 104
skipped question 12
Page 14
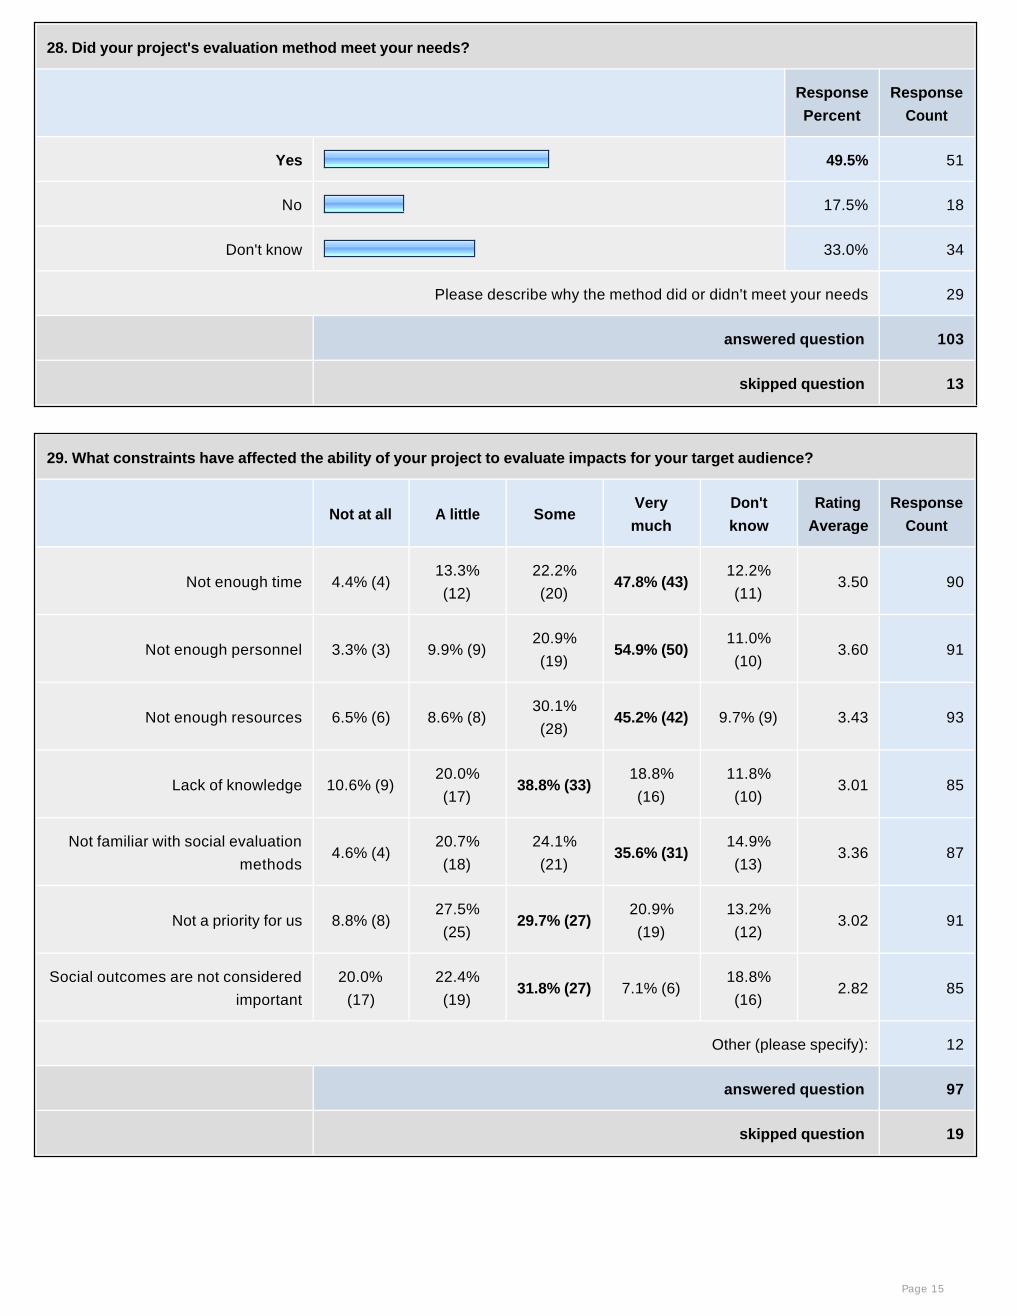
28. Did your project's evaluation method meet your needs?
Response
Percent
Response
Count
Yes 49.5% 51
No 17.5% 18
Don't know 33.0% 34
Please describe why the method did or didn't meet your needs 29
answered question 103
skipped question 13
29. What constraints have affected the ability of your project to evaluate impacts for your target audience?
Not at all A little SomeVery
much
Don't
know
Rating
Average
Response
Count
Not enough time 4.4% (4)13.3%
(12)
22.2%
(20)47.8% (43)
12.2%
(11)3.50 90
Not enough personnel 3.3% (3) 9.9% (9)20.9%
(19)54.9% (50)
11.0%
(10)3.60 91
Not enough resources 6.5% (6) 8.6% (8)30.1%
(28)45.2% (42) 9.7% (9) 3.43 93
Lack of knowledge 10.6% (9)20.0%
(17)38.8% (33)
18.8%
(16)
11.8%
(10)3.01 85
Not familiar with social evaluation
methods4.6% (4)
20.7%
(18)
24.1%
(21)35.6% (31)
14.9%
(13)3.36 87
Not a priority for us 8.8% (8)27.5%
(25)29.7% (27)
20.9%
(19)
13.2%
(12)3.02 91
Social outcomes are not considered
important
20.0%
(17)
22.4%
(19)31.8% (27) 7.1% (6)
18.8%
(16)2.82 85
Other (please specify): 12
answered question 97
skipped question 19
Page 15

30. What would help you to better track social outcomes?
Response
Count
46
answered question 46
skipped question 70
31. Please share any additional comments or suggestions.
Response
Count
19
answered question 19
skipped question 97
32. What is the name of your project?
Response
Count
85
answered question 85
skipped question 31
33. What is the location of your project (Minnesota county or municipality)
Response
Count
84
answered question 84
skipped question 32
Page 16

34. What is the dollar value of your project?
Response
Count
79
answered question 79
skipped question 37
35. What is the funding source(s) for your project?
Response
Count
84
answered question 84
skipped question 32
36. Project type (check all that apply):
Response
Percent
Response
Count
Research 23.9% 22
Planning 30.4% 28
Implementation 72.8% 67
Demonstration 32.6% 30
Education, communication or
information59.8% 55
TMDL 28.3% 26
Other (please specify) 12.0% 11
answered question 92
skipped question 24
Page 17

37. What is the main land use in the project area:
Response
Percent
Response
Count
Agricultural 44.7% 42
Municipal 3.2% 3
Residential 17.0% 16
Mixed use 16.0% 15
Other (please specify) 19.1% 18
answered question 94
skipped question 22
38. Name of the person completing this questionnaire (optional)
Response
Count
56
answered question 56
skipped question 60
39. Title of the person completing this questionnaire (optional):
Response
Count
57
answered question 57
skipped question 59
Page 18