Minnesota Lottery 18-34 Year Old Segmentation Study
83
© 2016 Ipsos 1 18-34 Year Old Segmentation Study PRESENTATION – JUNE 2016 Minnesota Lottery © 2016 Ipsos. All rights reserved. Contains Ipsos' Confidential and Proprietary information and may not be disclosed or reproduced without the prior written consent of Ipsos.
Transcript of Minnesota Lottery 18-34 Year Old Segmentation Study

© 2016 Ipsos 1
18-34 Year Old Segmentation Study PRESENTATION – JUNE 2016
Minnesota Lottery
© 2016 Ipsos. All rights reserved. Contains Ipsos' Confidential and Proprietary information and may not be disclosed or reproduced without the prior written consent of Ipsos.

© 2016 Ipsos 2
Agenda
What is Happening in Minnesota?
What are the Challenges?
What are the Segments?
How and Where Do We Reach Them?
Discuss the Findings

© 2016 Ipsos 3
What is Happening in Minnesota?
Population
2002
5,019,000 2015
5,489,600
9% Spend
in past 12 months
2002
$377,000,000
2015
$546,900,000
45%
51%
Penetration % played any lottery game
in past 12 months
2002 2015
43% 14%
© 2016 Ipsos 4
Source: Minnesota Lottery SCSU Survey
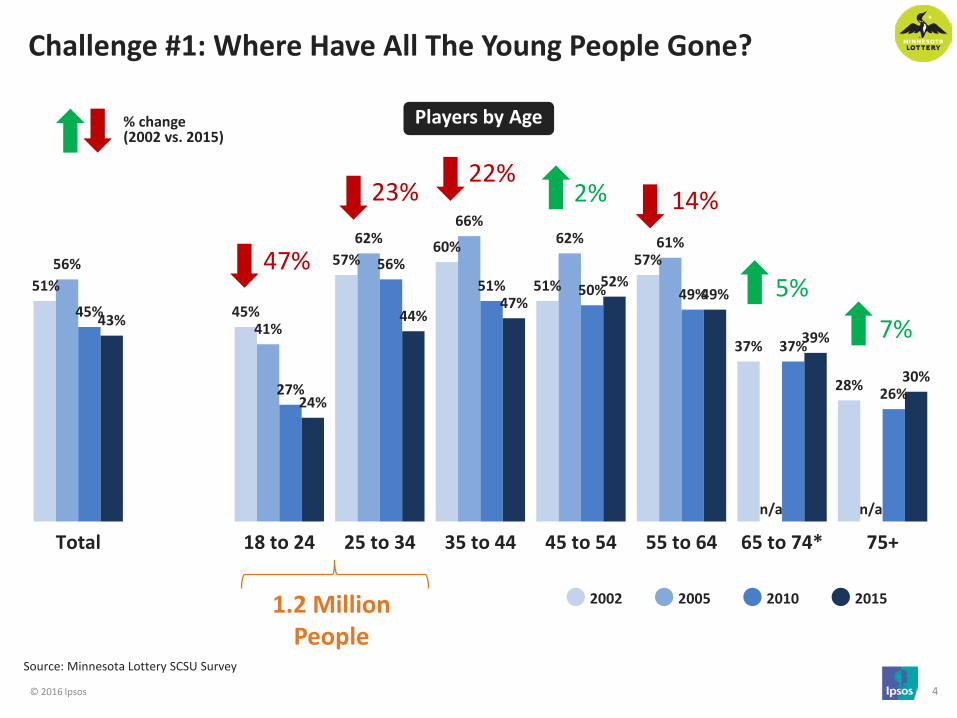
Challenge #1: Where Have All The Young People Gone?
51%
45%
57% 60%
51%
57%
37%
28%
56%
41%
62% 66%
62% 61%
45%
27%
56% 51% 50% 49%
37%
26%
43%
24%
44% 47%
52% 49%
39%
30%
Total 18 to 24 25 to 34 35 to 44 45 to 54 55 to 64 65 to 74* 75+
2002
Players by Age
47%
23% 2% 14%
5%
2005
% change (2002 vs. 2015)
n/a
1.2 Million People
2010 2015
n/a
22%
7%
© 2016 Ipsos 5
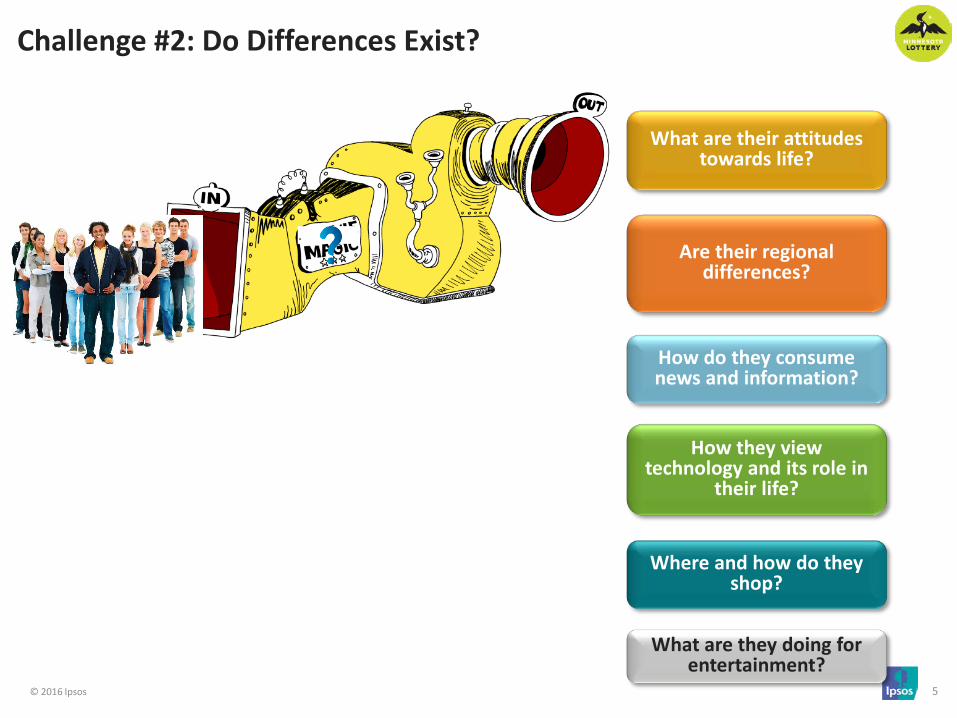
Challenge #2: Do Differences Exist?
Are their regional differences?
What are their attitudes towards life?
How they view technology and its role in
their life?
What are they doing for entertainment?
How do they consume news and information?
Where and how do they shop?
.
© 2016 Ipsos 6
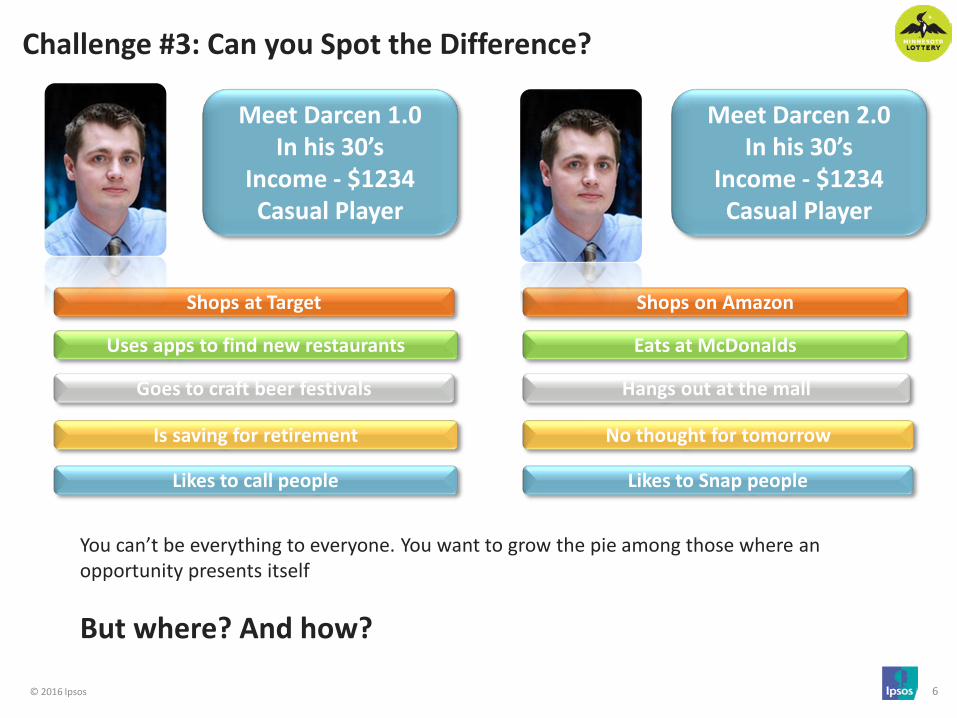
Challenge #3: Can you Spot the Difference?
You can’t be everything to everyone. You want to grow the pie among those where an opportunity presents itself
But where? And how?
Meet Darcen 1.0 In his 30’s
Income - $1234 Casual Player
Meet Darcen 2.0 In his 30’s
Income - $1234 Casual Player
Shops at Target Shops on Amazon
Uses apps to find new restaurants Eats at McDonalds
Goes to craft beer festivals
Is saving for retirement
Likes to call people
Hangs out at the mall
No thought for tomorrow
Likes to Snap people
© 2016 Ipsos 7
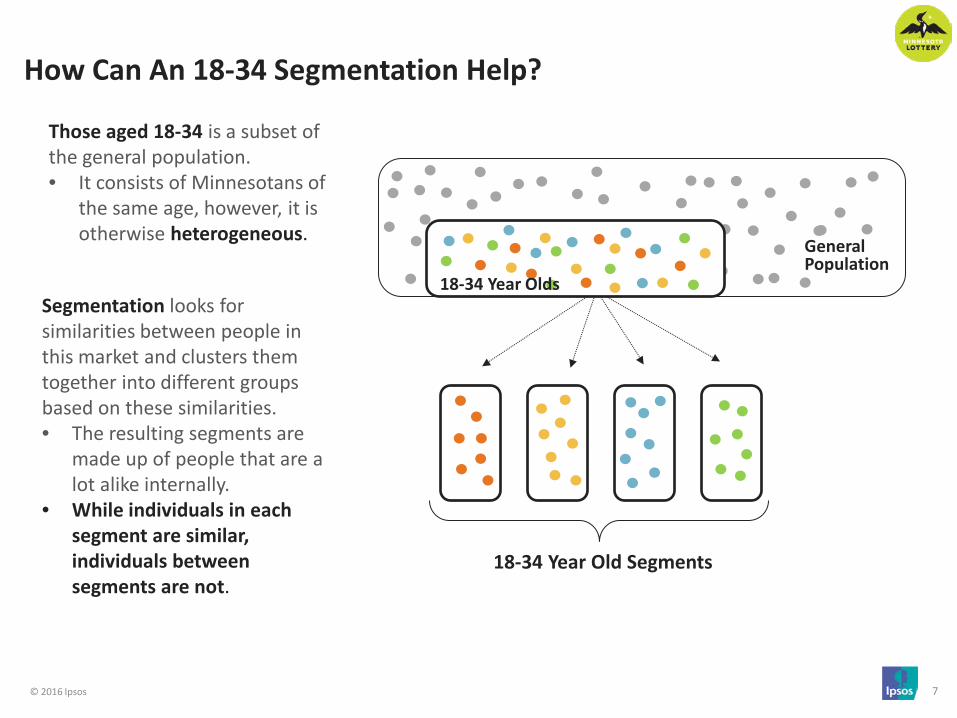
How Can An 18-34 Segmentation Help?
Segmentation looks for similarities between people in this market and clusters them together into different groups based on these similarities. • The resulting segments are
made up of people that are a lot alike internally.
• While individuals in each segment are similar, individuals between segments are not.
Those aged 18-34 is a subset of the general population. • It consists of Minnesotans of
the same age, however, it is otherwise heterogeneous.
18-34 Year Old Segments
18-34 Year Olds
General Population
© 2016 Ipsos 8
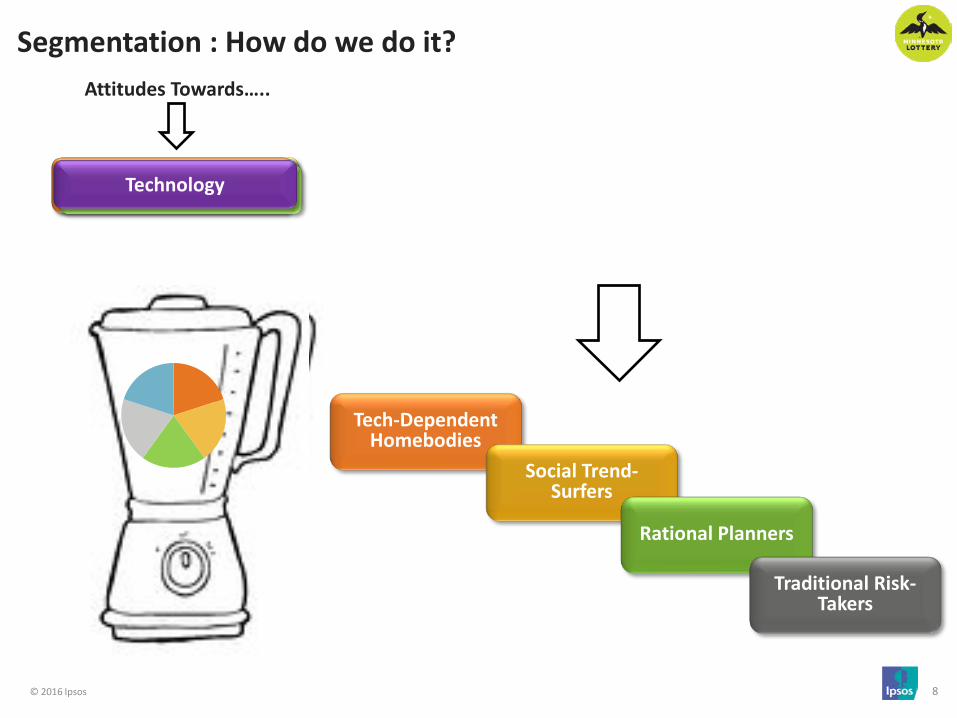
Entertainment Social Media News & Information Shopping Career/Finance Technology
Segmentation : How do we do it?
Tech-Dependent Homebodies
Social Trend-Surfers
Rational Planners
Traditional Risk-Takers
Attitudes Towards…..

© 2016 Ipsos 9
Phase 2: MN 18-34 Online Survey - Quantitative Survey - Segments identified
Phase 3: Qualitative Review and Segment Naming - Qualitative Mini Groups: Deep Dive - Naming the Segments
Phase 1: Qualitative Exploration of 18-34 Attitudes in Minnesota - Mini Groups in Duluth, Minneapolis, Mankato
Phase 4: Consumer Behaviors Study - Understand behaviors of new segments
Addressing the Challenges- The Road Traveled
Phase 5: Presentation and Workshop - Workshopping new segments
© 2016 Ipsos 10
10
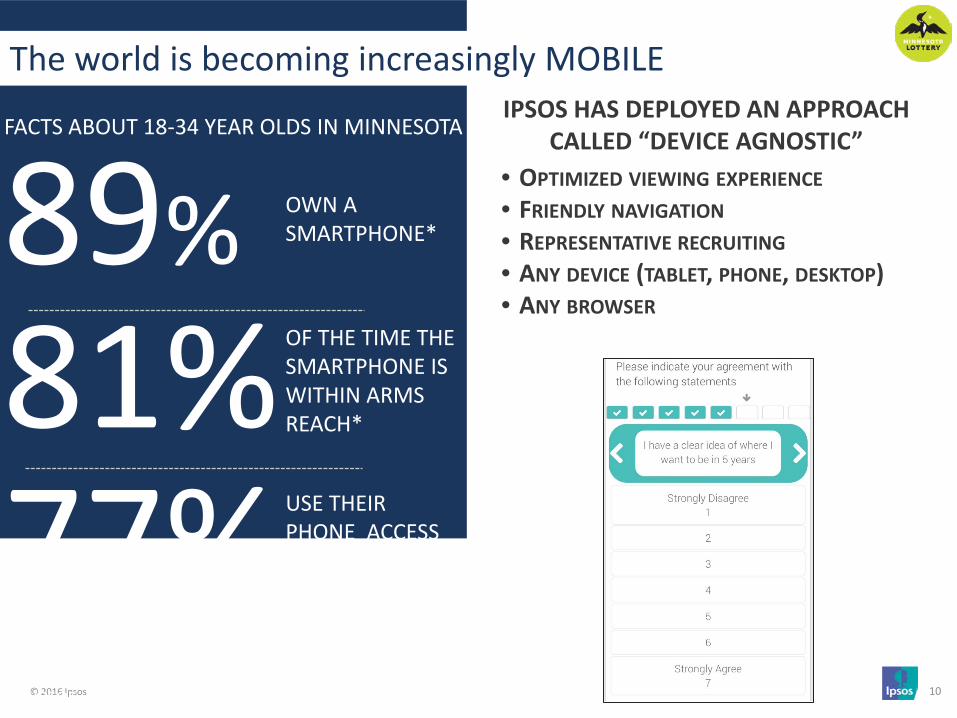
OF THE TIME THE SMARTPHONE IS WITHIN ARMS REACH*
89% 81%
OWN A SMARTPHONE*
• OPTIMIZED VIEWING EXPERIENCE • FRIENDLY NAVIGATION • REPRESENTATIVE RECRUITING • ANY DEVICE (TABLET, PHONE, DESKTOP) • ANY BROWSER
The world is becoming increasingly MOBILE IPSOS HAS DEPLOYED AN APPROACH
CALLED “DEVICE AGNOSTIC”
77% USE THEIR PHONE ACCESS THE INTERNET
EVERY SINGLE DAY*
FACTS ABOUT 18-34 YEAR OLDS IN MINNESOTA
*IPSOS –GAMING WITH MILLENIALS STUDY-2014

© 2016 Ipsos 11
SO WHAT ARE THE CHALLENGES?
18-34 year olds in Minnesota are playing the lottery less than they used to
How do we understand the nuance differences that exist within 18-34 year olds?
How and where do we reach 18-34 year olds in Minnesota?
1
2
3
© 2016 Ipsos 12
THE SEGMENTS
© 2016 Ipsos 13
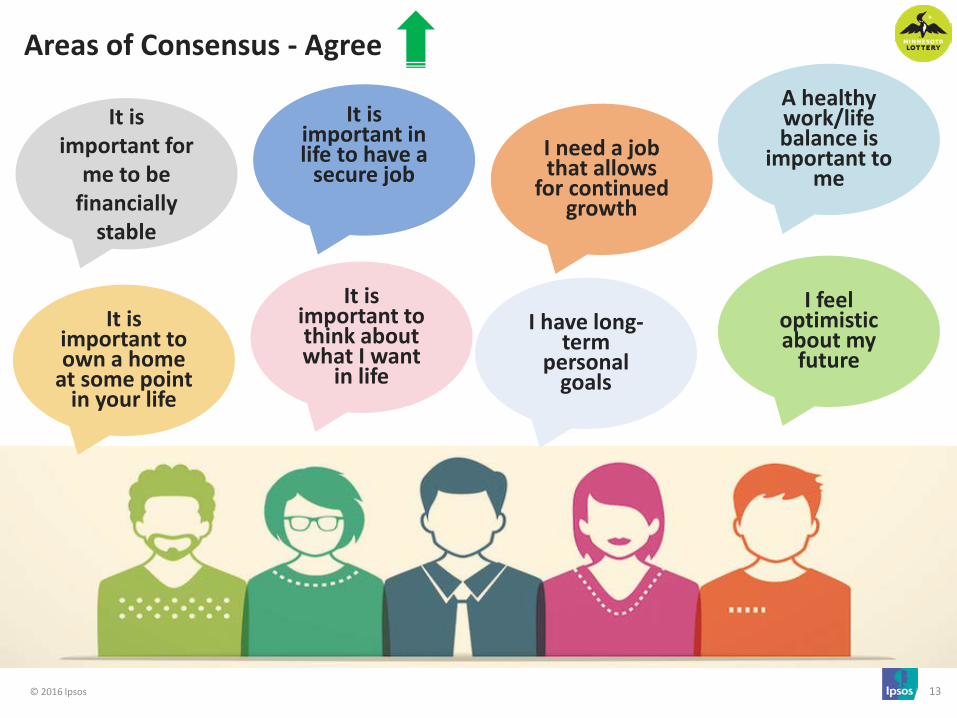
Areas of Consensus - Agree
It is important for
me to be financially
stable
It is important to think about what I want
in life
It is important in life to have a
secure job
It is important to own a home
at some point in your life
A healthy work/life balance is
important to me
I need a job that allows
for continued growth
I feel optimistic about my
future
I have long-term
personal goals
© 2016 Ipsos 14
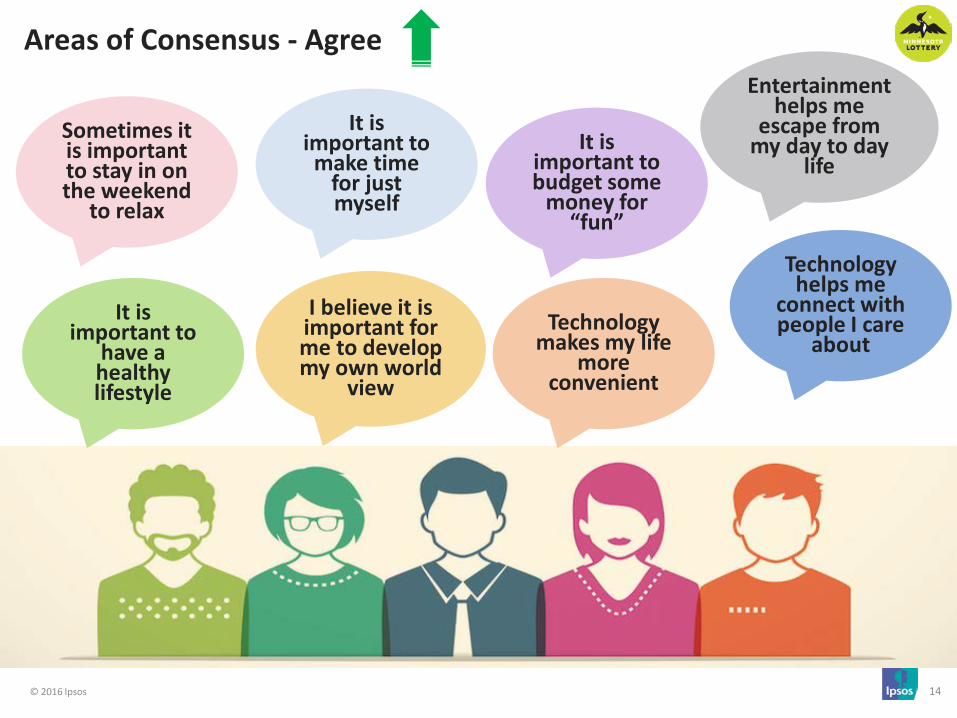
Areas of Consensus - Agree
Sometimes it is important to stay in on the weekend
to relax
It is important to make time
for just myself
Technology helps me
connect with people I care
about
It is important to budget some
money for “fun”
I believe it is important for me to develop my own world
view
Technology makes my life
more convenient
Entertainment helps me
escape from my day to day
life
It is important to
have a healthy lifestyle

© 2016 Ipsos 15
Areas of Consensus - Disagree
I prefer to stay close to home when I
travel
I consider myself morally
opposed to gambling
I enjoy spending
time in large crowds more than in small
groups
I am more likely to
purchase a product if I see
a celebrity I like actually
using it
I would rather have
lots of casual friends than a
few close friends
I never give out my email
address to companies
Celebrity endorsements
influence what
products I buy
I prefer to communicate
with my friends using short videos or pictures
© 2016 Ipsos 16
SEGMENT SUMMARIES
© 2016 Ipsos 17
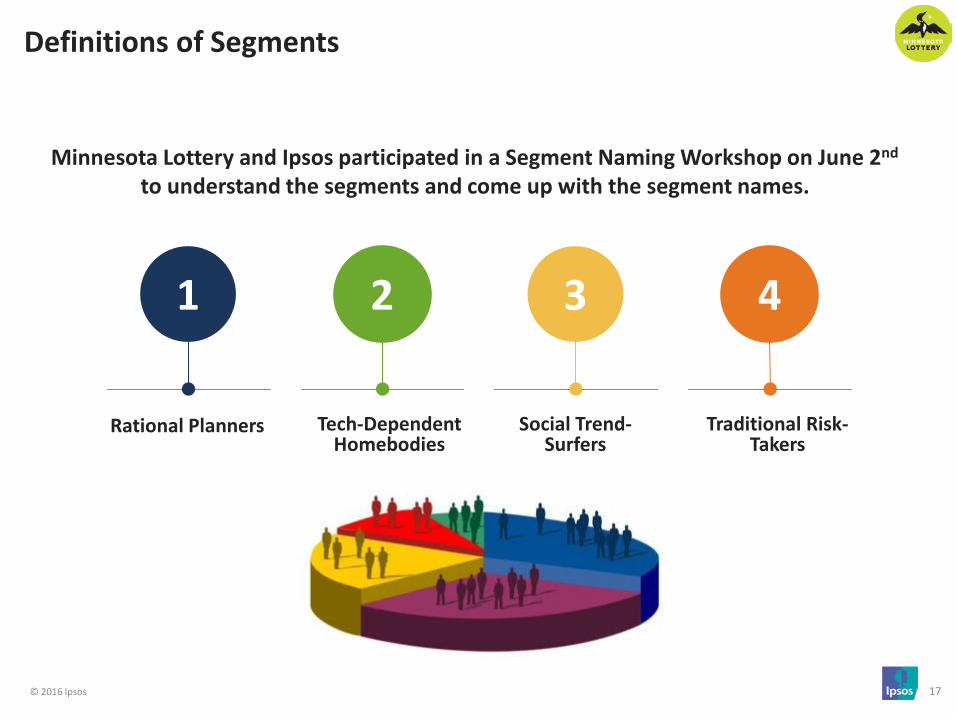
Definitions of Segments
Traditional Risk-Takers
Social Trend-Surfers
Tech-Dependent Homebodies
1 2 3
Minnesota Lottery and Ipsos participated in a Segment Naming Workshop on June 2nd to understand the segments and come up with the segment names.
Rational Planners
4
© 2016 Ipsos 18
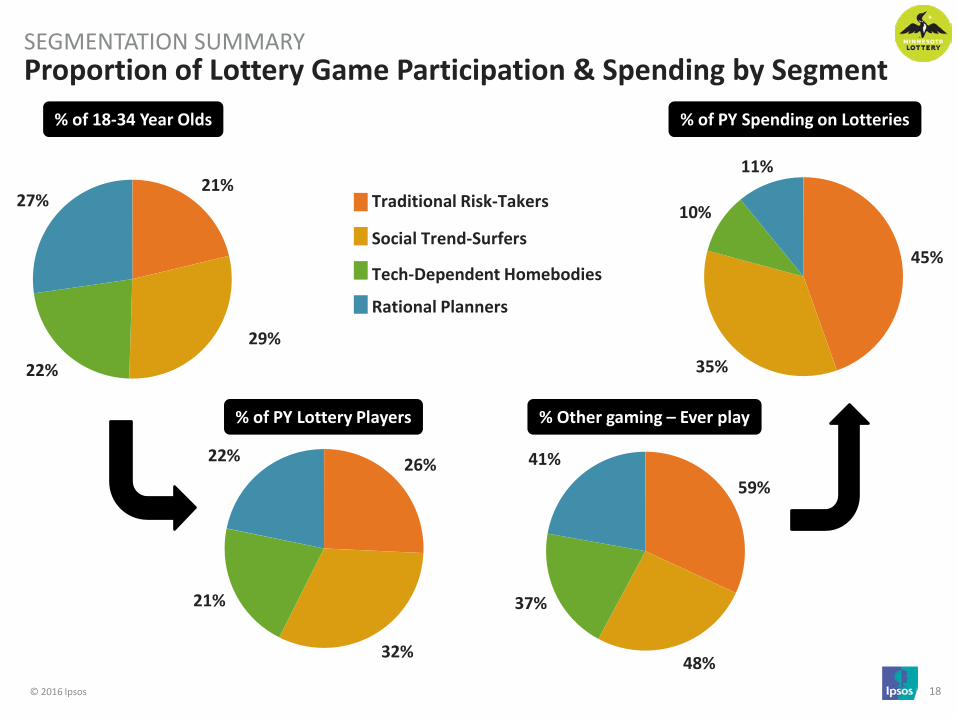
59%
48%
37%
41%
Proportion of Lottery Game Participation & Spending by Segment SEGMENTATION SUMMARY
21%
29%
22%
27%
26%
32%
21%
22%
% of PY Lottery Players
45%
35%
10%
11%
% of PY Spending on Lotteries
Traditional Risk-Takers
Social Trend-Surfers
Tech-Dependent Homebodies
Rational Planners
% of 18-34 Year Olds
% Other gaming – Ever play
© 2016 Ipsos 19 Base: Rational Planners (n=274)
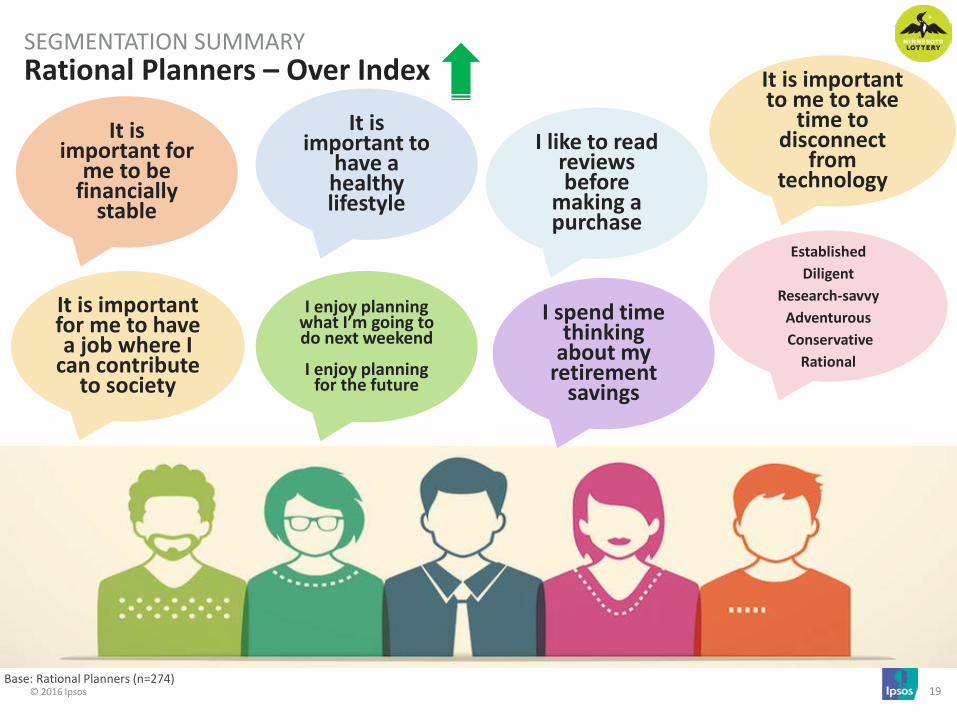
Rational Planners – Over Index SEGMENTATION SUMMARY
It is important for
me to be financially
stable
It is important to
have a healthy lifestyle
Established Diligent
Research-savvy Adventurous Conservative
Rational
I like to read reviews before
making a purchase
I enjoy planning what I’m going to do next weekend
I enjoy planning
for the future
I spend time thinking
about my retirement
savings
It is important to me to take
time to disconnect
from technology
It is important for me to have a job where I
can contribute to society
© 2016 Ipsos 20 Base: Rational Planners (n=274)
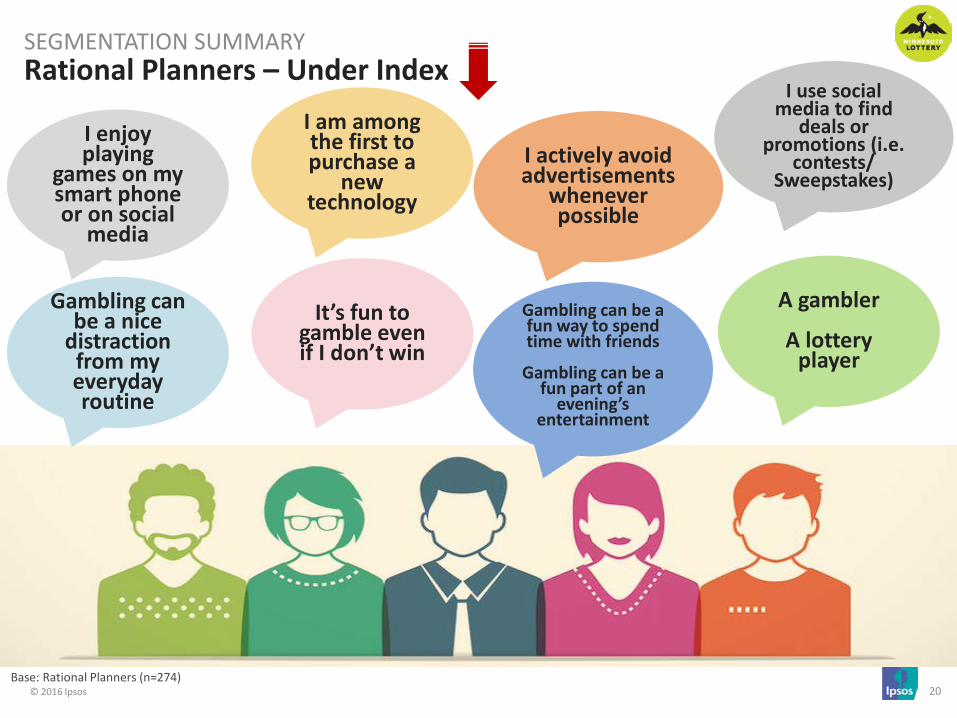
Rational Planners – Under Index SEGMENTATION SUMMARY
I enjoy playing
games on my smart phone or on social
media
It’s fun to gamble even if I don’t win
Gambling can be a fun way to spend time with friends
Gambling can be a
fun part of an evening’s
entertainment
I am among the first to purchase a
new technology
I use social media to find
deals or promotions (i.e.
contests/ Sweepstakes)
I actively avoid advertisements
whenever possible
A gambler
A lottery player
Gambling can be a nice
distraction from my everyday routine
© 2016 Ipsos 21
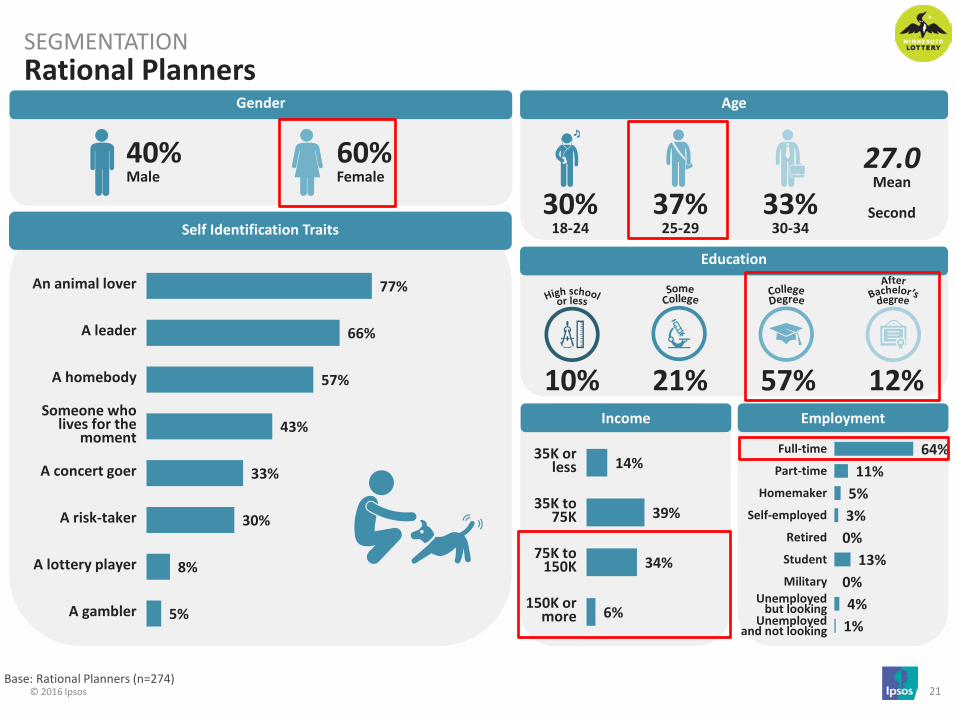
Rational Planners SEGMENTATION
Gender
40% Male
60% Female
Age
Education
33% 30-34
30% 18-24
37% 25-29
27.0 Mean
Second
12% 57% 10% Income Employment
Self Identification Traits
77%
66%
57%
43%
33%
30%
8%
5%
An animal lover
A leader
A homebody
Someone who lives for the
moment
A concert goer
A risk-taker
A lottery player
A gambler
14%
39%
34%
6%
35K or less
35K to 75K
75K to 150K
150K or more
21%
64% 11%
5% 3%
0% 13%
0% 4%
1%
Full-time
Part-time
Homemaker
Self-employed
Retired
Student
Military Unemployed
but looking Unemployed
and not looking
Base: Rational Planners (n=274)

© 2016 Ipsos 22
Rational Planners SEGMENTATION
Past Year/Month Spending (Any Game Mean excl. 0)
17% 34% 18% 30% <[VALUE] Any Game
Participation
I've purchased in the past month
I've purchased in the last 12 months, but not in the past month
I've purchased, but not in the last 12 months
I've heard of this game, but never purchased it
I've never heard of this game
$17.50 $65.50
Past Month Spend
Past Year Spend
Past Year Other Gaming Participation (Top 3 Mentions) Any Game Purchase Frequency
49%
29%
12% 7% 3% 1%
Any Game
Almost every day
Every draw
Weekly
Monthly
Every couple of months
Less than every couple of months
19% Paper
Pulltabs
16% Gambling at casinos
in Minnesota or neighboring states
12% Purchasing
raffle tickets
17%
51%
Past Month
Past Year
Lottery Play
22%
% of Past Year Spend
11%
Past Year Lottery Players
Base: Rational Planners (n=274)

© 2016 Ipsos 23
Tech-Dependent Homebodies – Over Index SEGMENTATION SUMMARY
Technology helps me
connect with people I care
about and keep up with my
friends
Social media is the primary
way I communicate with friends
I would rather do my
shopping online
Homebody Netflix
Introverted Hibernators
When I wake up in the morning, one of the first
things I do is check my social media accounts
I am most likely to get my news
through my phone
I primarily get my news from social
media, like Facebook
I find it easy to hibernate
during winter
I use social media to
follow brands I like or to find deals/ promotions
Base: Tech-Dependent Homebodies (n=223)
© 2016 Ipsos 24 Base: Tech-Dependent Homebodies (n=223)
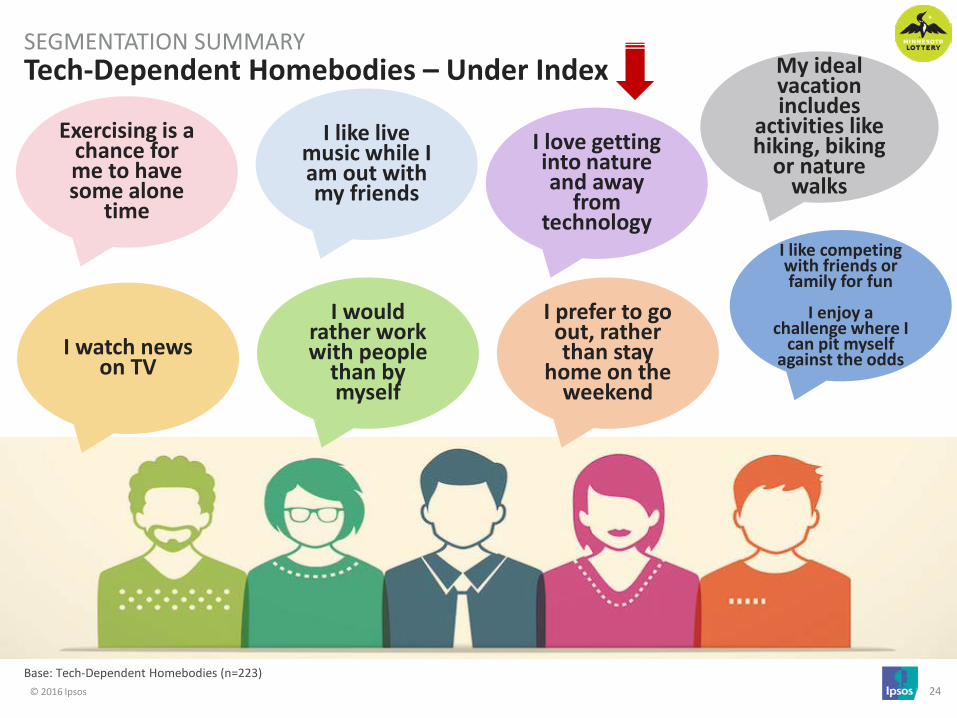
Tech-Dependent Homebodies – Under Index SEGMENTATION SUMMARY
Exercising is a chance for me to have some alone
time
I like live music while I am out with my friends
I like competing with friends or family for fun
I enjoy a
challenge where I can pit myself
against the odds
I love getting into nature and away
from technology
I watch news on TV
I prefer to go out, rather than stay
home on the weekend
My ideal vacation includes
activities like hiking, biking
or nature walks
I would rather work with people
than by myself

© 2016 Ipsos 25
Tech-Dependent Homebodies SEGMENTATION
Gender
29% Male
71% Female
Age
Education
33% 30-34
40% 18-24
26% 25-29
26.3 Mean
Third
6% 40% 28% Income Employment
Self Identification Traits
83%
78%
43%
33%
25%
14%
8%
7%
A homebody
An animal lover
A leader
Someone who lives for the
moment
A concert goer
A risk-taker
A lottery player
A gambler
27%
45%
21%
1%
35K or less
35K to 75K
75K to 150K
150K or more
26%
52% 12% 10%
2% 0%
14% 0%
6% 4%
Full-time
Part-time
Homemaker
Self-employed
Retired
Student
Military Unemployed
but looking Unemployed
and not looking
Base: Tech-Dependent Homebodies (n=223)

© 2016 Ipsos 26
Tech-Dependent Homebodies SEGMENTATION
Past Year/Month Spending (Any Game Mean excl. 0)
20% 41% 16% 23% <[VALUE] Any Game
Participation
I've purchased in the past month
I've purchased in the last 12 months, but not in the past month
I've purchased, but not in the last 12 months
I've heard of this game, but never purchased it
I've never heard of this game
$18.40 $62.80
Past Month Spend
Past Year Spend
Past Year Other Gaming Participation (Top 3 Mentions) Any Game Purchase Frequency
48%
26%
19%
7% 2%
Any Game
Almost every day
Every draw
Weekly
Monthly
Every couple of months
Less than every couple of months
19% Gambling at casinos
in Minnesota or neighboring states
11% Paper
Pulltabs
11% Purchasing
raffle tickets
20%
61%
Past Month
Past Year
Lottery Play
21%
% of Past Year Spend
10%
Past Year Lottery Players
Base: Tech-Dependent Homebodies (n=223)

© 2016 Ipsos 27 Base: Social Trend-Surfers (n=295)
Social Trend-Surfers – Over Index SEGMENTATION SUMMARY
I prefer to go out, rather than stay
home on the weekend
I like online ads that are targeted specifically to me
I am more likely to view ads that
show up in one of my social media
feeds
I enjoy playing
games on social media
Celebrity endorsements influence what products I buy
I am more likely to purchase a product if I see a celebrity I like actually using it
I trust social media
websites with my personal information
I am among the first to purchase
a new technology
Socialites Trendy
Brand /Image conscious
FOMO - want to be able to/ confidence
to contribute to conversation
I enjoy spending
time in large crowds more than in small
groups
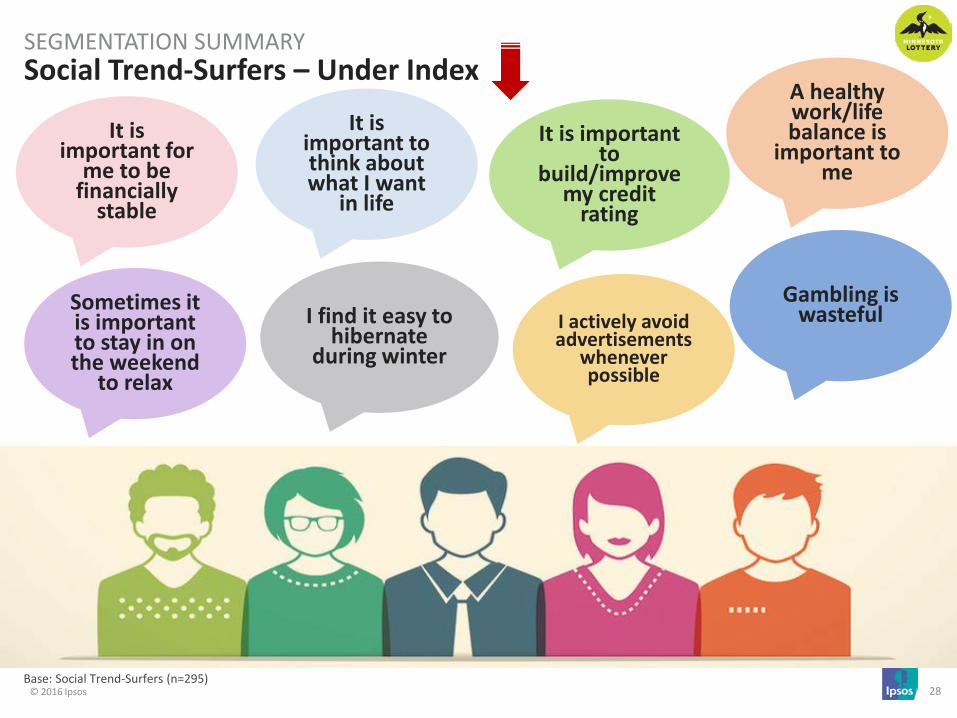
© 2016 Ipsos 28 Base: Social Trend-Surfers (n=295)
Social Trend-Surfers – Under Index SEGMENTATION SUMMARY
It is important for
me to be financially
stable
It is important to think about what I want
in life
Gambling is wasteful Sometimes it
is important to stay in on the weekend
to relax
I actively avoid advertisements
whenever possible
A healthy work/life balance is
important to me
I find it easy to hibernate
during winter
It is important to
build/improve my credit
rating

© 2016 Ipsos 29
Social Trend-Surfers SEGMENTATION
Gender
61% Male
39% Female
Age
Education
24% 30-34
45% 18-24
32% 25-29
25.4 Mean
Youngest
10% 37% 26% Income Employment
Self Identification Traits
69%
57%
53%
42%
41%
38%
22%
15%
An animal lover
A leader
Someone who lives for the
moment
A homebody
A concert goer
A risk-taker
A lottery player
A gambler
33%
32%
25%
4%
35K or less
35K to 75K
75K to 150K
150K or more
27%
50% 19%
4% 3%
<1% 15%
<1% 6%
1%
Full-time
Part-time
Homemaker
Self-employed
Retired
Student
Military Unemployed
but looking Unemployed
and not looking
Base: Social Trend-Surfers (n=295)
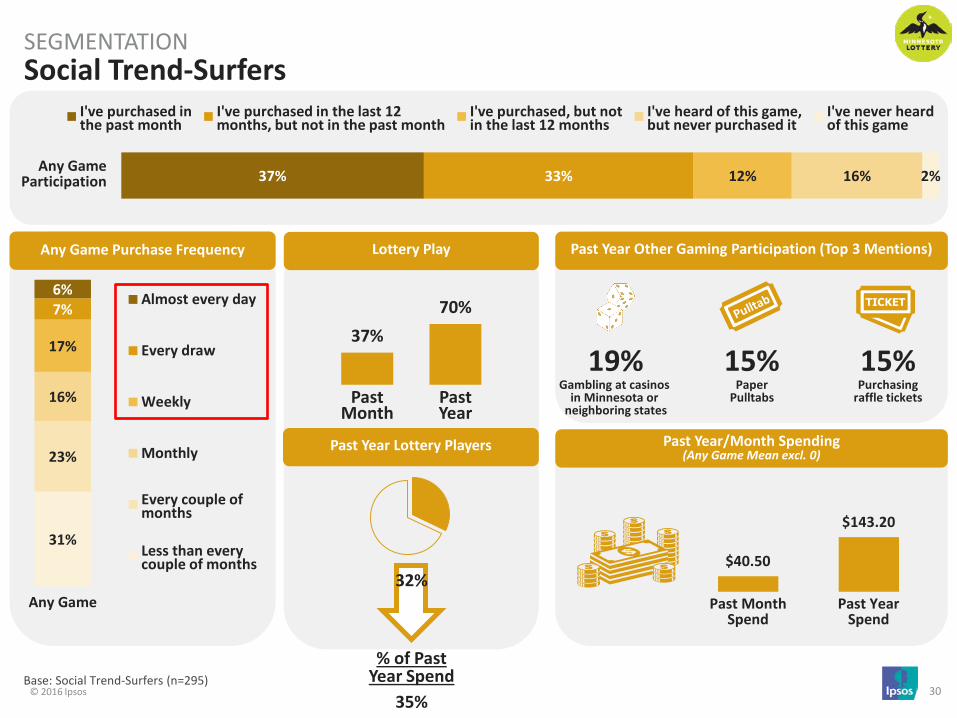
© 2016 Ipsos 30
Social Trend-Surfers SEGMENTATION
Past Year/Month Spending (Any Game Mean excl. 0)
37% 33% 12% 16% 2% Any Game
Participation
I've purchased in the past month
I've purchased in the last 12 months, but not in the past month
I've purchased, but not in the last 12 months
I've heard of this game, but never purchased it
I've never heard of this game
$40.50
$143.20
Past Month Spend
Past Year Spend
Past Year Other Gaming Participation (Top 3 Mentions) Any Game Purchase Frequency
31%
23%
16%
17%
7% 6%
Any Game
Almost every day
Every draw
Weekly
Monthly
Every couple of months
Less than every couple of months
19% Gambling at casinos
in Minnesota or neighboring states
15% Paper
Pulltabs
15% Purchasing
raffle tickets
37% 70%
Past Month
Past Year
Lottery Play
32%
% of Past Year Spend
35%
Past Year Lottery Players
Base: Social Trend-Surfers (n=295)

© 2016 Ipsos 31 Base: Traditional Risk-Takers (n=209)
Traditional Risk-Takers – Over Index SEGMENTATION SUMMARY
Hunting and fishing is a
fun source of recreation –
ideal vacation
Someone who lives for the moment
I prefer to pay with cash over debit or credit
Gambling can be a fun part of an
evening’s entertainment, a fun way to spend
time with friends or a nice distraction from my everyday
routine
I enjoy a challenge
where I can pit myself
against the odds
I actively follow at least one
Minnesota pro sports team
When I pay, I prefer to
interact with a store clerk over a machine
I enjoy the interaction with a clerk at a store
I feel comfortable asking
store staff about promotions and deals
It’s fun to gamble even if I don’t win
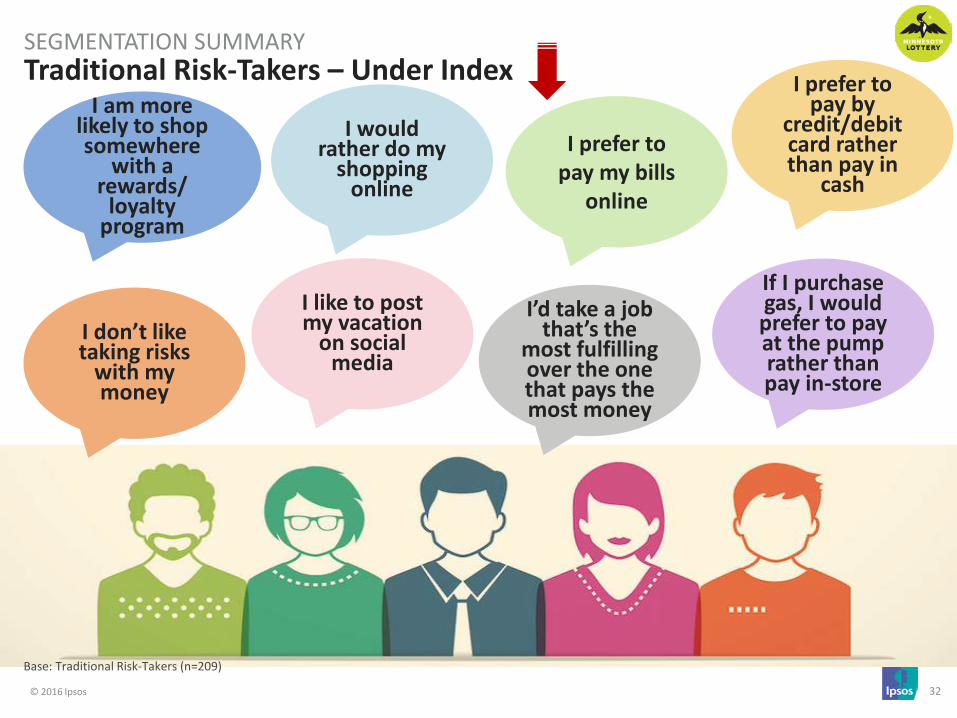
© 2016 Ipsos 32
Traditional Risk-Takers – Under Index SEGMENTATION SUMMARY
I prefer to pay my bills
online
I like to post my vacation
on social media
I am more likely to shop somewhere
with a rewards/
loyalty program
I prefer to pay by
credit/debit card rather than pay in
cash
I’d take a job that’s the
most fulfilling over the one that pays the most money
I don’t like taking risks
with my money
If I purchase gas, I would prefer to pay at the pump rather than pay in-store
I would rather do my
shopping online
Base: Traditional Risk-Takers (n=209)

© 2016 Ipsos 33
Traditional Risk-Takers SEGMENTATION
Gender
71% Male
29% Female
Age
Education
39% 30-34
33% 18-24
28% 25-29
27.1 Mean
Oldest
4% 35% 28% Income Employment
Self Identification Traits
80%
69%
67%
63%
43%
41%
39%
33%
An animal lover
A leader
Someone who lives for the
moment
A risk-taker
A homebody
A lottery player
A gambler
A concert goer
36%
39%
19%
2%
35K or less
35K to 75K
75K to 150K
150K or more
34%
55% 17%
4% 4%
0% 8%
<1% 8%
2%
Full-time
Part-time
Homemaker
Self-employed
Retired
Student
Military Unemployed
but looking Unemployed
and not looking
Base: Traditional Risk-Takers (n=209)

© 2016 Ipsos 34
Traditional Risk-Takers SEGMENTATION
Past Year/Month Spending (Any Game Mean excl. 0)
51% 31% 7% 9% 3% Any Game
Participation
I've purchased in the past month
I've purchased in the last 12 months, but not in the past month
I've purchased, but not in the last 12 months
I've heard of this game, but never purchased it
I've never heard of this game
$48.90
$221.80
Past Month Spend
Past Year Spend
Past Year Other Gaming Participation (Top 3 Mentions) Any Game Purchase Frequency
20%
26%
17%
24%
2% 11%
Any Game
Almost every day
Every draw
Weekly
Monthly
Every couple of months
Less than every couple of months
37% Gambling at casinos
in Minnesota or neighboring states
30% Paper
Pulltabs
18% Purchasing
raffle tickets
51% 82%
Past Month
Past Year
Lottery Play
26%
% of Past Year Spend
45%
Past Year Lottery Players
Base: Traditional Risk-Takers (n=209)

© 2016 Ipsos 35
LOTTERY GAMES OVERVIEW

© 2016 Ipsos 36
Base: All respondents Q26. Which of the following statements best describes your involvement with the following lottery games?
Lottery Participation LOTTERY GAMES OVERVIEW
31%
51% BCD
37% CD
20%
17%
35%
31%
33%
41% AB
34%
66%
82%
70%
61%
51%
Total (n=1,001)
Traditional Risk-Takers [A]
(n=209)
Social Trend- Surfers [B]
(n=295)
Tech-Dependent Homebodies [C]
(n=223)
Rational Planners [D]
(n=274)
Played past month Played past year, not past month
ABCD Significantly higher than other subgroup.
Adjusted Mean $ Last Year excl. 0
(among PY players of any game)
$130.40
$221.80 BCD
$143.20 CD
$62.80
$65.50
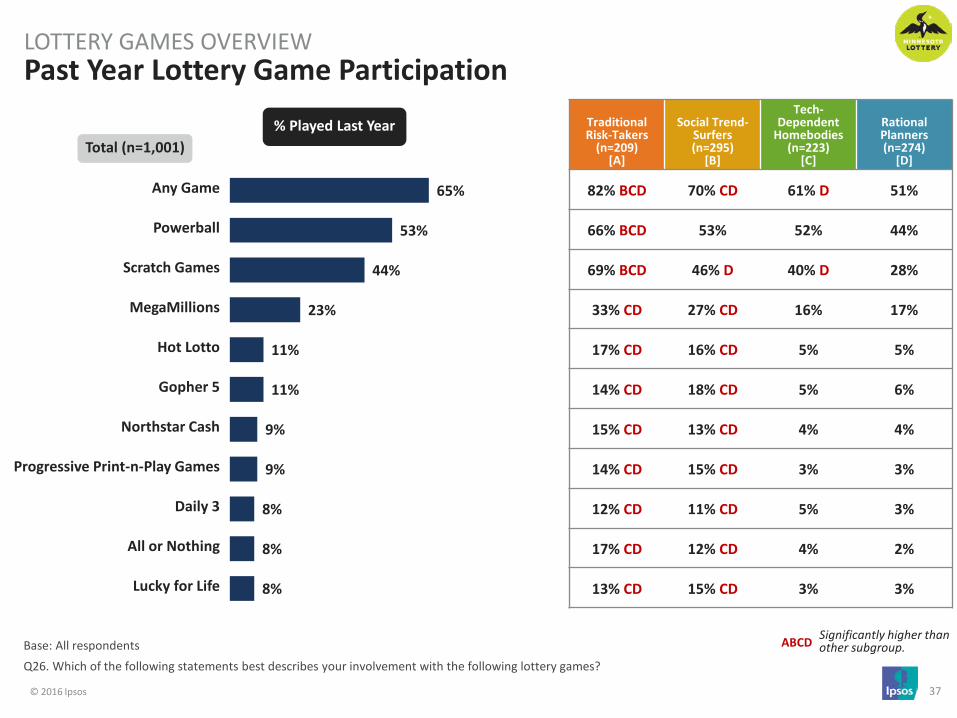
© 2016 Ipsos 37
65%
53%
44%
23%
11%
11%
9%
9%
8%
8%
8%
Any Game
Powerball
Scratch Games
MegaMillions
Hot Lotto
Gopher 5
Northstar Cash
Progressive Print-n-Play Games
Daily 3
All or Nothing
Lucky for Life
Base: All respondents Q26. Which of the following statements best describes your involvement with the following lottery games?
Past Year Lottery Game Participation LOTTERY GAMES OVERVIEW
Traditional Risk-Takers
(n=209) [A]
Social Trend-Surfers (n=295)
[B]
Tech-Dependent
Homebodies (n=223)
[C]
Rational Planners (n=274)
[D]
82% BCD 70% CD 61% D 51%
66% BCD 53% 52% 44%
69% BCD 46% D 40% D 28%
33% CD 27% CD 16% 17%
17% CD 16% CD 5% 5%
14% CD 18% CD 5% 6%
15% CD 13% CD 4% 4%
14% CD 15% CD 3% 3%
12% CD 11% CD 5% 3%
17% CD 12% CD 4% 2%
13% CD 15% CD 3% 3%
ABCD Significantly higher than other subgroup.
% Played Last Year Total (n=1,001)

© 2016 Ipsos 38
How Do We Reach
Them?
Social Media
Television
Radio /Music
Shopping
Entertainment / Events

© 2016 Ipsos 39
SOCIAL MEDIA USAGE

© 2016 Ipsos 40
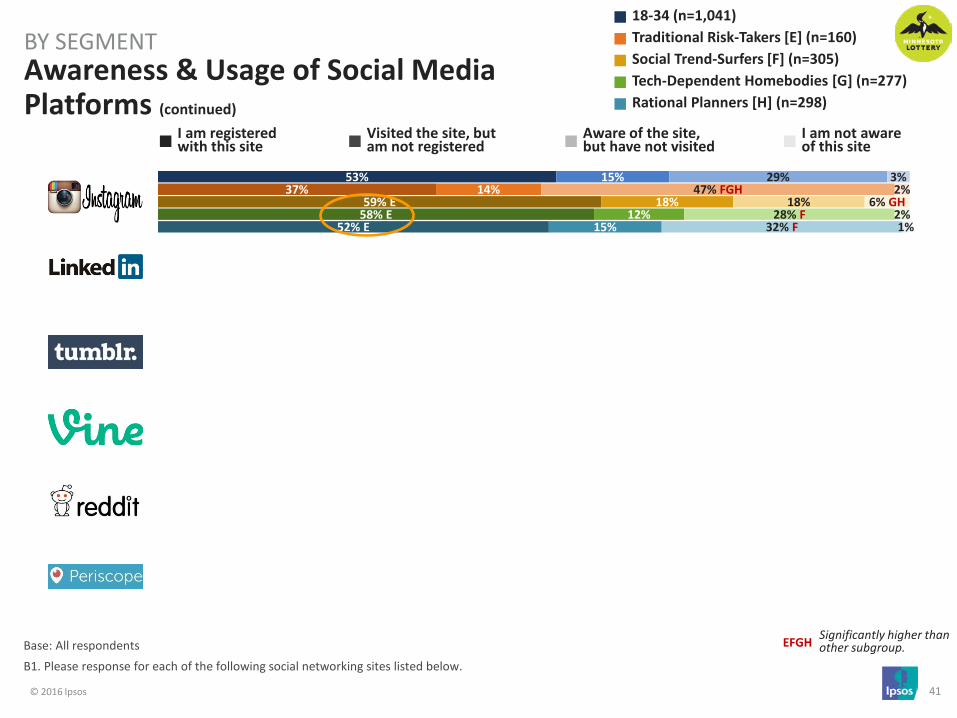
Base: All respondents B1. Please response for each of the following social networking sites listed below.
Awareness & Usage of Social Media Platforms
BY SEGMENT
91%
73%
58%
57%
56%
54%
86%
74% H
48%
53%
44%
39%
88%
78% H
63% E
61%
47%
63% EH
96% EFH
76% H
60% E
58%
68% EFH
61% EH
91%
63%
58%
53%
59% EF
47%
EFGH Significantly higher than other subgroup.
I am registered with this site
Visited the site, but am not registered
Aware of the site, but have not visited
I am not aware of this site
18-34 (n=1,041) Traditional Risk-Takers [E] (n=160) Social Trend-Surfers [F] (n=305) Tech-Dependent Homebodies [G] (n=277) Rational Planners [H] (n=298)
4%
24%
8%
19%
19%
20%
5% G
24%
8%
21%
20%
21%
6% G
17%
12% H
19%
22%
17%
1%
23%
8%
17%
16%
17%
4% G
34% EFG
5%
19%
18%
23%
5%
3%
31%
23%
23%
26%
8% G
2%
42% FG
23%
33% FGH
40% FGH
5%
4%
21%
20%
24% G
18%
2%
2%
30% F
23%
15%
21%
5%
2%
36% F
26%
23% G
30% FG
3%
2%
3%
1%
2%
3%
2%
1%
1%
1%
4%
1%
8% EGH
2%
2%
2%
1%
1%
2%
3%
1%
© 2016 Ipsos 41
Base: All respondents B1. Please response for each of the following social networking sites listed below.
Awareness & Usage of Social Media Platforms (continued)
BY SEGMENT
53%
45%
19%
17%
11%
5%
37%
35%
11%
13%
9%
4%
59% E
35%
23% EH
27% EGH
10%
5%
58% E
50% EF
26% EH
15%
14%
8% H
52% E
57% EF
12%
10%
9%
3%
I am registered with this site
Visited the site, but am not registered
Aware of the site, but have not visited
I am not aware of this site
EFGH Significantly higher than other subgroup.
18-34 (n=1,041) Traditional Risk-Takers [E] (n=160) Social Trend-Surfers [F] (n=305) Tech-Dependent Homebodies [G] (n=277) Rational Planners [H] (n=298)
15%
16%
25%
23%
30%
9%
14%
14%
27%
26%
30%
6%
18%
23% EGH
24%
26%
32%
14% EGH
12%
13%
20%
21%
29%
6%
15%
12%
27%
21%
28%
7%
29%
30%
47%
44%
44%
36%
47% FGH
37%
51% F
44% F
42%
29%
18%
28%
37%
31%
36%
36%
28% F
29%
47% F
46% F
46% F
37%
32% F
29%
53% F
54% F
50% F
39% E
3%
9%
10%
17%
16%
50%
2%
15% GH
11%
18%
19% G
62% FGH
6% GH
14% GH
15% GH
17%
21% GH
44%
2%
8% H
7%
18%
12%
50%
1%
2%
7%
16%
13%
51%

© 2016 Ipsos 42
64%
17%
17%
17%
16%
61%
16%
11%
19%
13%
56%
26%
23%
22%
26%
76%
18%
21%
19%
15%
62%
8%
9%
9%
10%
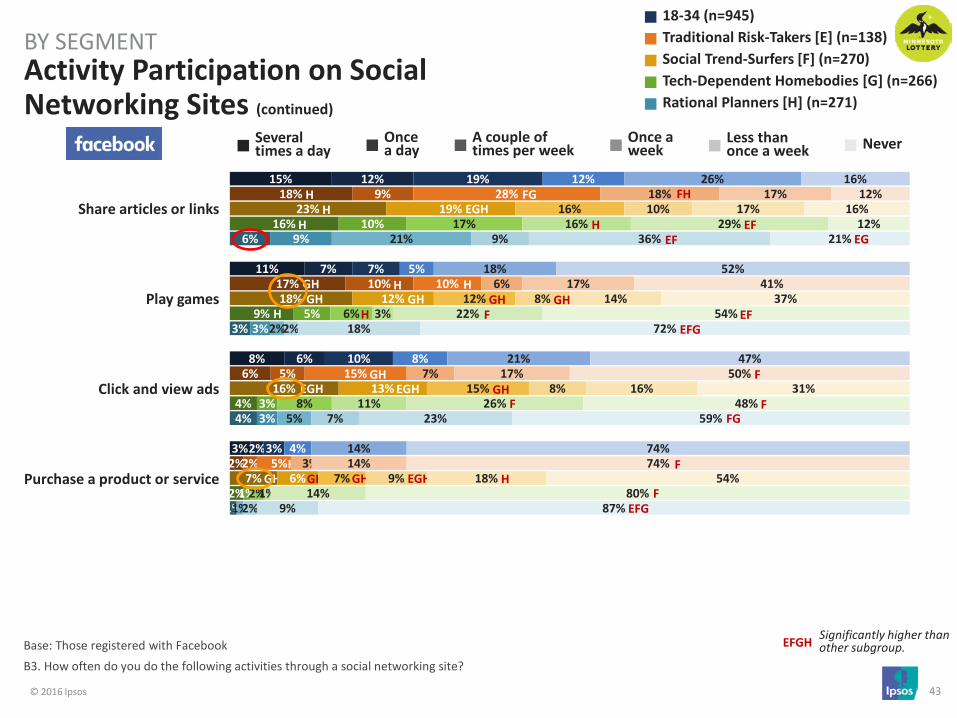
Base: Those registered with Facebook B3. How often do you do the following activities through a social networking site?
Activity Participation on Social Networking Sites (continued)
BY SEGMENT
Browsing my feed to see what's new
Share pictures or videos
Follow brands, celebrities or companies I'm interested in
learning about
Searching the site for specific news
Participate in a group chat or message
EFGH Significantly higher than other subgroup.
Several times a day
Once a day
A couple of times per week
Once a week
Less than once a week Never
18-34 (n=945) Traditional Risk-Takers [E] (n=138) Social Trend-Surfers [F] (n=270) Tech-Dependent Homebodies [G] (n=266) Rational Planners [H] (n=271)
H EGH
H
EGH H
GH GH
EFH
H H
H
18%
11%
12%
15%
12%
16%
15%
9%
12%
10%
20%
16%
17%
18%
16%
15%
7%
11%
15%
11%
18%
7%
9%
14%
8%
H
GH GH
GH
7%
23%
17%
17%
17%
7%
30%
14%
17%
17%
10%
22%
20%
23%
17%
4%
26%
19%
15%
14%
8%
17%
15%
14%
19%
H
H
G
GH
4%
13%
10%
10%
12%
6%
9%
11%
14%
14%
5%
11%
11%
9%
12%
1%
13%
8%
10%
14%
4%
19%
12%
11%
9%
EF
G G
G
4%
28%
22%
18%
27%
4%
23%
24%
16%
23%
4%
16%
17%
13%
15%
3%
29%
21%
20%
30%
5%
43%
26%
21%
38%
F EFG
EF F
F
F F
4%
8%
22%
23%
17%
6%
8%
31%
23%
22%
6%
10%
13%
16%
15%
2%
7%
21%
21%
16%
3%
7%
29%
31%
17%
FG
FG F
G G
FG
© 2016 Ipsos 43
15%
11%
8%
3%
18%
17%
6%
2%
23%
18%
16%
7%
16%
9%
4%
2%
6%
3%
4%
1%
Base: Those registered with Facebook B3. How often do you do the following activities through a social networking site?
Activity Participation on Social Networking Sites (continued)
BY SEGMENT
Several times a day
Once a day
A couple of times per week
Once a week
Less than once a week Never
Share articles or links
Play games
Click and view ads
Purchase a product or service
EFGH Significantly higher than other subgroup.
EGH
GH
GH GH
H
H H
H
18-34 (n=945) Traditional Risk-Takers [E] (n=138) Social Trend-Surfers [F] (n=270) Tech-Dependent Homebodies [G] (n=266) Rational Planners [H] (n=271)
12%
7%
6%
2%
9%
10%
5%
2%
19%
12%
13%
6%
10%
5%
3%
1%
9%
3%
3%
EGH
GH H
H GH
EGH
19%
7%
10%
3%
28%
10%
15%
5%
16%
12%
15%
7%
17%
6%
8%
2%
21%
2%
5%
1%
GH GH
GH H
H GH
H
FG 12%
5%
8%
4%
18%
6%
7%
3%
10%
8%
8%
9%
16%
3%
11%
1%
9%
2%
7%
2%
EGH
GH
FH
H
26%
18%
21%
14%
17%
17%
17%
14%
17%
14%
16%
18%
29%
22%
26%
14%
36%
18%
23%
9%
F
H
F
EF EF
16%
52%
47%
74%
12%
41%
50%
74%
16%
37%
31%
54%
12%
54%
48%
80%
21%
72%
59%
87%
F
F FG
F
F EFG
EF EFG
EG
© 2016 Ipsos 44
19%
11%
11%
6%
6%
19%
15%
13%
6%
4%
24%
15%
15%
9%
12%
21%
11%
11%
5%
4%
10%
4%
6%
1%
1%
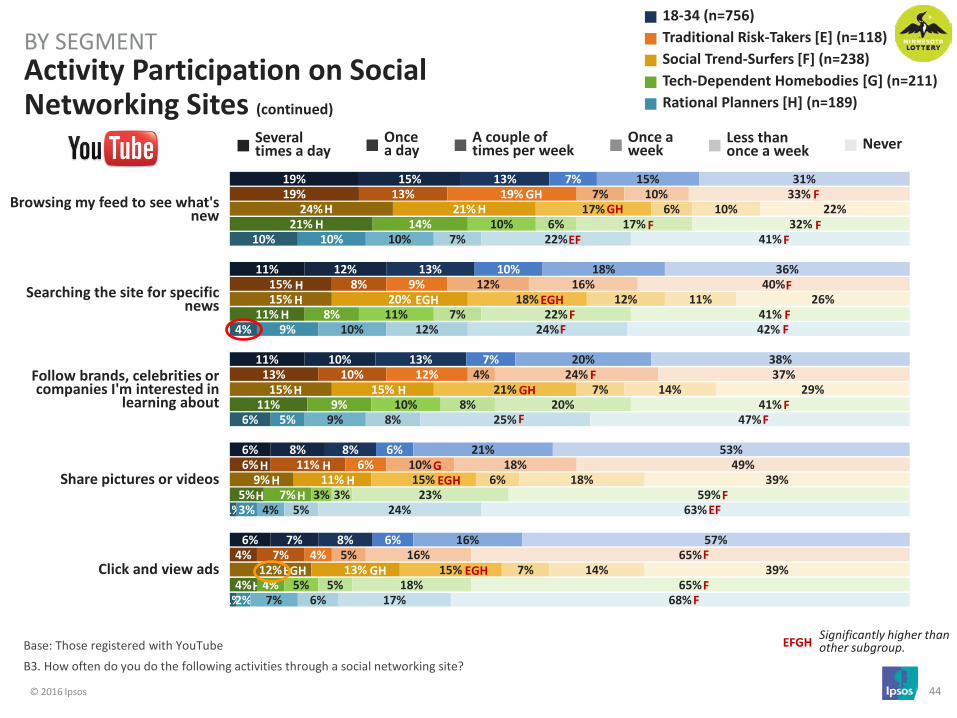
Base: Those registered with YouTube B3. How often do you do the following activities through a social networking site?
Activity Participation on Social Networking Sites (continued)
BY SEGMENT
Browsing my feed to see what's new
Searching the site for specific news
Follow brands, celebrities or companies I'm interested in
learning about
Share pictures or videos
Click and view ads
18-34 (n=756) Traditional Risk-Takers [E] (n=118) Social Trend-Surfers [F] (n=238) Tech-Dependent Homebodies [G] (n=211) Rational Planners [H] (n=189)
EFGH Significantly higher than other subgroup.
Several times a day
Once a day
A couple of times per week
Once a week
Less than once a week Never
H H
H
EGH H
H
H H
H H
H
15%
12%
10%
8%
7%
13%
8%
10%
11%
7%
21%
20%
15%
11%
13%
14%
8%
9%
7%
4%
10%
9%
5%
3%
2%
H H
H
GH
H
H
EGH
13%
13%
13%
8%
8%
19%
9%
12%
6%
4%
17%
18%
21%
15%
15%
10%
11%
10%
3%
5%
10%
10%
9%
4%
7%
EGH
EGH
GH
GH GH
EGH
7%
10%
7%
6%
6%
7%
12%
4%
10%
5%
6%
12%
7%
6%
7%
6%
7%
8%
3%
5%
7%
12%
8%
5%
6%
G
15%
18%
20%
21%
16%
10%
16%
24%
18%
16%
10%
11%
14%
18%
14%
17%
22%
20%
23%
18%
22%
24%
25%
24%
17%
F
F
F EF
F F
31%
36%
38%
53%
57%
33%
40%
37%
49%
65%
22%
26%
29%
39%
39%
32%
41%
41%
59%
65%
41%
42%
47%
63%
68%
F EF
F
F F
F F
F
F F
F
F F
© 2016 Ipsos 45
5%
4%
4%
3%
5%
7%
7%
4%
8%
6%
8%
6%
4%
2%
3%
1%
1%
1%
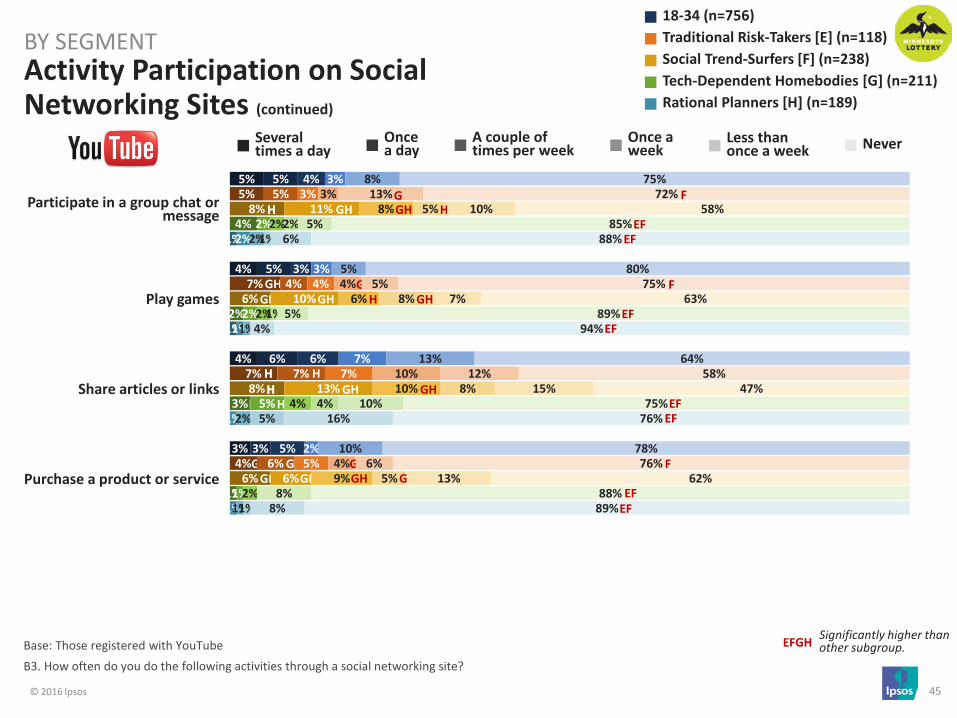
Base: Those registered with YouTube B3. How often do you do the following activities through a social networking site?
Activity Participation on Social Networking Sites (continued)
BY SEGMENT
Several times a day
Once a day
A couple of times per week
Once a week
Less than once a week Never
Participate in a group chat or message
Play games
Share articles or links
Purchase a product or service
EFGH Significantly higher than other subgroup.
18-34 (n=756) Traditional Risk-Takers [E] (n=118) Social Trend-Surfers [F] (n=238) Tech-Dependent Homebodies [G] (n=211) Rational Planners [H] (n=189)
GH GH
GH GH
H H
H
H
5%
5%
6%
3%
5%
4%
7%
6%
11%
10%
13%
6%
2%
2%
5%
1%
2%
1%
1%
1%
H H
H
GH GH
GH
GH H
H
GH
4%
3%
6%
5%
3%
4%
7%
5%
8%
6%
10%
9%
2%
2%
4%
2%
2%
1%
2%
1%
GH
H
GH
GH
3%
3%
7%
2%
3%
4%
10%
4%
5%
8%
8%
5%
2%
1%
4%
1%
5%
1%
GH GH
GH GH
H
8%
5%
13%
10%
13%
5%
12%
6%
10%
7%
15%
13%
5%
5%
10%
8%
6%
4%
16%
8%
G 75%
80%
64%
78%
72%
75%
58%
76%
58%
63%
47%
62%
85%
89%
75%
88%
88%
94%
76%
89%
F
EF EF
F
EF EF
EF EF
F
EF EF

© 2016 Ipsos 46
39%
33%
15%
12%
7%
29%
19%
10%
7%
8%
46%
40%
21%
18%
14%
38%
31%
12%
13%
5%
37%
33%
12%
6%
2%
Base: Those registered with Snapchat * Small base size, interpret with caution. B3. How often do you do the following activities through a social networking site?
Activity Participation on Social Networking Sites (continued)
BY SEGMENT
Browsing my feed to see what's new
Share pictures or videos
Participate in a group chat or message
Follow brands, celebrities or companies I'm interested in
learning about
Searching the site for specific news
18-34 (n=607) Traditional Risk-Takers [E] (n=76)* Social Trend-Surfers [F] (n=192) Tech-Dependent Homebodies [G] (n=166) Rational Planners [H] (n=172)
EFGH Significantly higher than other subgroup.
Several times a day
Once a day
A couple of times per week
Once a week
Less than once a week Never
E
E
EGH
EH H
E
H GH
20%
14%
9%
14%
7%
27%
12%
7%
5%
6%
20%
18%
13%
26%
11%
17%
15%
4%
10%
3%
18%
10%
11%
9%
6%
G
G
EGH
G
11%
19%
10%
11%
6%
18%
32%
13%
15%
12%
10%
15%
14%
12%
9%
12%
14%
10%
9%
3%
10%
22%
6%
9%
3%
G
FG
H
GH GH
4%
8%
6%
5%
5%
5%
15%
9%
5%
3%
5%
9%
5%
6%
9%
5%
5%
6%
7%
3%
3%
8%
7%
3%
2%
G
GH
8%
14%
13%
12%
8%
9%
15%
12%
11%
9%
5%
9%
9%
10%
8%
15%
19%
17%
15%
8%
6%
13%
13%
12%
7%
F
F
FH
17%
13%
47%
47%
68%
13%
9%
50%
57%
63%
13%
10%
39%
29%
50%
14%
17%
51%
47%
78%
26%
14%
51%
62%
80%
F F
F
F FG
EFG
EF EF

© 2016 Ipsos 47
5%
5%
5%
2%
8%
7%
3%
4%
8%
10%
10%
4%
4%
4%
3%
1%
1%
2%
2%
Base: Those registered with Snapchat * Small base size, interpret with caution. B3. How often do you do the following activities through a social networking site?
Activity Participation on Social Networking Sites (continued)
BY SEGMENT
Several times a day
Once a day
A couple of times per week
Once a week
Less than once a week Never
Play games
Share articles or links
Click and view ads
Purchase a product or service
EFGH Significantly higher than other subgroup.
18-34 (n=607) Traditional Risk-Takers [E] (n=76)* Social Trend-Surfers [F] (n=192) Tech-Dependent Homebodies [G] (n=166) Rational Planners [H] (n=172)
GH
3%
4%
4%
3%
2%
1%
3%
8%
9%
10%
8%
1%
2%
1%
1%
1%
3%
2%
1%
GH
EGH
GH
EGH
3%
5%
5%
4%
3%
11%
3%
5%
6%
8%
10%
8%
2%
2%
2%
1%
1%
3%
2%
2%
GH
GH
3%
5%
4%
2%
3%
7%
5%
1%
5%
6%
6%
6%
1%
2%
2%
1%
3%
4%
2%
1%
GH
G
4%
8%
8%
6%
6%
3%
5%
9%
4%
10%
8%
7%
5%
10%
9%
4%
2%
7%
7%
6%
E
82%
72%
75%
83%
77%
71%
81%
81%
69%
57%
56%
68%
88%
80%
83%
93%
93%
81%
85%
91%
F
F F
F
EF EF
EF EF
F
F F
© 2016 Ipsos 48
20%
9%
8%
8%
8%
17%
6%
9%
7%
7%
26%
16% GH
13% H
15% GH
10%
17%
7%
8%
6%
7%
19%
5%
4%
6%
7%
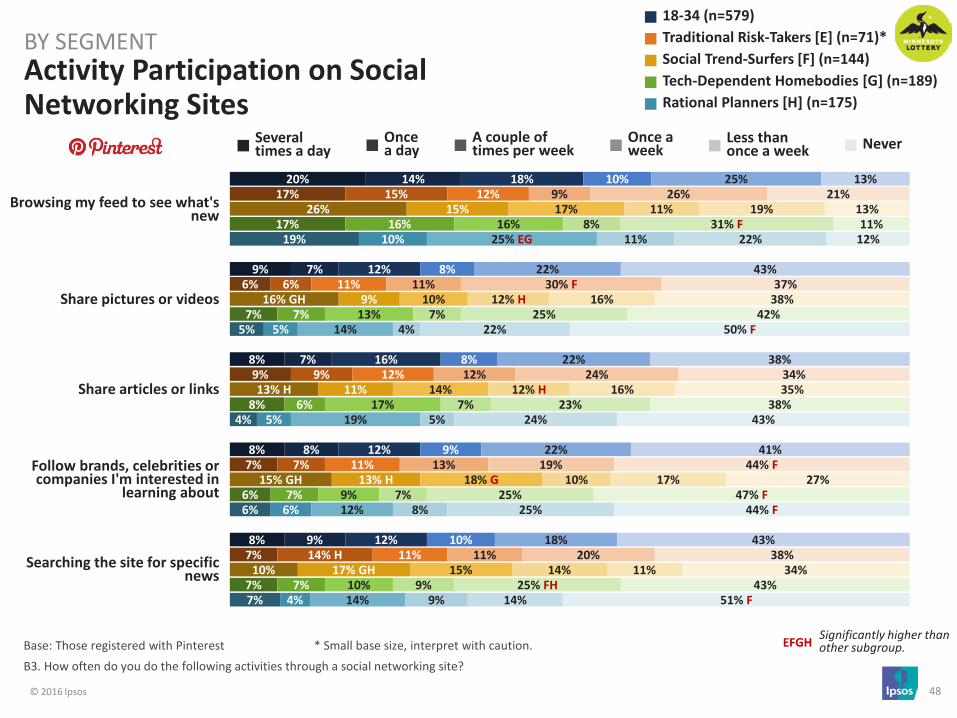
Base: Those registered with Pinterest * Small base size, interpret with caution. B3. How often do you do the following activities through a social networking site?
Activity Participation on Social Networking Sites
BY SEGMENT
Browsing my feed to see what's new
Share pictures or videos
Share articles or links
Follow brands, celebrities or companies I'm interested in
learning about
Searching the site for specific news
18-34 (n=579) Traditional Risk-Takers [E] (n=71)* Social Trend-Surfers [F] (n=144) Tech-Dependent Homebodies [G] (n=189) Rational Planners [H] (n=175)
EFGH Significantly higher than other subgroup.
Several times a day
Once a day
A couple of times per week
Once a week
Less than once a week Never
14%
7%
7%
8%
9%
15%
6%
9%
7%
14% H
15%
9%
11%
13% H
17% GH
16%
7%
6%
7%
7%
10%
5%
5%
6%
4%
18%
12%
16%
12%
12%
12%
11%
12%
11%
11%
17%
10%
14%
18% G
15%
16%
13%
17%
9%
10%
25% EG
14%
19%
12%
14%
10%
8%
8%
9%
10%
9%
11%
12%
13%
11%
11%
12% H
12% H
10%
14%
8%
7%
7%
7%
9%
11%
4%
5%
8%
9%
25%
22%
22%
22%
18%
26%
30% F
24%
19%
20%
19%
16%
16%
17%
11%
31% F
25%
23%
25%
25% FH
22%
22%
24%
25%
14%
13%
43%
38%
41%
43%
21%
37%
34%
44% F
38%
13%
38%
35%
27%
34%
11%
42%
38%
47% F
43%
12%
50% F
43%
44% F
51% F
© 2016 Ipsos 49
5%
4%
3%
3%
10% GH
6%
5% H
5%
10% GH
7% GH
6% H
6% H
3%
2%
2%
3%
2%
2%
1%
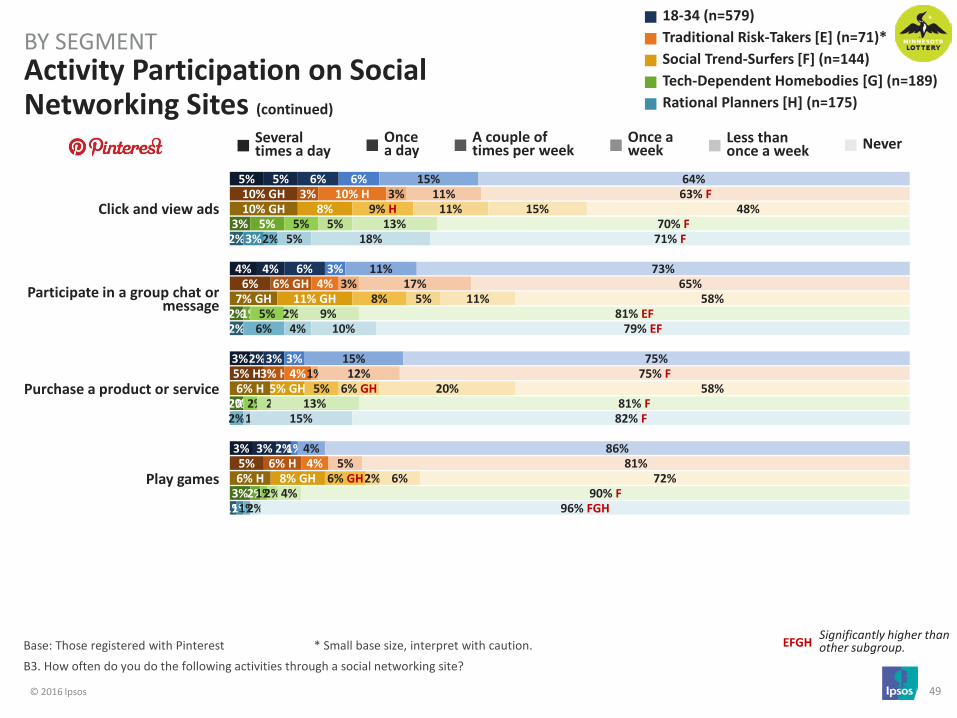
Base: Those registered with Pinterest * Small base size, interpret with caution. B3. How often do you do the following activities through a social networking site?
Activity Participation on Social Networking Sites (continued)
BY SEGMENT
Several times a day
Once a day
A couple of times per week
Once a week
Less than once a week Never
Click and view ads
Participate in a group chat or message
Purchase a product or service
Play games
EFGH Significantly higher than other subgroup.
18-34 (n=579) Traditional Risk-Takers [E] (n=71)* Social Trend-Surfers [F] (n=144) Tech-Dependent Homebodies [G] (n=189) Rational Planners [H] (n=175)
5%
4%
2%
3%
3%
6% GH
3% H
6% H
8%
11% GH
5% GH
8% GH
5%
1%
0%
2%
3%
1%
6%
6%
3%
2%
10% H
4%
4%
4%
9% H
8%
5%
6% GH
5%
5%
2%
1%
2%
6%
2%
1%
6%
3%
3%
1%
3%
3%
1%
11%
5%
6% GH
2%
5%
2%
2%
2%
5%
4%
1%
15%
11%
15%
4%
11%
17%
12%
5%
15%
11%
20%
6%
13%
9%
13%
4%
18%
10%
15%
2%
64%
73%
75%
86%
63% F
65%
75% F
81%
48%
58%
58%
72%
70% F
81% EF
81% F
90% F
71% F
79% EF
82% F
96% FGH

© 2016 Ipsos 50
TELEVISION
© 2016 Ipsos 51
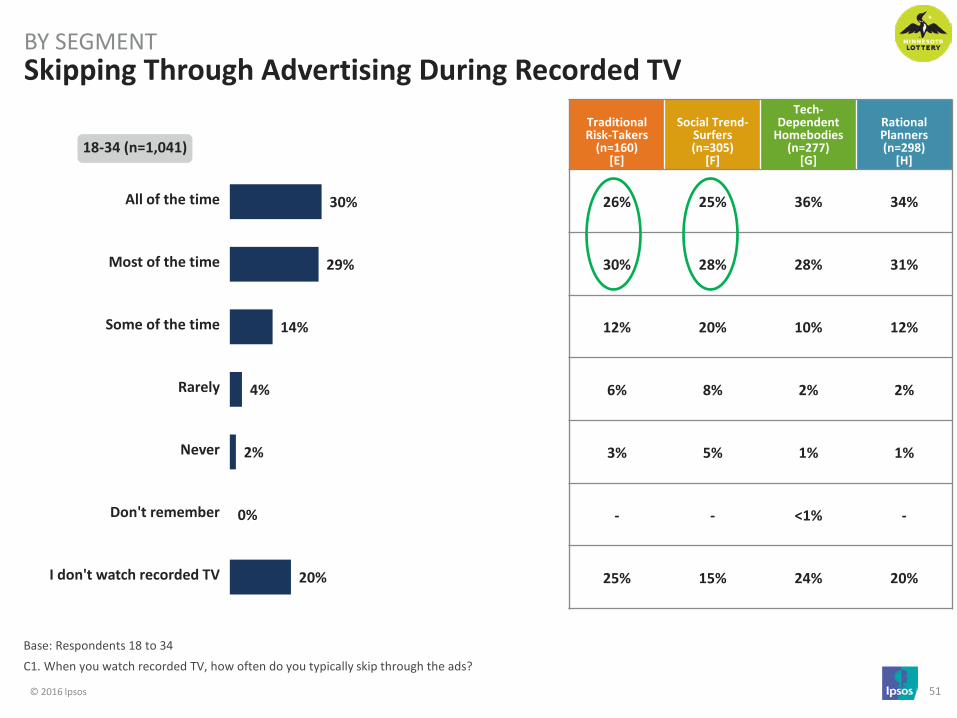
30%
29%
14%
4%
2%
0%
20%
All of the time
Most of the time
Some of the time
Rarely
Never
Don't remember
I don't watch recorded TV
Base: Respondents 18 to 34 C1. When you watch recorded TV, how often do you typically skip through the ads?
Skipping Through Advertising During Recorded TV BY SEGMENT
Traditional Risk-Takers
(n=160) [E]
Social Trend-Surfers (n=305)
[F]
Tech-Dependent
Homebodies (n=277)
[G]
Rational Planners (n=298)
[H]
26% 25% 36% 34%
30% 28% 28% 31%
12% 20% 10% 12%
6% 8% 2% 2%
3% 5% 1% 1%
- - <1% -
25% 15% 24% 20%
18-34 (n=1,041)
© 2016 Ipsos 52
30%
29%
22%
19%
19%
41% GH
30% G
19%
22%
18%
35% GH
38% G
33% EGH
22% H
21%
21%
15%
21% H
21%
19%
27%
32% G
13%
14%
17%
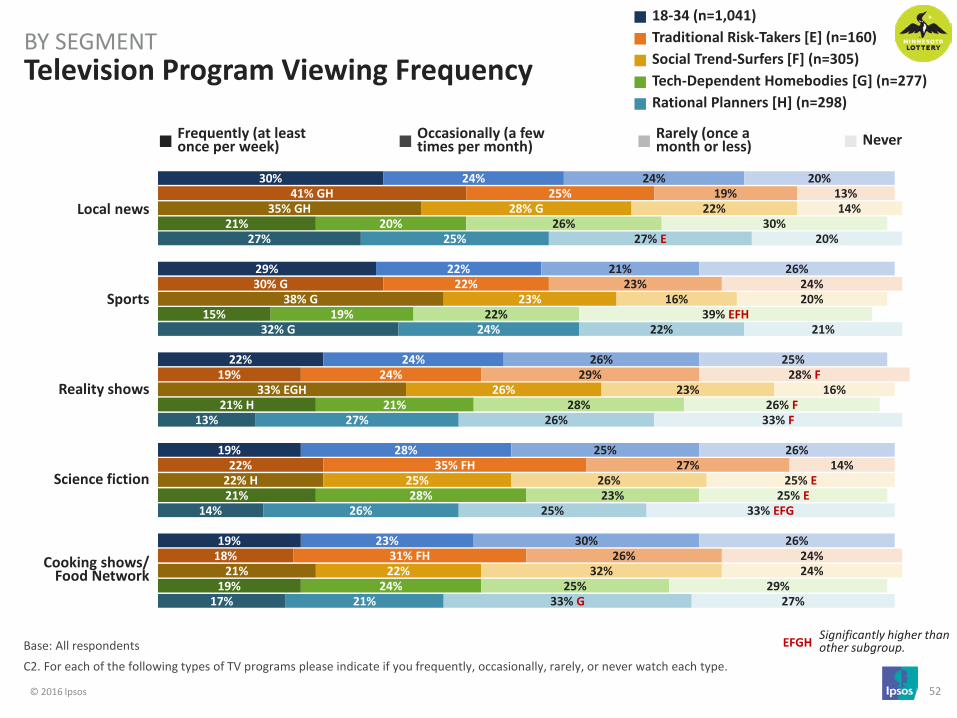
Base: All respondents C2. For each of the following types of TV programs please indicate if you frequently, occasionally, rarely, or never watch each type.
Television Program Viewing Frequency BY SEGMENT
Frequently (at least once per week)
Occasionally (a few times per month)
Rarely (once a month or less) Never
EFGH Significantly higher than other subgroup.
Local news
Sports
Reality shows
Science fiction
Cooking shows/ Food Network
18-34 (n=1,041) Traditional Risk-Takers [E] (n=160) Social Trend-Surfers [F] (n=305) Tech-Dependent Homebodies [G] (n=277) Rational Planners [H] (n=298)
24%
22%
24%
28%
23%
25%
22%
24%
35% FH
31% FH
28% G
23%
26%
25%
22%
20%
19%
21%
28%
24%
25%
24%
27%
26%
21%
24%
21%
26%
25%
30%
19%
23%
29%
27%
26%
22%
16%
23%
26%
32%
26%
22%
28%
23%
25%
27% E
22%
26%
25%
33% G
20%
26%
25%
26%
26%
13%
24%
28% F
14%
24%
14%
20%
16%
25% E
24%
30%
39% EFH
26% F
25% E
29%
20%
21%
33% F
33% EFG
27%
© 2016 Ipsos 53
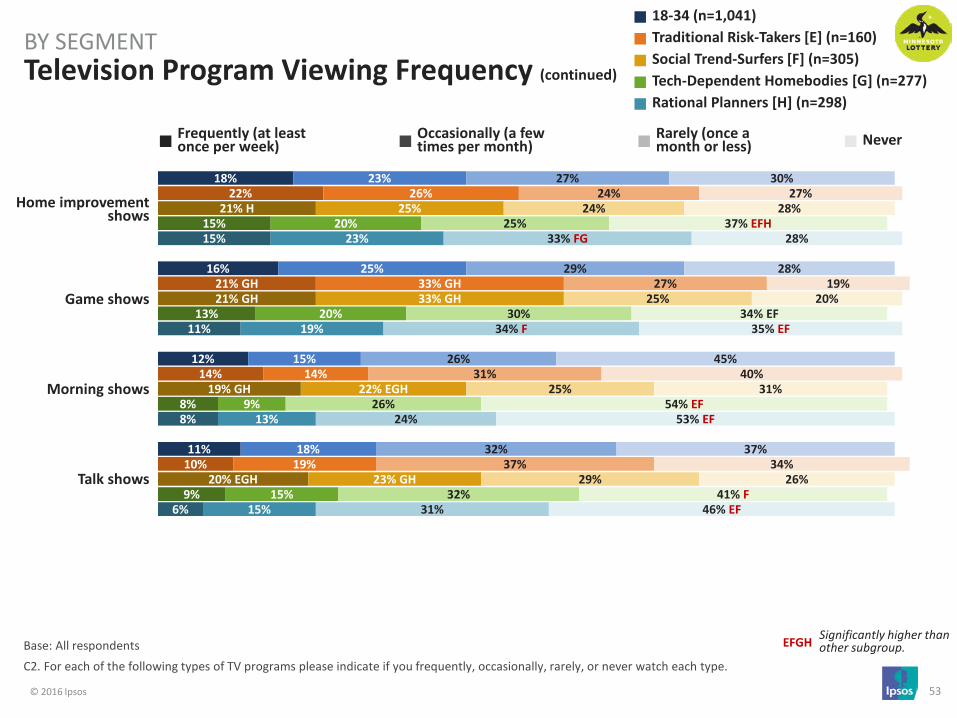
18%
16%
12%
11%
22%
21% GH
14%
10%
21% H
21% GH
19% GH
20% EGH
15%
13%
8%
9%
15%
11%
8%
6%
Base: All respondents C2. For each of the following types of TV programs please indicate if you frequently, occasionally, rarely, or never watch each type.
Television Program Viewing Frequency (continued)
BY SEGMENT
EFGH Significantly higher than other subgroup.
Home improvement shows
Game shows
Morning shows
Talk shows
Frequently (at least once per week)
Occasionally (a few times per month)
Rarely (once a month or less) Never
18-34 (n=1,041) Traditional Risk-Takers [E] (n=160) Social Trend-Surfers [F] (n=305) Tech-Dependent Homebodies [G] (n=277) Rational Planners [H] (n=298)
23%
25%
15%
18%
26%
33% GH
14%
19%
25%
33% GH
22% EGH
23% GH
20%
20%
9%
15%
23%
19%
13%
15%
27%
29%
26%
32%
24%
27%
31%
37%
24%
25%
25%
29%
25%
30%
26%
32%
33% FG
34% F
24%
31%
30%
28%
45%
37%
27%
19%
40%
34%
28%
20%
31%
26%
37% EFH
34% EF
54% EF
41% F
28%
35% EF
53% EF
46% EF

© 2016 Ipsos 54
RADIO / MUSIC
© 2016 Ipsos 55
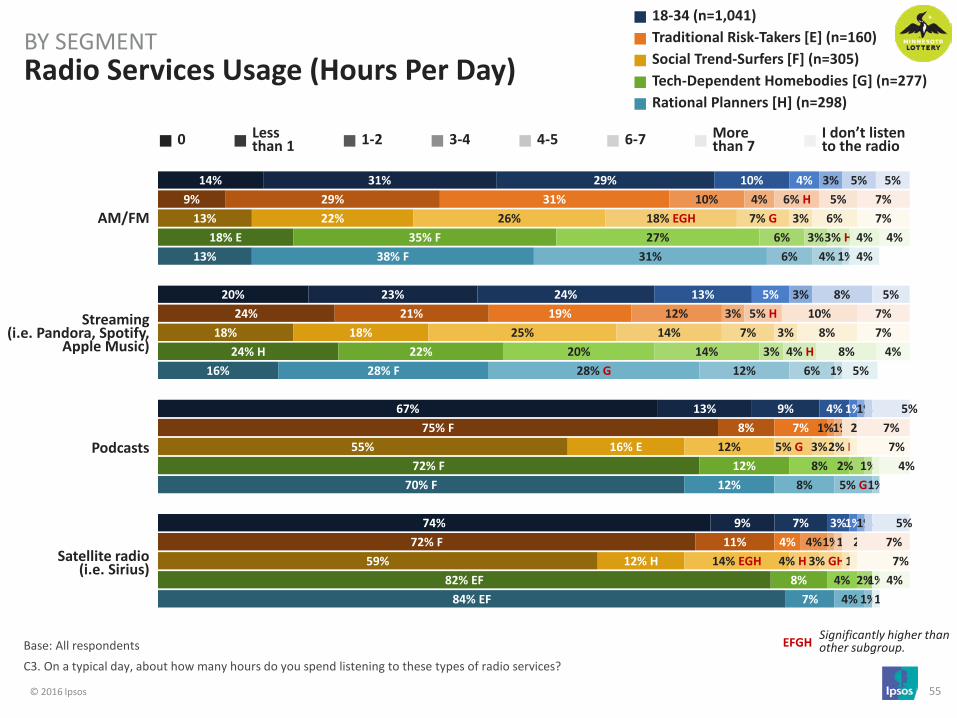
14%
20%
67%
74%
9%
24%
75% F
72% F
13%
18%
55%
59%
18% E
24% H
72% F
82% EF
13%
16%
70% F
84% EF
Base: All respondents C3. On a typical day, about how many hours do you spend listening to these types of radio services?
Radio Services Usage (Hours Per Day) BY SEGMENT
0 Less than 1 1-2 3-4 4-5 6-7 More
than 7 I don’t listen to the radio
AM/FM
Streaming (i.e. Pandora, Spotify,
Apple Music)
Podcasts
Satellite radio (i.e. Sirius)
EFGH Significantly higher than other subgroup.
18-34 (n=1,041) Traditional Risk-Takers [E] (n=160) Social Trend-Surfers [F] (n=305) Tech-Dependent Homebodies [G] (n=277) Rational Planners [H] (n=298)
31%
23%
13%
9%
29%
21%
8%
11%
22%
18%
16% E
12% H
35% F
22%
12%
8%
38% F
28% F
12%
7%
29%
24%
9%
7%
31%
19%
7%
4%
26%
25%
12%
14% EGH
27%
20%
8%
4%
31%
28% G
8%
4%
10%
13%
4%
3%
10%
12%
1%
4%
18% EGH
14%
5% G
4% H
6%
14%
2%
2%
6%
12%
5% G
1%
4%
5%
1%
1%
4%
3%
1%
1%
7% G
7%
3%
3% GH
3%
3%
1%
4%
6%
1%
3%
3%
1%
1%
6% H
5% H
1%
3%
3%
2% H
1%
3% H
4% H
1%
1%
5%
8%
1%
1%
5%
10%
2%
2%
6%
8%
1%
1%
4%
8%
1%
1%
4%
5%
1%
5%
5%
5%
5%
7%
7%
7%
7%
7%
7%
7%
7%
4%
4%
4%
4%
4%
4%
4%
4%

© 2016 Ipsos 56
75%
50%
24%
18%
3%
3%
79%
34%
15%
20%
2%
6%
75%
57%
37%
26%
1%
2%
66%
51%
17%
11%
4%
4%
79%
48%
21%
15%
5%
3%
45%
30%
7%
5%
3%
2%
57%
14%
5%
9%
2%
3%
38%
34%
11%
6%
1%
1%
42%
31%
8%
4%
4%
2%
50%
32%
4%
4%
4%
2%
Base: Listen to radio streaming services C4. Which of the following online music services do you currently use? Then, please indicate which service you most prefer to use.
Online Music Services Current Use and Preference BY SEGMENT
Pandora
Spotify
Apple Music
Google Play Music All Access
Amazon/ Amazon Prime
Music
iHeartRadio
Currently Use Prefer To Use
18-34 (n=780) Traditional Risk-Takers [E] (n=112) Social Trend-Surfers [F] (n=230) Tech-Dependent Homebodies [G] (n=200) Rational Planners [H] (n=238)
© 2016 Ipsos 57
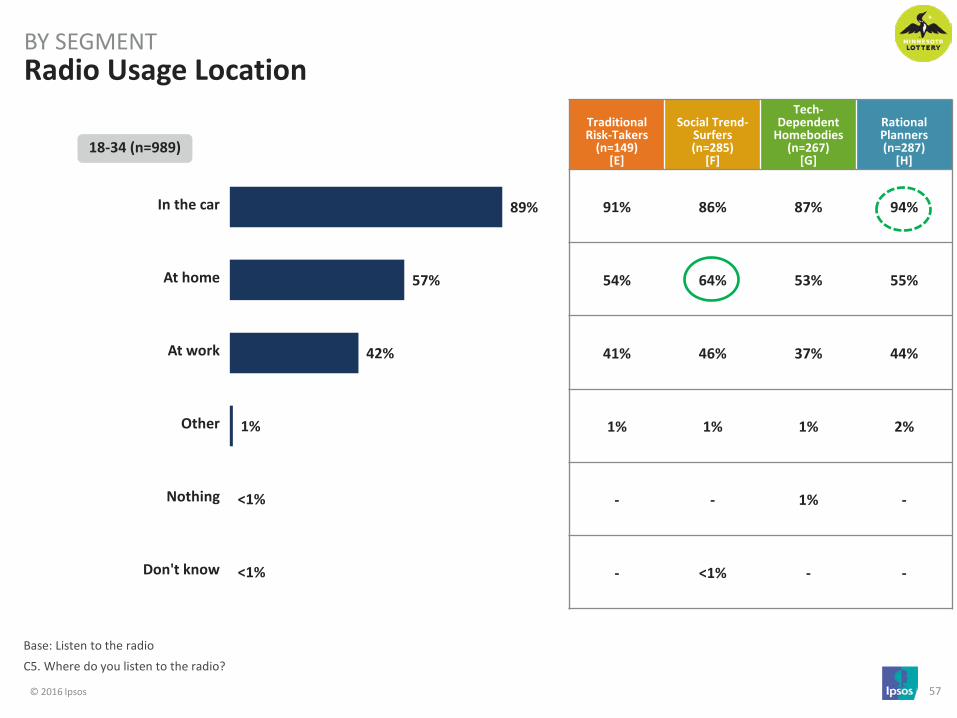
89%
57%
42%
1%
<1%
<1%
In the car
At home
At work
Other
Nothing
Don't know
Base: Listen to the radio C5. Where do you listen to the radio?
Radio Usage Location BY SEGMENT
Traditional Risk-Takers
(n=149) [E]
Social Trend-Surfers (n=285)
[F]
Tech-Dependent
Homebodies (n=267)
[G]
Rational Planners (n=287)
[H]
91% 86% 87% 94%
54% 64% 53% 55%
41% 46% 37% 44%
1% 1% 1% 2%
- - 1% -
- <1% - -
18-34 (n=989)
© 2016 Ipsos 58
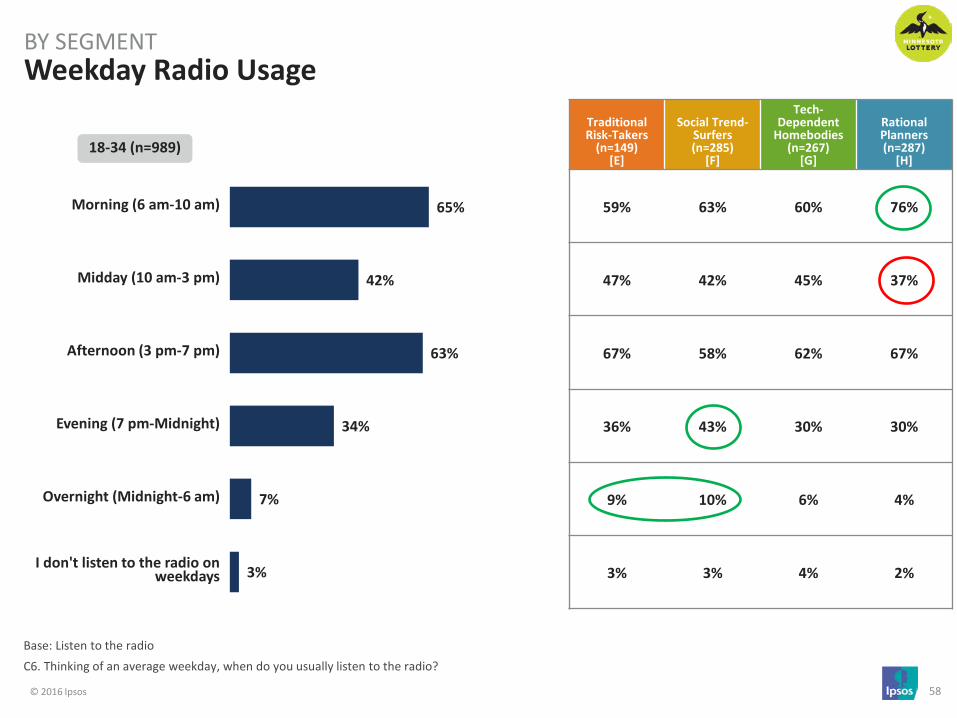
65%
42%
63%
34%
7%
3%
Morning (6 am-10 am)
Midday (10 am-3 pm)
Afternoon (3 pm-7 pm)
Evening (7 pm-Midnight)
Overnight (Midnight-6 am)
I don't listen to the radio on weekdays
Base: Listen to the radio C6. Thinking of an average weekday, when do you usually listen to the radio?
Weekday Radio Usage BY SEGMENT
Traditional Risk-Takers
(n=149) [E]
Social Trend-Surfers (n=285)
[F]
Tech-Dependent
Homebodies (n=267)
[G]
Rational Planners (n=287)
[H]
59% 63% 60% 76%
47% 42% 45% 37%
67% 58% 62% 67%
36% 43% 30% 30%
9% 10% 6% 4%
3% 3% 4% 2%
18-34 (n=989)
© 2016 Ipsos 59
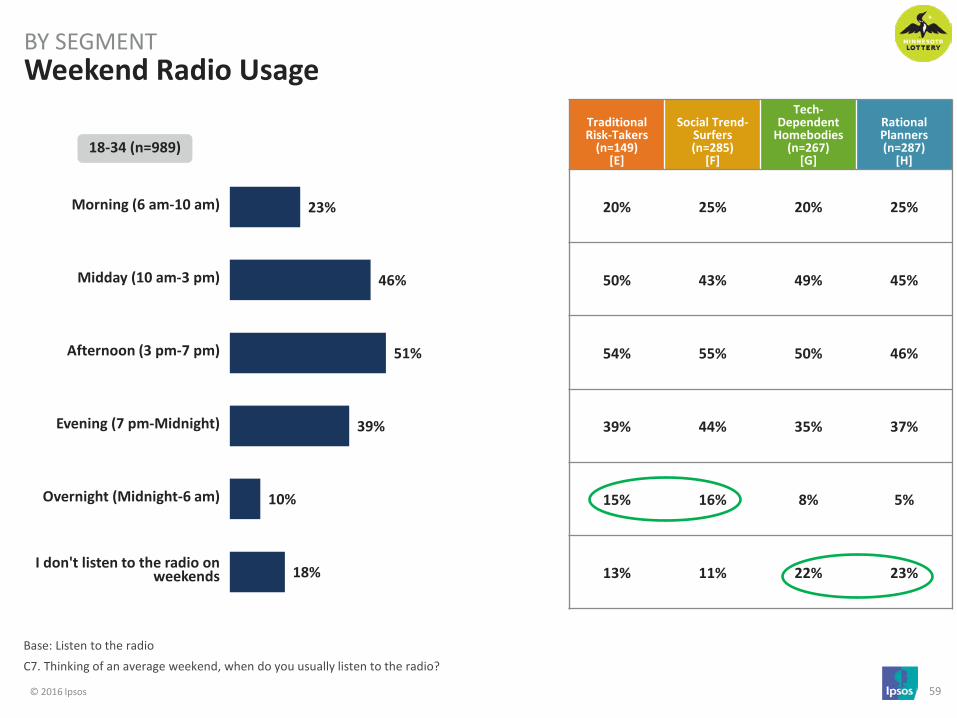
23%
46%
51%
39%
10%
18%
Morning (6 am-10 am)
Midday (10 am-3 pm)
Afternoon (3 pm-7 pm)
Evening (7 pm-Midnight)
Overnight (Midnight-6 am)
I don't listen to the radio on weekends
Base: Listen to the radio C7. Thinking of an average weekend, when do you usually listen to the radio?
Weekend Radio Usage BY SEGMENT
Traditional Risk-Takers
(n=149) [E]
Social Trend-Surfers (n=285)
[F]
Tech-Dependent
Homebodies (n=267)
[G]
Rational Planners (n=287)
[H]
20% 25% 20% 25%
50% 43% 49% 45%
54% 55% 50% 46%
39% 44% 35% 37%
15% 16% 8% 5%
13% 11% 22% 23%
18-34 (n=989)

© 2016 Ipsos 60
45%
35%
31%
28%
27%
34%
45% FG
38% GH
31% G
23%
53% EH
33%
39% GH
34% G
28%
46% E
32%
24%
20%
27%
43%
36%
26%
28% G
29%
Base: Listen to the radio C8. For each of the following types of radio programs, please indicate if you frequently, occasionally, rarely, or never listen to each type.
Radio Program Listening Frequency BY SEGMENT
Frequently (at least once per week)
Occasionally (a few times per month)
Rarely (once a month or less) Never
EFGH Significantly higher than other subgroup.
Pop
Rock
Country
Hip hop/rap
Alternative
18-34 (n=989) Traditional Risk-Takers [E] (n=149) Social Trend-Surfers [F] (n=285) Tech-Dependent Homebodies [G] (n=267) Rational Planners [H] (n=287)
28%
26%
15%
25%
28%
31%
24%
14%
20%
26%
27%
32% G
21% GH
30% EG
31% G
29%
22%
12%
22%
23%
26%
26%
14%
24%
30%
12%
20%
16%
22%
20%
13%
17%
12%
22%
24%
9%
19%
15%
19%
20%
11%
23%
19%
27% F
18%
16% F
19%
16%
20%
19%
15%
19%
38%
25%
26%
21% F
14%
36% F
27%
27%
12%
17%
26%
17%
22%
14%
23% E
45% F
31%
33% FH
15%
20%
44% F
27%
22%
© 2016 Ipsos 61
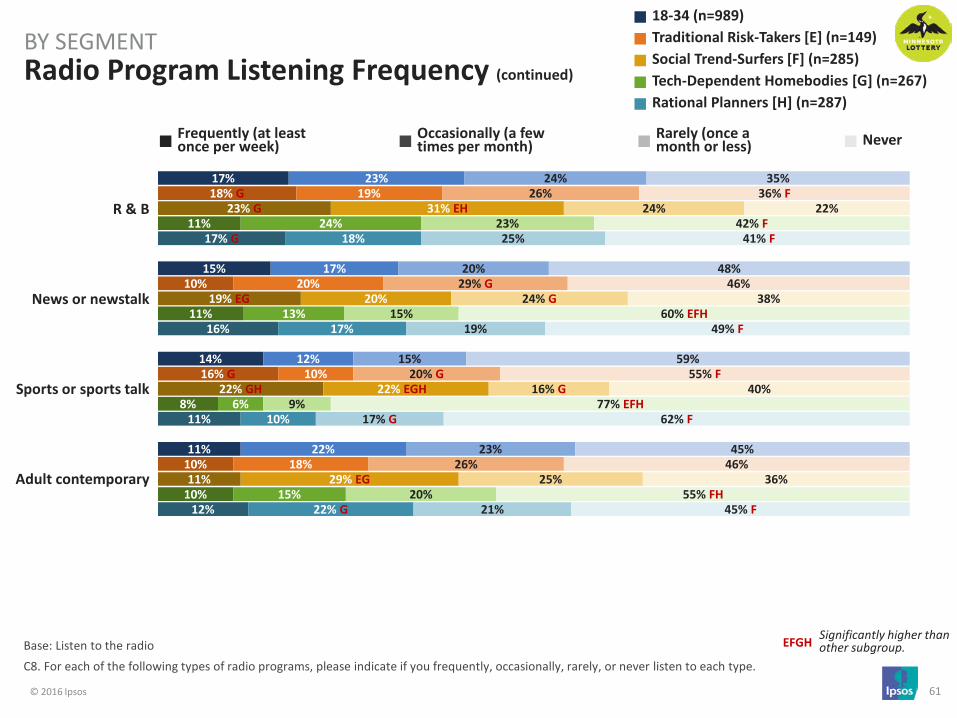
17%
15%
14%
11%
18% G
10%
16% G
10%
23% G
19% EG
22% GH
11%
11%
11%
8%
10%
17% G
16%
11%
12%
Base: Listen to the radio C8. For each of the following types of radio programs, please indicate if you frequently, occasionally, rarely, or never listen to each type.
Radio Program Listening Frequency (continued)
BY SEGMENT
EFGH Significantly higher than other subgroup.
R & B
News or newstalk
Sports or sports talk
Adult contemporary
Frequently (at least once per week)
Occasionally (a few times per month)
Rarely (once a month or less) Never
18-34 (n=989) Traditional Risk-Takers [E] (n=149) Social Trend-Surfers [F] (n=285)
Rational Planners [H] (n=287) Tech-Dependent Homebodies [G] (n=267)
23%
17%
12%
22%
19%
20%
10%
18%
31% EH
20%
22% EGH
29% EG
24%
13%
6%
15%
18%
17%
10%
22% G
24%
20%
15%
23%
26%
29% G
20% G
26%
24%
24% G
16% G
25%
23%
15%
9%
20%
25%
19%
17% G
21%
35%
48%
59%
45%
36% F
46%
55% F
46%
22%
38%
40%
36%
42% F
60% EFH
77% EFH
55% FH
41% F
49% F
62% F
45% F

© 2016 Ipsos 62
SHOPPING

© 2016 Ipsos 63
4%
3%
2%
1%
9%
5%
3%
3%
6%
5%
3%
3%
2%
3%
2%
1%
1%
Base: All respondents D1. Thinking of the various products you use around your home, such as groceries, snacks, and various household items, how often do you shop at each of the following types of stores?
Store Type Shop Frequency BY SEGMENT
Daily Several times a week
Once a week
A few times a month
Once a month
Less than once a month Never
EFGH Significantly higher than other subgroup.
18-34 (n=1,041) Traditional Risk-Takers [E] (n=160) Social Trend-Surfers [F] (n=305) Tech-Dependent Homebodies [G] (n=277) Rational Planners [H] (n=298)
Convenience stores
Big box stores such as Target or Wal-Mart
Supermarkets
Independently owned local businesses
H H
GH GH
GH H
H
16%
24%
17%
6%
25%
19%
18%
7%
17%
25%
21%
7%
15%
29%
14%
4%
9%
20%
15%
7%
G
FGH H
H
20%
34%
35%
12%
26%
29%
29%
10%
27%
35%
36%
17%
17%
30%
32%
8%
13%
39%
38%
11%
EG
GH
GH GH
25%
26%
25%
23%
19%
32%
25%
25%
25%
22%
22%
25%
26%
28%
26%
18%
27%
25%
29%
24%
F
G
10%
8%
11%
18%
6%
9%
16%
19%
10%
10%
9%
16%
12%
6%
12%
17%
12%
9%
9%
19%
FH
E
18%
4%
7%
26%
12%
5%
5%
24%
9%
2%
7%
17%
20%
5%
9%
37%
29%
5%
6%
28%
F
F F
EFH F
EF EFG
7%
1%
4%
15%
4%
1%
5%
14%
7%
2%
3%
15%
7%
6%
18%
10%
1%
2%
12%
H
E
© 2016 Ipsos 64
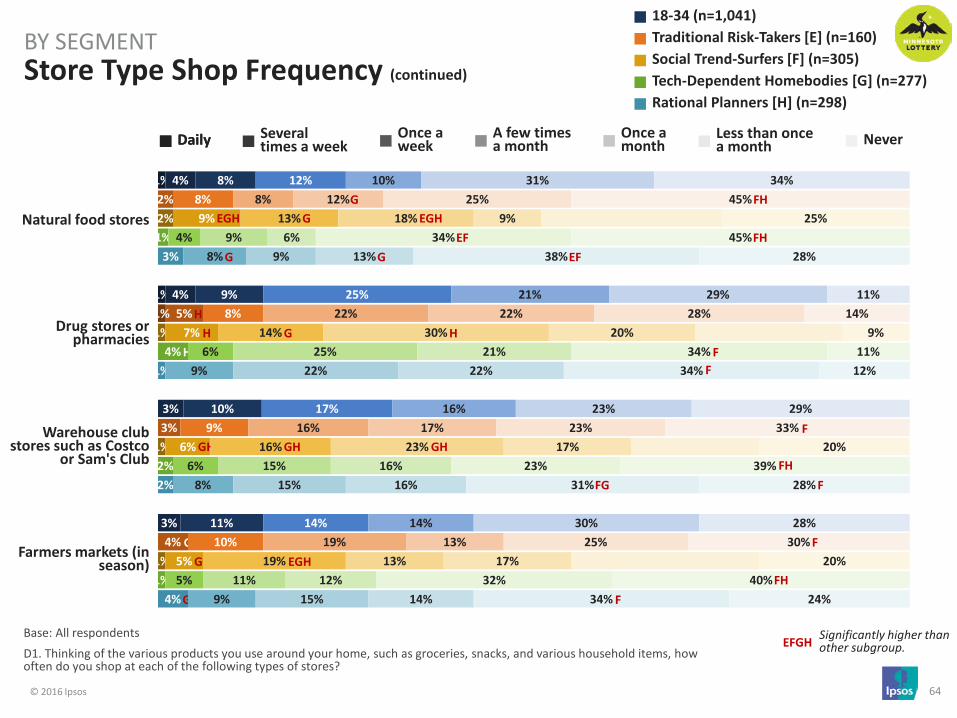
1%
1% 1%
2%
1%
1%
1%
Base: All respondents D1. Thinking of the various products you use around your home, such as groceries, snacks, and various household items, how often do you shop at each of the following types of stores?
Store Type Shop Frequency (continued)
BY SEGMENT
Daily Several times a week
Once a week
A few times a month
Once a month
Less than once a month Never
EFGH Significantly higher than other subgroup.
18-34 (n=1,041) Traditional Risk-Takers [E] (n=160) Social Trend-Surfers [F] (n=305) Tech-Dependent Homebodies [G] (n=277) Rational Planners [H] (n=298)
Natural food stores
Drug stores or pharmacies
Warehouse club stores such as Costco
or Sam's Club
Farmers markets (in season)
H
4%
4%
3%
3%
1%
2%
5%
3%
4%
9%
7%
6%
5%
1%
4%
2%
1%
3%
1%
2%
4%
Daily
GH
EGH
H H
H
G G
G
8%
9%
10%
11%
8%
8%
9%
10%
13%
14%
16%
19%
4%
6%
6%
5%
8%
9%
8%
9%
GH
G
G
G
EGH
12%
25%
17%
14%
8%
22%
16%
19%
18%
30%
23%
13%
9%
25%
15%
11%
9%
22%
15%
15%
GH
EGH
H
10%
21%
16%
14%
12%
22%
17%
13%
9%
20%
17%
17%
6%
21%
16%
12%
13%
22%
16%
14%
G
G
31%
29%
23%
30%
25%
28%
23%
25%
24%
20%
17%
25%
34%
34%
23%
32%
38%
34%
31%
34%
FG
EF EF
F F
F
34%
11%
29%
28%
45%
14%
33%
30%
25%
9%
20%
20%
45%
11%
39%
40%
28%
12%
28%
24%
F
FH F
FH
FH
F
FH
© 2016 Ipsos 65
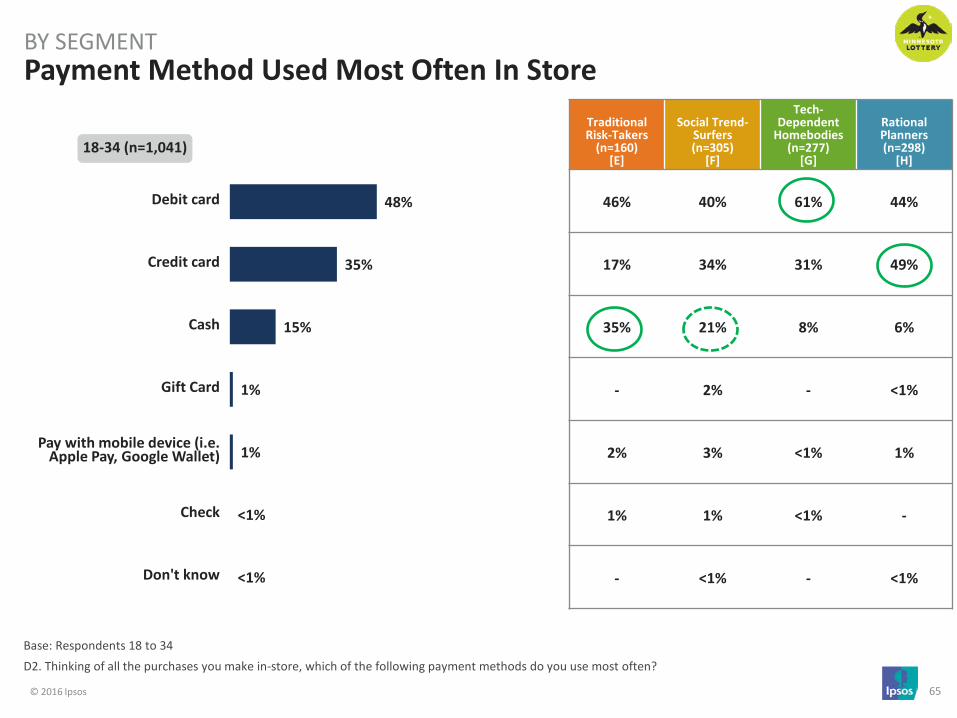
48%
35%
15%
1%
1%
<1%
<1%
Debit card
Credit card
Cash
Gift Card
Pay with mobile device (i.e. Apple Pay, Google Wallet)
Check
Don't know
Base: Respondents 18 to 34 D2. Thinking of all the purchases you make in-store, which of the following payment methods do you use most often?
Payment Method Used Most Often In Store BY SEGMENT
Traditional Risk-Takers
(n=160) [E]
Social Trend-Surfers (n=305)
[F]
Tech-Dependent
Homebodies (n=277)
[G]
Rational Planners (n=298)
[H]
46% 40% 61% 44%
17% 34% 31% 49%
35% 21% 8% 6%
- 2% - <1%
2% 3% <1% 1%
1% 1% <1% -
- <1% - <1%
18-34 (n=1,041)

© 2016 Ipsos 66
73%
29%
In-store
Online
Base: Respondents 18 to 34 D3. Of all the shopping you do, what proportion do you do online vs. in-store?
Online vs. In-Store Shopping BY SEGMENT
Traditional Risk-Takers
(n=160) [E]
Social Trend-Surfers (n=305)
[F]
Tech-Dependent
Homebodies (n=277)
[G]
Rational Planners (n=298)
[H]
77% 69% 75% 74%
27% 33% 27% 27%
Proportion (Mean excl. 0)
18-34 (n=1,041)
© 2016 Ipsos 67
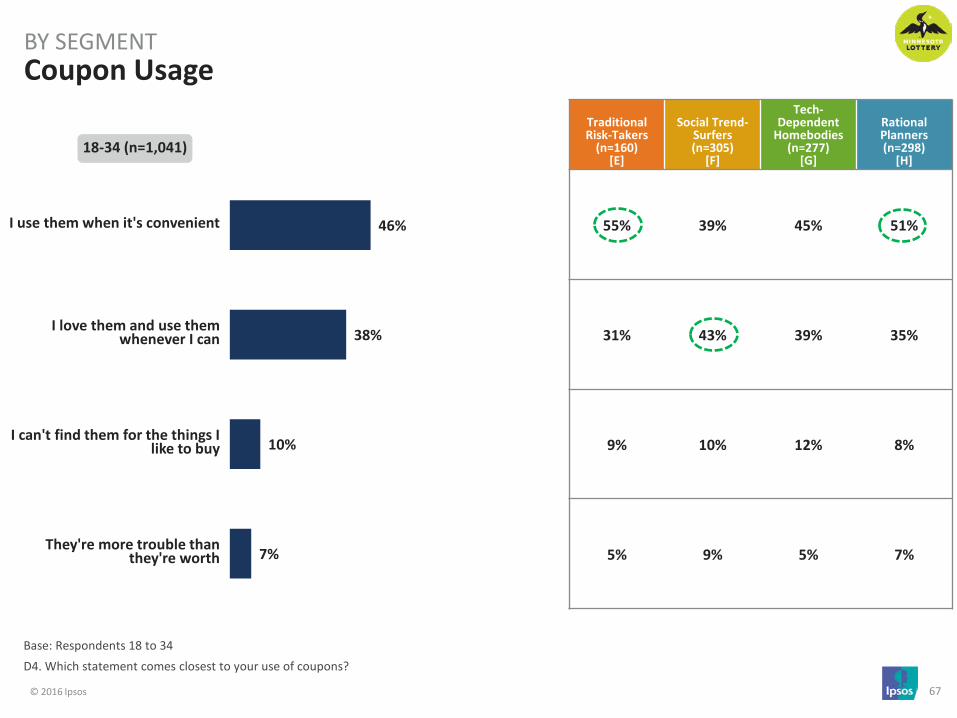
46%
38%
10%
7%
I use them when it's convenient
I love them and use them whenever I can
I can't find them for the things I like to buy
They're more trouble than they're worth
Base: Respondents 18 to 34 D4. Which statement comes closest to your use of coupons?
Coupon Usage BY SEGMENT
Traditional Risk-Takers
(n=160) [E]
Social Trend-Surfers (n=305)
[F]
Tech-Dependent
Homebodies (n=277)
[G]
Rational Planners (n=298)
[H]
55% 39% 45% 51%
31% 43% 39% 35%
9% 10% 12% 8%
5% 9% 5% 7%
18-34 (n=1,041)
© 2016 Ipsos 68
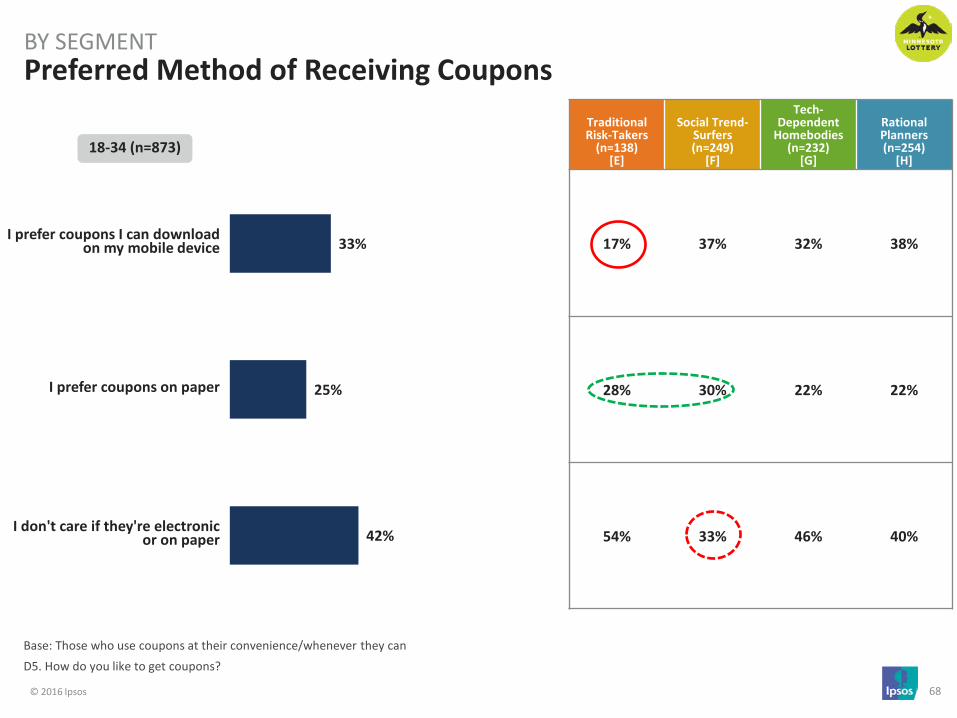
33%
25%
42%
I prefer coupons I can download on my mobile device
I prefer coupons on paper
I don't care if they're electronic or on paper
Base: Those who use coupons at their convenience/whenever they can D5. How do you like to get coupons?
Preferred Method of Receiving Coupons BY SEGMENT
Traditional Risk-Takers
(n=138) [E]
Social Trend-Surfers (n=249)
[F]
Tech-Dependent
Homebodies (n=232)
[G]
Rational Planners (n=254)
[H]
17% 37% 32% 38%
28% 30% 22% 22%
54% 33% 46% 40%
18-34 (n=873)

© 2016 Ipsos 69
66%
25%
2%
7%
Pay at pump
Pay clerk inside
Pay clerk outside at walk-up window
I don't usually purchase gas
Base: Respondents 18 to 34 D6. When buying gasoline, what is your primary method of payment?
Primary Payment Method When Purchasing Gasoline BY SEGMENT
Traditional Risk-Takers
(n=160) [E]
Social Trend-Surfers (n=305)
[F]
Tech-Dependent
Homebodies (n=277)
[G]
Rational Planners (n=298)
[H]
27% 62% 71% 87%
59% 27% 21% 10%
2% 3% <1% <1%
12% 8% 8% 3%
18-34 (n=1,041)

© 2016 Ipsos 70
EVENTS & ENTERTAINMENT OPTIONS

© 2016 Ipsos 71
65%
65%
62%
46%
40%
30%
17%
17%
10%
10%
1%
<1%
Social Media
From friends or family
Online (i.e. own personal search)
Television
Radio
Online (websites that notify you of upcoming events)
At an event
Coupons
Billboard
Direct mail
Other
Don't know
Base: Respondents 18 to 34 E1. Where do you look to find out about entertainment options?
Source(s) of Information Regarding Entertainment Options BY SEGMENT
Traditional Risk-Takers
(n=160) [E]
Social Trend-Surfers (n=305)
[F]
Tech-Dependent
Homebodies (n=277)
[G]
Rational Planners (n=298)
[H]
58% 63% 74% 62%
66% 53% 68% 72%
54% 55% 68% 67%
53% 51% 41% 43%
47% 39% 34% 41%
27% 27% 29% 35%
15% 19% 12% 19%
16% 22% 11% 16%
15% 14% 6% 8%
7% 15% 7% 8%
2% <1% - 1%
- <1% <1% -
18-34 (n=1,041)

© 2016 Ipsos 72
64%
48%
14%
7%
6%
61%
46%
17%
5%
5%
61%
54%
18%
12%
9%
65%
38%
11%
3%
3%
69%
54%
12%
6%
5%
Base: All respondents E2. Below you'll see a list of events that take place in Minnesota during the year. For each one, please select the response that best represents your experience with that event.
Minnesota Event Participation BY SEGMENT
I attended this event in the past year
I’ve attended this event, but not in the past year
I’d like to attend this event, but haven’t had the chance
I’m not interested in this event
I’m not familiar with this event
EFGH Significantly higher than other subgroup.
18-34 (n=1,041) Traditional Risk-Takers [E] (n=160) Social Trend-Surfers [F] (n=305) Tech-Dependent Homebodies [G] (n=277) Rational Planners [H] (n=298)
Mall of America
Minnesota State Fair
Minnesota Renaissance Festival
Red Bull Crushed Ice
Uptown Art Fair
G
G
G
G
EGH
G
24%
33%
30%
9%
13%
26%
32%
29%
7%
5%
20%
26%
23%
11%
15%
27%
42%
32%
3%
10%
24%
31%
36%
11%
18%
EFH
F F
E
EG
G
G
F
5%
12%
30%
31%
22%
9%
18%
37%
34%
22%
9%
12%
28%
31%
23%
4%
13%
28%
24%
18%
1%
9%
28%
36%
25%
H
G
G G
GH GH
5%
5%
21%
21%
18%
4%
4%
14%
18%
21%
4%
4%
19%
16%
15%
4%
7%
24%
29%
22%
6%
6%
22%
21%
17%
E E
F
EFH
2%
2%
6%
33%
41%
1%
4%
36%
48%
6%
5%
12%
29%
38%
1%
5%
42%
48%
1%
2%
26%
35%
EGH
H
FH
H
FH
EGH

© 2016 Ipsos 73
5%
3%
3%
2%
1%
1%
4%
5%
0%
1%
6%
6%
6%
6%
2%
2%
1%
1%
0%
1%
7%
2%
1%
1%
2%
Base: All respondents E2. Below you'll see a list of events that take place in Minnesota during the year. For each one, please select the response that best represents your experience with that event.
Minnesota Event Participation (continued)
BY SEGMENT
I attended this event in the past year
I’ve attended this event, but not in the past year
I’d like to attend this event, but haven’t had the chance
I’m not interested in this event
I’m not familiar with this event
EFGH Significantly higher than other subgroup.
18-34 (n=1,041) Traditional Risk-Takers [E] (n=160) Social Trend-Surfers [F] (n=305) Tech-Dependent Homebodies [G] (n=277) Rational Planners [H] (n=298)
Basilica Block Party
WE Fest
Soundset
Rock the Garden
Bayfront Blues Festival
G GH
EG
EG
GH GH
EGH
9%
9%
7%
5%
4%
9%
10%
6%
3%
2%
10%
14%
11%
8%
6%
6%
4%
3%
2%
2%
9%
7%
7%
6%
4%
G GH
EG
G
G
G
G
33%
31%
25%
24%
16%
30%
43%
26%
22%
18%
36%
34%
30%
25%
21%
25%
25%
22%
17%
7%
39%
26%
22%
30%
19%
GH GH
G G
G
G
G
GH
G
G
18%
34%
18%
14%
20%
14%
23%
16%
13%
21%
18%
25%
15%
16%
21%
20%
41%
21%
16%
21%
16%
44%
20%
11%
17%
EF EF
37%
23%
47%
55%
60%
47%
19%
47%
62%
59%
29%
21%
37%
45%
51%
47%
30%
53%
65%
71%
29%
22%
50%
52%
59%
EFH
EFH
FH
FH
F
F F
F
FH
© 2016 Ipsos 74
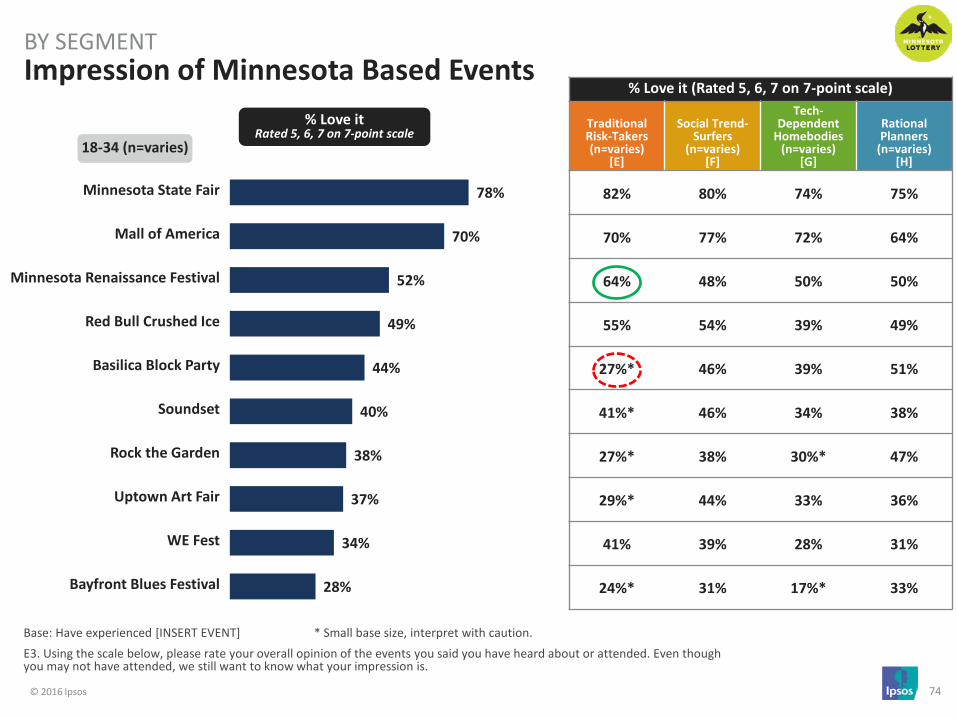
78%
70%
52%
49%
44%
40%
38%
37%
34%
28%
Minnesota State Fair
Mall of America
Minnesota Renaissance Festival
Red Bull Crushed Ice
Basilica Block Party
Soundset
Rock the Garden
Uptown Art Fair
WE Fest
Bayfront Blues Festival
Base: Have experienced [INSERT EVENT] * Small base size, interpret with caution. E3. Using the scale below, please rate your overall opinion of the events you said you have heard about or attended. Even though you may not have attended, we still want to know what your impression is.
Impression of Minnesota Based Events BY SEGMENT
18-34 (n=varies)
% Love it (Rated 5, 6, 7 on 7-point scale)
Traditional Risk-Takers (n=varies)
[E]
Social Trend-Surfers
(n=varies) [F]
Tech-Dependent
Homebodies (n=varies)
[G]
Rational Planners
(n=varies) [H]
82% 80% 74% 75%
70% 77% 72% 64%
64% 48% 50% 50%
55% 54% 39% 49%
27%* 46% 39% 51%
41%* 46% 34% 38%
27%* 38% 30%* 47%
29%* 44% 33% 36%
41% 39% 28% 31%
24%* 31% 17%* 33%
% Love it Rated 5, 6, 7 on 7-point scale

© 2016 Ipsos 75
34%
19%
16%
14%
12%
7%
5%
4%
4%
Minnesota Twins
Minnesota Wild
Minnesota Vikings
University of Minnesota sports
Minnesota Timberwolves
A rodeo
Minnesota auto racing
Minnesota Lynx
Minnesota United Soccer
Base: All respondents E4. For each item indicate (a) if you have attended a game in the past year, (b) if you've watched a game on TV in the past year, and (c) if you regularly follow news articles/stories for that team.
Sports Entertainment Participation BY SEGMENT
% Attended a Game in the Past Year
Traditional Risk-Takers
(n=160) [E]
Social Trend-Surfers (n=305)
[F]
Tech-Dependent
Homebodies (n=277)
[G]
Rational Planners (n=298)
[H]
31% 40% 21% 43%
21% 23% 8% 25%
18% 20% 9% 16%
15% 21% 4% 16%
8% 20% 4% 14%
8% 11% 5% 4%
9% 11% 1% 2%
4% 7% 2% 3%
3% 9% 1% 3%
18-34 (n=1,041)
% Attended a Game in the Past Year

© 2016 Ipsos 76
51%
41%
40%
26%
25%
13%
7%
6%
6%
Minnesota Vikings
Minnesota Wild
Minnesota Twins
Minnesota Timberwolves
University of Minnesota sports
Minnesota Lynx
Minnesota United Soccer
Minnesota auto racing
A rodeo
Base: All respondents E4. For each item indicate (a) if you have attended a game in the past year, (b) if you've watched a game on TV in the past year, and (c) if you regularly follow news articles/stories for that team.
Sports Entertainment Participation (continued)
BY SEGMENT
% Watched a Game on TV in the Past Year
Traditional Risk-Takers
(n=160) [E]
Social Trend-Surfers (n=305)
[F]
Tech-Dependent
Homebodies (n=277)
[G]
Rational Planners (n=298)
[H]
57% 50% 44% 56%
47% 43% 27% 48%
45% 45% 30% 42%
28% 35% 15% 25%
28% 31% 15% 25%
17% 16% 9% 11%
8% 11% 3% 7%
8% 12% 2% 4%
7% 11% 1% 5%
18-34 (n=1,041)
% Watched a Game on TV in the Past Year

© 2016 Ipsos 77
23%
20%
20%
15%
14%
10%
8%
6%
5%
Minnesota Vikings
Minnesota Twins
Minnesota Wild
University of Minnesota sports
Minnesota Timberwolves
Minnesota Lynx
Minnesota United Soccer
Minnesota auto racing
A rodeo
Base: All respondents E4. For each item indicate (a) if you have attended a game in the past year, (b) if you've watched a game on TV in the past year, and (c) if you regularly follow news articles/stories for that team.
Sports Entertainment Participation (continued)
BY SEGMENT
% Regularly Follow News Articles/Stories
Traditional Risk-Takers
(n=160) [E]
Social Trend-Surfers (n=305)
[F]
Tech-Dependent
Homebodies (n=277)
[G]
Rational Planners (n=298)
[H]
26% 26% 17% 24%
23% 21% 15% 24%
24% 24% 12% 23%
16% 20% 8% 16%
16% 22% 9% 12%
7% 16% 7% 10%
6% 13% 3% 8%
9% 9% 2% 4%
5% 12% - 3%
18-34 (n=1,041)
% Regularly Follow News Articles/Stories

© 2016 Ipsos 78
KEY TAKEAWAYS
© 2016 Ipsos 79
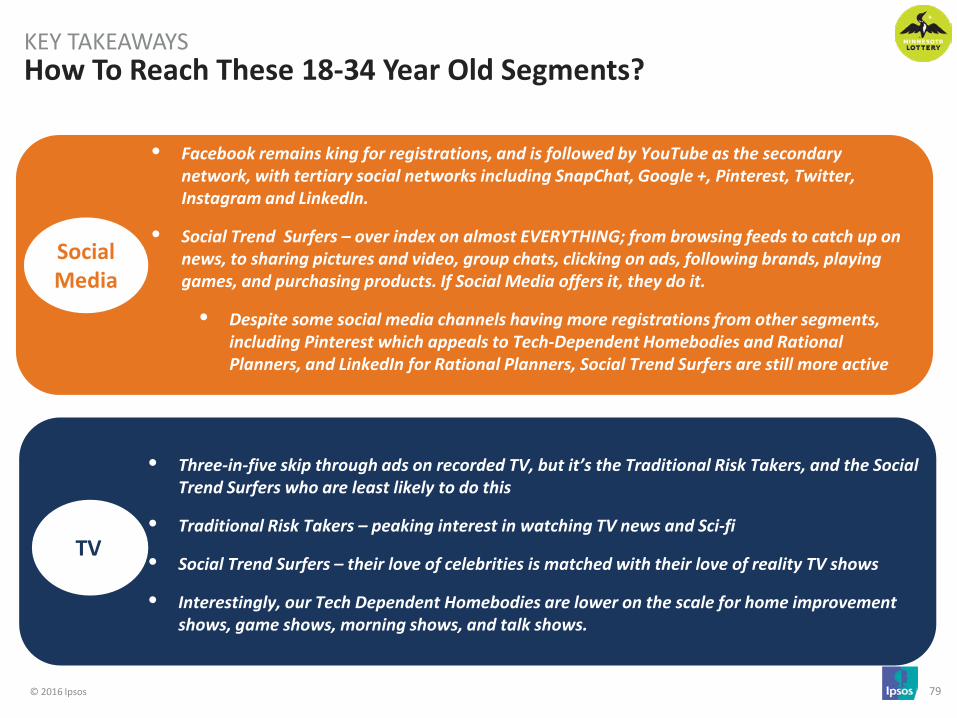
How To Reach These 18-34 Year Old Segments? KEY TAKEAWAYS
• Three-in-five skip through ads on recorded TV, but it’s the Traditional Risk Takers, and the Social Trend Surfers who are least likely to do this
• Traditional Risk Takers – peaking interest in watching TV news and Sci-fi
• Social Trend Surfers – their love of celebrities is matched with their love of reality TV shows
• Interestingly, our Tech Dependent Homebodies are lower on the scale for home improvement shows, game shows, morning shows, and talk shows.
• Facebook remains king for registrations, and is followed by YouTube as the secondary network, with tertiary social networks including SnapChat, Google +, Pinterest, Twitter, Instagram and LinkedIn.
• Social Trend Surfers – over index on almost EVERYTHING; from browsing feeds to catch up on news, to sharing pictures and video, group chats, clicking on ads, following brands, playing games, and purchasing products. If Social Media offers it, they do it.
• Despite some social media channels having more registrations from other segments, including Pinterest which appeals to Tech-Dependent Homebodies and Rational Planners, and LinkedIn for Rational Planners, Social Trend Surfers are still more active
Social Media
TV

© 2016 Ipsos 80
• While most still listen to traditional radio (AM/FM), in terms of the number of hours per day that 18-34 year olds are engaged, its streaming music that has greater concentration.
• Pandora use is prevalent for streaming radio, followed by Spotify. Where preference for Pandora is evident across most segments, Social Trend Surfers have similar levels of preference, shared between Pandora and Spotify.
• In terms of music preference, most are fans of Pop, but Social Trend Surfers are more interested in rock.
• The car is the most likely place to listen to the radio, with Rational Planners listening in the car on their way to work. Opportunities exist to reach both Traditional Risk Takers and Social Trend Surfers for late night radio opportunities, both during the weekdays and over the weekend.
• Convenience stores, big box outlets and Supermarkets are the most visited locations, with Traditional Risk Takers more partial to Convenience stores, while Social Trend Surfers and Tech-Dependent Homebodies more likely to visit Big Box Stores and Supermarkets.
• Tech Dependent Homebodies are not going to visit more niche, specialized stores such as independents, natural food locations, or farmers markets
• While the debit card followed by credit card is the most used form of payment, Rational Planners get out the credit card most often. For Traditional Risk Takers, the option of cash is also high
• Of all shopping, most is done in-store, with Traditional Risk Takers the least likely to shop online. Almost all shop online, but this trends higher among the Social Trend Surfers
• Gas at the pump is the domain of the Traditional Risk Taker
• Use of coupons is dependent upon access and convenience, with many preferring the option of electronic
Shopping
Radio
How To Reach These 18-34 Year Old Segments? KEY TAKEAWAYS
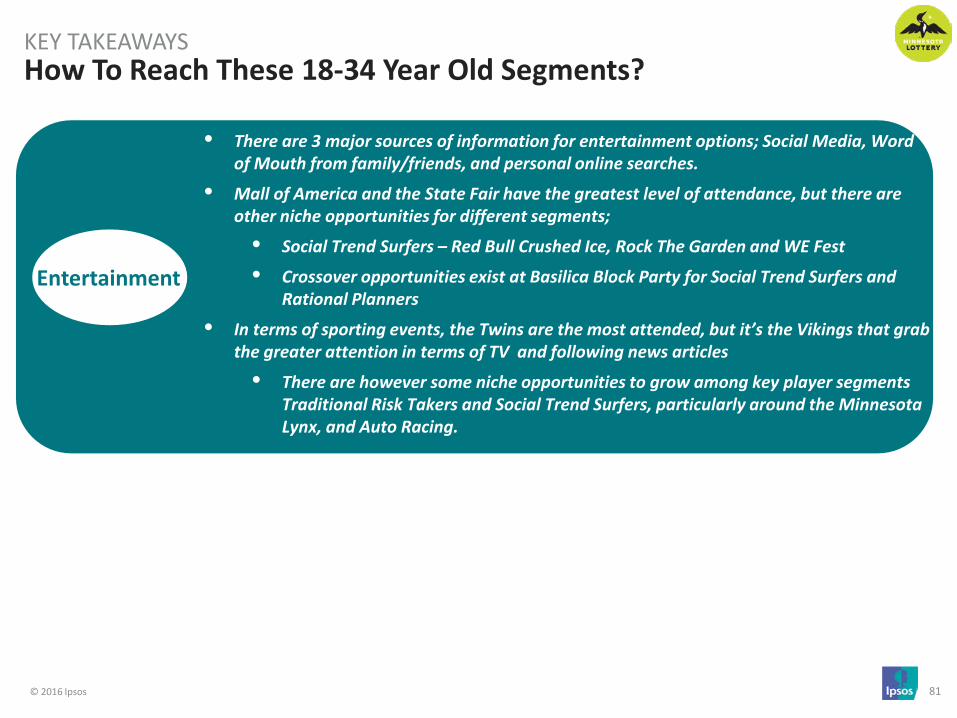
© 2016 Ipsos 81
The Untrained Cashiers have a heavy reliance on the Trained Cashiers, so without the Trained Cashiers issue resolution could be a concern when there are technical LX2.0 issues. Untrained Cashiers did not know what steps to take as it was not part of their training (if they received it) which could cause unnecessary delays. There’s also a risk of a breakdown in knowledge with LX2.0 if the Trained Cashiers were to ever leave the store/quit the company.
• There are 3 major sources of information for entertainment options; Social Media, Word of Mouth from family/friends, and personal online searches.
• Mall of America and the State Fair have the greatest level of attendance, but there are other niche opportunities for different segments;
• Social Trend Surfers – Red Bull Crushed Ice, Rock The Garden and WE Fest
• Crossover opportunities exist at Basilica Block Party for Social Trend Surfers and Rational Planners
• In terms of sporting events, the Twins are the most attended, but it’s the Vikings that grab the greater attention in terms of TV and following news articles
• There are however some niche opportunities to grow among key player segments Traditional Risk Takers and Social Trend Surfers, particularly around the Minnesota Lynx, and Auto Racing.
Entertainment
How To Reach These 18-34 Year Old Segments? KEY TAKEAWAYS
© 2016 Ipsos 82
Next Steps
Workshop
Business Plan
Collaborative effort to bring the segments to life
Incorporated in to ongoing tracking so the Lottery can monitor shifts in segment patterns and segment sizes over time
With support from Ipsos, The Lottery can use segments to target efforts and grow the business
Tracking

© 2016 Ipsos 83
JASON ALLSOPP VICE PRESIDENT
DARCEN ESAU
ASSOCIATE VICE PRESIDENT
ROSE WONG
RESEARCH MANAGER
PAUL LAUZON SENIOR VICE PRESIDENT
THANK YOU