Minnesota Housing Assistance for Seniors · Housing Assistance for Older Minnesotans 1 Summary...
21
Housing Assistance for Older Minnesotans 1 Housing Assistance for Older Minnesotans Fall 2012 Planning, Research & Evaluation
Transcript of Minnesota Housing Assistance for Seniors · Housing Assistance for Older Minnesotans 1 Summary...
Housing Assistance for Older Minnesotans
1
Housing Assistance for Older Minnesotans
Fall 2012
Planning, Research & Evaluation

Housing Assistance for Older Minnesotans
1
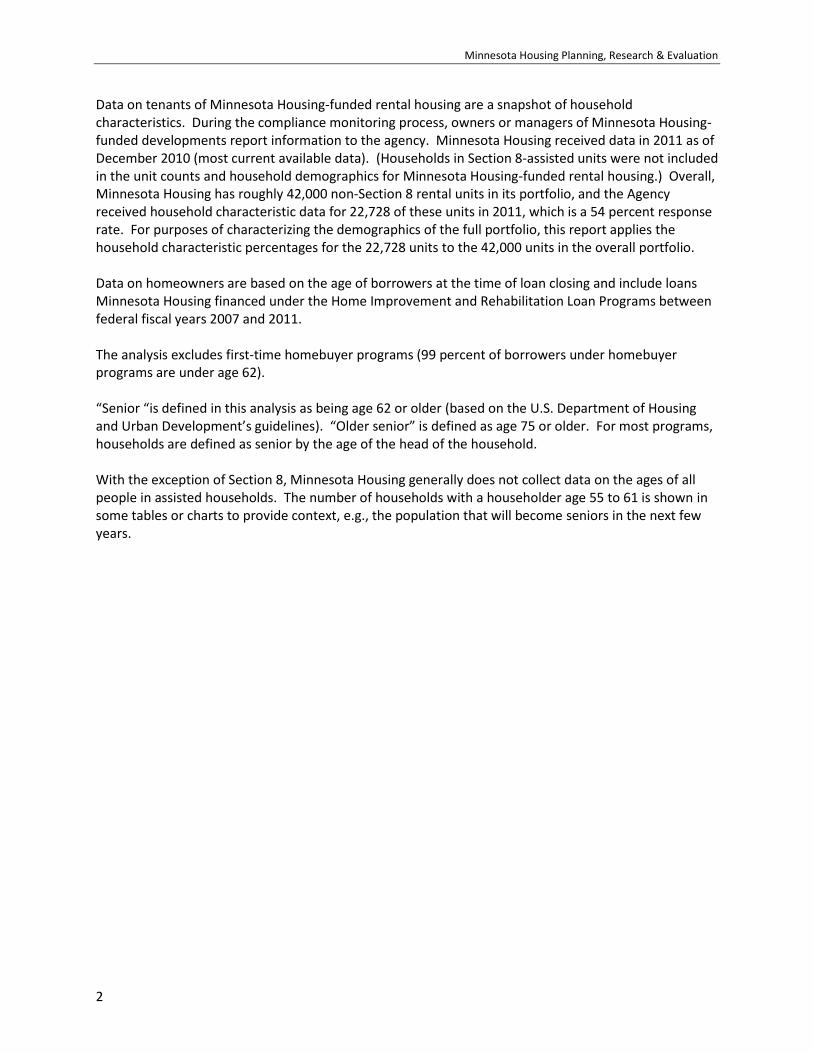
Summary Minnesota Housing serves low- and moderate-income seniors through a variety of housing assistance programs that traditionally have not been age restricted. The purpose of this report is to document the extent to which Minnesota Housing serves older households through programs that provide affordable rental housing to tenants and home improvement/rehabilitation loans to homeowners. Currently, 35.8 percent of lower-income households (less than $50,000 annually) in Minnesota have a household head that is age 62 or older. Even without targeting resources to seniors, a relatively high proportion of Minnesota Housing assistance goes to seniors:
Section 8 rental housing – 13,400 senior households annually, or 45 percent of assisted households
Minnesota Housing-funded non-Section 8 rental housing – 6,200 senior households annually, or 15 percent of assisted households
Rehabilitation loans to homeowners – nearly 500 senior households every five years, or 34 percent of Minnesota Housing borrowers
Home improvement loans to homeowners – 1,000 senior households every five years, or 13 percent of Minnesota Housing borrowers
With these programs over a five year period, Minnesota Housing assisted about 21,100 households1, which represents 4.0 percent of the state’s 533,800 senior households (household head age 62+) and 6.3% of the state’s 336,965 lower-income senior households. Finding the most suitable housing options to meet the physical and financial needs of seniors requires that the Agency have a range of options from which to choose. From helping older homeowners remain in their homes through improvement/rehabilitation loans that increase accessibility to assisting senior tenants to age in place through service-enriched rental housing, Minnesota Housing can assist in providing and broadening their housing options. As a starting point, this report examines how Minnesota currently assists seniors. In the effort to remain responsive to the changing housing needs of low- and moderate-income seniors, Minnesota Housing will continue to consider new approaches that might better serve them.
Background and Methodology This analysis includes data on: 1) tenants of Minnesota Housing-funded rental housing in 2010 (reported in 2011); 2) Section 8-assisted households (project-based assistance) as of September 2012; and 3) Minnesota Housing-funded households assisted between 2007 and 2011 under home improvement and rehabilitation programs for homeowners.
1 The total represents the number of households assisted by the rental programs in one year and the home
improvement/rehabilitation programs over five years. Rental tenants typically stay in these units for several years or more, while the home improvement/rehabilitation loans finance one-time projects. Thus, the rental programs typically serve the same households over the five year period, while the home improvement/rehabilitation programs serve different households each year.
Minnesota Housing Planning, Research & Evaluation
2
Data on tenants of Minnesota Housing-funded rental housing are a snapshot of household characteristics. During the compliance monitoring process, owners or managers of Minnesota Housing-funded developments report information to the agency. Minnesota Housing received data in 2011 as of December 2010 (most current available data). (Households in Section 8-assisted units were not included in the unit counts and household demographics for Minnesota Housing-funded rental housing.) Overall, Minnesota Housing has roughly 42,000 non-Section 8 rental units in its portfolio, and the Agency received household characteristic data for 22,728 of these units in 2011, which is a 54 percent response rate. For purposes of characterizing the demographics of the full portfolio, this report applies the household characteristic percentages for the 22,728 units to the 42,000 units in the overall portfolio. Data on homeowners are based on the age of borrowers at the time of loan closing and include loans Minnesota Housing financed under the Home Improvement and Rehabilitation Loan Programs between federal fiscal years 2007 and 2011. The analysis excludes first-time homebuyer programs (99 percent of borrowers under homebuyer programs are under age 62). “Senior “is defined in this analysis as being age 62 or older (based on the U.S. Department of Housing and Urban Development’s guidelines). “Older senior” is defined as age 75 or older. For most programs, households are defined as senior by the age of the head of the household. With the exception of Section 8, Minnesota Housing generally does not collect data on the ages of all people in assisted households. The number of households with a householder age 55 to 61 is shown in some tables or charts to provide context, e.g., the population that will become seniors in the next few years.
Housing Assistance for Older Minnesotans
3
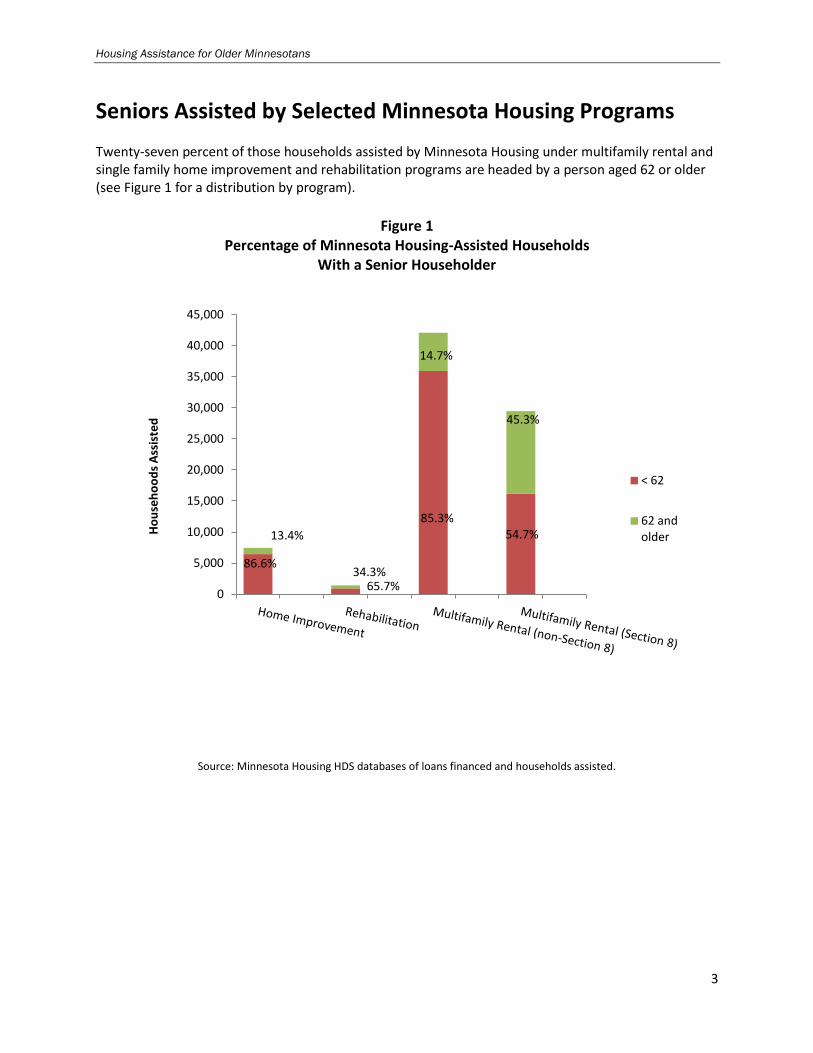
Seniors Assisted by Selected Minnesota Housing Programs Twenty-seven percent of those households assisted by Minnesota Housing under multifamily rental and single family home improvement and rehabilitation programs are headed by a person aged 62 or older (see Figure 1 for a distribution by program).
Figure 1
Percentage of Minnesota Housing-Assisted Households With a Senior Householder
Source: Minnesota Housing HDS databases of loans financed and households assisted.
86.6%
65.7%
85.3% 54.7% 13.4%
34.3%
14.7%
45.3%
0
5,000
10,000
15,000
20,000
25,000
30,000
35,000
40,000
45,000
Ho
use
ho
od
s A
ssis
ted
< 62
62 and older
Minnesota Housing Planning, Research & Evaluation
4
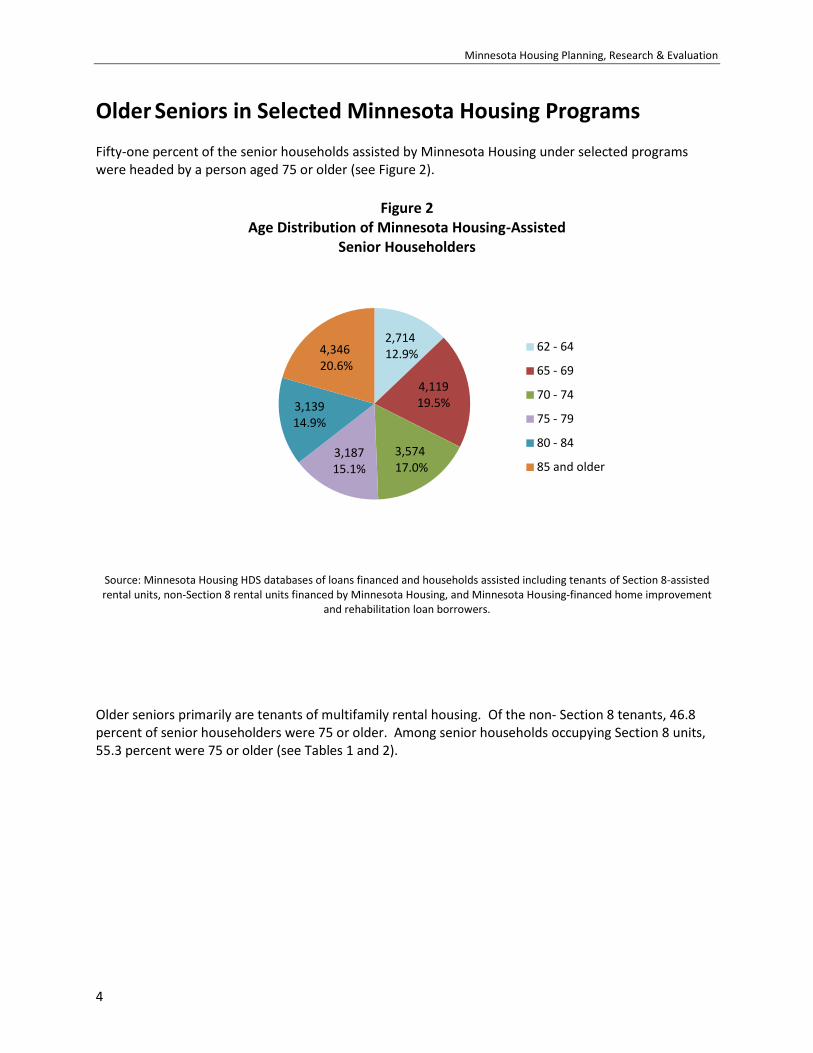
Older Seniors in Selected Minnesota Housing Programs Fifty-one percent of the senior households assisted by Minnesota Housing under selected programs were headed by a person aged 75 or older (see Figure 2).
Figure 2
Age Distribution of Minnesota Housing-Assisted Senior Householders
Source: Minnesota Housing HDS databases of loans financed and households assisted including tenants of Section 8-assisted rental units, non-Section 8 rental units financed by Minnesota Housing, and Minnesota Housing-financed home improvement
and rehabilitation loan borrowers.
Older seniors primarily are tenants of multifamily rental housing. Of the non- Section 8 tenants, 46.8 percent of senior householders were 75 or older. Among senior households occupying Section 8 units, 55.3 percent were 75 or older (see Tables 1 and 2).
2,714 12.9%
4,119 19.5%
3,574 17.0%
3,187 15.1%
3,139 14.9%
4,346 20.6%
62 - 64
65 - 69
70 - 74
75 - 79
80 - 84
85 and older
Housing Assistance for Older Minnesotans
5
Multifamily Programs Multifamily programs serve the greatest number of older Minnesotans among all Minnesota Housing programs—over 19,000 senior households each year.
Minnesota Housing administers Housing Assistance Payments for approximately 30,000 households in Section 8 housing. Under U.S. Department of Housing and Urban Development (HUD) rules, the tenant of a Section 8 unit pays no more than 30 percent of household income for rent; HUD pays the difference between the tenant‘s payment and the total rent for the unit.
o As of September 2012, 45 percent of all households receiving Section 8 project-based assistance were seniors.
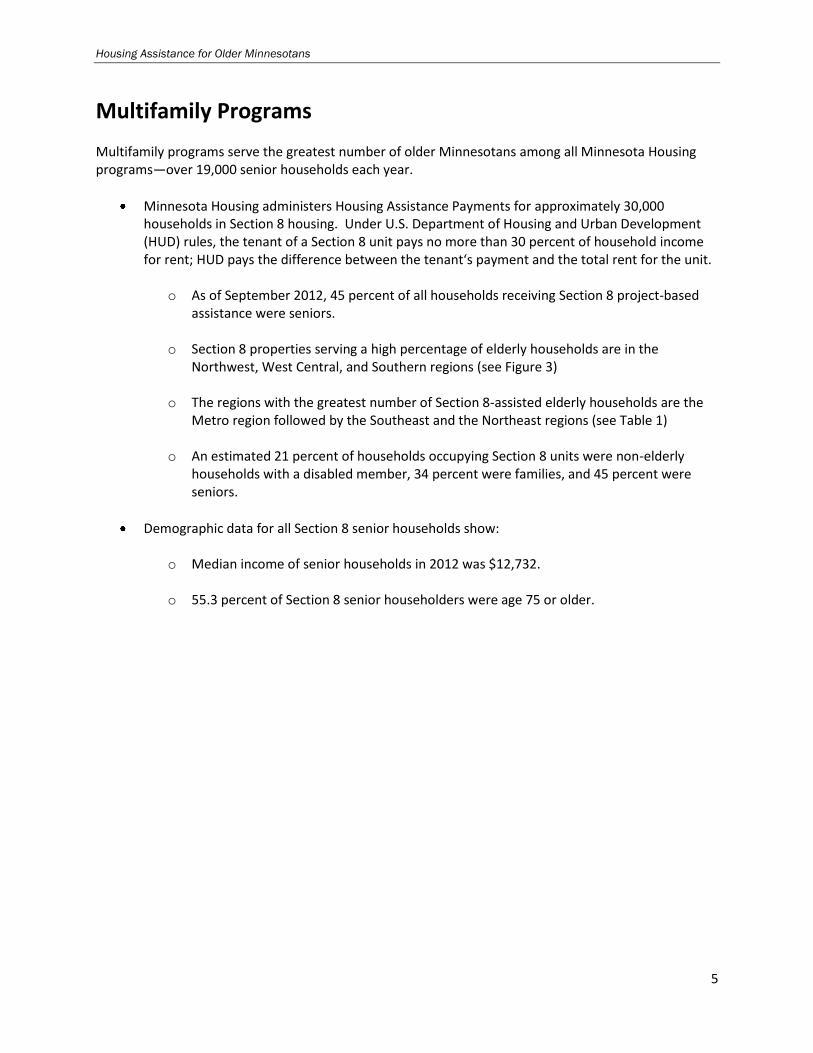
o Section 8 properties serving a high percentage of elderly households are in the
Northwest, West Central, and Southern regions (see Figure 3)
o The regions with the greatest number of Section 8-assisted elderly households are the Metro region followed by the Southeast and the Northeast regions (see Table 1)
o An estimated 21 percent of households occupying Section 8 units were non-elderly
households with a disabled member, 34 percent were families, and 45 percent were seniors.
Demographic data for all Section 8 senior households show:
o Median income of senior households in 2012 was $12,732.
o 55.3 percent of Section 8 senior householders were age 75 or older.
Minnesota Housing Planning, Research & Evaluation
6
Figure 3 Share of Section 8 Householders Who are Age 62 or Older, by County
Housing Assistance for Older Minnesotans
7
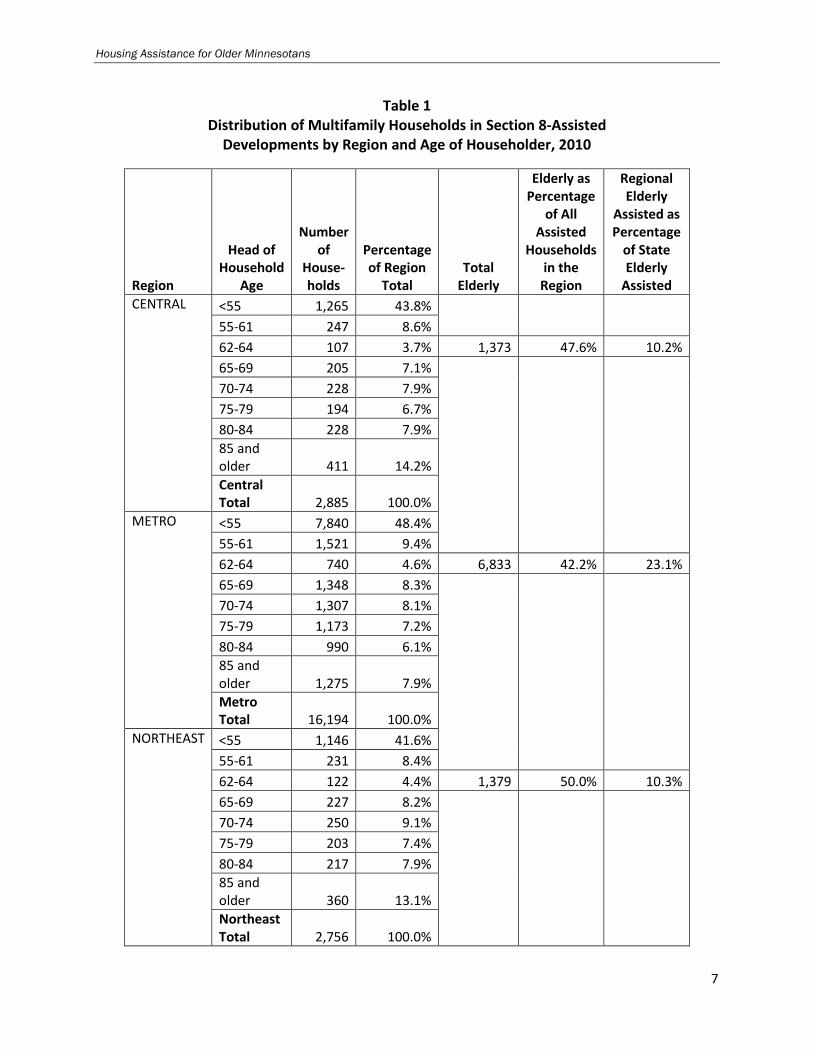
Table 1 Distribution of Multifamily Households in Section 8-Assisted
Developments by Region and Age of Householder, 2010
Region
Head of Household
Age
Number of
House-holds
Percentage of Region
Total Total
Elderly
Elderly as Percentage
of All Assisted
Households in the
Region
Regional Elderly
Assisted as Percentage
of State Elderly
Assisted
CENTRAL <55 1,265 43.8%
55-61 247 8.6%
62-64 107 3.7% 1,373 47.6% 10.2%
65-69 205 7.1%
70-74 228 7.9%
75-79 194 6.7%
80-84 228 7.9%
85 and older 411 14.2%
Central Total 2,885 100.0%
METRO <55 7,840 48.4%
55-61 1,521 9.4%
62-64 740 4.6% 6,833 42.2% 23.1%
65-69 1,348 8.3%
70-74 1,307 8.1%
75-79 1,173 7.2%
80-84 990 6.1%
85 and older 1,275 7.9%
Metro Total 16,194 100.0%
NORTHEAST <55 1,146 41.6%
55-61 231 8.4%
62-64 122 4.4% 1,379 50.0% 10.3%
65-69 227 8.2%
70-74 250 9.1%
75-79 203 7.4%
80-84 217 7.9%
85 and older 360 13.1%
Northeast Total 2,756 100.0%

Minnesota Housing Planning, Research & Evaluation
8
Table 1 Distribution of Multifamily Households in Section 8-Assisted
Developments by Region and Age of Householder, 2010
Region
Head of Household
Age
Number of
House-holds
Percentage of Region
Total Total
Elderly
Elderly as Percentage
of All Assisted
Households in the
Region
Regional Elderly
Assisted as Percentage
of State Elderly
Assisted
NORTHWEST <55 298 31.9%
55-61 78 8.3%
62-64 30 3.2% 559 59.8% 4.2%
65-69 70 7.5%
70-74 67 7.2%
75-79 99 10.6%
80-84 106 11.3%
85 and older 187 20.0%
Northwest Total 935 100.0%
SOUTHEAST <55 1,856 43.5%
55-61 437 10.3%
62-64 215 5.0% 1,969 46.2% 14.7%
65-69 344 8.1%
70-74 285 6.7%
75-79 302 7.1%
80-84 310 7.3%
85 and older 513 12.0%
Southeast Total 4,262 100.0%
SOUTHWEST <55 619 43.0%
55-61 138 9.6%
62-64 47 3.3% 682 47.4% 5.1%
65-69 101 7.0%
70-74 91 6.3%
75-79 83 5.8%
80-84 128 8.9%
85 and older 232 16.1%
Southwest Total 1,439 100.0%
Housing Assistance for Older Minnesotans
9
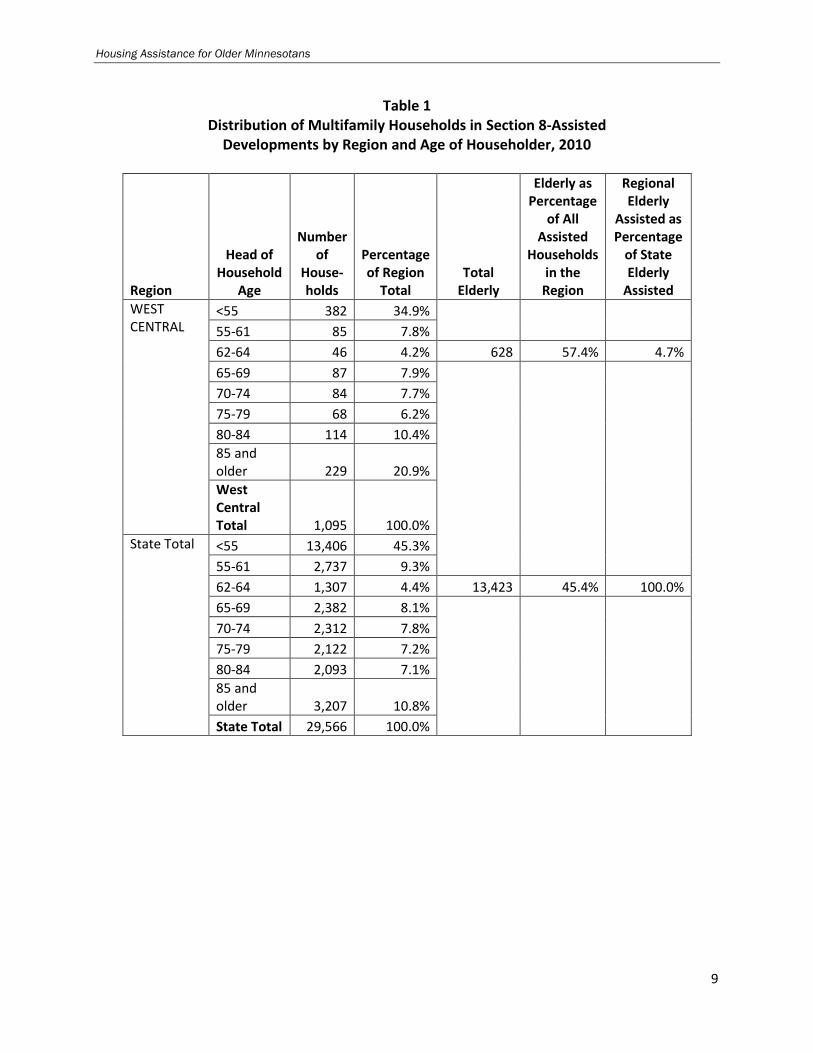
Table 1 Distribution of Multifamily Households in Section 8-Assisted
Developments by Region and Age of Householder, 2010
Region
Head of Household
Age
Number of
House-holds
Percentage of Region
Total Total
Elderly
Elderly as Percentage
of All Assisted
Households in the
Region
Regional Elderly
Assisted as Percentage
of State Elderly
Assisted
WEST CENTRAL
<55 382 34.9%
55-61 85 7.8%
62-64 46 4.2% 628 57.4% 4.7%
65-69 87 7.9%
70-74 84 7.7%
75-79 68 6.2%
80-84 114 10.4%
85 and older 229 20.9%
West Central Total 1,095 100.0%
State Total <55 13,406 45.3%
55-61 2,737 9.3%
62-64 1,307 4.4% 13,423 45.4% 100.0%
65-69 2,382 8.1%
70-74 2,312 7.8%
75-79 2,122 7.2%
80-84 2,093 7.1%
85 and older 3,207 10.8%
State Total 29,566 100.0%
Minnesota Housing Planning, Research & Evaluation
10
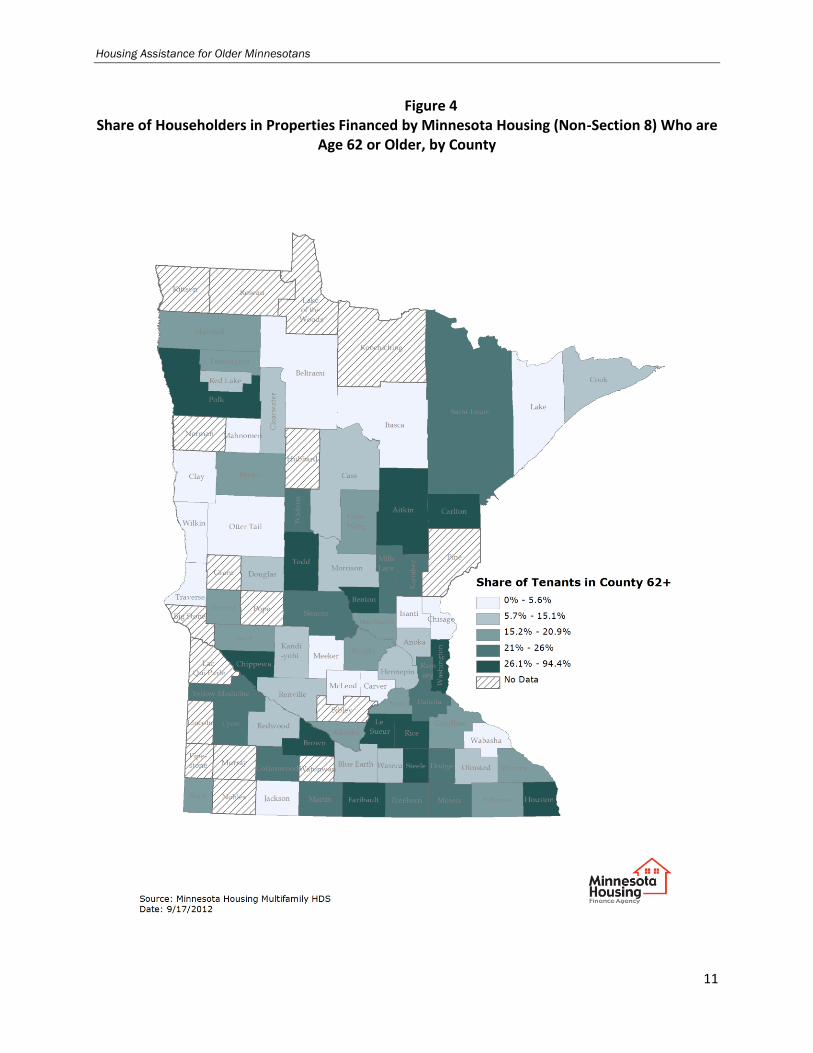
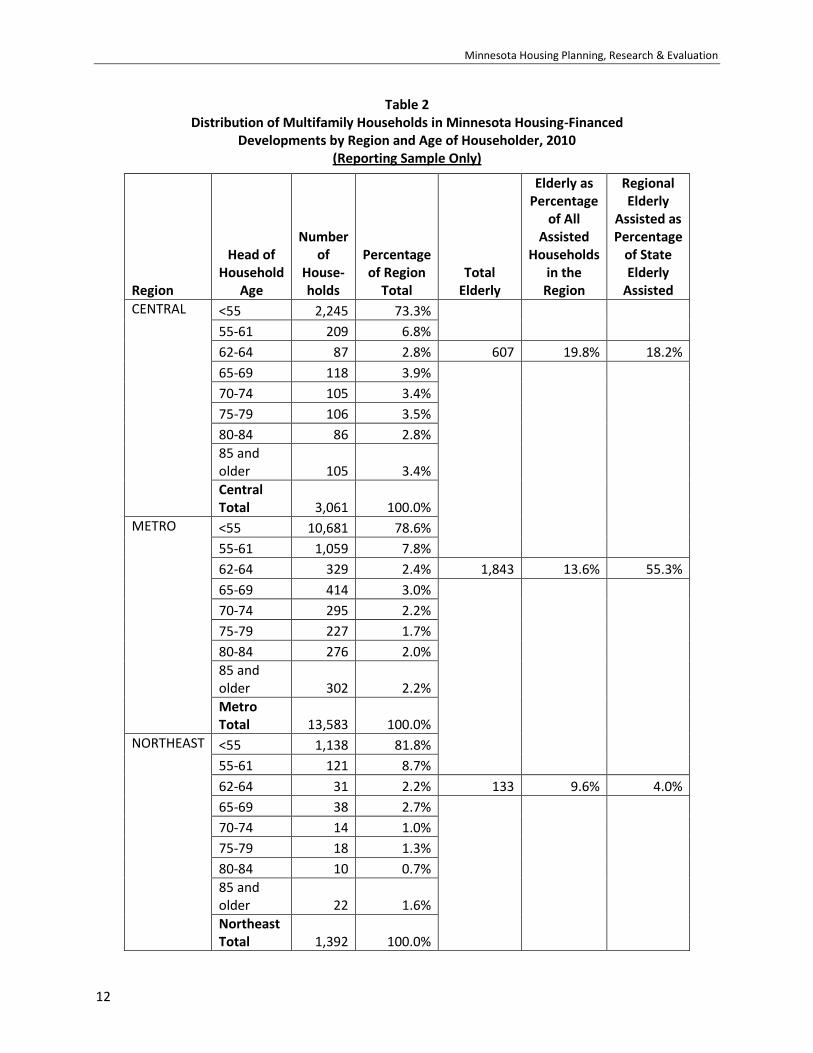
In addition to administering Section 8 Housing Assistance Payments, Minnesota Housing provides permanent mortgage financing and gap funds for the development of affordable rental housing. During the process of monitoring for compliance with program rules, property owners report annually on the characteristics of households occupying these rental units. Of the households in Minnesota Housing-funded developments (non-Section 8) reporting in 2011, 14.7 percent were headed by a senior. Demographics of senior households in non-Section 8 Minnesota Housing-financed developments show:
o Median household income was $15,160.2
o 46.8 percent of senior householders were 75 or older.
o Ninety-seven percent included only one or two household members.
o Properties serving a high percentage of elderly households are in the Central and Southeast regions (see Figure 4).
o The regions with the greatest number of assisted elderly households are the Metro
region followed by the Central and the Southeast regions (see Table 2).
Eighty-four percent of the Minnesota Housing-financed units occupied by seniors were in developments that received housing tax credit allocations.
2 2009.2010 move-ins
Housing Assistance for Older Minnesotans
11
Figure 4 Share of Householders in Properties Financed by Minnesota Housing (Non-Section 8) Who are
Age 62 or Older, by County
Minnesota Housing Planning, Research & Evaluation
12
Table 2 Distribution of Multifamily Households in Minnesota Housing-Financed
Developments by Region and Age of Householder, 2010 (Reporting Sample Only)
Region
Head of Household
Age
Number of
House-holds
Percentage of Region
Total Total
Elderly
Elderly as Percentage
of All Assisted
Households in the
Region
Regional Elderly
Assisted as Percentage
of State Elderly
Assisted
CENTRAL <55 2,245 73.3%
55-61 209 6.8%
62-64 87 2.8% 607 19.8% 18.2%
65-69 118 3.9%
70-74 105 3.4%
75-79 106 3.5%
80-84 86 2.8%
85 and older 105 3.4%
Central Total 3,061 100.0%
METRO <55 10,681 78.6%
55-61 1,059 7.8%
62-64 329 2.4% 1,843 13.6% 55.3%
65-69 414 3.0%
70-74 295 2.2%
75-79 227 1.7%
80-84 276 2.0%
85 and older 302 2.2%
Metro Total 13,583 100.0%
NORTHEAST <55 1,138 81.8%
55-61 121 8.7%
62-64 31 2.2% 133 9.6% 4.0%
65-69 38 2.7%
70-74 14 1.0%
75-79 18 1.3%
80-84 10 0.7%
85 and older 22 1.6%
Northeast Total 1,392 100.0%
Housing Assistance for Older Minnesotans
13
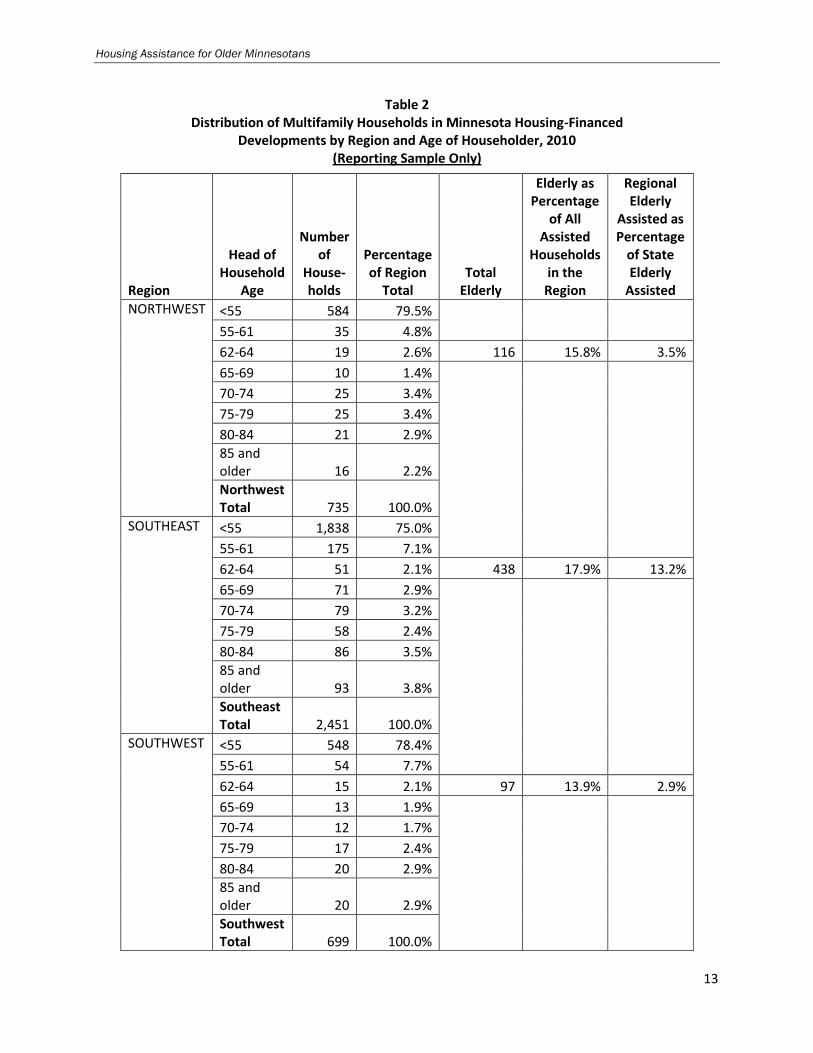
Table 2 Distribution of Multifamily Households in Minnesota Housing-Financed
Developments by Region and Age of Householder, 2010 (Reporting Sample Only)
Region
Head of Household
Age
Number of
House-holds
Percentage of Region
Total Total
Elderly
Elderly as Percentage
of All Assisted
Households in the
Region
Regional Elderly
Assisted as Percentage
of State Elderly
Assisted
NORTHWEST <55 584 79.5%
55-61 35 4.8%
62-64 19 2.6% 116 15.8% 3.5%
65-69 10 1.4%
70-74 25 3.4%
75-79 25 3.4%
80-84 21 2.9%
85 and older 16 2.2%
Northwest Total 735 100.0%
SOUTHEAST <55 1,838 75.0%
55-61 175 7.1%
62-64 51 2.1% 438 17.9% 13.2%
65-69 71 2.9%
70-74 79 3.2%
75-79 58 2.4%
80-84 86 3.5%
85 and older 93 3.8%
Southeast Total 2,451 100.0%
SOUTHWEST <55 548 78.4%
55-61 54 7.7%
62-64 15 2.1% 97 13.9% 2.9%
65-69 13 1.9%
70-74 12 1.7%
75-79 17 2.4%
80-84 20 2.9%
85 and older 20 2.9%
Southwest Total 699 100.0%
Minnesota Housing Planning, Research & Evaluation
14
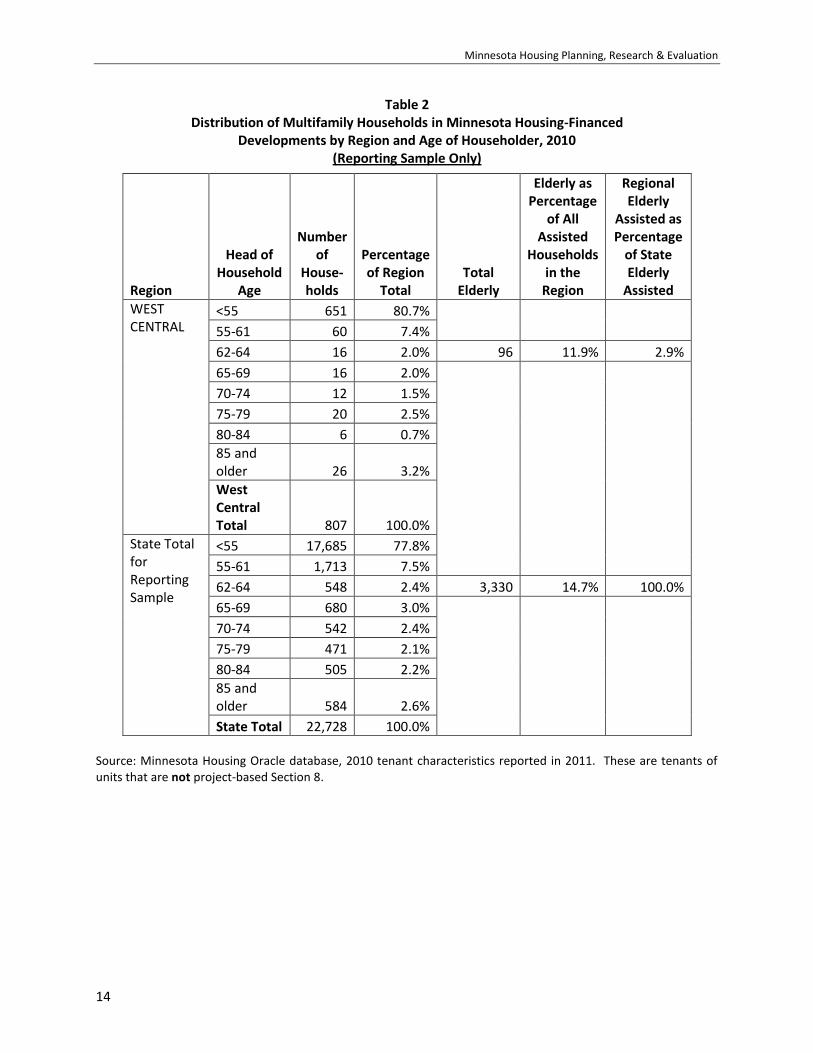
Table 2 Distribution of Multifamily Households in Minnesota Housing-Financed
Developments by Region and Age of Householder, 2010 (Reporting Sample Only)
Region
Head of Household
Age
Number of
House-holds
Percentage of Region
Total Total
Elderly
Elderly as Percentage
of All Assisted
Households in the
Region
Regional Elderly
Assisted as Percentage
of State Elderly
Assisted
WEST CENTRAL
<55 651 80.7%
55-61 60 7.4%
62-64 16 2.0% 96 11.9% 2.9%
65-69 16 2.0%
70-74 12 1.5%
75-79 20 2.5%
80-84 6 0.7%
85 and older 26 3.2%
West Central Total 807 100.0%
State Total for Reporting Sample
<55 17,685 77.8%
55-61 1,713 7.5%
62-64 548 2.4% 3,330 14.7% 100.0%
65-69 680 3.0%
70-74 542 2.4%
75-79 471 2.1%
80-84 505 2.2%
85 and older 584 2.6%
State Total 22,728 100.0%
Source: Minnesota Housing Oracle database, 2010 tenant characteristics reported in 2011. These are tenants of units that are not project-based Section 8.
Minnesota Housing Assistance for Seniors
15
Single Family Programs Minnesota Housing provides affordable home improvement financing to qualified borrowers to improve the property they occupy, increase its accessibility to a disabled occupant, or increase its energy efficiency. The Home Improvement Program provides general home improvement financing, and the Rehabilitation Loan Program provides deferred funding to homeowners to make basic repairs that directly affect the safety, habitability, energy efficiency or accessibility of their homes. To achieve a meaningful sample size from which to identify borrower characteristics under these programs, we reviewed records of loans that Minnesota Housing financed from federal fiscal year 2007 through 2011. Of the two programs reviewed, the Home Improvement Program served the greatest number of seniors while the Rehabilitation Loan Program served the greatest percentage of seniors.
Demographics of Home Improvement borrowers:
o One thousand home improvement loans financed by Minnesota Housing were to senior borrowers (13.4 percent of the nearly 7,500 loans financed).
o The median income of households with borrowers age 62 or older was $46,160; age 75 or older was $33,376.
o Ninety-five percent of senior households included only one or two members.
Demographics of Rehabilitation Loan borrowers:
o Nearly 500 rehabilitation loans financed by Minnesota Housing were to senior borrowers (34.3 percent of more than 1,400 loans financed).
o The median household income of borrowers age 62 or older was $12,772; age 75 or older was $12,540.
o Ninety-six percent of senior households included only one or two members.
o Of the Rehabilitation Loan Program borrowers who were seniors, 37.9 percent were 75 or older.
o Of the Rehabilitation Loan Program borrowers who were seniors, 18.6 were identified as
being disabled.
o Under the Emergency & Accessibility Loan (EAL) component of the Rehabilitation Loan Program, qualifying owners may make emergency repairs to their property or modifications that increase its accessibility to a disabled occupant. The greatest proportion of all home improvement and rehabilitation loan borrowers who were seniors received EAL—39.4 percent of EAL borrowers were age 62 or older.
Minnesota Housing Planning, Analysis & Evaluation
16
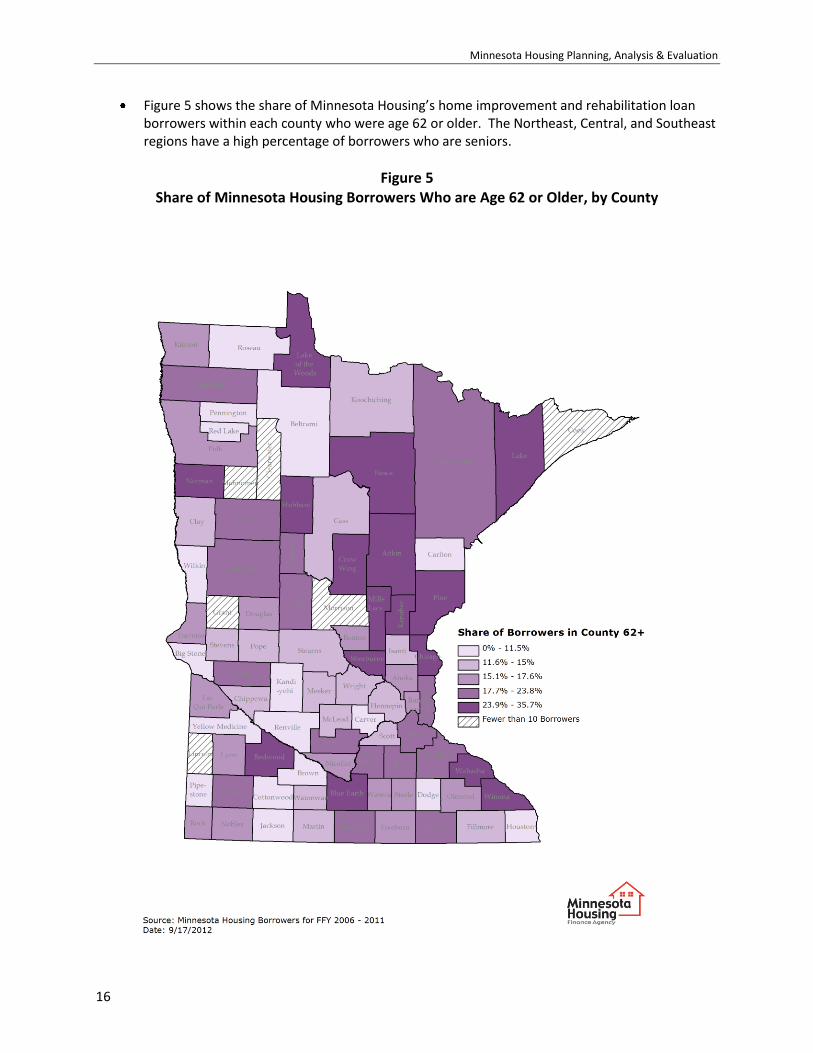
Figure 5 shows the share of Minnesota Housing’s home improvement and rehabilitation loan borrowers within each county who were age 62 or older. The Northeast, Central, and Southeast regions have a high percentage of borrowers who are seniors.
Figure 5 Share of Minnesota Housing Borrowers Who are Age 62 or Older, by County
Minnesota Housing Assistance for Seniors
17
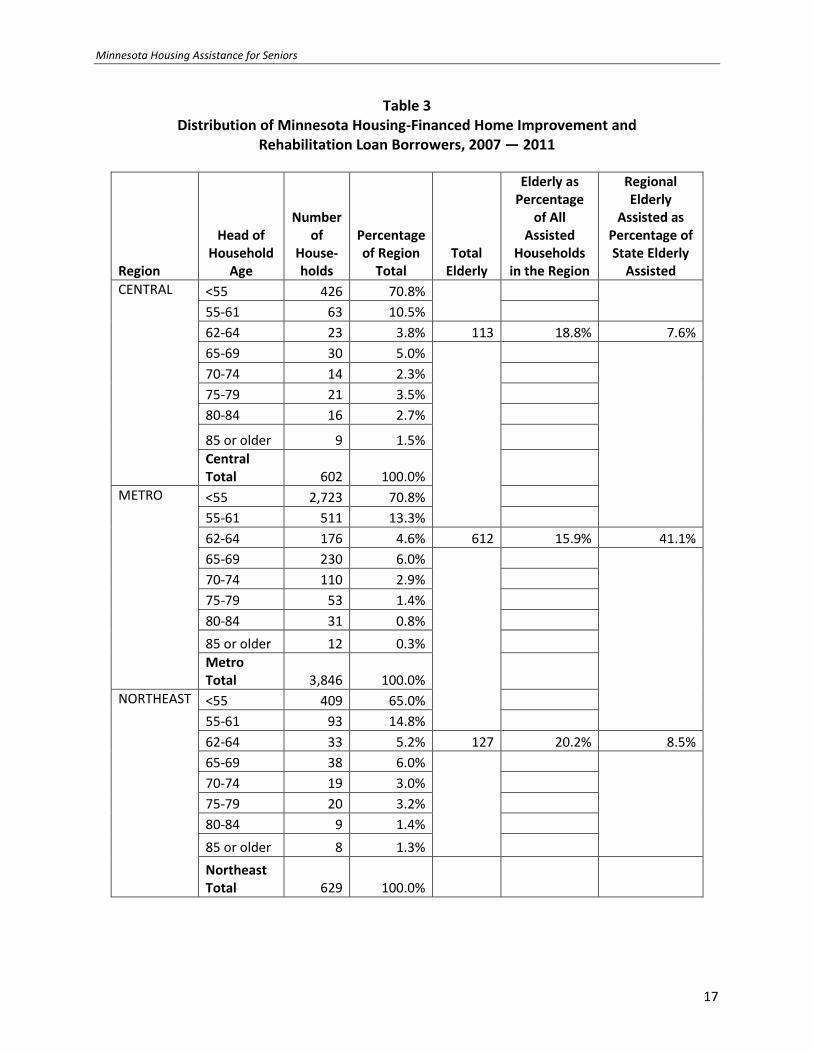
Table 3 Distribution of Minnesota Housing-Financed Home Improvement and
Rehabilitation Loan Borrowers, 2007 — 2011
Region
Head of Household
Age
Number of
House-holds
Percentage of Region
Total Total
Elderly
Elderly as Percentage
of All Assisted
Households in the Region
Regional Elderly
Assisted as Percentage of State Elderly
Assisted
CENTRAL <55 426 70.8%
55-61 63 10.5%
62-64 23 3.8% 113 18.8% 7.6%
65-69 30 5.0%
70-74 14 2.3%
75-79 21 3.5%
80-84 16 2.7%
85 or older 9 1.5%
Central Total 602 100.0%
METRO <55 2,723 70.8%
55-61 511 13.3%
62-64 176 4.6% 612 15.9% 41.1%
65-69 230 6.0%
70-74 110 2.9%
75-79 53 1.4%
80-84 31 0.8%
85 or older 12 0.3%
Metro Total 3,846 100.0%
NORTHEAST <55 409 65.0%
55-61 93 14.8%
62-64 33 5.2% 127 20.2% 8.5%
65-69 38 6.0%
70-74 19 3.0%
75-79 20 3.2%
80-84 9 1.4%
85 or older 8 1.3%
Northeast Total 629 100.0%
Minnesota Housing Planning, Analysis & Evaluation
18
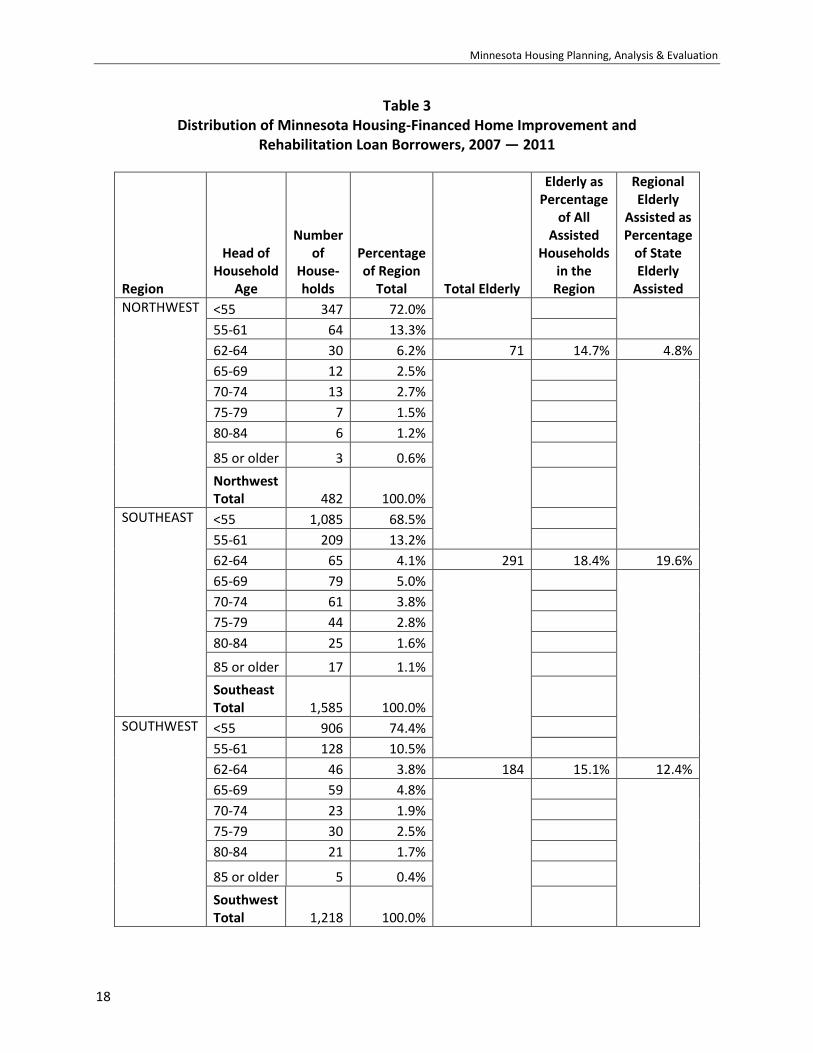
Table 3 Distribution of Minnesota Housing-Financed Home Improvement and
Rehabilitation Loan Borrowers, 2007 — 2011
Region
Head of Household
Age
Number of
House-holds
Percentage of Region
Total Total Elderly
Elderly as Percentage
of All Assisted
Households in the
Region
Regional Elderly
Assisted as Percentage
of State Elderly
Assisted
NORTHWEST <55 347 72.0%
55-61 64 13.3%
62-64 30 6.2% 71 14.7% 4.8%
65-69 12 2.5%
70-74 13 2.7%
75-79 7 1.5%
80-84 6 1.2%
85 or older 3 0.6%
Northwest Total 482 100.0%
SOUTHEAST <55 1,085 68.5%
55-61 209 13.2%
62-64 65 4.1% 291 18.4% 19.6%
65-69 79 5.0%
70-74 61 3.8%
75-79 44 2.8%
80-84 25 1.6%
85 or older 17 1.1%
Southeast Total 1,585 100.0%
SOUTHWEST <55 906 74.4%
55-61 128 10.5%
62-64 46 3.8% 184 15.1% 12.4%
65-69 59 4.8%
70-74 23 1.9%
75-79 30 2.5%
80-84 21 1.7%
85 or older 5 0.4%
Southwest Total 1,218 100.0%
Minnesota Housing Assistance for Seniors
19
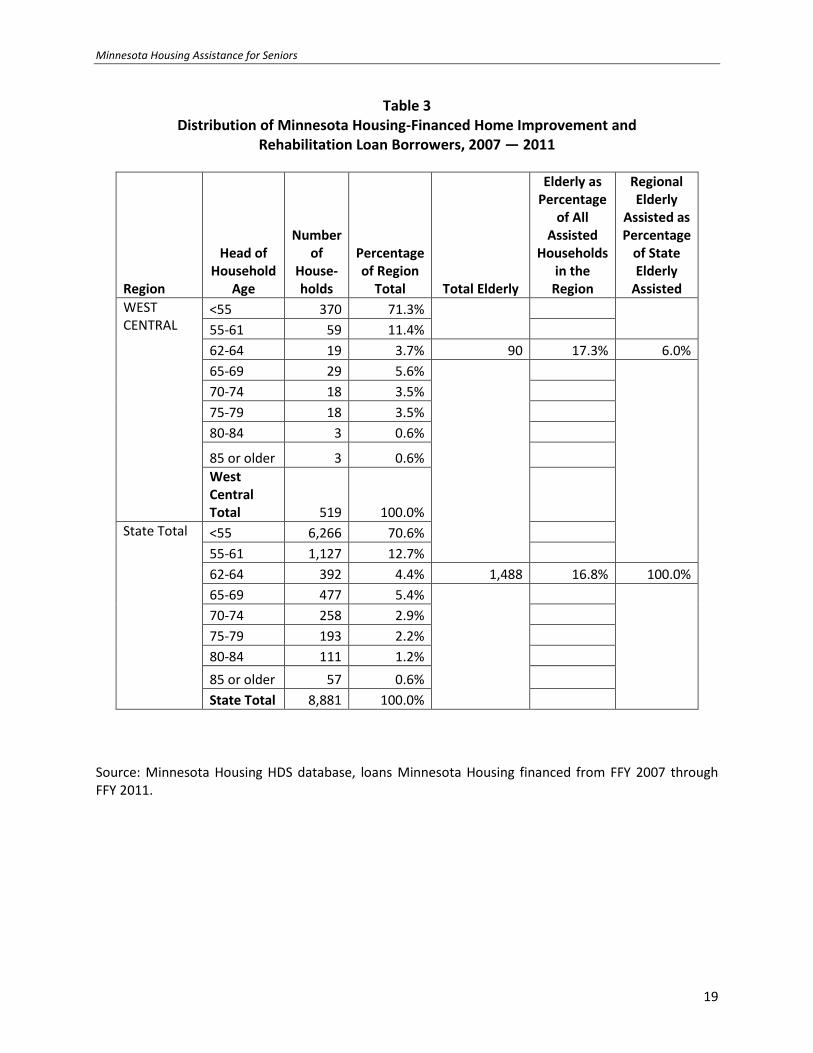
Table 3 Distribution of Minnesota Housing-Financed Home Improvement and
Rehabilitation Loan Borrowers, 2007 — 2011
Region
Head of Household
Age
Number of
House-holds
Percentage of Region
Total Total Elderly
Elderly as Percentage
of All Assisted
Households in the
Region
Regional Elderly
Assisted as Percentage
of State Elderly
Assisted
WEST CENTRAL
<55 370 71.3%
55-61 59 11.4%
62-64 19 3.7% 90 17.3% 6.0%
65-69 29 5.6%
70-74 18 3.5%
75-79 18 3.5%
80-84 3 0.6%
85 or older 3 0.6%
West Central Total 519 100.0%
State Total <55 6,266 70.6%
55-61 1,127 12.7%
62-64 392 4.4% 1,488 16.8% 100.0%
65-69 477 5.4%
70-74 258 2.9%
75-79 193 2.2%
80-84 111 1.2%
85 or older 57 0.6%
State Total 8,881 100.0%
Source: Minnesota Housing HDS database, loans Minnesota Housing financed from FFY 2007 through FFY 2011.