
Mining Taxation: An Application to Mali - imf.org · Mining Taxation: An Application to Mali...
24
Mining Taxation: An Application to Mali Saji Thomas WP/10/126
Transcript of Mining Taxation: An Application to Mali - imf.org · Mining Taxation: An Application to Mali...
Mining Taxation: An Application to Mali
Saji Thomas
WP/10/126

© 2010 International Monetary Fund WP/10/126 IMF Working Paper African Department
Mining Taxation: An Application to Mali
Prepared by Saji Thomas1
Authorized for distribution by Brian Ames
May 2010
Abstract This Working Paper should not be reported as representing the views of the IMF. The views expressed in this Working Paper are those of the author and do not necessarily represent those of the IMF or IMF policy. Working Papers describe research in progress by the authors and are published to elicit comments and to further debate.
Mali’s gold sector is an enclave with weak forward and backward linkages with the rest of the economy. Given the predominance of the fiscal transmission channel, it is important that the design of the mineral tax regime gives the state a fair share of the benefits. Using optimal control theory, this paper estimates that the optimal royalty tax in Mali is about 3.5 percent. By reducing the royalty rate from 6 percent to 3 percent, Mali’s mining code broadly ensures that the risk is shared between the state and mining companies, provides sufficient incentives to attract new exploration, and is comparable to the fiscal regimes in other sub-Saharan African countries in its mix of tax instruments and tax structure. JEL Classification Numbers: H20, Q32, O55 Keywords: Gold, Mining, Taxation, Mali Author’s E-Mail Address: [email protected]
1 The author gratefully acknowledges useful comments from Messrs. Ames, Anayiotos, Camard, Mills, and Wane; and seminar participants in Mali.

2
Contents Page
I. Introduction ..................................................................................................................... 3 A. Mali’s Gold Sector .......................................................................................... 3 B. Macroeconomic Impact of the Gold Sector .................................................... 4 C. Backward Linkages with the Rest of Economy .............................................. 6
II. Mining Taxation in Mali ................................................................................................. 8 A. A Basic Model ................................................................................................ 9 B. Mineral Tax Instruments ............................................................................... 10
III. Optimal Mining Taxation: an Application to Mali ....................................................... 12 A. Determining the Optimal Royalty Rate ........................................................ 14
IV. An Assessment of the Mining Fiscal Regime in Mali ................................................... 15 A. Fiscal Stability Clause................................................................................... 15 B. Taxation Based on Profits Rather than Production ....................................... 15 C. Fiscal Risk to the State .................................................................................. 16 D. A Simple and Robust Tax System ................................................................ 16 E. Comparisons with Mineral Taxes in Other Countries .................................. 16
V. Conclusions and Policy Implications ............................................................................ 19 References ............................................................................................................................... 20 Appendix. Dynamic Optimal Simulation Results
Text Tables 1. Gold Sector Indicators, 2004–08 .................................................................................... 3 2. Contribution of Mining Sector to Government Revenues, 2004–08 .............................. 5 3. Input-Output Coefficient Matrix ..................................................................................... 7 4. Total Requirements Matrix ............................................................................................. 8 5. International Comparisons of Mineral Tax Regimes for Selected Countries ............... 18
Text Figures 1. Gold Production and Foreign Investment, 2000–08 ....................................................... 4 2. Optimal Tax Rate .......................................................................................................... 14
Appendix Tables A1. Scenario 1: Even Extraction Profile and Discounted Cash Flow ................................. 21 A2. Scenario 2: Optimal Extraction Profile and Discounted Cash Flow ............................. 22 A3. Scenario 3: Optimal Extraction Profile and Discounted Cash Flow Using the Optimal Royalty Tax Rate ............................................................................................ 23
3
I. INTRODUCTION
A. Mali’s Gold Sector
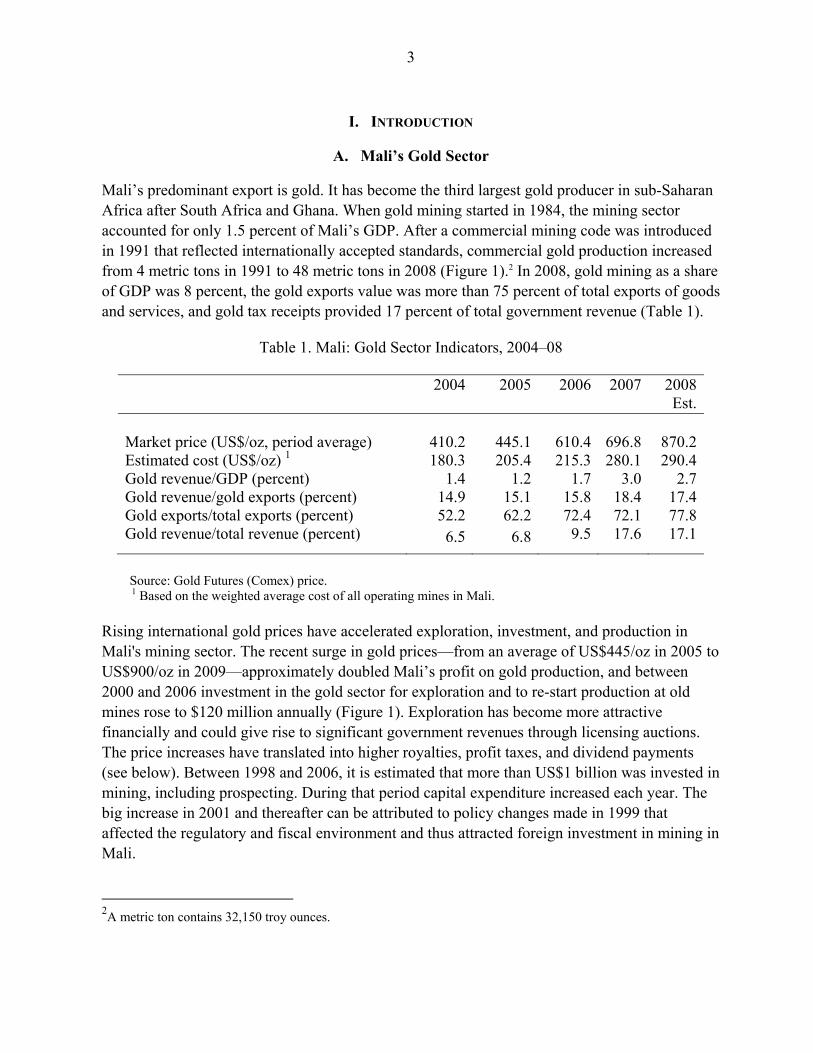
Mali’s predominant export is gold. It has become the third largest gold producer in sub-Saharan Africa after South Africa and Ghana. When gold mining started in 1984, the mining sector accounted for only 1.5 percent of Mali’s GDP. After a commercial mining code was introduced in 1991 that reflected internationally accepted standards, commercial gold production increased from 4 metric tons in 1991 to 48 metric tons in 2008 (Figure 1).2 In 2008, gold mining as a share of GDP was 8 percent, the gold exports value was more than 75 percent of total exports of goods and services, and gold tax receipts provided 17 percent of total government revenue (Table 1).
Table 1. Mali: Gold Sector Indicators, 2004–08
2004 2005 2006
2007
2008 Est.
Market price (US$/oz, period average) 410.2 445.1 610.4 696.8 870.2Estimated cost (US$/oz) 1 180.3 205.4 215.3 280.1 290.4Gold revenue/GDP (percent) 1.4 1.2 1.7 3.0 2.7Gold revenue/gold exports (percent) 14.9 15.1 15.8 18.4 17.4Gold exports/total exports (percent) 52.2 62.2 72.4 72.1 77.8Gold revenue/total revenue (percent) 6.5 6.8 9.5 17.6 17.1
Source: Gold Futures (Comex) price. 1 Based on the weighted average cost of all operating mines in Mali. Rising international gold prices have accelerated exploration, investment, and production in Mali's mining sector. The recent surge in gold prices—from an average of US$445/oz in 2005 to US$900/oz in 2009—approximately doubled Mali’s profit on gold production, and between 2000 and 2006 investment in the gold sector for exploration and to re-start production at old mines rose to $120 million annually (Figure 1). Exploration has become more attractive financially and could give rise to significant government revenues through licensing auctions. The price increases have translated into higher royalties, profit taxes, and dividend payments (see below). Between 1998 and 2006, it is estimated that more than US$1 billion was invested in mining, including prospecting. During that period capital expenditure increased each year. The big increase in 2001 and thereafter can be attributed to policy changes made in 1999 that affected the regulatory and fiscal environment and thus attracted foreign investment in mining in Mali.
2A metric ton contains 32,150 troy ounces.

4
However, gold mining is an enclave economy with weak linkages to the rest of the economy. Forward linkages increase foreign reserves, tax revenues, and employment; backward linkages creates demand for locally produced intermediate inputs and capital goods and domestic demand for finished goods. Backward linkages are naturally few because most of the intermediate inputs required for gold production are imported. Moreover, although there are some real sector impacts in the form of job creation, they are limited because mineral extraction is capital-intensive and requires specialized skills that are scarce in the local labor force.
B. Macroeconomic Impact of the Gold Sector
Mining operations have major implications for the external, and real sectors of the economy, but the main macroeconomic impact in Mali is through the fiscal channel. In more developed economies there are sound structural links because opportunities for local industry to provide inputs into a mineral project or perhaps to use mineral outputs for their own production can be realized. However, in Mali, where the structural links are less extensive, the main macroeconomic impact comes from the revenue collected by the government. The mining sector generates extra revenue because the government retains an equity position in all new exploration activities without making any financial contribution. Mines also contribute to development in their localities by engaging in community activities and building infrastructure, such as schools, hospitals, and roads, providing access to previously remote locations.
Industrial gold production contributes to government revenue in three streams: royalty payments (3–6 percent of gold value, depending on the date the mine opened); corporate income taxes (although all but one mine benefits from a five-year tax holiday granted in the 1991 mining code); and dividend payments on state shareholdings. For 2006–08, these payments averaged
0
10
20
30
40
50
60
70
80
2000 2001 2002 2003 2004 2005 2006 2007 2008
(tons)
50
75
100
125
150
175
200
(US$ millions)
Gold production (left axis)
Foreign direct investment (right axis)
Figure 1. Mali: Gold Production and Foreign Investment, 2000–08
5
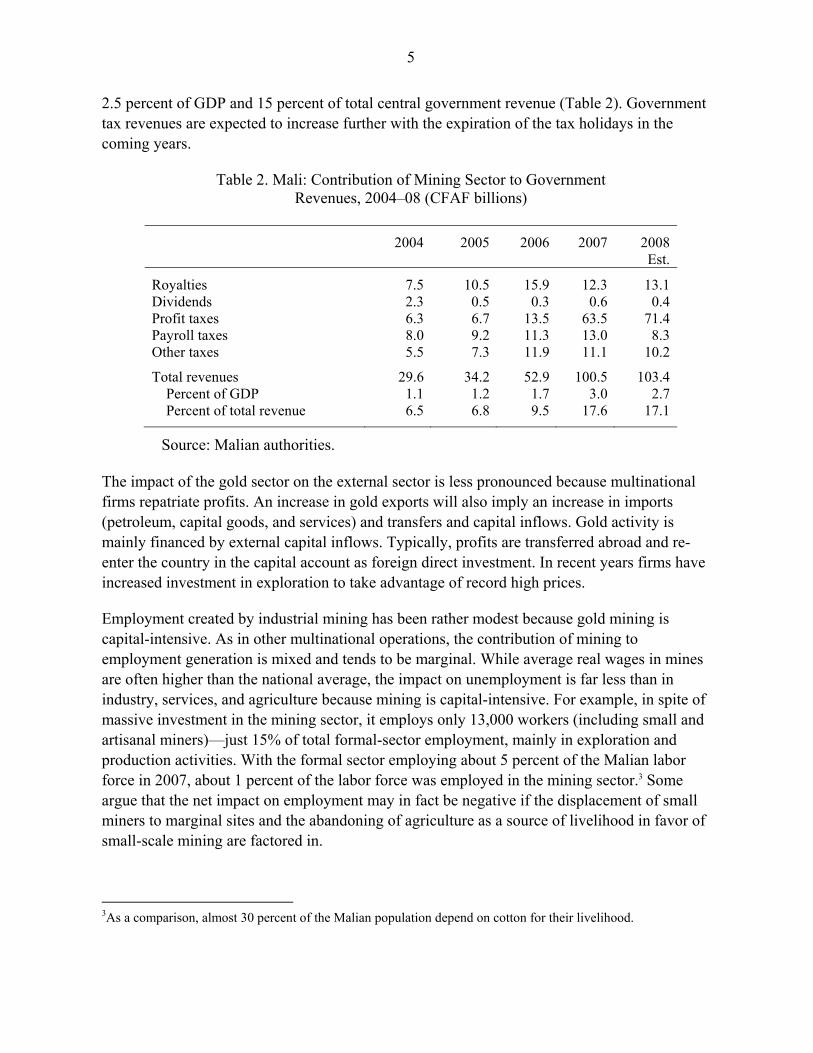
2.5 percent of GDP and 15 percent of total central government revenue (Table 2). Government tax revenues are expected to increase further with the expiration of the tax holidays in the coming years.
Table 2. Mali: Contribution of Mining Sector to Government Revenues, 2004–08 (CFAF billions)
2004 2005 2006 2007 2008
Est.
Royalties 7.5 10.5 15.9 12.3 13.1Dividends 2.3 0.5 0.3 0.6 0.4Profit taxes 6.3 6.7 13.5 63.5 71.4Payroll taxes 8.0 9.2 11.3 13.0 8.3Other taxes 5.5 7.3 11.9 11.1 10.2
Total revenues 29.6 34.2 52.9 100.5 103.4 Percent of GDP 1.1 1.2 1.7 3.0 2.7 Percent of total revenue 6.5 6.8 9.5 17.6 17.1
Source: Malian authorities. The impact of the gold sector on the external sector is less pronounced because multinational firms repatriate profits. An increase in gold exports will also imply an increase in imports (petroleum, capital goods, and services) and transfers and capital inflows. Gold activity is mainly financed by external capital inflows. Typically, profits are transferred abroad and re-enter the country in the capital account as foreign direct investment. In recent years firms have increased investment in exploration to take advantage of record high prices.
Employment created by industrial mining has been rather modest because gold mining is capital-intensive. As in other multinational operations, the contribution of mining to employment generation is mixed and tends to be marginal. While average real wages in mines are often higher than the national average, the impact on unemployment is far less than in industry, services, and agriculture because mining is capital-intensive. For example, in spite of massive investment in the mining sector, it employs only 13,000 workers (including small and artisanal miners)—just 15% of total formal-sector employment, mainly in exploration and production activities. With the formal sector employing about 5 percent of the Malian labor force in 2007, about 1 percent of the labor force was employed in the mining sector.3 Some argue that the net impact on employment may in fact be negative if the displacement of small miners to marginal sites and the abandoning of agriculture as a source of livelihood in favor of small-scale mining are factored in.
3As a comparison, almost 30 percent of the Malian population depend on cotton for their livelihood.

6
C. Backward Linkages with the Rest of Economy
Measuring the impact of the gold sector on the rest of the economy is a function not only of taxes and wages paid, but also of intersectoral integration which depends on forward and backward linkages. While some forward linkages, such as taxes and wages, are readily quantifiable, calculating the development impact of improvements to infrastructure and human capital is difficult. In Mali, backward linkages are minimal because most intermediate inputs into gold production are imported. Spillover effects are confined to the petroleum and services sector. An input-output model (I-O) was used to estimate the direct and indirect benefits from the mining sector for other sectors (Miller and Blair, 1985).
Input-output model for Mali
We present an I-O for Mali, where the total output of sector i is denoted by Xi , the interindustry sales by sector i to sector j is denoted by Xij, and the total final demand for sector i’s product is denoted by Yi, then we can express the total output as follows:
Xi = Xi1 + Xi2+........+ Xin + Yi (1) The relationship between inputs and outputs can be specified by fixed I-O coefficients. That is,
Xij = aij* Xj (i, j = 1, ..., m), or aij = Xij /Xj . (2) Here, aij signifies the amount of commodity i required to produce one unit of commodity j. Substituting (2) in (1), we get:
Xi = ai1 X1 + ai2 Xi2+........+ ainXn + Yi (3)
Xn = an1 X1 + an2 Xi2+........+ annXn + Yn (4) In matrix notation, this is represented as:
X = AX + Y (5) where the technical coefficients matrix A is a (m x m) matrix of (aij) coefficients, X is a (m x 1) vector of output levels of m sectors, and Y is a (m x 1) vector of level of final demand for each of the m sectors. By definition, aij entry in this matrix signifies the amount of good i required to produce one unit of good j:
X – AX = Y (6)
(I – A) X = Y (7)
X = (I – A)-1 Y = RY (8)

7
where I is the (m x m) identity matrix and R = (rij) is a (m x m) matrix (the Leontief inverse). Here each coefficient rij represents the amount of output of sector i required to meet the requirement of one unit of final demand for sector j. It includes direct and indirect effects in the sense that to produce one unit of sector i’s output, we require aji units of each sector j with j = 1,...,m. But to produce one unit of sector j’s output, we need aij units of output of sector ’'s output. Thus, rij captures the direct and indirect effects. The Leontief inverse (I – A)-1 provides sectoral multipliers at the regional or national level.
The I-O matrix indicates the linkages between mining and other sectors. The I-O coefficients show few linkages (Table 3). The rows (output) indicate that for every $1 of gold produced in the country, just $0.06 equivalent of gold is used for domestic consumption and $0.94 is exported. The columns (inputs) indicate the use of inputs in producing gold. To produce $1 equivalent of gold, $0.20 of petroleum and chemicals and $0.08 of manufactured goods are required.
Table 3. Mali: Input-Output Coefficient Matrix
Sector Agri-
culture Textiles/Cotton
Manu-factured Goods
Petrol and Chemi-
cals
Mining Other Services
Agriculture 0.33 0.34 0.11 0.04 0.00 0.05 0.03 Textiles (cotton) 0.01 0.15 0.00 0.00 0.00 0.00 0.00 Manufacturing 0.00 0.08 0.04 0.01 0.08 0.08 0.02 Petroleum and chemicals 0.04 0.02 0.17 0.10 0.20 0.07 0.05 Mining 0.00 0.00 0.02 0.00 0.02 0.02 0.00 Other 0.09 0.01 0.01 0.02 0.00 0.01 0.02 Services 0.06 0.07 0.08 0.06 0.05 0.09 0.10
Sources: Malian authorities; and IMF staff calculations.
The total requirement matrix shows the minimal direct and indirect effects of the mining sector on the entire economy (Table 4). We estimated the Leontief inverse matrix for Mali (Eq. 8). The results indicate that the impact of gold mining is limited to only a few sectors. For every dollar’s worth of gold produced, the value added in the economy is $1.50. On the other hand, the corresponding aggregate industry multiplier for cotton is 2.28 and for agriculture 1.94. This is mainly because the intermediate input demand generated by mining is much smaller than that generated by cotton and agriculture. In summary, the macroeconomic impact of gold mining on the rest of the economy is limited, and the main impact is through the fiscal channel.

8
Table 4. Mali: Total Requirements Matrix 1
Sector Agri-
culture Textiles/Cotton
Manu-facturing
Petrol and Chemi-
cals
Mining Other Services
Agriculture 1.53 0.64 0.19 0.07 0.03 0.10 0.06 Textiles (cotton) 0.02 1.19 0.00 0.00 0.00 0.00 0.00 Manufacturing 0.02 0.11 1.05 0.02 0.09 0.09 0.03 Petroleum and chemicals 0.09 0.10 0.22 1.13 0.25 0.11 0.08 Mining 0.00 0.00 0.02 0.00 1.02 0.02 0.00 Other 0.14 0.08 0.03 0.03 0.02 1.03 0.03 Services 0.13 0.16 0.13 0.08 0.09 0.12 1.13
Industry Multiplier 1.94 2.28 1.65 1.33 1.50 1.48 1.33
1 Leontief inverse matrix of (1–A), where A is the input-output matrix.
II. MINING TAXATION IN MALI
Given the prominence of the fiscal transmission channel, it is of paramount importance that the government design a fiscal regime that brings it a fair share of the benefits of gold mining. To this end, Mali should assess the efficiency of various tax instruments and their effect on the incentives and behavior of mining companies, and design an appropriate mineral tax regime. The choice of fiscal instruments depends on the timing of revenue collection, risk sharing, administrative convenience, and political judgment. Product-based levies4 can ensure that the government receives at least a minimum payment for the exploitation of minerals; profit-based instruments reduce uncertainty in mineral contracts because they mean that the government shares in returns from projects that turn out to be more profitable than expected.
This section uses a dynamic optimization taxation model to (i) analyze the tax instruments used in the mining sector; and (2) numerically calibrate the model to compute the optimal level of taxation in Mali.
Taxation of the mineral sector represents the price for the right to extract a scarce resource. The tax objectives arise from the role of government as owner of minerals, which requires the government to secure an appropriate share of mineral rents. Maintaining the neutrality characteristic of mineral taxation is highly important in fulfilling this objective. Mineral extraction makes it possible to generate sizable economic rents that may exceed the return
4 Mali uses a variety of mineral levies, both direct and indirect. Some, such as the basic income tax, import duties, export taxes, sales tax, value-added tax, property tax- and stamp duties are imposed as part of the government’s general taxing power. Others, such as royalties and equity sharing, are levied with a view to claiming government's legitimate share as mineral owner. Another group of levies is intended to minimize damage to the environment and restore ecological balance.

9
thresholds necessary to constitute an incentive for an investor to carry out a project. This raises the possibility that the state may apply higher taxation without calling the investment decision into question. One of the criticisms leveled against mining companies is that they are not paying enough taxes, so the country is not getting a fair share of the wealth flowing from its mineral sector. As a sovereign state, Mali should pursue taxation and other policies that achieve, to the maximum extent possible, the goals and objectives they have set for the mineral sector.
A. A Basic Model
Assume that the initial mineral resource deposit size is R. Let π(q,t) denote the profits the firm can make at time t by extracting q of this resource and processing it into a standard refined product. The variable profit function thus implicitly includes the price of the refined product and the costs of variable inputs used in extraction, but does not capture the stochastic element of gold prices. Profits would normally also depend on the grade of the ore being mined, which will change as extraction proceeds and will depend on the sequence in which the different components of ore are extracted (Heaps,1985). Taxation policy affects not only the choice of extraction rates (q(t)) but also the resources employed in exploring for new ore deposits. Assume that initial reserves can be augmented by a certain exploration process at a cost of C(R), the present value of past exploration and development expenses at the moment extraction begins. The mine operator’s problem is to choose a length of time, T, for the mine to operate, and an extraction profile, q(t), to maximize the present value, V, of the profit function:
V = )(),(0 RCdtetq rtT , (9)
subject to the following constraints:
q(0) =R (10) q(T) = 0 (11) R(t) = R – q(t) , (12)
where q(t), the extraction rate, is the control variable and R(t) is the state variable representing reserves at a given time, t. At time t=0, R is total reserves; at t=T, the reserves are depleted, so R=0. The amount of reserves remaining at time t, R(t), is given by eq. (12).
Using optimal control theory (Heaps, 1985), the Hamiltonian equation for the optimization is given by
)()(),( qRRCetqMaxH rt (13)
The first-order conditions that characterize the operator’s optimal strategy are
e rtq)/( , a constant, (14)

10
)( 'RC (15)
Condition (14) says that discounted marginal profits should be the same at all points in time. Otherwise, ore extraction could be shifted from a time of low discounted profits to a time of high discounted profits, resulting in an increase in V, whereas condition (15) says that the shadow price of extra reserves should equal the marginal cost of finding them.
Further differentiating (14), we can obtain the slope of the extraction path, which is given by
)/( 2)/()/)(2/2( tqqrdtdqq (17)
Re-arranging (17), we get
)]2/2/[()]/( 2)/([/ qtqqrdtdq , (18)
which is less than 0 unless the price of the refined product rises too fast. Extraction rates will decline over time.
B. Mineral Tax Instruments
A number of taxes are applied to the extractive industries in order to collect the government’s share of the economic rent. Among them are severance taxes based on output or gross revenue (also called royalties), net profit taxes, license fees, and property taxes. Their impact on the extraction plans of individual mines could be analyzed based on the above model. In practice, firms are subject to a combination of taxes, including corporation income tax and taxes levied by lower jurisdictions that may or may not be deductible for income tax purposes. For the sake of simplicity, the various types of taxes will be treated separately here.
Royalty tax A severance tax or royalty is usually a portion of gross output or gross revenue. If the royalty is σ(t) at time t, then the present value of a firm’s extraction plan becomes
)(]*[0 RCdteqV rtT (19)
and V is maximized when
e rtq ]/[ , a constant. (20) The slope of the extraction path is now given by
rdtdtqqrdtdqq )/()/( 2)/()/)(2/2(
11
q
rdtdqtqqrdtdq
2/2
)/()2/2/[()]/( 2)/(/
(21)
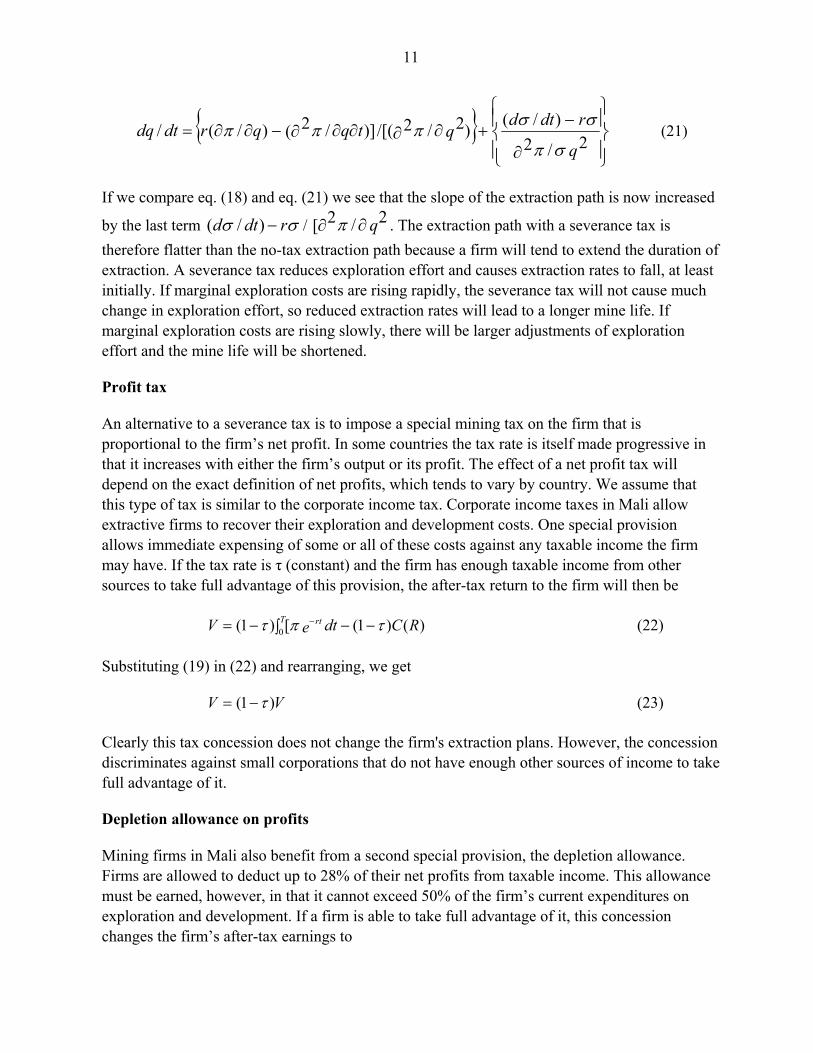
If we compare eq. (18) and eq. (21) we see that the slope of the extraction path is now increased
by the last term rdtd )/( / q2/[ 2 . The extraction path with a severance tax is
therefore flatter than the no-tax extraction path because a firm will tend to extend the duration of extraction. A severance tax reduces exploration effort and causes extraction rates to fall, at least initially. If marginal exploration costs are rising rapidly, the severance tax will not cause much change in exploration effort, so reduced extraction rates will lead to a longer mine life. If marginal exploration costs are rising slowly, there will be larger adjustments of exploration effort and the mine life will be shortened.
Profit tax An alternative to a severance tax is to impose a special mining tax on the firm that is proportional to the firm’s net profit. In some countries the tax rate is itself made progressive in that it increases with either the firm’s output or its profit. The effect of a net profit tax will depend on the exact definition of net profits, which tends to vary by country. We assume that this type of tax is similar to the corporate income tax. Corporate income taxes in Mali allow extractive firms to recover their exploration and development costs. One special provision allows immediate expensing of some or all of these costs against any taxable income the firm may have. If the tax rate is τ (constant) and the firm has enough taxable income from other sources to take full advantage of this provision, the after-tax return to the firm will then be
)()1([)1( 0 RCdteV rtT (22)
Substituting (19) in (22) and rearranging, we get
VV )1( (23) Clearly this tax concession does not change the firm's extraction plans. However, the concession discriminates against small corporations that do not have enough other sources of income to take full advantage of it.
Depletion allowance on profits Mining firms in Mali also benefit from a second special provision, the depletion allowance. Firms are allowed to deduct up to 28% of their net profits from taxable income. This allowance must be earned, however, in that it cannot exceed 50% of the firm’s current expenditures on exploration and development. If a firm is able to take full advantage of it, this concession changes the firm’s after-tax earnings to

12
)()1(0 [)28.01( RCdte rtTV (24)
The necessary conditions for maximizing V are the same as those for maximizing V except that (14) becomes
0)('))72.01/(28.0()(')/( RCRCe rtq (25) The optimal extraction plan qt still satisfies the differential equation (14). A decrease of both T and R would increase the LHS of equation (25). This type of depletion allowance raises extraction rates, increases exploration effort, and lengthens mine lives. In Mali, the depletion allowance is a percentage of gross revenue to a maximum of 28% of net income from the extraction operation. Thus, if the net income limitation is not binding, this allowance is equivalent to a negative severance tax proportional to the price of ore. If the price is not rising too quickly, then (dσ/dt)- rσ > 0, since σ < 0, and this allowance raises exploration and extraction rates.
III. OPTIMAL MINING TAXATION: AN APPLICATION TO MALI
For a representative mining firm, the objective is to maximize profits. Over time this means maximizing the net present value (NPV) of a company. On the other hand, the government’s goal is to use its mineral wealth to promote social welfare. While the specific measures needed to accomplish this general goal may vary, one reasonable possibility is for the government to use taxation policies to maximize the NPV of the stream of revenues flowing from the mining sector to the government over time.
In this section, we numerically calibrate the dynamic optimization model given by equation (9) and compute the optimal royalty tax rate for Mali5. The model does not capture the role of competition in the mining sector in the determination of optimal tax policy. For a numerical solution to a dynamic optimization problem, an annual cash flow function is required. Modeled as a power function, this is given by
qq ttC
)( , (26)
and qt has diminishing returns if 0<α<1.
5 The government’s choice of royalty tax is also influenced by dividends and profit taxes, but the paper focuses on the royalty tax because that is a tax specific to the mining sector. The shareholders of the mining companies determine the dividend distribution (government only has a 10% stake and hence a limited say), and profit taxes are applicable to all sectors and is not specific to mining sector

13
The value of the mine is the sum of discounted cash flows earned during its life, from year 0 to T, and can be expressed as
)(),(0
0 qCqxV t
T t (27)
The present value, V, is the discrete time equivalent of equation (9). The time path of extraction in each year is given by qt = {q1, q2, q3, ….qT}. C(qt) indicates the cash flow in year t, and β =1/(1+r) is the discount factor, where r is interest.
Substituting equation (26) into equation (27) yields
qqxV t
T t 0
0 ),( (28)
The cash flow function indicates that mineral extraction q(t), produces cash flow, V(qt), at time t. It is assumed that mineral extraction is subject to diminishing returns at each point in time. Cash flows that occur in the future are subjected to the discount factor, e–rt,, where r is the discount rate applicable to this type of investment. The value of the mine depends on the initial reserve, X, and on the time path of ore extraction, qt, in the interval from 0 to T.
The mine operator chooses the time path of ore extraction, qt = {q1, q2, q3, ….qT}, which maximizes the present value of the function, subject to the following constraint:
xt+1 − xt = −qt (29)
Equation (29) says that at the beginning of each year, the ore reserve equals the reserve at the beginning of the preceding year minus the ore extracted during that year, so the decision maker controls the reduction in reserve from one year to the next.
A numerical solution to a dynamic optimization problem requires two endpoint conditions. We assume that the initial ore reserve is 2,000 units and the natural life of the mine is 20 years. Thus the initial condition is x0=2,000 and the final condition is xT=x20 (≥0). Naturally, it is optimal to recover all ore because the value function (27) assigns no value to mineral that stays underground after time T. Therefore, the final condition holds as an equality but it is sufficient to impose an inequality. In the case of a mine, it is also natural to assume that the rate of extraction is nonnegative at all times. The parameter α, which determines the curvature of the annual cash flow function, is put at 0.8, and the interest rate, r, is 5 per cent. The iterative algorithm requires an initial time path of ore extraction. In the Scenario 1 (base case) we assume that mineral extraction is the same in all periods; the royalty rate is set at 6 percent of the value and the profit tax is 35 percent as the tax code specifies. In scenario 2, we calculate the time path of ore extraction that maximizes the value of the mine, V(qt). In scenario 3, we calculate the

14
time path of ore extraction that maximizes the value of the mine, V(qt), given the optimal royalty rate. The optimization results of all the three scenarios are presented in Tables A1–A3 in the Appendix.
A. Determining the Optimal Royalty Rate
The optimal royalty tax rate for a mining company would be zero, but this would produce no royalty revenues for the government. As the tax rate rises from zero to some optimal level (T*), as the modified Laffer curve in Figure 2 shows, the NPV of the stream of current and future government revenues increases. Once the optimal level is reached, however, any further increase in the tax rate will cause companies to reduce their exploration for new deposits, stop developing new mines, and eventually, if the tax rate is pushed high enough, close their existing mines (Tilton, 2004). These developments cause the NPV of government revenues to decline, eventually to zero.
Figure 2: The Optimal Tax Rate
185
190
195
200
205
210
0 1 2 3 4 5 6 7 8 9 10
Royalty tax rates (percent)
NP
V o
f go
vern
men
t rev
enue
180
185
190
195
200
205
210
T*
We use the extraction rates given by eq. (26) to model the mining company’s behavior under various tax rates to derive a relationship between the royalty tax rate and the NPV of government revenues. The optimum rate is at T* (see Figure 2), which in the case of Mali is about 3.5 percent. Royalty tax rates were 6 percent under the old mining code; they have been reduced to 3 percent in the new code, but most companies are still operating under the old code. The new royalty rates are close to its optimal rates, but the effective tax rate may be below the optimum because of tax incentives to encourage investment. On the other hand, because of the

15
favorable tax conditions, over the last decade mining production has expanded rapidly. Whether this would have been the case had mining taxes been higher it is not possible to know.
IV. AN ASSESSMENT OF THE MINING FISCAL REGIME IN MALI
The objective of a mineral tax system is to create incentives for investors while simultaneously generating adequate rents for the state. As the sovereign tax authority and the natural resource owner, the government has a dual fiscal role. As the tax power, it must ensure that the natural resource sector makes its due contribution to public revenues. As the resource owner, it must determine when to exploit its natural resources as well as ensure that it obtains an appropriate price for them. At one level there is a fundamental conflict between mining companies and the government because both parties want to maximize rewards and shift as much risk as possible to the other party. At another level resource agreements and the associated fiscal rules create a shared interest between the mining company and the government. The magnitude of revenues to be divided is maximized through fiscal arrangements that encourage a stable fiscal environment and efficient resource development. Achieving such an equilibrium is not always easy. This section evaluates the mining fiscal regime in Mali using the basic principles of mineral taxation.
A. Fiscal Stability Clause
An important component of any kind of assessment of risk is the perceived stability of the tax regime. The possibility of obtaining better tax treatment is not an incentive for new investments; it only serves to reduce state revenues and offer a windfall gain to the investor. Unfortunately for both companies and governments, tax regime stability is difficult to guarantee. Moreover, a fiscal stability clause by itself is not enough to ensure fiscal stability—much depends on clarity in implementation. The fiscal stability clause in Mali’s 1999 Mining Code states that investors may be subject to a new “mining” tax, which deserves further examination because it could be counterproductive in attracting new investors.
B. Taxation Based on Profits Rather than Production
The ideal way to tax the rents occasioned by the extraction of mineral resources is directly, because other forms of taxation will prompt the investor to make decisions that will reduce efficiency and lower tax payments. The inefficiency induced by levying a royalty is that by reducing the revenue of operators to a point below the break-even price, it will prompt marginal, mines to close and thereby reduce government revenue. A tax on corporate profits or income is more efficient because it does not alter the optimal output of companies striving to maximize profits. A corporate profit tax and royalties based on profitability tend to distribute the risk of mining equitably between the state and the mining companies. The structure of the tax regime introduced by the 1999 Mining Code is therefore superior to its predecessor because royalties now constitute only a strict mining tax and have been lowered from 6 percent to 3 percent. The reduction of tax exemptions, in particular from the profit tax, also represents a significant structural improvement.
16
C. Fiscal Risk to the State
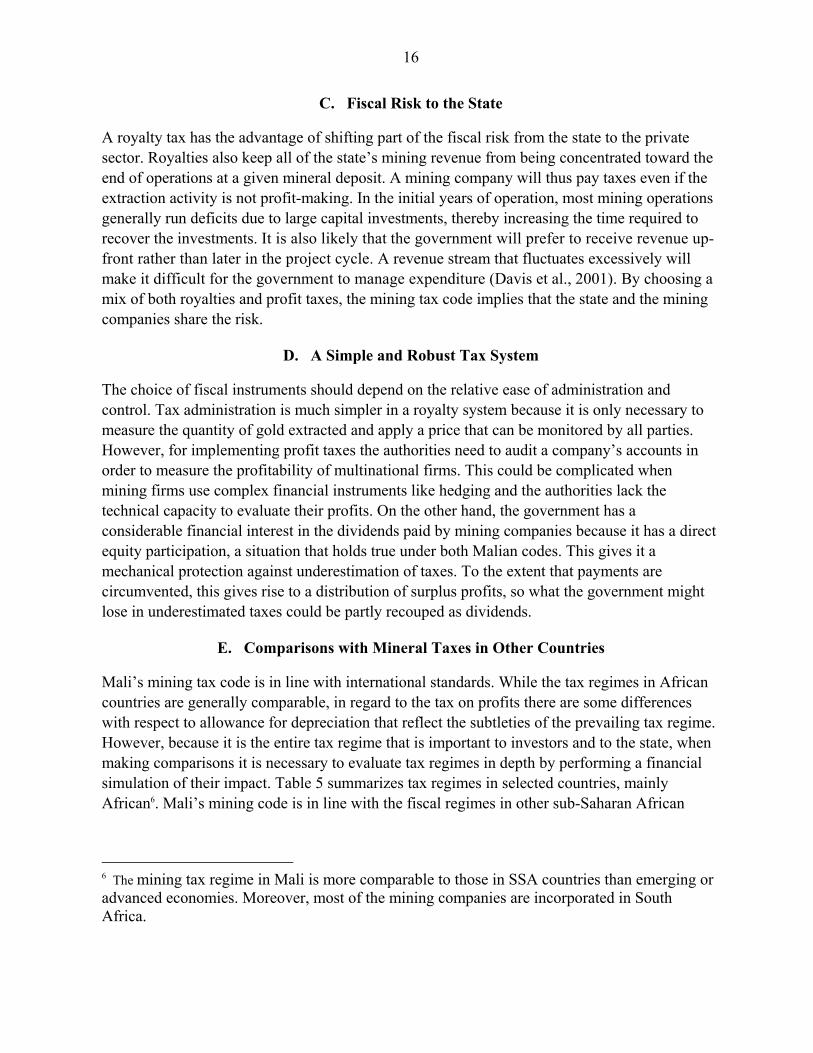
A royalty tax has the advantage of shifting part of the fiscal risk from the state to the private sector. Royalties also keep all of the state’s mining revenue from being concentrated toward the end of operations at a given mineral deposit. A mining company will thus pay taxes even if the extraction activity is not profit-making. In the initial years of operation, most mining operations generally run deficits due to large capital investments, thereby increasing the time required to recover the investments. It is also likely that the government will prefer to receive revenue up-front rather than later in the project cycle. A revenue stream that fluctuates excessively will make it difficult for the government to manage expenditure (Davis et al., 2001). By choosing a mix of both royalties and profit taxes, the mining tax code implies that the state and the mining companies share the risk.
D. A Simple and Robust Tax System
The choice of fiscal instruments should depend on the relative ease of administration and control. Tax administration is much simpler in a royalty system because it is only necessary to measure the quantity of gold extracted and apply a price that can be monitored by all parties. However, for implementing profit taxes the authorities need to audit a company’s accounts in order to measure the profitability of multinational firms. This could be complicated when mining firms use complex financial instruments like hedging and the authorities lack the technical capacity to evaluate their profits. On the other hand, the government has a considerable financial interest in the dividends paid by mining companies because it has a direct equity participation, a situation that holds true under both Malian codes. This gives it a mechanical protection against underestimation of taxes. To the extent that payments are circumvented, this gives rise to a distribution of surplus profits, so what the government might lose in underestimated taxes could be partly recouped as dividends.
E. Comparisons with Mineral Taxes in Other Countries
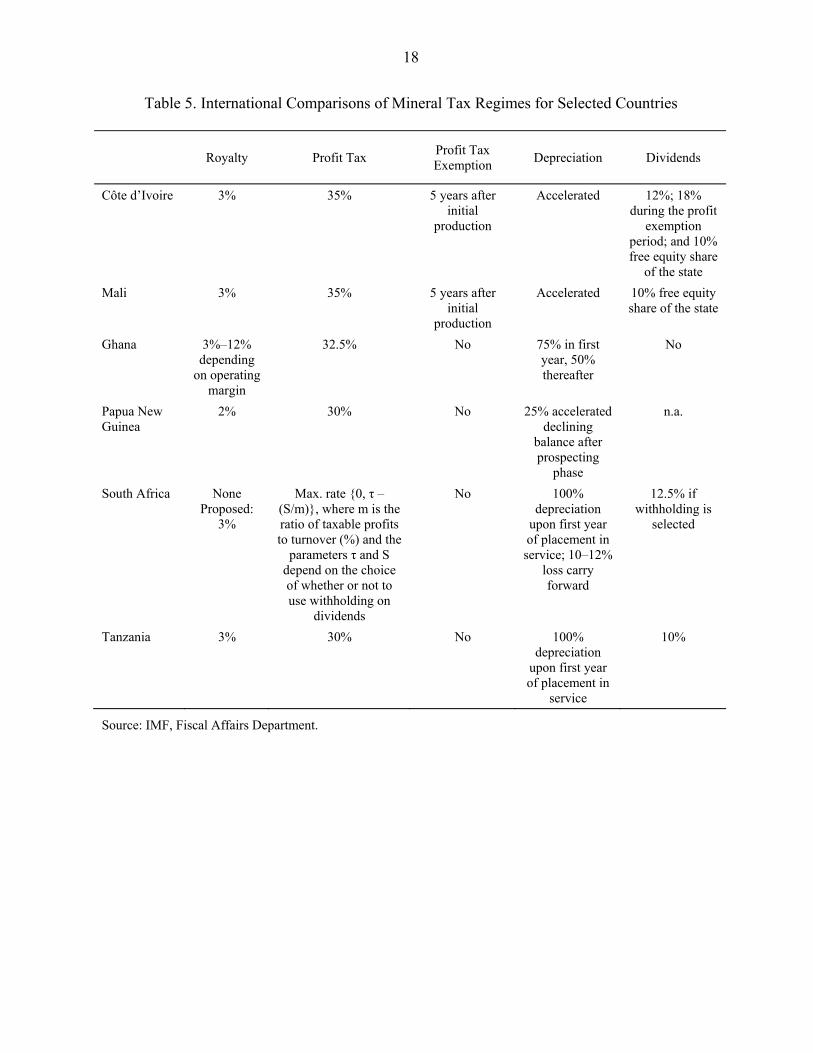
Mali’s mining tax code is in line with international standards. While the tax regimes in African countries are generally comparable, in regard to the tax on profits there are some differences with respect to allowance for depreciation that reflect the subtleties of the prevailing tax regime. However, because it is the entire tax regime that is important to investors and to the state, when making comparisons it is necessary to evaluate tax regimes in depth by performing a financial simulation of their impact. Table 5 summarizes tax regimes in selected countries, mainly African6. Mali’s mining code is in line with the fiscal regimes in other sub-Saharan African
6 The mining tax regime in Mali is more comparable to those in SSA countries than emerging or advanced economies. Moreover, most of the mining companies are incorporated in South Africa.

17
countries because it has chosen a hybrid mix of tax instruments to better allocate the risks between the state and the mining companies.
Another common form of tax incentive used in Mali is accelerated depreciation, which provides a depreciation allowance for capital goods and plants. The corporate income tax rate is slightly higher than those of other countries but it follows the tax code and does not provide tax holidays. The government of Mali reserves the right to participate (back-in rights) as a shareholder in the capital of a mining company to the extent of a maximum carried interest of 10 percent, free of financial obligations but with the right to preferential dividends, and the option to acquire an additional 10 percent working interest by contributing to capital.
The tax regime, in line with those in other countries, creates adequate tax incentives for investors while yielding the state an adequate share of rents. However, there is scope for making it more effective in terms of accounting rules, sharing of revenue between central and local governments, and clarifying the rights of minority shareholders.
18
Table 5. International Comparisons of Mineral Tax Regimes for Selected Countries
Royalty Profit Tax Profit Tax Exemption
Depreciation Dividends
Côte d’Ivoire 3% 35% 5 years after initial
production
Accelerated 12%; 18% during the profit
exemption period; and 10% free equity share
of the state
Mali 3% 35% 5 years after initial
production
Accelerated 10% free equity share of the state
Ghana 3%–12% depending
on operating margin
32.5% No 75% in first year, 50% thereafter
No
Papua New Guinea
2% 30% No 25% accelerated declining
balance after prospecting
phase
n.a.
South Africa None Proposed:
3%
Max. rate {0, τ – (S/m)}, where m is the ratio of taxable profits to turnover (%) and the
parameters τ and S depend on the choice of whether or not to use withholding on
dividends
No 100% depreciation
upon first year of placement in service; 10–12%
loss carry forward
12.5% if withholding is
selected
Tanzania 3% 30% No 100% depreciation
upon first year of placement in
service
10%
Source: IMF, Fiscal Affairs Department.

19
V. CONCLUSIONS AND POLICY IMPLICATIONS
Using an I-O model, this study finds that Mali’s gold sector has few forward and backward linkages with the rest of the economy. Gold production contributes to government revenue mainly through royalties, corporate income taxes, and dividend payments on state shareholdings. Given the prominence of the fiscal transmission channel, it is important that the government design a mineral tax regime that gives the state a fair share of the benefits.
Using optimal control theory to calculate the optimal royalty tax and the optimal extraction rates for mining companies, this study finds the optimal royalty tax to be about 3.5 percent of the value of gold production. Moreover, by reducing the royalty rate from 6 percent to 3 percent, the new mining code has brought the royalty rates close to its optimum levels. The relatively favorable mining tax regime may suggest that the actual tax rate is below the optimum, but that is not necessarily the case. As a result of favorable tax incentives, mining has expanded rapidly over the last decade in Mali. Whether this would have been the case had mining taxes been higher, it is not possible to know. Without such information, as well as information on the implications for future investments, we cannot be sure that a higher tax rate would raise, rather than lower, the NPV of mining.
Mali’s mining code broadly ensures that the risk is shared between the state and mining companies while providing sufficient incentives to attract new exploration. The code is in line with the fiscal regimes in other sub-Saharan African countries in its mix of tax instruments and its tax structure, taking into account the capacity and costs of implementation and administration. The tax structure is simple; it shares risks between mining companies and government, is nondiscretionary within the mining sector, and is based mainly on profits. The current system has served Mali well given the volatility in gold prices and production; it seems appropriate for the authorities to retain the current regime. However, although gold prices are at record levels, the state has not been able to collect its full share of revenues because of the profit tax holidays granted under the old mining code. Once these expire, the government’s tax take should increase.

20
References Aryee, B., 2001, “Ghana’s Mining Sector: Its Contribution to the National Economy,”
Resources Policy, Vol. 27, pp. 61–75. Baunsgaard, T., 2001, “A Primer on Mineral Taxation,” IMF Working Paper WP/01/139
(Washington: International Monetary Fund). Bannon, I., and P. Collier, 2003, Natural Resources and Violent Conflict: Actions and Options
(Washington: World Bank). Collier, P., 2003, Breaking the Conflict Trap: Civil War and Development Policy (London:
Oxford University Press). Davis, J., R. Ossowski, J. Daniel, and S. Barnett, 2001, “Stabilization and Savings Funds for
Nonrenewable Resources,” Occasional Paper No. 205 (Washington: International Monetary Fund).
Fearon, J.D., and D.D. Laitin, 2002, "Ethnicity, Insurgency, and Civil War," unpublished manuscript (May).
Heaps, 1985. “The taxation of Nonreplenishable Natural Resources Revisited,” Journal of
Environmental Economics and Management, Vol. 12, pp 14-27. Mehlum, H., and R. Torvik, 2002, “Institutions and the Resource Curse,” No. 29 (Oslo, Norway:
Department of Economics, University of Oslo). Miller, R., and P. Blair, 1985. Input-output Analysis: Foundations and Extensions (Cambridge,
Massachusetts: Cambridge University Press, 2009. PricewaterhouseCoopers, 2000, Mineral Taxation Policies in Asia (New York). Sacs, J., and A. Warner, 2001, “The Curse of Natural Resources,” European Economic Review,
Vol. 45, pp. 827–38. Sarma, J.V.M., and G. Naresh, 2001. “Mineral Taxation Around the World: Trends and Issues,”
Asia-Pacific Tax Bulletin, January, pp. 24–43. Tilton, John, 2004, “Determining the Optimal Tax on Mining,” Natural Resources Forum,
Vol. 28, pp. 144–49.

21 APPENDIX
DYNAMIC OPTIMIZATION SIMULATION RESULTS
A. Scenario 1 (Base Case): Mineral Extraction is the Same in All Periods
We first assume that ore is extracted evenly in each year, so the tax structure has no impact on extraction. The value of the mine is the sum of discounted cash flows earned during its operation. We also assume that the royalty tax is set at 6 percent of production value and the profit tax is 35 percent. If the initial ore reserve is 2,000 units and 100 units are extracted in each year (see Table A1), in the 20th period the reserve is exhausted. The discounted value of the mining operation is $263. However, an equal extraction time path may not be optimal when future cash flows must be discounted.
Table A1. Scenario 1: Even Extraction Profile and Discounted Cash Flow
Assumptions:
α 0.80r 0.05β 0.95Royalty tax 0.06Profit tax 0.35
Time period q(t) x(t) V(qt)0 100 2,000 17.681 100 1,900 17.112 100 1,800 16.553 100 1,700 16.014 100 1,600 15.505 100 1,500 14.996 100 1,400 14.517 100 1,300 14.048 100 1,200 13.589 100 1,100 13.14
10 100 1,000 12.7211 100 900 12.3012 100 800 11.9113 100 700 11.5214 100 600 11.1515 100 500 10.7816 100 400 10.4417 100 300 10.1018 100 200 9.7719 100 100 9.4520 100 0
NPV 263.24

22
B. Scenario 2: Optimal Mineral Extraction
In scenario 2, using dynamic optimization we calculate the time path of ore extraction that maximizes the value of the mine, V(qt). Two constraints are imposed: each year ore extraction is nonnegative, and ore extraction stops when the mine is exhausted. The entire ore reserve is extracted because no value is assigned to ore that stays underground at the end of the planning horizon.
Table A2. Scenario 2: Optimal Extraction Profile and Discounted Cash Flow
α 0.80r 0.05β 0.95Royalty tax 0.06Profit tax 0.35
Time period q(t) x(t) V(qt)0 315 2,000 44.321 267 1,685 37.482 227 1,418 31.873 192 1,191 27.044 163 999 22.925 138 836 19.446 117 697 16.507 100 580 14.018 85 480 11.899 72 395 10.09
10 61 324 8.5611 52 263 7.2612 44 211 6.1613 37 167 5.2214 31 130 4.4215 27 98 3.7516 23 72 3.1717 19 49 2.6918 16 30 2.2819 14 14 1.9420 0 0 0.00
NPV 280.99
Table A2 shows the optimal time path of ore extraction. It is optimal to extract 315 units of ore in year 0, 267 units in year 1, 227 units in year 2, and so on. The value of the mine increases from $263 in scenario 1 to $289 in scenario 2 if the optimal time path is adopted. The optimal path slopes downward because the discount factor provides an incentive to get the mineral out of the ground quickly. However, the diminishing returns of the annual cash flow function (0<α<1) prevent even more ore being mined in the early years. It should be noted that the optimal time path fulfills both constraints: in each year ore extraction is nonnegative, and extraction stops when the mine is exhausted. The discount factor makes it worthwhile to mine ore quickly, but
23
this effect is counterbalanced by the diminishing return of the annual cash flow function. Sensitivity analysis could be done by changing the interest rate (r) and the curvature of the function (α). A rise in the interest rate increases the incentive to mine the ore quickly; increasing α implies a lower degree of diminishing returns.
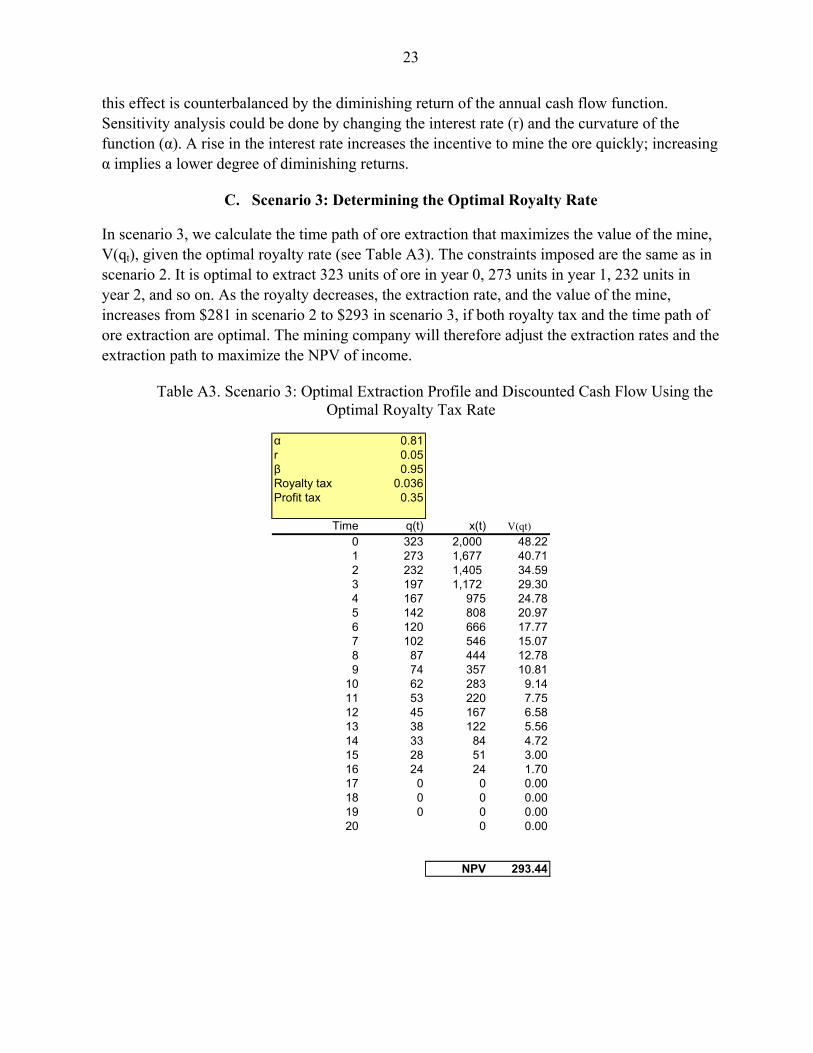
C. Scenario 3: Determining the Optimal Royalty Rate
In scenario 3, we calculate the time path of ore extraction that maximizes the value of the mine, V(qt), given the optimal royalty rate (see Table A3). The constraints imposed are the same as in scenario 2. It is optimal to extract 323 units of ore in year 0, 273 units in year 1, 232 units in year 2, and so on. As the royalty decreases, the extraction rate, and the value of the mine, increases from $281 in scenario 2 to $293 in scenario 3, if both royalty tax and the time path of ore extraction are optimal. The mining company will therefore adjust the extraction rates and the extraction path to maximize the NPV of income.
Table A3. Scenario 3: Optimal Extraction Profile and Discounted Cash Flow Using the Optimal Royalty Tax Rate
α 0.81r 0.05β 0.95Royalty tax 0.036Profit tax 0.35
Time q(t) x(t) V(qt)
0 323 2,000 48.221 273 1,677 40.712 232 1,405 34.593 197 1,172 29.304 167 975 24.785 142 808 20.976 120 666 17.777 102 546 15.078 87 444 12.789 74 357 10.81
10 62 283 9.1411 53 220 7.7512 45 167 6.5813 38 122 5.5614 33 84 4.7215 28 51 3.0016 24 24 1.7017 0 0 0.0018 0 0 0.0019 0 0 0.0020 0 0.00
NPV 293.44


