MINING QUALIFICATIONS AUTHORITY STRATEGIC PLAN FOR …
204
Page 1 of 191 MINING QUALIFICATIONS AUTHORITY STRATEGIC PLAN FOR 2015/16 – 2019/20 NOVEMBER 2016 MINING QUALIFICATIONS AUTHORITY
Transcript of MINING QUALIFICATIONS AUTHORITY STRATEGIC PLAN FOR …
Page 1 of 191
MINING QUALIFICATIONS AUTHORITY STRATEGIC PLAN FOR 2015/16 – 2019/20 NOVEMBER 2016
MINING QUALIFICATIONS A U T H O R I T Y
Page 2 of 191
FOREWORD “Digging with Skills and Knowledge”
The Mining Qualifications Authority’s strategic planning process is guided by the Medium Term Strategic Framework
(MTSF), which reflects political outcomes priorities, the Framework for the National Skills Development Strategy; and
the National Small-Scale Mining Development Framework. This is in line with changes in government’s approach to
planning, monitoring and evaluation aimed at translating the government’s election mandate into reality. The mining
and minerals industry currently employs about 495 000 direct workers and 150 000 indirect workers. In this regard the
Mining Qualifications Authority (MQA) plays a vital role in the mining industry, which forms a fundamental component in
South Africa’s economy. The MQA developed its strategic priorities for the last year of the National Skills Development
Strategy III (NSDS III) period and beyond, by developing the necessary skills development policies for the mining
and minerals sector. The skills sector plan (SSP) which was updated in August 2016, gives effect to the policies and
provides a concrete plan for the MQA to achieve its objectives.
The MQA is fully committed to achieving its goals by ensuring that the skills and human resources base of the mining
sector workforce is strengthened, improving health and safety awareness among the workforce and building cohesion
to advance national government priorities in the mining and minerals sector.

OFFICIAL SIGN-OFF
It is hereby certified that this Strategic Plan:
Was development by the management of the Mining Qualifications Authority under the guidance of the Board and the Honourable Minister of Higher Education, Dr B Nzimande;
Takes into account all the relevant policies, legislation and other mandates for which the Mining Qualifications Authority is responsible; and
Accurately reflects the strategic outcome-orientated goals and objectives which the Mining Qualifications Authority will endeavour to achieve over the
period 2015/16-2019/20.
···
Tebogo Mmotla Acting Chief Executive Officer
AmonTeteme
Labour Convenor
Vusi Mabena Employer Convenor
Page 3 of 191
..... • •••
Page 4 of 191
CONTENTS
PART A – STRATEGIC OVERVIEW 7
1 Vision............................................................................................................................. ..........................................8
2 Mission............................................................................................................................ ...............................8
3 Values ..................................................................................................................................................8
4 Legislative and other mandates...............................................................................................................8
4.2 Legislative mandates...........................................................................................................................9
4.3 Policy mandates..................................................................................................................................9
4.4 Relevant court rulings........................................................................................................ .........................10
4.5 Planned policy initiaves......................................................................................................................11 5 Situational analysis………………………………………………………………………………….11
5.1 Performance environment..................................................................................................................11
5.2 Organisational environment ...............................................................................................................16 Appendix 1 –MQA Orgonogram
5.3 Description of the strategic planning p r o c e s s ......................................................................................18
6 Strategic outcome-oriented goals of the institution....................................................................................19
Part B - Strategic Objectives 20
7. Programmes ............................................................................................................................. ...................21 7.1. Strategic objectives………………………………………………………………………………………………..21
7.2 Resource consideration .....................................................................................................................21 7.3 Risk management………………………………………………………………………………….21
Part C - links to other plans 29 Appendix 1 –MQA response to the DHET proposed targets
8. Links to the long-term infrastructure and other capital plans…………………………………………………..30
9. Conditional grants…………………………………………………………………………………………………… 35
10. Public entities……………………………………………………………………………………………………… .35 11. Public-private partnerships……………………………………………………………………………………….....35
Page 5 of 191
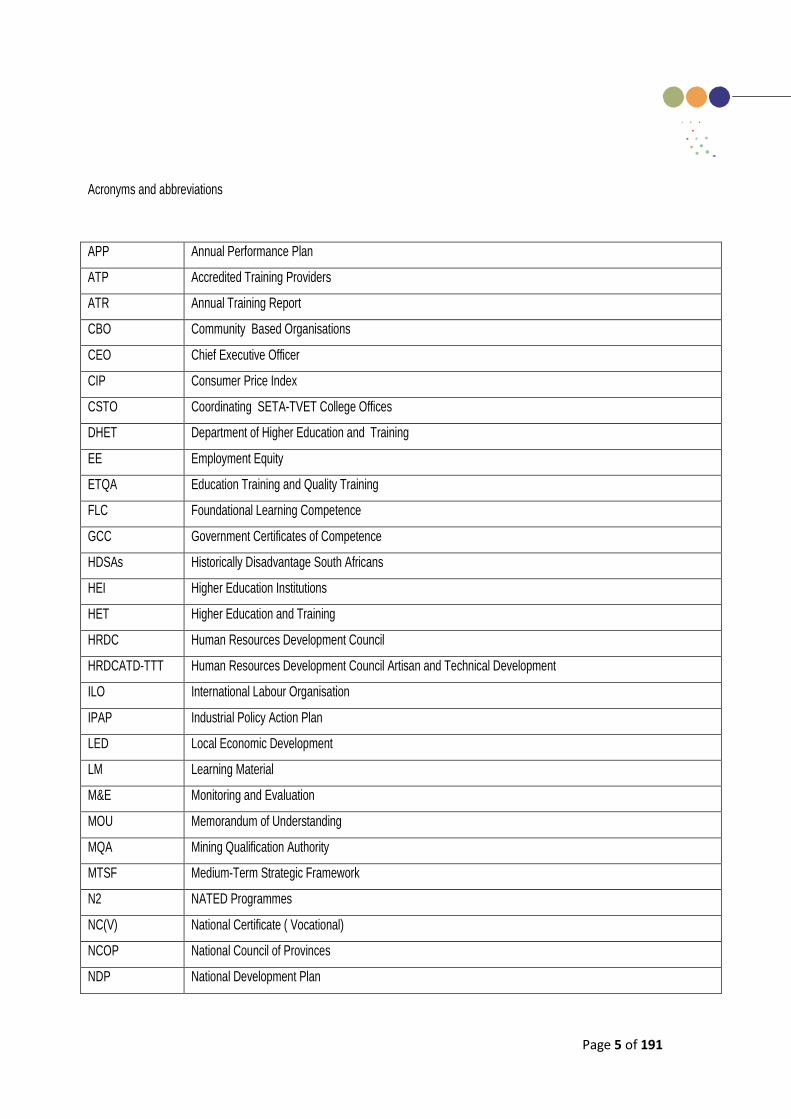
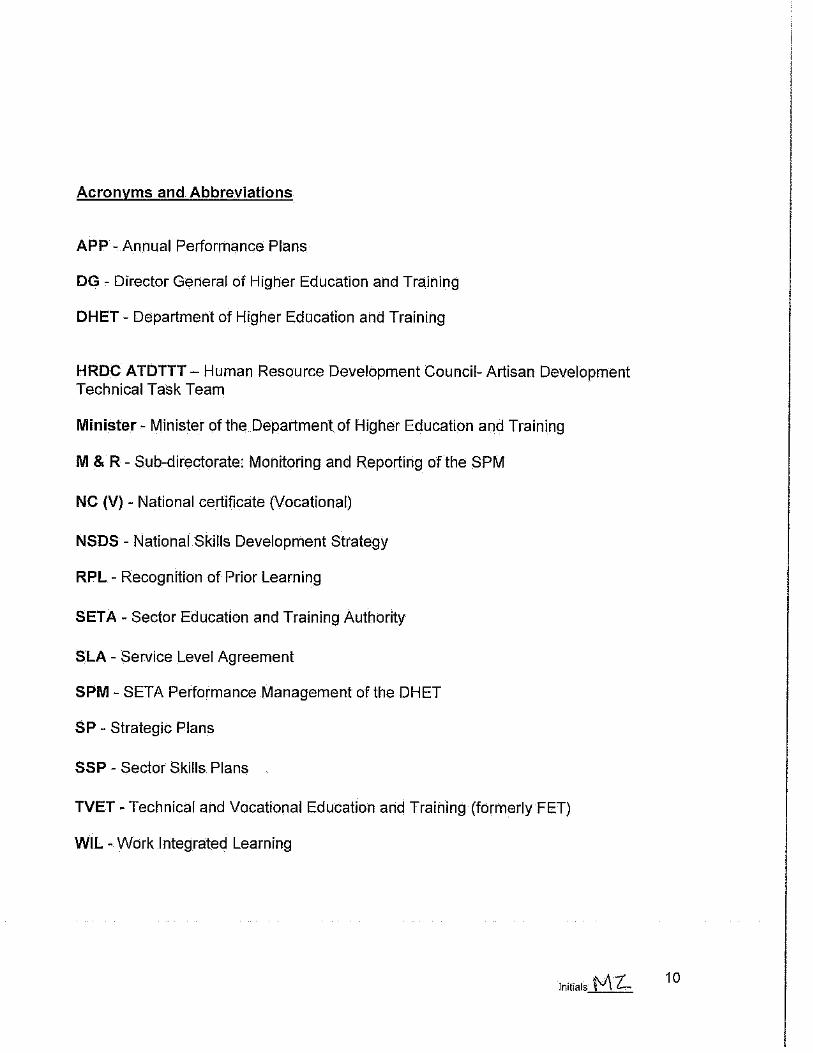
Acronyms and abbreviations APP Annual Performance Plan
ATP Accredited Training Providers
ATR Annual Training Report
CBO Community Based Organisations
CEO Chief Executive Officer
CIP Consumer Price Index
CSTO Coordinating SETA-TVET College Offices
DHET Department of Higher Education and Training
EE Employment Equity
ETQA Education Training and Quality Training
FLC Foundational Learning Competence
GCC Government Certificates of Competence
HDSAs Historically Disadvantage South Africans
HEI Higher Education Institutions
HET Higher Education and Training
HRDC Human Resources Development Council
HRDCATD-TTT Human Resources Development Council Artisan and Technical Development
ILO International Labour Organisation
IPAP Industrial Policy Action Plan
LED Local Economic Development
LM Learning Material
M&E Monitoring and Evaluation
MOU Memorandum of Understanding
MQA Mining Qualification Authority
MTSF Medium-Term Strategic Framework
N2 NATED Programmes
NC(V) National Certificate ( Vocational)
NCOP National Council of Provinces
NDP National Development Plan
Page 6 of 191
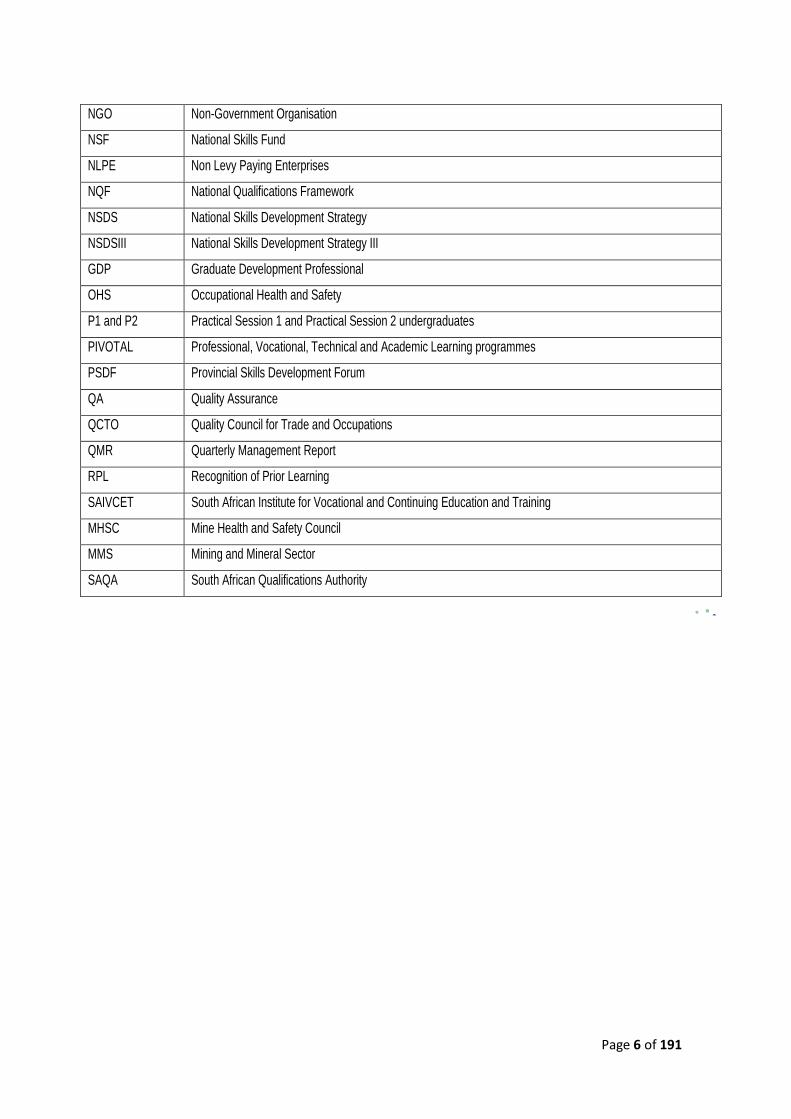
NGO Non-Government Organisation
NSF National Skills Fund
NLPE Non Levy Paying Enterprises
NQF National Qualifications Framework
NSDS National Skills Development Strategy
NSDSIII National Skills Development Strategy III
GDP Graduate Development Professional
OHS Occupational Health and Safety
P1 and P2 Practical Session 1 and Practical Session 2 undergraduates
PIVOTAL Professional, Vocational, Technical and Academic Learning programmes
PSDF Provincial Skills Development Forum
QA Quality Assurance
QCTO Quality Council for Trade and Occupations
QMR Quarterly Management Report
RPL Recognition of Prior Learning
SAIVCET South African Institute for Vocational and Continuing Education and Training
MHSC Mine Health and Safety Council
MMS Mining and Mineral Sector
SAQA South African Qualifications Authority

Page 7 of 191
. .
PART A: STRATEGIC OVERVIEW
Page 8 of 191
1. Vision
A competent, health and safety-orientated Mining and Minerals workforce.
2. Mission
To ensure that the Mining and Minerals Sector (MMS) has sufficient competent people to improve health and
safety, employment equity and increase productivity standard.
3. Values
The Mining Qualifications Authority subscribes to the following values:
a) Continuous learning;
b) Empowerment;
c) Professionalism;
d) Honesty and mutual respect; and
e) Service excellence.
4. Legislative and other mandates
The MQA is a statutory body that has the primary mandate of coordinating skills development processes and
programmes in the MMS. The primary objective of the MQA is to support the MMS to continuously develop sufficient
competent persons in occupations that are core to the MMS.
The legislative framework that the MQA operates under comprises of three primary statutes being the:
a) Mine Health and Safety Act of 1996;
b) Skills Development Act of 1998; and
c) Mineral and Petroleum Resources Development Act of 2002.
The MQA is guided by the above statutes within the framework of controls of the:
a) Public Finance Management Act;
b) Preferential Procurement Policy Framework Act;
c) Skills Development Levies Act;
d) Audit Act; and
e) King III Governance Code of Conduct.
4.1 Legislative and other mandates
Section 29(1) & (2) of the Bill of Rights states that everyone has the right to a basic education, including adult basic
education and further education, which the state, through reasonable measures, must make progressively available
and accessible.

Page 9 of 191
4.2 Legislative mandates
4.2.1 T h e Mine Health and Safety Act, 1996, (Act 29 of 1996) Section 41 (3) established the MQA on 14 June
1996 to advise the Minister of Minerals and Energy (now the Minister of Mineral Resources) on –
a) The creation of a framework for qualifications and learning achievements in the mining industry to improve health
and safety standards through proper training and education;
b) Standards and competency setting, assessment, examinations, quality assurance and accreditation in the mining
industry; and
c) Linking the qualifications framework for the mining industry to the National Qualifications Framework referred to in
the National Qualifications Framework Act, 67 of 2008.
4.2.2 The Skills Development Amendment Act, 2003 (Act 31 of 2003), Section 4A of Schedule 2 “re-established”
the MQA as follows:
Despite anything to the contrary in either this Act or the Mine Health and Safety Act, 1996 (Act 29 of 1996) and with
effect from 20 March 2000, the Mining Qualifications Authority, established in terms of Section 41(3) of the Mine Health
and Safety Act, 1996 must be regarded as having been established in terms of section 9(1) of this Act as SETA 16.
4.2.3 The Mineral and Petroleum Resources Development Act, 2002 (Act 28 of 2002) establishes that the
Minerals and Mining Development Board must in terms of Section 58(1)(b) of this Act “in consultation with the
MQA, ensure the promotion of human resources development in the minerals and mining industry”.
4.3 Policy mandates
The MQA is guided, among others, by the following policy frameworks:
a) Medium-Term Strategic Framework (MTSF) which reflects socio-political priorities. The MQA supports the
MTSF objectives of “Speeding up growth and transforming the economy to create decent work and sustainable
livelihoods”.
b) National Skills Development Strategy III. The MQA supports various outcomes of the NSDS numeracy,
promoting growth of the TVET sector and encouraging better use of workplace-based skills development.
c) Human Resources Development Strategy of South Africa. The MQA supports skills development through
projects such as management development and other transformational objectives for the sector.
d) National Skills Accord. The MQA provides for artisan development, which includes unemployed and employed
learners.
e) National Development Plan (NDP). The MQA provides for the policy by ensuring that appropriate skills
development programmes, at the further education and training band as well as the higher education and training
band, are implemented.
f) Beneficiation Strategy. Skills development initiatives for the mining beneficiation processes are provided for.
g) Broad-Based Socio-Economic Empowerment Charter for the MMS. Various programmes have been
implemented in order to support the skills needs identified for the MMS

Page 10 of 191
4.4 Relevant court rulings
The MQA is a Schedule 3(a) public entity and thus, any relevant court rulings will be implemented into the operations, programmes, and activities of MQA where applicable.

Page 11 of 191
Relevant legislative developments
National Skills Development landscape change
The Department of Higher Education & Training (DHET) published on 10 November 2015 a draft proposal for a new
National Skills Development landscape which would take effect on 1 March 2018. The MQA is guided by the policies
of the Department of Higher Education and Training and thus, any policy changes will be incorporated into the
operations, programmes, and activities of MQA as and when the need arises.
4.5 Planned policy initiatives
Not applicable. The MQA is a Schedule 3(a) public entity.
5. Situational analysis
The below situational analysis aims to highlight the MQA’s performance and environmental climate and update. This
information has been collected through research within the sector and a review of the MMS related strategy
imperatives informed by legislation and policy change. It gives insight into national and provincial layout of the MMS
relating to its size and composition of employer and employees base. An analysis of the Sector’s economic
performance is critical in understanding the MMS GDP contribution and its relation to employment and skills
development in the South African context.
5.1 Performance environment
South Africa remains one of the largest net exporters of minerals and metals. In the mining industry South Africa is an
important global hub with deep backward vertical integration and a fully-fledged supply industry serving both South
African and foreign companies. South Africa accounts for 96% of known global reserves of the platinum group metals
(PGMs), 74% of chrome, 26% manganese and 11% of gold reserves
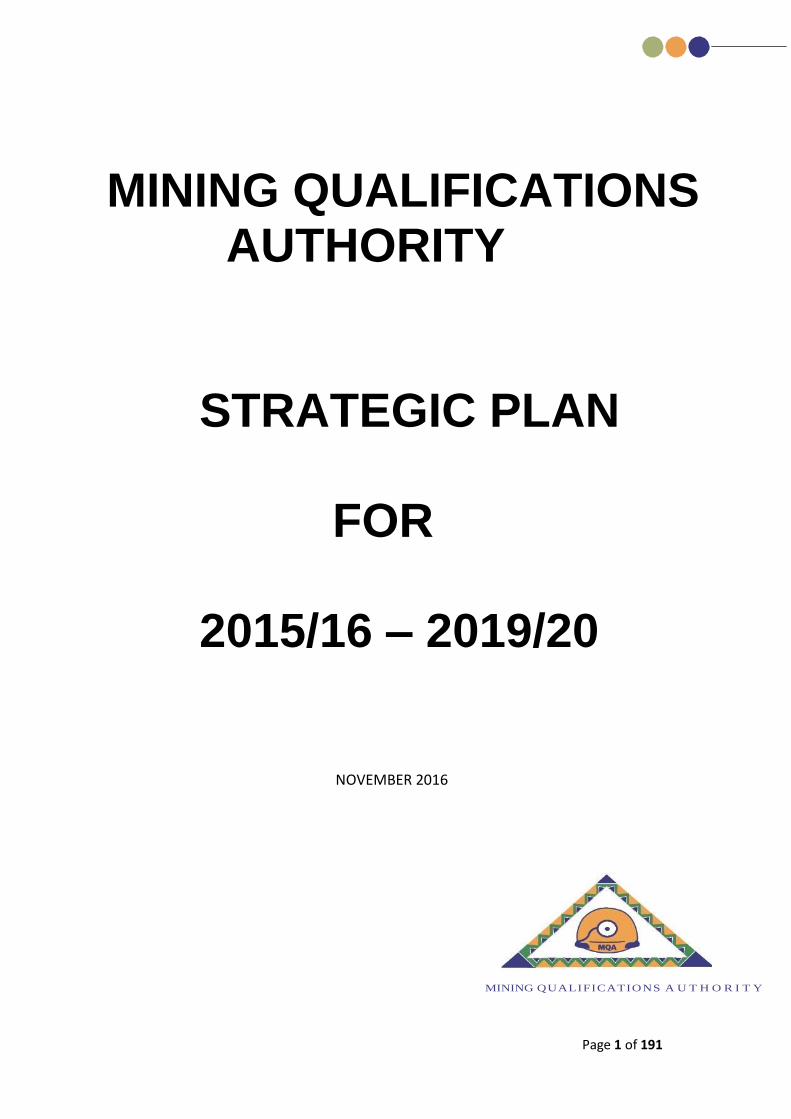
The below explains the MMS’ value chain showing primary activities from exploration to minerals value addition and the
support activities in each stage of the value chain.
FIGURE 1: MINING AND MINERALS SECTOR VALUE CHAIN
Source: Underhill Corporate Solutions illustration based on Ecopartners
Page 12 of 191
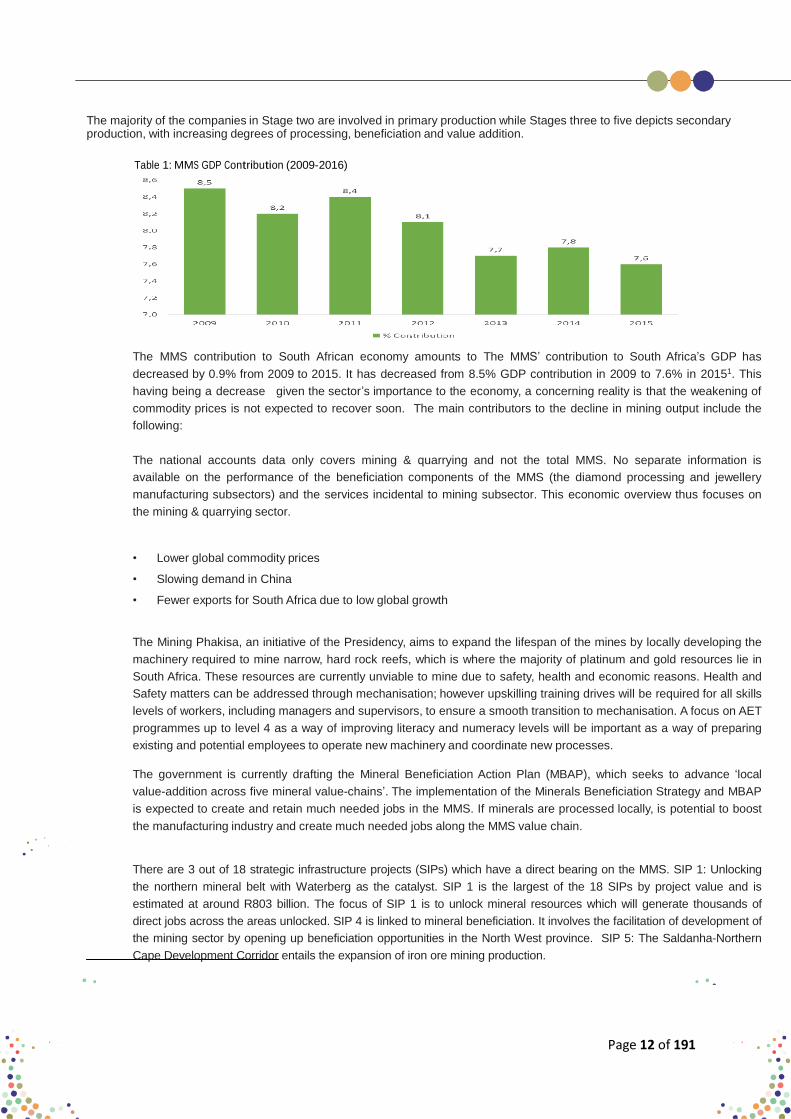
The majority of the companies in Stage two are involved in primary production while Stages three to five depicts secondary production, with increasing degrees of processing, beneficiation and value addition.
Table 1: MMS GDP Contribution (2009-2016)
The MMS contribution to South African economy amounts to The MMS’ contribution to South Africa’s GDP has
decreased by 0.9% from 2009 to 2015. It has decreased from 8.5% GDP contribution in 2009 to 7.6% in 20151. This
having being a decrease given the sector’s importance to the economy, a concerning reality is that the weakening of
commodity prices is not expected to recover soon. The main contributors to the decline in mining output include the
following:
The national accounts data only covers mining & quarrying and not the total MMS. No separate information is
available on the performance of the beneficiation components of the MMS (the diamond processing and jewellery
manufacturing subsectors) and the services incidental to mining subsector. This economic overview thus focuses on
the mining & quarrying sector.
• Lower global commodity prices
• Slowing demand in China
• Fewer exports for South Africa due to low global growth
The Mining Phakisa, an initiative of the Presidency, aims to expand the lifespan of the mines by locally developing the
machinery required to mine narrow, hard rock reefs, which is where the majority of platinum and gold resources lie in
South Africa. These resources are currently unviable to mine due to safety, health and economic reasons. Health and
Safety matters can be addressed through mechanisation; however upskilling training drives will be required for all skills
levels of workers, including managers and supervisors, to ensure a smooth transition to mechanisation. A focus on AET
programmes up to level 4 as a way of improving literacy and numeracy levels will be important as a way of preparing
existing and potential employees to operate new machinery and coordinate new processes.
The government is currently drafting the Mineral Beneficiation Action Plan (MBAP), which seeks to advance ‘local
value-addition across five mineral value-chains’. The implementation of the Minerals Beneficiation Strategy and MBAP
is expected to create and retain much needed jobs in the MMS. If minerals are processed locally, is potential to boost
the manufacturing industry and create much needed jobs along the MMS value chain.
There are 3 out of 18 strategic infrastructure projects (SIPs) which have a direct bearing on the MMS. SIP 1: Unlocking
the northern mineral belt with Waterberg as the catalyst. SIP 1 is the largest of the 18 SIPs by project value and is
estimated at around R803 billion. The focus of SIP 1 is to unlock mineral resources which will generate thousands of
direct jobs across the areas unlocked. SIP 4 is linked to mineral beneficiation. It involves the facilitation of development of
the mining sector by opening up beneficiation opportunities in the North West province. SIP 5: The Saldanha-Northern
Cape Development Corridor entails the expansion of iron ore mining production.

Page 13 of 191
BELOW IS A FIVE YEAR TREND ANALYSIS OF THE MMS LABOUR PROFILE FOR THE PERIOD 2012-2016.
Figure 2: Employee Breakdown within MMS over a 5 year period:
Total employment in the MMS has been declining over the years. As of 31st May 2016, the MMS employs an estimated
520 003 people, which is a 1% decrease from 2015, and a 17.3% drop since 2012.
Source: Calculated from weighted MQA WSP/ATR submissions (2012-2016)
Total employment in the MMS has been declining over the years. As of 31st May 2016, the MMS employs an estimated
520 003 people, which is a 1% decrease from 2015, and a 17.3% drop since 2012. 2
Figure 3: Occupational Distribution of Labour over a 5 year period
Source: Calculated from weighted MQA WSP/ATR submissions (2012-2016)
The analysis of employment data by occupational categories shows that the biggest decreases in employment numbers
are found in the elementary occupations, with a 26% decrease since 2012. Of this 18.4% are within the Plant and Machine
Operators & Assemblers category. The Technicians & Associate Professionals category have experienced a 17.6% decrease
since 2012.
Page 14 of 191
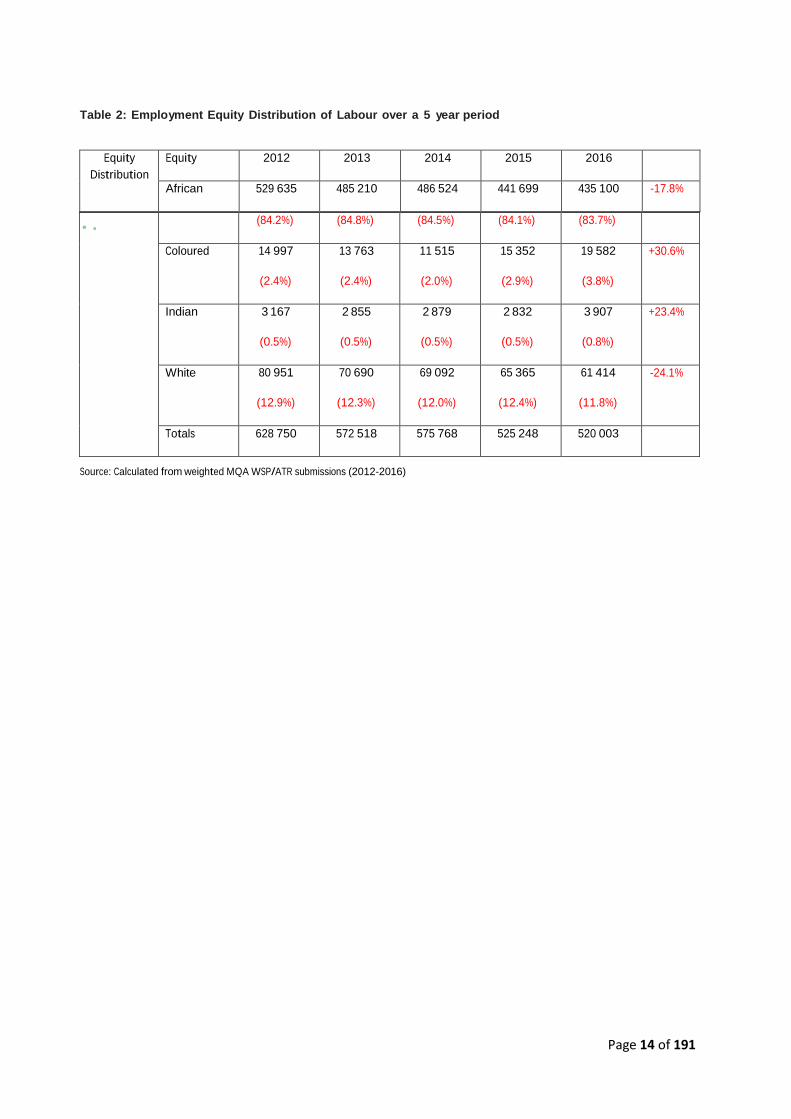
Table 2: Employment Equity Distribution of Labour over a 5 year period
Equity
Distribution
Equity 2012 2013 2014 2015 2016
African 529 635 485 210 486 524 441 699 435 100 -17.8%
Source: Calculated from weighted MQA WSP/ATR submissions (2012-2016)
(84.2%) (84.8%) (84.5%) (84.1%) (83.7%)
Coloured 14 997
(2.4%)
13 763
(2.4%)
11 515
(2.0%)
15 352
(2.9%)
19 582
(3.8%)
+30.6%
Indian 3 167
(0.5%)
2 855
(0.5%)
2 879
(0.5%)
2 832
(0.5%)
3 907
(0.8%)
+23.4%
White 80 951
(12.9%)
70 690
(12.3%)
69 092
(12.0%)
65 365
(12.4%)
61 414
(11.8%)
-24.1%
Totals 628 750 572 518 575 768 525 248 520 003

Page 15 of 191
The overall composition of employees by race shows that Africans have been, and continue to be, the dominant group in the
MMS. In 2016 the total employment number of Africans decreased by 0.4% between 2012 and 2016. There has been a
24.1% decrease in White employment during the same period. Coloured employment experienced an increase in numbers
from 2015 to 2016 compared to the previous 4 years, The Indian group is consistently the least represented in the MMS
constituting less than 1%, although the numbers increased by 38% from 2015 to 2016.
Figure 4: Gender Distribution of Labour over a 5 year period
Source: Calculated from weighted MQA WSP/ATR submissions (2012-2016)
Although the sector is historically male-dominated, the proportion of females has been increasing gradually, from 11%
in 2012, to 14.5% in 2016.

Page 16 of 191
Figure 5: Management Equity in Labour Distribution over a 5 year period
Source: Calculated from weighted MQA WSP/ATR submissions (2012-2016)
In terms of E q u i t y i n management, there has been an overall increase o f Africans in management positions, Coloureds and Indians. In 2012, these 3 race groups together constituted 37.7% of management, 42.4% in 2013, a decrease to
37.5% in 2014 and increase to 39% in 2015, and then showing the highest proportion across the 5 years in 2016,
with 42.5% of management. Regarding gender, African, Coloured and Indian females together constitute 9.1% of
management
IMPLICATIONS OF THE SITUATIONAL ANALYSIS FINDINGS FOR SKILLS DEVELOPMENT
The main implications for skills development in the sector are summarised below:
• There has been a decrease in employment figures over the last few years. This shows that the sector has been
retrenching. The MQA and other role players need to pay special attention to the reskilling of retrenched workers
so that they can be absorbed into other sectors of the formal labour market.
• The MMS is still faced with specific challenges relating to labour market profile. HDSA and women in particular are
underrepresented in the MMS management notwithstanding the targets set out in the mining charter which
states that women should makeup 105 of companies’ workforce and at least 40% of HDSA should be in
management positions. Achieving greater transformation in ownership within mining sector is also imperative as it
will improve both transformational and competitiveness targets.
• There are still racial and gender disparities in the demographic composition of the industry signaling the
need for role-players to continue to address workforce imbalances. The MQA might need to consider a
reallocation of the discretionary grant to support industry to increase the uptake and throughput of historically
disadvantaged individuals, particularly women, in the MMS training and skills development pipeline.
• The MQA is to monitor the developments of Mining Phakisa and prepare existing and potential employees
accordingly in terms of skills requirement; as well as take advantage of the implementation of the Mineral
Beneficiation Action Plan (MBAP) and the SIPs projects, which are
expected to lead to increased economic activity and the creation of new jobs in South Africa
Page 17 of 191
• An analysis of the skills requirements and supply mechanisms for the above is to be thoroughly researched to
ascertain the nature and level of skills to develop in supporting these initiatives. Relevant skills need to be prioritised.
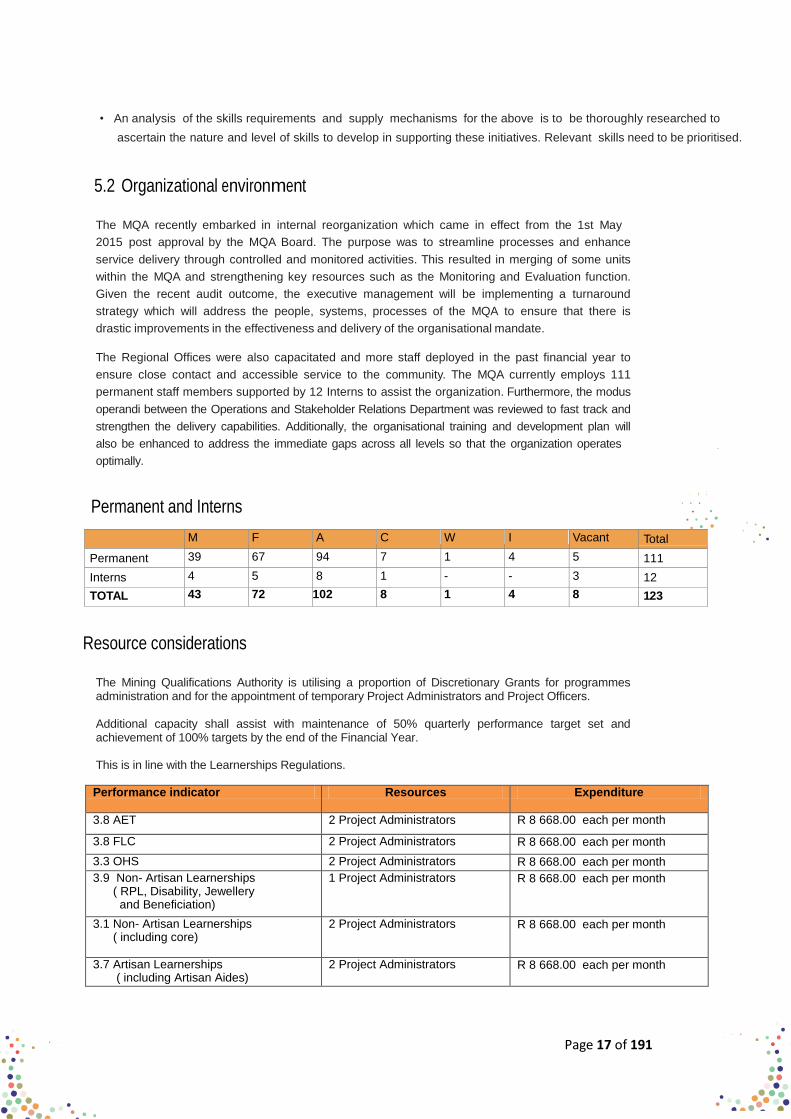
5.2 Organizational environment
The MQA recently embarked in internal reorganization which came in effect from the 1st May
2015 post approval by the MQA Board. The purpose was to streamline processes and enhance
service delivery through controlled and monitored activities. This resulted in merging of some units
within the MQA and strengthening key resources such as the Monitoring and Evaluation function.
Given the recent audit outcome, the executive management will be implementing a turnaround
strategy which will address the people, systems, processes of the MQA to ensure that there is
drastic improvements in the effectiveness and delivery of the organisational mandate.
The Regional Offices were also capacitated and more staff deployed in the past financial year to
ensure close contact and accessible service to the community. The MQA currently employs 111
permanent staff members supported by 12 Interns to assist the organization. Furthermore, the modus
operandi between the Operations and Stakeholder Relations Department was reviewed to fast track and
strengthen the delivery capabilities. Additionally, the organisational training and development plan will
also be enhanced to address the immediate gaps across all levels so that the organization operates
optimally.
Permanent and Interns
M F A C W I Vacant Total
Permanent 39 67 94 7 1 4 5 111
Interns 4 5 8 1 - - 3 12
TOTAL 43 72 102 8 1 4 8 123
Resource considerations
The Mining Qualifications Authority is utilising a proportion of Discretionary Grants for programmes administration and for the appointment of temporary Project Administrators and Project Officers. Additional capacity shall assist with maintenance of 50% quarterly performance target set and achievement of 100% targets by the end of the Financial Year. This is in line with the Learnerships Regulations.
Performance indicator Resources Expenditure
3.8 AET 2 Project Administrators R 8 668.00 each per month
3.8 FLC 2 Project Administrators R 8 668.00 each per month
3.3 OHS 2 Project Administrators R 8 668.00 each per month
3.9 Non- Artisan Learnerships ( RPL, Disability, Jewellery and Beneficiation)
1 Project Administrators R 8 668.00 each per month
3.1 Non- Artisan Learnerships ( including core)
2 Project Administrators
R 8 668.00 each per month
3.7 Artisan Learnerships ( including Artisan Aides)
2 Project Administrators R 8 668.00 each per month
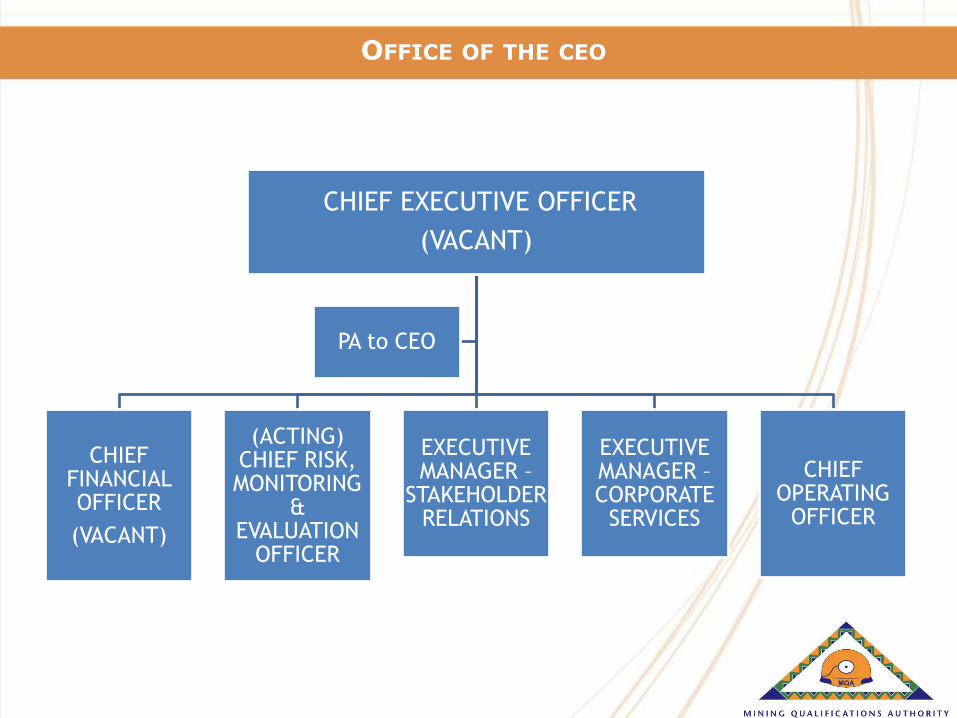
OFFICE OF THE CEO
CHIEF EXECUTIVE OFFICER
(VACANT)
CHIEF FINANCIAL OFFICER
(VACANT)
(ACTING) CHIEF RISK, MONITORING
& EVALUATION
OFFICER
EXECUTIVE MANAGER –
STAKEHOLDER RELATIONS
EXECUTIVE MANAGER – CORPORATE
SERVICES
CHIEF OPERATING
OFFICER
PA to CEO
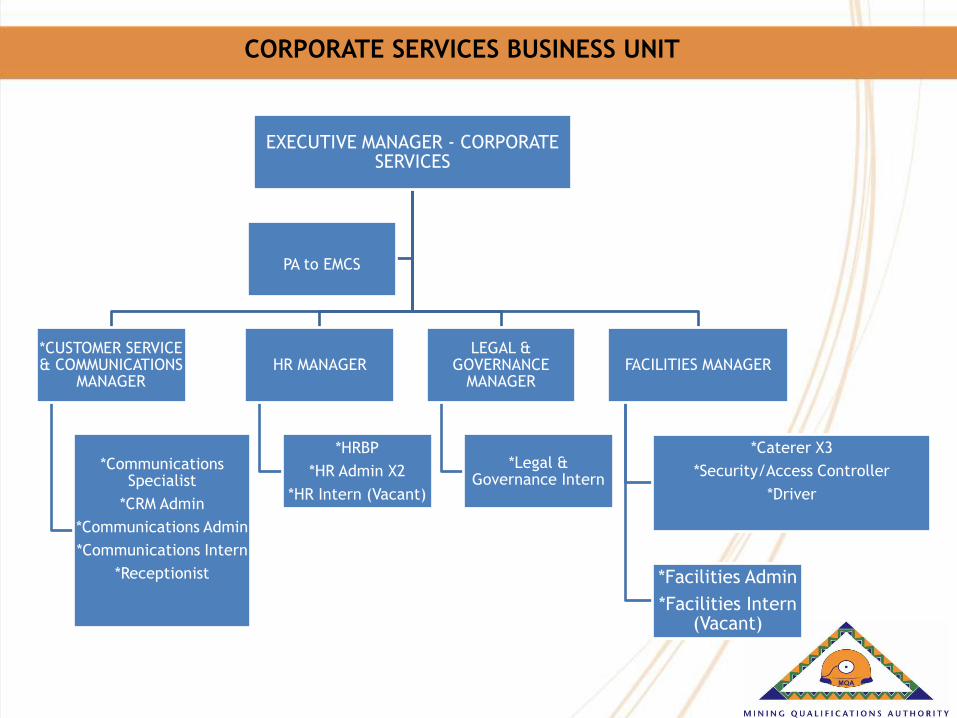
CORPORATE SERVICES BUSINESS UNIT
EXECUTIVE MANAGER - CORPORATE SERVICES
*CUSTOMER SERVICE & COMMUNICATIONS
MANAGER
*Communications Specialist
*CRM Admin
*Communications Admin
*Communications Intern
*Receptionist
HR MANAGER
*HRBP
*HR Admin X2
*HR Intern (Vacant)
LEGAL & GOVERNANCE
MANAGER
*Legal & Governance Intern
FACILITIES MANAGER
*Caterer X3
*Security/Access Controller
*Driver
*Facilities Admin
*Facilities Intern (Vacant)
PA to EMCS
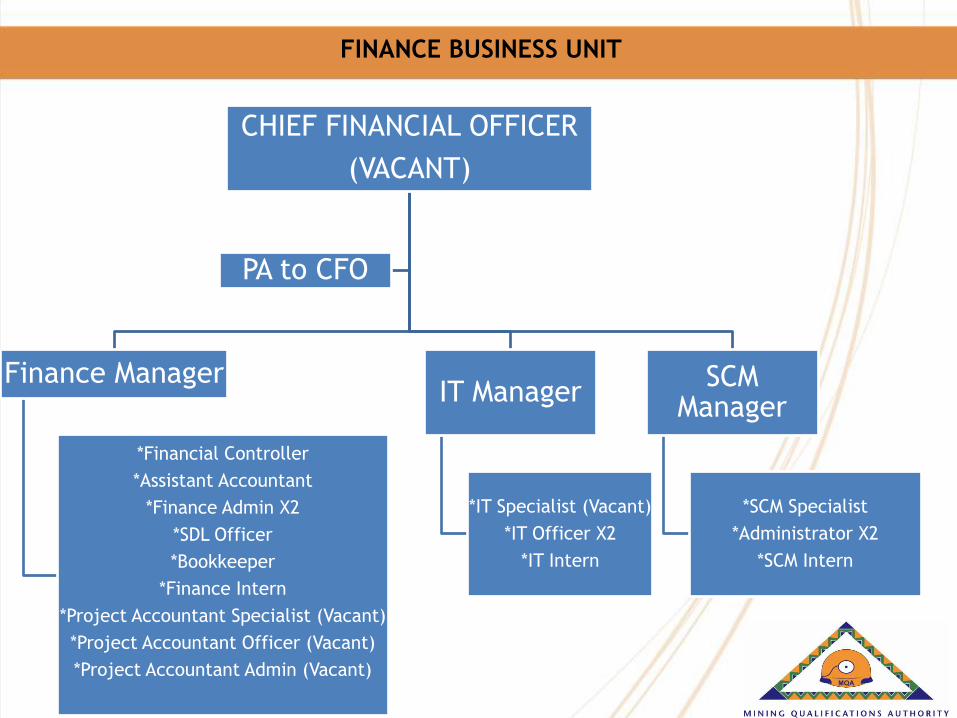
FINANCE BUSINESS UNIT
CHIEF FINANCIAL OFFICER
(VACANT)
Finance Manager
*Financial Controller
*Assistant Accountant
*Finance Admin X2
*SDL Officer
*Bookkeeper
*Finance Intern
*Project Accountant Specialist (Vacant)
*Project Accountant Officer (Vacant)
*Project Accountant Admin (Vacant)
IT Manager
*IT Specialist (Vacant)
*IT Officer X2
*IT Intern
SCM Manager
*SCM Specialist
*Administrator X2
*SCM Intern
PA to CFO

MONITORING & EVALUATION BUSINESS UNIT
CHIEF RISK, MONITORING & EVALUATION OFFICER
MONITORING & EVALUATION –
M & E Manager
*M & E Specialist
RISK & FRAUD ADMINISTRATION - M & E Manager
*M & E Specialist
COMPLIANCE MANAGEMENT –
M & E Manager
*M & E Specialist
Risk, M & E & EMSR PA
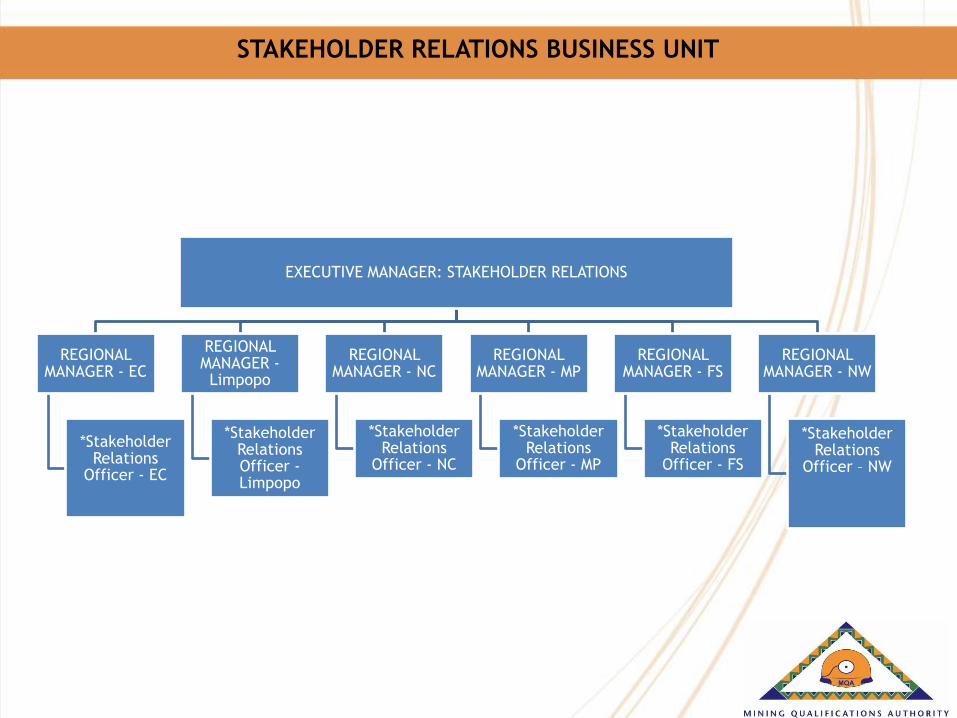
STAKEHOLDER RELATIONS BUSINESS UNIT
EXECUTIVE MANAGER: STAKEHOLDER RELATIONS
REGIONAL MANAGER - EC
*Stakeholder Relations
Officer - EC
REGIONAL MANAGER - Limpopo
*Stakeholder Relations Officer - Limpopo
REGIONAL MANAGER - NC
*Stakeholder Relations
Officer - NC
REGIONAL MANAGER - MP
*Stakeholder Relations
Officer - MP
REGIONAL MANAGER - FS
*Stakeholder Relations
Officer - FS
REGIONAL MANAGER - NW
*Stakeholder Relations
Officer – NW

OPERATIONS BUSINESS UNIT
CHIEF OPERATING OFFICER
STRATEGIC PLANNING MANAGER
*Snr Planning Administrator
SDR MANAGER
*SD Specialist
*SDR Specialist
*SDR Admin
*Research Admin
SDR Intern (Vacant)
LP MANAGER: OPERATIONS PROJECTS
*Non-artisan Specialist
*OHS & FLC Specialist;
*AET Specialist
* Artisan Development Specialist
*Artisan Development Admin
(X4)
*Non-artisan Learnership
*OHS & FLC Admin
*AET Admin
*Special Projects Admin (Vacant)
*LP Intern x2
LP MANAGER: STRATEGIC PROJECTS
Strategic Projects Specialist
*Internships Specialist
*Bursary Specialist
*Work Experience Specialist
Work Experience Admin
*Projects Admin
*Internships Admin
*Bursary Admin
*Strategic projects Intern
ETQA Manager
*QA Specialist *Learning Material Specialist
*ETQA Specialist X2
*Program Evaluation Specialist
*Monitoring & Learner Achievement Specialist
*Certification Admin X5
*ETQA Admin
*ETQA Admin (Vacant)
*QA Admin X2
*Accreditation Admin
ETQA Interns X2
PA to COO

Page 18 of 191
5.3 Description of the strategic planning process
The MQA has consulted with various stakeholders to inform the strategic plan:
Committee(s) Date(s)
Executive Committee/CEO session 03 June 2016
Operations Unit Line Managers (Strategic session) 28 & 29 July 2016
Board (Strategic session) 29 August 2016
MQA Executive consolidation of inputs from all relevant stakeholders
including:
• State • Organised Labour
• Employers
29 August 2016
Submission of the first draft Strategic Plan to DHET and National Treasury 31 August 2016
Executive Management Strategic Session 31 August & 1 September 2016
Board Strategic Session 12 September 2016
Strategic Plan Feedback session with DHET 12 October 2016
MQA executive and management session 27 October 2016
Submission of the Final Strategic Plan to DHET 15 November 2016

Page 19 of 191
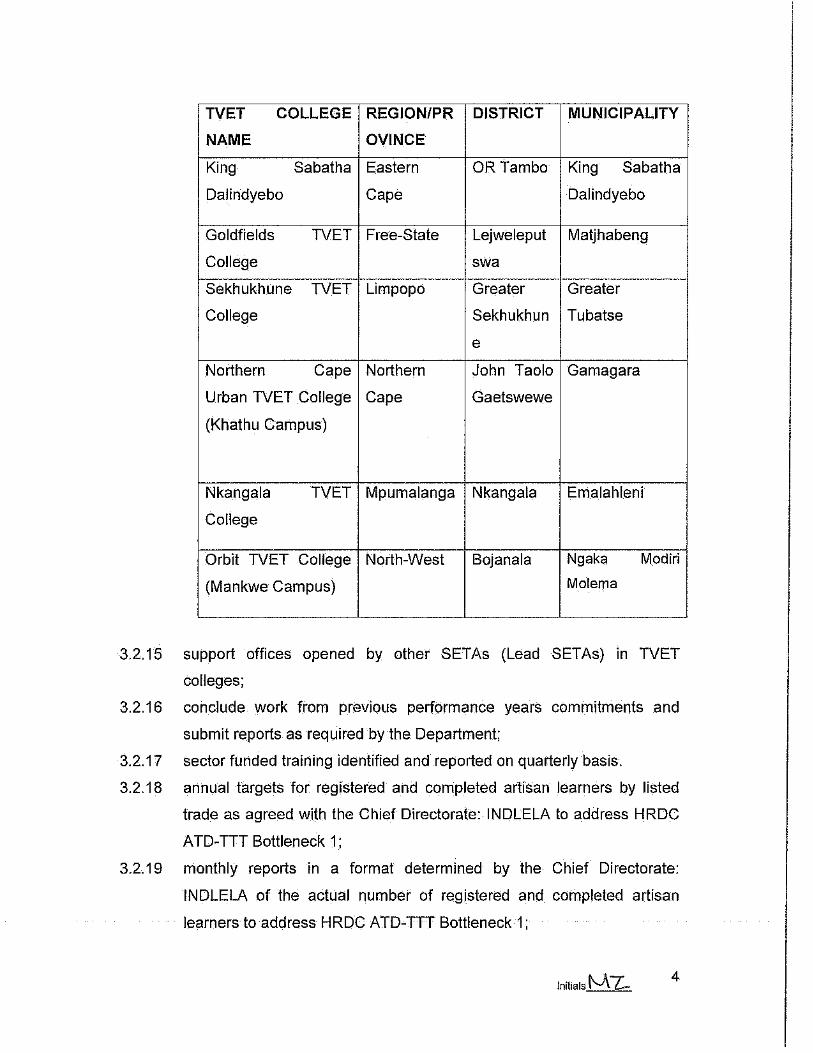
6. Strategic outcome-oriented goals of the institution
Strategic Outcome-orientated
Goal 1
Implement an efficient, effective and transparent corporate
governance system within the legislative framework
Goal Statement Provide strategic direction over the strategic plan period to leverage policy, human capital, processes and systems to deliver on the organizational mandate within the appropriate governance and legislative framework.
Strategic Outcome-orientated
Goal 2
Lead sector skills planning through research
Goal Statement Strengthen skills development planning and decision making capacity through responsive and credible institutional research for the duration of the strategic plan.
Strategic Outcome-orientated
Goal 3
Support transformation of the sector through skills
development.
Goal Statement For the duration of the strategic plan, the MQA will
facilitate the delivery of core and non-core sector
learning programmes aligned to the qualifications
framework, to promote the NSDS III and Mining Charter
transformation imperatives by focusing on the MMS
workforce, particularly HDSAs; retrenches, youth, women
and people with disabilities within mining communities and
labour sending areas.
Strategic Outcome-orientated
Goal 4
Ensure the delivery of quality programmes in the MMS
Goal Statement Implement quality assurance of training delivery, capacity
and infrastructure through the review, evaluation and
monitoring of learning materials and training providers for
the duration of the strategic plan.
Page 20 of 191
PART B:
STRATEGIC OBJECTIVES

Page 21 of 191
7a. Programme 1: Administration
7.1a Strategic objectives
Strategic Objective 1 Promote efficient and effective governance and administration.
Objective Statement By the end of the 2017-18 financial year, the MQA will improve the efficient
and effective management of human resources, legal, marketing and
communications, ICT, finance, supply chain management, M&E and
stakeholder relations to achieve its mandate.
Baseline Qualified audit outcome in 2015-16
Justification Create an environment that is conducive to enable effective and efficient
skills delivery.
Links PFMA, NDP 2030, outcome 5 of national government priorities that promote
a skilled and capable workforce to support an inclusive
7. 2a Resource considerations
Administration expenditure including the 0.5% transfer to the Quality Council for Trades and Occupations (QCTO) in the
financial years 2013/14 – 2015/16 remained within the regulated 10,5% as per SETA Grant regulations. A number of
interventions to strengthen the MQA’s governance and operational environment including development of a turnaround
strategy to address the qualified audit opinion, improvement of information systems among others will continue to be
implemented. However, the expenditure for the Administration programme is projected to stay within the regulated level
as improvements are deployed throughout the organisation. The medium term expenditure framework projections show
an increase from about R144,7 million in 2017/18 to about R163, 3 million in 2019/20.
7.3a Risk management
# Risk Description Consequences Mitigation Plans
1 Reputational risk Lack of trust by stakeholders may
result in lost opportunities for Public
Private Partnerships and funding
requests.
Lack of buy in by stakeholders
in MQA existing and proposed
interventions.
Implement the approved
turnaround strategy to address
exceptions raised by the Auditor-
General
Enhance declaration of interest
mechanisms, verification and
accountability thereof.
Conduct internal control reviews
and monitor and evaluate
reported incidents of fraud and
corruption.
Page 22 of 191
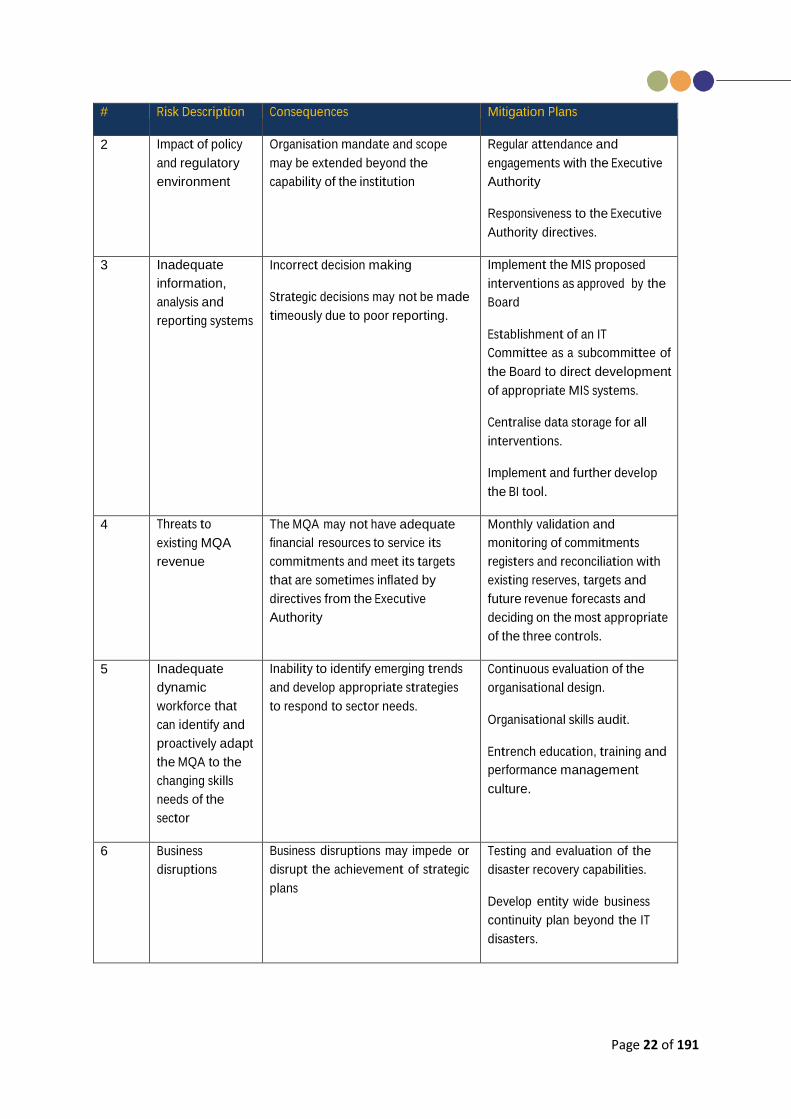
# Risk Description Consequences Mitigation Plans
2 Impact of policy
and regulatory
environment
Organisation mandate and scope
may be extended beyond the
capability of the institution
Regular attendance and
engagements with the Executive
Authority
Responsiveness to the Executive
Authority directives.
3 Inadequate
information,
analysis and
reporting systems
Incorrect decision making
Strategic decisions may not be made
timeously due to poor reporting.
Implement the MIS proposed
interventions as approved by the
Board
Establishment of an IT
Committee as a subcommittee of
the Board to direct development
of appropriate MIS systems.
Centralise data storage for all
interventions.
Implement and further develop
the BI tool.
4 Threats to
existing MQA
revenue
The MQA may not have adequate
financial resources to service its
commitments and meet its targets
that are sometimes inflated by
directives from the Executive
Authority
Monthly validation and
monitoring of commitments
registers and reconciliation with
existing reserves, targets and
future revenue forecasts and
deciding on the most appropriate
of the three controls.
5 Inadequate
dynamic
workforce that
can identify and
proactively adapt
the MQA to the
changing skills
needs of the
sector
Inability to identify emerging trends
and develop appropriate strategies
to respond to sector needs.
Continuous evaluation of the
organisational design.
Organisational skills audit.
Entrench education, training and
performance management
culture.
6 Business
disruptions
Business disruptions may impede or
disrupt the achievement of strategic
plans
Testing and evaluation of the
disaster recovery capabilities.
Develop entity wide business
continuity plan beyond the IT
disasters.
Page 23 of 191
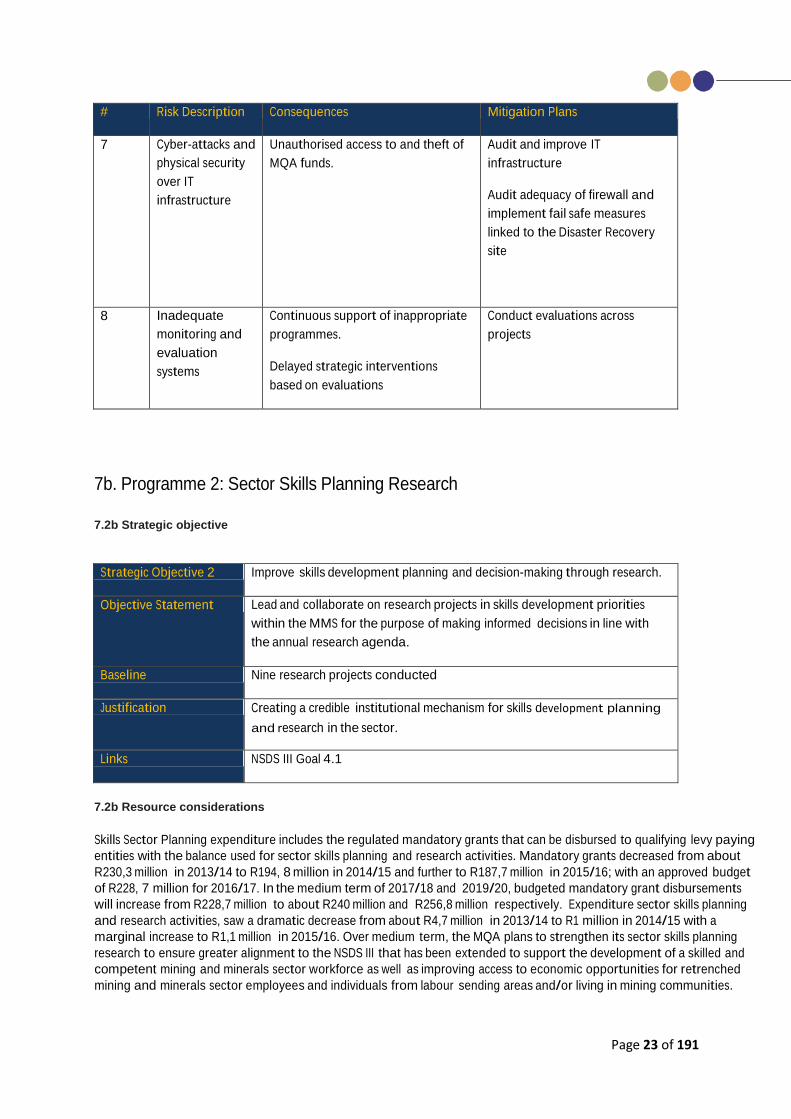
# Risk Description Consequences Mitigation Plans
7 Cyber-attacks and
physical security
over IT
infrastructure
Unauthorised access to and theft of
MQA funds.
Audit and improve IT
infrastructure
Audit adequacy of firewall and
implement fail safe measures
linked to the Disaster Recovery
site
8 Inadequate
monitoring and
evaluation
systems
Continuous support of inappropriate
programmes.
Delayed strategic interventions
based on evaluations
Conduct evaluations across
projects
7b. Programme 2: Sector Skills Planning Research 7.2b Strategic objective
Strategic Objective 2 Improve skills development planning and decision-making through research.
Objective Statement Lead and collaborate on research projects in skills development priorities
within the MMS for the purpose of making informed decisions in line with
the annual research agenda.
Baseline Nine research projects conducted
Justification Creating a credible institutional mechanism for skills development planning
and research in the sector.
Links NSDS III Goal 4.1
7.2b Resource considerations
Skills Sector Planning expenditure includes the regulated mandatory grants that can be disbursed to qualifying levy paying
entities with the balance used for sector skills planning and research activities. Mandatory grants decreased from about
R230,3 million in 2013/14 to R194, 8 million in 2014/15 and further to R187,7 million in 2015/16; with an approved budget
of R228, 7 million for 2016/17. In the medium term of 2017/18 and 2019/20, budgeted mandatory grant disbursements
will increase from R228,7 million to about R240 million and R256,8 million respectively. Expenditure sector skills planning
and research activities, saw a dramatic decrease from about R4,7 million in 2013/14 to R1 million in 2014/15 with a
marginal increase to R1,1 million in 2015/16. Over medium term, the MQA plans to strengthen its sector skills planning
research to ensure greater alignment to the NSDS III that has been extended to support the development of a skilled and
competent mining and minerals sector workforce as well as improving access to economic opportunities for retrenched
mining and minerals sector employees and individuals from labour sending areas and/or living in mining communities.
Page 24 of 191
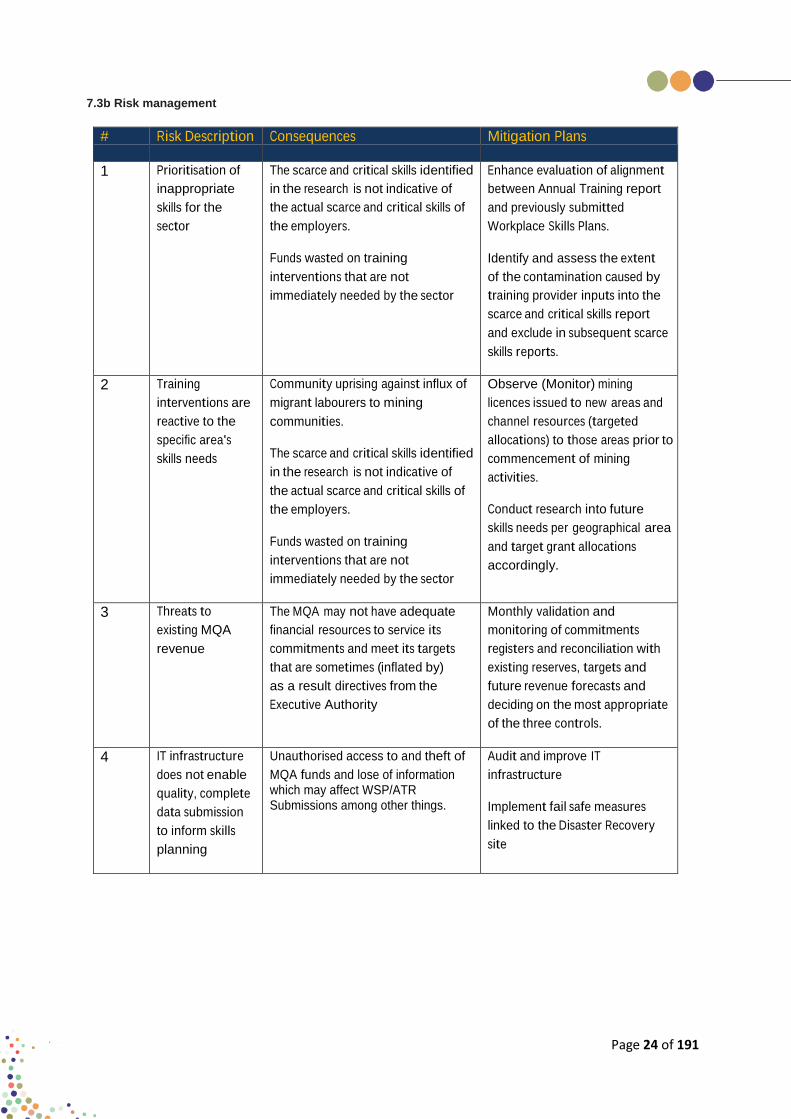
7.3b Risk management
# Risk Description Consequences Mitigation Plans
1 Prioritisation of
inappropriate
skills for the
sector
The scarce and critical skills identified
in the research is not indicative of
the actual scarce and critical skills of
the employers.
Funds wasted on training
interventions that are not
immediately needed by the sector
Enhance evaluation of alignment
between Annual Training report
and previously submitted
Workplace Skills Plans.
Identify and assess the extent
of the contamination caused by
training provider inputs into the
scarce and critical skills report
and exclude in subsequent scarce
skills reports.
2 Training
interventions are
reactive to the
specific area's
skills needs
Community uprising against influx of
migrant labourers to mining
communities.
The scarce and critical skills identified
in the research is not indicative of
the actual scarce and critical skills of
the employers.
Funds wasted on training
interventions that are not
immediately needed by the sector
Observe (Monitor) mining
licences issued to new areas and
channel resources (targeted
allocations) to those areas prior to
commencement of mining
activities.
Conduct research into future
skills needs per geographical area
and target grant allocations
accordingly.
3 Threats to
existing MQA
revenue
The MQA may not have adequate
financial resources to service its
commitments and meet its targets
that are sometimes (inflated by)
as a result directives from the
Executive Authority
Monthly validation and
monitoring of commitments
registers and reconciliation with
existing reserves, targets and
future revenue forecasts and
deciding on the most appropriate
of the three controls.
4 IT infrastructure
does not enable
quality, complete
data submission
to inform skills
planning
Unauthorised access to and theft of
MQA funds and lose of information which may affect WSP/ATR Submissions among other things.
Audit and improve IT
infrastructure
Implement fail safe measures
linked to the Disaster Recovery
site
Page 25 of 191
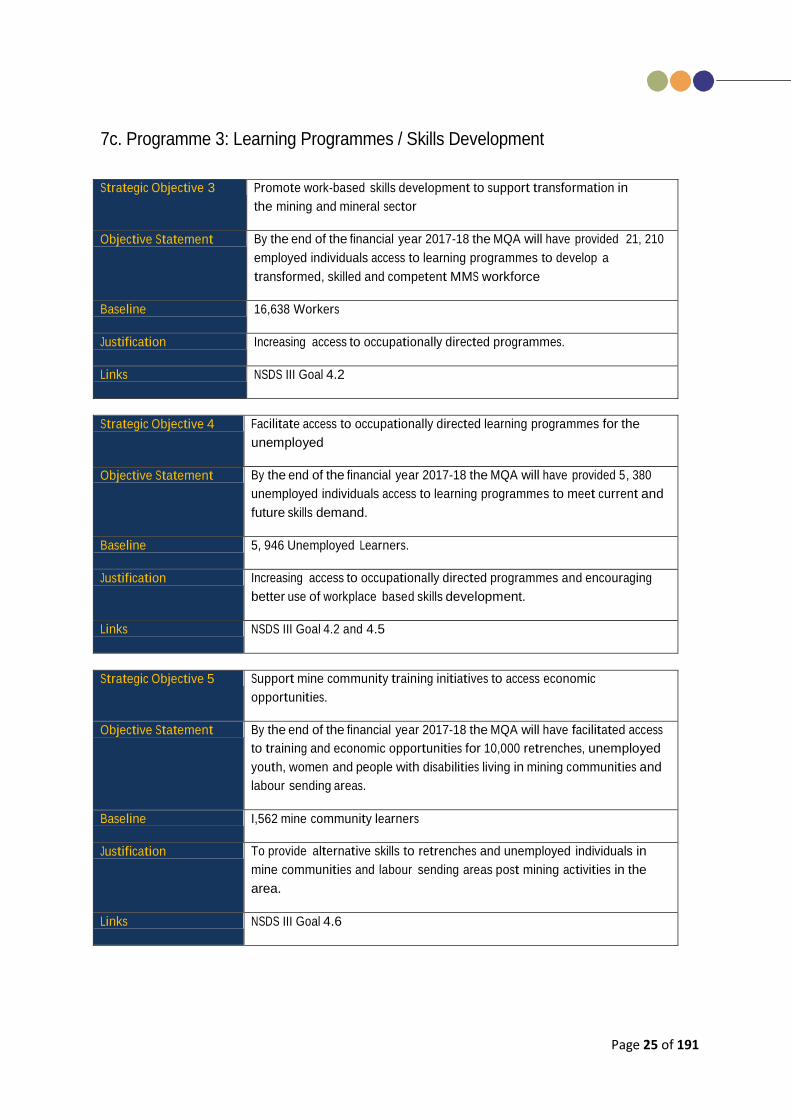
7c. Programme 3: Learning Programmes / Skills Development
Strategic Objective 3 Promote work-based skills development to support transformation in
the mining and mineral sector
Objective Statement By the end of the financial year 2017-18 the MQA will have provided 21, 210
employed individuals access to learning programmes to develop a
transformed, skilled and competent MMS workforce
Baseline 16,638 Workers
Justification Increasing access to occupationally directed programmes.
Links NSDS III Goal 4.2
Strategic Objective 4 Facilitate access to occupationally directed learning programmes for the
unemployed
Objective Statement By the end of the financial year 2017-18 the MQA will have provided 5, 380
unemployed individuals access to learning programmes to meet current and
future skills demand.
Baseline 5, 946 Unemployed Learners.
Justification Increasing access to occupationally directed programmes and encouraging
better use of workplace based skills development.
Links NSDS III Goal 4.2 and 4.5
Strategic Objective 5 Support mine community training initiatives to access economic
opportunities.
Objective Statement By the end of the financial year 2017-18 the MQA will have facilitated access
to training and economic opportunities for 10,000 retrenches, unemployed
youth, women and people with disabilities living in mining communities and
labour sending areas.
Baseline I,562 mine community learners
Justification To provide alternative skills to retrenches and unemployed individuals in
mine communities and labour sending areas post mining activities in the
area.
Links NSDS III Goal 4.6

Page 26 of 191
7.2c Resource considerations
Learning Programmes, in line with the grant regulation regulations, has the largest allocation with a significant increase in
expenditure recorded from about R498 million in 2013/14 to R722,8 million in 2014/15 with a further increase reported for
2015/16. In line with its mandate and informed by the needs of the mining and minerals sector, the MQA will prioritise
three key areas as reflected in its Strategic Objectives. These areas include supporting transformation and developing the
skills of the mining and minerals workforce by funding workplace-based skills development; increasing access to
occupationally directed programmes for the unemployed; and encouraging and supporting mine community training
initiatives. Core and non-core mining and minerals sector interventions to be supported include artisan development
programmes, bursaries, adult literacy, learnerships, workplace integrated learning, lecturer development programmes and
recognition of prior learning. Over the medium term, expenditure is budgeted to steadily increase from R1,2 billion to
2017/18 to R1,27 billion in 2018/19 to R1,3 billion in 2019/20.
7.3c Risk management
# Risk Description Consequences Mitigation Plans
1 Threats to existing MQA revenue The MQA may not
have adequate
financial resources
to service its
commitments and
meet its targets
that are sometimes
inflated by
directives from the
Executive Authority
Monthly validation
and monitoring of
commitments
registers and
reconciliation with
existing reserves,
targets and future
revenue forecasts
and deciding on the
most appropriate of
the three controls.
2 Business disruptions Business
disruptions may
impede or disrupt
the achievement of
strategic plans
Testing and
evaluation of the
disaster recovery
capabilities.
Develop entity wide
business continuity
plan beyond the IT
disasters.

Page 27 of 191
# Risk Description Consequences Mitigation Plans
3 Inadequate training spaces for workplace
integrated learning
Annual
Performance Plan
and Strategic plan
targets may not be
met
Audit available
training spaces in the
industry through
analysis of WSP and
ATR information.
Evaluate
opportunities for
placements outside
the country.
Evaluate disciplines
and related sectors
for possible
placement
opportunities
outside the sector.
4 Inadequate interventions for targeted
development of senior black professionals
Industry
continuously
reports shortage of
skills as an
impediment to
transformation
despite MQA skills
development
interventions
Review delivery
model, content,
relevance and
adequacy of the
existing HDSA
programme.
Implement
recommendations of
the GCC study
Page 28 of 191
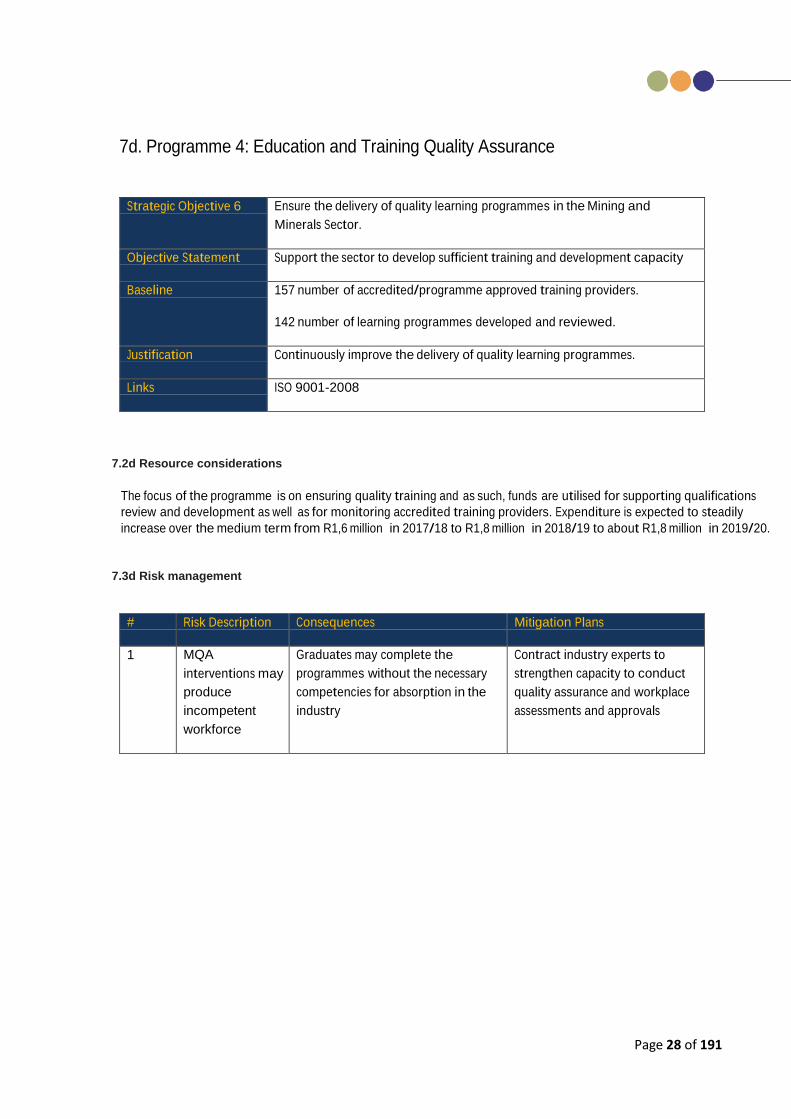
7d. Programme 4: Education and Training Quality Assurance
Strategic Objective 6 Ensure the delivery of quality learning programmes in the Mining and
Minerals Sector.
Objective Statement Support the sector to develop sufficient training and development capacity
Baseline 157 number of accredited/programme approved training providers.
142 number of learning programmes developed and reviewed.
Justification Continuously improve the delivery of quality learning programmes.
Links ISO 9001-2008
7.2d Resource considerations
The focus of the programme is on ensuring quality training and as such, funds are utilised for supporting qualifications
review and development as well as for monitoring accredited training providers. Expenditure is expected to steadily
increase over the medium term from R1,6 million in 2017/18 to R1,8 million in 2018/19 to about R1,8 million in 2019/20.
7.3d Risk management
# Risk Description Consequences Mitigation Plans
1 MQA
interventions may
produce
incompetent
workforce
Graduates may complete the
programmes without the necessary
competencies for absorption in the
industry
Contract industry experts to
strengthen capacity to conduct
quality assurance and workplace
assessments and approvals
Page 29 of 191
PART C:
LINKS TO OTHER PLANS


www.mqa.org.za
www.mqa.org.za
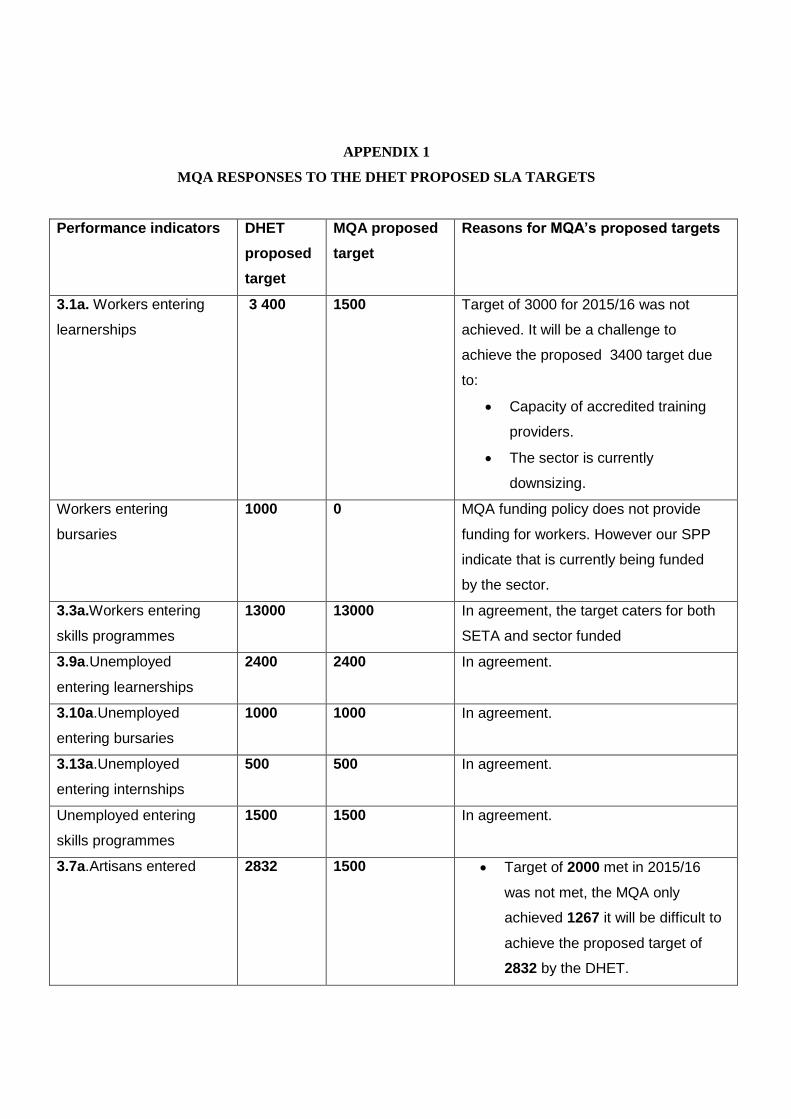
APPENDIX 1
MQA RESPONSES TO THE DHET PROPOSED SLA TARGETS
Performance indicators DHET
proposed
target
MQA proposed
target
Reasons for MQA’s proposed targets
3.1a. Workers entering
learnerships
3 400 1500 Target of 3000 for 2015/16 was not
achieved. It will be a challenge to
achieve the proposed 3400 target due
to:
Capacity of accredited training
providers.
The sector is currently
downsizing.
Workers entering
bursaries
1000 0 MQA funding policy does not provide
funding for workers. However our SPP
indicate that is currently being funded
by the sector.
3.3a.Workers entering
skills programmes
13000 13000 In agreement, the target caters for both
SETA and sector funded
3.9a.Unemployed
entering learnerships
2400 2400 In agreement.
3.10a.Unemployed
entering bursaries
1000 1000 In agreement.
3.13a.Unemployed
entering internships
500 500 In agreement.
Unemployed entering
skills programmes
1500 1500 In agreement.
3.7a.Artisans entered 2832 1500 Target of 2000 met in 2015/16
was not met, the MQA only
achieved 1267 it will be difficult to
achieve the proposed target of
2832 by the DHET.
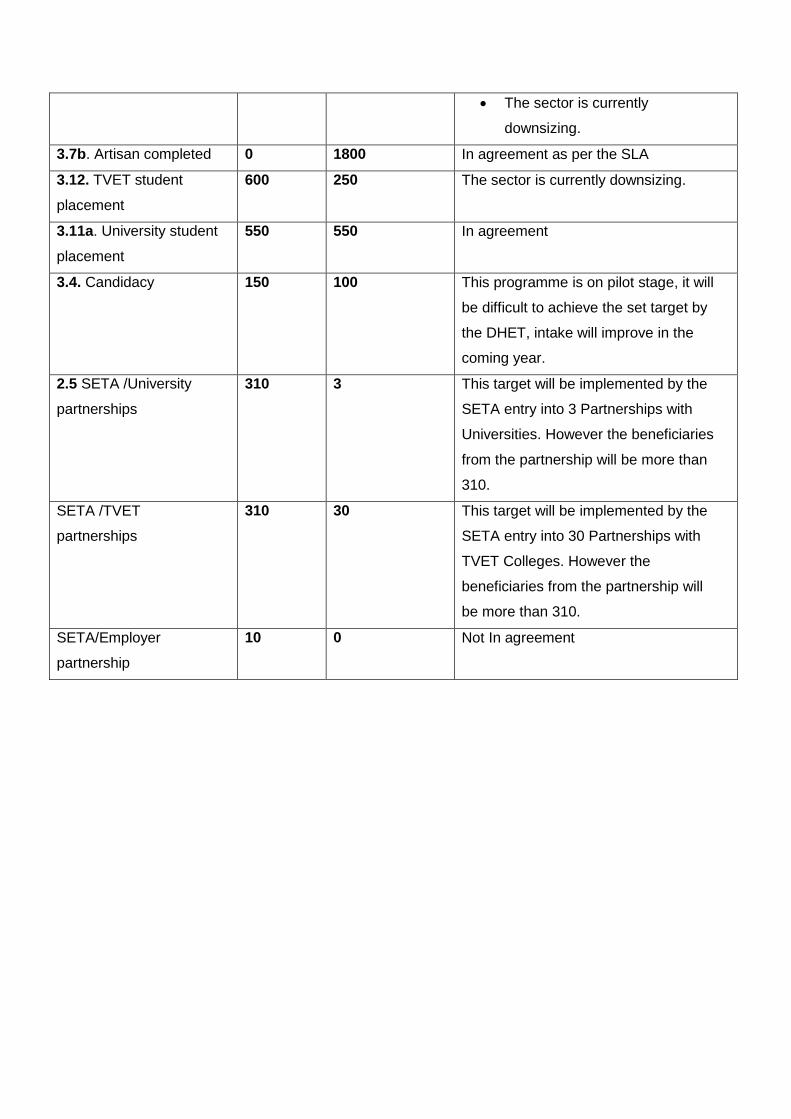
Page 2 of 2
The sector is currently
downsizing.
3.7b. Artisan completed 0 1800 In agreement as per the SLA
3.12. TVET student
placement
600 250 The sector is currently downsizing.
3.11a. University student
placement
550 550 In agreement
3.4. Candidacy 150 100 This programme is on pilot stage, it will
be difficult to achieve the set target by
the DHET, intake will improve in the
coming year.
2.5 SETA /University
partnerships
310 3 This target will be implemented by the
SETA entry into 3 Partnerships with
Universities. However the beneficiaries
from the partnership will be more than
310.
SETA /TVET
partnerships
310 30 This target will be implemented by the
SETA entry into 30 Partnerships with
TVET Colleges. However the
beneficiaries from the partnership will
be more than 310.
SETA/Employer
partnership
10 0 Not In agreement

Page 35 of 191
9. Conditional grants
Not applicable. The MQA is a Schedule 3(a) public entity.
10. Public entities
Not applicable. The MQA is a Schedule 3(a) public entity.
11. Public-private partnerships
Project Name
Programme Municipality Project Description
Outputs Estimated project cost
Expenditure to date
Project duration
Start Finish MQA – Orbit College Lecturer Support
TVET Lectures Support
Bojanala
Placement of 6 Lectures for
R216 000 R0.00 January 2016
March 2018
NCV Learner Placement
NCV Learner Placement
Nkangala Placement of 8 TVET Colleges’ NCV Graduates
Award bursaries to HET Students in Mining & Minerals disciplines
R1 200 000
R600 000 April
2015 March 2017
Collaboration with HEIs regarding skills development research in the MMS (University of Pretoria)
University Partnerships
Tshwane Metropolitan
To provide financial support and assistance to students who are undertaking research in the MMS and who wish to present their research at an accredited conference or publish in an accredited journal.
A copy of material which has been presented by students at a conference or published in a journal and proof of such presentation and publication A written close out report
R100 000 R100 000 3 May 2016
Collaboration with HEIs regarding skills development research in the MMS (University of Pretoria)
Collaboration with HEIs regarding skills development research in the MMS (University of Zululand)
University Partnerships
Umhlathuze Municipality
To provide financial support and assistance to students who are undertaking research in the MMS and who wish to present their research at an accredited conference or publish in an accredited journal.
A copy of material which has been presented by students at a conference or published in a journal and proof of such presentation and publication A written close out report
R100 000 R0.00 31 March 2016
31 March 2017
Page 36 of 191
MINING QUALIFICATIONS AUTHORITY
ANNUAL PERFORMANCE PLAN
FOR
2017 – 2018
NOVEMBER 2016
Page 37 of 191
FOREWORD
“Digging with Skills and Knowledge”
The Mining Qualification Authority strategic planning process is guided by the Medium Term Strategic Framework(MTSF)
which reflects political outcomes priorities, the Framework for the National Skills Development Strategy, and the National
Small-Scale Mining Development Framework. This is in line with changes in Government’s approach to planning, monitoring
and evaluation aimed at translating the government’s election mandate into reality.
The Annual Performance Plan (APP) is guided by the Strategic Plan and contains the performance targets for the
budget years. The Annual Performance Plan sets out MQA’s priorities and indicates the steps taken by management to
ensure that the targets are achieved.
The MQA is fully committed to supporting and ensuring the implementation of the APP.
OFFICIAL SIGN-OFF
It is hereby certified that this Annual Performance Plan:
Was development by the management of the Mining Qualifications Authority under the guidance the Honourable Minister of Higher Education, Dr B Nzimande;
Was prepared in line with current Strategic Plan of the Mining Qualifications and Authority; and
Accurately reflects the performance targets which the Mining Qualifications Authority will endeavor to achieve given the resources made available in the budget for 2017 – 2018
···
Tebogo Mmotla Acting Chief Executive Officer
AmonTeteme
Labour Convenor
Vusi Mabena Employer Convenor
Page 38 of 191
..... • •••

Page 39 of 191
CONTENTS
Part A – Strategic overview 40
1 Updated situational analysis………………………………………………………………………………………41
1.1 Performance delivery environment...........................................................................................................................45
1.2 Organizational environment ...........................................................................................................................................................45
2 Revisions to legislative and other mandates................................................................................................................46
3 Overview of 2017/18 budget and MTEF estimates……………….....................................................................................................46
3.1 Expenditure estimates…………………………………………………………………………………….........46
3.2 Relating expenditure trends to strategic outcome orientated goals…………………………………………………………………….47
Part B – Programme and subprogramme plans 48
4 Programmes .............................................................................................................................................49
4.1 Strategic Objective annual targets for 2017/18……………………………………………………..……………………………………49 4.2 Programme performance indicators and annual targets for 2017/18.............................................................................................49 4.3 Quarterly targets for 2017/18………………………………………………………………………………………………………………..51 4.4 Reconciling performance targets with the Budget and MTEF…………………………………………………………………………...77 Part C: Links to other plans 93 5 Links to long-term infrastructure and other capital plans…………………………………………………………………………………94 6 Conditional grants…………………………………………………………………………………………………………………………….94 7 Public Entities………………………………………………………………………………………………………………………………….94 8 Public-private partnerships…………………………………………………………………………………………………………………...95 Annexure
Annexure D MQA Sector Skills Plan update 2017 – 2018 106
Annexure E - Technical Indicator Descriptions 171
Page 40 of 191
PART A:
STRATEGIC OVERVIEW

Page 41 of 191
1. UPDATED SITUATIONAL ANALYSIS
South Africa remains one of the largest net exporters of minerals and metals. In the mining industry South Africa is an
important global hub with deep backward vertical integration and a fully-fledged supply industry serving both South
African and foreign companies. South Africa accounts for 96% of known global reserves of the platinum group metals
(PGMs), 74% of chrome, 26% manganese and 11% of gold reserves
The below explains the MMS’ value chain showing primary activities from exploration to minerals value addition and the
support activities in each stage of the value chain.
FIGURE 1: MINING AND MINERALS SECTOR VALUE CHAINE
Exploration Capital goods
• Geophysical
• Drilling
• Survey, etc.
Mining Capital Goods
• Drilling
• Cutting
• Hauling
• Hoisting, etc.
Processing Capital Goods
• Crushers/mills,
• Hydromet plant
• Materials handling,
• Furnaces, etc.
Refining Capital Goods
• Smelters,
• Furnaces,
• Electro winning cells
• Casters, etc.
Fabrication Capital goods
• Rolling,
• Moulding,
• Machning
• Assembling, etc.
STAGE 1
EXPLORATION
STAGE 2
MINING
STAGE 3
MINERAL
PROCESSING
STAGE 4
SMELTING &
REFINING
STAGE 5
FABRICATION/ VALUE
ADDITION
Exploration Services
• GIS
• Analytical
• Data processing
• Financing, etc.
Mining Services
• Mine planning,
• Consumables/spares
• Sub-contracting,
• Analytical, etc.
Processing Services
• Comminution
• Grinding media
• Chem/regents
• Process control,
• Analytical, etc.
Refining Services
• Reductants
• Chemicals,
• Assaying, etc.
Value Adding Services
• Design,
• Marketing,
• Distribution,
• Services, etc.
Source: Underhill Corporate Solutions illustration based on Ecopartners
The majority of the companies in Stage two are involved in primary production while Stages three to five depicts
secondary production, with increasing degrees of processing, beneficiation and value addition.
The MMS’ contribution to South Africa’s GDP has decreased by 0.9% from 2009 to 2015. Given the sector’s importance
to the economy, a concerning reality is that the weakening of commodity prices is not expected to recover soon. The
main contributors to the decline in mining output include the following:
• Lower global commodity prices
• Slowing demand in China
• Fewer exports for South Africa due to low global growth
The Mining Phakisa, an initiative of the Presidency, aims to expand the lifespan of the mines by locally developing the
machinery required to mine narrow, hard rock reefs, which is where the majority of platinum and gold resources lie in
South Africa. These resources are currently unviable to mine due to safety, health and economic reasons. Health and
Safety matters can be addressed through mechanisation; however upskilling training drives will be required for all skills
levels of workers, including managers and supervisors, to ensure a smooth transition to mechanisation. A focus on AET
programmes up to level 4 as a way of improving literacy and numeracy levels will be important as a way of preparing
existing and potential employees to operate new machinery and coordinate new processes.
The government is currently drafting the Mineral Beneficiation Action Plan (MBAP), which seeks to advance ‘local
value-addition across five mineral value-chains’. The implementation of the Minerals Beneficiation Strategy and MBAP
is expected to create and retain much needed jobs in the MMS. If minerals are processed locally, is potential to boost
the manufacturing industry and create much needed jobs along the MMS value chain.

Page 42 of 191
There are 3 out of 18 strategic infrastructure projects (SIPs) which have a direct bearing on the MMS. SIP 1: Unlocking
the northern mineral belt with Waterberg as the catalyst. SIP 1 is the largest of the 18 SIPs by project value and is
estimated at around R803 billion. The focus of SIP 1 is to unlock mineral resources which will generate thousands of
direct jobs across the areas unlocked. SIP 4 is linked to mineral beneficiation. It involves the facilitation of development
of the mining sector by opening up beneficiation opportunities in the North West province. SIP 5: The Saldanha-
Northern Cape Development Corridor entails the expansion of iron ore mining production.
BELOW IS A FIVE YEAR TREND ANALYSIS OF THE MMS LABOUR PROFILE FOR THE PERIOD 2012-2016.
Figure 2: Employee Breakdown within MMS over a 5 year period:
Total employment in the MMS has been declining over the years. As of 31st May 2016, the MMS employs an estimated
520 003 people, which is a 1% decrease from 2015, and a 17.3% drop since 2012.
Source: Calculated from weighted MQA WSP/ATR submissions (2012-2016)
Page 43 of 191
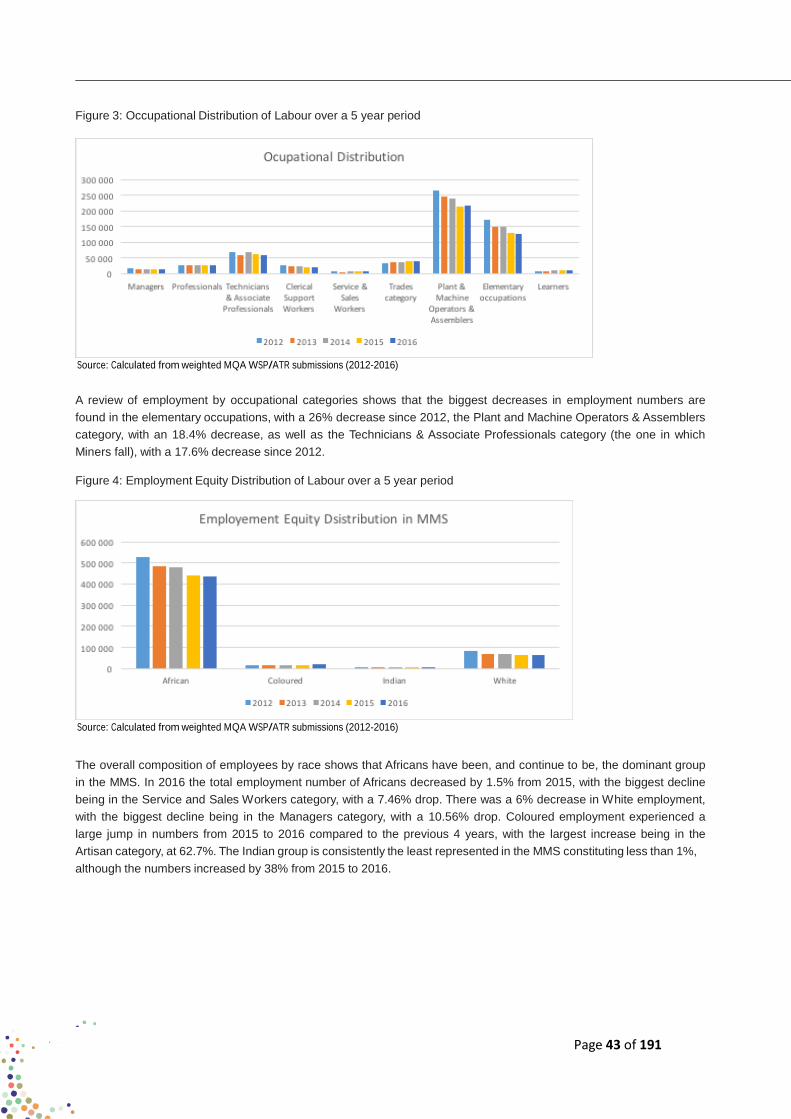
Figure 3: Occupational Distribution of Labour over a 5 year period
Source: Calculated from weighted MQA WSP/ATR submissions (2012-2016)
A review of employment by occupational categories shows that the biggest decreases in employment numbers are
found in the elementary occupations, with a 26% decrease since 2012, the Plant and Machine Operators & Assemblers
category, with an 18.4% decrease, as well as the Technicians & Associate Professionals category (the one in which
Miners fall), with a 17.6% decrease since 2012.
Figure 4: Employment Equity Distribution of Labour over a 5 year period
Source: Calculated from weighted MQA WSP/ATR submissions (2012-2016)
The overall composition of employees by race shows that Africans have been, and continue to be, the dominant group
in the MMS. In 2016 the total employment number of Africans decreased by 1.5% from 2015, with the biggest decline
being in the Service and Sales Workers category, with a 7.46% drop. There was a 6% decrease in White employment,
with the biggest decline being in the Managers category, with a 10.56% drop. Coloured employment experienced a
large jump in numbers from 2015 to 2016 compared to the previous 4 years, with the largest increase being in the
Artisan category, at 62.7%. The Indian group is consistently the least represented in the MMS constituting less than 1%,
although the numbers increased by 38% from 2015 to 2016.

Page 44 of 191
Figure 5: Gender Distribution of Labour over a 5 year period
Source: Calculated from weighted MQA WSP/ATR submissions (2012-2016)
Although the sector is historically male-dominated, the proportion of females has been increasing gradually, from 11%
in 2012, to 14.5% in 2016.
Figure 6: Management Equity in Labour Distribution over a 5 year period
Source: Calculated from weighted MQA WSP/ATR submissions (2012-2016)
In terms of management by equity, there has been an overall increase in management of Africans, Coloureds and
Indians. In 2012, these 3 race groups together constituted 37.7% of management, 42.4% in 2013, a decrease to
37.5% in 2014, to 39% in 2015, and then showing the highest proportion across the 5 years in 2016, with 42.5% of
management. Regarding gender, African, Coloured and Indian females together constitute 9.1% of management
IMPLICATIONS OF THE SITUATIONAL ANALYSIS FINDINGS FOR SKILLS DEVELOPMENT
The main implications for skills development in the sector are summarised below:
• There has been a decrease in employment figures over the last few years. This shows that the sector has been
retrenching. The MQA and other role players need to pay special attention to the reskilling of retrenched workers
so that they can be absorbed into other sectors of the formal labour market.
• The MQA is to monitor the developments of Mining Phakisa and prepare existing and potential employees
accordingly.

Page 45 of 191
in terms of skills requirement; as well as take advantage of the implementation of the Mineral Beneficiation Action Plan
(MBAP) and the SIPs projects, which are expected to lead to increased economic activity and the creation of new
jobs in South Africa.
• An analysis of the skills requirements and supply mechanisms for the above is to be thoroughly researched
to ascertain the nature and level of skills to develop in supporting these initiatives. Relevant skills need to be
prioritised.
• There are still racial and gender disparities in the demographic composition of the industry signalling the need
for role-players to continue to address workforce imbalances. The MQA might need to consider a reallocation of
the discretionary grant to support industry to increase the uptake and throughput of historically disadvantaged
individuals, particularly women, in the MMS training and skills development pipeline.
1.1 PERFORMANCE DELIVERY ENVIRONMENT
In addition, the following trends have been observed in the sector:
i) Increasing number of jobs being lost for operational reasons;
ii) Trend will continue into the future unless existing problems in the Industry are arrested;
iii) Cyclical nature of commodity prices is likely to continue; and
iv) Technological changes in the value chain increasingly indicate a need for a different skilled workforce and less
reliance on unskilled labour.
In view of the above, the MQA will have to change its skills development focus to up-skilling and re-skilling the current
workforce to enhance the employability, portability and mobility of employees.
The MQA has been re-established to conduct its activities as a Sector Education and Training Authority (SETA) from 1
April 2016 to 31 March 2018.
1.2 ORGANIZATIONAL ENVIRONMENT
The MQA recently embarked in internal reorganization which came in effect from the 1st May 2015 post approval
by the MQA Board. The purpose was to streamline processes and enhance service delivery through controlled and
monitored activities. This resulted in merging of some units within the MQA and strengthening key resources such as
the Monitoring and Evaluation function. Given the recent challenge of the audit outcome, the executive management
will be implementing a turnaround strategy which will address the people, systems, processes of the MQA to ensure
that there is drastic improvements in the effectiveness and delivery of the organisational mandate.
The Regional Offices were also capacitated and more staff deployed in the past financial year to ensure close contact
and accessible service to the community. The MQA currently employs 111 permanent staff members supported by 12
Interns to assist the organization. Furthermore, the modus operandi between the Operations and Stakeholder Relations
Department was reviewed to fast track and strengthen the delivery capabilities. Additionally, the organisational training and
development plan will also be enhanced to address the immediate gaps across all levels so that the organization operates
optimally.
PERMANENT STAFF AND INTERNS
M F A C W I Vacant Total
Permanent 39 67 94 7 1 4 5 111
Interns 4 5 8 1 - - 3 12
TOTAL 43 72 102 8 1 4 8 123

Page 46 of 191
2. REVISIONS TO LEGISLATIVE AND OTHER MANDATES
There have been no significant changes to the Mining Qualifications Authority’s legislative and other mandates.
3. OVERVIEW OF 2017/18 BUDGET AND MTEF ESTIMATES
3.1 Expenditure estimates – The expenditure estimates are indicated below:
STATEMENT OF FINANCIAL PERFORMANCE
AUDITED OUTCOME
APPROVED
BUDGET MEDIUM-TERM ESTIMATE
R THOUSAND 2013/14 2014/15 2015/16 2016/17 2017/18 2018/19 2019/20
Revenue
Tax revenue
Non-tax revenue
than capital assets of which:
Administrative fees
Other sales
Other non-tax revenue
-
42,632
-
-
-
-
45,648
-
-
-
-
49,838
-
-
-
-
50,572
-
-
-
-
53,101
-
-
-
-
55,756
-
-
-
-
59,659
-
-
-
42,632 45,648 49,838 50,572 53,101 55,756 59,659
Transfers received 894,452 971,303 1,021,522 1,016,425 1,168,889 1,344,223 1,438,319
Total revenue 937,084 1,016,951 1,071,360 1,066,997 1,221,990 1,399,978 1,497,976
Expenses
Current Expenses 89,350 108,303 121,786 136,669 144,732 154,657 165,483
Compensation of Employees 60,987 68,815 72,914 78,017 83,479 89,322
Goods and Services 36,555 42,724 44,904 52,709 56,399 60,346 64,570
Depreciation 2,542 2,404 4,415 4,432 3,379 3,548 3,796
Losses from disposal of assets 80 72 212 - - - -
Interest, dividends and rent on land 39 25 30 8 - - -
Transfer to QCTO 1,299 2,505 3,627 6,607 6,937 7,284 7,794
Transfers and subsidies 737,571 919,551 1,025,324 1,380,046 1,437,476 1,509,350 1,615,004
Discretionary Grant Expenditure 507,282 724,762 837,577 1,151,350 1,208,918 1,269,364 1,358,219
Mandatory Grant Expenditure 230,289 194,789 187,747 228,696 228,558 239,986 256,785
Total Expenses 826,921 1,027,854 1,147,352 1,516,715 1,582,208 1,664,007 1,780,487
Surplus/(Deficit) 110,163 -34,575 -75,992 449,717 360,219 264,029 282,511

Page 47 of 191
STATEMENT OF FINANCIAL PERFORMANCE
AUDITED OUTCOME
APPROVED
BUDGET MEDIUM-TERM ESTIMATE
R THOUSAND 2013/14 2014/15 2015/16 2016/17 2017/18 2018/19 2019/20
ASSETS
Cash & Cash Equivalents
730,314
720,014
775,876
95,000
81,266
134,126
93,532
Inventory loans 247 427 302 240 180 135 160
Accrued investment 555 520 - - - - -
Receivables and prepayments 20,351 17,123 27,921 10,169 7,627 5,720 8,203
Carrying value of assets 59,887 62,334 66,553 68,723 72,159 75,767 78,450
Non-current assets held for sale - - - - - - -
Defined benefit plan assets - - - - - - -
Taxation - - - - - - -
Derivatives financial instruments - - - - - - -
TOTAL ASSETS 811,354 800,418 870,652 174,132 161,233 215,748 180,345
EQUITY & LIABILITIES
Accumulated surplus/(deficit) 110,163 34,575 -75,992 449,717 360,219 264,029 282,511
Capital and reserves 373,684 483,847 396,964 443,200 443,200 410,734 358,854
Capital reserve fund borrowings - - - - - - -
Finance lease 52 165 - - - - -
Deferred income - - - - - - -
Trade and other payables 247,709 183,438 287,967 50,376 32,745 65,210 38,762
Benefits payables - - - - - - -
Capitalised value of pension taxation - - - - - - -
Provisions 79,746 167,543 185,721 180,650 27,875 3,833 65,240
Managed funds (e.g. poverty
alleviation fund)
- - - - - - -
Derivatives financial instruments - - - - - - -
TOTAL EQUITY & LIABILITIES 811,354 800,418 870,652 174,133 161,233 215,748 180,345
3.2 Relating expenditure trends to strategic outcome-orientated goals
The revenue on interest, dividend and rent on land relates to only interest received on short-term investments. Between
2010/11 and 2016/17 the interest received will decrease by 35% (at an average of 5% per year). The decrease is
attributed by the successive drops in the prime lending rate in 2013/14 and due to maintaining a low bank balance in
the MTEF as compared to the prior years.
The decrease in transfers received is attributed to conservative estimates by the MQA due to assumptions that jobs in
the mining industry will shed by 3% due to declining mineral reserves.
The increase in administration cost is due to an additional post to the establishment, expenses introduced by the
purchase of the new building and activities introduced by the establishment of regional offices.
The high increases in discretionary grants between 2010/11 and 2016/17 are due to the change in grant regulation
which was effective from 01 April 2013.

Page 48 of 191
PART B:
PROGRAMME AND
SUB-PROGRAMME PLANS
Page 49 of 191
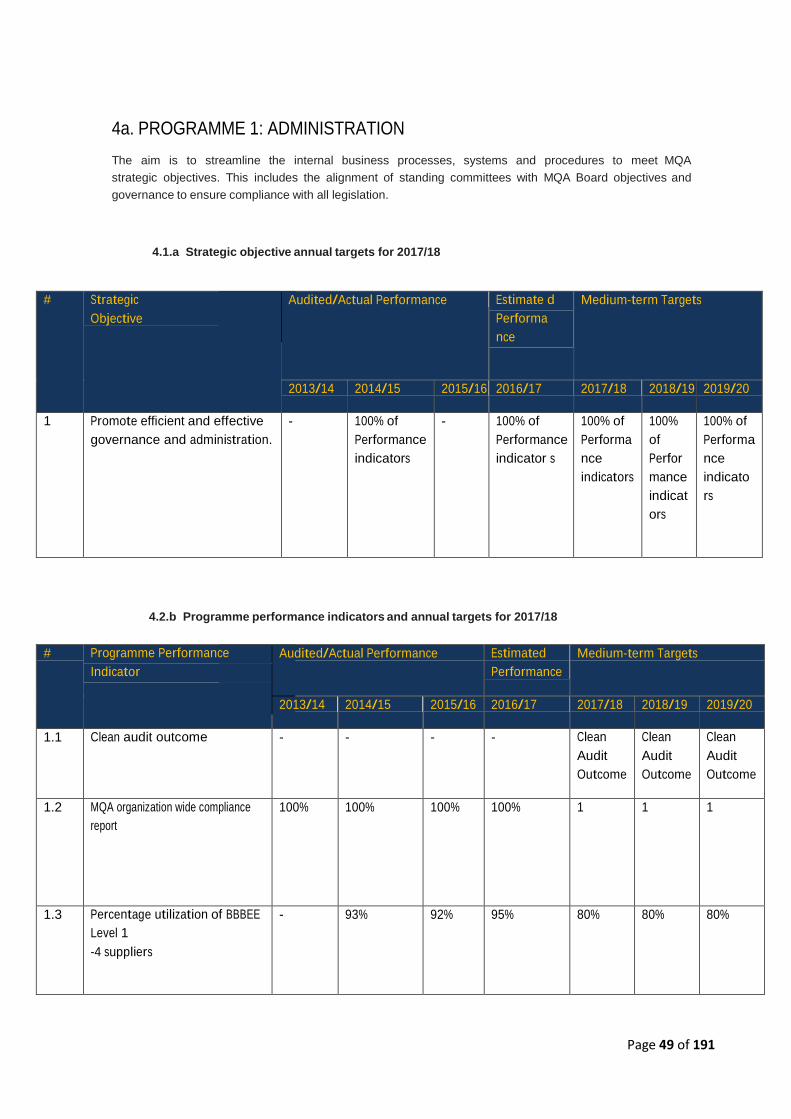
4a. PROGRAMME 1: ADMINISTRATION The aim is to streamline the internal business processes, systems and procedures to meet MQA
strategic objectives. This includes the alignment of standing committees with MQA Board objectives and
governance to ensure compliance with all legislation.
4.1.a Strategic objective annual targets for 2017/18
# Strategic
Objective
Audited/Actual Performance Estimate d
Performa
nce
Medium-term Targets
2013/14 2014/15 2015/16 2016/17 2017/18 2018/19 2019/20
1 Promote efficient and effective
governance and administration.
- 100% of
Performance
indicators
- 100% of
Performance
indicator s
100% of
Performa
nce
indicators
100%
of
Perfor
mance
indicat
ors
100% of
Performa
nce
indicato
rs
4.2.b Programme performance indicators and annual targets for 2017/18
# Programme Performance
Indicator
Audited/Actual Performance Estimated
Performance
Medium-term Targets
2013/14 2014/15 2015/16 2016/17 2017/18 2018/19 2019/20
1.1 Clean audit outcome - - - - Clean
Audit
Outcome
Clean
Audit
Outcome
Clean
Audit
Outcome
1.2 MQA organization wide compliance
report
100% 100% 100% 100% 1 1 1
1.3 Percentage utilization of BBBEE
Level 1
-4 suppliers
- 93% 92% 95% 80% 80% 80%
Page 50 of 191
# Programme Performance
Indicator
Audited/Actual Performance Estimated
Performance
Medium-term Targets
2013/14 2014/15 2015/16 2016/17 2017/18 2018/19 2019/20
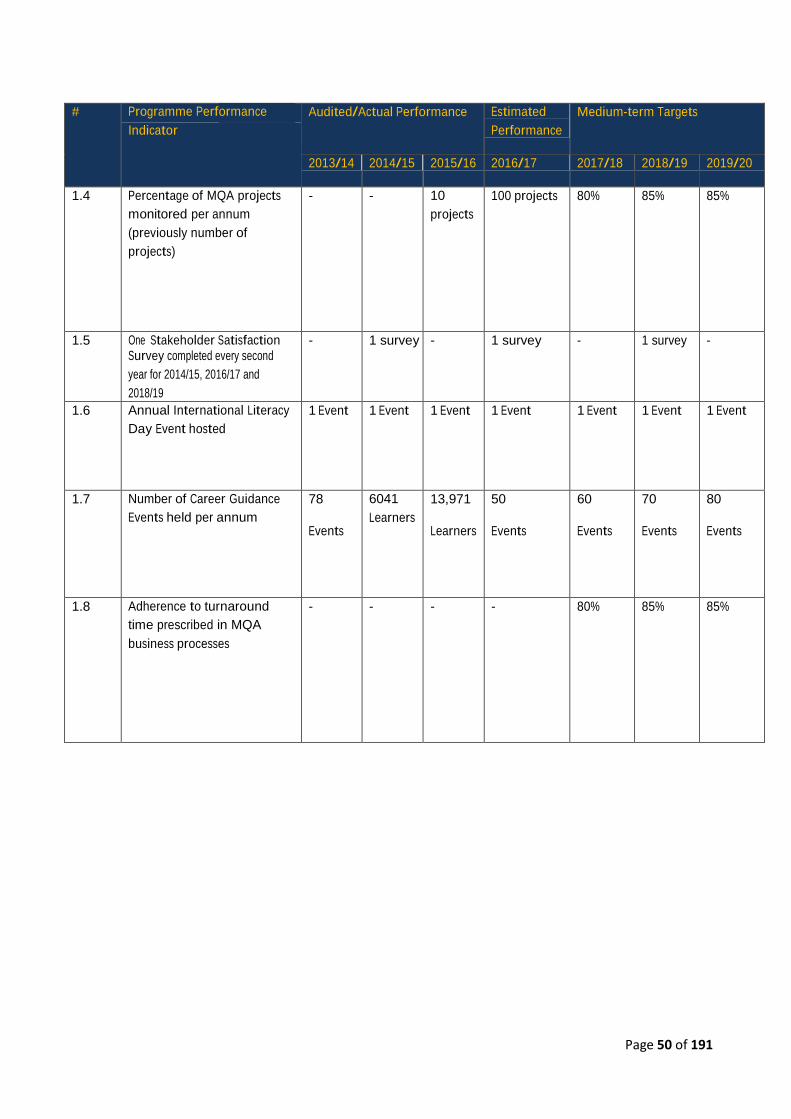
1.4 Percentage of MQA projects
monitored per annum
(previously number of
projects)
- - 10
projects
100 projects 80% 85% 85%
1.5 One Stakeholder Satisfaction Survey completed every second
year for 2014/15, 2016/17 and
2018/19
- 1 survey - 1 survey - 1 survey -
1.6 Annual International Literacy
Day Event hosted
1 Event 1 Event 1 Event 1 Event 1 Event 1 Event 1 Event
1.7 Number of Career Guidance
Events held per annum
78
Events
6041
Learners
13,971
Learners
50
Events
60
Events
70
Events
80
Events
1.8 Adherence to turnaround
time prescribed in MQA
business processes
- - - - 80% 85% 85%

Page 51 of 191
4.3.a Quarterly targets for 2017/18
Performance Indicator Reporting
Period
Annual
target
2017/18
Quarterly Targets
1st 2nd
3rd 4th
1.1 Clean audit outcome Annually Clean
Audit
Outcome
Clean
Audit
Outcome
Clean
Audit
Outcome
Clean
Audit
Outcome
Clean
Audit
Outcome
1.2 MQA organization wide compliance report Annually 100% 0 0 0 1
1.3 Percentage utilization of BBBEE Level 1 -4
suppliers
Annually 80% 80% 80% 80% 80%

Page 52 of 191
Performance Indicator Reporting
Period
Annual
target
2017/18
Quarterly Targets
1st 2nd
3rd 4th
1.4 Percentage of MQA projects monitored
per annum (previously number of
projects)
Annually 80% 20% 20% 20% 20%
1.5 One Stakeholder Satisfaction
Survey completed every second year for 2014/15, 2016/17 and 2018/19
Bi-annually - - - - -
1.6 Annual International Literacy Day
Event hosted
Annually 1 Event 0 1 Event 0 0
1.7 Number of Career Guidance Events
held per annum
Annually 60
Events
20 10 10 20
1.8 Adherence to turnaround time
prescribed in MQA business
processes
Annually 80% 80% 80% 80% 80%
4b. PROGRAMME 2: SECTOR SKILLS PLANNING RESEARCH
4.1. b Strategic objectives annual targets for 2017/18
# Strategic
Objective
Audited/Actual Performance Estimated
Performance
Medium-term Targets
2013/
14
2014/15 2015/16 2016/17 2017/18 2018/19 2019/20
2 Improve skills
development
planning and
decision- making
through research
100% of
Perfo
rman
ce
Indica
tors
100% of
Performa
nce
Indicator
s
139% of
Performa
nce
Indicator
s
100% of
Performance
Indicators
100% of
Performan
ce
Indicators
100% of
Performanc
e Indicators
100% of
Performanc
e Indicators

Page 53 of 191
4.2. b Programme performance indicators and annual targets for 2017/18
# Programme Performance
Indicator
Audited/Actual Performance Estimated
Performance
Medium-term Targets
2013/14 2014/15 2015/16 2016/17 2017/18 2018/19 2019/20
2.1 Number of Skills
Development
Facilitator capacity
building workshops per
annum
889 1383 765
Participants
800
Participants
20
Workshops
30
Workshops
40
Workshops
2.2 Number of Skills
Development
Committee Member
capacity building
workshops per annum
- - 523
Participants
550
Participants
100
Workshops
150
Workshops
200
Workshops
2.3 Number of Workplace
Skills Plans (WSPs) and
Annual Training Reports
(ATRs) evaluated for Small
Levy Paying, Medium and
Large Firms
to access mandatory
grants per annum
- 573 609 650 660 650 650
2.4 Number of sector
research outputs
completed per annum
3 5 11 9 9 9 9
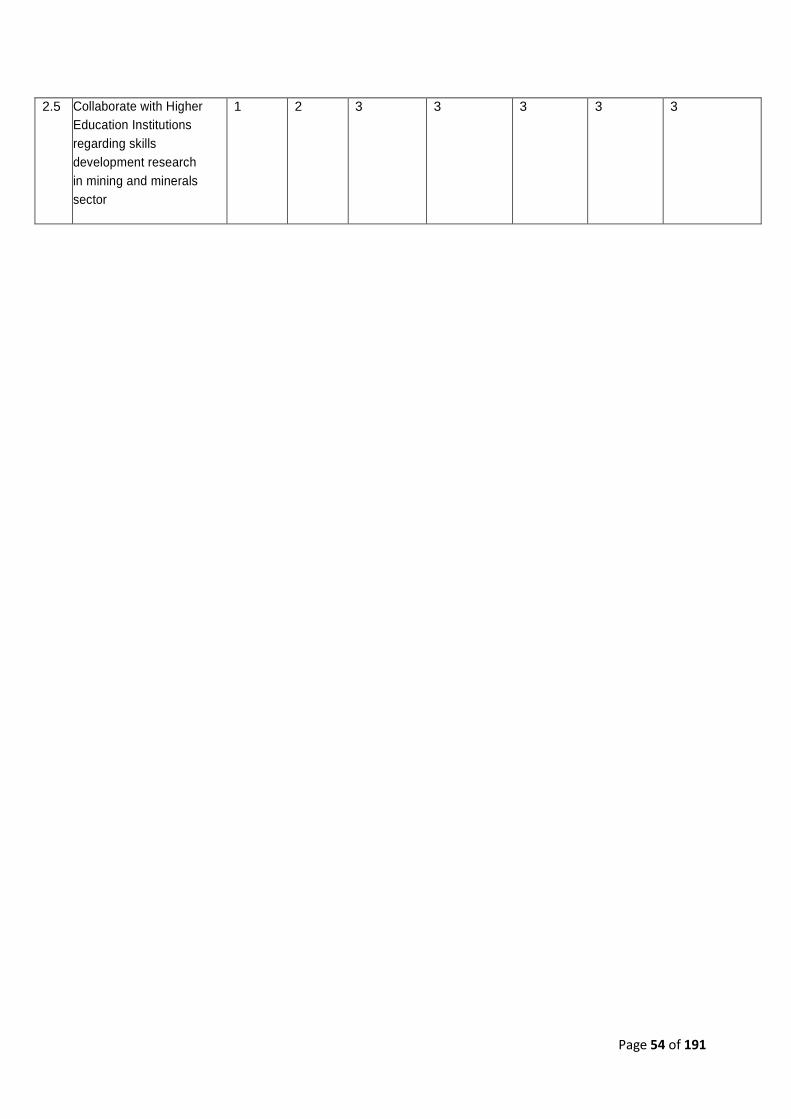
Page 54 of 191
2.5 Collaborate with Higher
Education Institutions
regarding skills
development research
in mining and minerals
sector
1 2 3 3 3 3 3
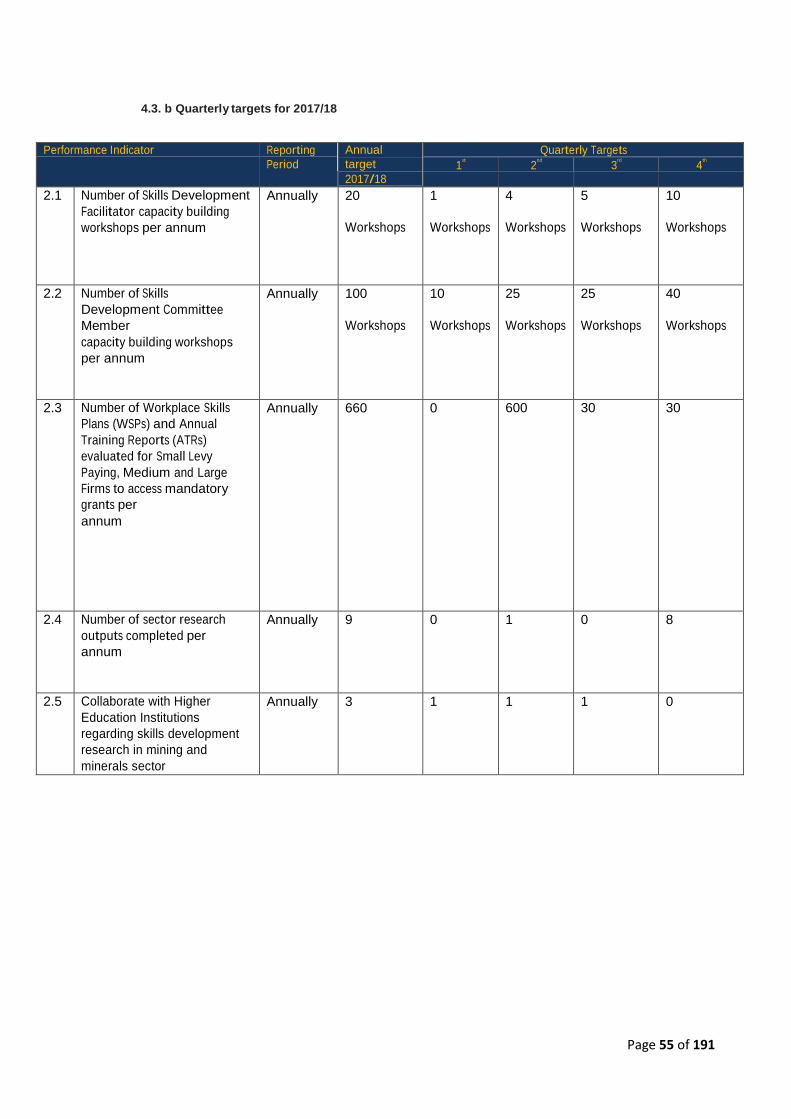
Page 55 of 191
4.3. b Quarterly targets for 2017/18
Performance Indicator Reporting
Period
Annual
target
2017/18
Quarterly Targets
1st 2
nd 3
rd 4
th
2.1 Number of Skills Development
Facilitator capacity building
workshops per annum
Annually 20
Workshops
1
Workshops
4
Workshops
5
Workshops
10
Workshops
2.2 Number of Skills
Development Committee
Member
capacity building workshops
per annum
Annually 100
Workshops
10
Workshops
25
Workshops
25
Workshops
40
Workshops
2.3 Number of Workplace Skills
Plans (WSPs) and Annual
Training Reports (ATRs)
evaluated for Small Levy
Paying, Medium and Large
Firms to access mandatory
grants per
annum
Annually 660 0 600 30 30
2.4 Number of sector research
outputs completed per
annum
Annually 9 0 1 0 8
2.5 Collaborate with Higher
Education Institutions
regarding skills development
research in mining and
minerals sector
Annually 3 1 1 1 0

Page 56 of 191
4c. PROGRAMME 3: LEARNING PROGRAMMES / SKILLS DEVELOPMENT
4.1.c Strategic objective annual targets for 2017/18
# Strategic
Objective
Audited/Actual Performance Estimated
Performan
ce
Medium-term Targets
2013/14 2014/15 2015/16 2016/17 2017/18 2018/19 2019/20
3 Promote work-based skills
development t to support
transformation on in the
mining and mineral sector
101% of
Performance
Indicators
110% of
Performan
ce
Indicators
68% of
Performan
ce
Indicators
100% of
Performan
ce
Indicators
100% of
Performa
nce
Indicators
100% of
Performa
nce
Indicators
100% of
Performa
nce
Indicators
4 Facilitate access to
occupationally directed
learning programme s for
the
unemployed
80% of
Performance
Indicators
100% of
Performan
ce
Indicators
69% of
Performan
ce
Indicators
100% of
Performan
ce
Indicators
100% of
Performa
nce
Indicators
100% of
Performa
nce
Indicators
100% of
Performa
nce
Indicators
5 Support mine community
training initiatives to
access economic
opportunities.
- - 100% of
Performan
ce
Indicators
100% of
Performan
ce
Indicators
100% of
Performa
nce
Indicators
100% of
Performa
nce
Indicators
100% of
Performa
nce
Indicators

Page 57 of 191
4.2.c Programme performance indicators and annual targets for 2017/18
# Programme
Performance
Indicator
Audited/Actual Performance Estimated
Performance
Medium-term Targets
2013/14 2014/15 2015/16 2016/17 2017/18 2018/19 2019/20
3.1a Number of
employees
entering a
Learnership per
annum
- - 1241
1800
1500
1600
1650
3.1b Number of
employees
completing a
Learnership per
annum
- - 331 1440 800 900 1000
3.1c Number of
employees
completing RPL
for learnerships
- - 23 200 200 200 200
3.2a Number of HDSA
MMS employees
that enter a
management
development
programme per
annum
135 - 150 150 250 250 250
3.2b Number of HDSA
MMS employees
that complete a
management
development
programme per
annum
- - 75 150 150 150 150
3.3a Number of
employees that
enter the
Occupational
Health and Safety
representatives
skills programme
per annum
- 6438 4694 6000 6200 6500 6500

Page 58 of 191
# Programme
Performance
Indicator
Audited/Actual Performance Estimated
Performance
Medium-term Targets
2013/14 2014/15 2015/16 2016/17 2017/18 2018/19 2019/20
3.3b Number of employees
that successfully
complete the
Occupational Health
and Safety
representatives’ skills
programme per
annum
10068 4339 4519 6000 6200 6000 6000
3.4a Number of HDSA
MMS learners that
enter a candidacy
programme per
annum
- - - 100 100 100 100
3.4b Number of HDSA
MMS learners that
complete a
candidacy
programme per
annum
- - - 100 100 100 100
3.5a Number of
HDSA HET
lecturers that enter
into a lecturer
development
programme per
annum
25 27 27 27 30 30 30
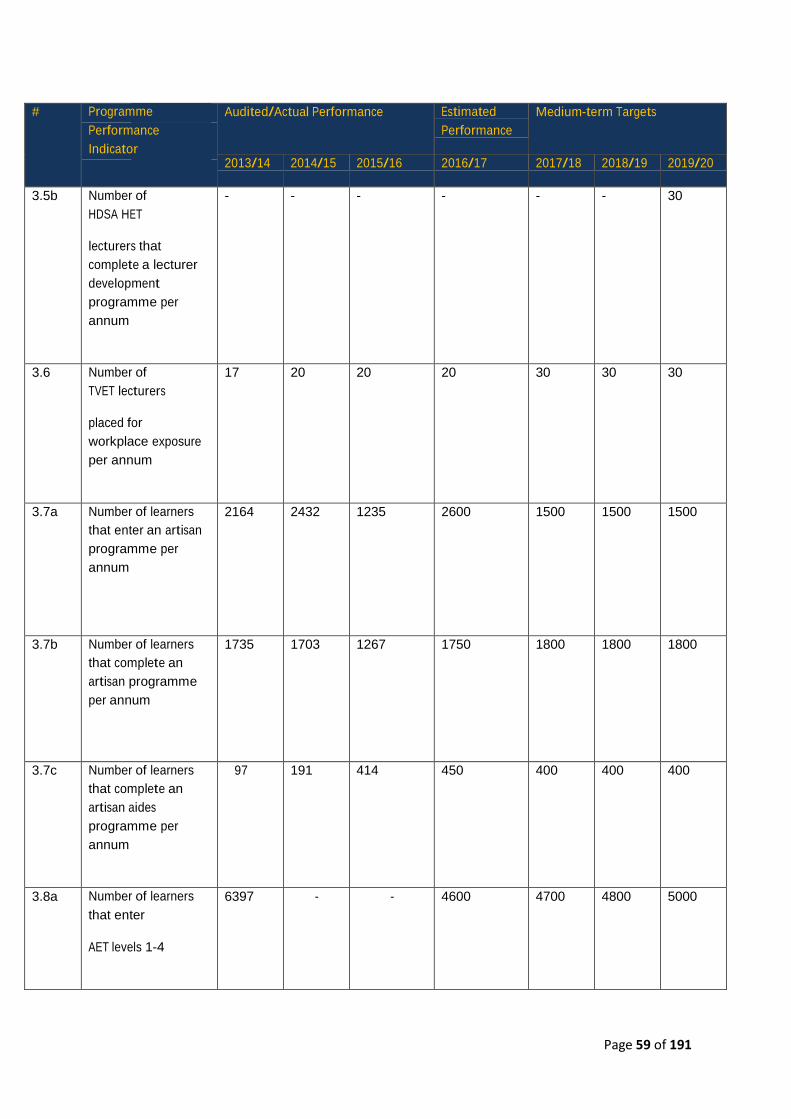
Page 59 of 191
# Programme
Performance
Indicator
Audited/Actual Performance Estimated
Performance
Medium-term Targets
2013/14 2014/15 2015/16 2016/17 2017/18 2018/19 2019/20
3.5b Number of
HDSA HET
lecturers that
complete a lecturer
development
programme per
annum
- - - - - - 30
3.6 Number of
TVET lecturers
placed for
workplace exposure
per annum
17 20 20 20 30 30 30
3.7a Number of learners
that enter an artisan
programme per
annum
2164 2432 1235 2600 1500 1500 1500
3.7b Number of learners
that complete an
artisan programme
per annum
1735 1703 1267 1750 1800 1800 1800
3.7c Number of learners
that complete an
artisan aides
programme per
annum
97 191 414 450 400 400 400
3.8a Number of learners
that enter
AET levels 1-4
6397 - - 4600 4700 4800 5000

Page 60 of 191
# Programme Performance
Indicator
Audited/Actual Performance Estimated
Performance
Medium-term Targets
2013/14 2014/15 2015/16 2016/17 2017/18 2018/19 2019/20
3.8b Number of learners that
successfully complete AET
programme levels 1-4
2556 2151 2364 2350 2500 2600 2700
3.8c Number of learners that
successfully complete FLC
programmes
451 257 274 280 280 290 300
3.9a Numbers of unemployed
learners that enter a
Learnership per annum
2814 3264 671 2200 2400 1000 1000
3.9b Numbers of unemployed
learners that complete a
Learnership per annum
- 1000 186 1000 500 550 600
3.10a Number of unemployed
learners awarded a
bursary per annum
787 535 1310 700 1000 1000 1000
3.10b Number of unemployed
learners awarded a
bursary completing per
annum
- - 228 300 600 650 700

Page 61 of 191
# Programme
Performance
Indicator
Audited/Actual Performance Estimated
Performance
Medium-term Targets
2013/14 2014/15 2015/16 2016/17 2017/18 2018/19 2019/20
3.11a Number of
undergraduates
that enter a work
place experience
programme per
annum
431 822 723 500 600 650 700
3.11b Number of
undergraduates
that complete a
work place
experience
programme per
annum
- - 338 300 340 350 360
3.12a Number of TVET NCV
graduates that enter
a work placement
programme per
annum
250 89 529 200 250 260 260
3.12b Number of TVET NCV
graduates that
complete a work
placement
programme per
annum
- - 60 100 200 200 200
3.13a Number of
graduates that enter
an Internship
programme per
annum
600 699 454 450 500 530 550
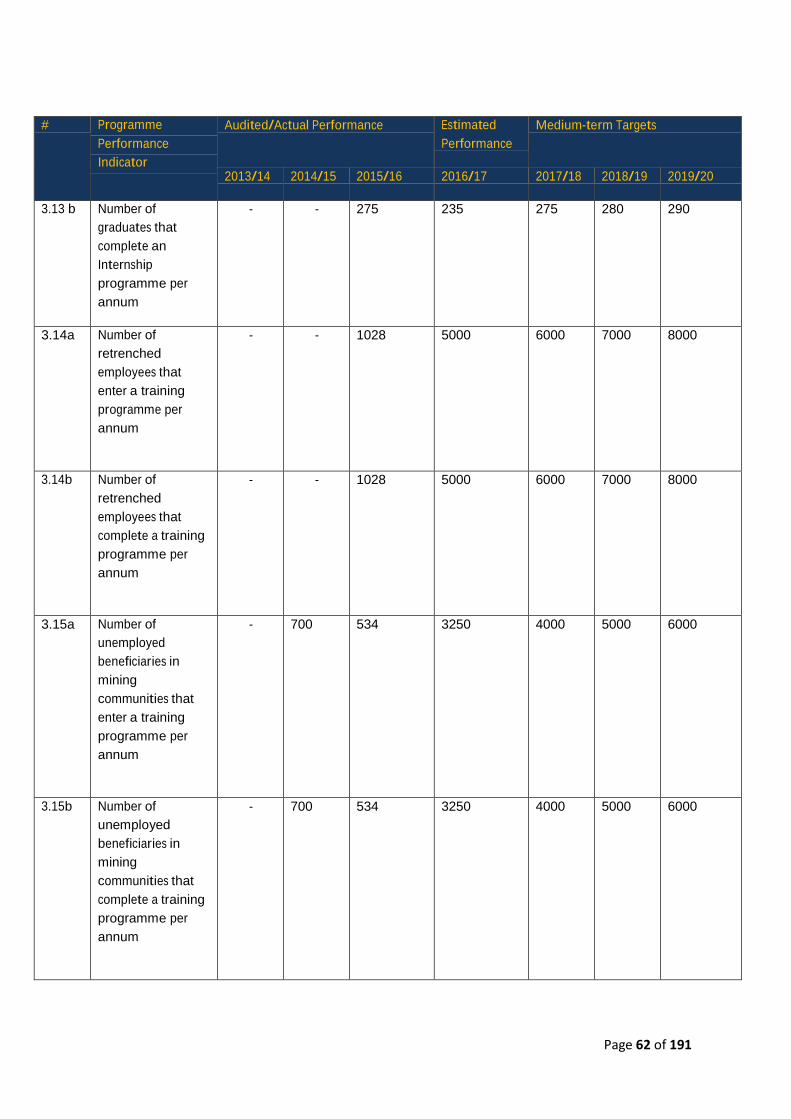
Page 62 of 191
# Programme
Performance
Indicator
Audited/Actual Performance Estimated
Performance
Medium-term Targets
2013/14 2014/15 2015/16 2016/17 2017/18 2018/19 2019/20
3.13 b Number of
graduates that
complete an
Internship
programme per
annum
- - 275 235 275 280 290
3.14a Number of
retrenched
employees that
enter a training
programme per
annum
- - 1028 5000 6000 7000 8000
3.14b Number of
retrenched
employees that
complete a training
programme per
annum
- - 1028 5000 6000 7000 8000
3.15a Number of
unemployed
beneficiaries in
mining
communities that
enter a training
programme per
annum
- 700 534 3250 4000 5000 6000
3.15b Number of
unemployed
beneficiaries in
mining
communities that
complete a training
programme per
annum
- 700 534 3250 4000 5000 6000
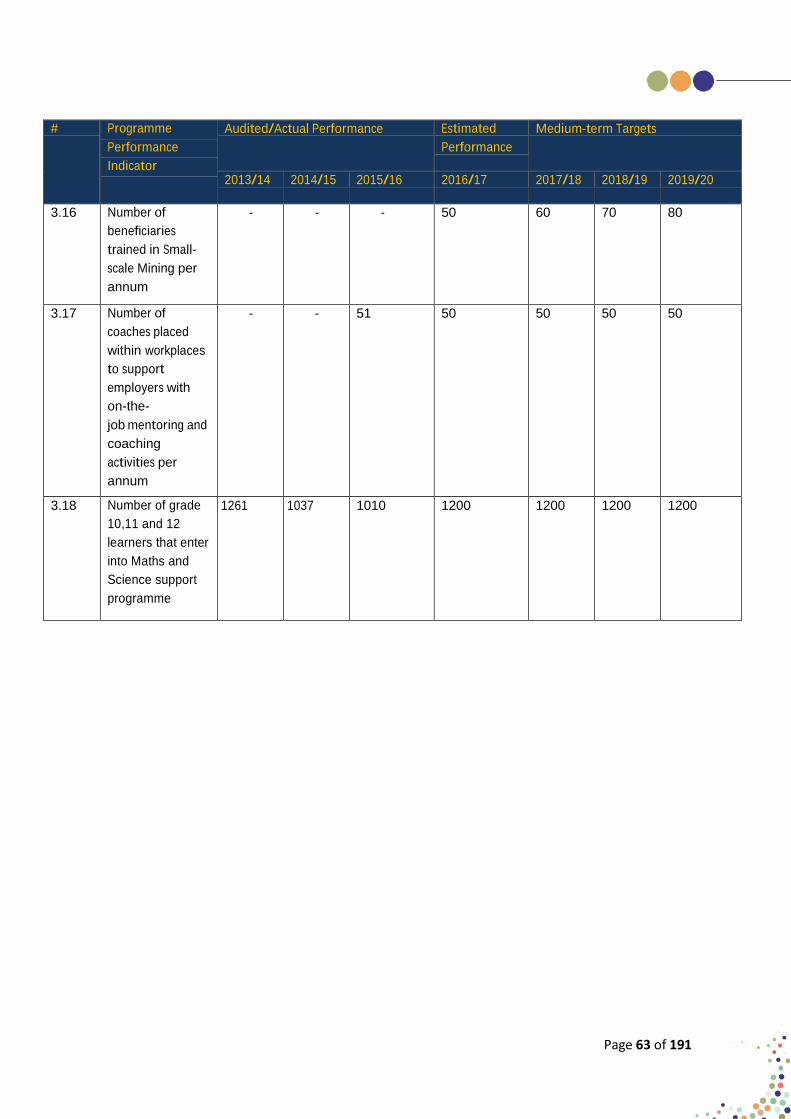
Page 63 of 191
# Programme
Performance
Indicator
Audited/Actual Performance Estimated
Performance
Medium-term Targets
2013/14 2014/15 2015/16 2016/17 2017/18 2018/19 2019/20
3.16 Number of
beneficiaries
trained in Small-
scale Mining per
annum
- - - 50 60 70 80
3.17 Number of
coaches placed
within workplaces
to support
employers with
on-the-
job mentoring and
coaching
activities per
annum
- - 51 50 50 50 50
3.18 Number of grade
10,11 and 12
learners that enter
into Maths and
Science support
programme
1261 1037 1010 1200 1200 1200 1200
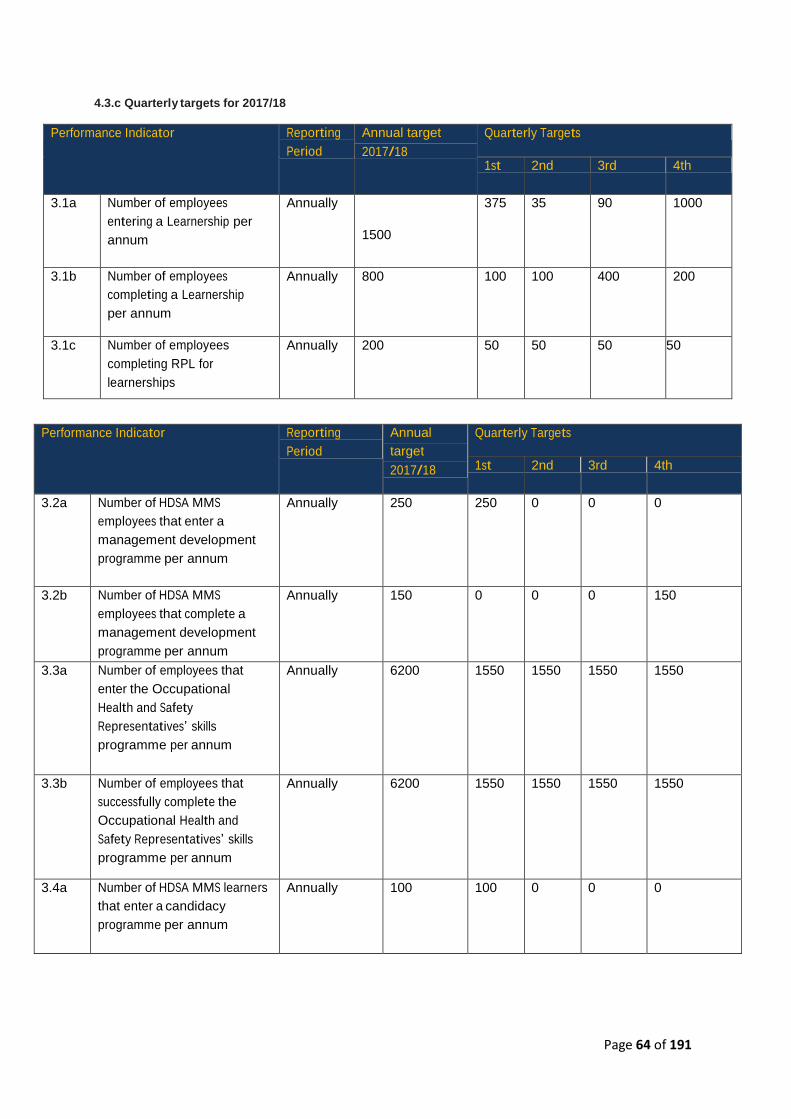
Page 64 of 191
4.3.c Quarterly targets for 2017/18
Performance Indicator Reporting
Period
Annual target
2017/18
Quarterly Targets
1st 2nd 3rd 4th
3.1a Number of employees
entering a Learnership per
annum
Annually
1500
375 35 90 1000
3.1b Number of employees
completing a Learnership
per annum
Annually 800 100 100 400 200
3.1c Number of employees
completing RPL for
learnerships
Annually 200 50 50 50 50
Performance Indicator Reporting
Period
Annual
target
2017/18
Quarterly Targets
1st 2nd 3rd 4th
3.2a Number of HDSA MMS
employees that enter a
management development
programme per annum
Annually 250 250 0 0 0
3.2b Number of HDSA MMS
employees that complete a
management development
programme per annum
Annually 150 0 0 0 150
3.3a Number of employees that
enter the Occupational
Health and Safety
Representatives’ skills
programme per annum
Annually 6200 1550 1550 1550 1550
3.3b Number of employees that
successfully complete the
Occupational Health and
Safety Representatives’ skills
programme per annum
Annually 6200 1550 1550 1550 1550
3.4a Number of HDSA MMS learners
that enter a candidacy
programme per annum
Annually 100 100 0 0 0
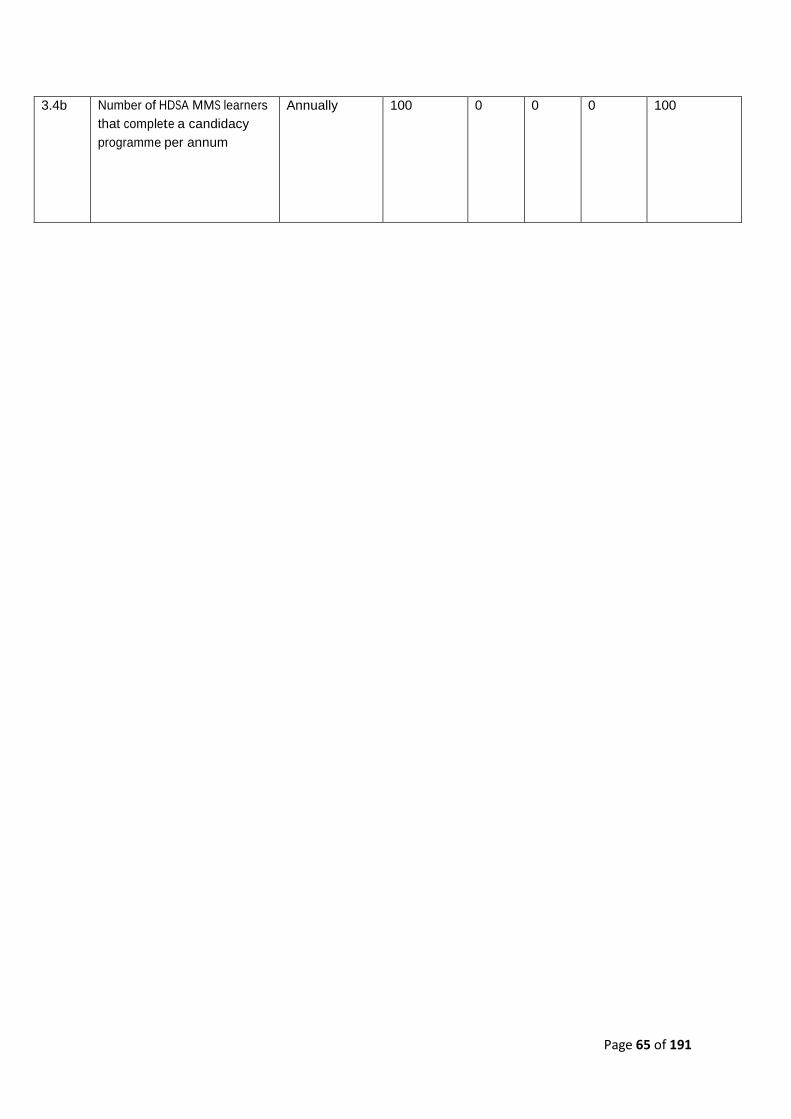
Page 65 of 191
3.4b Number of HDSA MMS learners
that complete a candidacy
programme per annum
Annually 100 0 0 0 100

Page 66 of 191
Performance Indicator Reporting
Period
Annual
target
2017/18
Quarterly Targets
1st 2nd 3rd 4th
3.5a Number of HDSA HET
lecturers that enter into a lecturer
development programme per
annum
Annually 30 30 0 0 0
3.5b Number of HDSA HET
lecturers that complete a
lecturer development
programme per annum
Annually - - - - -
3.6 Number of HDSA TVET lecturers
placed for workplace exposure
per annum
Annually 30 20 10 0 0
3.7a Number of
learners that enter an artisan
programme per annum
Annually 1500 150 300 300 750
3.7b Number of learners that
complete an
artisan programme per annum
Annually 1800 200 300 400 900
3.7c Number of learners that complete
an artisan aides programme per
annum
Annually 400 50 125 125 100

Page 67 of 191
Performance Indicator Reporting
Period
Annual
target
2017/18
Quarterly Targets
1st 2nd 3rd 4th
3.8a Number of
learners that enter
AET levels 1-4
Annually 4700 1000 1000 1000 1700
3.8b Number of learners that successfully
complete AET programme levels
1-4
Annually 2500 700 300 0 1500
3.8c Number of learners that
successfully complete FLC
programmes
Annually 280 70 70 70 70
3.9a Numbers of unemployed learners
that enter a Learnership per annum
Annually 2400 200 500 850 850
3.9b Numbers of unemployed
learners that complete a
Learnership per annum
Annually 500 100 100 200 100
3.10a Number of unemployed learners
awarded a bursary per annum
Annually 1000 0 0 0 1000
3.10b Number of unemployed learners
awarded a bursary completing
Annually 600 0 0 0 600

Page 68 of 191
3.11a Number of undergraduates that
enter a work place experience
programme per annum
Annually 600 100 100 100 300
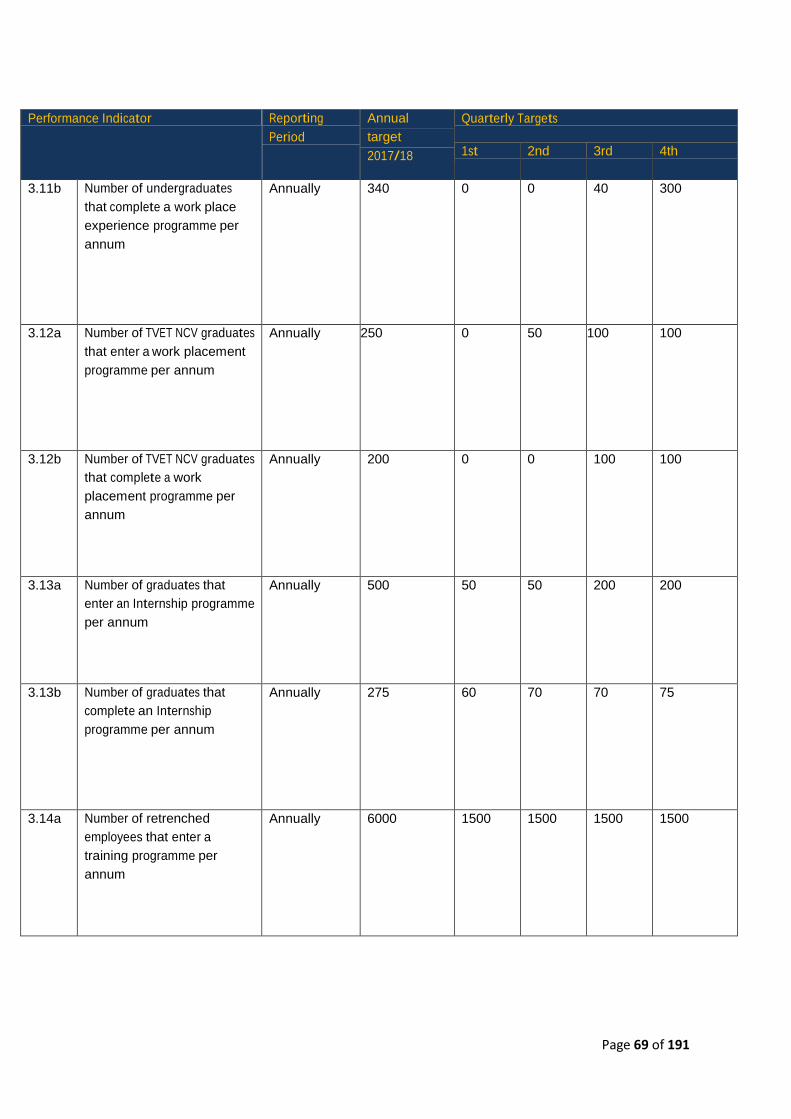
Page 69 of 191
Performance Indicator Reporting
Period
Annual
target
2017/18
Quarterly Targets
1st 2nd 3rd 4th
3.11b Number of undergraduates
that complete a work place
experience programme per
annum
Annually 340 0 0 40 300
3.12a Number of TVET NCV graduates
that enter a work placement
programme per annum
Annually 250 0 50 100 100
3.12b Number of TVET NCV graduates
that complete a work
placement programme per
annum
Annually 200 0 0 100 100
3.13a Number of graduates that
enter an Internship programme
per annum
Annually 500 50 50 200 200
3.13b Number of graduates that
complete an Internship
programme per annum
Annually 275 60 70 70 75
3.14a Number of retrenched
employees that enter a
training programme per
annum
Annually 6000 1500 1500 1500 1500

Page 70 of 191
Performance Indicator Reporting
Period
Annual
target
2017/18
Quarterly Targets
1st 2nd 3rd 4th
3.14b Number of retrenched
employees that complete a
training programme per
annum
Annually 6000 1500 1500 1500 1500
3.15a Number of unemployed
beneficiaries in mining
communities that enter a
training programme per
annum
Annually 4000 1000 1000 1000 1000
3.15b Number of unemployed
beneficiaries in mining
communities that
complete a training
programme per annum
Annually 4000 1000 1000 1000 1000
3.16 Number of beneficiaries
trained in Small- scale
Mining per annum
Annually 60 0 30 30 0
3.17 Number of coaches placed
within workplaces to support
employers with on-the-job
mentoring and coaching
activities per annum
Annually 50 25 25 0 0
3.18 Number of grade 10,11 and
12 learners that enter into
Maths and Science support
programme
Annually 1200 0 0 0 1200
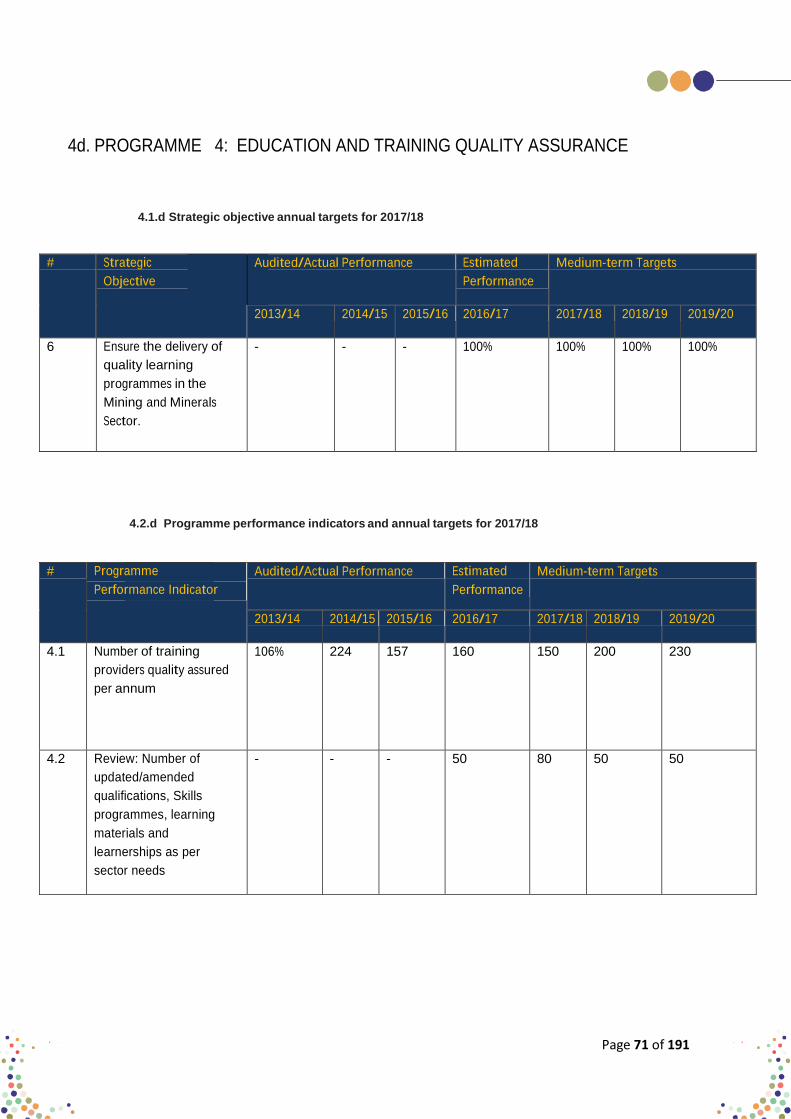
Page 71 of 191
4d. PROGRAMME 4: EDUCATION AND TRAINING QUALITY ASSURANCE
4.1.d Strategic objective annual targets for 2017/18
# Strategic
Objective
Audited/Actual Performance Estimated
Performance
Medium-term Targets
2013/14 2014/15 2015/16 2016/17 2017/18 2018/19 2019/20
6 Ensure the delivery of
quality learning
programmes in the
Mining and Minerals
Sector.
- - - 100% 100% 100% 100%
4.2.d Programme performance indicators and annual targets for 2017/18
# Programme
Performance Indicator
Audited/Actual Performance Estimated
Performance
Medium-term Targets
2013/14 2014/15 2015/16 2016/17 2017/18 2018/19 2019/20
4.1 Number of training
providers quality assured
per annum
106% 224 157 160 150 200 230
4.2 Review: Number of
updated/amended
qualifications, Skills
programmes, learning
materials and
learnerships as per
sector needs
- - - 50 80 50 50
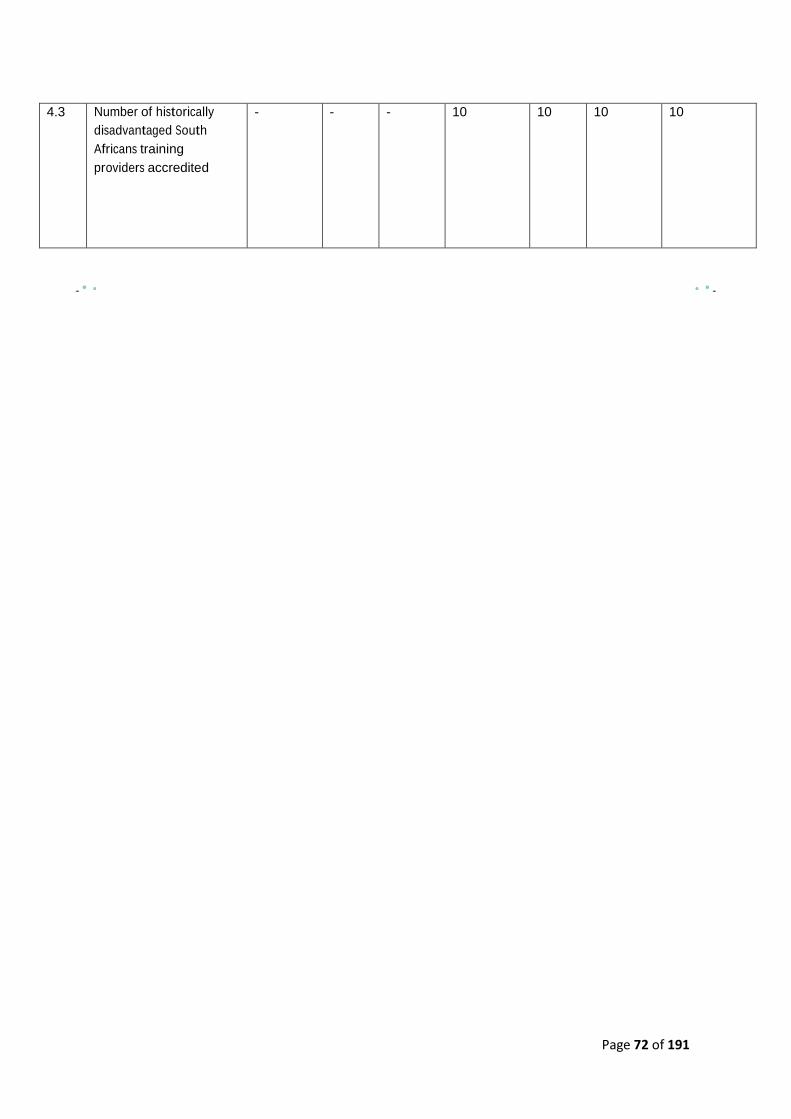
Page 72 of 191
4.3 Number of historically
disadvantaged South
Africans training
providers accredited
- - - 10 10 10 10

Page 73 of 191
4.3.d Quarterly targets for 2017/18
Performance Indicator Reporting
Period
Annual
target
2017/18
Quarterly Targets
1st 2nd 3rd 4th
4.1 Number of training providers
quality assured per annum
Annually 150 30 60 30 30
4.2 Review: Number of
updated/amended qualifications,
Skills programmes, learning
materials and learnerships as per
sector needs
Annually 80 0 10 25 45
4.3 Number of historically
disadvantaged South Africans
training providers accredited
Annually 10 0 5 5 0
Page 74 of 191
MATERIALITY AND SIGNIFICANCE FRAMEWORK (YEAR END: 31 MARCH 2016)
Materiality and Significance Framework (Year end: 31 March 2015)
In terms of Treasury Regulations (Sections 28.1.5, 28.2.1, 30.1.3(e)) issued in terms of the Public Finance Management
Act, Act no.1 of 1999, the accounting authority of the MQA must develop and agree a framework of acceptable levels
of materiality and significance with the relevant executive authority.
The ethical conduct of the MQA Board and staff is built on moral values such as trust, integrity, confidentiality and
discretion and underpins our commitment to adhere to the highest possible acceptable norms and standards of society
in all our dealings with our clients and stakeholders as well as the relationships within the organisation.
Our staff members will refrain from any conduct, which may be prejudicial to the image, name and good standing of the
MQA and will ensure that all activities will be done according to the legal framework of South Africa
The specific sections of the PFMA that has relevance for the purposes of material is Section 50(1), Section 55(2) and
Section 66(1) and for significance is Section 54(2).
Ameliorate
Definition of Materiality
Information is material if its omission or misstatement could influence the economic decisions of users taken on
the basis of the financial statements. Materiality depends on the size of the item or error judged in the particular
circumstances of its omission or misstatement. This materiality provides a threshold or cut- off point, rather than being
a primary qualitative characteristic which information must have if it is to be useful1.
Definition of significant
Extensive or important enough to merit attention. In the development of the framework we considered both the
quantitative and qualitative aspects.
Factors considered in developing the framework
Nature of the business
The MQA is responsible for skills development facilitation in the MMS
Page 75 of 191
Statutory Requirements
The SETA is a public organisation that is accountable to many stakeholders. A lower level of materiality is apt in light of
the strict legislation within which the SETA operates.
Control and Inherent Risks
The following factors were examined in determining the materiality percentage:
a. Annual Risk assessment (outsourced to a reputable auditing firm)
b. 3 year internal audit plan
c. Fraud Prevention plan
d. Appropriate approvals framework
e. A well-structured procurement policy tying in with the relevant legislation
f. The implementation and adoption of a Quality Management System.
g. Technical competence (qualifications), skills and experience of staff engaged in the decision making process
including the governance structure.
h. Structure of the Audit Committee with reference to King’s Code of Corporate Governance
i. Appointment of internal auditors (external to the MQA) to ensure an independent report on areas of non-
conformance.
Materiality Level
The level of a material loss for Grant expenditure is assessed at R 3 450 115 (rounded) being 0.25% of budgeted Total
Revenue for 2016/2017. Previous financial year was R 3 593 690.
The level of a material loss for Operational/Administrative expenditure is assessed at R 1 447 320 (rounded) being 1%
of budgeted Total Administration expenses for 2017/2018. Previous financial year was R 1 366 690.
Different levels of materiality can be used and the decision to use a conservative level of 0.25% is based on the fact
that the total assets of MQA is not considered to be an indicator of performance as MQA is not an asset intensive
entity and the revenue component is selected as a basis for the materiality calculation as the level of activity (grant and
discretionary payments) is dependent on the levies received.
Qualitative Factors considered
Materiality does not only relate to the size of the assets and the elements of the financial statements. Misstatements
that are large individually or in aggregate may affect a reasonable user’s judgement. Misstatements may also be
material on qualitative grounds. We have considered the following qualitative factors:
a. Unusual transactions entered into that are not of a repetitive nature and are disclosable purely due to the nature
thereof due to knowledge thereof affecting the decision making of the user of financial statements.
b. Sizeable increase in our stakeholder base, that is, more organisations contributing SDL to MQA levy income base.
c. Fraudulent or dishonest behaviour of an officer or staff of the SETA at senior management level.
Any
d. Rand value to be disclosed.
e. Fraudulent or dishonest behaviour of ALL other employees or officers of MQA, if in aggregate or individually the

Page 76 of 191
sum total of those transactions exceeds R1000.00
f. Material infringement of legislation that governs MQA.
g. Any transaction entered into that could result in reputational risk to MQA.
h. Changes in key personnel and departure of key executives.
i. Application of new or changes in accounting policy.
Materiality Framework aligned to Treasury Regulation
TREASURY REGULATION 28.1.5
“For purposes of “material” [section 50(1), 55(2) and 66(1) (c) of the Act] and “significant” [section 54(2) of the Act], the accounting authority
must develop and agree on a framework of acceptable levels of materiality and significance with the relevant executive authority in
consultation with the external auditors.”
REGULATION MATERIAL
Section 50(1)
Section 55(2)
Section 66(1)
Section 54(2)
(1) The accounting authority for a public entity must Both the qualitative and quantitative aspects as
– referred to in sections 3 and 4.
(c) on request disclose to the executive authority
responsible for that public entity or the legislature to which the public entity is accountable, all material
facts, including those reasonably discoverable,
which in any way influence the decision or actions of
the executive authority or that legislature; and
(b) include particulars of – Section 3 and 4 define the qualitative and qualitative
(i) any material losses through criminal conduct and aspects that are considered for the purpose of this
any irregular expenditure and fruitless and wasteful section. expenditure that occurred during the financial year;
(1) An institution to which this Act applies may not Losses incurred due to criminal conduct by 100%
borrow money or issue a guarantee, indemnity or compliance with the Act within the ambit as set
security, or enter into any other transaction that by this clause. Full disclosure required for all
binds or may bind that institution or the Revenue transactions.
Fund to any future financial commitment, unless
such borrowing, guarantee, indemnity, security or
other transaction –
(a) is authorised by this act;
(b) in the case of public entities, is also authorised
by other legislation not in conflict with this Act; and
(c) in the case of loans by a province or a provincial
government business enterprise under the
ownership control of a provincial executive, is within
the limits as set in terms of the Borrowing Powers of
Provincial Governments Act, 1996 (Act 48 of 1996).
Before a public entity concludes any of the following All transactions to be approved by the DHET.
transactions, the accounting authority for the public
entity must promptly and in writing inform the relevant
treasury of the transaction and submit relevant
particulars of the transaction to its executive authority
for approval of the transaction
(a) establishment or participation in the
establishment of a company;
(b) participation in a significant partnership, trust,
unincorporated joint venture or similar arrangement;
(c) acquisition of disposal or a significant
shareholding in a company;
(d) acquisition or disposal of a significant asset.
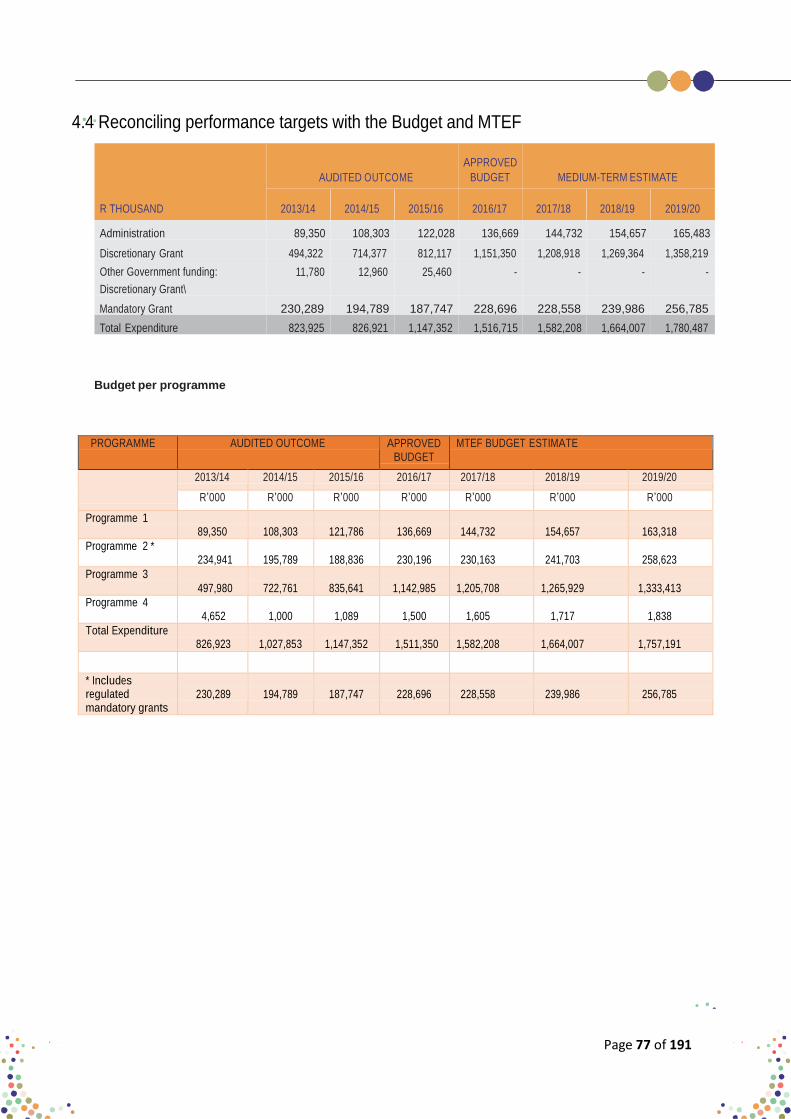
Page 77 of 191
4.4 Reconciling performance targets with the Budget and MTEF
AUDITED OUTCOME
APPROVED
BUDGET MEDIUM-TERM ESTIMATE
R THOUSAND 2013/14 2014/15 2015/16 2016/17 2017/18 2018/19 2019/20
Administration 89,350 108,303 122,028 136,669 144,732 154,657 165,483
Discretionary Grant 494,322 714,377 812,117 1,151,350 1,208,918 1,269,364 1,358,219
Other Government funding:
Discretionary Grant\
11,780 12,960 25,460 - - - -
Mandatory Grant 230,289 194,789 187,747 228,696 228,558 239,986 256,785
Total Expenditure 823,925 826,921 1,147,352 1,516,715 1,582,208 1,664,007 1,780,487
Budget per programme
PROGRAMME AUDITED OUTCOME APPROVED BUDGET
MTEF BUDGET ESTIMATE
2013/14 2014/15 2015/16 2016/17 2017/18 2018/19 2019/20
R’000 R’000 R’000 R’000 R’000 R’000 R’000
Programme 1 89,350
108,303
121,786
136,669
144,732
154,657
163,318
Programme 2 * 234,941
195,789
188,836
230,196
230,163
241,703
258,623
Programme 3 497,980
722,761
835,641
1,142,985
1,205,708
1,265,929
1,333,413
Programme 4 4,652
1,000
1,089
1,500
1,605
1,717
1,838
Total Expenditure 826,923
1,027,853
1,147,352
1,511,350
1,582,208
1,664,007
1,757,191
* Includes regulated mandatory grants
230,289
194,789
187,747
228,696
228,558
239,986
256,785

Page 78 of 191
DETAILED BREAKDOWNS OF DISCRETIONARY GRANTS
AUDITED OUTCOME APPROVED
MTEF BUDGET ESTIMATE BUDGET
MQA Project Name 2013/14 2014/15 2015/16 2016/17 2017/18 2018/19 2019/20
R’000 R’000 R’000 R’000 R’000 R’000 R’000
A008 – Skills Development Facilitator Support
2
4,652
1,000
1,089
1,500
1,605
1,717
1,838
A001 – HEI Lecturer Support 3 10,190 10,353 11,714 17,900 19,153 20,494 21,928
A002 – Bursaries 3 58,038 78,237 87,215 160,613 171,856 183,886 196,758
A003 – Work Experience 3 47,264 69,027 109,848 95,210 101,875 109,006 116,636
A006 – Internships (GDP) 3 55,045 121,527 153,744 117,602 125,834 134,643 144,068
A007 – Non Artisan Learnerships 3 56,677 79,877 74,418 200,144 190,935 180,122 174,959
A009 – ABET 3 15,181 14,718 31,383 23,230 24,856 26,596 28,458
A010 – OHS Rep Development 3 11,492 12,498 14,108 15,000 16,050 17,174 18,376
A011 – NSF 2 - Artisan Development
3
0
0
0
0
0
A012 – UIF 1 Learnerships Artisan 50% (MQA)
3
0
0
0
0
0
A013 – MQA Artisan Development 3 105,364 271,572 217,971 285,577 305,567 326,957 349,844
A014 – RPL / Artisan Aides - Employed
3
2,295
3,133
2,255
8,000
8,560
9,159
9,800
A015 – TVET College Support 3 0 0 44,652 43,367 46,403 49,651 53,126
A016 – Maths & Science 3 7,565 2,836 7,545 11,700 12,519 13,395 14,333
A017 – FLC Grant Incentive 3 1,105 1,720 1,955 2,100 2,247 2,404 2,573
A018 – Mpumalanga TVET Artisan 3 0 0 0 500 535 572 613
A019 – Mine Community Development
3
0
25,219
26,139
80,000
85,600
91,592
98,003
A020 – Workplace Coach Development
3
0
9,042
7,793
12,600
13,482
14,426
15,436
A021 – Youth Development 3 0 7,029 11,356 40,000 42,800 45,796 49,002
A022 – Management Development 3 1,393 360 3,802 8,625 9,229 9,875 10,566
A041 HDSA Management Development Candidacy
3
0
0
20,604
22,046
23,590
25,241
A004 – Standard Setting 4 3,149 2,243 1,334 2,758 2,951 3,158 3,379
A005 – Learning Materials (LM) Development
4
4,015
3,987
3,797
4,000
4,280
4,580
4,900
A042 HDSA Accredited Training Provider Support
4
0
0
500
535
572
613
TOTAL EXPENDITURE
383,425
714,378
812,118
1,151,530
1,208,918
1,269,364
1,340,448
Funds for PIVOTAL Grants: R1 299 747
Funds for other skills development interventions: R22 400
% Split is 98% for PIVOTAL grants and 2% for other skills development interventions

Page 79 of 191
PROGRAMMES SUPPORTED BY PIVOTAL GRANTS
SSP 2015-2016
MQA TOP 10 PIVOTAL
PROJECT SKILLS LIST/ SCARCE
FIELD/DISCIPLINE OCCUPATION APP LINKAGE NUMBER SKILLS LIST
Metallurgical Metallurgist 3.10a & b Supported Unemployed A002 Links to the SSP Scarce
Engineering Learners to enter into MMS Bursary Skills List
programmes.
Jewellery Design Jewellery Designer 3.10a & b Support Unemployed
Manufacturing Learners to enter into MMS Bursary
programmes.
Geology Geologist 3.10a & b Support Unemployed
Learners to enter into MMS Bursary
programmes
Mining Engineering Mining Engineer 3.10a & b Support Unemployed
Learners to enter into MMS Bursary
programmes.
Mechanical Mechanical Engineer 3.10a & b Support unemployed
Engineering Learners to enter into MMS Bursary
programmes.
Mine Surveying Mine Planner 3.10a & b Support unemployed
Learners to enter into MMS Bursary
programmes.
A002 Links to the SSP Scarce
Skills List
A002 Links to the SSP Pivotal
Skills List
A002 Links to the SSP
PIVOTAL Skills List
A002 Links to the SSP
PIVOTAL Skills List
A002 Links to the SSP
PIVOTAL Skills List

Page 80 of 191
SSP 2015-2016
MQA TOP 10 PIVOTAL
PROJECT SKILLS LIST/ SCARCE
FIELD/DISCIPLINE OCCUPATION APP LINKAGE NUMBER SKILLS LIST
Electrical Engineering Electrical Engineer 3.10a & b Support unemployed A002 Links to the SSP
(Heavy Current Only)
Chemical Engineering Chemical Engineer
(Mineral Processing)
Environmental Health Environmental Health
and Management and Manager
Analytical Chemistry Analytical Chemist
Electro Mechanical Electro Mechanical
Engineering Engineer
Industrial Engineering Industrial Engineer
Learners to enter into MMS Bursary PIVOTAL Skills List
programmes.
3.10a & b Support unemployed A002 Links to the SSP Scarce
Learners to enter into MMS Bursary Skills List
programmes
3.10a &b Support unemployed A002 Links to the SSP Scarce
Learners to enter into MMS Bursary Skills List
Programmes.
3.10a &b Support unemployed A002 Links to the SSP Scarce
Learners to enter into MMS Bursary Skills List
Programmes.
3.10a &b Support unemployed A002 Links to the SSP Scarce
Learners to enter into MMS Bursary Skills List
Programmes.
3.10a & Support unemployed A002 Links to the SSP Scarce
Learners to enter into MMS Bursary Skills List
Programmes.
Non- Artisan Learnerships
FIELD/
DISCIPLINE OCCUPATION
APP
LINKAGE
MQA
PROJECT
NUMBER
SSP 2017-2018
TOP 10 PIVOTAL
SKILLS LIST/
SCARCE SKILLS
LIST
Rock-Breaker
(Underground
Hardrock,
Underground
Coal, Surface)
Rock-Breaker 3.1a & b and
3.9a &b
A007 Links to the SSP
Scarce Skills List
Support Transformation of the sector through
skills development To increase access to occupationally-directed programmes in the mining and mineral sector.
This is done to accurately determine requisite Strata Control Strata Controller 3.1a & b and 3.9a &b
A007 Links to the SSP Scarce Skills List
middle level skill needs and evolve strategies to
ensure increased access to occupationally-directed Occupational
Health and
Safety
Occupational
Health and
Safety Officer/
Manager
3.1a & b and 3.9a &b
A007 Links to the SSP
Scarce Skills List training related to them. The MQA is currently
contributing to 3 Strategic Infrastructure Projects
(SIPs) linked to the National Development Plan -
which have a direct bearing on the MMS. (SIP1,
SIP 4 and SIP 5)

Page 81 of 191
FIELD/
DISCIPLINE
OCCUPATION
APP
LINKAGE
MQA PROJECT
NUMBER
SSP 2017-2018
TOP 10 PIVOTAL
SKILLS LIST/
SCARCE SKILLS
LIST
Mining Technical Mining 3.1a &b and A007 Links to the SSP
Support Technician 3.9a &b Scarce Skills List
Mineral Survey Mineral Survey 3.1a & b and A007 Links to the SSP
3.9a & b Scarce Skills List
Mineral Mineral 3.1a &b and A007 Links to the SSP
Processing and Processing and 3.9a & b Scarce Skills List
Control Controller Analytical Analyst 3.1a & b and A007 Links to the SSP
Support 3.9a &b Scarce Skills List
Cement and
Lime
Cement and
Lime Machine
3.1a & b
and 3.9a
&b Artisan
Learnershi
ps Lear
A007 Links to the SSP
Scarce Skills List
Manufacturing Operator Jewellery
and Diamond
Processing
Gold Smith 3.1a & b
and 3.9a
&b
A007 Links to the SSP
Scarce Skills List
Small Scale Miner 3.1a & b and A007 Links to the SSP
Mining 3.9a &b Scarce Skills List
Winding Engine Winding Engine 3.1a & b and A007 Links to the SSP
Driving Driver 3.91 & b Scarce Skills List
AET
FIELD/
DISCIPLINE OCCUPATION
APP
LINKAGE
MQA
PROJECT
NUMBER
ABET levels 1-4 N/A 3.8a & b A009 Links to the SSP
Scarce Skills List
Support transformation of the sector through
skills development
GETC – NQF
Level 1
N/A 3.8a and b A009 Links to the SSP To address the low levels of youth and adult
Scarce Skills List language in numeracy skills to enable access to
additional training in mining. Employees whose
highest level of education is between Grades 4 and
9 constitute 22% of the sector. given that changing
technology and Mining Phakisa’s mechanisation
goals will lead to a need for upskilling of many
current and future employees in the areas of
machine operations and maintenance, it will be
important for MQA to prioritise the funding of AET
training and related foundational programmes,
up to and including level 4. This will help to
develop adequate literacy and numeracy levels for
industry’s emerging new skills requirements.
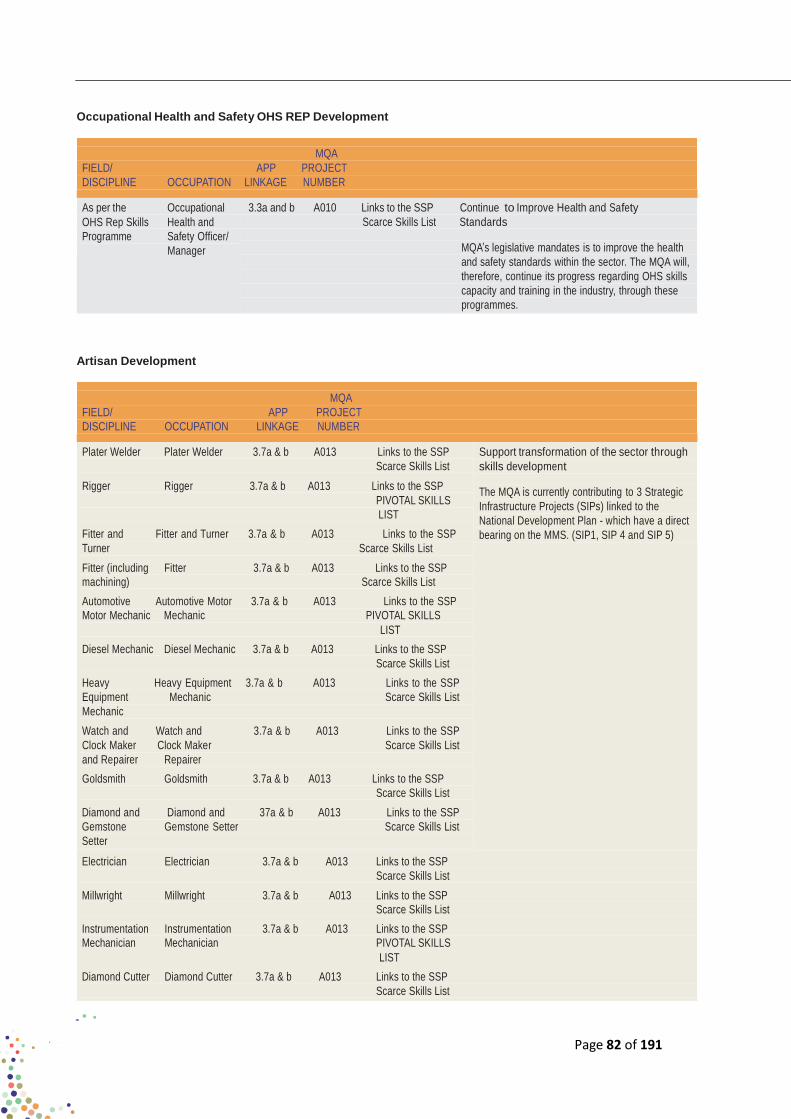
Page 82 of 191
Occupational Health and Safety OHS REP Development
MQA
FIELD/ APP PROJECT
DISCIPLINE OCCUPATION LINKAGE NUMBER
As per the Occupational 3.3a and b A010 Links to the SSP Continue to Improve Health and Safety
OHS Rep Skills Health and
Programme Safety Officer/
Manager
Scarce Skills List Standards
MQA’s legislative mandates is to improve the health
and safety standards within the sector. The MQA will,
therefore, continue its progress regarding OHS skills
capacity and training in the industry, through these
programmes.
Artisan Development
MQA
FIELD/ APP PROJECT
DISCIPLINE OCCUPATION LINKAGE NUMBER
Plater Welder Plater Welder 3.7a & b A013 Links to the SSP
Scarce Skills List
Rigger Rigger 3.7a & b A013 Links to the SSP
PIVOTAL SKILLS
LIST
Fitter and Fitter and Turner 3.7a & b A013 Links to the SSP
Turner Scarce Skills List
Fitter (including Fitter 3.7a & b A013 Links to the SSP
machining) Scarce Skills List
Automotive Automotive Motor 3.7a & b A013 Links to the SSP
Motor Mechanic Mechanic PIVOTAL SKILLS
LIST
Diesel Mechanic Diesel Mechanic 3.7a & b A013 Links to the SSP
Scarce Skills List
Heavy Heavy Equipment 3.7a & b A013 Links to the SSP
Equipment Mechanic Scarce Skills List
Mechanic
Watch and Watch and 3.7a & b A013 Links to the SSP
Clock Maker Clock Maker Scarce Skills List
and Repairer Repairer
Goldsmith Goldsmith 3.7a & b A013 Links to the SSP
Scarce Skills List
Diamond and Diamond and 37a & b A013 Links to the SSP
Gemstone Gemstone Setter Scarce Skills List
Setter
Support transformation of the sector through
skills development
The MQA is currently contributing to 3 Strategic
Infrastructure Projects (SIPs) linked to the
National Development Plan - which have a direct
bearing on the MMS. (SIP1, SIP 4 and SIP 5)
Electrician Electrician 3.7a & b A013 Links to the SSP
Scarce Skills List
Millwright Millwright 3.7a & b A013 Links to the SSP
Scarce Skills List
Instrumentation Instrumentation 3.7a & b A013 Links to the SSP
Mechanician Mechanician PIVOTAL SKILLS
LIST
Diamond Cutter Diamond Cutter 3.7a & b A013 Links to the SSP
Scarce Skills List

Page 83 of 191
RPL/Artisan Aides
MQA
APP PROJECT
FIELD/DISCIPLINE OCCUPATION LINKAGE NUMBER
Engineering Maintenance Aide: Engineering 3.7c A014 Links to the SSP Scarce Support transformation
and Repairing for Maintenance Skills List of the sector through
Underground Coal Mining and Repairing for skills development
Underground Coal
Mining
Engineering Maintenance: Aide: Engineering 3.7c A014 Links to the SSP Scarce
The MQA is currently
contributing to 3 Strategic
Infrastructure Projects
(SIPs) linked to the Underground Hard Rock Maintenance: Skills List
(Metalliferous) Underground Hard Rock National Development
(Metalliferous)
Plan - which have a direct
Engineering Fabrication: Aide: Engineering 3.7c A014 Links to the SSP Scarce bearing on the MMS.
Mining and Minerals Fabrication: Mining and Skills List (SIP1, SIP 4 and SIP 5) Minerals
Electro-Mechanics: Mining Aide: Electro- 3.7c A014 Links to the SSP Scarce
and Minerals Mechanics: Mining and Skills List
Minerals
Mechanical Engineering: Aide: Mechanical 3.7c A014 Links to the SSP Scarce
Fitting: Mining and Minerals Engineering: Fitting: Skills List
Mining and Minerals
Mechanical Handling: Aide: Mechanical 3.7c A014 Links to the SSP Scarce
Rigging: Mining and Handling: Rigging: Skills List
Minerals Mining and Minerals
Electrical Engineering: Aide: Electrical 3.7c A014 Links to the SSP
Mining and Minerals Engineering: Mining and PIVOTAL SKILLS LIST
Minerals
Measurement, Control and Aide: Measurement, 3.7c A014 Links to the SSP Scarce
Instrumentation: Mining and Control and Skills List
Minerals Instrumentation: Mining
and Minerals
Automotive Repair and Aide: Automotive Repair 3.7c A014 Links to the SSP Scarce
Maintenance: Mining and and Maintenance: Skills List
Minerals Mining and Minerals
Skills Programmes
FIELD/DISCIPLINE OCCUPATION
APP
LINKAGE
MQA
PROJECT
NUMBER
Fitting including
Machinery
Fitter A022 Links to the SSP
Scarce Skills List
Core mining skills must continue to be
developed through skills programmes.
Diesel Mechanic Diesel Mechanic A022 Links to the SSP
Scarce Skills List
Plater Welder Plater Welder A022 Links to the SSP
Scarce Skills List
In order to ensure a sufficient pool of skills
for the sector in the long-term, it is important
that the MQA continues to support and fund
programmes which are core to the sector.
Measurement
Control and
Instrumentation
Controller:
Measurement
Control and
Instrumentation
A022 Links to the SSP
Scarce Skills List
These should include core contextualized
and regularized short skills programmes. This
will also involve improved monitoring and
evaluation of training delivery and quality.
Rigger Ropesman Rigger Ropesman A022 Links to the SSP
PIVOTAL SKILLS
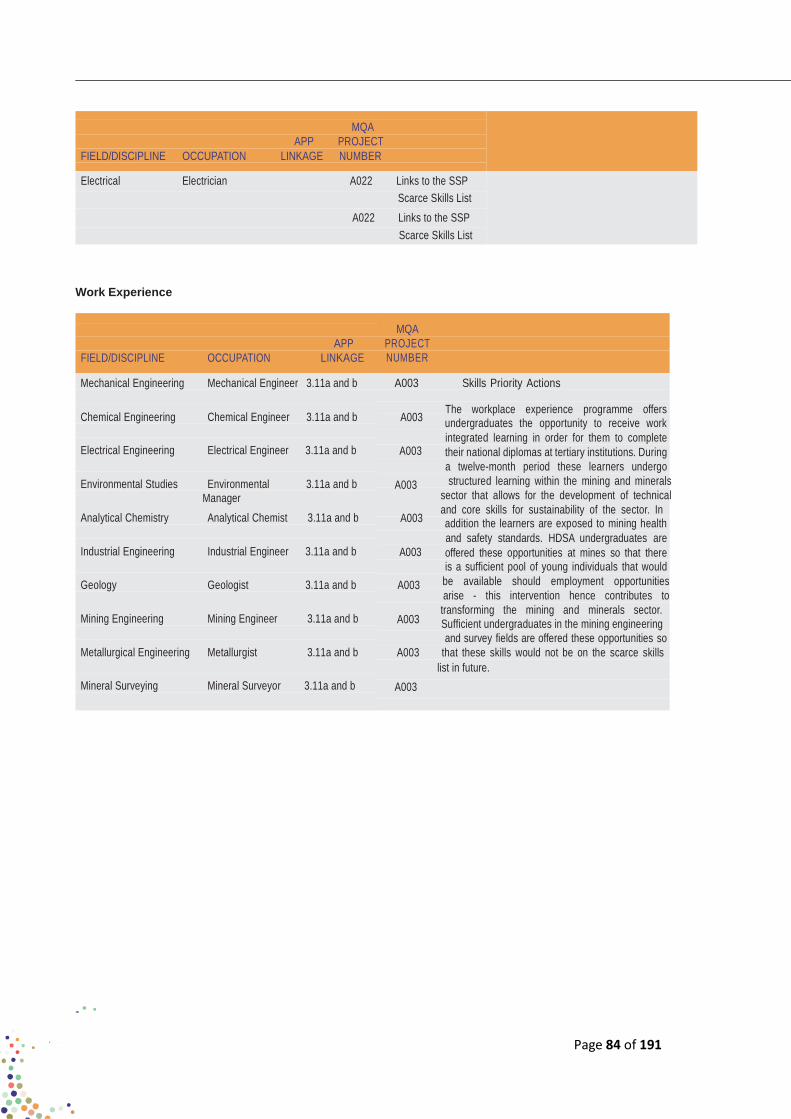
Page 84 of 191
MQA
APP PROJECT
FIELD/DISCIPLINE OCCUPATION LINKAGE NUMBER
Electrical Electrician A022 Links to the SSP
Scarce Skills List
A022 Links to the SSP
Scarce Skills List
Work Experience
APP
FIELD/DISCIPLINE OCCUPATION LINKAGE
MQA
PROJECT
NUMBER
Mechanical Engineering Mechanical Engineer 3.11a and b
Chemical Engineering Chemical Engineer 3.11a and b
Electrical Engineering Electrical Engineer 3.11a and b
Environmental Studies Environmental 3.11a and b
Manager
Analytical Chemistry Analytical Chemist 3.11a and b
Industrial Engineering Industrial Engineer 3.11a and b
Geology Geologist 3.11a and b
Mining Engineering Mining Engineer 3.11a and b
Metallurgical Engineering Metallurgist 3.11a and b
Mineral Surveying Mineral Surveyor 3.11a and b
A003 Skills Priority Actions
The workplace experience programme offers A003
undergraduates the opportunity to receive work
integrated learning in order for them to complete A003 their national diplomas at tertiary institutions. During
a twelve-month period these learners undergo
A003 structured learning within the mining and minerals
sector that allows for the development of technical
and core skills for sustainability of the sector. In A003 addition the learners are exposed to mining health
and safety standards. HDSA undergraduates are
A003 offered these opportunities at mines so that there is a sufficient pool of young individuals that would
A003 be available should employment opportunities
arise - this intervention hence contributes to
transforming the mining and minerals sector. A003 Sufficient undergraduates in the mining engineering
and survey fields are offered these opportunities so
A003 that these skills would not be on the scarce skills
list in future.
A003

Page 85 of 191
Internships
FIELD/DISCIPLINE OCCUPATION APP LINKAGE
MQA
PROJECT
NUMBER
Analytical Chemistry Analytical
Chemist
Chemical Engineering Chemical
Engineer
3.13a and b A006 Through the placement of Higher Education graduates the internship programme allows for the development of
technical skills for sustainability of the sector, as well as the 3.13a and b A006
development of core mining skills for the various disciplines.
The internships programme prepares unemployed graduates
Jewellery Design and
Creative Jewellery
Goldsmith 3.13a and b A006 over a two year period for work readiness in the occupations
outlined by providing work exposure as well as learning interventions. The structured work exposure offered at
Electrical Engineering Electrical
Engineer
3.13a.and b A006 employers also assists with providing necessary training
in health and safety matters which contributes then to
Environmental
Science
Environmental
Scientist
3.13a and b A006 improving health and safety standards. The work exposure
offers graduates the opportunity to participate and learn the requirements for new technology employed at companies.
Extraction Metallurgy Extraction
Metallurgist
3.13a and b A006 In addition the internship programme offers HDSAs the
opportunity for work experience thus making them eligible for
Geology Geologist 3.13a and b A006 employment, this intervention hence supports transformation
of the sector through skills development. Furthermore, by Industrial Engineering Industrial
Engineer
3.13a and b A006 offering work exposure to graduates in the fields of mining
engineering and survey the internships programme is
Metallurgy Metallurgist 3.13a and b A006
Mine Engineering Mine Engineer 3.13a and b A006
Mine Survey Mine Surveyor 3.13a and b A006
HET Lecturer Support
contributing to the filling of hard to fill occupations within the
mining and minerals sector
APP MQA PROJECT
FIELD/DISCIPLINE OCCUPATION LINKAGE NUMBER
HET Lecturer Lecturers 3.5a and b A001 The MQA supports the development of HDSAs as lecturers
Support at universities, this intervention is aimed at supporting
transformation of the sector through skills development
TVET College Support: Lecturers
APP MQA PROJECT
FIELD/DISCIPLINE OCCUPATION LINKAGE NUMBER
TVET College Lecturers 3.6 MQA Project The aim of offering TVET lecturers work exposure at mines
Support: Lecturers is to ensure quality improvements in lecturing at the colleges, which would then lead towards HDSAs learners receiving quality education, in turn these learners would be available
for employment opportunities within the mining and minerals
sector thus contributing to transformation of the sector.
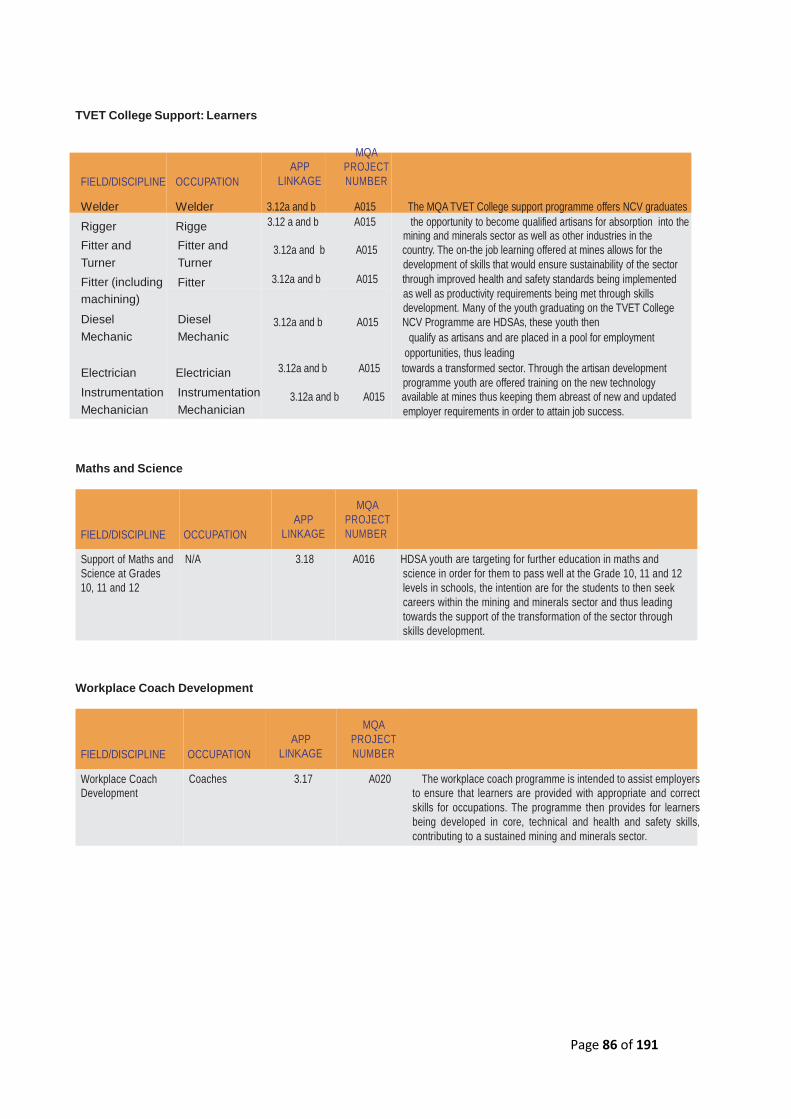
Page 86 of 191
TVET College Support: Learners
FIELD/DISCIPLINE OCCUPATION
APP
LINKAGE
MQA
PROJECT
NUMBER
Welder Welder 3.12a and b A015 The MQA TVET College support programme offers NCV graduates
Rigger Rigge 3.12 a and b A015 the opportunity to become qualified artisans for absorption into the mining and minerals sector as well as other industries in the
Fitter and
Turner
Fitter and
Turner 3.12a and b A015 country. The on-the job learning offered at mines allows for the
development of skills that would ensure sustainability of the sector
Fitter (including
machining)
Fitter 3.12a and b A015 through improved health and safety standards being implemented
as well as productivity requirements being met through skills
development. Many of the youth graduating on the TVET College Diesel
Mechanic
Diesel
Mechanic
3.12a and b A015 NCV Programme are HDSAs, these youth then
qualify as artisans and are placed in a pool for employment
opportunities, thus leading
Electrician Electrician 3.12a and b A015 towards a transformed sector. Through the artisan development
programme youth are offered training on the new technology Instrumentation
Mechanician
Instrumentation
Mechanician 3.12a and b A015 available at mines thus keeping them abreast of new and updated
employer requirements in order to attain job success.
Maths and Science
FIELD/DISCIPLINE OCCUPATION
APP
LINKAGE
MQA
PROJECT
NUMBER
Support of Maths and
Science at Grades
10, 11 and 12
N/A 3.18 A016 HDSA youth are targeting for further education in maths and
science in order for them to pass well at the Grade 10, 11 and 12
levels in schools, the intention are for the students to then seek
careers within the mining and minerals sector and thus leading
towards the support of the transformation of the sector through
skills development.
Workplace Coach Development
FIELD/DISCIPLINE OCCUPATION
APP
LINKAGE
MQA
PROJECT
NUMBER
Workplace Coach
Development
Coaches 3.17 A020 The workplace coach programme is intended to assist employers
to ensure that learners are provided with appropriate and correct
skills for occupations. The programme then provides for learners
being developed in core, technical and health and safety skills,
contributing to a sustained mining and minerals sector.
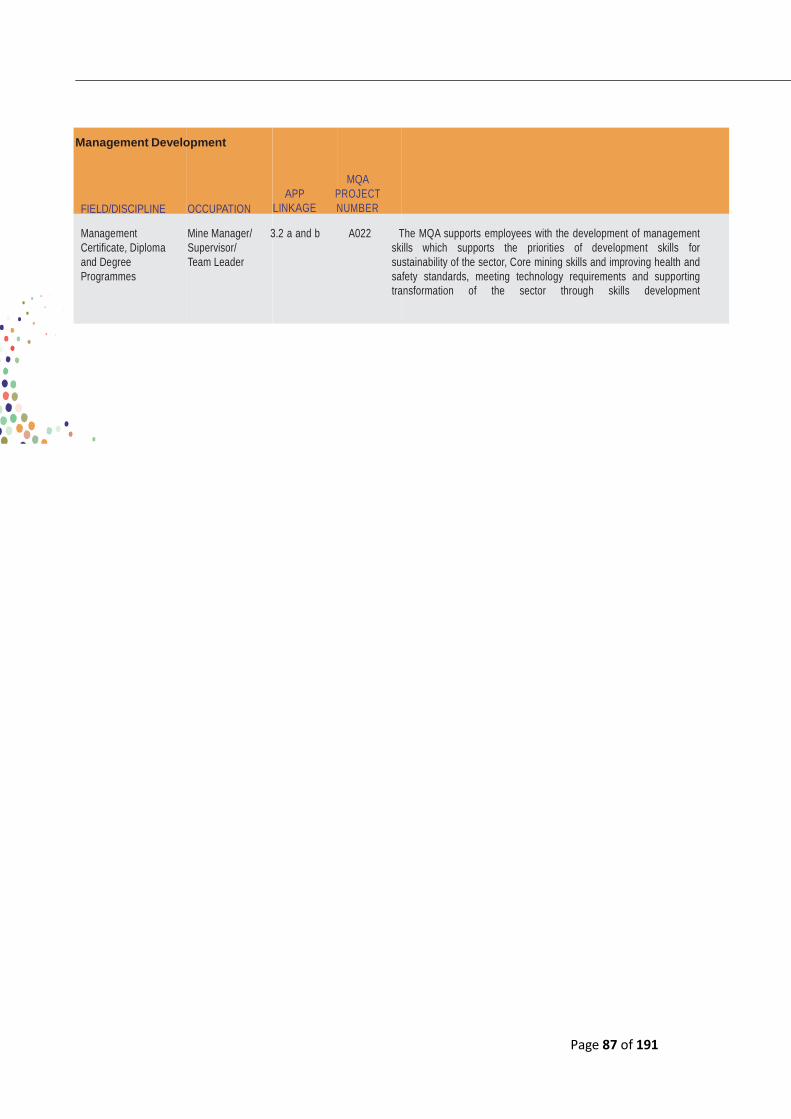
Page 87 of 191
Management Development
FIELD/DISCIPLINE OCCUPATION
APP
LINKAGE
MQA
PROJECT
NUMBER
Management
Certificate, Diploma
and Degree
Programmes
Mine Manager/
Supervisor/
Team Leader
3.2 a and b A022 The MQA supports employees with the development of management
skills which supports the priorities of development skills for
sustainability of the sector, Core mining skills and improving health and
safety standards, meeting technology requirements and supporting
transformation of the sector through skills development

Page 88 of 191
Candidacy
FIELD/
DISCIPLINE OCCUPATION APP LINKAGE
MQA
PROJECT
NUMBER
Mechanical
Engineering
Mechanical
Engineer
3.4 a and b A041 The candidacy programme aims to place Higher Education
graduates that have completed internship programmes to obtain a relevant government certificate of competence.
Electrical
Engineering
Mineral
Beneficiation
(Smelting)
Electrical Engineer 3.4 a and b A041
Production 3.15b A005 Links to the
SSP Scarce
Skills List
In this programme the development of, technical skills as
well as the development of core mining skills for the various
disciplines are undertaken. The structured learning for the
candidacy programme makes graduates ready
for undertaking the examinations for the certificates of
competence. Once they attain the certificate of competence
HDSAs are available for senior roles within the sector. This
intervention links with the priorities of supporting
transformation of the sector as well as development of the
sustainability of the sector and improving health and safety
standards employed at mines.
The implementation of the strategy is expected to create
and retain much needed jobs in the MMS. The MQA
needs to maintain strong relationships with government
departments involved in this, to understand its role in
responding to any resulting skills needs.
Mineral
Beneficiation
(Hydrometallurgy)
Scraper Winch
Operator
Mineral
Beneficiation
(Hydrometallurgy)
Scraper Winch
Operator
3.15b A005 Links to the
SSP Scarce
Skills List
3.15b A005 Links to the
Regulation
The implementation of the strategy is expected to create
and retain much needed jobs in the MMS. The MQA
needs to maintain strong relationships with government
departments involved in this, to understand its role in
responding to any resulting skills needs.
Not linked to the SSP
Ventilation Officer Ventilation Officer 3.15b A005 Links to the
Regulation
Not linked to the SSP

Page 89 of 191
PROGRAMME 3 TARGETS APP LINKAGE
MQA PROJECT
NUMBER SKILLS PRIORITY ACTIONS
Capacitate skills development
facilitators and skills development
committee members.
Undertake 9 relevant research projects in
skills development priorities within the
MMS for the purpose of making informed
decisions.
2.1 & 2.2 A008 Develop Skills for Sustainability: To ensure better use
of workplace based skills development within MMS.
The SDFs and SDC are to be capacitated to enable
them to plan skills development initiatives for the sector
accordingly. This ties to the data sources, credibility and
reliability of information reported through WSP-ATR as
elaborated in section for WSP-ATR evaluations.
2.4 Administration Develop Skills for Sustainability: The main change drivers
currently impacting the MMS are: technology, together
with Mining Phakisa. it is imperative for the MQA to
understand and unpack the implications of these change
drivers on skills development for the sector so as to
understand the impact theses has on skills planning to
ensure that learners graduate with knowledge of and
experience in the latest technology being used in the
sector. The outlook of the MMS would be improved if
the MQA monitors through research; the developments of
Mining Phakisa, the implementation of the Mineral
Beneficiation Action Plan (MBAP) and the SIPs projects,
which are expected to increase economic activity and
create new jobs. There is a growing need to protect the
environment, with increased enforcement of legislation
and consumer pressure driving the demand for eco-
compliance within the MMS. Research to understand and
unpack the skills requirements for the green economy
within MMS is a necessity. All the above contribute to a
credible institutional mechanism to skills planning.
Evaluate 660 Workplace Skills Plans
(WSPs) and Annual Training
Reports(ATR) for Small, Medium and
Large Firms.to disburse mandatory
grants
2.3 Mandatory
Grants
Develop Skills for Sustainability: The Research process
and Methods section in the SSP highlights challenges
in data sources and data sets. Of importance to note
is the heavy reliance on WSP-ATR data received annually.
Reliability and credibility of this data source is paramount to
various chapters in the SSP and the overall understanding
of the MMS profile. This including but not limited to
Employer and Employee profiles, the skills initiatives and
skills planning by the sector. Evaluation of WSP-ATR
submissions is critical as a process to ensure data validity,
credibility and consistency in reporting.
Collaborate with 5 public institutions
regarding skills development research in
the Mining and Minerals Sector.
2.5. Administration Develop Skills for Sustainability: partnerships with
various public institutions for research has been
highlighted and recommended in the SSP to compliment
the work being done by MQA as well as having a
collaborated approach in research within MMS.
Youth Development
MQA
SSP 2015-2016
TOP 10 PIVOTAL SKILLS
APP PROJECT LIST/ SCARCE SKILLS
FIELD/DISCIPLINE OCCUPATION LINKAGE NUMBER LIST
Entrepreneurship of Small Medium
Enterprise Development for the MMS
Entrepreneur N/A A021 Links to the SSP Scarce Skills
List

Page 90 of 191
ANNEXURE 1: PROGRAMME SPECIFIC DESCRIPTION
MQA SKILLS
INTERVENTIONS
OBJECTIVE OF SKILLS
INTERVENTIONS ALIGNMENT TO NSDS3
OTHER NATIONAL AND
SECTORAL INITIATIVES
SUPPORTED
NB: All skills
development initiatives
DHET’s PERFORMANCE
REQUIREMENTS
(QMR)
Standards Setting
for HET and TVET
programmes
Career and Pathway
Guidance Project
Mathematics and Science
Project
Developed Occupational
Qualifications, Standards
and Programmes in
accordance with the MMS
Participate in establishing
partnerships and assisting
employees in the sector
with information on career
path progression as well
as career guidance.
Career guidance to be
provided to employed and
unemployed youth
To support Grades 10, 11
and 12 Maths & Science
learners to achieve good
maths and science results
in order for them to seek
careers with in the MMS
Quality provisioning of
skills Building career and
vocational guidance Addressing the low level
of youth and adult
numeracy skills to enable
additional training
Support of Governments
MTSF
Objectives: Strengthen
the Skills and carter for
human resources base
National Career guidance
Framework Contribution to
Presidential Outcomes
for Minster of Higher
Education and Training:
Output 2: Increase access
to programmes leading to
intermediate- and
To be added onto QMR
Template of the DHET)
Other Support
To be added onto QMR
Template of the DHET)
Other Support
To be added onto QMR
Template of the DHET)
- Rural Schools
- Mining Community
Schools
AET Grant To facilitate and support
the registration of learners
of AET programmes to
progressively increase
levels of literacy in the
MMS
Addressing the low level
of youth and adult
language and numeracy
skills to enable additional
training
Contribution to
Presidential Outcomes
for the Minster of Higher
Education and Training:
Output 2: Increase access
to programmes
(To be added onto QMR
Template of the DHET)
Basic and Foundation
Learning (Entered and
Certificated)
AET 1
Skills Programmes for
Occupational Health and
safety Representatives
Development
To train 40 000 OHS
Representatives over five
years as required by Mine
Health & Safety Tripartite
Leadership Summit.
Encouraging better use
of workplace-based skills
development
Support of Governments
MTSF Objectives:
Strengthen the skills and
human resource base
(To be added onto QMR
Template of the DHET)
Intermediate Learning
Employed (Registered
and Certificated)
TVET collaboration Provide support to Public
TVET Colleges which
results in the effective
implementation of skills
development
interventions required for
the MMS.
Promoting the growth of
the public TVET college
system that is responsive
to sector, local, regional
and national skills needs
and priorities. (NSDSIII
Goal) Partnerships
between public training
providers, between
providers and SETAs
Broad-based Socio-
Economic National Skills
Accord
To be reported within the
relevant programmes
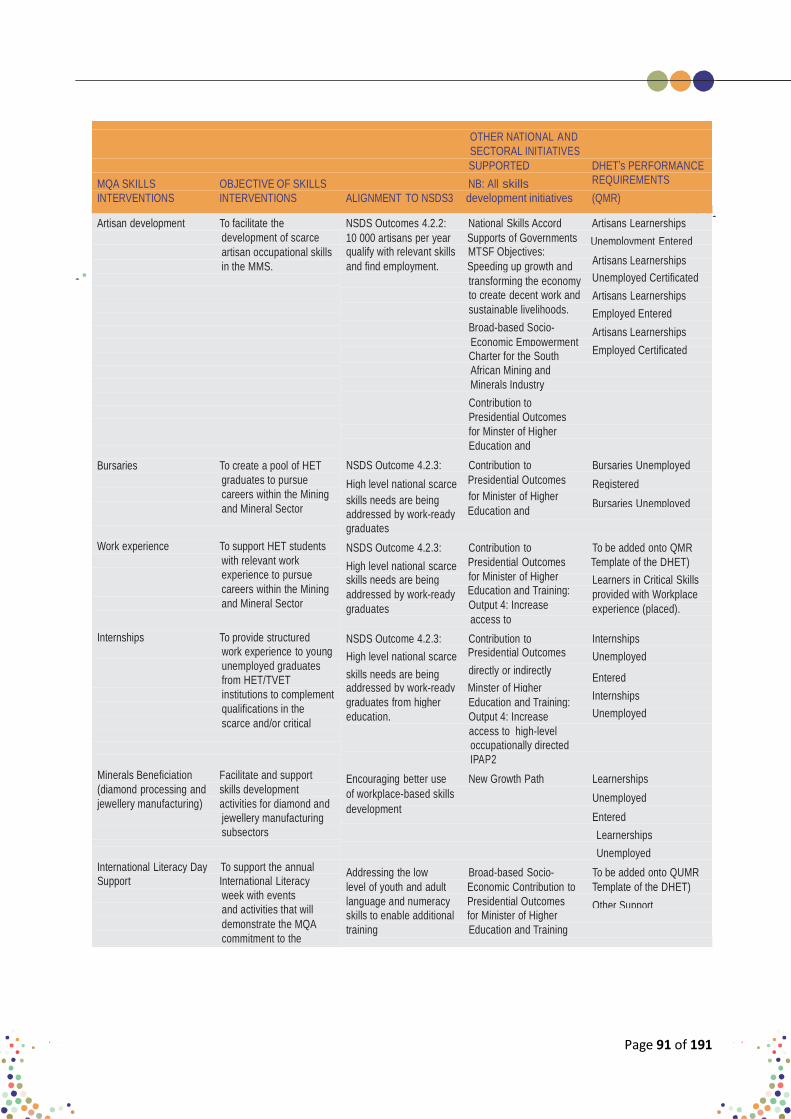
Page 91 of 191
OTHER NATIONAL AND
SECTORAL INITIATIVES
SUPPORTED DHET’s PERFORMANCE
MQA SKILLS OBJECTIVE OF SKILLS NB: All skills REQUIREMENTS
INTERVENTIONS INTERVENTIONS ALIGNMENT TO NSDS3 development initiatives (QMR)
Artisan development To facilitate the NSDS Outcomes 4.2.2: National Skills Accord Artisans Learnerships
development of scarce
artisan occupational skills
in the MMS.
Bursaries To create a pool of HET
graduates to pursue
careers within the Mining
and Mineral Sector
Work experience To support HET students
with relevant work
experience to pursue
careers within the Mining
and Mineral Sector
Internships To provide structured
work experience to young
unemployed graduates
from HET/TVET
institutions to complement
qualifications in the
scarce and/or critical
Minerals Beneficiation Facilitate and support
(diamond processing and skills development
jewellery manufacturing) activities for diamond and
jewellery manufacturing
subsectors
International Literacy Day To support the annual
Support International Literacy
week with events
and activities that will
demonstrate the MQA
commitment to the
10 000 artisans per year Supports of Governments Unemployment Entered qualify with relevant skills MTSF Objectives:
and find employment. Speeding up growth and Artisans Learnerships
transforming the economy Unemployed Certificated
to create decent work and Artisans Learnerships sustainable livelihoods. Employed Entered Broad-based Socio- Artisans Learnerships Economic Empowerment
Charter for the South Employed Certificated
African Mining and
Minerals Industry
Contribution to
Presidential Outcomes
for Minster of Higher
Education and
NSDS Outcome 4.2.3: Contribution to Bursaries Unemployed
High level national scarce Presidential Outcomes Registered
skills needs are being for Minister of Higher Bursaries Unemployed
addressed by work-ready Education and
graduates
NSDS Outcome 4.2.3: Contribution to To be added onto QMR
High level national scarce Presidential Outcomes Template of the DHET)
skills needs are being for Minister of Higher Learners in Critical Skills
addressed by work-ready Education and Training: provided with Workplace
graduates Output 4: Increase experience (placed). access to
NSDS Outcome 4.2.3: Contribution to Internships
High level national scarce Presidential Outcomes Unemployed
skills needs are being directly or indirectly Entered
addressed by work-ready Minster of Higher
graduates from higher Education and Training: Internships
education. Output 4: Increase Unemployed
access to high-level
occupationally directed
IPAP2
Encouraging better use New Growth Path Learnerships
of workplace-based skills Unemployed
development Entered
Learnerships
Unemployed
Addressing the low Broad-based Socio- To be added onto QUMR
level of youth and adult Economic Contribution to Template of the DHET)
language and numeracy Presidential Outcomes Other Support
skills to enable additional for Minister of Higher
training Education and Training

Page 92 of 191
MQA SKILLS
INTERVENTIONS
OBJECTIVE OF SKILLS
INTERVENTIONS ALIGNMENT TO NSDS3
OTHER NATIONAL AND
SECTORAL INITIATIVES
SUPPORTED
NB: All skills
development initiatives
DHET’s PERFORMANCE
REQUIREMENTS
(QMR)
Foundational Learning
Competency Grant
Incentive
Development of learning
materials
To facilitate and support
the enrolment of learners
on FLC training to
progressively increase
levels of literacy in the
Sector To develop learning
packs, learning materials
for TVET and HET
programmes to be used
by industry providers.
Addressing the low level
of youth and adult
language and numeracy
skills to enable additional
training Quality provisioning of
skills development
Broad-based Socio-
Economic Empowerment
Charter for the South
African Mining and
Minerals Industry
Contribution to
Presidential Outcome
for Minister of Higher
Education and Training
NB: All skills development
initiatives support of
Government Objectives:
Strengthen the skills and
human resource base
To be added onto QMR
Template of the DHET)
Foundational
Employed
Registered
To be added onto QMR
Template of the DHET)
Other Support
Non-artisan Learnerships To support learners on
core Learnerships (Non-
artisan) for the MMS.
Encouraging better use
of workplace-based skills
development
Broad-based Socio-
Economic Empowerment
Charter for the South
African Mining and
minerals industry
New Growth Path
Support of Governments
MTSF
Objectives: Speeding up
growth and transforming
the economy to create
decent work and
sustainable livelihoods.
Contribution to
Presidential Outcomes
for Minster of Higher
Education and
Learnerships
Unemployed
Entered
Learnership
Unemployed
Certificated
Learnerships Employed
Entered
Page 93 of 191
Part C: Links to other plans
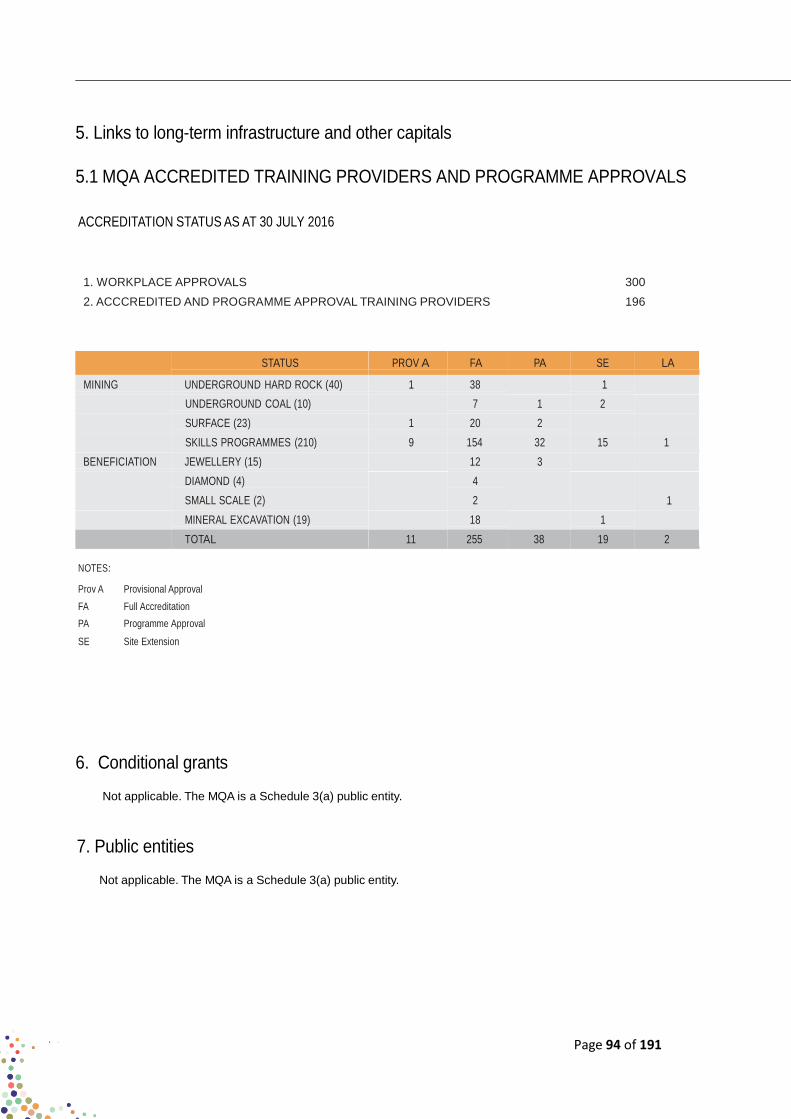
Page 94 of 191
5. Links to long-term infrastructure and other capitals
5.1 MQA ACCREDITED TRAINING PROVIDERS AND PROGRAMME APPROVALS
ACCREDITATION STATUS AS AT 30 JULY 2016
1. WORKPLACE APPROVALS 300
2. ACCCREDITED AND PROGRAMME APPROVAL TRAINING PROVIDERS 196
STATUS PROV A FA PA SE LA
MINING UNDERGROUND HARD ROCK (40) 1 38 1
UNDERGROUND COAL (10) 7 1 2
SURFACE (23) 1 20 2
SKILLS PROGRAMMES (210) 9 154 32 15 1
BENEFICIATION JEWELLERY (15) 12 3
DIAMOND (4) 4
SMALL SCALE (2) 2 1
MINERAL EXCAVATION (19) 18 1
TOTAL 11 255 38 19 2
NOTES:
Prov A Provisional Approval
FA Full Accreditation
PA Programme Approval
SE Site Extension
6. Conditional grants
Not applicable. The MQA is a Schedule 3(a) public entity.
7. Public entities
Not applicable. The MQA is a Schedule 3(a) public entity.

Page 95 of 191
8. Public – private partnerships
8.1 Collaboration plans with SA public TVET Colleges
TABEL OF CONTENTS
1.
Acronyms
163
2.
Preamble
164
3.
Introduction
165
4.
Profile of TVET Colleges
165
5.
Challenges
167
6.
Strategic Intent
167
7.
MQA’s Approach and Interventions
168
8.
Implementation Plan
168
9.
Conclusion
168
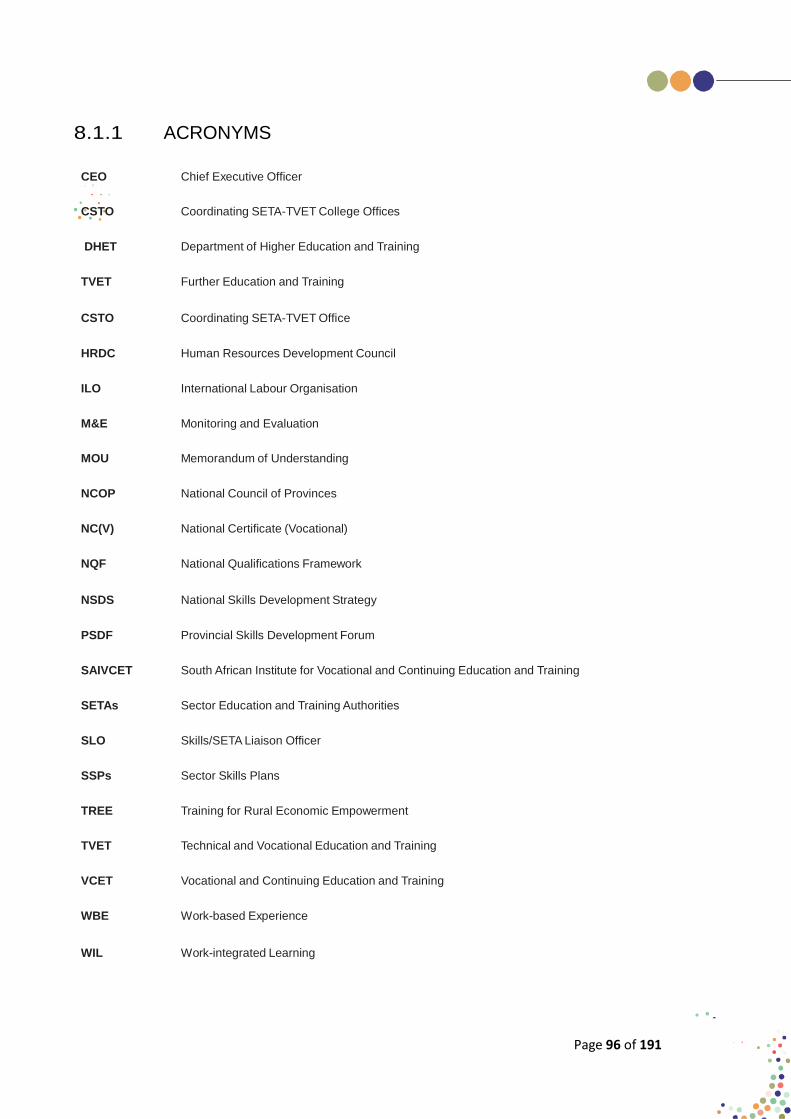
Page 96 of 191
8.1.1 ACRONYMS
CEO Chief Executive Officer
CSTO Coordinating SETA-TVET College Offices
DHET Department of Higher Education and Training
TVET Further Education and Training
CSTO Coordinating SETA-TVET Office
HRDC Human Resources Development Council
ILO International Labour Organisation
M&E Monitoring and Evaluation
MOU Memorandum of Understanding
NCOP National Council of Provinces
NC(V) National Certificate (Vocational)
NQF National Qualifications Framework
NSDS National Skills Development Strategy
PSDF Provincial Skills Development Forum
SAIVCET South African Institute for Vocational and Continuing Education and Training
SETAs Sector Education and Training Authorities
SLO Skills/SETA Liaison Officer
SSPs Sector Skills Plans
TREE Training for Rural Economic Empowerment
TVET Technical and Vocational Education and Training
VCET Vocational and Continuing Education and Training
WBE Work-based Experience
WIL Work-integrated Learning

Page 97 of 191
8.1.2 PREAMBLE
The National Skills Development Strategy (NSDS) III makes specific reference to the need for SETAs to form
partnerships with TVET colleges, and support colleges to be providers of choice. There are moves underway within
the DHET to create an enabling mechanism for such partnerships to operate and skills levy money will be earmarked
to ensure this happens. However, the skills development sub-system must be able to rely on the ability of the college
sub-system to deliver, both in terms of quality and quantity.
Part of the responsibility rests on the SETAs to achieve goals 4.2 and 4.3 of the NSDS III, outlined below:
4.2 Increasing access to occupationally-directed programmes through work experience
4.3 Promoting the growth of a public TVET college system that is responsive to sector, regional and national skills
needs and priorities
NSDS Outcome 4.3.1: The National Certificate (Vocational) and N-courses are recognised by employers as
important base qualifications through which young people are obtaining additional vocational skills and
work experience, entering the labour market with marketable skills, and obtaining employment
NSDS Outcome 4.3.2: Partnerships between DHET, SETAs, employers, private providers and public TVET
colleges are resulting in increased capacity to meet industry needs throughout the country
Output 4.3.2.2: SETAs identify TVET colleges with relevant programmes and put in place partnerships to offer
vocational courses and work experience for college learners
This calls for a coordinated approach for collaboration to provide the SETAs with a platform for partnerships to:
• Identify relevant programmes and establish the necessary partnerships with all stakeholders (namely SETA’s,
TVET Executives, Employers, Provincial Government and Communities) to offer career guidance, vocational
courses and bursaries for TVET learners;
• Facilitate collaboration and processes to enable the following:
o Collaboration between colleges and industry;
o Support for development of Assessors and Moderators;
o Support for learner guidance in scarce and critical skills required by each sector through career exhibitions;
and
o Support for learner with bursaries for identified programmes.
• Establish a workplace for the provincial SETA collaboration to function from i.e. co-ordinate activities and
disseminate Information regarding initiatives and projects in the province;
• Develop lecturer capacity (linking to a skills programme/qualification) to deliver programmes necessary for
economy of provinces;
• Establish strategic partnerships for delivery inclusive of local government and the business sector;
• Develop articulated professional qualifications pathways between TVET Colleges and universities in the provinces;
• Ensure existing facilities and infrastructure are well-utilised and of a standard to ensure that the project is
implemented effectively;
• Include rural communities in planning and delivery;
• Conduct monitoring and evaluation activities to determine the impact of projects and the collaboration agreement within the provinces
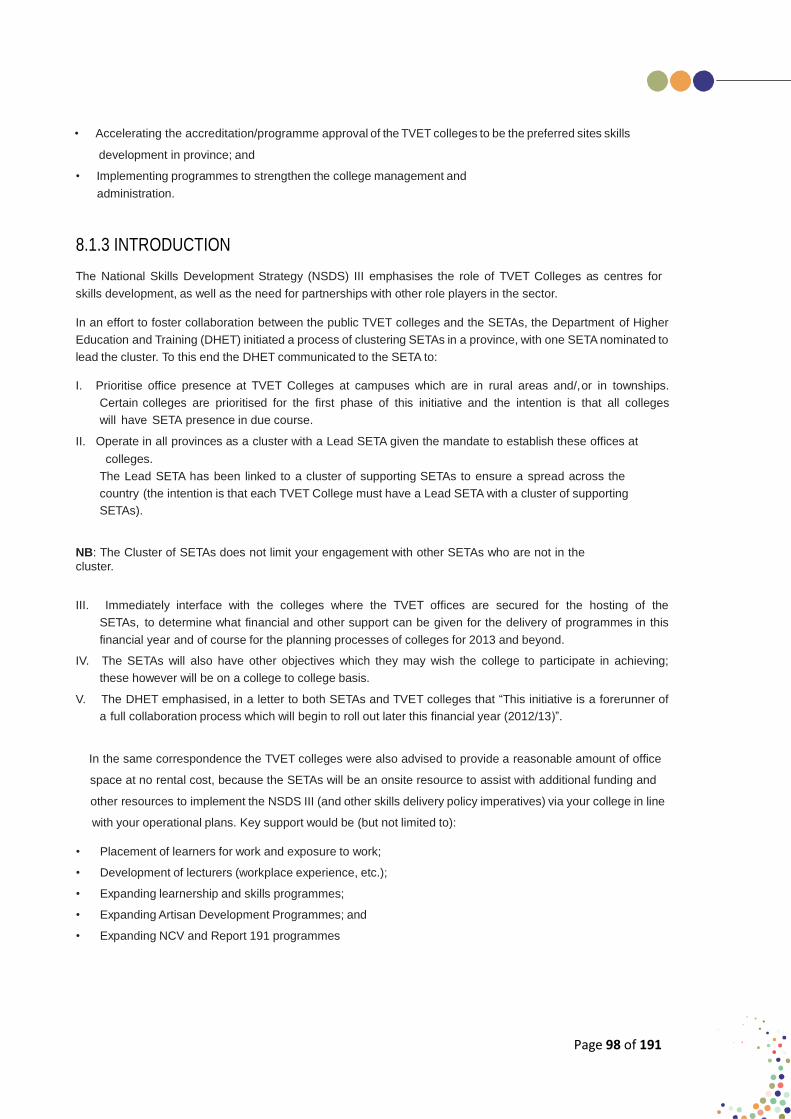
Page 98 of 191
• Accelerating the accreditation/programme approval of the TVET colleges to be the preferred sites skills
development in province; and
• Implementing programmes to strengthen the college management and
administration.
8.1.3 INTRODUCTION
The National Skills Development Strategy (NSDS) III emphasises the role of TVET Colleges as centres for
skills development, as well as the need for partnerships with other role players in the sector.
In an effort to foster collaboration between the public TVET colleges and the SETAs, the Department of Higher
Education and Training (DHET) initiated a process of clustering SETAs in a province, with one SETA nominated to
lead the cluster. To this end the DHET communicated to the SETA to:
I. Prioritise office presence at TVET Colleges at campuses which are in rural areas and/,or in townships.
Certain colleges are prioritised for the first phase of this initiative and the intention is that all colleges
will have SETA presence in due course.
II. Operate in all provinces as a cluster with a Lead SETA given the mandate to establish these offices at
colleges.
The Lead SETA has been linked to a cluster of supporting SETAs to ensure a spread across the
country (the intention is that each TVET College must have a Lead SETA with a cluster of supporting
SETAs).
NB: The Cluster of SETAs does not limit your engagement with other SETAs who are not in the
cluster.
III. Immediately interface with the colleges where the TVET offices are secured for the hosting of the
SETAs, to determine what financial and other support can be given for the delivery of programmes in this
financial year and of course for the planning processes of colleges for 2013 and beyond.
IV. The SETAs will also have other objectives which they may wish the college to participate in achieving;
these however will be on a college to college basis.
V. The DHET emphasised, in a letter to both SETAs and TVET colleges that “This initiative is a forerunner of
a full collaboration process which will begin to roll out later this financial year (2012/13)”.
In the same correspondence the TVET colleges were also advised to provide a reasonable amount of office
space at no rental cost, because the SETAs will be an onsite resource to assist with additional funding and
other resources to implement the NSDS III (and other skills delivery policy imperatives) via your college in line
with your operational plans. Key support would be (but not limited to):
• Placement of learners for work and exposure to work;
• Development of lecturers (workplace experience, etc.);
• Expanding learnership and skills programmes;
• Expanding Artisan Development Programmes; and
• Expanding NCV and Report 191 programmes

Page 99 of 191
While all the SETAs are supporting this national DHET projects, there has been some work done by the MQA in
support of the TVET colleges where its regional offices are housed. Some of the initiatives undertaken by the
MQA in the past financial year includes, but not limited to, the following:
• Placement of Report 191 and NCV learners for work and exposure to work;
• Development of lecturers in work environments; and
• Assisting with program pproval with the ETQA business unit of the MQA.
8.1.4 PROFILE OF TVET COLLEGES
As of December 2010, there were 603 managers, 7 957 lecturing staff and 6 048 support staff in the 50 public
TVET Colleges, with 232 campuses or learning sites public TVET colleges in South Africa, as can be seen in the
table below.
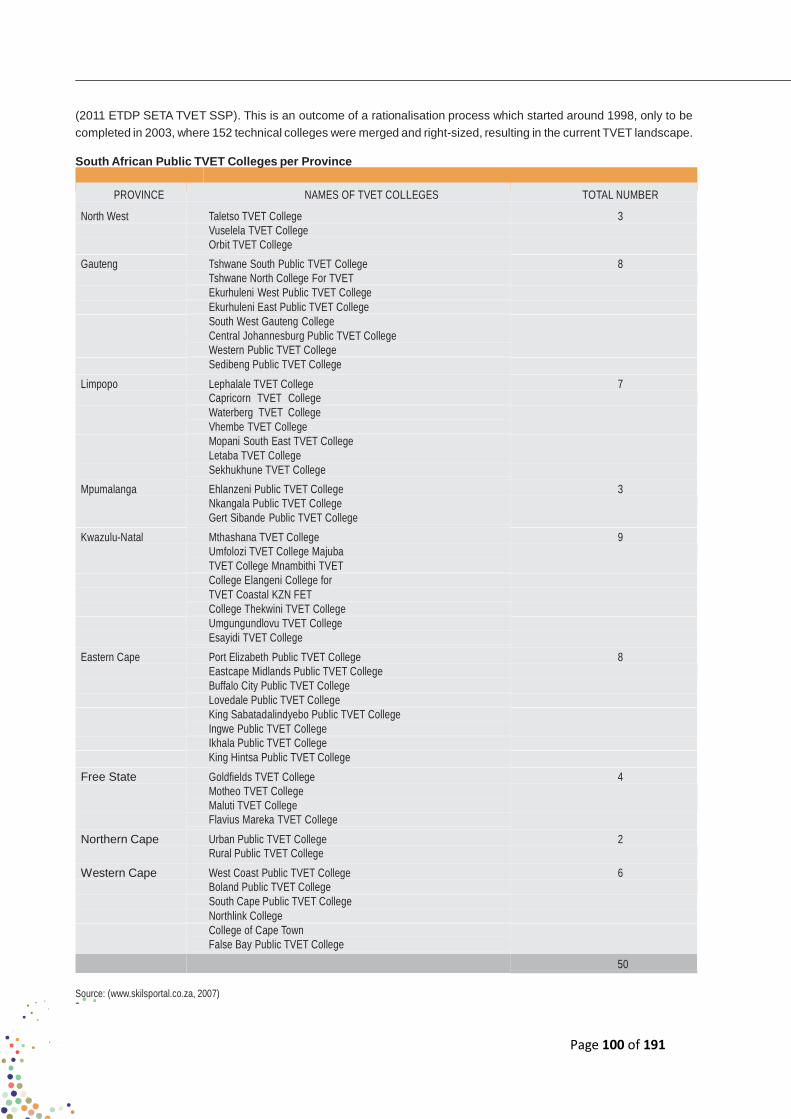
Page 100 of 191
(2011 ETDP SETA TVET SSP). This is an outcome of a rationalisation process which started around 1998, only to be
completed in 2003, where 152 technical colleges were merged and right-sized, resulting in the current TVET landscape.
South African Public TVET Colleges per Province
PROVINCE
North West
NAMES OF TVET COLLEGES
Taletso TVET College
TOTAL NUMBER
3
Vuselela TVET College Orbit TVET College
Gauteng Tshwane South Public TVET College
Tshwane North College For TVET
8
Ekurhuleni West Public TVET College Ekurhuleni East Public TVET College South West Gauteng College Central Johannesburg Public TVET College
Western Public TVET College
Sedibeng Public TVET College Limpopo Lephalale TVET College
Capricorn TVET College
7
Waterberg TVET College Vhembe TVET College Mopani South East TVET College
Letaba TVET College
Sekhukhune TVET College Mpumalanga Ehlanzeni Public TVET College
Nkangala Public TVET College
3
Gert Sibande Public TVET College Kwazulu-Natal Mthashana TVET College
Umfolozi TVET College Majuba
9
TVET College Mnambithi TVET College Elangeni College for TVET Coastal KZN FET College Thekwini TVET College Umgungundlovu TVET College Esayidi TVET College
Eastern Cape Port Elizabeth Public TVET College
Eastcape Midlands Public TVET College
8
Buffalo City Public TVET College Lovedale Public TVET College King Sabatadalindyebo Public TVET College
Ingwe Public TVET College
Ikhala Public TVET College King Hintsa Public TVET College Free State Goldfields TVET College
Motheo TVET College
Maluti TVET College
4
Flavius Mareka TVET College Northern Cape Urban Public TVET College
Rural Public TVET College
2
Western Cape West Coast Public TVET College
Boland Public TVET College
6
South Cape Public TVET College Northlink College College of Cape Town
False Bay Public TVET College
50
Source: (www.skilsportal.co.za, 2007)

Page 101 of 191
8.1.5 CHALLENGES
The general challenges by all Public TVET Colleges in the country are summarised as follows:
5.1. Lack of adequate funding for students’ tuition, books, accommodation and personal allowances;
5.2. Lack of favourable recruitment of NCV graduates upon completion of their studies;
5.3. Lack of favourable recruitment of Report 191 graduates upon completion of their studies;
5.4. Poor placement of graduates for workplace experience in industry;
5.5. Industry- inexperienced lecturers;
5.6. Industry-unconnected curriculum;
5.7. Poor management and adherence to corporate governance issues;
5.8. Outdated workshop equipment; and
5.9. Poor college infrastructure, including libraries and resource centres.
8.1.6 STRATEGIC INTENT
The MQA Regional offices were tasked with the responsibility of developing a report detailing the gaps that had been
identified within the TVET Colleges in all the regions the MQA has regional offices in.
As a result of the directive, an abridged and consolidated report takes into account, inter alia, the following areas where
the gaps had been identified, with the intent of exploring the possibility of offering aid to TVET Colleges:
I. Workshops;
II. Management Issues;
III. Financial Stability;
IV. Curriculum; and
V. Others.
GAP AREA STATUS REPORT
Workshops The equipment and machinery used for skills development in the TVET Colleges’ workshops are very old and
some are unserviceable. They are not aligned to what the industry uses, and that poses a challenge in that the
students carry out their practicals based on equipment they may never see again in the real life work
environment.
Management Issues The signed MOU deliverables are not carried out by either the TVET Colleges or MQA, even though the drafted
implementation plan clearly identified the action steps that needed to be taken.
Financial Stability The TVET Colleges are relatively stable financially as most of its funding for the learners comes from the
Department of Higher Education (DHET). The only challenge faced by the TVET Colleges in so far as finances
are concerned is the late funding of students’ studies through NSFAS bursaries by DHET, and this tends to fuel
students uprisings in various campuses, especially during the beginning of each trimester or semester, creating
huge uncertainties among the students.
Curriculum The curricula in both the Nated and the NCV programmes at the TVET Colleges are more or less aligned to the
MQA and industry requirements, but very limited.
Other Gap Areas • The establishment of the Resource Centre (Library) on campus;
• The placements of the learners in the workplace; and
• The placements of lecturers in the workplace environment.
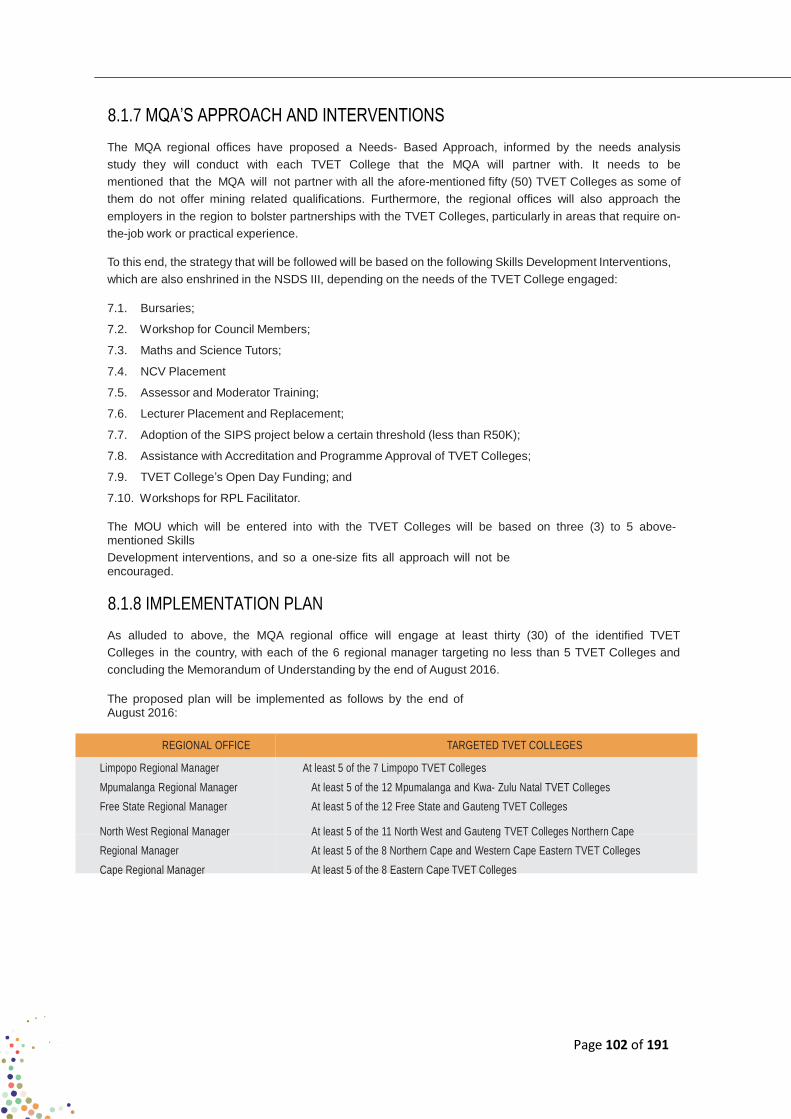
Page 102 of 191
8.1.7 MQA’S APPROACH AND INTERVENTIONS
The MQA regional offices have proposed a Needs- Based Approach, informed by the needs analysis
study they will conduct with each TVET College that the MQA will partner with. It needs to be
mentioned that the MQA will not partner with all the afore-mentioned fifty (50) TVET Colleges as some of
them do not offer mining related qualifications. Furthermore, the regional offices will also approach the
employers in the region to bolster partnerships with the TVET Colleges, particularly in areas that require on-
the-job work or practical experience.
To this end, the strategy that will be followed will be based on the following Skills Development Interventions,
which are also enshrined in the NSDS III, depending on the needs of the TVET College engaged:
7.1. Bursaries;
7.2. Workshop for Council Members;
7.3. Maths and Science Tutors;
7.4. NCV Placement
7.5. Assessor and Moderator Training;
7.6. Lecturer Placement and Replacement;
7.7. Adoption of the SIPS project below a certain threshold (less than R50K);
7.8. Assistance with Accreditation and Programme Approval of TVET Colleges;
7.9. TVET College’s Open Day Funding; and
7.10. Workshops for RPL Facilitator.
The MOU which will be entered into with the TVET Colleges will be based on three (3) to 5 above- mentioned Skills
Development interventions, and so a one-size fits all approach will not be encouraged.
8.1.8 IMPLEMENTATION PLAN
As alluded to above, the MQA regional office will engage at least thirty (30) of the identified TVET
Colleges in the country, with each of the 6 regional manager targeting no less than 5 TVET Colleges and
concluding the Memorandum of Understanding by the end of August 2016.
The proposed plan will be implemented as follows by the end of August 2016:
REGIONAL OFFICE TARGETED TVET COLLEGES
Limpopo Regional Manager At least 5 of the 7 Limpopo TVET Colleges
Mpumalanga Regional Manager At least 5 of the 12 Mpumalanga and Kwa- Zulu Natal TVET Colleges
Free State Regional Manager At least 5 of the 12 Free State and Gauteng TVET Colleges
North West Regional Manager At least 5 of the 11 North West and Gauteng TVET Colleges Northern Cape
Regional Manager At least 5 of the 8 Northern Cape and Western Cape Eastern TVET Colleges
Cape Regional Manager At least 5 of the 8 Eastern Cape TVET Colleges
Page 103 of 191
8.1.9 CONCLUSION
All 30 signed MOUs would emanate from engagements with the TVET College CEO and would be based on the need of each
college. No one-size -fits all approach would be followed in the development of these MOUs. These MOUs would be discussed
with the Executive Manager: Stakeholder Relations before they are submitted to the MQA CEO for approval. The concerned
regional manager would have to develop the financial implications with the relevant MQA business unit
and the Executive Manager: Stakeholder Relations before the MOU is developed and signed by the MQA CEO.

Page 104 of 191
8.2 COLLABORATION PLANS WITH SA PUBLIC HET INSTITUTIONS
The MQA intends to initiate and establish partnerships and relations with the following South African Public HET
institutions around identified learning programmes (forming part of the Intervention column within the Medium Term
Strategic Framework period starting from 2012/13):
NO
NAME
PROVINCE
PROGRAMMES
IDENTIFIED MQA
INTERVENTION
1. Nelson Mandela Metropolitan University Eastern Cape Mining and Minerals Sector
Related
• Bursaries
2. Rhodes University Eastern Cape Geology • Bursaries
• Lecturer Development
3. University of Fort Hare Eastern Cape Geology • Bursaries
• Lecturer Development
4. Walter Sisulu University of Technology Eastern Cape Mining and Minerals Sector • Bursaries
Related 5. Central University of Technology Free State Mining and Minerals Sector
Related
• Bursaries
6. University of the Free State Free State Mining and Minerals Sector • Bursaries
Related 7. University of Pretoria Gauteng Mining Engineering • Bursaries
• Lecturer Development
• Learning Material
Support (Rock
Engineering)
8. University of South Africa Gauteng Electrical, Mechanical and • Learning Material
Mining Engineering • Support (Rock
• Engineering)
• Bursaries
• Programme
Development (Mine
Survey)
• Lecturer Development
9. Tshwane University of Technology Gauteng Mining and Minerals Sector
Related
• Bursaries
10. University of the Witwatersrand Gauteng Mine Surveying and Mining • Learning Material
Engineering Support (Rock
Engineering)
• Bursaries
• Mine Inspector
• Development
• Possible Research
11. Vaal University of Technology Gauteng Mining and Minerals Sector • Bursaries
Related 12. University of Johannesburg Gauteng Mining Engineering • Lecturer Development
• Learning Material
Support (Rock
Engineering)
• Bursaries
• Programme
Development (Mine
Survey)
• Possible Research
• Partnership
• Research Bursary
13. Durban University of Technology Kwa-Zulu Natal Jewellery and Beneficiation
related
• Bursaries

Page 105 of 191
NO
NAME
PROVINCE
PROGRAMMES
IDENTIFIED MQA
INTERVENTION
14. University of KwaZulu Natal Kwa-Zulu Natal Mining and Minerals Sector
Related
• Bursaries
15. Mangosuthu Technikon Kwa-Zulu Natal Mining and Minerals Sector • Bursaries
Related 16. University of Zululand Kwa-Zulu Natal Mining and Minerals Sector • Bursaries
Related 17. University of Limpopo Limpopo Mining and Minerals Sector • Bursaries
Related 18. University of Venda Limpopo Mining & Environmental
Programmes and Geology
• Lecturer Development
19. North West University (Potchefstroom) North West Mining and Minerals Sector • Bursaries
Related • Possible Research
• Partnership
• Research Bursary
20. University of Stellenbosch Western Cape Mining and Minerals Sector • Bursaries
Related 21. University of the Western Cape Western Cape Mining and Minerals Sector • Bursaries
Related 22. Cape Peninsula University of Technology Western Cape Jewellery and Beneficiation
related • Bursaries

Page 106 of 191
ANNEXURE D
MQA SECTOR
SKILLS PLAN UPDATE
2017 - 2018
FINAL REPORT: 31 AUGUST 2016

Page 107 of 191
FOREWORD
The Mining Qualifications Authority (MQA) prides itself in ensuring that the Mining and Mineral Sector (MMS) remains
at the cutting edge of skills development. In keeping up with this progression, this Board submits to the Department
of Higher Education and Training (DHET) the First Draft Sector Skills Plan (SSP) update for the Mining and Minerals
Sector for the period 2017-18.
The Sector Skills Plan has been prepared in accordance with the National Skills Development Strategy (NSDS) III,
in accordance with the expectations of the DHET. This SSP has been presented to the Skills Research and Planning
Committee. The improvement of the skills of our workforce is imperative for the economic development of our sector, for
the improvement of our health and safety record and for the growth and wellbeing of all employees. The main purpose
of this SSP annual update is to guide and inform skills development initiatives in the sector. It is the result of not only a
thorough research process, but also of extensive data triangulation from primary and secondary data sources. The MQA
scheduled stakeholder consultative sessions between June 2015 and May 2016. Through stakeholder engagements,
the stakeholders take ownership of this plan and now all stakeholders are urged to work together to address the skills
development priorities and to achieve the goals and objectives set in this SSP.
Mr Mthokozisi Zondi
Chairperson: MQA Board
Page 108 of 191
ACRONYMS
AET Adult Education and Training
AIDS Acquired Immune Deficiency Syndrome
APP Annual Performance Plan
ATR Annual Training Report
ABET Adult Basic Education and Training
BEE Black Economic Empowerment
BER Bureau of Economic Research
bn Billion
CAD Computer-Aided Design
CETA Construction Education and Training
Authority
CHIETA Chemical Industries Education and
Training Authority
CLAS Cement, Lime, Aggregates and Sand
ct Carat
DHET Department of Higher Education and
Training
DMR Department of Mineral Resources
DoE Department of Energy
DST Department of Science and Technology
EC Eastern Cape
ECSA Engineering Council of South Africa
ESETA Energy Sector Education and Training
Authority
FASSET Financial & Accounting Sector
Education and Training Authority
FDI Foreign Direct Investment
FET Further Education and Training
FS Free State
GCC Government Certificate of Competency
GDP Gross Domestic Product
GET General Education and Training
GP Gauteng Province
GVA Gross Value Added
GWM&E Government- Wide Monitoring and
Evaluation
HDSA Historically Disadvantaged South
African
HET Higher Education and Training
HIV Human Immunodeficiency Virus
HR Human Resources
HRDS-SA Human Resources Development
Strategy for South Africa
IMF International Monetary Fund
INSETA Insurance Sector Education and
Training Authority
IPAP Industrial Policy Action Plan
IRM Industrial Raw Materials
KZN KwaZulu-Natal
LDEDAT Limpopo Department for Economic
Development and Tourism
LMI Labour Market Intelligence
LP Limpopo Province
M&E Monitoring and Evaluation
MBAP Mineral Beneficiation Action Plan
Mct Metric carat
MDP Management Development Programme
merSETA Manufacturing, Engineering and
Related Services SETA
Page 109 of 191
MHS Mine Health and Safety
MMS Mining and Minerals Sector
MP Mpumalanga Province
MPRDA Minerals and Petroleum Resources
Development Act
MQA Mining Qualifications Authority
Mt Metric ton
MTSF Mid Term Strategic Framework
NC Northern Cape
NCV National Certificate Vocational
NDP National Development Plan
NGP National Growth Path
NMBLP Nelson Mandela Bay Logistics Park
NQF National Qualifications Framework
NRF National Research Fund
NSA National Skills Accord
NSSP National Sector Skills Plan
NSDS National Skills Development Strategy
NUM National Union of Mine Workers
NW North West
OFO Organising Framework for Occupations
OHS Occupational Health and Safety
PDP Provincial Development Plan
PGMs Platinum Group Metals
PGDP Provincial Gross Domestic Product
PICC Presidential Infrastructure Coordinating
Commission
PIVOTAL Professional, Vocational, Technical and
Academic Learning
R&D Research and Development
RSSP Regional Sector Skills Plan
SA South Africa
SAMDA South African Mining Development
SARB South Africa Reserve Bank
SDA Skills Development Act
SDL Skills Development Levy
SERO Socio-Economic Review and Outlook
SETA Sector Education and Training Authority
SEZ Special Economic Zone
SIC Standard Industrial Classification SIP
Strategic Infrastructure Project
SMME Small, Medium and Micro Enterprise
SOE State Owned Enterprise
SSP Sector Skills Plan
Stats SA Statistics South Africa
TETA Transport Education and Training
Authority
TVET Technical a n d V o c a t i o n a l
E d u c a t i o n and Training
UCS Underhill Corporate Solutions
UoT University of Technology
WC Western Cape
WP-PSET White Paper - Post School Education
and Training
WSP Workplace Skills Plan
YEA Youth Employment Accord

Page 110 of 191
EXECUTIVE SUMMARY
1. INTRODUCTION AND BACKGROUND
The Sector Education and Training Authority (SETA) for the Mining and Minerals Sector (MMS) and the Mining
Qualifications Authority (MQA) prepared this Sector Skills Plan (SSP) Update in accordance with new guidelines of the
Department of Higher Education and Training (DHET). The main purpose of this SSP is to inform and support skills
development initiatives in the sector.
2. RESEARCH METHODOLOGY
The research methodology used for this SSP Update included both quantitative and qualitative research methods.
Secondary (desktop) research was conducted on economic, social and development status and strategies. MQA
Workplace Skills Plans (WSPs) and Annual Training Reports (ATRs) complemented these sources but also allowed for
an analysis of the size and nature of the sector. Extensive national and regional stakeholder workshops and consultations
were undertaken between June 2015 and May 2016 to enable triangulation of this data and provide deeper insight into
change drivers, skills demand and supply, and skills gaps. Stakeholders included employers, labour unions and training
providers, as well as representatives from the Department of Mineral Resources (DMR), the Chamber of Mines, the
National Union of Mineworkers (NUM) and the Department of Higher Education and Training (DHET).
3. SECTOR PROFILE
The MMS is an important sector to South Africa but is currently facing challenges which include:
• Its contribution to GDP has been decreasing gradually, from 8.5% in 2009 to 7.6% in 2016.
• Declining global demand for mining commodities and retrenchments have led to a decrease in the number of
people employed, from a peak of 628 750 in 2012 to 520 003 in 2016.
• However, the outlook of the MMS would be improved if the sector monitors the developments of Mining Phakisa
and prepares existing and potential employees accordingly; and takes advantage of the implementation of the
Mineral Beneficiation Action Plan (MBAP) and the SIPs projects, which are expected to increase economic activity
and create new jobs.
Additionally, analysis of the MMS revealed the following:
• MMS employment is mainly concentrated in North West, Limpopo, Gauteng and Mpumalanga; together constituting
80.8% of total employment in the MMS.
• Mpumalanga, Gauteng, North West and Free State’s employment numbers have been declining steadily, by 38.8%,
29.1%, 16% and 14.4% respectively between 2012 and 2016. The biggest growth has been seen in Northern
Cape, whose employment numbers have been increasing steadily, by 40.5% in the same 5-year period.
• The PGM sector employs the most people in the MMS, with 33.4% of employment.
• Employment numbers in the CLAS, Coal, Diamond, Gold and Services Incidental to Mining sectors have overall all
been on the decline since 2012.
• Although the sector is historically male-dominated, the proportion of females has been increasing gradually, from
11% in 2012 to 14.5% in 2016.
• In terms of management by equity, there has been an overall increase in management of Africans, Coloureds and
Indians. These 3 race groups together constituted 37.7% of total management in 2012, to 42.65% in 2016. When
breaking management levels down, Whites comprise 71.1% of top management, 64.9% of senior management,
and 50% of mid management. Africans comprise the second highest in all 3 categories, the highest proportion
(38%) being in mid management.

Page 111 of 191
• The highest proportion of the sector’s employees (47%) have achieved the equivalent of upper high school levels
(Grades 10-12), followed by 22% of the sector with Grades 4-9.
4. KEY SKILLS ISSUES
The key change drivers which are impacting the MMS are Technology (including Mining Phakisa developments);
Declining global demand; Mining Charter and Employment equity; Occupational Health and Safety (OHS); and Mineral
beneficiation. In particular, technology affects skills planning as learners need to graduate with knowledge of, and
experience in the latest technology being used in the sector. Furthermore, the widespread downscaling of operations
across the sector has led to large-scale retrenchment drives, resulting in the need to prioritise portable skills training.
MQA also need to continue focusing on the transformational targets contained in the Mining Charter.
5. EXTENT OF SKILLS MISMATCHES
Analysis of 2015-16 MQA WSP-ATR submissions and comments from extensive national and regional engagements
over a 1-year period revealed the following:
• There are recruitment challenges where a few of the core mining occupations are concerned. The 10 most hard-
to-fill occupations which need to be addressed by the MQA were found to be Mining Manager, Mining Planner,
Mining Engineer, Rock Engineer, Surveyor, Rigger Ropesman, Diesel Mechanic, Boilermaker, Instrumentation
Mechanician and Fitter. Stakeholders believe that the most concerning are Mining Manager, Rock Engineer, Diesel
Mechanic and Rigger Ropesman. The occupation, Rock Engineering Manager, has one of the highest scarce
intensity rates and may also need to be addressed.
• Main supply-side concerns were found to be as follows:
o Basic education: low Levels of Maths & Science; and insufficient access to career awareness.
o TVET College sector: Lack of practical training at colleges; and outdated curricula at colleges.
o HET sector: Lack of career awareness for Rock Engineering, a specialisation of Mining Engineering; and a
probable over-supply of Geologists.
o Other (not specific to a level of education): Declining GCC achievement numbers for core MMS-related
occupations; and lack of management skills.
• MQA funds numerous programmes aimed at addressing the supply of skills to the sector as well as transformational
imperatives. These include practical training and experience; P1 and P2 training; graduate internships; bursaries to
unemployed youth; maths and science programmes to the unemployed; and career awareness events. The targets
for all of these interventions were successfully achieved, and, in most cases, exceeded.
• Given the importance of Maths and Science as building blocks for the majority of occupations in the sector,
stakeholders suggested that these programmes be monitored for impact, as well as focus efforts on the
development of teachers and on fewer beneficiaries, to ensure impact. Funding could also be directed at those who
are applying for bursaries and as a condition before commencement of studies.
• As the role of career awareness is to disseminate accurate information and draw the right skills and potential to the
sector, stakeholders proposed that events should provide greater detail so that a person is empowered to make
an informed decision regarding whether or not a particular career might be suited to them or not, thus potentially
avoiding career changes and unnecessary training expenditure at a later stage. It is important to continue to
partner effectively to increase access to high school learners, and to emphasise the positive effects on future job
prospects of pursuing Maths and Science until Grade 12.
• In terms of MQA’s artisan development initiatives, it will be important to see successful throughput of learners in
the
Page 112 of 191
following programmes as they are on the hard-to-fill list: Diesel Mechanic, Boilermaker, Instrument Mechanician
and Rigger Ropesman. Furthermore, these learnerships need to incorporate changes in technology and include
work experience at suppliers of new technology to the mines. The number of MQA-funded artisan graduates is
currently higher than the number of vacancies in the sector, so it appears that enough MQA-funded artisans are
being developed in the system. However, the MQA competes with other sectors for artisans, and an uncertainty
with the completed numbers is that the number of graduates who do seek and find employment in the MMS after
studying is unknown.
• Two of the MQA’s bursary-funded disciplines are on the hard-to-fill list: Mining Engineering and Mining Surveying.
With regard to Mining Engineering, it will be important for the MQA to create awareness about the specialisation
of Rock Engineering among those pursuing this qualification, as a lack of career awareness is widely held by
stakeholders to be the main reason for a shortage of Rock Engineers in the sector. The number of Mining Surveying
bursars is low and may need to be addressed by the MQA. In contrast, the high number of Geology bursars in
the system, the majority being in first or second year of studies, may need to be addressed by the MQA owing to
stakeholder concerns over the past 2-3 years that large numbers of Geology graduates cannot find work.
• The primary reasons for skills gaps are outdated technology at colleges; insufficient and irrelevant workplace
experience; low levels of maths and science; insufficient high quality career guidance; lack of GCC; employment
equity; lack of management experience; lack of interest from youth; geographic location; and industry
attractiveness.
6. SECTOR PARTNERSHIPS
The MQA currently has formal partnerships with 5 TVET Colleges. Most are in very early stages, but it was highlighted
that better collaboration is needed between the MQA, TVET Colleges and the industry for the purposes of improving
access to workplace experience. Other recommendations include ongoing development programmes for lecturers of
MMS-related subjects; and the continuation of TVET College support to enable eventual accreditation of programmes.
The MQA has a very strong and effective partnership with its three tripartite partners: the DMR, the Chamber of Mines
and organised Labour, who convene regularly to discuss challenges facing skills development in the MMS, which
enables the MQA to respond accordingly to address them. Additionally, the MQA is becoming increasingly involved in
inter-SETA meetings, which involve the sharing of skills development progress reports and a focus on possible areas of
collaboration. With regard to green skills, a partnership with the Department of Water and Sanitation is recommended
to mitigate the challenge of significantly reducing water levels, to combine strengths and avoid any duplication of work.
Furthermore, partnerships should be formed with R&D departments of companies that focus on cleaner production and
remediation research.
7. SKILLS PRIORITY ACTIONS
As a result of the findings in this SSP, the following priorities are recommended to the MQA:
• Priority 1: Support transformation of the sector through skills development
• Priority 2: Core mining skills must continue to be developed through skills programmes
• Priority 3: Monitor and develop the skills for minerals beneficiation
• Priority 4: Continue to improve health and safety standards
• Priority 5: Develop skills for sustainability.

Page 113 of 191
TABLE OF CONTENTS
FOREWORD 107
EXECUTIVE SUMMARY 110
RESEARCH PROCESS AND METHODS 110
Introduction 110
Key Findings 110
SECTOR PROFILE 110
1.1. Introduction 118
1.2. Scope of Coverage 118
1.3. Key Role Players 118
1.4. Economic Performance 120
1.5. MMS Future Outlook 124
1.6. Employer Profile 125
1.7. Labour Market Profile 127
1.8. Summary and Conclusion 133
2. KEY SKILLS ISSUES 134
Introduction 134
Change Drivers 134
Alignment of National Strategies and Plans 136
Conclusion 138
3. EXTENT OF SKILLS MISMATCH 139
3.1. Introduction 139
3.2. Extent and Nature of Demand 139
3.3. Extent and Nature of Supply 142
3.4. Identification of Scarce Skills and Skills Gaps 153
3.5. Conclusion 158
4. SECTOR PARTNERSHIPS 159
Introduction 159
State of Existing Partnerships 159
Proposed New Partnerships 163
Conclusion 164
5. SKILLS PRIORITY ACTIONS 165
Research findings 165
Recommended Priority 1: Support transformation of the sector through skills development 166
Recommended Priority 2: Core Mining Skills Must Continue to Be Developed through Skills Programmes 166
Recommended Priority 3: Monitor and Develop the Skills Required for Minerals Beneficiation 167
Recommended Priority 4: Continue to Improve Health and Safety Standards 168
Recommended Priority 5: Develop Skills for Sustainability 168
Conclusion 168
BIBLIOGRAPHY 169
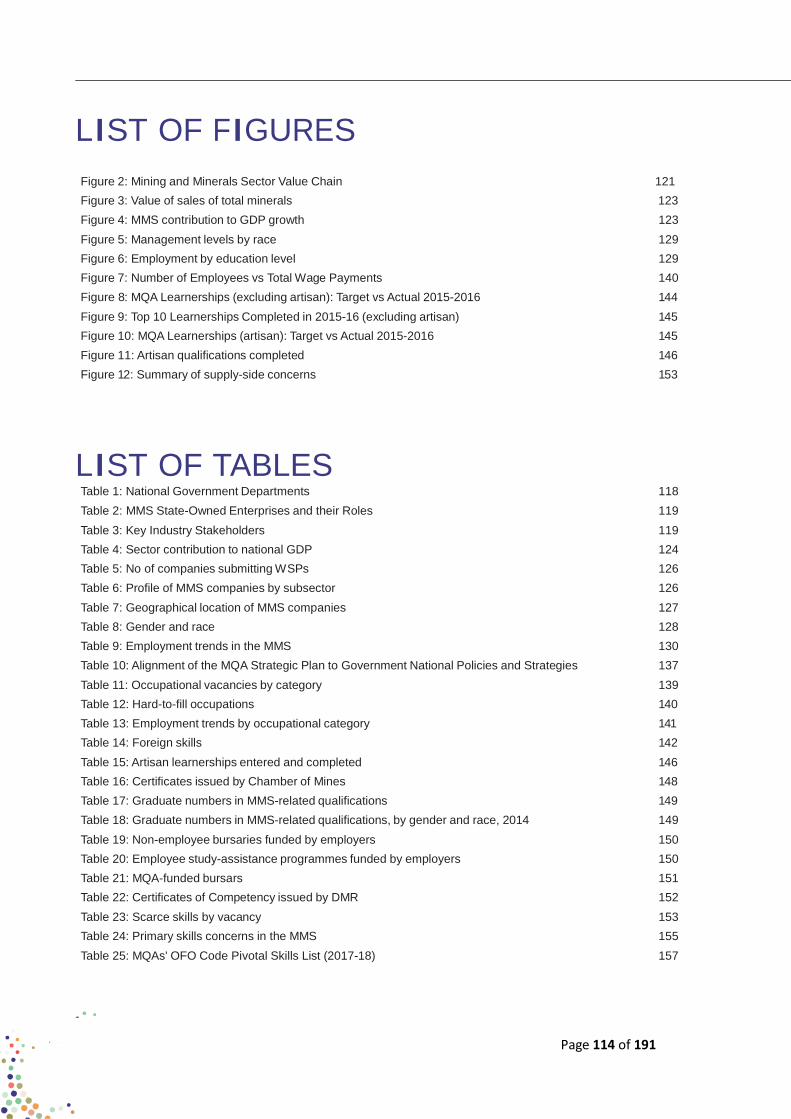
Page 114 of 191
LIST OF FIGURES
Figure 2: Mining and Minerals Sector Value Chain 121
Figure 3: Value of sales of total minerals 123
Figure 4: MMS contribution to GDP growth 123
Figure 5: Management levels by race 129
Figure 6: Employment by education level 129
Figure 7: Number of Employees vs Total Wage Payments 140
Figure 8: MQA Learnerships (excluding artisan): Target vs Actual 2015-2016 144
Figure 9: Top 10 Learnerships Completed in 2015-16 (excluding artisan) 145
Figure 10: MQA Learnerships (artisan): Target vs Actual 2015-2016 145
Figure 11: Artisan qualifications completed 146
Figure 12: Summary of supply-side concerns 153
LIST OF TABLES Table 1: National Government Departments 118
Table 2: MMS State-Owned Enterprises and their Roles 119
Table 3: Key Industry Stakeholders 119
Table 4: Sector contribution to national GDP 124
Table 5: No of companies submitting WSPs 126
Table 6: Profile of MMS companies by subsector 126
Table 7: Geographical location of MMS companies 127
Table 8: Gender and race 128
Table 9: Employment trends in the MMS 130
Table 10: Alignment of the MQA Strategic Plan to Government National Policies and Strategies 137
Table 11: Occupational vacancies by category 139
Table 12: Hard-to-fill occupations 140
Table 13: Employment trends by occupational category 141
Table 14: Foreign skills 142
Table 15: Artisan learnerships entered and completed 146
Table 16: Certificates issued by Chamber of Mines 148
Table 17: Graduate numbers in MMS-related qualifications 149
Table 18: Graduate numbers in MMS-related qualifications, by gender and race, 2014 149
Table 19: Non-employee bursaries funded by employers 150
Table 20: Employee study-assistance programmes funded by employers 150
Table 21: MQA-funded bursars 151
Table 22: Certificates of Competency issued by DMR 152
Table 23: Scarce skills by vacancy 153
Table 24: Primary skills concerns in the MMS 155
Table 25: MQAs' OFO Code Pivotal Skills List (2017-18) 157
Page 115 of 191
RESEARCH PROCESS AND METHODS
INTRODUCTION
SETAs are expected to facilitate the delivery of sector-specific skills interventions that help to achieve the goals of the
NSDS III. It is therefore a core mandate for the SETA to develop National Sector Skills Plans (SSPs). The SSP must
outline current and projected needs of the sector and sector employers, as well as the current and future training and
qualification needs of the sector that are agreed with stakeholders and can improve the match between education and
training supply and demand. The SSP must also highlight suitable interventions that will address the skills needs of the
sector.
The MQA therefore aims to support objective and informed decision making for skills development through research
in the MMS. The MQA intends to contribute to the body of skills development both nationally and within the provinces
through collaboration with relevant bodies within the MMS and to then disseminate the research reports and findings.
The purpose of this section is to provide details regarding the research process and methodology employed by the
research team in order to complete an SSP for the MQA which is both factual and analytical, and therefore informative,
useful and actionable for the SETA.
RESEARCH PROCESS AND METHODS
Research Topic
The SSP research process pursued an answer to the following primary question: “What are the key issues influencing
the Mining and Minerals Sector (MMS) which are either currently or have the potential to impact skills supply and
demand, as well as skills development?
Nature of the Study
The research study used both quantitative and qualitative research methodologies. It was important to include qualitative
methods owing to the limitations of quantitative methods in providing insight to data and statistics. Insight was important
to achieve as the sector is complex and subject to significant internal and external pressures which must be understood
for their implications on skills development.
Objectives of the Study
The objectives of the research study were to:
• Determine the key change drivers impacting the sector where skills development is concerned.
• Highlight any skills mismatches between demand and supply in the sector.
• Investigate the primary reasons for the skills mismatches.
• Understand stakeholders’ experiences of, and beliefs regarding the effectiveness and impact of MQA’s skills
development interventions for the sector.
• Determine whether there is any potential for growth and the creation of much-needed jobs in the sector, which
would influence skills development initiatives for the MQA.

Page 116 of 191
Data Collection Tools
Much of the qualitative research that was completed was in the form of 2 large workshops undertaken in each of the
9 provinces (i.e. 18 workshops in total) as well as 2 smaller focus groups in each of the 9 provinces (i.e. 18 focus
groups overall), a total of 36 engagements around the country. The large workshops were effective in bringing together
numerous stakeholders from industry, labour and government to discuss the topic of the research. The focus groups
were attended by a smaller number of regional experts who were able to provide deeper insight and greater detail into
issues that cannot be adequately covered in the time allocated for the large workshops. The last set of workshops
and focus groups held early in 2016 were used to involve stakeholders in the sector in the assessment process of the
findings, to ensure that all key skills issues had been identified and addressed. Discussion Guides were used at all of
the meetings, both workshop and task teams, to ensure that attention was maintained on the important issues of the
research.
Additionally, personal interviews were conducted with a small sample of regional employers, labour and government
around the country between June 2015 and March 2016, as well as with national experts in Gauteng during May 2016.
Sample Size and Scope
Where the regional consultation sessions are concerned, 2 large workshops were held in each of the 9 regions (i.e.
18 workshops in total), where an approximate average of 45 stakeholders attended per workshop. With regard to the
2 smaller focus groups in each of the 9 provinces (i.e. 18 focus groups in total), an average of 20 people attended per
focus group.
With regard to personal interviews, 5 employers were consulted (1 representing each of the main subsectors), 2 DMR officials, 2 artisan development experts, an industry skills development specialist and a labour representative.
The MQA Board, MQA’s EXCO as well as MQA’s SRP Committee were all engaged during May 2016 for their expertise
on and assessment of the research findings. All outstanding matters needing clarity were discussed fully and resolved
during these high-level engagements.
With regard to the WSP/ATR database, it is widely accepted that the WSP/ATRs submitted by employers in the
MMS provide an employment coverage of as much as 95% of the sector, therefore the sample size of this particular
quantitative data type is statistically very high.
The scope of the project involved covering the following areas:
• Reviewing the economic landscape and performance of the sector, the employer and labour profiles, as well as
outlook of the sector.
• Outlining key change drivers influencing the sector, with particular attention to those which impact skills
development.
• Analysing the 2015-16 WSP data submitted, to understand the emerging trends in the sector as well as possible
limitations of the data.
• Analysing the state of education institutions providing the skills needed by the sector.
• Identifying the key skills mismatches in the sector, and the primary reasons thereof.
• Seeking assessment of the findings, by both key national and regional stakeholders.
• Analysing MQA’s partnerships at a national level as well as around the country.
• Determining the key research findings.
• Recommending 5 key priority areas for the MQA.
Page 117 of 191
Data Sources and Data Sets
The quantitative data used was sourced mainly from MQA’s weighted WSP/ATR submissions and MQA’s programme
interventions databases, as well as through literature and document review of relevant policies and previous SSPs.
Other substantial information sources included DMR, DHET, Stats SA, Quantec and Chamber of Mines reports. One
of the main challenges in using data from different sources is the methodologies and purposes for which this data was
collected, which sometimes provides results based on their particular foci. For example, data from MQA includes a
sector referred to as ‘Services Incidental to Mining’ which has important skills development implications for the remit of
the SETA, which is not usually included in other data sources, for example DMR.
Furthermore, qualitative data was sourced in the form of regional workshops and one-on-one consultations with
expert stakeholders in the sector, including representatives from DMR, the Chamber of Mines, the National Union
of Mineworkers (NUM) and the Department of Higher Education and Training (DHET). This information provided
rich insight into the quantitative data and statistics, and facilitated understanding of the change drivers impacting the
sector, skills demand and supply, the current and emerging skills gaps and potential solutions to the complexities and
challenges in providing skills development for the sector.
Time-frame of the Study
One year was taken to fully research the topic. It began in June 2015 with the first set of 9 regional workshops, and
ended in May 2016 with the Board, EXCO and SRP Committee meetings.
KEY FINDINGS
The key findings of this report which are aligned to the objectives of the research are as follows:
• The main change drivers currently impacting the MMS are: technology, as it impacts skills planning in terms of
the need to ensure that learners graduate with knowledge of, and experience in the latest technology being used
in the sector; retrenchments, as the widespread downscaling of operations across the sector has led to large-
scale retrenchment drives, resulting in the need to prioritise portable skills training; and transformation, as targets
contained in the Mining Charter are designed to redress historical imbalances.
• The 10 most hard-to-fill occupations were found to be Mining Manager, Mine Planner, Mining Engineer, Rock
Engineer, Surveyor, Rigger Ropesman, Diesel Mechanic, Boilermaker, Instrumentation Mechanician and Fitter.
Experts believe that the most concerning are Mining Manager, Rock Engineer, Diesel Mechanic and Rigger
Ropseman.
• The primary reasons for skills gaps are outdated technology at colleges; insufficient and irrelevant workplace
experience; low levels of maths and science; insufficient access to high quality career guidance; geographic
location; employment equity; lack of succession planning; lack of management skills; lack of interest from youth in
certain occupations; and industry attractiveness.
• Maths and Science and career awareness events should be monitored for impact given the importance of Maths
and Science as building blocks for the majority of occupations in the sector, and with career awareness’ potential
to disseminate accurate information as well as draw the right skills and potential to the sector.
• Successful implementation of Mining Phakisa, the Minerals Beneficiation Action Plan and 3 of the 18 SIPs projects
has the potential to create and sustain jobs in the MMS. Greater collaboration between the MQA and the key role-
players involved in these initiatives is needed in order to understand in advance what the skills requirements will
be and to respond accordingly.
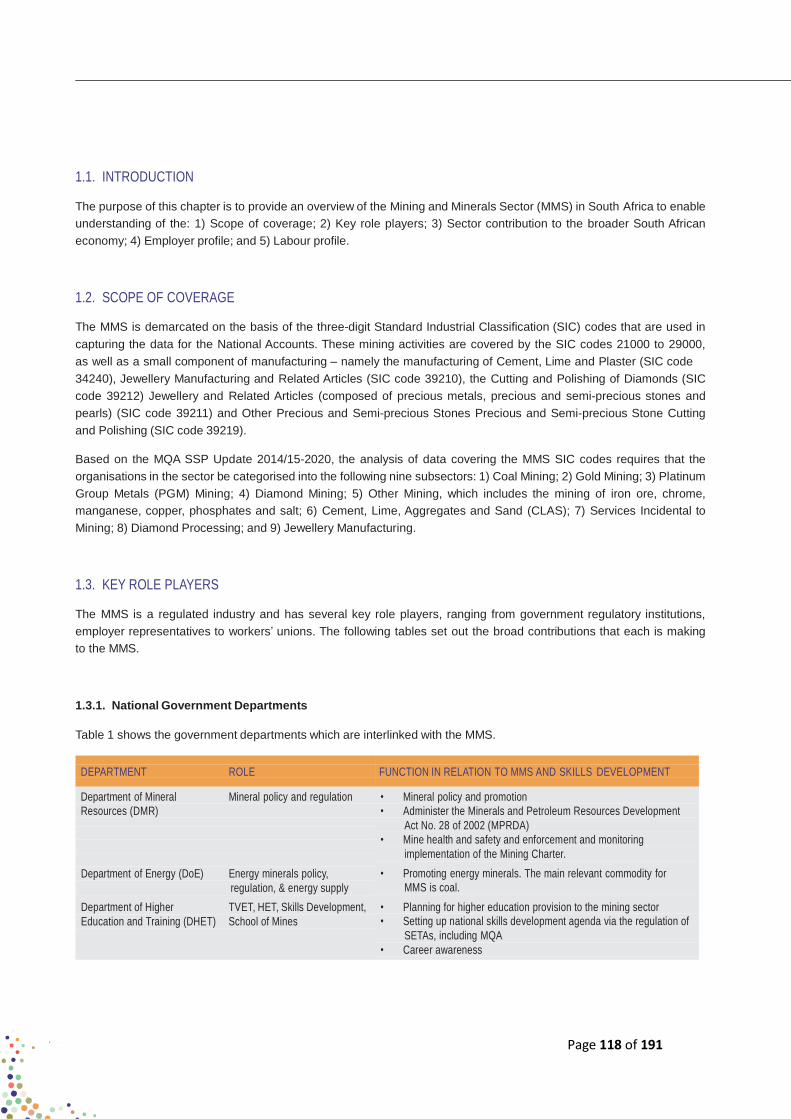
Page 118 of 191
1.1. INTRODUCTION
The purpose of this chapter is to provide an overview of the Mining and Minerals Sector (MMS) in South Africa to enable
understanding of the: 1) Scope of coverage; 2) Key role players; 3) Sector contribution to the broader South African
economy; 4) Employer profile; and 5) Labour profile.
1.2. SCOPE OF COVERAGE
The MMS is demarcated on the basis of the three-digit Standard Industrial Classification (SIC) codes that are used in
capturing the data for the National Accounts. These mining activities are covered by the SIC codes 21000 to 29000,
as well as a small component of manufacturing – namely the manufacturing of Cement, Lime and Plaster (SIC code
34240), Jewellery Manufacturing and Related Articles (SIC code 39210), the Cutting and Polishing of Diamonds (SIC
code 39212) Jewellery and Related Articles (composed of precious metals, precious and semi-precious stones and
pearls) (SIC code 39211) and Other Precious and Semi-precious Stones Precious and Semi-precious Stone Cutting
and Polishing (SIC code 39219).
Based on the MQA SSP Update 2014/15-2020, the analysis of data covering the MMS SIC codes requires that the
organisations in the sector be categorised into the following nine subsectors: 1) Coal Mining; 2) Gold Mining; 3) Platinum
Group Metals (PGM) Mining; 4) Diamond Mining; 5) Other Mining, which includes the mining of iron ore, chrome,
manganese, copper, phosphates and salt; 6) Cement, Lime, Aggregates and Sand (CLAS); 7) Services Incidental to
Mining; 8) Diamond Processing; and 9) Jewellery Manufacturing.
1.3. KEY ROLE PLAYERS
The MMS is a regulated industry and has several key role players, ranging from government regulatory institutions,
employer representatives to workers’ unions. The following tables set out the broad contributions that each is making
to the MMS.
1.3.1. National Government Departments
Table 1 shows the government departments which are interlinked with the MMS.
DEPARTMENT ROLE FUNCTION IN RELATION TO MMS AND SKILLS DEVELOPMENT
Department of Mineral Mineral policy and regulation
Resources (DMR)
Department of Energy (DoE) Energy minerals policy,
regulation, & energy supply
Department of Higher TVET, HET, Skills Development,
Education and Training (DHET) School of Mines
• Mineral policy and promotion
• Administer the Minerals and Petroleum Resources Development
Act No. 28 of 2002 (MPRDA)
• Mine health and safety and enforcement and monitoring
implementation of the Mining Charter.
• Promoting energy minerals. The main relevant commodity for
MMS is coal.
• Planning for higher education provision to the mining sector
• Setting up national skills development agenda via the regulation of
SETAs, including MQA
• Career awareness

Page 119 of 191
1.3.2. State owned enterprises that play a role in the MMS
Table 2 below lists some of the main state owned enterprises (SOEs) which are involved in MMS research, compliancy
monitoring, skills development and promotion of minerals among others.
Table 2: MMS State-Owned Enterprises and their Roles
STATE-OWNED ENTERPRISES ROLE FUNCTION IN RELATION TO MMS AND SKILLS DEVELOPMENT
Mine Health and Safety Council Occupational Health and Safety
Mintek Mineral processing and
Metallurgy
Engineering Council of South Regulation of the engineering
Africa (ECSA) profession
South African Diamond and Diamond and Precious metals
Precious Metals Regulator regulation
State Diamond Trader Buying and selling of
rough diamonds
• Improving and promoting occupational health and safety in the
mining industry
• Liaise with MQA about MHS and skills development
• R & D expertise; intellectual capital-engineers, scientists and
technologists
• Provide infrastructure of modern laboratories, pilot plant and
workshops which can be used by MQA in skills development
• Accreditation of engineering programmes
• Registration of persons as professionals
• Regulation of the practice of registered persons
• Regulation of diamond, gold and PGMs
• Skills transfer
• Business development support
• Local beneficiation
• Promote equitable access to beneficiation of diamonds
• Develop South Africa’s diamond cutting and polishing skills
1.3.3. MMS key industry stakeholders
Table 3 shows some of the key industry stakeholders which are involved in advocacy, promotion and other industry
development initiatives.
Table 3: Key Industry Stakeholders
INDUSTRY STAKEHOLDER ROLE FUNCTION IN RELATION TO MMS AND SKILLS DEVELOPMENT
Chamber of Mines of Creating partnerships with
South Africa key stakeholders
Copper Development Copper industry
Association (Pty) Ltd representation
Federation of SA Gem & Earth science clubs
Mineralogical Societies
South African Mining Lobbying to government
Development Association and organised labour
(SAMDA)
• Establish conducive policy, legislative and operating environment
• Promote and expand the use of copper and copper alloys
• Marketing and promoting skills which can be adopted in MQA
learning materials
• Assist in formation of earth science clubs and societies
• Marketing and promoting skills which can be used in MQA training
materials
• Junior mining7 initiative by SA junior mining investor
• Create enabling environment for raising finance
• Develop technical and other skills
• Practice responsible environmental management
7 Junior mines have an asset base of between R50 million and R7 billion. Those above these thresholds are referred to as ‘majors’ and below these are ‘small scale miners’.

Page 120 of 191
1.3.4. MMS Worker Representatives
The mining sector is highly unionised with a great number of employees represented or affiliated to a union. Mine
unions are amongst the most active and vocal unions in South Africa and their activities have a significant bearing
on the productivity in the MMS. NUM and UASA are the two unions which form part of the tripartite alliance within the
MQA’s structures.
1.4. ECONOMIC PERFORMANCE
This section provides an overview of the importance and contribution of the sector to the country.
1.4.1. Overview of the MMS
South Africa accounts for 96% 1 of known global reserves of the platinum group metals (PGMs), 74% of chrome,
26% manganese and 11% of gold reserves.2 As a leading producer and supplier of a range of minerals, the country
should be in a position to offer a highly competitive investment location and ensure that it can meet specific trade and
investment requirements of prospective investors and business people, whilst also meeting the development needs of
its populace.
South Africa remains one of the largest net exporters of minerals and metals. In the mining industry South Africa is an
important global hub with deep backward vertical integration and a fully-fledged supply industry serving both South
African and foreign companies.3 The MMS has played a key role in the country’s economic development, which has
transformed South Africa into the most industrialised country in Africa. It has also been the principal driver of the current
infrastructure network which now underpins jobs in many other sectors. The New Development Plan and New Growth
Path both recognise the critical role that mining contributes to growing investments, exports, GDP and job creation.
Given the sector’s importance to the economy, a concern is that mining production marked a significant decline in
March 2016, falling by a record 18% year on year in March, accelerating from an 8.3% fall year on year in February,4
with a particularly sharp fall in output of PGMs. The main contributors to the decline in mining output were PGMs, coal,
iron ore, manganese ore, and gold. Output was negatively affected by lower global commodity prices and slowing
demand from China5, among others. Seasonally adjusted mining production fell by 5.2% in the first quarter of 2016
compared with the previous quarter, again mainly due to lower PGMs and iron ore production.6
1.4.2. Value Chain of the MMS
Figure 1 below explains the MMS value chain, showing the industry’s primary activities from exploration to minerals
value addition and the support activities in each stage of the value chain. A value chain is a set of activities that
companies operating in a specific industry perform in order to deliver a valuable product or service for the market.7 As
illustrated in Figure 1, the majority of the companies in Stage 2 are involved in primary production while Stages 3-5
depict secondary production, with increasing degrees of processing, beneficiation and value addition.
Source: Underhill Corporate Solutions illustration based on Ecopartners8
1 2 http://www.gcis.gov.za/sites/www.gcis.gov.za/files/docs/resourcecentre/pocketguide/2012/15%20Mineral%20Resources.pdf
3 African Economic Outlook, 2014.
4 http://www.statssa.gov.za/publications/P2041/P2041March2016.pdf
5 http://www.statssa.gov.za/publications/P2041/P2041March2016.pdf
6 http://www.statssa.gov.za/?page_id=1856&PPN=P2041&SCH=6459
7 Porter, Michael E. (1985). Competitive Advantage: Creating and Sustaining Superior Performance. New York.: Simon and Schuster. Retrieved 13
May 2016.
8 http://www.ecopartners.co.za/docs/Wits%20University%20Mineral%20Economics%20Value%20Chain%20Analysis%20February%202011.pdf
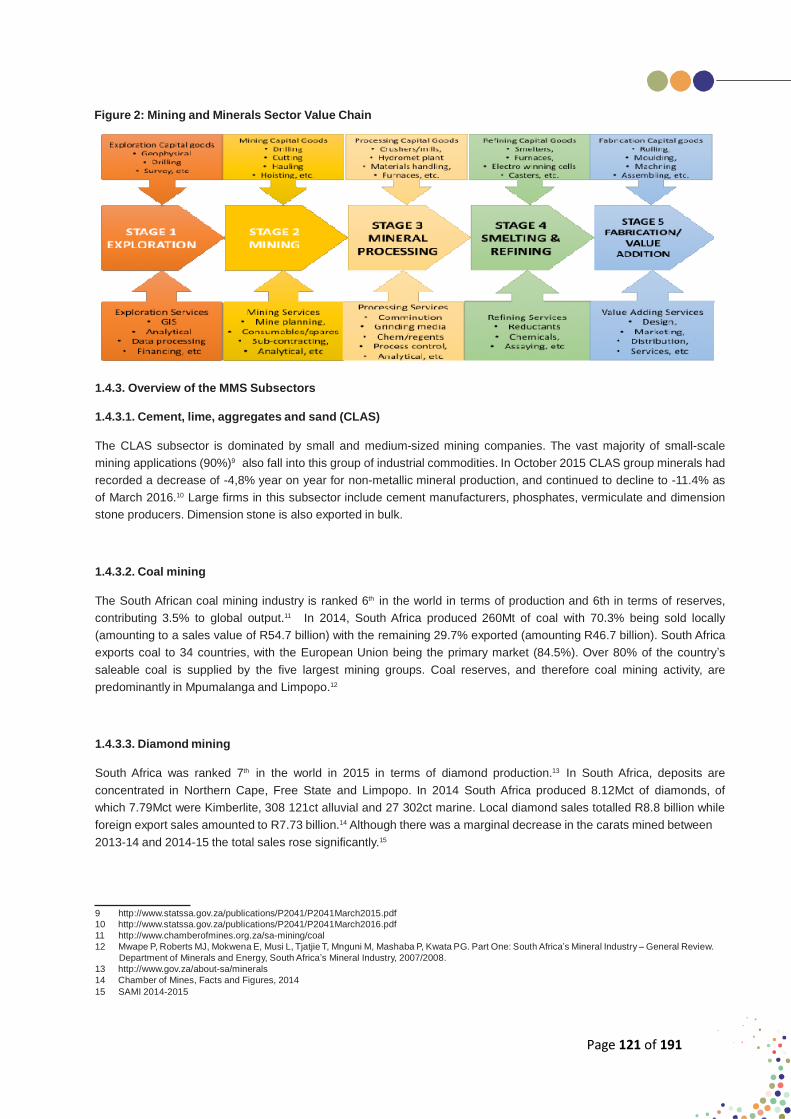
Page 121 of 191
Figure 2: Mining and Minerals Sector Value Chain
1.4.3. Overview of the MMS Subsectors
1.4.3.1. Cement, lime, aggregates and sand (CLAS)
The CLAS subsector is dominated by small and medium-sized mining companies. The vast majority of small-scale
mining applications (90%)9 also fall into this group of industrial commodities. In October 2015 CLAS group minerals had
recorded a decrease of -4,8% year on year for non-metallic mineral production, and continued to decline to -11.4% as
of March 2016.10 Large firms in this subsector include cement manufacturers, phosphates, vermiculate and dimension
stone producers. Dimension stone is also exported in bulk.
1.4.3.2. Coal mining
The South African coal mining industry is ranked 6th in the world in terms of production and 6th in terms of reserves,
contributing 3.5% to global output.11 In 2014, South Africa produced 260Mt of coal with 70.3% being sold locally
(amounting to a sales value of R54.7 billion) with the remaining 29.7% exported (amounting R46.7 billion). South Africa
exports coal to 34 countries, with the European Union being the primary market (84.5%). Over 80% of the country’s
saleable coal is supplied by the five largest mining groups. Coal reserves, and therefore coal mining activity, are
predominantly in Mpumalanga and Limpopo.12
1.4.3.3. Diamond mining
South Africa was ranked 7th in the world in 2015 in terms of diamond production.13 In South Africa, deposits are
concentrated in Northern Cape, Free State and Limpopo. In 2014 South Africa produced 8.12Mct of diamonds, of
which 7.79Mct were Kimberlite, 308 121ct alluvial and 27 302ct marine. Local diamond sales totalled R8.8 billion while
foreign export sales amounted to R7.73 billion.14 Although there was a marginal decrease in the carats mined between
2013-14 and 2014-15 the total sales rose significantly.15
9 http://www.statssa.gov.za/publications/P2041/P2041March2015.pdf
10 http://www.statssa.gov.za/publications/P2041/P2041March2016.pdf
11 http://www.chamberofmines.org.za/sa-mining/coal
12 Mwape P, Roberts MJ, Mokwena E, Musi L, Tjatjie T, Mnguni M, Mashaba P, Kwata PG. Part One: South Africa’s Mineral Industry – General Review.
Department of Minerals and Energy, South Africa’s Mineral Industry, 2007/2008.
13 http://www.gov.za/about-sa/minerals
14 Chamber of Mines, Facts and Figures, 2014
15 SAMI 2014-2015

Page 122 of 191
1.4.3.4. Gold mining
The South African gold mining industry is ranked 1st in the world in terms of gold reserves and 7th in production,1
contributing 5.6% to global production.2 Three of the world’s 10 largest gold mining companies have headquarters in
South Africa and are multinational corporations with operations in Australia, West Africa and South America. Gauteng
dominates in gold mining accounting for 51.6% of South Africa’s production. Free State follows (21.6%); North West
(20.6%); Mpumalanga (4.6%) and then Limpopo (1.6%). Approximately 5% of South Africa’s gold production is
beneficiated locally to coins and jewellery. 3 Total gold production, in terms of kilograms, has been decreasing sharply
over the years. Total monthly production fell from around 25 00kgs in 2005 to less than 10 000kgs in 2016, a 60%
decrease in 10 years.
1.4.3.5. PGM mining
PGMs (Platinum Group Metals) consists of six chemically similar elements: platinum, palladium, rhodium, ruthenium,
iridium and osmium. South Africa’s reserves constitute 87% of the global reserve base and the country contributes
around 58.7% to global production, ranking 1st in both categories. South Africa’s bushveld (North West province and
a smaller part of Limpopo province) hosts approximately 80% of PGM-bearing ore.4 From March 2015 to March 2016
PGMs registered the largest negative contribution in mining production year on year: -23,7% decrease in mining
production to -4.5% percentage points5 on mining production and sales.6
1.4.3.6. Other mining commodities
Included in this bracket are producers of uranium, copper, chrome, iron ore, manganese and salt. Uranium production
is a by-product of gold mining and distribution of the sector mirrors that of gold mining. South Africa’s copper deposits
lie mainly in Limpopo with copper being mainly mined by one large company. With regard to chrome and iron ore,
the subsector was significantly and negatively impacted from the massive decline in global demand, particularly from
China. Widespread downscaling and retrenchment drives characterised the subsector for much of 2015. With regard
to iron ore, South Africa is ranked 13th in the world for reserves; 6th for production and 5th for exports. Manganese is
ranked 1st in the world in terms of reserves, 2nd in production and 2nd for exports. Iron ore and manganese deposits
are concentrated in Northern Cape.7
1.4.3.7. Services incidental to mining
The Services Incidental to Mining category consists of a large group of relatively smaller companies providing services
to the MMS. This includes research and development in the mining and mineral extraction, training, catering, payroll
services, manufacturing, distribution, hiring and maintenance of machinery and equipment, consulting services, shaft
sinking, transportation and logistics.
1.4.3.8. Diamond processing and jewellery manufacturing
The South African diamond processing industry consists of 221 licenced diamond manufacturers. The diamond trading
company of De Beers is the major supplier of rough diamonds to the sector although some are sourced from local
independent mines and others imported from Belgium, a major global diamonds buyer of rough diamonds. The Master
Diamond Cutters’ Association has 80 members which employ 95% of the employees in this subsector. 8 South Africa’s
1 http://www.mineweb.com/regions/ 2 Chamber of Mines. Facts and Figures booklet, 2012.
3 http://www.dmr.gov.za/publications/south-africas-mineral-industry-sami.html
4 http://www.chamberofmines.org.za/sa-mining/platinum
5 http://www.statssa.gov.za/publications/P2041/P2041March2016.pdf
6 http://www.statssa.gov.za/publications/P2041/P2041March2016.pdf
7 Chamber of Mines, Facts and Figures
8 http://www.essentialsjewelry.com/southafrica-gem-jewelry/south-africa-rough-diamond.html
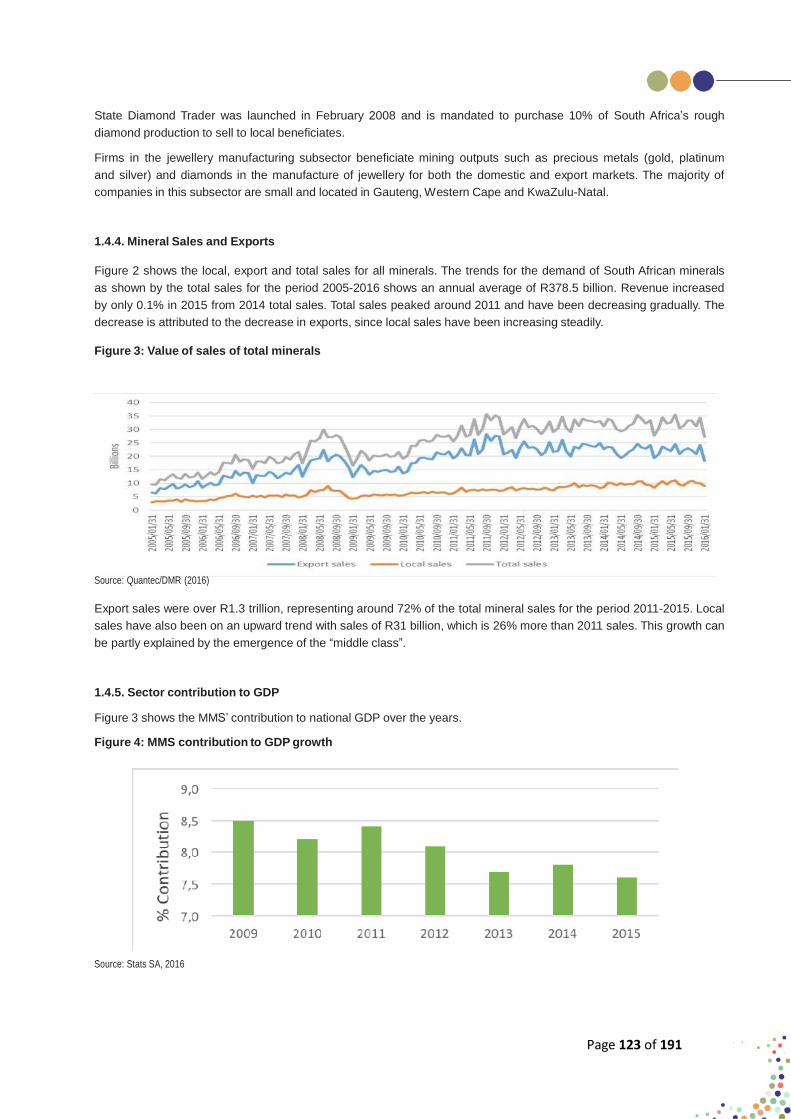
Page 123 of 191
State Diamond Trader was launched in February 2008 and is mandated to purchase 10% of South Africa’s rough
diamond production to sell to local beneficiates.
Firms in the jewellery manufacturing subsector beneficiate mining outputs such as precious metals (gold, platinum
and silver) and diamonds in the manufacture of jewellery for both the domestic and export markets. The majority of
companies in this subsector are small and located in Gauteng, Western Cape and KwaZulu-Natal.
1.4.4. Mineral Sales and Exports
Figure 2 shows the local, export and total sales for all minerals. The trends for the demand of South African minerals
as shown by the total sales for the period 2005-2016 shows an annual average of R378.5 billion. Revenue increased
by only 0.1% in 2015 from 2014 total sales. Total sales peaked around 2011 and have been decreasing gradually. The
decrease is attributed to the decrease in exports, since local sales have been increasing steadily.
Figure 3: Value of sales of total minerals
Source: Quantec/DMR (2016)
Export sales were over R1.3 trillion, representing around 72% of the total mineral sales for the period 2011-2015. Local
sales have also been on an upward trend with sales of R31 billion, which is 26% more than 2011 sales. This growth can
be partly explained by the emergence of the “middle class”.
1.4.5. Sector contribution to GDP
Figure 3 shows the MMS’ contribution to national GDP over the years.
Figure 4: MMS contribution to GDP growth
Source: Stats SA, 2016

Page 124 of 191
As shown in Figure 3, the MMS’ contribution to South Africa’s GDP has decreased by 0.9% from 2009 to 2015.
The decline in global commodity demand, downscaling and closing down of mines compounded the decline in 2015,
resulting in a decline in mining activity in the second quarter (-6.4%) and third quarter (-9.8% decline) in 2015. The
National Treasury reported that the global outlook for economic growth is subdued, weighed down by a prolonged
slump in commodity prices and slower growth in China. Prices are not expected to recover soon. Low global growth
means fewer exports for South Africa, thus impacting mineral sales.
1.4.6. Comparison of Economic Sector Contribution to GDP
Table 4 below shows the economic sector contributions to the national GDP for the past 6 years (2010-2015).1 In 2015
Finance, real estate and business services was the highest individual contributor to the national GDP, with 19.63%,
General Government Services 2nd with 15.45%. The MMS2 was the 6th highest contributor to GDP in 2015. The MMS
has experienced the biggest decline in GDP contribution of all sectors (from 8.2% in 2010 to 7.6% in 2015).
Table 4: Sector contribution to national GDP
ECONOMIC SECTOR
2010
2011
2012
2013
2014
2015
Agriculture, forestry and fishing 2.5 2.4 2.3 2.3 2.3 2.4
Mining and quarrying 8.2 8.4 8.1 7.7 7.8 7.6
Manufacturing 12.7 13.1 13.0 13.0 12.8 12.6
Electricity, gas and water 2.5 2.5 2.4 2.4 2.3 2.3
Construction 3.6 3.5 3.4 3.4 3.4 3.4
Wholesale, retail and motor trade; catering and
accommodation
13.3 13.5 13.6 13.7 13.7 13.7
Transport, storage and communication 8.5 8.4 8.3 8.4 8.3 8.4
Finance, real estate and business services 19.4 19.1 19.2 19.4 19.6 19.6
General government services 14.8 14.7 14.9 15.1 15.2 15.4
Personal services 5.5 5.4 5.4 5.4 5.3 5.3
Total value added 90.9 90.8 90.6 90.6 90.7 90.7
Taxes less subsidies on products 9.1 9.2 9.4 9.4 9.3 9.3
GDP at market prices 100 100 100 100 100 100
Source: Stats SA, 2016
1.5. MMS FUTURE OUTLOOK
1.5.1. Mining Phakisa
The Mining Phakisa, an initiative of the Presidency, aims to expand the lifespan of the mines by locally developing
the machinery required to mine narrow, hard rock reefs, which is where the majority of platinum and gold resources
lie in South Africa. These resources are currently unviable to mine due to safety, health and economic reasons. Job
sustainability is a high priority area, with the intention that jobs in mining will be sustained through access to currently
unmineable resources. In terms of skills development, upskilling training drives will be required for all skills levels
of workers, including managers and supervisors, to ensure a smooth transition to mechanisation. A focus on AET
programmes up to level 4 as a way of improving literacy and numeracy levels will be important as a way of preparing
existing and potential employees to operate new machinery and coordinate new processes.
1 The national accounts data only covers mining & quarrying and not the total MMS. No separate information is available on the performance of
the beneficiation components of the MMS (the diamond processing and jewellery manufacturing subsectors) and the services incidental to mining
subsector. This economic overview thus focuses on the mining & quarrying sector.
2 The national accounts data only covers mining & quarrying and not the total MMS. No separate information is available on the performance of
the beneficiation components of the MMS (the diamond processing and jewellery manufacturing subsectors) and the services incidental to mining
subsector. This economic overview thus focuses on the mining & quarrying sector.
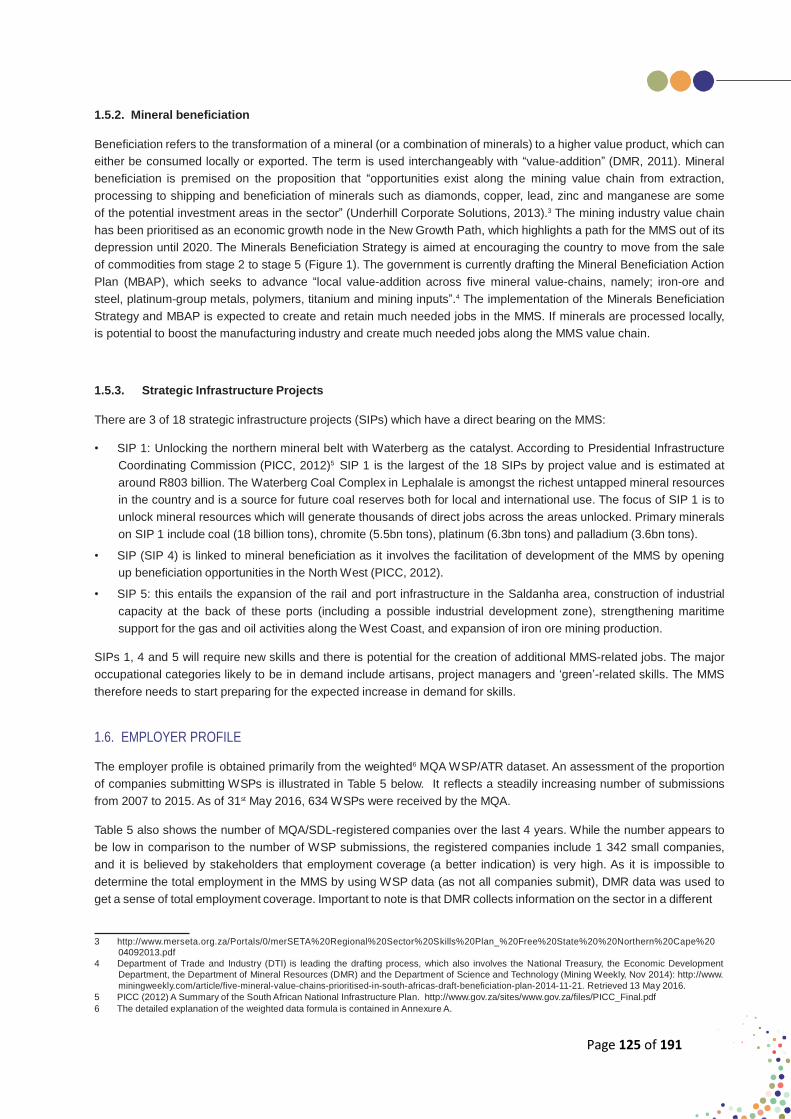
Page 125 of 191
1.5.2. Mineral beneficiation
Beneficiation refers to the transformation of a mineral (or a combination of minerals) to a higher value product, which can
either be consumed locally or exported. The term is used interchangeably with “value-addition” (DMR, 2011). Mineral
beneficiation is premised on the proposition that “opportunities exist along the mining value chain from extraction,
processing to shipping and beneficiation of minerals such as diamonds, copper, lead, zinc and manganese are some
of the potential investment areas in the sector” (Underhill Corporate Solutions, 2013).3 The mining industry value chain
has been prioritised as an economic growth node in the New Growth Path, which highlights a path for the MMS out of its
depression until 2020. The Minerals Beneficiation Strategy is aimed at encouraging the country to move from the sale
of commodities from stage 2 to stage 5 (Figure 1). The government is currently drafting the Mineral Beneficiation Action
Plan (MBAP), which seeks to advance “local value-addition across five mineral value-chains, namely; iron-ore and
steel, platinum-group metals, polymers, titanium and mining inputs”.4 The implementation of the Minerals Beneficiation
Strategy and MBAP is expected to create and retain much needed jobs in the MMS. If minerals are processed locally,
is potential to boost the manufacturing industry and create much needed jobs along the MMS value chain.
1.5.3. Strategic Infrastructure Projects
There are 3 of 18 strategic infrastructure projects (SIPs) which have a direct bearing on the MMS:
• SIP 1: Unlocking the northern mineral belt with Waterberg as the catalyst. According to Presidential Infrastructure
Coordinating Commission (PICC, 2012)5 SIP 1 is the largest of the 18 SIPs by project value and is estimated at
around R803 billion. The Waterberg Coal Complex in Lephalale is amongst the richest untapped mineral resources
in the country and is a source for future coal reserves both for local and international use. The focus of SIP 1 is to
unlock mineral resources which will generate thousands of direct jobs across the areas unlocked. Primary minerals
on SIP 1 include coal (18 billion tons), chromite (5.5bn tons), platinum (6.3bn tons) and palladium (3.6bn tons).
• SIP (SIP 4) is linked to mineral beneficiation as it involves the facilitation of development of the MMS by opening
up beneficiation opportunities in the North West (PICC, 2012).
• SIP 5: this entails the expansion of the rail and port infrastructure in the Saldanha area, construction of industrial
capacity at the back of these ports (including a possible industrial development zone), strengthening maritime
support for the gas and oil activities along the West Coast, and expansion of iron ore mining production.
SIPs 1, 4 and 5 will require new skills and there is potential for the creation of additional MMS-related jobs. The major
occupational categories likely to be in demand include artisans, project managers and ‘green’-related skills. The MMS
therefore needs to start preparing for the expected increase in demand for skills.
1.6. EMPLOYER PROFILE
The employer profile is obtained primarily from the weighted6 MQA WSP/ATR dataset. An assessment of the proportion
of companies submitting WSPs is illustrated in Table 5 below. It reflects a steadily increasing number of submissions
from 2007 to 2015. As of 31st May 2016, 634 WSPs were received by the MQA.
Table 5 also shows the number of MQA/SDL-registered companies over the last 4 years. While the number appears to
be low in comparison to the number of WSP submissions, the registered companies include 1 342 small companies,
and it is believed by stakeholders that employment coverage (a better indication) is very high. As it is impossible to
determine the total employment in the MMS by using WSP data (as not all companies submit), DMR data was used to
get a sense of total employment coverage. Important to note is that DMR collects information on the sector in a different
3 http://www.merseta.org.za/Portals/0/merSETA%20Regional%20Sector%20Skills%20Plan_%20Free%20State%20%20Northern%20Cape%20 04092013.pdf
4 Department of Trade and Industry (DTI) is leading the drafting process, which also involves the National Treasury, the Economic Development
Department, the Department of Mineral Resources (DMR) and the Department of Science and Technology (Mining Weekly, Nov 2014): http://www.
miningweekly.com/article/five-mineral-value-chains-prioritised-in-south-africas-draft-beneficiation-plan-2014-11-21. Retrieved 13 May 2016.
5 PICC (2012) A Summary of the South African National Infrastructure Plan. http://www.gov.za/sites/www.gov.za/files/PICC_Final.pdf
6 The detailed explanation of the weighted data formula is contained in Annexure A.
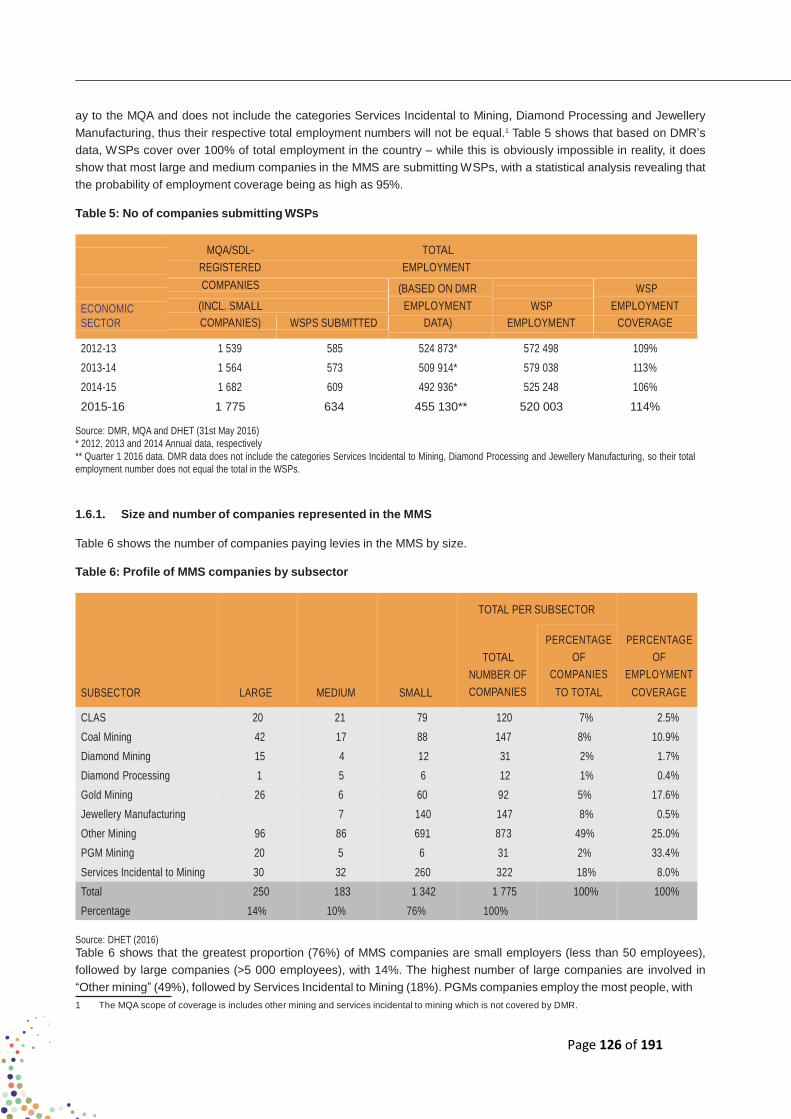
Page 126 of 191
ay to the MQA and does not include the categories Services Incidental to Mining, Diamond Processing and Jewellery
Manufacturing, thus their respective total employment numbers will not be equal.1 Table 5 shows that based on DMR’s
data, WSPs cover over 100% of total employment in the country – while this is obviously impossible in reality, it does
show that most large and medium companies in the MMS are submitting WSPs, with a statistical analysis revealing that
the probability of employment coverage being as high as 95%.
Table 5: No of companies submitting WSPs
ECONOMIC
SECTOR
MQA/SDL- TOTAL
REGISTERED EMPLOYMENT
COMPANIES
(INCL. SMALL
(BASED ON DMR
WSP
EMPLOYMENT
WSP
EMPLOYMENT
DATA)
EMPLOYMENT
COVERAGE COMPANIES) WSPS SUBMITTED
2012-13 1 539 585 524 873* 572 498 109%
2013-14 1 564 573 509 914* 579 038 113%
2014-15 1 682 609 492 936* 525 248 106%
2015-16 1 775 634 455 130** 520 003 114%
Source: DMR, MQA and DHET (31st May 2016)
* 2012, 2013 and 2014 Annual data, respectively
** Quarter 1 2016 data. DMR data does not include the categories Services Incidental to Mining, Diamond Processing and Jewellery Manufacturing, so their total
employment number does not equal the total in the WSPs.
1.6.1. Size and number of companies represented in the MMS
Table 6 shows the number of companies paying levies in the MMS by size.
Table 6: Profile of MMS companies by subsector
TOTAL PER SUBSECTOR
SUBSECTOR LARGE MEDIUM SMALL
TOTAL
NUMBER OF
COMPANIES
PERCENTAGE
OF
COMPANIES
TO TOTAL
PERCENTAGE
OF
EMPLOYMENT
COVERAGE
CLAS 20 21 79 120 7% 2.5%
Coal Mining 42 17 88 147 8% 10.9%
Diamond Mining 15 4 12 31 2% 1.7%
Diamond Processing 1 5 6 12 1% 0.4%
Gold Mining 26 6 60 92 5% 17.6%
Jewellery Manufacturing 7 140 147 8% 0.5%
Other Mining 96 86 691 873 49% 25.0%
PGM Mining 20 5 6 31 2% 33.4%
Services Incidental to Mining 30 32 260 322 18% 8.0%
Total 250 183 1 342 1 775 100% 100%
Percentage 14% 10% 76% 100%
Source: DHET (2016)
Table 6 shows that the greatest proportion (76%) of MMS companies are small employers (less than 50 employees),
followed by large companies (>5 000 employees), with 14%. The highest number of large companies are involved in
“Other mining” (49%), followed by Services Incidental to Mining (18%). PGMs companies employ the most people, with
1 The MQA scope of coverage is includes other mining and services incidental to mining which is not covered by DMR.

Page 127 of 191
33.4% employment coverage, followed by Other Mining (25%), and Gold mining (17.6%).
1.6.2. Geographical location of companies in the MMS
Table 7 shows the geographic location of companies in the sector. While the number of companies for some of the
provinces is very high, for example Western Cape, the employment coverage is very low – in Western Cape, only 1.3%
of total employment in the sector. The province has a high number of small companies, many of which are in jewellery
manufacturing and design. Conversely, Limpopo has a relatively low number of companies (3.5%) but the majority are
large companies and employ the second highest number of people in the country’s MMS (16.7%), after North West.
Table 7: Geographical location of MMS companies
PROVINCE
TOTAL
% OF MMS EMPLOYERS
% OF MMS EMPLOYMENT
Eastern Cape 37 2.1% 0.4%
Free state 46 2.6% 7.0%
Gauteng 843 47.5% 16.3%
KwaZulu-Natal 73 4.1% 2.0%
Limpopo 62 3.5% 16.7%
Mpumalanga 274 15.4% 12.2%
North West 151 8.5% 35.6%
Northern Cape 100 5.6% 8.5%
Western Cape 189 10.6% 1.3%
Total 1 775 100% 100%
Source: DHET (March 2016) and MQA WSP/ATR submission 2015-16
1.6.3. Mining start-ups and closures
In the MMS most mining operations are large but small-scale mining also forms an important part of the sector.
However, it is mainly small-scale mining entities which experience challenges with sustainability, attributed to the
capital intensive nature of the industry as well as broader market dynamics. Entrepreneurs in the small, medium
and artisanal mining sector therefore need to be supported so that they perform efficiently and within the codes and
regulations of the sector at large. In order to mitigate these challenges, the MMS has prioritised the beneficiation of
mineral resources into commercial products to try and ensure long term sustainability for small scale mining. During
stakeholder engagement sessions conducted by the MQA in 2015-16, key stakeholder participants identified 4 major
areas that impede sustainability: 1) Finance-related issues: obtaining finance, obtaining equipment, etc.; 2) Labour
issues: health and safety and working conditions; 3) Legal and market constraints: obtaining permits, transport, tax
regimes and selling arrangements; and 4) Difficulty and high cost of attracting and retaining suitably skilled people.
Small companies, especially those in more rural areas, are affected the most.
1.7. LABOUR MARKET PROFILE
1.7.1. Introduction
This section is based on information in the weighted WSP/ATR submissions provided to the MQA by levy-paying
companies. A total of 634 companies submitted their WSPs by 31st May 2016. The section highlights the profile of the
MMS labour market in terms of total employment, provincial distribution, gender and other equity indicators.

Page 128 of 191
1.7.2. Gender and Race
In terms of gender, Table 8 shows that 14.5% of the sector’s employees are female. It also shows that females constitute
the majority of employees in the Clerical Support Workers category (55%), and comprise a relatively high percentage
in the Professionals (33%) and Service and Sales Workers (32.6%) categories.
In terms of race, Table 8 also shows the composition of the 4 race groups in the sector. Overall, Africans constitute
the majority (83.7%) of the sector’s employees followed by Whites (11.8%), Coloureds (3.8%) and Indians (0.8%).
Africans constitute the majority of employees in most occupational categories, including Professionals and Technical
and Associate Professionals. The one exception is the Managers category, where Africans comprise the second highest
after Whites, with 32.5%.
GENDER RACE
OCCUPATIONAL CATEGORIES FEMALE MALE AFRICAN WHITE COLOURED INDIAN
Managers 2 477
(18.5%)
Professionals 8 490
(33.0%)
Technicians and Associate Professionals 8 479
(14.6%)
Clerical Support Workers 11 880
(55.0%)
Service and Sales Workers 2 244
(32.6%)
10 920
(81.5%)
17 201
(67.0%)
49 398
(85.4%)
9 702
(45.0%)
4 642
(67.4%)
4 340
(32.4%)
14 020
(54.6%)
37 922
(65.5%)
13 564
(62.8%)
5 861
(85.1%)
7 704
(57.5%)
9 486
(36.9%)
16 892
(29.2%)
5 843
(27.1%)
729
(10.6%)
649
(4.8%)
1 351
(5.3%)
2 448
(4.2%)
1 711
(7.9%)
263
(3.8%)
704
(5.3%)
833
(3.2%)
615
(1.1%)
465
(2.2%)
33
(0.5%)
Skilled Agricultural, Forestry, Fishery, Craft and
Related Trades Workers (Artisan category)
3 326
(8.3%)
36 623
(91.7%)
22 633
(56.7%)
13 559
(33.9%)
3 422
(8.6%)
335
(0.8%)
Plant and Machine Operators and Assemblers 14 575
(6.7%)
Elementary Occupations 20 202
(15.8%)
Learners 3 777
(34.8%)
Total 75 450
(14.5%)
201 670
(93.3%)
107 333
(84.2%)
7 064
(65.2%)
444 553
(85.5%)
205 078
(94.8%)
122 628
(96.2%)
9 054
(83.5%)
435 100
(83.7%)
3 839
(1.8%)
2 409
(1.9%)
952
(8.8%)
61 414
(11.8%)
6 801
(3.1%)
2 160
(1.7%)
777
(7.2%)
19 582
(3.8%)
526
(0.2%)
337
(0.3%)
58
(0.5%)
3 907
(0.8%)
Source: Calculated from Weighted MQA WSP/ATR Submission (2016)
Upon closer analysis of the different management levels, Figure 4 reveals that Whites comprise 71.1% of top
management, 64.9% of senior management, and half (50%) of mid management. Africans comprise the second highest
in all 3 categories, the highest proportion (38%) being in mid management.

Page 129 of 191
Figure 5: Management levels by race
Source: Calculated from Weighted MQA WSP/ATR Submission (2016)
1.7.3. Education and skills levels
With regard to education, analysis of the weighted WSP submissions revealed that the highest proportion of employees
(29.9%) in the sector have achieved the equivalent of Grade 12 (including Nated 3 and NCV 3), followed by Grade
11 (10.8%). Grouping the many educational levels into 4 broad categories showed that the highest proportion of the
sector’s employees (47%) have achieved the equivalent of upper high school levels (Grades 10-12), depicted in Figure
5, followed by 22% of the sector with Grades 4-9 as their highest level of education. Of the 1.8% of the sector’s
employees who have no schooling at all, 73.8% are South African citizens and 90.5% fall into the categories Plant and
Machine Operators and Assemblers and Elementary Occupations.
Figure 6: Employment by education level
Source: Calculated from Weighted MQA WSP/ATR Submission (2016
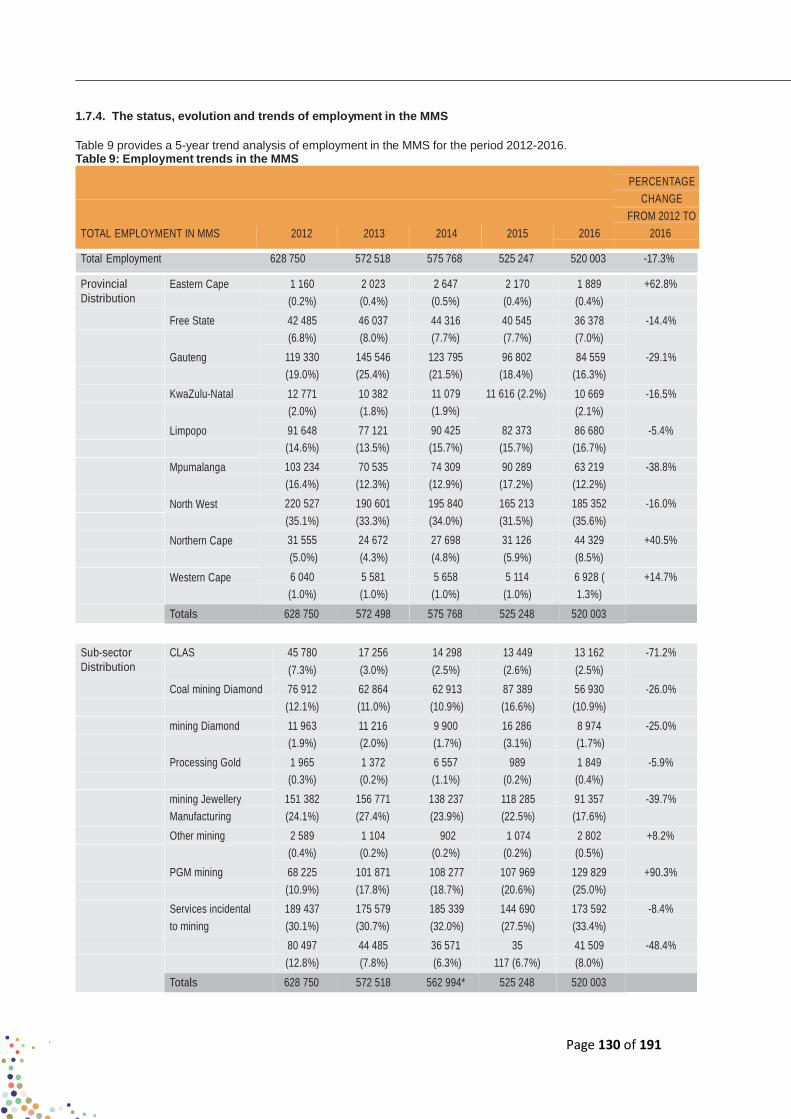
Page 130 of 191
1.7.4. The status, evolution and trends of employment in the MMS
Table 9 provides a 5-year trend analysis of employment in the MMS for the period 2012-2016. Table 9: Employment trends in the MMS
PERCENTAGE
CHANGE
FROM 2012 TO
TOTAL EMPLOYMENT IN MMS 2012 2013 2014 2015 2016 2016
Total Employment 628 750 572 518 575 768 525 247 520 003 -17.3%
Provincial Eastern Cape 1 160 2 023 2 647 2 170 1 889 +62.8%
Distribution (0.2%) (0.4%) (0.5%) (0.4%) (0.4%)
Free State 42 485 46 037 44 316 40 545 36 378 -14.4%
(6.8%) (8.0%) (7.7%) (7.7%) (7.0%)
Gauteng 119 330 145 546 123 795 96 802 84 559 -29.1%
(19.0%) (25.4%) (21.5%) (18.4%) (16.3%) KwaZulu-Natal 12 771 10 382 11 079 11 616 (2.2%) 10 669 -16.5%
(2.0%) (1.8%) (1.9%) (2.1%) Limpopo 91 648 77 121 90 425 82 373 86 680 -5.4%
(14.6%) (13.5%) (15.7%) (15.7%) (16.7%) Mpumalanga 103 234 70 535 74 309 90 289 63 219 -38.8%
(16.4%) (12.3%) (12.9%) (17.2%) (12.2%) North West 220 527 190 601 195 840 165 213 185 352 -16.0%
(35.1%) (33.3%) (34.0%) (31.5%) (35.6%) Northern Cape 31 555 24 672 27 698 31 126 44 329 +40.5%
(5.0%) (4.3%) (4.8%) (5.9%) (8.5%) Western Cape 6 040 5 581 5 658 5 114 6 928 ( +14.7%
(1.0%) (1.0%) (1.0%) (1.0%) 1.3%)
Totals 628 750 572 498 575 768 525 248 520 003
Sub-sector CLAS 45 780 17 256 14 298 13 449 13 162 -71.2%
Distribution (7.3%) (3.0%) (2.5%) (2.6%) (2.5%)
Coal mining Diamond 76 912 62 864 62 913 87 389 56 930 -26.0%
(12.1%) (11.0%) (10.9%) (16.6%) (10.9%) mining Diamond 11 963 11 216 9 900 16 286 8 974 -25.0%
(1.9%) (2.0%) (1.7%) (3.1%) (1.7%)
Processing Gold 1 965 1 372 6 557 989 1 849 -5.9%
(0.3%) (0.2%) (1.1%) (0.2%) (0.4%)
mining Jewellery 151 382 156 771 138 237 118 285 91 357 -39.7%
Manufacturing (24.1%) (27.4%) (23.9%) (22.5%) (17.6%)
Other mining 2 589 1 104 902 1 074 2 802 +8.2%
(0.4%) (0.2%) (0.2%) (0.2%) (0.5%) PGM mining 68 225 101 871 108 277 107 969 129 829 +90.3%
(10.9%) (17.8%) (18.7%) (20.6%) (25.0%) Services incidental 189 437 175 579 185 339 144 690 173 592 -8.4%
to mining (30.1%) (30.7%) (32.0%) (27.5%) (33.4%) 80 497 44 485 36 571 35 41 509 -48.4%
(12.8%) (7.8%) (6.3%) 117 (6.7%) (8.0%)
Totals 628 750 572 518 562 994* 525 248 520 003

Page 131 of 191
TOTAL EMPLOYMENT IN MMS
2012
2013
2014
2015
2016
PERCENTAGE
CHANGE
FROM 2012 TO
2016
Gender Male 559 470 503 974 506 676 454 663 444 553 -20.5%
Distribution (89.0%) (88.0%) (88.0%) (86.6%) (85.5%) Female 69 280 68 544 89 092 70 585 75 450 +8.9%
(11.0%) (12.0%) (12.0%) (13.4%) (14.5%) Totals 628 750 572 518 575 768 525 248 520 003
Equity African
529 635
485 210
486 524
441 699
435 100
-17.8%
Distribution (84.2%) (84.8%) (84.5%) (84.1%) (83.7%) Coloured 14 997 13 763 11 515 (2.0%) 15 352 19 582 +30.6%
(2.4%) (2.4%) (2.9%) (3.8%) Indian 3 167 2 855 2 879 2 832 3 907 +23.4%
(0.5%) (0.5%) (0.5%) (0.5%) (0.8%) White 80 951 70 690 69 092 65 365 61 414 -24.1%
(12.9%) (12.3%) (12.0%) (12.4%) (11.8%) Totals 628 750 572 518 575 768 525 248 520 003
Occupational Managers
17 643
14 677
13 359
14 165
13 397
-24.1%
Group (2.8%) (2.6%) (2.3%) (2.7%) (2.6%) Distribution Professionals 26 852 26 379 25 749 26 601 25 691 -4.3%
(4.3%) (4.6%) (4.5%) (5.1%) (4.9%) Technicians 70 254 60 864 68 688 61 145 57 877 -17.6%
& Associate
Professionals
(11.2%) (10.6%) (11.9%) (11.6%) (11.1%)
Clerical Support 27 299 23 152 23 596 22 315 21 582 -20.9%
Workers (4.3%) (4.0%) (4.1%) (4.2%) (4.2%) Service & Sales 7 125 6 322 6 488 6 419 6 885 -3.4%
Workers (1.1%) (1.1%) (1.1%) (1.2%) (1.3%) Trades category 34 315 36 985 38 238 39 678 39 949 +16.4%
(5.5%) (6.5%) (6.6%) (7.6%) (7.7%) Plant & Machine 264 952 244 335 238 765 213 412 216 245 -18.4%
Operators & (42.1%) (42.7%) (41.5%) (40.6%) (41.6%) Assemblers Elementary 172 699 150 614 150 201 131 172 127 534 -26.2%
occupations (27.5%) (26.3%) (26.1%) (25.0%) (24.5%) Learners 7 611 9 190 10 684 10 341 10 841 +42.4%
(1.2%) (1.6%) (1.9%) (2.0%) (2.1%) Totals 628 750 572 518 575 768 525 248 520 003
Disability Distribution
4 843 (0.8%)
4 450 (0.8%)
4 924 (0.9%)
3 815 (0.7%)
4 864 (0.9%)
+0.4%
Management by African
5 377
4 005
3 913
4 315
4 340
-19.3%
Equity (30.5%) (37.0%) (29.4%) (30.5%) (32.4%) distribution Coloured 692 (3.9%) 299 (2.8%) 490 (3.7%) 586 (4.1%) 649 (4.8%) -6.2%
Indian 595 (3.4%) 288 (2.7%) 591 (4.4%) 649 (4.6%) 704 (5.3%) +18.3%
White 10 979 6 235 8 312 8 614 7 704 -29.8%
(62.2%) (57.6%) (62.5%) (60.8%) (57.5%) Total in management 17 643 10 827 13 306 14 164 13 397
Source: Calculated from Weighted MQA WSP/ATR Submission (2012-2016)
* In the 2014 report, the subsector field was left blank for 12 774 employees, thus why the subsector employment total does not equal total employment in the
sector for that year (575 768).

Page 132 of 191
Table 9 shows that the most significant changes and trends over the past 5 years occurred in the following categories:
• Total employment in the MMS has been declining over the years. As of 31st May 2016, the MMS employs an
estimated 520 003, which is a 1% decrease from 2015, and a 17.3% drop since 2012.
• Mpumalanga, Gauteng, North West and Free State’s employment numbers have been declining steadily, by
38.8%, 29.1%, 16% and 14.4% respectively between 2012 and 2016. The biggest growth has been seen in
Northern Cape, whose employment numbers have been increasing steadily, by 40.5% in the same 5-year period.
• In terms of subsector employment, most subsectors have experienced significant declines in employment numbers
since 2012, the biggest being CLAS with a 71.2% drop between 2012 and 2016, followed by Services Incidental to
Mining with a 48.4% drop and Gold with a 39.7% drop. Other Mining has shown a relatively large increase, growing
by 90.3% in the same 5-year period.
• A review of employment by occupational categories shows that the 3 biggest decreases in employment numbers
are found in the Elementary occupations, with a 26% decrease since 2012, Managers, with a 24.1% decrease, and
Plant and Machine Operators & Assemblers, with an 18.4% decrease between 2012 and 2016.
• Although the sector is historically male-dominated, the proportion of females has been increasing gradually, from
11% in 2012, to 14.5% in 2016.
• The overall composition of employees by race shows that Africans have been, and continue to be, the dominant
group in the MMS. In 2016 the total employment number of Africans decreased by 1.5% from 2015, with the
biggest decline being in the Service and Sales Workers category, with a 7.46% drop. There was a 6% decrease
in White employment, with the biggest decline being in the Managers category, with a 10.56% drop between
2015 and 2016. Coloured employment experienced a large jump in numbers from 2015 to 2016 compared to the
previous 4 years, with the largest increase being in the Artisan category, at 62.7%. The Indian group is consistently
the least represented in the MMS constituting less than 1%, although the numbers increased by 38% from 2015 to
2016.
• In terms of management by equity, there has been an overall increase in management of Africans, Coloureds and
Indians. In 2012, these 3 race groups together constituted 37.7% of management, to the highest proportion across
the 5 years in 2016, with 42.5% of management.
• People with disabilities have consistently represented less than 1% of the total MMS sector labour force since
2012.
1.7.5. Implications of Findings for Skills Development
The main implications for skills development in the sector are summarised below:
• There has been a decrease in employment figures over the last few years, with retrenchments remaining a
foreseeable reality. The MQA and other role players need to prioritise the reskilling of retrenched workers so that
they can be absorbed into other sectors of the formal labour market.
• There is an urgent need to monitor and implement Mining Phakisa, the 3 SIPs projects related to the MMS as well
as mineral beneficiation as they each have great potential to create much-needed jobs. Relevant skills for these
initiatives need to be developed.
• There are still racial and gender disparities in the demographic composition of the industry signalling the need
for role-players to continue to address workforce imbalances. The MQA might need to consider a reallocation of
the discretionary grant to support industry to increase the uptake and throughput of historically disadvantaged
individuals, particularly women and HDSAs in top and senior management levels, in their training and skills
development pipeline.
Page 133 of 191
1.8. SUMMARY AND CONCLUSION
This chapter revealed that South Africa is an important hub in the global mining value chain. However, the sector is
currently facing some challenges which include:
• The sector’s contribution to GDP has been decreasing over the last few years, from 8.5% in 2009 to 7.6% in 2016.
• There has been a decrease in number of people employed from a peak of 628 750 in 2012 to 520 003 in 2016.
• It has been concluded that the short to long term outlook of the sector would be improved if the sector monitors
the developments of Mining Phakisa and prepares existing and potential employees accordingly; as well as takes
advantage of the implementation of the Mineral Beneficiation Action Plan (MBAP) and the SIPs projects, which are
expected to lead to increased economic activity and the creation of new jobs in South Africa.
• The MQA and other role players need to pay special attention to the reskilling of retrenched workers so that they
can be absorbed into other sectors of the formal labour market.
• There are still demographic disparities in the gender and management by equity compositions of the industry
signalling the need for MQA and other role players to continue to address workforce imbalances.
Page 134 of 191
2. KEY SKILLS ISSUES
INTRODUCTION
This chapter is concerned with identifying factors that are driving change in the MMS and which impact on skills
demand and supply. It offers an analysis of their implications for skills development. Secondly, the chapter provides
an analysis of the alignment of MQA’s SSP to national strategies and plans such as the National Skills Development
Strategy as well as those specific to the MMS such as the Minerals and Petroleum Resources Development Act.
2.1 CHANGE DRIVERS
There are numerous factors that impact on skills development in the MMS, including economic, social, technological,
environmental and legislative. The influence of the drivers on the sector is important, particularly their impact on skills
development. Some of the change drivers are non-sector specific, meaning they are not directly related to the sector
but exert change in the broader environment in which the sector operates. All change drivers discussed have direct
implications for skills development in the MMS, and are listed in no particular order.
2.1.1 Technology
Technological change remains at the forefront of the sector’s ability to become as safe, healthy efficient and sustainable
as possible. New, sophisticated technologies are transforming the sector’s operations. As a result, the type, level
and mix of skills required is starting to change, affecting occupations including Rock Drill Operator, Blaster, Drill Rig
Operator as well as most of the artisan trades. Upskilling and re-skilling programmes are needed so that employees
are trained in new mining processes that will extend the lifespans of mines. TVET Colleges are for the most part not
up-to-date with latest technology therefore many skills may need to be developed on the job.
As mentioned in chapter 1, the Mining Phakisa initiative aims to expand the lifespan of some of the mines by developing
locally the machinery required to mine narrow, hard rock reefs, which is where the majority of platinum and gold
resources lie in South Africa but which are currently unviable to mine due to safety, health and economic reasons. Job
sustainability is a high priority of the initiative, with the intention that jobs in mining will be sustained through access
to currently unmineable resources. R&D is currently underway to develop the machinery locally, and it will be crucial
for the MQA to stay abreast of these developments as the time-frame goals are relatively short: 5 years for remote
drill-and-blast mechanisation and 10 years for 24/7 mechanisation. In terms of skills development, upskilling training
drives will be required for all skills levels of workers, including managers and supervisors, to ensure a smooth transition
to mechanisation. A focus on AET programmes up to level 4 as a way of improving literacy and numeracy levels will
be important to prepare existing and potential employees to operate new machinery and coordinate new processes.
Research still needs to be conducted on the potential impact of new mechanised methods on various skills, and the
training that will be required for each to adapt accordingly.
21.2 Global demand
Many subsectors in the MMS are experiencing significant decline in growth owing to decreased global demand for their
commodities (in particular, platinum, iron ore, chrome and manganese), with many operations downscaling or closing
down as a result. Retrenchments are an ongoing reality so skills are re-entering the market. Portable skills training has
become a necessity for those who are not re-absorbed in the MMS and must be made a priority by the MQA.
Page 135 of 191
2.1.3 Occupational Health and Safety
Mining operations come with inherent risks that can impact the health and safety of employees. There has been a
decrease in mining injuries and fatalities, with total fatalities decreasing sharply from a peak of 744 per annum in 1989
to 77 in 2015. Mining companies, government and unions need to continue to place importance on employee safety
since continued fatalities, injuries and occupational diseases jeopardise a company’s licence to operate. The MQA must
also continue its support of OHS skills development by increasing human resources supply in areas critical to OHS.
2.1.4. Mining Charter and Employment equity
The Mining Charter stipulates that mining companies must be at least 26% black-owned to qualify for mining and
prospecting rights. Companies are required to comply with social, labour and community objectives such as procurement
spend with BEE entities. Failure to comply with the Charter could result in permits or mining rights being revoked.
Companies situated in remote areas find it difficult to comply owing to their locations. The stakeholder engagements
revealed the need for training and support to small businesses in remote areas which can service the mines. The
MQA’s response is to continue to prioritise mentorship and entrepreneurship development.
Employment equity (HDSAs, women and people with disabilities) is another high priority change driver. The current
Mining Charter (2010) stipulates that there should be at least 40% participation in HDSAs in management positions.
While chapter 1’s labour market profile indicates that this target is being met (42.65%), stakeholders in most provinces
stated that HDSAs are underrepresented at more senior management levels. However, it was also advised that
HDSAs with senior management experience are hard to find. Internal development is often challenging as it takes a
long time and an investment in costs, with head-hunting and/or migration to other provinces/sectors being a common
eventuality. The MQA supports programmes such as the Management Development Programme (MDP) which is aimed
at addressing this challenge.
In April 2016 a draft new Mining Charter with new targets was gazetted by the DMR. The proposed targets are
considerably higher, in particular where black females in senior management are concerned. Owing to the nature of the
sector, regional stakeholders around the country consistently emphasised the difficulties which mining companies have
always faced where the employment of females is concerned. While these targets are currently still being discussed
between stakeholders at the highest levels, and therefore are not yet finalised, it will be important for the MQA to
begin strategic discussions and planning around possible outcomes, in order to support industry to achieve any new
transformation targets if and when it happens.
2.1.5 Mineral beneficiation
The mining industry value chain has been prioritised as an economic growth node in the New Growth Path, which
highlights a path for the MMS out of its depression until 2020. The Minerals Beneficiation Strategy is aimed at encouraging
the country to move from the sale of commodities to value-added products. The government is currently drafting the
Mineral Beneficiation Action Plan (MBAP), which seeks to advance “local value-addition across five mineral value-
chains, namely; iron-ore and steel, platinum-group metals, polymers, titanium and mining inputs”. The implementation
of the strategy is expected to create and retain much needed jobs in the MMS. However, while mineral beneficiation
has the potential to transform the industry, regional stakeholders believe that not much is being done to implement
numerous undertakings in the past few years. Regional stakeholders expressed the importance of implementing efforts
to beneficiate the country’s minerals and metals, especially during an economic downturn. The MQA needs to maintain
strong relationships with government departments involved in this, to understand its role in responding to any resulting
skills needs.

Page 136 of 191
2.1.6 Environmental sustainability
The industry is becoming more conscious of the growing need to protect the environment, with increased enforcement
of legislation and consumer pressure driving the demand for eco-compliance. Skilled workers will be required in energy
efficiency and sourcing of ‘green’ products and services and managing ‘green’ supply chains. Alternative sources of
energy are also being prioritised owing to the increasing costs of electricity which impact production and profitability.
2.1.7 Community and youth development
Community unrest occurs in mining communities when local skills are not being used for jobs, and when the youth
cannot find jobs elsewhere. Unrest can lead to disruptions in business operations and a resulting decline in productivity.
Regional stakeholders in all provinces advised that training of local skills in communities is hindered by the low levels
of Maths and Science, and general basic education. The MMS particularly in Limpopo, Mpumalanga, Free State and
Eastern Cape has recently faced rising community unrest and disruption to production. The MQA has been encouraged
by stakeholders to include community leaders at all regional engagements, and to increase access to Maths, Science
and bridging programmes.
2.1.8. Labour market (supply of skills)
Regional stakeholders in most provinces advised that certain occupations in the MMS are not attracting as much
interest from the youth as in the past. A large factor is understood to be the unattractive shift hours. This relates to
Boilermaker, Rigger, Diesel Mechanic, Rock Drill Operator, Drill Rig Operator and Mechanical Loader Operator. There
is also a concern that career awareness initiatives do not adequately portray some of the MMS occupations, leading
to misperceptions and/or disinterest from potential learners. This may lead to a situation whereby some or all of these
occupations become scarce to employers. MQA’s career awareness initiatives have the potential to address these
concerns.
2.1.9. Small enterprise development
Enterprise development supports the notion that Small, Medium and Micro-sized Enterprises (SMMEs) should build
sustainable business models given that the gestation period for success in the MMS is long. Enterprise development
creates employment growth opportunities. The MQA Funding Policy for 2016-17 calls for the grant allocations to take
into account SMMEs (companies employing less than 50 employees). The MQA will assist SMMEs with research and
development of appropriate technologies, and by providing training and support so that development is sustainable.
There is potential for the smaller mining provinces to grow given the mineral deposits that have been discovered and
the prospective and mining rights applications which have been lodged with DMR in recent months. Some of these
companies may require development in business management skills to ensure sustainability.
2.2 ALIGNMENT OF NATIONAL STRATEGIES AND PLANS
Each SETA is required to develop an SSP Update within the framework of the National Skills Development Strategy
(NSDS) III as prescribed by the Skills Development Act of 1988, Section 10 as amended (2008). Sector skills planning
in South Africa must take into account a wide range of national policy imperatives that seek to support inclusive
sector growth paths that advance economic growth and the social development and transformation agenda. Table 10
summarises the national policies which guide the strategy and operations of the MQA.
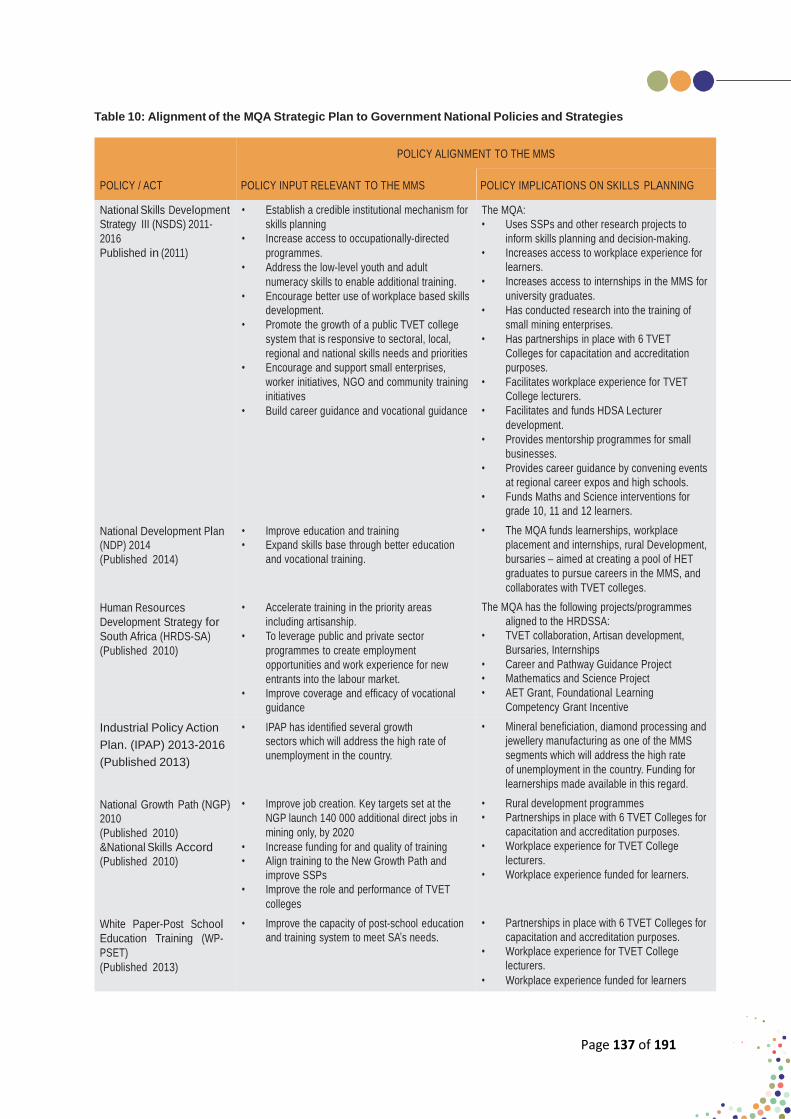
Page 137 of 191
Table 10: Alignment of the MQA Strategic Plan to Government National Policies and Strategies
POLICY ALIGNMENT TO THE MMS
POLICY / ACT POLICY INPUT RELEVANT TO THE MMS POLICY IMPLICATIONS ON SKILLS PLANNING
National Skills Development
Strategy III (NSDS) 2011-
2016
Published in (2011)
National Development Plan
(NDP) 2014
(Published 2014)
Human Resources
Development Strategy for
South Africa (HRDS-SA)
(Published 2010)
Industrial Policy Action
Plan. (IPAP) 2013-2016
(Published 2013)
National Growth Path (NGP)
2010
(Published 2010)
&National Skills Accord
(Published 2010)
White Paper-Post School
Education Training (WP-
PSET)
(Published 2013)
• Establish a credible institutional mechanism for
skills planning
• Increase access to occupationally-directed
programmes.
• Address the low-level youth and adult
numeracy skills to enable additional training.
• Encourage better use of workplace based skills
development.
• Promote the growth of a public TVET college
system that is responsive to sectoral, local,
regional and national skills needs and priorities
• Encourage and support small enterprises,
worker initiatives, NGO and community training
initiatives
• Build career guidance and vocational guidance • Improve education and training
• Expand skills base through better education
and vocational training.
• Accelerate training in the priority areas
including artisanship.
• To leverage public and private sector
programmes to create employment
opportunities and work experience for new
entrants into the labour market.
• Improve coverage and efficacy of vocational
guidance
• IPAP has identified several growth
sectors which will address the high rate of
unemployment in the country.
• Improve job creation. Key targets set at the
NGP launch 140 000 additional direct jobs in
mining only, by 2020
• Increase funding for and quality of training
• Align training to the New Growth Path and
improve SSPs
• Improve the role and performance of TVET
colleges
• Improve the capacity of post-school education
and training system to meet SA’s needs.
The MQA:
• Uses SSPs and other research projects to
inform skills planning and decision-making.
• Increases access to workplace experience for
learners.
• Increases access to internships in the MMS for
university graduates.
• Has conducted research into the training of
small mining enterprises.
• Has partnerships in place with 6 TVET
Colleges for capacitation and accreditation
purposes.
• Facilitates workplace experience for TVET
College lecturers.
• Facilitates and funds HDSA Lecturer
development.
• Provides mentorship programmes for small
businesses.
• Provides career guidance by convening events
at regional career expos and high schools.
• Funds Maths and Science interventions for
grade 10, 11 and 12 learners.
• The MQA funds learnerships, workplace
placement and internships, rural Development,
bursaries – aimed at creating a pool of HET
graduates to pursue careers in the MMS, and
collaborates with TVET colleges.
The MQA has the following projects/programmes
aligned to the HRDSSA:
• TVET collaboration, Artisan development,
Bursaries, Internships
• Career and Pathway Guidance Project
• Mathematics and Science Project
• AET Grant, Foundational Learning
Competency Grant Incentive
• Mineral beneficiation, diamond processing and
jewellery manufacturing as one of the MMS
segments which will address the high rate
of unemployment in the country. Funding for
learnerships made available in this regard.
• Rural development programmes
• Partnerships in place with 6 TVET Colleges for
capacitation and accreditation purposes.
• Workplace experience for TVET College
lecturers.
• Workplace experience funded for learners.
• Partnerships in place with 6 TVET Colleges for
capacitation and accreditation purposes.
• Workplace experience for TVET College
lecturers.
• Workplace experience funded for learners
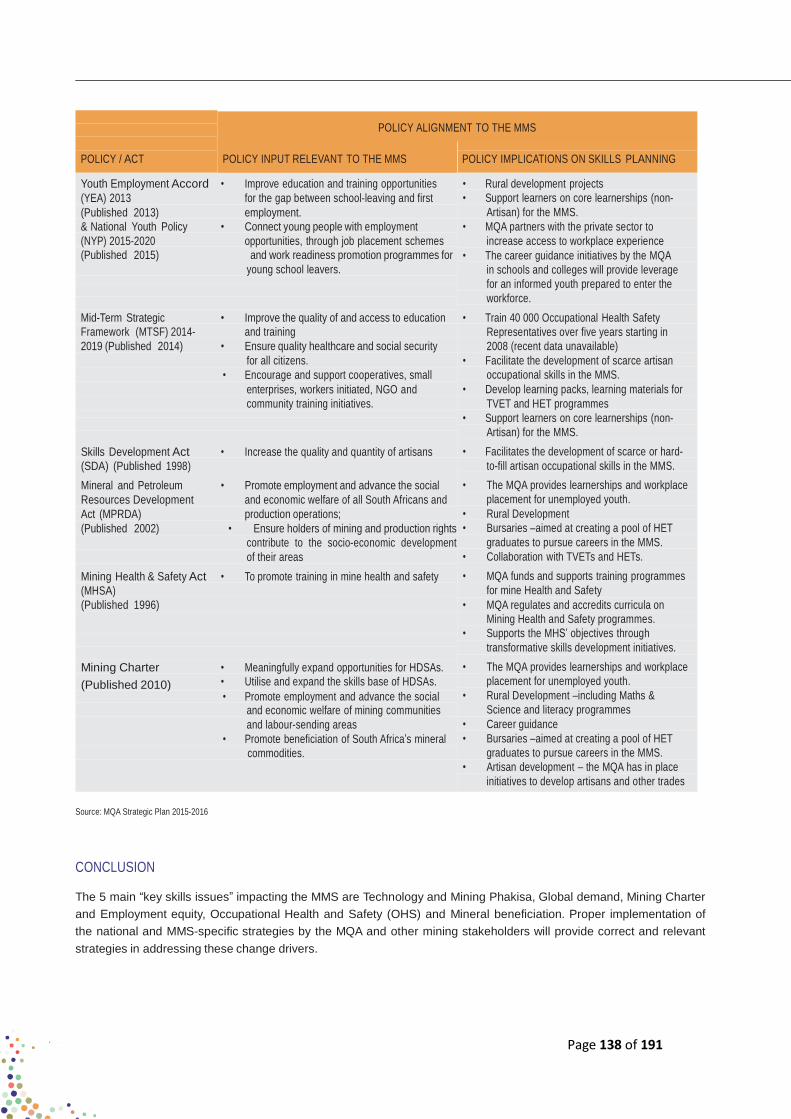
Page 138 of 191
POLICY ALIGNMENT TO THE MMS
POLICY / ACT POLICY INPUT RELEVANT TO THE MMS POLICY IMPLICATIONS ON SKILLS PLANNING
Youth Employment Accord • Improve education and training opportunities
(YEA) 2013 for the gap between school-leaving and first
(Published 2013) employment.
& National Youth Policy • Connect young people with employment
(NYP) 2015-2020 opportunities, through job placement schemes
(Published 2015) and work readiness promotion programmes for
young school leavers.
Mid-Term Strategic • Improve the quality of and access to education
Framework (MTSF) 2014- and training
2019 (Published 2014) • Ensure quality healthcare and social security
for all citizens.
• Encourage and support cooperatives, small
enterprises, workers initiated, NGO and
community training initiatives.
Skills Development Act • Increase the quality and quantity of artisans
(SDA) (Published 1998)
Mineral and Petroleum • Promote employment and advance the social
Resources Development and economic welfare of all South Africans and
Act (MPRDA) production operations;
(Published 2002) • Ensure holders of mining and production rights
contribute to the socio-economic development
of their areas
Mining Health & Safety Act • To promote training in mine health and safety
(MHSA)
(Published 1996)
Mining Charter • Meaningfully expand opportunities for HDSAs.
(Published 2010) • Utilise and expand the skills base of HDSAs. • Promote employment and advance the social
and economic welfare of mining communities
and labour-sending areas
• Promote beneficiation of South Africa’s mineral
commodities.
• Rural development projects
• Support learners on core learnerships (non-
Artisan) for the MMS.
• MQA partners with the private sector to
increase access to workplace experience
• The career guidance initiatives by the MQA
in schools and colleges will provide leverage
for an informed youth prepared to enter the
workforce.
• Train 40 000 Occupational Health Safety
Representatives over five years starting in
2008 (recent data unavailable)
• Facilitate the development of scarce artisan
occupational skills in the MMS.
• Develop learning packs, learning materials for
TVET and HET programmes
• Support learners on core learnerships (non-
Artisan) for the MMS.
• Facilitates the development of scarce or hard-
to-fill artisan occupational skills in the MMS.
• The MQA provides learnerships and workplace
placement for unemployed youth.
• Rural Development
• Bursaries –aimed at creating a pool of HET
graduates to pursue careers in the MMS.
• Collaboration with TVETs and HETs.
• MQA funds and supports training programmes
for mine Health and Safety
• MQA regulates and accredits curricula on
Mining Health and Safety programmes.
• Supports the MHS’ objectives through
transformative skills development initiatives.
• The MQA provides learnerships and workplace
placement for unemployed youth.
• Rural Development –including Maths &
Science and literacy programmes
• Career guidance
• Bursaries –aimed at creating a pool of HET
graduates to pursue careers in the MMS.
• Artisan development – the MQA has in place
initiatives to develop artisans and other trades
Source: MQA Strategic Plan 2015-2016
CONCLUSION
The 5 main “key skills issues” impacting the MMS are Technology and Mining Phakisa, Global demand, Mining Charter
and Employment equity, Occupational Health and Safety (OHS) and Mineral beneficiation. Proper implementation of
the national and MMS-specific strategies by the MQA and other mining stakeholders will provide correct and relevant
strategies in addressing these change drivers.
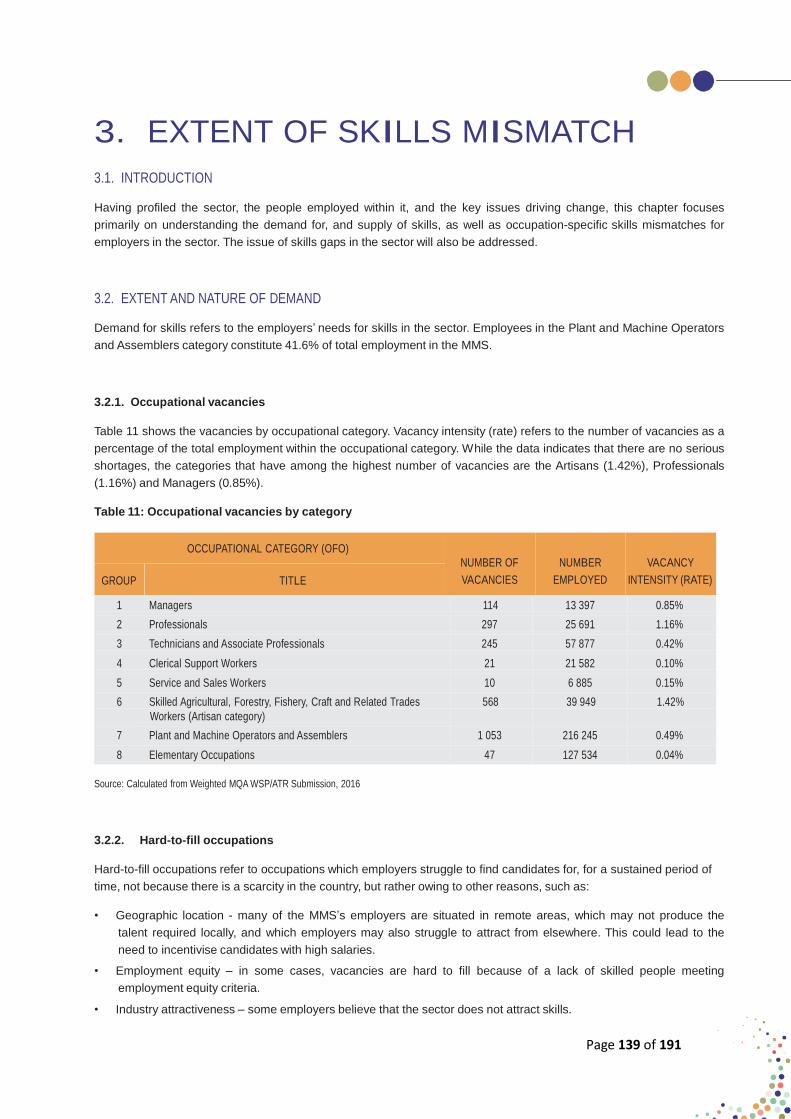
Page 139 of 191
3. EXTENT OF SKILLS MISMATCH
3.1. INTRODUCTION
Having profiled the sector, the people employed within it, and the key issues driving change, this chapter focuses
primarily on understanding the demand for, and supply of skills, as well as occupation-specific skills mismatches for
employers in the sector. The issue of skills gaps in the sector will also be addressed.
3.2. EXTENT AND NATURE OF DEMAND
Demand for skills refers to the employers’ needs for skills in the sector. Employees in the Plant and Machine Operators
and Assemblers category constitute 41.6% of total employment in the MMS.
3.2.1. Occupational vacancies
Table 11 shows the vacancies by occupational category. Vacancy intensity (rate) refers to the number of vacancies as a
percentage of the total employment within the occupational category. While the data indicates that there are no serious
shortages, the categories that have among the highest number of vacancies are the Artisans (1.42%), Professionals
(1.16%) and Managers (0.85%).
Table 11: Occupational vacancies by category
OCCUPATIONAL CATEGORY (OFO)
GROUP TITLE
NUMBER OF
VACANCIES
NUMBER
EMPLOYED
VACANCY
INTENSITY (RATE)
1 Managers 114 13 397 0.85%
2 Professionals 297 25 691 1.16%
3 Technicians and Associate Professionals 245 57 877 0.42%
4 Clerical Support Workers 21 21 582 0.10%
5 Service and Sales Workers 10 6 885 0.15%
6 Skilled Agricultural, Forestry, Fishery, Craft and Related Trades
Workers (Artisan category) 568 39 949 1.42%
7 Plant and Machine Operators and Assemblers 1 053 216 245 0.49%
8 Elementary Occupations 47 127 534 0.04%
Source: Calculated from Weighted MQA WSP/ATR Submission, 2016
3.2.2. Hard-to-fill occupations
Hard-to-fill occupations refer to occupations which employers struggle to find candidates for, for a sustained period of
time, not because there is a scarcity in the country, but rather owing to other reasons, such as:
• Geographic location - many of the MMS’s employers are situated in remote areas, which may not produce the
talent required locally, and which employers may also struggle to attract from elsewhere. This could lead to the
need to incentivise candidates with high salaries.
• Employment equity – in some cases, vacancies are hard to fill because of a lack of skilled people meeting
employment equity criteria.
• Industry attractiveness – some employers believe that the sector does not attract skills.

Page 140 of 191
Table 12 shows the top 10 occupations which employers classify as hard-to-fill, owing to one or a combination of
the above factors. This information is based on extensive research and findings from MQA’s 2015-16 RSSP project,
during which comprehensive and regular engagements were held in every province with representatives from industry,
labour, training providers and government to understand the skills challenges and needs. Expert stakeholders were
also consulted individually to corroborate findings and to determine whether any changes in the skills landscape had
occurred since March 2016 when the last regional engagements were held.
Table 12: Hard-to-fill occupations
NUMBER
HARD-TO-FILL OCCUPATION EMPLOYED VACANCY INTENSITY (RATE)
Mining Manager 132201
Mine Planner 132202
Mining Engineer 214601
Rock Engineer 214601
Surveyor 216502
Rigger Ropesman 651501
Diesel Mechanic 653306
Boilermaker 651302
Instrumentation Mechanician 672105
Fitter 652301
Geographic location, high salary, lack of management skills,
MMCC
Lack of planning & sector experience, lack of HDSAs
Geographic location, high salary, lack of HDSAs, lack of GCC
Geographic location, lack of career awareness at university
Geographic location, lack of experience, lack of GCC
Lack of roping skills, low interest from learners
Lack of knowledge and experience in updated technology, lack
of electrical knowledge. Becoming scarce
Lack of updated technology, declining interest from learners,
declining throughput rates at college, low maths levels
Lack of knowledge and experience in updated technology
Lack of knowledge and experience in updated technology
Source: RSSP workshops and national expert stakeholder consultations 2015-16
3.2.3. Wage trends
Figure 6 shows that before the year 2012, the number of employees in the mining industry was increasing at a faster
rate than the increase in total wage payments. However, the trend was reversed in 2012. Total employment has fallen
by 13.3% from a peak of 524 873 in 2012 to 481 521 in 2015. Overall, total wage bill has increased by 54% from 2010
to 2015. DMR’s annual figures were used.
Figure 7: Number of Employees vs Total Wage Payments
Source: DMR (2010-2015)
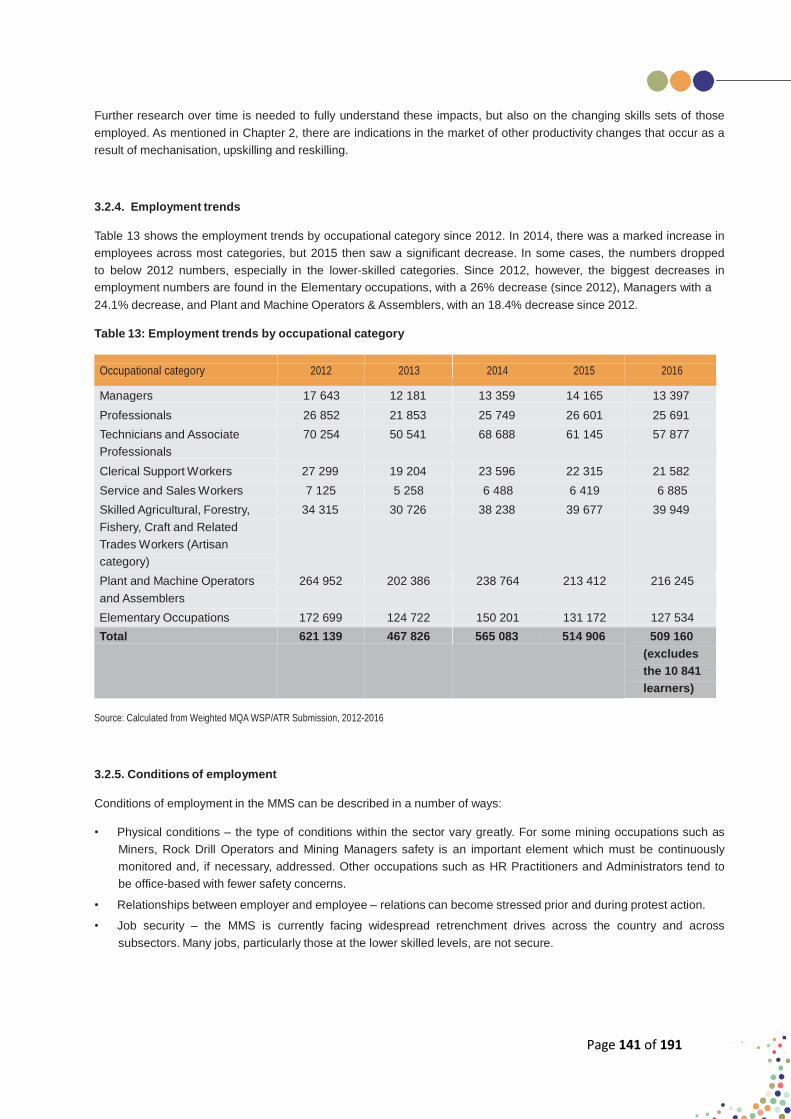
Page 141 of 191
Further research over time is needed to fully understand these impacts, but also on the changing skills sets of those
employed. As mentioned in Chapter 2, there are indications in the market of other productivity changes that occur as a
result of mechanisation, upskilling and reskilling.
3.2.4. Employment trends
Table 13 shows the employment trends by occupational category since 2012. In 2014, there was a marked increase in
employees across most categories, but 2015 then saw a significant decrease. In some cases, the numbers dropped
to below 2012 numbers, especially in the lower-skilled categories. Since 2012, however, the biggest decreases in
employment numbers are found in the Elementary occupations, with a 26% decrease (since 2012), Managers with a
24.1% decrease, and Plant and Machine Operators & Assemblers, with an 18.4% decrease since 2012.
Table 13: Employment trends by occupational category
Occupational category
2012
2013
2014
2015
2016
Managers 17 643 12 181 13 359 14 165 13 397
Professionals 26 852 21 853 25 749 26 601 25 691
Technicians and Associate
Professionals
70 254 50 541 68 688 61 145 57 877
Clerical Support Workers 27 299 19 204 23 596 22 315 21 582
Service and Sales Workers 7 125 5 258 6 488 6 419 6 885
Skilled Agricultural, Forestry,
Fishery, Craft and Related
Trades Workers (Artisan
category)
34 315 30 726 38 238 39 677 39 949
Plant and Machine Operators
and Assemblers
264 952 202 386 238 764 213 412 216 245
Elementary Occupations 172 699 124 722 150 201 131 172 127 534
Total 621 139 467 826 565 083 514 906 509 160
(excludes
the 10 841
learners)
Source: Calculated from Weighted MQA WSP/ATR Submission, 2012-2016
3.2.5. Conditions of employment
Conditions of employment in the MMS can be described in a number of ways:
• Physical conditions – the type of conditions within the sector vary greatly. For some mining occupations such as
Miners, Rock Drill Operators and Mining Managers safety is an important element which must be continuously
monitored and, if necessary, addressed. Other occupations such as HR Practitioners and Administrators tend to
be office-based with fewer safety concerns.
• Relationships between employer and employee – relations can become stressed prior and during protest action.
• Job security – the MMS is currently facing widespread retrenchment drives across the country and across
subsectors. Many jobs, particularly those at the lower skilled levels, are not secure.

Page 142 of 191
3.2.6. Migration
Bilateral labour agreements between South Africa and numerous countries in Southern Africa allow for mining
companies to employ workers with Southern African Development Community origin, thus allowing for diversity of skills
in the sector. Table 14 shows the number of foreigners employed in each occupational category.
Table 14: Foreign skills
OCCUPATIONAL CATEGORY (OFO)
GROUP TITLE
TOTAL EMPLOYED
IN THE MMS
NUMBER OF
FOREIGNERS
EMPLOYED IN
OCCUPATION
GROUP
PERCENTAGE OF
FOREIGNERS TO
TOTAL EMPLOYED
IN OCCUPATION
GROUP
1 Managers 13 397 423 3.16%
2 Professionals 25 691 812 3.16%
3 Technicians and Associate Professionals 57 877 4 921 8.50%
4 Clerical Support Workers 21 582 434 2.01%
5 Service and Sales Workers 6 885 264 3.84%
6 Skilled Agricultural, Forestry, Fishery, Craft and Related Trades
Workers (Artisan category)
39 949 1 104 2.76%
7 Plant and Machine Operators and Assemblers 216 245 38 879 17.98%
8 Elementary Occupations 127 534 13 655 10.71%
Source: Calculated from Weighted MQA WSP/ATR Submission, 2016
Table 14 reveals that the occupational categories with the highest number of foreigners are Plant and Machine Operators
and Assemblers (17.98%), Elementary Occupations (10.71%), and Technicians and Associate Professionals (Miners
fall into this category) (8.5%). The use of migrant workers, highest in the 2 lowest-skilled categories where Table 13
showed that some of the biggest drops in employment numbers have occurred since 2012, has been raised by some
of the MQA’s Skills Research and Planning Committee members as being a possible area requiring further discussion
and research.
3.3. EXTENT AND NATURE OF SUPPLY
The future growth prospects of a sector are dependent on the availability of appropriate and affordable skills, therefore
an analysis of the supply-side is necessary. Data received from the MQA, DMR, DHET and Chamber of Mines on
education and training, as well as comments from stakeholders at numerous national and regional meetings held
between June 2015 and May 2016, were analysed for this section.
3.3.1. Current state of education and training provision
The skills required for the MMS are produced at school, TVET Colleges, private Training Providers, Universities of
Technology, Universities as well as workplaces themselves.
3.3.1.1. Basic education
3.3.1.1.1. Overview of the basic education
The skills available to the sector consist of people currently employed, as well as those that are unemployed but
available for work. Chapter 1’s labour market profile showed that the biggest proportion of workers (47%) have
achieved the equivalent of Grades 10 - 12 as their highest level of education. However, stakeholders at every regional
Page 143 of 191
meeting expressed concern at the quality of basic education in the country. Many occupations within the MMS require a
foundation of good quality Maths and Science, which for the majority of the population is lacking, even when Grade 12
has been completed. South Africa has one of the highest rates of public investment in education in the world. At about
7% of gross domestic product (GDP) and 20% of total state expenditure, the government spends more on education
than on any other sector. School infrastructure has been a persistent challenge for many rural provinces and a fair
portion of the Department of Basic Education’s budget will be channeled to rural school infrastructure. The NDP calls
for 450 000 Grade 12 learners to achieve university entrance passes with Maths and Physical Science in 2030. But
the intake for these subjects at high school has been slow. Although the national Grade 12 pass rate has improved
somewhat in recent years, questions remain about the quality of the Grade 12 certificate, especially considering that
learners need to score only 30% to pass some subjects. National and regional stakeholders believe that many learners
struggle with the National Certificate Vocational (NCV) subjects at TVET Colleges because their basic education has
been poor. It is believed that when this has been resolved, much of the current training requirements which employers
and the MQA have to fund will become unnecessary.
Employees whose highest level of education is between Grades 4 and 9 constitute 22% of the sector. This range includes
AET levels 1 – 4. As discussed in Chapter 2, given that changing technology and Mining Phakisa’s mechanisation
goals will lead to a need for upskilling of many current and future employees in the areas of machine operations and
maintenance, it will be important for stakeholders in the sector to prioritise the funding of AET training, up to and
including level 4. This will help to develop adequate literacy and numeracy levels for industry’s emerging new skills
requirements. MQA’s WSP/AR submissions show that employers in the sector do offer training on AET 1 – 4 for their
employees. In 2015-16 a total of 4 333 employees received 1 or more levels of AET training.
3.3.1.1.2. MQA interventions to address challenges at basic education level
The MQA, in consultation with the MMS, has been developing skills interventions over the years to meet the scarce and
critical skills needs in the sector, at various levels of education.
3.3.1.1.3. MQA interventions in basic education: Maths and Science programmes
The MQA has developed an intervention which aims to address the poor quality of Maths and Science at basic education
level. It supports Grades 10, 11 and 12 learners to successfully complete Maths and Science. In 2015-16 the MQA
committed to support 1,000 learners, which was successfully achieved with a total of 1,010 learners supported in this
programme. Stakeholders during the RSSP project suggested that these programmes be monitored for impact, and
that the learnings be incorporated into the programmes to ensure effectiveness. A popular suggestion from national and
regional stakeholders was to focus efforts on the development of teachers, as well as focus on fewer beneficiaries, to
ensure impact. It was widely suggested that considerable funding be directed at those who are applying for bursaries,
and as a condition before commencement of studies.
3.3.1.1.4. MQA interventions in basic education: Career awareness
Stakeholders in the sector widely believe that career guidance initiatives should be taking place before Grade 10,
when learners need to decide their subjects, including whether or not to drop Maths and replace it with Maths Literacy.
There is a lack of informative career guidance for the majority of the population which would help a person understand
the variety of career options and career progression opportunities that are available. In 2015-16 the MQA committed
to target 10 000 learners to attend its career guidance workshops, the aim of which is to provide comprehensive
information on careers and pathways in the sector and to correct any misperceptions about mining occupations, as the
MMS is not perceived to be an attractive industry to work in. This target was exceeded by a substantial amount – a total
of 13 871 delegates attended, the reason being an unexpected public response to the activities. Regional stakeholders
during the RSSP project emphasised the role of career guidance in creating awareness and knowledge around the
diverse mining career options available, as well as in providing information on the importance of pursuing Maths and

Page 144 of 191
Science until Grade 12 (including the consequences on future career prospects if not done). Career awareness events
should provide sufficient detail so that a person is empowered to make an informed decision regarding whether or not
the career might be suited to them or not, and whether or not the mining industry is attractive to them, thus potentially
avoiding career changes and unnecessary training expenditure at a later stage. Regional stakeholders suggested that
this initiative should be monitored for impact, and that an increase in events at high schools be undertaken if possible.
3.3.1.2. TVET college sector
TVET colleges form a critical component of the current training capacity of skills for the sector. Programmes include
NCV, Nated (mainly for artisan development), skills programmes, learnerships and short courses. Many MMS-related
skills are developed at this level of education, covering a variety of mining operations including blasting, excavations,
metallurgy and engineering. Practical training at college workshops and on-the-job workplace experience are an
important component of this level.
The main concern at this level was stated by regional stakeholders as being that many learners are not adequately work-
ready upon graduating, particularly artisans. While employers appreciate the need to carry a measure of responsibility
for the training of graduates to develop company-specific skills, indications are that many colleges’ workshops are not
equipped enough to provide adequate practical training required for the completion of qualifications, and curricula are
for the most part not believed to be updated with latest technologies being used in the sector.
Below is a summary of the MQA’s skills development interventions at the TVET college sector level to assist industry
in meeting its skills requirements.
3.3.1.2.1. MQA interventions at TVET college: Learnerships (non-artisan)
Figure 7 shows the Annual Targets versus Actual Achievements for 2015-16 where learnerships are concerned,
excluding artisans. A total of 3 624 learners registered for MQA-funded non-artisan learnerships, which is 76% of MQA’s
target; 682 unemployed learners completed non-artisan learnerships during the year, a 68% achievement of the target;
and 1 881 employed learners completed non-artisan learnerships during the year, which exceeded the target at 131%.
Figure 8: MQA Learnerships (excluding artisan): Target vs Actual 2015-2016
Source: MQA database (2016)
Figure 8 shows the Top 10 learnerships (excluding artisans) completed by unemployed and employed learners in 2015-
16. The top 3 concern core mining skills at stage 1 of mining activities. With many subsectors in the MMS undergoing
retrenchment drives, there is currently very little indication of a shortage in the skills supplied in the TVET College
sector, with the exception of a lack of practical experience and knowledge in new technologies.
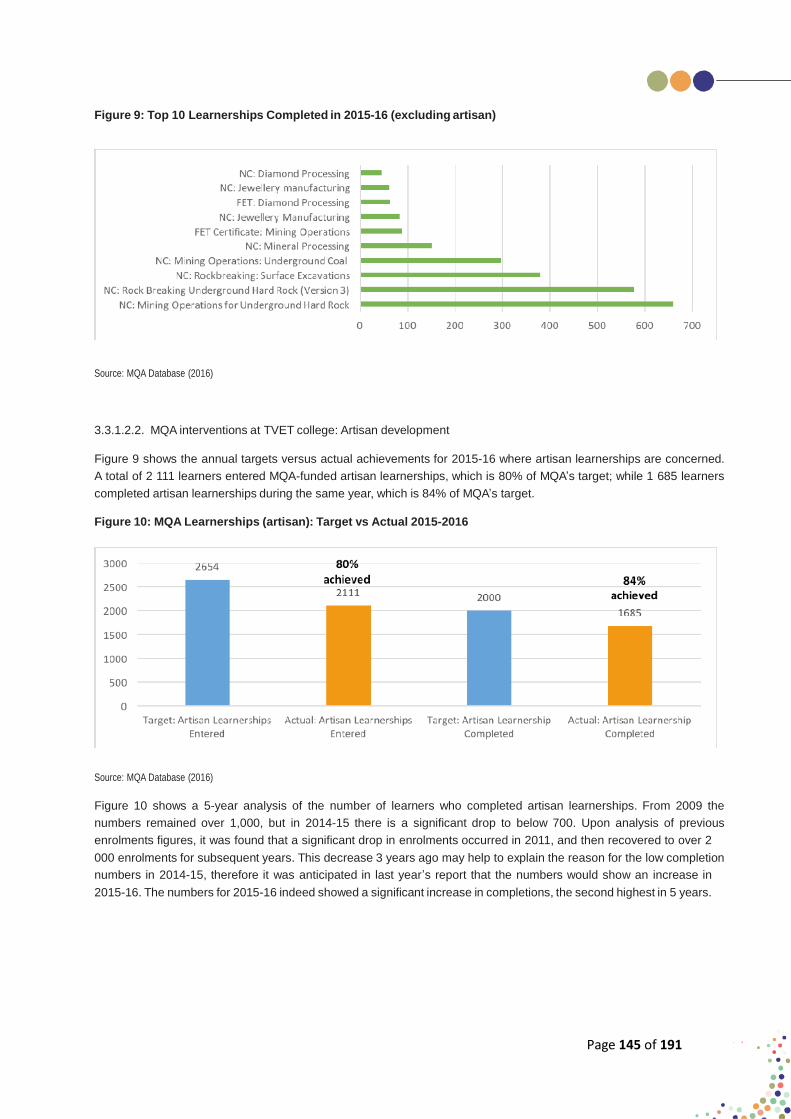
Page 145 of 191
Figure 9: Top 10 Learnerships Completed in 2015-16 (excluding artisan)
Source: MQA Database (2016)
3.3.1.2.2. MQA interventions at TVET college: Artisan development
Figure 9 shows the annual targets versus actual achievements for 2015-16 where artisan learnerships are concerned.
A total of 2 111 learners entered MQA-funded artisan learnerships, which is 80% of MQA’s target; while 1 685 learners
completed artisan learnerships during the same year, which is 84% of MQA’s target.
Figure 10: MQA Learnerships (artisan): Target vs Actual 2015-2016
Source: MQA Database (2016)
Figure 10 shows a 5-year analysis of the number of learners who completed artisan learnerships. From 2009 the
numbers remained over 1,000, but in 2014-15 there is a significant drop to below 700. Upon analysis of previous
enrolments figures, it was found that a significant drop in enrolments occurred in 2011, and then recovered to over 2
000 enrolments for subsequent years. This decrease 3 years ago may help to explain the reason for the low completion
numbers in 2014-15, therefore it was anticipated in last year’s report that the numbers would show an increase in
2015-16. The numbers for 2015-16 indeed showed a significant increase in completions, the second highest in 5 years.
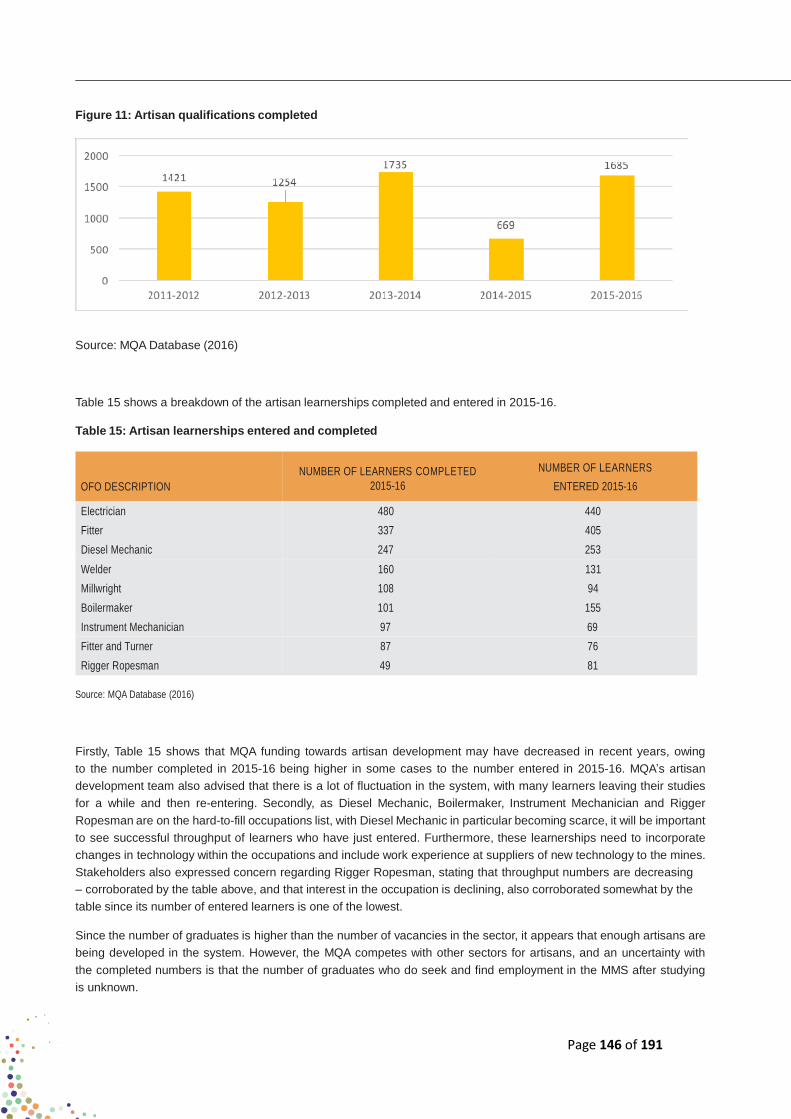
Page 146 of 191
Figure 11: Artisan qualifications completed
Source: MQA Database (2016)
Table 15 shows a breakdown of the artisan learnerships completed and entered in 2015-16.
Table 15: Artisan learnerships entered and completed
OFO DESCRIPTION
NUMBER OF LEARNERS COMPLETED
2015-16
NUMBER OF LEARNERS
ENTERED 2015-16
Electrician 480 440
Fitter 337 405
Diesel Mechanic 247 253
Welder 160 131
Millwright 108 94
Boilermaker 101 155
Instrument Mechanician 97 69
Fitter and Turner 87 76
Rigger Ropesman 49 81
Source: MQA Database (2016)
Firstly, Table 15 shows that MQA funding towards artisan development may have decreased in recent years, owing
to the number completed in 2015-16 being higher in some cases to the number entered in 2015-16. MQA’s artisan
development team also advised that there is a lot of fluctuation in the system, with many learners leaving their studies
for a while and then re-entering. Secondly, as Diesel Mechanic, Boilermaker, Instrument Mechanician and Rigger
Ropesman are on the hard-to-fill occupations list, with Diesel Mechanic in particular becoming scarce, it will be important
to see successful throughput of learners who have just entered. Furthermore, these learnerships need to incorporate
changes in technology within the occupations and include work experience at suppliers of new technology to the mines.
Stakeholders also expressed concern regarding Rigger Ropesman, stating that throughput numbers are decreasing
– corroborated by the table above, and that interest in the occupation is declining, also corroborated somewhat by the
table since its number of entered learners is one of the lowest.
Since the number of graduates is higher than the number of vacancies in the sector, it appears that enough artisans are
being developed in the system. However, the MQA competes with other sectors for artisans, and an uncertainty with
the completed numbers is that the number of graduates who do seek and find employment in the MMS after studying
is unknown.

Page 147 of 191
3.3.1.2.3. MQA interventions at TVET college: Practical training and workplace exposure
According to the National Skills Accord between industry and government, SETAs need to facilitate the placement
of TVET College and university students into industry. In 2015-16 the MQA had a target to place 500 TVET NCV
learners with host employers, with 529 being successfully placed. The target for P1 and P2 training for the University
of Technikon students was also successfully achieved, with the target of 650 exceeded by 80, as well as internships for
University graduates (target of 450 was exceeded by 88).
To help alleviate the burden on employers to mentor learners, the MQA has introduced an initiative to place coaches
within workplaces to support employers with on-the-job mentoring and coaching activities. The target for 2016-17 is to
place 50 coaches in companies for this purpose.
Suggestions from stakeholders included that the focus on TVET Colleges should be on lecturer development. These
suggestions are currently being addressed by the MQA, which has a programme to place lecturers in companies for
workplace exposure. In 2015-16 the MQA’s target of placing 20 lecturers was successfully achieved.
3.3.1.3. MQA-Accredited Training Providers
As of April 2016, there were a total of 150 Training Providers which were fully accredited by the MQA, meaning that they
focus on MMS-related qualifications, with another 33 offering a few MQA-approved programmes. Training providers at
regional workshops expressed that the process of gaining accreditation is sometimes very lengthy which impedes the
speed at which skills can be developed in the MMS.
3.3.1.4. Employer training reported on WSP-ATR
Companies in the sector contribute much to the development of skills for employees. Over 1 million training programmes
were completed by employees in 2015-16. They varied greatly in type, from job-specific development programmes to
learnerships, with the 3 most common being short courses (a total of 279 225 completed), induction training (243 443)
and refresher/ex-leave training (163 479).
Upon deeper analysis of the different types of short courses completed, it was found that while many of them were not
specified in the WSPs, among the highest were Rock Engineering Strata Control Operations, Occupational Health &
Safety, and Blasting Assistant within Underground Hard Rock.
There were 5 868 employees impacted by MQA learnerships. A further 353 learnerships were programmes from other
SETAs, such as:
• CETA: Refractories Installer (Site Assistance) Level 2
• CHIETA: Chemical Boilermaker Level 4
• ESETA: National Certificate in Electrical Engineering (Generation) Level 3
• ETDP: National Certificate: Occupationally Directed Education, Training and Development Practices Level 6
• FASSET: Certificate: Certified Accounting Technician Level 5
• INSETA: GUI Based Applications for End-user Computing Level 3
• merSETA: Further Education and Training Certificate: Automotive Repair and Maintenance (Earthmoving
Equipment) Level 4
• SERVICES SETA: First Line Manager Level 5
• TETA: National Certificate in Freight Handling, Warehousing & Distribution Level 3
This reinforces the importance of ongoing collaboration between the MQA and other SETAs.
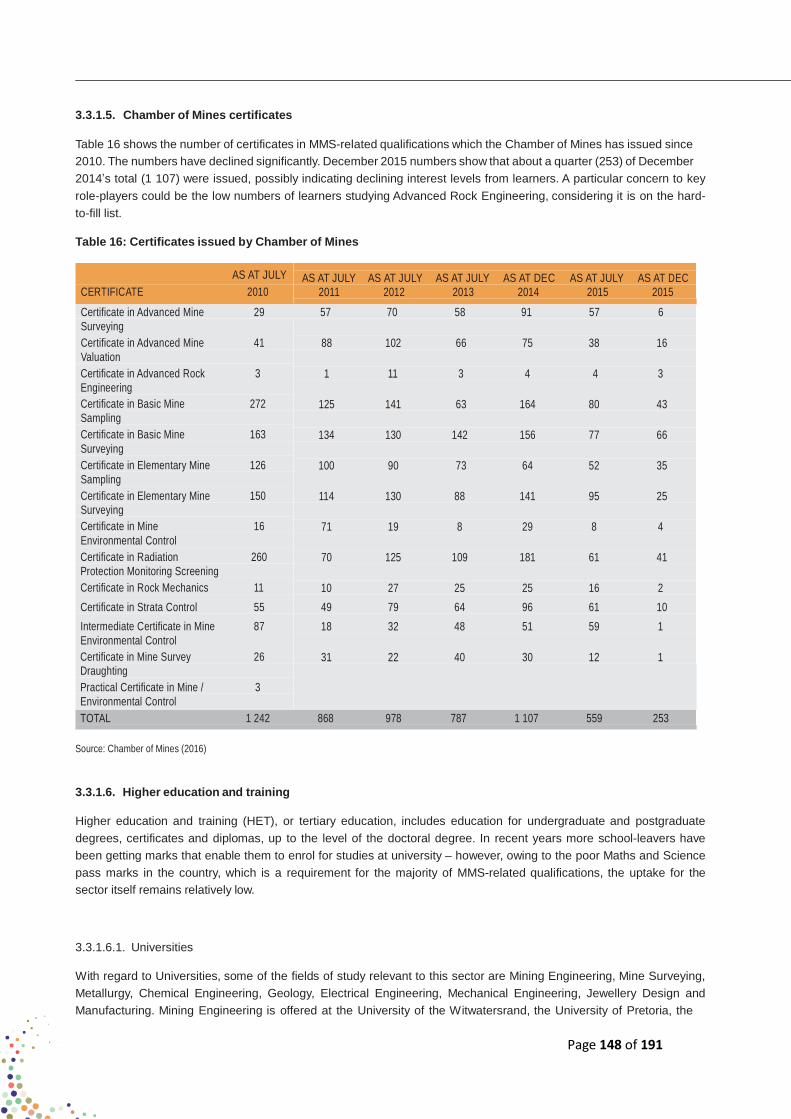
Page 148 of 191
3.3.1.5. Chamber of Mines certificates
Table 16 shows the number of certificates in MMS-related qualifications which the Chamber of Mines has issued since
2010. The numbers have declined significantly. December 2015 numbers show that about a quarter (253) of December
2014’s total (1 107) were issued, possibly indicating declining interest levels from learners. A particular concern to key
role-players could be the low numbers of learners studying Advanced Rock Engineering, considering it is on the hard-
to-fill list.
Table 16: Certificates issued by Chamber of Mines
AS AT JULY
CERTIFICATE 2010
AS AT JULY AS AT JULY AS AT JULY AS AT DEC AS AT JULY AS AT DEC
2011 2012 2013 2014 2015 2015
Certificate in Advanced Mine 29 57 70 58 91 57 6
Surveying
Certificate in Advanced Mine 41
Valuation
Certificate in Advanced Rock 3
Engineering
Certificate in Basic Mine 272
Sampling
Certificate in Basic Mine 163
Surveying
Certificate in Elementary Mine 126
Sampling
Certificate in Elementary Mine 150
Surveying
Certificate in Mine 16
Environmental Control
Certificate in Radiation 260
Protection Monitoring Screening
Certificate in Rock Mechanics 11
Certificate in Strata Control 55
Intermediate Certificate in Mine 87
Environmental Control
Certificate in Mine Survey 26
Draughting
Practical Certificate in Mine / 3
Environmental Control
88 102 66 75 38 16
1 11 3 4 4 3
125 141 63 164 80 43
134 130 142 156 77 66
100 90 73 64 52 35
114 130 88 141 95 25
71 19 8 29 8 4
70 125 109 181 61 41
10 27 25 25 16 2
49 79 64 96 61 10
18 32 48 51 59 1
31 22 40 30 12 1
TOTAL 1 242 868 978 787 1 107 559 253
Source: Chamber of Mines (2016)
3.3.1.6. Higher education and training
Higher education and training (HET), or tertiary education, includes education for undergraduate and postgraduate
degrees, certificates and diplomas, up to the level of the doctoral degree. In recent years more school-leavers have
been getting marks that enable them to enrol for studies at university – however, owing to the poor Maths and Science
pass marks in the country, which is a requirement for the majority of MMS-related qualifications, the uptake for the
sector itself remains relatively low.
3.3.1.6.1. Universities
With regard to Universities, some of the fields of study relevant to this sector are Mining Engineering, Mine Surveying,
Metallurgy, Chemical Engineering, Geology, Electrical Engineering, Mechanical Engineering, Jewellery Design and
Manufacturing. Mining Engineering is offered at the University of the Witwatersrand, the University of Pretoria, the
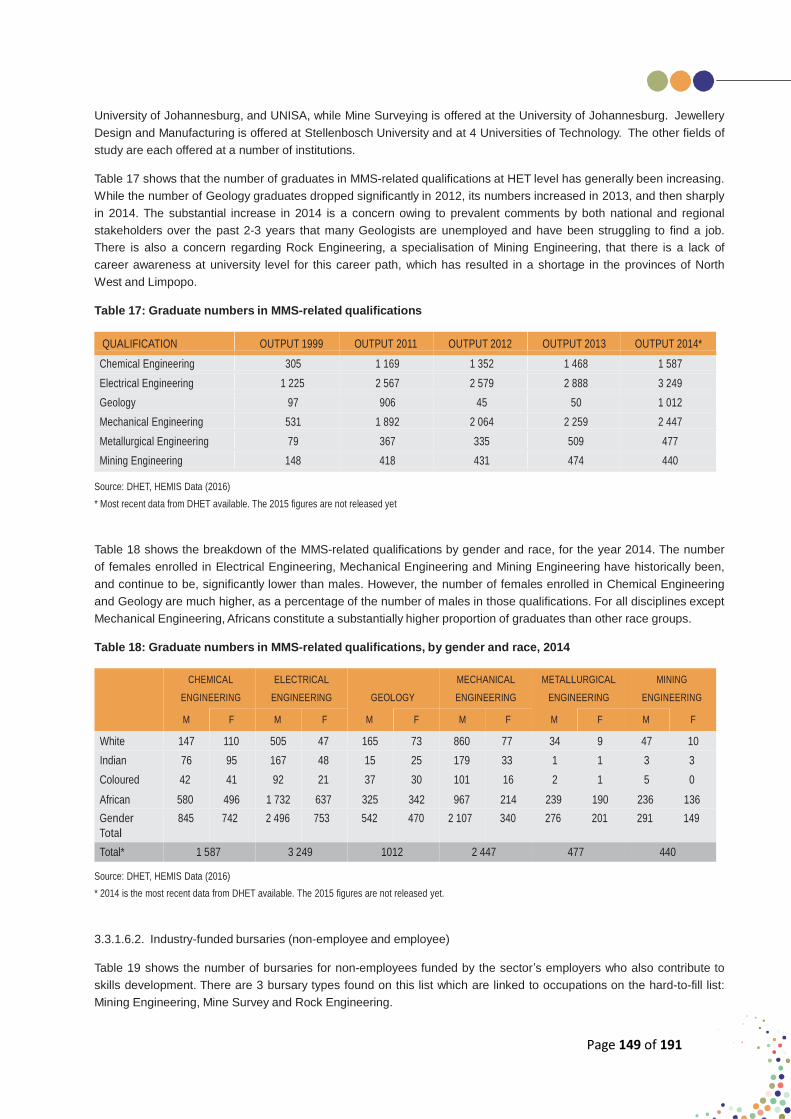
Page 149 of 191
University of Johannesburg, and UNISA, while Mine Surveying is offered at the University of Johannesburg. Jewellery
Design and Manufacturing is offered at Stellenbosch University and at 4 Universities of Technology. The other fields of
study are each offered at a number of institutions.
Table 17 shows that the number of graduates in MMS-related qualifications at HET level has generally been increasing.
While the number of Geology graduates dropped significantly in 2012, its numbers increased in 2013, and then sharply
in 2014. The substantial increase in 2014 is a concern owing to prevalent comments by both national and regional
stakeholders over the past 2-3 years that many Geologists are unemployed and have been struggling to find a job.
There is also a concern regarding Rock Engineering, a specialisation of Mining Engineering, that there is a lack of
career awareness at university level for this career path, which has resulted in a shortage in the provinces of North
West and Limpopo.
Table 17: Graduate numbers in MMS-related qualifications
QUALIFICATION OUTPUT 1999 OUTPUT 2011 OUTPUT 2012 OUTPUT 2013 OUTPUT 2014*
Chemical Engineering 305 1 169 1 352 1 468 1 587
Electrical Engineering 1 225 2 567 2 579 2 888 3 249
Geology 97 906 45 50 1 012
Mechanical Engineering 531 1 892 2 064 2 259 2 447
Metallurgical Engineering 79 367 335 509 477
Mining Engineering 148 418 431 474 440
Source: DHET, HEMIS Data (2016)
* Most recent data from DHET available. The 2015 figures are not released yet
Table 18 shows the breakdown of the MMS-related qualifications by gender and race, for the year 2014. The number
of females enrolled in Electrical Engineering, Mechanical Engineering and Mining Engineering have historically been,
and continue to be, significantly lower than males. However, the number of females enrolled in Chemical Engineering
and Geology are much higher, as a percentage of the number of males in those qualifications. For all disciplines except
Mechanical Engineering, Africans constitute a substantially higher proportion of graduates than other race groups.
Table 18: Graduate numbers in MMS-related qualifications, by gender and race, 2014
CHEMICAL
ENGINEERING
ELECTRICAL
ENGINEERING GEOLOGY
MECHANICAL
ENGINEERING
METALLURGICAL
ENGINEERING
MINING
ENGINEERING
M F M F M F M F M F M F
White 147 110 505 47 165 73 860 77 34 9 47 10
Indian 76 95 167 48 15 25 179 33 1 1 3 3
Coloured 42 41 92 21 37 30 101 16 2 1 5 0
African 580 496 1 732 637 325 342 967 214 239 190 236 136
Gender
Total
845 742 2 496 753 542 470 2 107 340 276 201 291 149
Total* 1 587 3 249 1012 2 447 477 440
Source: DHET, HEMIS Data (2016)
* 2014 is the most recent data from DHET available. The 2015 figures are not released yet.
3.3.1.6.2. Industry-funded bursaries (non-employee and employee)
Table 19 shows the number of bursaries for non-employees funded by the sector’s employers who also contribute to
skills development. There are 3 bursary types found on this list which are linked to occupations on the hard-to-fill list:
Mining Engineering, Mine Survey and Rock Engineering.

Page 150 of 191
Table 19: Non-employee bursaries funded by employers
PROGRAMME TYPE
NUMBER OF BURSARIES
(AS OF 31ST MAY 2016)
Mining Engineering 241
Mechanical Engineering 173
Metallurgy 107
Electrical Engineering (Heavy Current Only) 77
Geology 66
Chemical Engineering 60
Mine Survey 35
Environmental Health and Management 17
Rock Engineering 11
Industrial Engineering 9
Analytical Chemistry 7
Electrical Engineering 4
Civil Engineering 2
Mine Environmental Control 2
Bio Chemistry 1
Surveying 1
Other 1 056
Total 1 869
Source: Calculated from Weighted MQA WSP/ATR Submission, 2015-2016
Table 20 shows the number of study-assistance programmes funded by the sector’s employers for their employees.
While these programmes are usually employee-driven, it is noteworthy that a relatively high percentage (12%) of
bursaries is being directed towards Industrial Engineering, given stakeholders’ concerns over rising costs and the
ongoing need to optimise operations.
Table 20: Employee study-assistance programmes funded by employers
NUMBER OF STUDY-ASSISTANCE
PROGRAMME TYPE PROGRAMMES
Industrial Engineering 303
Chemical Engineering 195
Electrical Engineering (Heavy Current Only) 176
Geology 153
Mining Engineering 70
Mechanical Engineering 55
Metallurgy 33
Environmental Health and Management 37
Analytical Chemistry 11
Mine Surveying 8
Jewellery Design Manufacturing 1
Other (unspecified) 1 475
TOTAL 2 517
Source: Calculated from Weighted MQA WSP/ATR Submission, 2016

Page 151 of 191
3.3.1.6.3. MQA interventions at HET level
The MQA has a bursary scheme for tertiary studies. It applies to:
• Students entering their first year of study who possess a South African Matriculation Certificate (or an evaluated
equivalent qualification) in the subjects and with subject grades that are required by the academic institution (or
such equivalent qualification as that the institution may determine), for undergraduate studies;
• Bursars entering their second or third year of study who meet the requirements as specified under the “Bursary
Continuation, Suspension and Reinstatement” principles contained in this policy;
• Students studying towards a University or University of Technology (Degree, Diploma and B Tech).
In 2015-16, the MQA’s Annual Performance Plan (APP) required that 1 000 bursaries during the year be provided
to unemployed learners for MMS-related qualifications. This target was achieved and exceeded by 672, due to
overwhelming response from students requiring study assistance. The annual target of 150 for completed programmes
was also exceeded, with 265 learners completing their studies. The MQA benchmarks its target throughput rate against
educational institutions, which is said to be between 15% and 20%. Table 21 shows the current MQA-funded bursars
in the system.
Table 21: MQA-funded bursars
STUDY DISCIPLINE 1st YR 2nd YR 3rd YR 4th YR B. TECH HON MASTERS N1 - N5 NCV2-4 TOTAL
Mining Engineering 86 90 102 29 28 - - - - 335
Mechanical Engineering 60 72 59 11 20 - 1 17 - 241
Electrical Engineering 55 47 26 3 16 - 1 45 5 199
Chemical Engineering 26 46 56 20 27 - - 1 - 177
Metallurgical Engineering 35 47 44 3 44 1 1 - - 176
Geology 38 60 28 10 2 7 1 - - 147
Environmental Studies 6 53 42 3 11 - - - - 115
Industrial Engineering 19 35 40 8 7 - - - - 108
Analytical Chemistry 9 29 29 6 6 1 1 - - 81
Other (Ns and NCV) 3 5 1 - - - - 11 10 30
Jewellery Design - 12 12 5 - - - - - 29
Mining Surveying 5 6 6 - 3 - - - - 19
TOTAL 342 504 445 99 165 9 6 75 15 1 659
Percentage 21% 30% 27% 6% 10% 1% 0% 4% 1% 100%
Source: MQA database (2016)
Table 21 shows that 2 of the occupations on the hard-to-fill list, Mining Engineering and Mining Surveying, have bursars
currently in the system (335 and 19 respectively). With regard to Mining Engineering, while this represents the highest
proportion of bursaries issued by the MQA (20.2%), it will be important for the MQA to create awareness about the
specialisation of Rock Engineering among those pursuing this qualification, as a lack of career awareness is widely
held by stakeholders to be the main reason for a shortage of Rock Engineers in the sector. However, the number of
Mining Surveying bursars is low and may need to be addressed by the MQA. In contrast, the high number of Geology
bursars in the system (147 in total), (the majority (66.7%) of which are in first and second year of studies), may need
to be addressed by the MQA owing to stakeholders concerns over the past 2-3 years that large numbers of graduates
cannot find work.
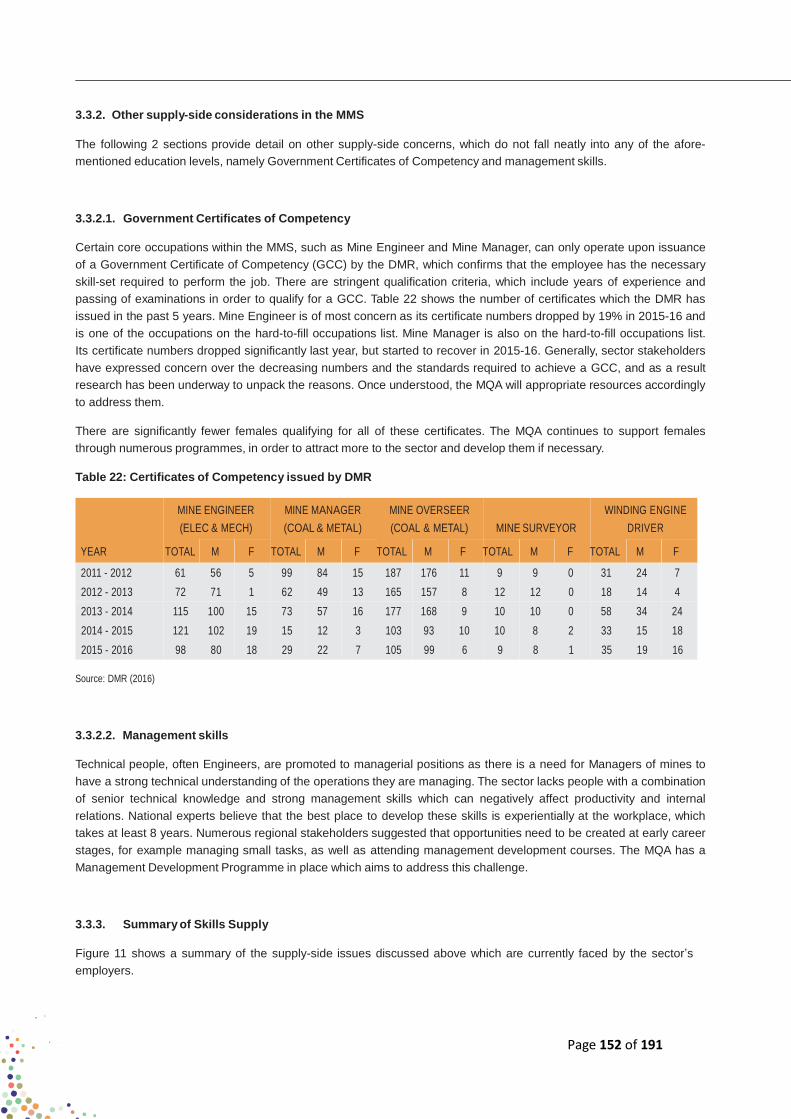
Page 152 of 191
3.3.2. Other supply-side considerations in the MMS
The following 2 sections provide detail on other supply-side concerns, which do not fall neatly into any of the afore-
mentioned education levels, namely Government Certificates of Competency and management skills.
3.3.2.1. Government Certificates of Competency
Certain core occupations within the MMS, such as Mine Engineer and Mine Manager, can only operate upon issuance
of a Government Certificate of Competency (GCC) by the DMR, which confirms that the employee has the necessary
skill-set required to perform the job. There are stringent qualification criteria, which include years of experience and
passing of examinations in order to qualify for a GCC. Table 22 shows the number of certificates which the DMR has
issued in the past 5 years. Mine Engineer is of most concern as its certificate numbers dropped by 19% in 2015-16 and
is one of the occupations on the hard-to-fill occupations list. Mine Manager is also on the hard-to-fill occupations list.
Its certificate numbers dropped significantly last year, but started to recover in 2015-16. Generally, sector stakeholders
have expressed concern over the decreasing numbers and the standards required to achieve a GCC, and as a result
research has been underway to unpack the reasons. Once understood, the MQA will appropriate resources accordingly
to address them.
There are significantly fewer females qualifying for all of these certificates. The MQA continues to support females
through numerous programmes, in order to attract more to the sector and develop them if necessary.
Table 22: Certificates of Competency issued by DMR
MINE ENGINEER
(ELEC & MECH)
MINE MANAGER
(COAL & METAL)
MINE OVERSEER
(COAL & METAL) MINE SURVEYOR
WINDING ENGINE
DRIVER
YEAR TOTAL M F TOTAL M F TOTAL M F TOTAL M F TOTAL M F
2011 - 2012 61 56 5 99 84 15 187 176 11 9 9 0 31 24 7
2012 - 2013 72 71 1 62 49 13 165 157 8 12 12 0 18 14 4
2013 - 2014 115 100 15 73 57 16 177 168 9 10 10 0 58 34 24
2014 - 2015 121 102 19 15 12 3 103 93 10 10 8 2 33 15 18
2015 - 2016 98 80 18 29 22 7 105 99 6 9 8 1 35 19 16
Source: DMR (2016)
3.3.2.2. Management skills
Technical people, often Engineers, are promoted to managerial positions as there is a need for Managers of mines to
have a strong technical understanding of the operations they are managing. The sector lacks people with a combination
of senior technical knowledge and strong management skills which can negatively affect productivity and internal
relations. National experts believe that the best place to develop these skills is experientially at the workplace, which
takes at least 8 years. Numerous regional stakeholders suggested that opportunities need to be created at early career
stages, for example managing small tasks, as well as attending management development courses. The MQA has a
Management Development Programme in place which aims to address this challenge.
3.3.3. Summary of Skills Supply
Figure 11 shows a summary of the supply-side issues discussed above which are currently faced by the sector’s
employers.

Page 153 of 191
Figure 12: Summary of supply-side concerns
Source: UCS 2016
3.4. IDENTIFICATION OF SCARCE SKILLS AND SKILLS GAPS
3.4.1. Scarce skills
Scarce occupations, otherwise known as hard-to-fill vacancies, are defined as occupations which take 3 months or
more to find a candidate with suitable work experience, qualifications and attributes at current wage levels. Scarce skills
are usually caused by one of two factors:
1. Absolute scarcity – this relates to suitably skilled people but who are not available in the labour market. Reasons
could include industry attractiveness.
2. Relative scarcity – this relates to suitably skilled people but who do not meet other employment criteria. Reasons
could include lack of sector-specific knowledge.
The scarce occupations extracted from the 2015-16 WSPs as of 31st May 2016 are shown in Table 23. The table has
been expanded from a top 10 to include all those occupations with a vacancy intensity rate of 5% or higher (as this is
the generally-accepted level at which concern regarding possible scarcity is raised). Total scarcity refers to the sum
of all vacancies identified in the WSP submissions, Total employed refers to the number that is currently employed by
the sector, and Vacancy intensity refers to the number of vacancies as a percentage of the total employment within the
occupation - therefore, the higher the percentage the higher the assumed scarcity.
Table 23: Scarce skills by vacancy
TOTAL TOTAL VACANCY
OCCUPATION OFO CODE ALTERNATIVE TITLE/S VACANCY EMPLOYED INTENSITY
Diamond and Gemstone 661302 Jewellery Setter 51 127 40.16%
Setter
ICT Communications 351201 Computer Help Desk Operator, ICT 15 38 39.32%
Assistant Systems Analysis Assistant, ICT
Communications Assistant
Special Forces Operator 542203 Team Leader 5 17 29.85%
Telecommunications 352201 Engineering Technician 4 16 25.64%
Technical Officer or (Telecommunications)
Technologist
Telecommunications Line 672204 Telecommunication Electrician 1 4 24.27%
Mechanic
Seismologist 211402 Geophysicist, Geophysical Scientist 4 19 21.02%
Ship's Master 315201 Deck Officer, Harbour Pilot 1 5 19.23%
Rock Engineering Manager 132203 7 39 17.91%
Psychometrician 263409 1 6 17.61%

Page 154 of 191
OCCUPATION
OFO CODE
ALTERNATIVE TITLE/S
TOTAL
VACANCY
TOTAL
EMPLOYED
VACANCY
INTENSITY
Accountant 241106 1 6 16.45%
Legal Executive 341102 2 13 15.69%
Engineer Soldier 542305 Engineer Officer 1 7 13.89%
Ship's Officer 315202 1 7 13.74%
Telecommunications 215303 Communications Specialist (ICT), 1 7 13.51%
Network Engineer Communications Consultant Occupational Social Worker 263507 Adoptions Worker 4 38 10.53%
Computer Network and 252301 Applications Developer, Systems 11 123 8.91%
Systems Engineer Engineer, Computer Network Engineer, Network Support Engineer
Employee Wellness 121205 Employee Wellness Consultant 1 12 8.40% Manager Bricklayer 641201 Bricklayer (Refractory and/ or Chemical), 10 123 8.16%
Bricklayer (Refractory), Bricklayer and Plasterer
Electronics Engineer 215201 Instrumentation Engineer, Information 6 79 7.64%
Engineer Electrical Engineer 215101 Control Engineer, Electrical Engineer 25 352 7.11%
(Mines) Goldsmith 661301 Jeweller, Jewellery Chainmaker (Hand
Made), Designer Goldsmith
52 784 6.63%
Developer Programmer 251203 ICT Programmer, ICT Developer,
Applications Developer
3 47 6.40%
Dentist 226102 1 17 5.92%
Automotive Motor Mechanic 653101 Auto Engineer / Mechanic, Automotive
Fitter, Automotive Mechanic, Mechanical
12 218 5.50%
Service Advisor (Vehicles), Motor Mechanic
Transportation Electrician 671208 Auto Electrician, Locomotive Electrician 37 738 5.02%
Electronics Engineering
Technologist
215202 Instrumentation Technologist,
Information Technologist, Computer
9 180 5.00%
Engineering Technologist
Source: Calculated from Weighted MQA WSP/ATR Submission, 2016
When one considers the low total employment for the majority of occupations, their scarce intensity rates are not cause
for concern. The vast majority of the occupations are also not core to the MMS. However, of those which are, Diamond
& Gemstone Setter and Rock Engineering Manager have considerable scarce intensity rates. Rock Engineer is also on
the hard-to-fill occupations list so this may need to be addressed by the MQA. Other occupations which are core to the
MMS and whose scarce intensity rates may be of concern to the MQA, are Electronics Engineer, Electrical Engineer,
Goldsmith, Automotive Motor Mechanic, Auto Electrician and Electronics Engineering Technologist. It is believed by
both national and regional stakeholders that more emphasis should be placed on the hard-to-fill occupations (Table
12) rather than the scarce skills, as the hard-to-fill occupations were determined by a year of extensive consultation
with numerous stakeholders, with consensus reached by industry, labour, government and training providers, while the
scarce skills list is based on the number of vacancies only.
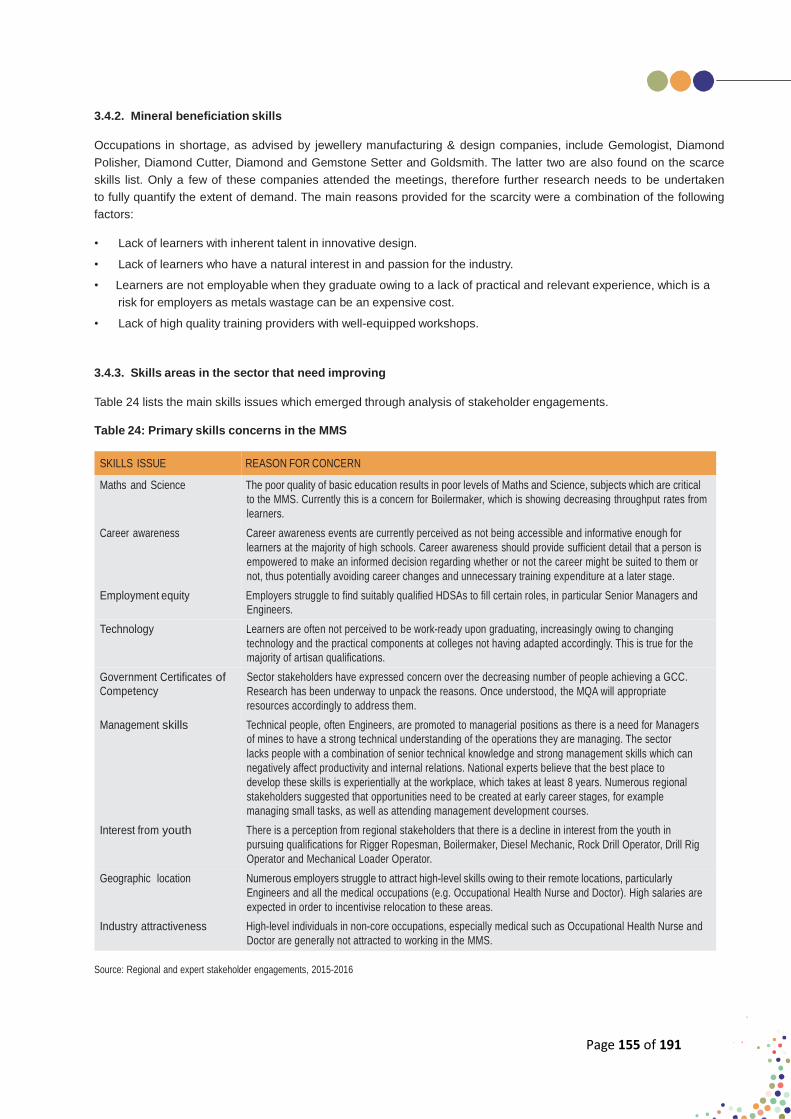
Page 155 of 191
3.4.2. Mineral beneficiation skills
Occupations in shortage, as advised by jewellery manufacturing & design companies, include Gemologist, Diamond
Polisher, Diamond Cutter, Diamond and Gemstone Setter and Goldsmith. The latter two are also found on the scarce
skills list. Only a few of these companies attended the meetings, therefore further research needs to be undertaken
to fully quantify the extent of demand. The main reasons provided for the scarcity were a combination of the following
factors:
• Lack of learners with inherent talent in innovative design.
• Lack of learners who have a natural interest in and passion for the industry.
• Learners are not employable when they graduate owing to a lack of practical and relevant experience, which is a
risk for employers as metals wastage can be an expensive cost.
• Lack of high quality training providers with well-equipped workshops.
3.4.3. Skills areas in the sector that need improving
Table 24 lists the main skills issues which emerged through analysis of stakeholder engagements.
Table 24: Primary skills concerns in the MMS
SKILLS ISSUE REASON FOR CONCERN
Maths and Science The poor quality of basic education results in poor levels of Maths and Science, subjects which are critical
to the MMS. Currently this is a concern for Boilermaker, which is showing decreasing throughput rates from
learners.
Career awareness Career awareness events are currently perceived as not being accessible and informative enough for
learners at the majority of high schools. Career awareness should provide sufficient detail that a person is
empowered to make an informed decision regarding whether or not the career might be suited to them or
not, thus potentially avoiding career changes and unnecessary training expenditure at a later stage.
Employment equity Employers struggle to find suitably qualified HDSAs to fill certain roles, in particular Senior Managers and
Engineers.
Technology Learners are often not perceived to be work-ready upon graduating, increasingly owing to changing
technology and the practical components at colleges not having adapted accordingly. This is true for the
majority of artisan qualifications.
Government Certificates of
Competency
Sector stakeholders have expressed concern over the decreasing number of people achieving a GCC.
Research has been underway to unpack the reasons. Once understood, the MQA will appropriate
resources accordingly to address them.
Management skills Technical people, often Engineers, are promoted to managerial positions as there is a need for Managers
of mines to have a strong technical understanding of the operations they are managing. The sector
lacks people with a combination of senior technical knowledge and strong management skills which can
negatively affect productivity and internal relations. National experts believe that the best place to
develop these skills is experientially at the workplace, which takes at least 8 years. Numerous regional
stakeholders suggested that opportunities need to be created at early career stages, for example
managing small tasks, as well as attending management development courses.
Interest from youth There is a perception from regional stakeholders that there is a decline in interest from the youth in
pursuing qualifications for Rigger Ropesman, Boilermaker, Diesel Mechanic, Rock Drill Operator, Drill Rig
Operator and Mechanical Loader Operator.
Geographic location Numerous employers struggle to attract high-level skills owing to their remote locations, particularly
Engineers and all the medical occupations (e.g. Occupational Health Nurse and Doctor). High salaries are
expected in order to incentivise relocation to these areas.
Industry attractiveness High-level individuals in non-core occupations, especially medical such as Occupational Health Nurse and
Doctor are generally not attracted to working in the MMS.
Source: Regional and expert stakeholder engagements, 2015-2016
Page 156 of 191
3.4.4. Impact of skills shortages on employers
Employers at regional meetings advised that the impact of these skills gaps include:
• The lack of high quality Maths and Science levels in learners make training more challenging to employers, as
many of the MMS-related occupations require these subjects as a foundation to do the jobs well.
• Employers struggle to find qualified HDSAs to fill some of the engineering and management roles, which affects
Employment Equity numbers.
• Changing technology in the MMS has affected the skills required within certain occupations, particularly artisans.
Colleges for the most part have not adapted accordingly, which is an increased training cost to employers.
• Employers located in rural areas need to incentivise skilled people to relocate from other parts of the country, with
additional incentives to retain them, which is a high cost to company.
• The lack of management skills can cause tension between employees within companies, and a lack of planning
ability within the management skill can disrupt operations and jeopardise productivity.
• Employers sometimes struggle to find suitably qualified skills from local communities, which can result in community
protests and unrest. This can lead to a decline in productivity and profitability while the unrest is ongoing, or in the
case of new mines, operational start up delays.
• Individuals in non-core occupations such as Occupational Health Nurses are generally not attracted to working in
the MMS, thus companies need to incentivise with high salaries. This is an increased cost to company.
3.4.5. Employability of graduates
• Graduates who complete artisan qualifications are perceived to be not work-ready as they lack knowledge of
and experience in new technology, which can be caused by inadequate practical training at college, as well as
workplace experience which is too generic in nature. The responsibility then becomes the employers’ to undertake
further training for them. MQA’s work-integrated learning programmes aims to address this issue.
• Graduates of non-mining engineering qualifications usually lack MMS-related experience. Companies generally
prefer to recruit Engineers with some sector-related experience. MQA’s internship programmes for Engineering
graduates aims to address this issue.
• MQA is undertaking impact assessments of bursary, internship, work placement and artisan qualifications, and a
tracer study of bursars is currently underway as well.
3.4.6. PIVOTAL skills
The MQAs’ OFO Code Pivotal Skills List in Table 25 was determined by considering the hard-to-fill occupations, as well
as the critical skills within occupations which are lacking, as advised by both national and regional stakeholders. The
occupations on the scarce skills list were considered as well, with particular focus on those which are on the hard-to-fill
list as well. It is important to note that sometimes the occupation itself is not necessarily scarce, rather a skill within the
occupation is. In this case, this is especially true for Mining Manager and Mine Planner and the artisan trades.
It is important to note that since the PIVOTAL list is OFO code-based, it is not possible to reflect the MQA’s other
critical priorities in it. For example, AET, MDP, OHS, as well as skills related to mineral beneficiation and sustainability
are blanket priorities in the sector and required to be developed within many occupations and at different NQF levels.
Therefore, highlighting some of these occupations in the PIVOTAL list would be excluding many others which are as
applicable. Considering this, as well as that PIVOTAL skills is also required to address scarce and critical skills, the
MQA’s research team chose to focus its PIVOTAL list on those occupations which are hard-to-fill only.
The interventions listed in the PIVOTAL List were informed by understanding the unique reasons for the challenges
faced by employers where each of the occupations are concerned. For example, the primary reason facing employers
where Mining Manager is concerned is a lack of senior management skills, while the challenges with the artisan trades
is a need for increased access to updated technology during studies. The quantities were informed by the number of
vacancies for each occupation as at 31st May 2016.
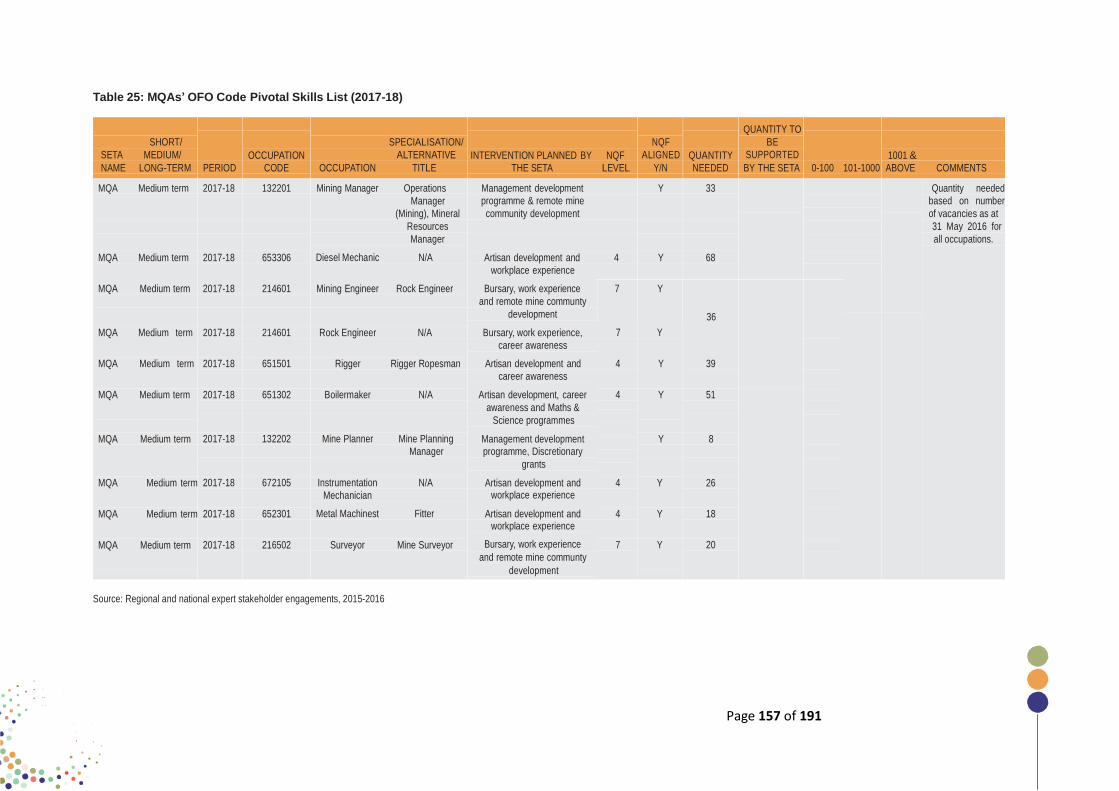
Page 157 of 191
Table 25: MQAs’ OFO Code Pivotal Skills List (2017-18)
SHORT/
SETA MEDIUM/
OCCUPATION
SPECIALISATION/
ALTERNATIVE
INTERVENTION PLANNED BY NQF
NQF
ALIGNED
QUANTITY
QUANTITY TO
BE
SUPPORTED
1001 &
NAME LONG-TERM PERIOD CODE OCCUPATION TITLE THE SETA LEVEL Y/N NEEDED BY THE SETA 0-100 101-1000 ABOVE COMMENTS
MQA Medium term
MQA Medium term
2017-18
2017-18
132201
653306
Mining Manager Operations
Manager
(Mining), Mineral
Resources
Manager
Diesel Mechanic N/A
Management development Y 33
programme & remote mine
community development
Artisan development and 4 Y 68
workplace experience
Quantity needed
based on number
of vacancies as at
31 May 2016 for
all occupations.
MQA Medium term 2017-18 214601 Mining Engineer Rock Engineer Bursary, work experience 7 Y
and remote mine communty
development 36
MQA Medium term 2017-18 214601 Rock Engineer N/A Bursary, work experience,
career awareness
7 Y
MQA Medium term
MQA Medium term
MQA Medium term
MQA Medium term
MQA Medium term
MQA Medium term
2017-18
2017-18
2017-18
2017-18
2017-18
2017-18
651501
651302
132202
672105
652301
216502
Rigger Rigger Ropesman
Boilermaker N/A
Mine Planner Mine Planning
Manager
Instrumentation N/A
Mechanician
Metal Machinest Fitter
Surveyor Mine Surveyor
Artisan development and 4 Y 39
career awareness
Artisan development, career 4 Y 51
awareness and Maths &
Science programmes
Management development Y 8 programme, Discretionary
grants
Artisan development and 4 Y 26 workplace experience
Artisan development and 4 Y 18 workplace experience
Bursary, work experience 7 Y 20 and remote mine communty
development
Source: Regional and national expert stakeholder engagements, 2015-2016
Page 158 of 191
The envisaged outcomes from the identified interventions include an increase in Mining Engineers and Rock Engineers
in the sector, an increase of senior technical people with management skills, and an increase in the number of artisan
graduates with relevant knowledge of and experience in updated technology being used by the sector. The PIVOTAL
List is ranked in order of priority according to advice by both national and regional experts in the sector.
3.5. CONCLUSION
Analysis of MQA’s WSP submissions and comments from national and regional stakeholders between June 2015 and
May 2016 indicates that while the number of vacancies per occupation are generally low, there are still a number of
hard-to-fill occupations. These are: Mining Manager, Mining Engineer, Mine Planner, Rock Engineer, Surveyor, Rigger
Ropesman, Diesel Mechanic, Boilermaker, Instrumentation Mechanician and Fitter. The primary reasons underlying
the challenges were found to be related to changing technology which colleges have not adapted to, declining interest
from the youth, low maths and science levels, lack of GCC, lack of management experience, lack of HDSAs with senior
management experience, geographic location.
Numerous employers struggle to attract high-level skills owing to their remote locations, particularly Engineers and all
the medical occupations (e.g. Occupational Health Nurse and Doctor). High salaries are expected in order to incentivise
relocation to these areas. Industry attractiveness is also a reason for the difficulty in attracting the medical occupations.
Main supply-side concerns were found to be as follows:
• Basic education: low Maths & Science levels; and insufficient access to career awareness.
• TVET College sector: lack of practical training at colleges; and outdated curricula at colleges.
• HET sector: Lack of career awareness for Rock Engineering, a specialisation of Mining Engineering; and a probable
over-supply of Geologists.
• Other (not specific to a level of education): Declining GCC achievement numbers, and lack of management skills.
The MQA assists the industry in addressing these challenges through interventions which include: Partnerships with
colleges; Local community projects such as learnerships, skills programmes, Maths and Science programmes, and
adult education and training; Targeting HDSAs to address transformation issues; Career awareness programmes.
Stakeholders strongly suggested that some of these programmes, in particular Maths & Science and career awareness
events, be thoroughly researched and adjusted to increase effectiveness, as well as monitored for impact.

Page 159 of 191
4. SECTOR PARTNERSHIPS
INTRODUCTION
The MQA partners with, and has relationships with numerous key role-players in the industry, such as government
departments, labour unions, industry representatives and training providers. The purpose of this chapter is to assess
the effectiveness of the existing MQA partnerships in the sector. The chapter identifies problems to maintaining and
creating partnerships and proposes measures for deepening them. The Chapter will also indicate new partnerships that
the MQA has identified that will be addressed and considered during the cycle of this SSP Update.
STATE OF EXISTING PARTNERSHIPS
4.1.1. TVET College partnerships
The MQA has established official partnerships, through Memoranda of Understanding (MOUs), with 5 TVET colleges
in provinces where MQA has a regional presence, and because qualifications related to the MMS are offered there.
For the most part qualifications at the colleges are not yet accredited by the MQA, however one of the primary aims
of these partnerships is to support and develop the colleges so that accreditation becomes a natural outcome in the
medium to long term. The objectives of the partnerships with these 5 TVET Colleges include to facilitate the offering
of learnerships, trades and other industry qualifications, as well as lecturer development, workplace learning, learner
placements and to assist with the compliance of these colleges’ workshops to meet the standards for programme
approval. It is difficult to make a judgement on the partnerships’ level of success as most of them are in early stages
making incremental progress and adjusting to challenges at the colleges. The partnership in Northern Cape, however,
has already yielded significant progress through persistence and the prioritisation of collaboration, as will be discussed
in its section below, and should serve as a benchmark to other regions.
The following provides a summary of the successes and challenges of MQA partnerships with each of the 5 colleges:
4.1.1.1. Goldfields TVET College in Free State province
• Assistance with the placement of learners at workplaces is still in early stages, and engagements with employers
are underway with one of the gold mine companies having indicated interest in becoming involved. The aim is to
place some learners during the 2016-17 financial year.
• A pilot project for the placement of lecturers at workplaces to gain work experience was introduced for Goldfields
TVET College wherein MQA committed to facilitate and fund the placement of 20 TVET lecturers in Mining
Industry for work experience for a period of three months. However the project was never successfully
implemented since it was indicated that the 3 months period was too short for sufficient experience to be gained.
The MQA intends to lengthen the work experience period to 18 months as it was indicated that 3 months was too
short for sufficient experience to be gained.
• With regard to assistance with the compliance of colleges’ workshops to meet the standards for programme
approval, an assessment of the workshop at Goldfields TVET College was undertaken and a report of findings
was made available, wherein Harmony Gold Mine has also assisted the College to equip the workshops with some of
the required equipment.
This partnership stands out for its initiative-taking focus and willingness to learn from experience and adapt quickly. It
was noted by stakeholders at the regional workshops in Welkom in 2015 that more stakeholder collaboration is needed,
and must be facilitated by the MQA, in order for the college to respond quickly and relevantly to industry needs.

Page 160 of 191
4.1.1.2. Nkangala TVET College in Mpumalanga province
A change in senior Management during 2015 at Nkangala led to a delay in the partnership’s progress, however
discussions with the MQA with regard to how to move forward together are currently underway.
Page 161 of 191
• Assistance with the placement of learners at workplaces is ongoing with the MQA regional office in discussions
with employers. Some of the large companies have indicated interest in becoming involved. So far 8 NCV learners
have been placed, although there is still a challenge of ongoing resistance from industry regarding the NCV
programme.
• Assistance with the placement of lecturers at workplaces to gain work experience is in a similar stage as learner
placement, with MQA regional office’s engagements with employers yielding positive reactions and candidates
have been identified for these companies.
• With regard to assistance with the compliance of Nkangala’s workshop, this is still under discussion between the
MQA and the college’s new Management.
4.1.1.3. Northern Cape Rural TVET College in Northern Cape province
• Some of the large companies have indicated interest in assisting learners with workplace experience, and the aim
is to place the first group of learners during 2016.
• With regard to lecturer development to gain workplace experience, 5 lecturers were impacted during 2015, with
early indications showing that the new knowledge is benefiting learners in the classroom in terms of practical
application. The challenge is that lecturers can only be released during vacation times.
• Collaborative efforts between numerous stakeholders resulted in the workshop of one of the five campuses
of Northern Cape Rural College, Okiep Campus, being deemed compliant in 2015, and their trade test centre
becoming accredited by NAMB. The other 2 engineering workshops which are part of Northern Cape Rural College
are still undergoing assessments.
• Regional stakeholders in Northern Cape stated that one of the major challenges facing the partnership is that many
learners are awarded bursaries but do not perform, mostly because of poor Maths and Science levels. It is believed
that better screening of candidates is needed, otherwise bridging programmes need to be considered.
While there are still many challenges to overcome in the partnership with Northern Cape Rural TVET College, the
process followed with regard to workshop compliance presents a model example of what can be achieved through
multi-stakeholder collaboration and commitment. It will now be important for this partnership to be monitored for its
impact on skills priorities in the province.
4.1.1.4. Orbit TVET College in North West province
• With regard to placement of learners in workplaces, this initiative has not yielded any results yet as companies
expressed having their own internal processes for placing learners within their companies, although more recent
engagements are showing that employers are willing to take on learners for artisan development.
• With regard to the placement of lecturers at workplaces to gain work experience, while there has been some
initial interest from companies they indicated it would be fruitless to place lecturers to gain experience if they are
not being developed to become Artisans (since they are teaching apprentices and will struggle with the technical
content). It was suggested that MQA’s grants for this be sufficient to offset the cost of temporarily replacing the
lecturer fulltime to ensure training will not be disrupted.
• With regard to the capacitation of workshops, so far none have been accredited, however ongoing engagements
are being held regarding the best way to move forward. One of the large employers in the province is interested in
becoming involved, and will participate in an exercise of workshops audits aimed at establishing the college’s state
of readiness for accreditation on MQA programmes, initially targeting the engineering skills programmes.
• Regional stakeholders in North West stated that one of the major challenges facing the partnership is that many
learners at colleges do not perform, mostly because of inadequate career guidance as well as poor Maths and
Science levels. It is believed that better career awareness programmes and screening of candidates is needed to
ensure interest in and aptitude for qualifications being pursued.
Page 162 of 191
4.1.1.5. Sekhukhune TVET College in Limpopo province
• Assistance with the placement of learners at workplaces is in early stages and has not yielded any results yet,
although the MQA is in ongoing discussions with a number of employers.
• Assistance with the placement of lecturers at workplaces to gain work experience has an Engineering focus, as the
MQA is in discussions with employers regarding assistance with the development of lecturers to offer Engineering
programmes at the college.
• With regard to the compliance of workshops to meet the standards for programme approval, the MQA is currently
in discussions with employers to possibly adopt the college so that infrastructure challenges can be resolved.
• The colleges’ Engineering programmes are currently undergoing accreditation assessments.
4.1.2. University partnerships
The MQA has established official partnerships, through Memoranda of Understanding (MOUs), with the following
Universities: Rhodes University, the University of Cape Town, the University of Fort Hare, the University of
Johannesburg, the University of Limpopo, the University of Pretoria, the University of South Africa, the University of
Venda and the University of the Witwatersrand. The objective of the partnerships with the Universities identified
above is for these institutions to employ historically disadvantaged lecturers to lecture on mining-related disciplines.
They begin as junior lecturers and are mentored by senior lecturers, and are encouraged to complete PhDs. The MQA
funds the salaries of these lecturers. The aim is that they are eventually absorbed by the universities as permanent
employees.
The MQA’s current target to support 27 HDSA lecturers has been successfully achieved. Since the partnerships’
commencement in 2011, 3 lecturers have been successfully absorbed by the university, while 6 have been absorbed
by industry. All of these were replaced so that the target of 27 is an ongoing commitment by the MQA.
One of the challenges in this partnership is that there is a very low turnover of lecturers at the universities, so it will likely
be a lengthy period of time that MQA needs to support the same pool of HDSA lecturers before they are considered for
permanent employment. The MQA has intentions of providing the lecturers with 3 years of international exposure during
their tenures, to gain valuable experience and are therefore more employable on their return to South Africa.
4.1.3. Partnerships with the DMR, Chamber of Mines and Organised Labour
The MQA has had an ongoing and close relationship with its 3 strategic tripartite partners: the DMR, the Chamber of
Mines and organised labour. All parties involved in this partnership convene regularly to discuss challenges facing skills
development in the MMS. It is considered a successful partnership by the individual parties as it enables the MQA to
respond to skills gaps appropriately and with support from its key stakeholders.
4.1.4. Inter-SETA partnerships
In alignment with the Minister of Higher Education and Training’s call for increased inter-SETA collaboration, the MQA is
becoming increasingly involved in inter-SETA meetings, often chairing meetings in Limpopo and Mpumalanga and North
West. These meetings involve sharing skills development progress reports and focus on possible areas of collaboration.
The SETAs also share costs and platforms for career awareness. However, obtaining formal agreements that were
proposed is an ongoing challenge. Furthermore, stakeholders advised that not enough Memoranda of Understandings
are in place for qualifications needed in the MMS but which are accredited by other SETAs.
4.1.5. Premier’s Office partnerships
The MQA has working relationships with the Premier’s Offices in Limpopo, Free State, Mpumalanga, Northern Cape,
KZN and Eastern Cape. While the partnerships have not been formalised, there is agreement that this needs to take
Page 163 of 191
place. All skills development efforts by the SETAs are reported to the Provincial Skills Development Forum chaired by
the Premiers, who in turn are engaged for assistance in the removal of blockages to implement them. A challenge is
that turnaround time to the implementation of agreements is sometimes long.
PROPOSED NEW PARTNERSHIPS
4.1.6. Minerals beneficiation partnerships
Owing to the size of South Africa’s untapped minerals the country has significant potential to increase mineral
beneficiation. Stakeholders in every province expressed the importance of implementing efforts to beneficiate the
country’s minerals and metals, especially during an economic downturn and significantly reduced global demand. The
Minerals Beneficiation Strategy is aimed at encouraging the country to move from the sale of mined minerals and metals
to the sale of beneficiated, value-added products. The government is currently drafting the Mineral Beneficiation Action
Plan (MBAP), which seeks to advance “local value-addition across five mineral value-chains, namely; iron-ore and
steel, platinum-group metals, polymers, titanium and mining inputs” . The implementation of the Minerals Beneficiation
Strategy and MBAP is expected to create and retain much needed jobs in the MMS. However, stakeholders advised
that there is much scepticism as little so far has been done to implement the past commitments to mineral beneficiation
goals. The argument made in this report is that these interventions are more likely to work if the activities are better
coordinated, and that this will have significant implications for the skills development system. The MQA’s role would
be to respond accordingly with skills development initiatives. Stakeholders that can be engaged and partnered with to
keep abreast of any developments, are suggested below:
4.1.6.1. Government partnerships
The DTI completed a research project in 2013 that analysed backward and forward beneficiation potential in four
key value-chains (ferrous metals; polymers; titanium, PGMs) and developed strategies to increase the localisation of
mining inputs. The next phase was to unpack the high-level analysis and identify key projects in the selected value
chains that can be taken forward. Collaboration with the DTI and DMR needs to be put in place to ensure that the MQA
can respond accordingly and timeously with the skills development requirements.
4.1.6.2. Training provider partnerships
With regard to the jewellery manufacturing sector, the “Skills Requirements for Mineral Beneficiation through Jewellery
Manufacturing” report recommends that Training Provider capacity may need to be supported to provide stronger
practical skills. This was corroborated at the regional stakeholder engagements, also revealing a need to capacitate
colleges in the provision of comprehensive career guidance and screening programmes to identify students who have
an avid interest and talent in innovative design work, which is what is believed is needed to contribute to the sector
becoming internationally competitive.
4.1.7. Green skills partnerships
Rhodes University’s report, “Green Skills for the Mining Sector” conducted on behalf of the MQA and released in May
2015, as well as stakeholder comments made during the regional meetings in June 2015, were used to inform the
recommendations in this section.

Page 164 of 191
4.1.7.1. Department of Water and Sanitation partnership
The Green Skills for the Mining Sector report recommended that the MQA supports the Department of Water and
Sanitation in strengthening the capacity of its regulatory function with regard to mining, with a range of skills from
demand determination to regulatory roles in the approval and enforcement of water use licences.
4.1.7.2. Research institutions
The Green Skills for the Mining Sector report also recommended that partnerships be formed with industry including
Eskom, the Fossil Fuel Foundation, Mintek, SANEDI, DST and the NRF to complement their funding for cleaner
production research in clean technology and processes, and in the effective remediation of the impacts of mining on
air, soil and water quality.
CONCLUSION
The MQA has formal partnerships with 5 TVET Colleges. It was highlighted that an increase in more effective
collaboration is needed between the MQA, TVET Colleges and industry, for the purposes of responding relevantly to
industry’s needs and preparing learners accordingly.
Greater collaboration is needed between the MQA and government departments working on implementing the Mineral
Beneficiation Strategy, in order to understand in advance what the skills requirements will be.
The MQA is becoming increasingly involved in inter-SETA meetings, which involve the sharing of skills development
progress reports and focus on possible areas of collaboration. However, obtaining formal agreements that were
proposed is an ongoing challenge. Furthermore, stakeholders have advised that not enough MOUs are in place for
qualifications needed in the MMS but which are accredited by other SETAs.
Regarding green skills, a partnership with the Department of Water and Sanitation is recommended to mitigate
the challenge of significantly reducing water levels, to combine strengths and avoid duplication of work. It is also
recommended that partnerships be formed with companies’ R&D departments that focus on cleaner production
research in clean technology and processes, and in the effective remediation of the impacts of mining on air, soil and
water quality.
Page 165 of 191
5. SKILLS PRIORITY ACTIONS
RESEARCH FINDINGS
The purpose of this chapter is to identify the top 5 key priority actions for the sector based on a consolidation of the
analysis from previous chapters. This chapter will indicate the recommended skills priority actions that the MQA will
prioritise for the cycle 2017-18, which will reflect the operational priorities inherent in the MQA’s Strategic in its quest to
implement its various learning interventions for the MMS as it aligns with national priorities.
The key findings of this report are as follows:
• The main change drivers currently impacting the MMS are: technology, together with Mining Phakisa, as it impacts
skills planning in terms of the need to ensure that learners graduate with knowledge of and experience in the
latest technology being used in the sector; retrenchments, as the widespread downscaling of operations across
the sector owing to decreased global demand for mined commodities has led to large-scale retrenchment drives,
resulting in the need to prioritise portable skills training; and transformation, as targets contained in the Mining
Charter are designed to redress historical imbalances.
• The current Mining Charter stipulates that there should be at least 40% participation from HDSAs in management
positions. While HDSAs constitute 50% at the mid management level, exceeding the target, HDSAs are
underrepresented at top and senior management levels, falling below the 40% target at 28.9% and 35.2%
respectively.
• The 10 most hard-to-fill occupations are Mining Manager, Mining Planner, Mining Engineer, Rock Engineer,
Surveyor, Rigger Ropesman, Diesel Mechanic, Boilermaker, Instrumentation Mechanician and Fitter. Experts
believe that the most concerning are Mining Manager, Rock Engineer, Diesel Mechanic and Rigger Ropesman.
• The primary reasons for skills gaps are outdated technology at colleges; insufficient and irrelevant workplace
experience; low levels of Maths and Science; insufficient access to high quality career awareness; geographic
location; employment equity; lack of GCCs; lack of management skills; lack of interest from youth in certain
occupations; and industry attractiveness.
• The main supply-side concerns were found to be as follows:
o Basic education: low levels of Maths & Science; and insufficient access to career awareness.
o TVET College sector: lack of practical training at colleges; and outdated curricula at colleges.
o HET sector: lack of career awareness for Rock Engineering, a specialisation of Mining Engineering; and a
probable over-supply of Geologists.
o Other (not specific to a level of education): Declining GCC achievement numbers for core MMS-related
occupations; and lack of management skills.
• The MQA’s targets for Maths & Science and career awareness events were exceeded in 2015-16. Stakeholders
believe, however, that there is room for improvement and that the initiatives should be monitored for impact, given
the importance of Maths and Science as building blocks for the majority of occupations in the sector, and with
career awareness’ potential to disseminate accurate information as well as draw the right skills and potential to the
sector.
• The outlook of the MMS would be improved if the sector monitors the developments of Mining Phakisa and
prepares existing and potential employees accordingly; and takes advantage of the implementation of the Mineral
Beneficiation Action Plan (MBAP) and the SIPs projects, which are expected to increase economic activity and
create new jobs.
• With regard to green skills, the industry is becoming more conscious of the growing need to protect the environment,
with increased enforcement of legislation and consumer pressure driving the demand for eco-compliance. Skilled
workers will be required in energy efficiency and sourcing of ‘green’ products and services and managing ‘green’
supply chains. Alternative sources of energy are also being prioritised owing to the increasing costs of electricity
which impact production and profitability.

Page 166 of 191
RECOMMENDED PRIORITY 1: SUPPORT TRANSFORMATION OF THE SECTOR THROUGH SKILLS DEVELOPMENT
Employment Equity plays a key role in South Africa’s transformation agenda. In order for the MQA to support this national
priority, it will continue to prioritise skills development to enable an increase in the number of Historically-Disadvantaged
South Africans (HDSAs). These include, and are not limited to, undertaking skills development interventions to
capacitate more men and women to occupy management and supervisory roles, with emphasis on enabling women to
occupy positions in core mining occupations. The MQA will also prioritise skills development interventions to respond
to the disabled, i.e. those individuals already employed, and those seeking employment in the sector with a view to
increasing their representation.
The current Mining Charter stipulates that there should be at least 40% participation from HDSAs in management
positions. HDSAs in particular are believed to be underrepresented at top and senior management levels, this is
supported by the MQA’s WSP submissions which show that they fall below the target. The MQA intends to continue
supporting black individuals in and for management roles, which includes support to individuals in its Management
Development Programmes. It is also recommended that management programmes for engineering students
be targeted for support, to pre-empt their advancement to managers of mining operations at later stages of their
careers. Discretionary grants could be used to support industry in the development of women for senior and executive
management positions if the proposed higher targets are gazetted in a new Mining Charter.
The widespread downscaling of operations across the sector owing to decreased global demand has led to large-scale
retrenchment drives, resulting in the urgent need for MQA to prioritise portable skills training and support industry in
this where possible. Owing to the cyclical nature of the industry, it is believed that these initiatives need to take place
as a pre-emptive measure, before retrenchments are a consideration, since retrenchment is a very stressful event and
the person is therefore not likely to be thoroughly engaged in a training programme. Additionally, research should be
undertaken with employers and employees to determine what the most relevant and useful training programmes for
employees would be. The lay-off scheme could also be considered as part of a solution.
The MQA will also continue to support programmes such as lecturer development programmes and Rural Development
Projects aimed at addressing equity and transformational imperatives within the sector. With regard to Maths and
Science, a strong suggestion from national and regional stakeholders is to focus efforts on the development of teachers,
as well as to focus on fewer beneficiaries, to ensure impact. It was believed that funding be directed at those who are
applying for bursaries, and as a condition before commencement of studies.
With regard to career awareness, stakeholders believed that events should provide sufficient detail that a person is
empowered to make an informed decision regarding whether or not a particular career might be suited to them or not,
thus potentially avoiding career changes and unnecessary training expenditure at a later stage. It is also important to
continue to emphasise the positive effects on future job prospects of pursuing Maths and Science until Grade 12, and
partner effectively to increase access to career awareness to high school learners.
People with disabilities consistently represent less than 1% of the labour force in the MMS. It is proposed that the MQA
plays a more active role in supporting people with disabilities to acquire skills to take up employment in the sector, and
increase skills development interventions for those already employed.
RECOMMENDED PRIORITY 2: CORE MINING SKILLS MUST CONTINUE TO BE DEVELOPED THROUGH SKILLS PROGRAMMES
In order to ensure a sufficient pool of skills for the sector in the long-term, it is important that the MQA continues to
support and fund programmes which are core to the sector. These should include learnerships, both non-artisan and
artisan. This will also involve improved monitoring and evaluation of training delivery and quality. Capacity-building of
Page 167 of 191
TVET College lecturers will also continue to be supported to ensure that this improves the quality and relevance of
public sector training.
Technological change in the sector is currently affecting numerous occupations including Rock Drill Operator, Blaster,
Drill Rig Operator as well as most of the artisan trades. The MQA will need to direct funding towards upskilling
programmes so that employees are trained in new mechanised processes, as well as provide support where possible to
identified TVET Colleges which are not up-to-date with latest technology, and allocate funding to workplace experience
at suppliers of new technology. With regard to Mining Phakisa, it will be crucial for the MQA to stay abreast of its R&D
and manufacturing developments to understand the skills implications, as the time-frame goals are relatively short:
5 years for remote drill-and-blast mechanisation and 10 years for 24/7 mechanisation. Up-skilling and re-skilling of
workers for mining, manufacturing, agriculture, etc. will be necessary to ensure a just transition to future mining. It
will be essential for the MQA to continue to be included in the skills planning discussions at Mining Phakisa Labs, to
monitor developments and their implications on skills. Research still needs to be conducted on the potential impact of
new mechanised methods on various skills, and the training that will be required for each to adapt accordingly, a study
which the MQA could consider driving. A strong focus on AET programmes up to level 4 as a way of improving literacy
and numeracy levels will be important for the MQA over the next 5 years to assist in preparing existing and potential
employees to operate new machinery and coordinate new processes.
Interventions to ensure employability of graduates will also be prioritised through various workplace training
mechanisms. There will continue to be collaboration with industry to provide valuable workplace experience, via
work-integrated learning for TVET College learners, P1 and P2 training for University of Technology students, and
internships for university undergraduates.
The 10 most hard-to-fill occupations (Mining Manager, Mining Planner, Mining Engineer, Rock Engineer, Surveyor,
Rigger Ropesman, Diesel Mechanic, Boilermaker, Instrumentation Mechanician and Fitter), will be prioritised in terms
of skills planning initiatives, with a particular focus on Mining Manager, Rock Engineer, Rigger Ropesman and Diesel
Mechanic. The reasons behind these occupations being hard to fill differ, as discussed in chapter 3, and must therefore
be considered individually and uniquely where interventions are concerned. This is addressed in the PIVOTAL list.
With regard to the Government Certificates of Competence, the MQA should monitor the research being undertaken
to understand the declining achievement numbers, as they are an important requirement for some of the core MMS
qualifications such as Mining Engineer and Mine Manager.
RECOMMENDED PRIORITY 3: MONITORAND DEVELOP THE SKILLS REQUIRED FOR MINERALS BENEFICIATION
South Africa’s Minerals Beneficiation Strategy is planning to transform the industry from being largely resource-based to
knowledge-based. In order for this to succeed, greater collaboration between the MQA, industry councils and jewellery
manufacturers needs to be put in place and official partnerships formed and sustained with mutual firm commitments to
chart the way forward to revive the industry. In particular, the MQA will seek to ensure an adequate and relevant supply
of skills to the sector. Qualifications will need to be carefully scoped against industry requirements, with a longer term
view of the type of workforce in mind.
With regard to minerals beneficiation, greater collaboration is needed between the MQA and the government
departments working on implementing the Mineral Beneficiation Implementation Plan, to understand in advance what
the skills requirements will be, in order to respond accordingly and timeously. Where the jewellery manufacturing sector
is concerned, a consideration for the MQA would be to conduct research into possible ways to revive the sector and to
facilitate engagement on the possible removal of red tape which would open up doors for local skills development. Two
such examples are diamond cutting and polishing which are mostly conducted abroad owing to enforced legislation in
South Africa.
Page 168 of 191
RECOMMENDED PRIORITY 4: CONTINUE TO IMPROVE HEALTH AND SAFETY STANDARDS
Mining is an activity with inherent risks that can impact on the health and safety of employees. Additionally, a company’s
licence to operate is jeopardised when there are fatalities, injuries and occupational injuries. The government has
put in place legislation and associated processes to ensure the safety of workers is paramount as a key feature of
the sustainability of the mining sector. Indeed, in this respect, one of the MQA’s legislative mandates is to improve
the health and safety standards and it must continue to be a priority. The results of this have been already realised
notwithstanding other interventions by those in the sector. There there has been a notable decrease in mining injuries
and fatalities, with total fatalities decreasing sharply from a peak of 744 per year in 1989 to 77 in 2015.
The MQA will, therefore, continue its progress regarding OHS skills capacity and training in the industry, through the
following measures:
• Support skills development in OHS Skills programmes.
• Train OHS Representatives over 5 years as required by the Mine Health and Safety Tripartite Leadership Summit
Agreement signed on 5th September 2008.
There were indications at the regional meetings that there is a challenge in finding Mine Environmental Hygienists and
OHS Practitioners, particularly in remote areas of the country. While these occupations did not make the top 10 ‘hard-
to-fill’ list or the scarce skills list, they represent key skills for the sector. It is proposed that MQA should explore reasons
which contribute to a possible supply shortfall and if necessary determine the solutions which will mitigate them.
RECOMMENDED PRIORITY 5: DEVELOP SKILLS FOR SUSTAINABILITY
One of the most pressing challenges for the MMS is the potential damage being done to the environment by mining
operations. Reducing water levels, together with inadequate recycling initiatives will also have significant and far-
reaching consequences if not addressed soon. Proactive efforts to mitigate this challenge should be undertaken by the
MQA in partnership with other government departments. There is need to understand the seriousness of the issue, and
in particular whether there are adequate skills to address it. A range of skills from demand determination to regulatory
roles in the approval and enforcement of water use licences, will likely be required. It is anticipated that support would
include short (top-up) courses and the establishment of networks/communities of practice.
It is also recommended that partnerships be formed with industry including Eskom, the Fossil Fuel Foundation, Mintek,
SANEDI, DST and the NRF to complement their funding for cleaner production research (i.e. in clean technology and
processes), and in the effective remediation of the impacts of mining on air, soil and water quality.
Research is underway to explore what the ‘green skills’ needs are within the entire mining value chain, including
whether or not any are considered scarce.
Alternative, including “greener”, sources of energy are being prioritised in the industry owing to the increasing costs
of electricity which impact production and profitability, which will require the necessary skills in order to adapt current
processes and operations.
CONCLUSION
As a result of the findings in this SSP, the following skills priorities are recommended to the MQA:
• Priority 1: Support transformation of the sector through skills development
• Priority 2: Core mining skills must continue to be developed through skills programmes
• Priority 3: Monitor and develop the skills required for Minerals Beneficiation
• Priority 4: Continue to improve Health and Safety standards
• Priority 5: Develop skills for sustainability.
Page 169 of 191
BIBLIOGRAPHY
African Development Bank (ADB). 2014. African Economic Outlook. http://www.afdb.org/en/knowledge/publications/
african-economic-outlook/
Retrieved 05 May 2016.
Chamber of Mines, Facts and Figures, 2014 http://www.chamberofmines.org.za/sa
Retrieved 10 May 2016.
Department of Mineral Resources (DMR). 2011. A Beneficiation Strategy for the Minerals Industry of South Africa.
http://www.gov.za/sites/www.gov.za/files/Beneficiation%20Strategy%20June%202011%20final%20(3)_0.pdf
Retrieved 14 April 2016.
Department of Trade and Industry (DTI) is leading the drafting process, which also involves the National Treasury, the
Economic Development Department, the Department of Mineral Resources (DMR) and the Department of Science and
Technology (Mining Weekly, Nov 2014): http://www.miningweekly.com/article/five-mineral-value-chains-prioritised-in-
south-africas-draft-beneficiation-plan-2014-11-21
Retrieved 19 April 2016.
Mineral energy complex on the beneficiation policy through the lens of network analysis http://www.ecopartners.co.za/
docs/Wits%20University%20Mineral%20Economics%20Value%20Chain%20Analysis%20February%202011.pdf
Retrieved 19 April 2016
Mineral Resources Pocket Guide http://www.gcis.gov.za/sites/www.gcis.gov.za/files/docs/resourcecentre/
pocketguide/2012/15%20Mineral%20Resources.pdf
Retrieved 13 May 2016.
Mwape P., Roberts M.J., Mokwena E., Musi L., Tjatjie T., Mnguni M., Mashaba P., Kwata P.G. 2007/ 2008. South
Africa’s Mineral Industry – General Review. Department of Minerals and Energy, South Africa’s Mineral Industry.
National Treasury (2016). 2016 Budget Review, http://www.treasury.gov.za/documents/national%20budget/2016/
review/chapter%202.pdf
Retrieved 13 May 2016.
Page 170 of 191
Mining Qualification Authority (2015) Regional Sector Skills Plan meetings.
SAMI 2014-2015
http://www.dmr.gov.za/publications/south-africas-mineral-industry-sami.html
Retrieved 18 April 2016
MQA-CSMI, Small Scale Mining Colloquium, Johannesburg, South Africa – Report and Analysis of Outputs, September
2010.
PICC. 2012. Summary of South Africa National Infrastructure Plan. http://www.gov.za/sites/www.gov.za/files/PICC_
Final.pdf
Retrieved 13 May 2016.
Porter, M. E. (1985). Competitive Advantage: Creating and Sustaining Superior Performance. New York.: Simon and
Schuster. Retrieved 13 May 2016
Special Economic Zones: Limpopo http://www.gov.za/speeches/special-economic-zones-boost-economy-limpopo-
2015-06-28-28-jun-2015-0000
Retrieved 13 September 2015.
South Africa Government. 2014. Info. http://www.gov.za/
Mineral Production and Sales- March 2016.http://www.statssa.gov.za/publications/P2041/P2041March2016.pdf
Retrieved 19 March 2016
Page 171 of 191
ANNEXURE E
TECHNICAL INDICATOR DESCRIPTIONS
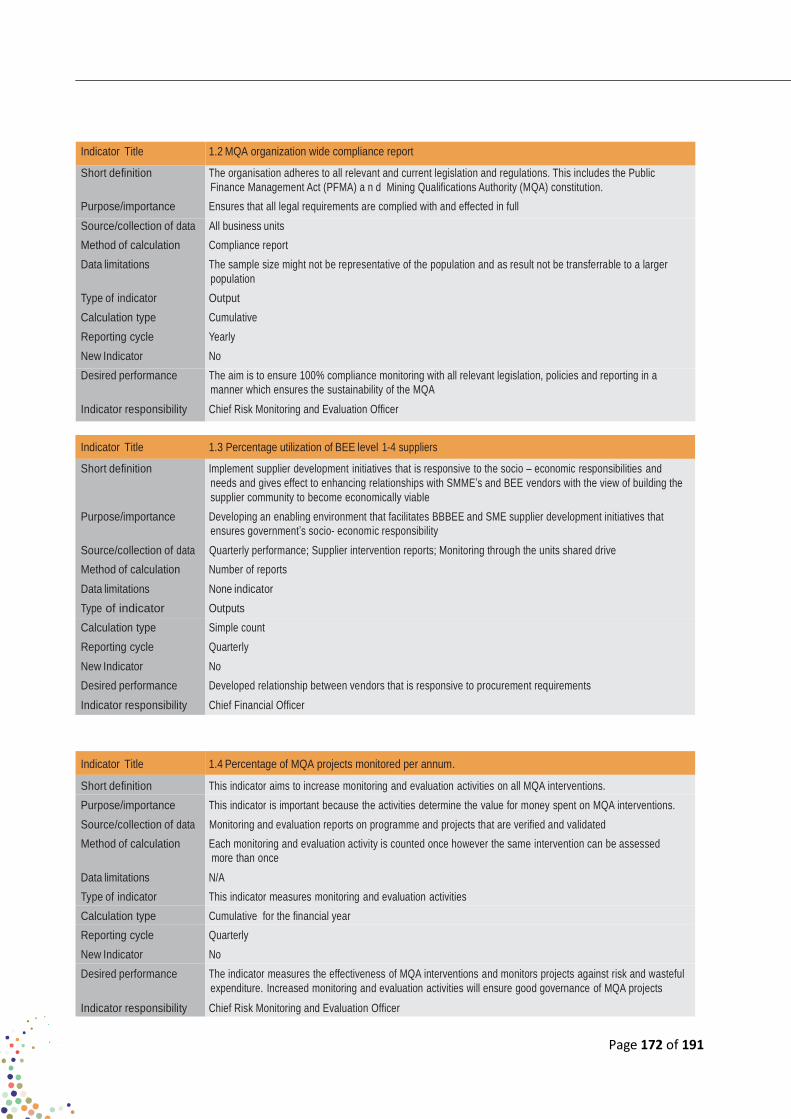
Page 172 of 191
Indicator Title 1.2 MQA organization wide compliance report
Short definition The organisation adheres to all relevant and current legislation and regulations. This includes the Public
Finance Management Act (PFMA) a n d Mining Qualifications Authority (MQA) constitution.
Purpose/importance Ensures that all legal requirements are complied with and effected in full
Source/collection of data All business units
Method of calculation Compliance report
Data limitations The sample size might not be representative of the population and as result not be transferrable to a larger
population
Type of indicator Output
Calculation type Cumulative
Reporting cycle Yearly
New Indicator No
Desired performance The aim is to ensure 100% compliance monitoring with all relevant legislation, policies and reporting in a
manner which ensures the sustainability of the MQA
Indicator responsibility Chief Risk Monitoring and Evaluation Officer
Indicator Title 1.3 Percentage utilization of BEE level 1-4 suppliers
Short definition Implement supplier development initiatives that is responsive to the socio – economic responsibilities and
needs and gives effect to enhancing relationships with SMME’s and BEE vendors with the view of building the
supplier community to become economically viable
Purpose/importance Developing an enabling environment that facilitates BBBEE and SME supplier development initiatives that
ensures government’s socio- economic responsibility
Source/collection of data Quarterly performance; Supplier intervention reports; Monitoring through the units shared drive
Method of calculation Number of reports
Data limitations None indicator
Type of indicator Outputs
Calculation type Simple count
Reporting cycle Quarterly
New Indicator No
Desired performance Developed relationship between vendors that is responsive to procurement requirements
Indicator responsibility Chief Financial Officer
Indicator Title 1.4 Percentage of MQA projects monitored per annum.
Short definition This indicator aims to increase monitoring and evaluation activities on all MQA interventions.
Purpose/importance This indicator is important because the activities determine the value for money spent on MQA interventions.
Source/collection of data Monitoring and evaluation reports on programme and projects that are verified and validated
Method of calculation Each monitoring and evaluation activity is counted once however the same intervention can be assessed
more than once
Data limitations N/A
Type of indicator This indicator measures monitoring and evaluation activities
Calculation type Cumulative for the financial year
Reporting cycle Quarterly
New Indicator No
Desired performance The indicator measures the effectiveness of MQA interventions and monitors projects against risk and wasteful
expenditure. Increased monitoring and evaluation activities will ensure good governance of MQA projects
Indicator responsibility Chief Risk Monitoring and Evaluation Officer
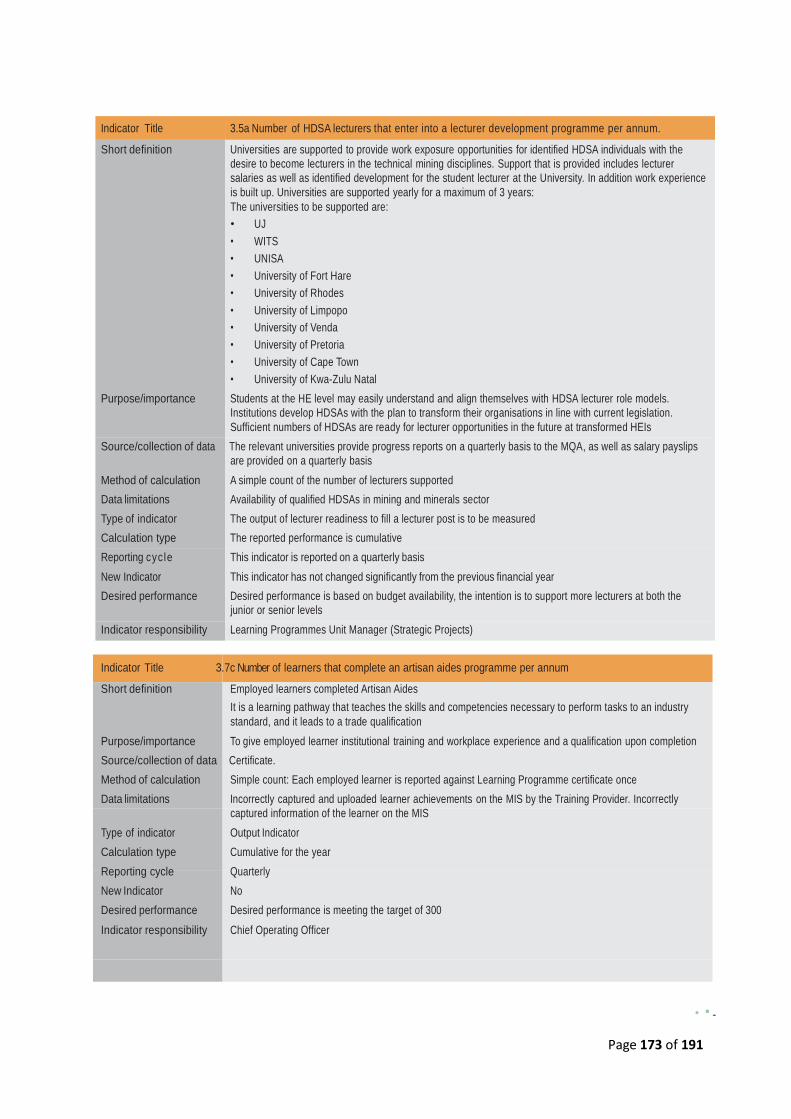
Page 173 of 191
Indicator Title 3.5a Number of HDSA lecturers that enter into a lecturer development programme per annum.
Short definition Universities are supported to provide work exposure opportunities for identified HDSA individuals with the
desire to become lecturers in the technical mining disciplines. Support that is provided includes lecturer
salaries as well as identified development for the student lecturer at the University. In addition work experience
is built up. Universities are supported yearly for a maximum of 3 years:
The universities to be supported are:
• UJ
• WITS
• UNISA
• University of Fort Hare
• University of Rhodes
• University of Limpopo
• University of Venda
• University of Pretoria
• University of Cape Town
• University of Kwa-Zulu Natal
Purpose/importance Students at the HE level may easily understand and align themselves with HDSA lecturer role models.
Institutions develop HDSAs with the plan to transform their organisations in line with current legislation.
Sufficient numbers of HDSAs are ready for lecturer opportunities in the future at transformed HEIs
Source/collection of data The relevant universities provide progress reports on a quarterly basis to the MQA, as well as salary payslips
are provided on a quarterly basis
Method of calculation A simple count of the number of lecturers supported
Data limitations Availability of qualified HDSAs in mining and minerals sector
Type of indicator The output of lecturer readiness to fill a lecturer post is to be measured
Calculation type The reported performance is cumulative
Reporting cycle This indicator is reported on a quarterly basis
New Indicator This indicator has not changed significantly from the previous financial year
Desired performance Desired performance is based on budget availability, the intention is to support more lecturers at both the
junior or senior levels
Indicator responsibility Learning Programmes Unit Manager (Strategic Projects)
Indicator Title 3.7c Number of learners that complete an artisan aides programme per annum
Short definition Employed learners completed Artisan Aides
It is a learning pathway that teaches the skills and competencies necessary to perform tasks to an industry standard, and it leads to a trade qualification
Purpose/importance To give employed learner institutional training and workplace experience and a qualification upon completion
Source/collection of data Certificate.
Method of calculation Simple count: Each employed learner is reported against Learning Programme certificate once
Data limitations Incorrectly captured and uploaded learner achievements on the MIS by the Training Provider. Incorrectly
captured information of the learner on the MIS
Type of indicator Output Indicator
Calculation type Cumulative for the year
Reporting cycle Quarterly
New Indicator No
Desired performance Desired performance is meeting the target of 300
Indicator responsibility Chief Operating Officer
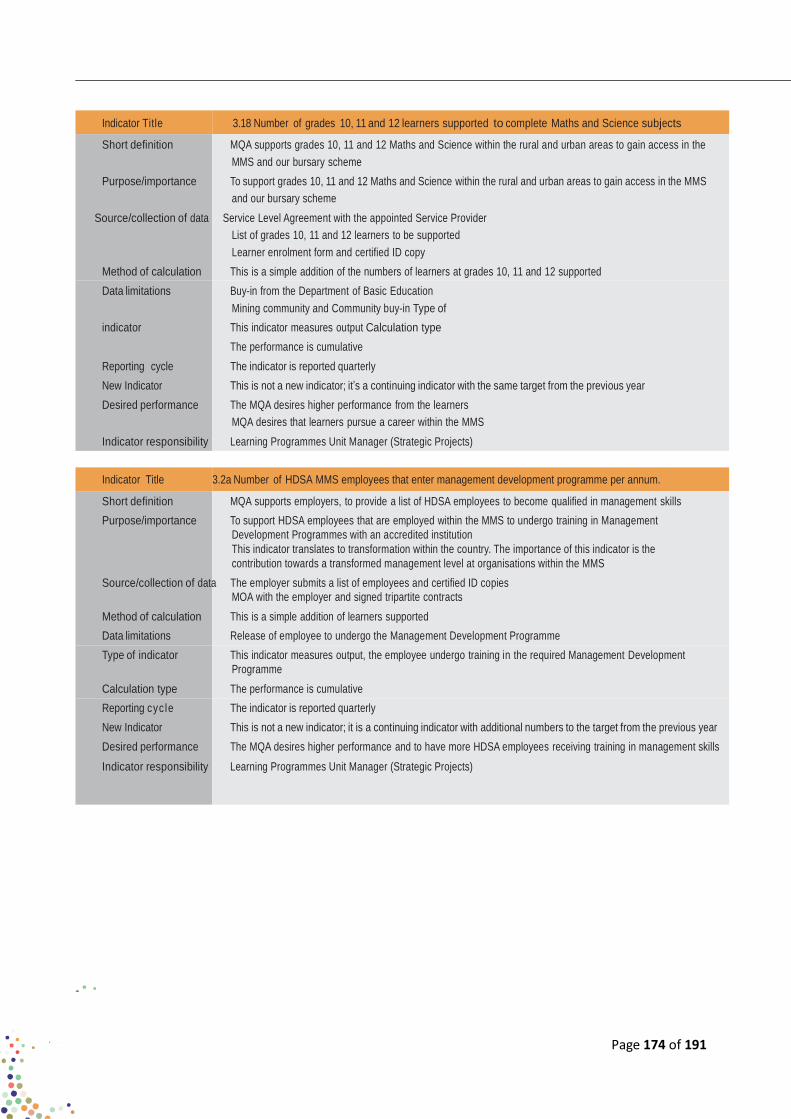
Page 174 of 191
Indicator Title 3.18 Number of grades 10, 11 and 12 learners supported to complete Maths and Science subjects
Short definition MQA supports grades 10, 11 and 12 Maths and Science within the rural and urban areas to gain access in the
MMS and our bursary scheme
Purpose/importance To support grades 10, 11 and 12 Maths and Science within the rural and urban areas to gain access in the MMS
and our bursary scheme
Source/collection of data Service Level Agreement with the appointed Service Provider
List of grades 10, 11 and 12 learners to be supported
Learner enrolment form and certified ID copy
Method of calculation This is a simple addition of the numbers of learners at grades 10, 11 and 12 supported
Data limitations Buy-in from the Department of Basic Education
Mining community and Community buy-in Type of
indicator This indicator measures output Calculation type
The performance is cumulative
Reporting cycle The indicator is reported quarterly
New Indicator This is not a new indicator; it’s a continuing indicator with the same target from the previous year
Desired performance The MQA desires higher performance from the learners
MQA desires that learners pursue a career within the MMS
Indicator responsibility Learning Programmes Unit Manager (Strategic Projects)
Indicator Title 3.2a Number of HDSA MMS employees that enter management development programme per annum.
Short definition MQA supports employers, to provide a list of HDSA employees to become qualified in management skills
Purpose/importance To support HDSA employees that are employed within the MMS to undergo training in Management
Development Programmes with an accredited institution
This indicator translates to transformation within the country. The importance of this indicator is the
contribution towards a transformed management level at organisations within the MMS
Source/collection of data The employer submits a list of employees and certified ID copies
MOA with the employer and signed tripartite contracts
Method of calculation This is a simple addition of learners supported
Data limitations Release of employee to undergo the Management Development Programme
Type of indicator This indicator measures output, the employee undergo training in the required Management Development
Programme
Calculation type The performance is cumulative
Reporting cycle The indicator is reported quarterly
New Indicator This is not a new indicator; it is a continuing indicator with additional numbers to the target from the previous year
Desired performance The MQA desires higher performance and to have more HDSA employees receiving training in management skills
Indicator responsibility Learning Programmes Unit Manager (Strategic Projects)

Page 175 of 191
Indicator Title 3.2b Number of HDSA MMS employees that complete a management development programme per annum
Short definition MQA supports employers, to provide a list of HDSA employees on management development programmes
Purpose/importance To support HDSA employees that are employed within the MMS to complete training in Management
Development Programmes with an accredited institution
This indicator translates to transformation within the sector. The importance of this indicator is the contribution
towards a transformed management level at organisations within the MMS
Source/collection of data The employer submits a list of employees and ID copies
MOA with the employer and signed tripartite contracts and certified certificates
Method of calculation This is a simple addition of learners that complete the management development programme in the financial
year
Data limitations Release of employee to undergo the Management Development Programme
Type of indicator This indicator measures output and the employee completes training in the required Management Development
Programme
Calculation type The performance is cumulative
Reporting cycle The indicator is reported quarterly
New Indicator This is not a new indicator; it is a continuing indicator with additional numbers to the target from the previous
year
Desired performance The MQA desires higher performance and to have more qualified HDSA employees to become managers.
Indicator responsibility Learning Programmes Unit Manager (Strategic Projects)
Indicator Title
3.4a Number of HDSA MMS learners that enter a candidacy programme per annum
Short definition Number of unemployed/employed graduates placed in structured work-based programmes at host companies,
the graduate undergoes learning that will lead to readiness for the panel examination. This affords the
graduate workplace learning that supports the qualification that has been achieved at the HEI. The support is
for a one-year duration
List of Disciplines Supported for Internships
• Mechanical Engineering
• Electrical Engineering
• Mine Engineering
• Mine Survey
Purpose/importance To ensure that graduates get the work experience and training in the MMS which relate to their qualification in
order for them to be ready for relevant certificate of competence within the MMS
Source/collection of data Submission of application forms and, signed tripartite candidacy contracts, signed MOAs with mining
companies
Method of calculation Simple count of the number of graduates placed for the one-year work based learning in the financial year
Data limitations Host employers not adhering to set timelines for submissions of contracts which affect reporting of graduates
that are on the candidacy programmes
Type of indicator Output – graduates that are placed for the work exposure with the aim of ultimately attaining a GCC/CoC
Calculation type Cumulative
Reporting cycle Quarterly
New Indicator This is a new indicator
Desired performance All the individuals complete and attain their GCC or CoC
Indicator responsibility Learning Programmes Unit Manager (Strategic Projects)
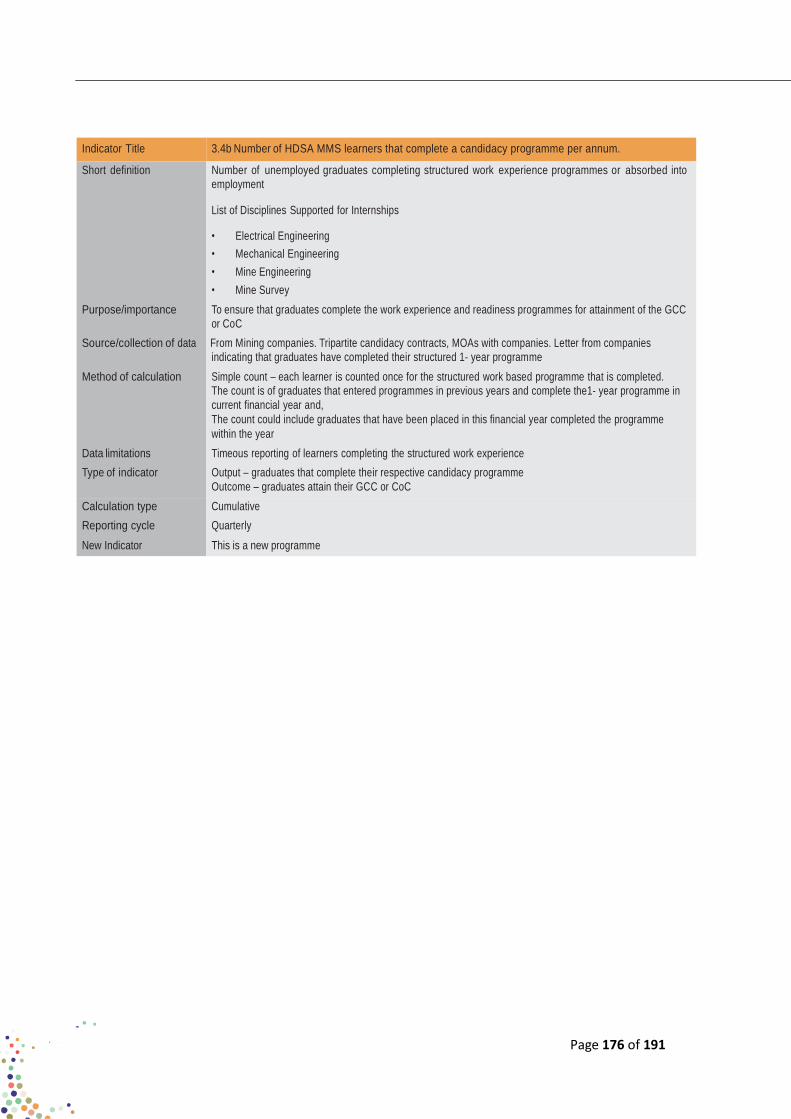
Page 176 of 191
Indicator Title 3.4b Number of HDSA MMS learners that complete a candidacy programme per annum.
Short definition Number of unemployed graduates completing structured work experience programmes or absorbed into
employment
List of Disciplines Supported for Internships
• Electrical Engineering
• Mechanical Engineering
• Mine Engineering
• Mine Survey
Purpose/importance To ensure that graduates complete the work experience and readiness programmes for attainment of the GCC
or CoC
Source/collection of data From Mining companies. Tripartite candidacy contracts, MOAs with companies. Letter from companies
indicating that graduates have completed their structured 1- year programme
Method of calculation Simple count – each learner is counted once for the structured work based programme that is completed.
The count is of graduates that entered programmes in previous years and complete the1- year programme in
current financial year and,
The count could include graduates that have been placed in this financial year completed the programme
within the year
Data limitations Timeous reporting of learners completing the structured work experience
Type of indicator Output – graduates that complete their respective candidacy programme
Outcome – graduates attain their GCC or CoC
Calculation type Cumulative
Reporting cycle Quarterly
New Indicator This is a new programme
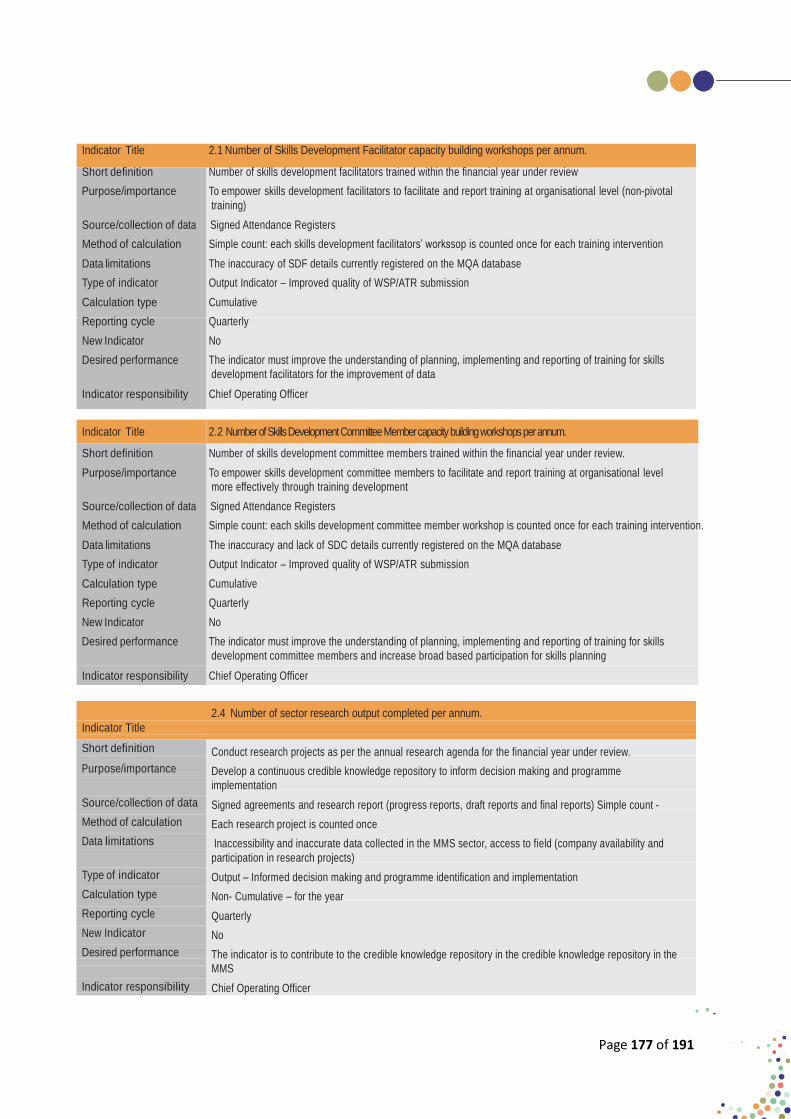
Page 177 of 191
Indicator Title 2.1 Number of Skills Development Facilitator capacity building workshops per annum.
Short definition Number of skills development facilitators trained within the financial year under review
Purpose/importance To empower skills development facilitators to facilitate and report training at organisational level (non-pivotal
training)
Source/collection of data Signed Attendance Registers
Method of calculation Simple count: each skills development facilitators’ workssop is counted once for each training intervention
Data limitations The inaccuracy of SDF details currently registered on the MQA database
Type of indicator Output Indicator – Improved quality of WSP/ATR submission
Calculation type Cumulative
Reporting cycle Quarterly
New Indicator No
Desired performance The indicator must improve the understanding of planning, implementing and reporting of training for skills
development facilitators for the improvement of data
Indicator responsibility Chief Operating Officer
Indicator Title 2.2 Number of Skills Development Committee Member capacity building workshops per annum.
Short definition Number of skills development committee members trained within the financial year under review.
Purpose/importance To empower skills development committee members to facilitate and report training at organisational level
more effectively through training development
Source/collection of data Signed Attendance Registers
Method of calculation Simple count: each skills development committee member workshop is counted once for each training intervention.
Data limitations The inaccuracy and lack of SDC details currently registered on the MQA database
Type of indicator Output Indicator – Improved quality of WSP/ATR submission
Calculation type Cumulative
Reporting cycle Quarterly
New Indicator No
Desired performance The indicator must improve the understanding of planning, implementing and reporting of training for skills
development committee members and increase broad based participation for skills planning
Indicator responsibility Chief Operating Officer
Indicator Title
Short definition
Purpose/importance
Source/collection of data
Method of calculation
Data limitations
Type of indicator
Calculation type
Reporting cycle
New Indicator
Desired performance
Indicator responsibility
2.4 Number of sector research output completed per annum.
Conduct research projects as per the annual research agenda for the financial year under review.
Develop a continuous credible knowledge repository to inform decision making and programme
implementation
Signed agreements and research report (progress reports, draft reports and final reports) Simple count -
Each research project is counted once
Inaccessibility and inaccurate data collected in the MMS sector, access to field (company availability and
participation in research projects)
Output – Informed decision making and programme identification and implementation
Non- Cumulative – for the year
Quarterly
No
The indicator is to contribute to the credible knowledge repository in the credible knowledge repository in the
MMS
Chief Operating Officer
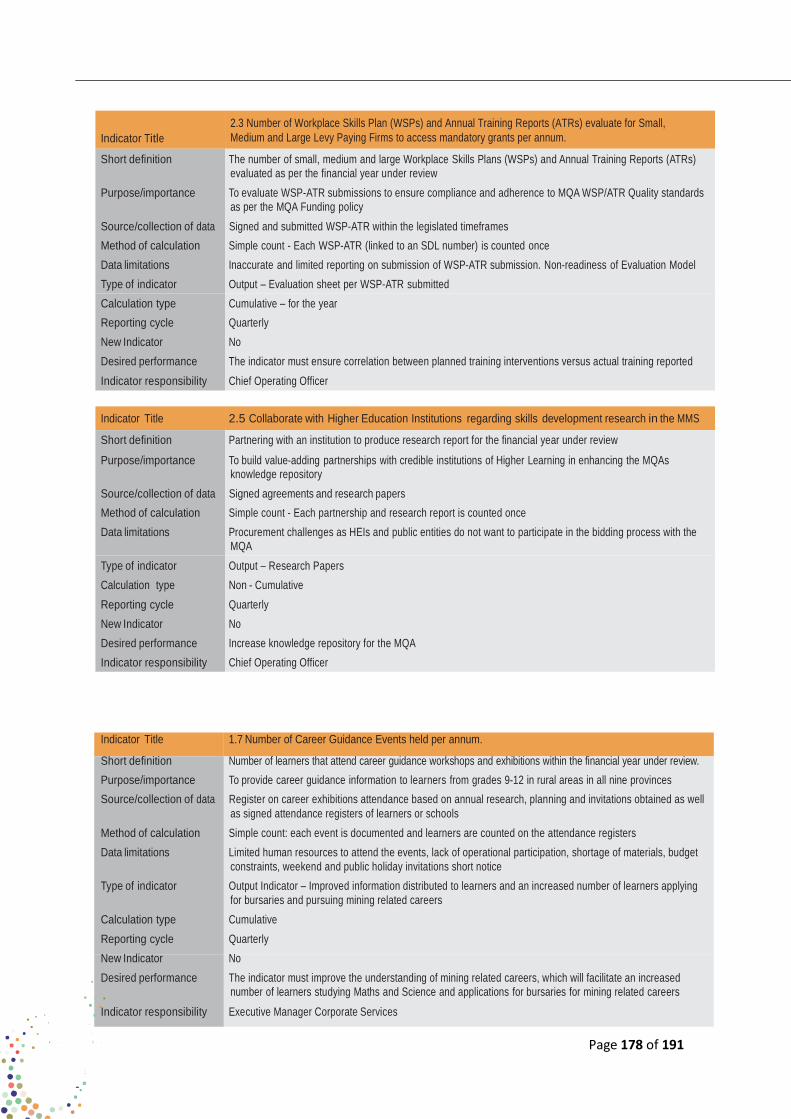
Page 178 of 191
Indicator Title
2.3 Number of Workplace Skills Plan (WSPs) and Annual Training Reports (ATRs) evaluate for Small,
Medium and Large Levy Paying Firms to access mandatory grants per annum.
Short definition The number of small, medium and large Workplace Skills Plans (WSPs) and Annual Training Reports (ATRs)
evaluated as per the financial year under review
Purpose/importance To evaluate WSP-ATR submissions to ensure compliance and adherence to MQA WSP/ATR Quality standards
as per the MQA Funding policy
Source/collection of data Signed and submitted WSP-ATR within the legislated timeframes
Method of calculation Simple count - Each WSP-ATR (linked to an SDL number) is counted once
Data limitations Inaccurate and limited reporting on submission of WSP-ATR submission. Non-readiness of Evaluation Model
Type of indicator Output – Evaluation sheet per WSP-ATR submitted
Calculation type Cumulative – for the year
Reporting cycle Quarterly
New Indicator No
Desired performance The indicator must ensure correlation between planned training interventions versus actual training reported
Indicator responsibility Chief Operating Officer
Indicator Title 2.5 Collaborate with Higher Education Institutions regarding skills development research in the MMS
Short definition Partnering with an institution to produce research report for the financial year under review
Purpose/importance To build value-adding partnerships with credible institutions of Higher Learning in enhancing the MQAs knowledge repository
Source/collection of data Signed agreements and research papers
Method of calculation Simple count - Each partnership and research report is counted once
Data limitations Procurement challenges as HEIs and public entities do not want to participate in the bidding process with the
MQA
Type of indicator Output – Research Papers
Calculation type Non - Cumulative
Reporting cycle Quarterly
New Indicator No
Desired performance Increase knowledge repository for the MQA
Indicator responsibility Chief Operating Officer
Indicator Title 1.7 Number of Career Guidance Events held per annum.
Short definition Number of learners that attend career guidance workshops and exhibitions within the financial year under review.
Purpose/importance To provide career guidance information to learners from grades 9-12 in rural areas in all nine provinces
Source/collection of data Register on career exhibitions attendance based on annual research, planning and invitations obtained as well
as signed attendance registers of learners or schools
Method of calculation Simple count: each event is documented and learners are counted on the attendance registers
Data limitations Limited human resources to attend the events, lack of operational participation, shortage of materials, budget
constraints, weekend and public holiday invitations short notice
Type of indicator Output Indicator – Improved information distributed to learners and an increased number of learners applying
for bursaries and pursuing mining related careers
Calculation type Cumulative
Reporting cycle Quarterly
New Indicator No
Desired performance The indicator must improve the understanding of mining related careers, which will facilitate an increased
number of learners studying Maths and Science and applications for bursaries for mining related careers
Indicator responsibility Executive Manager Corporate Services
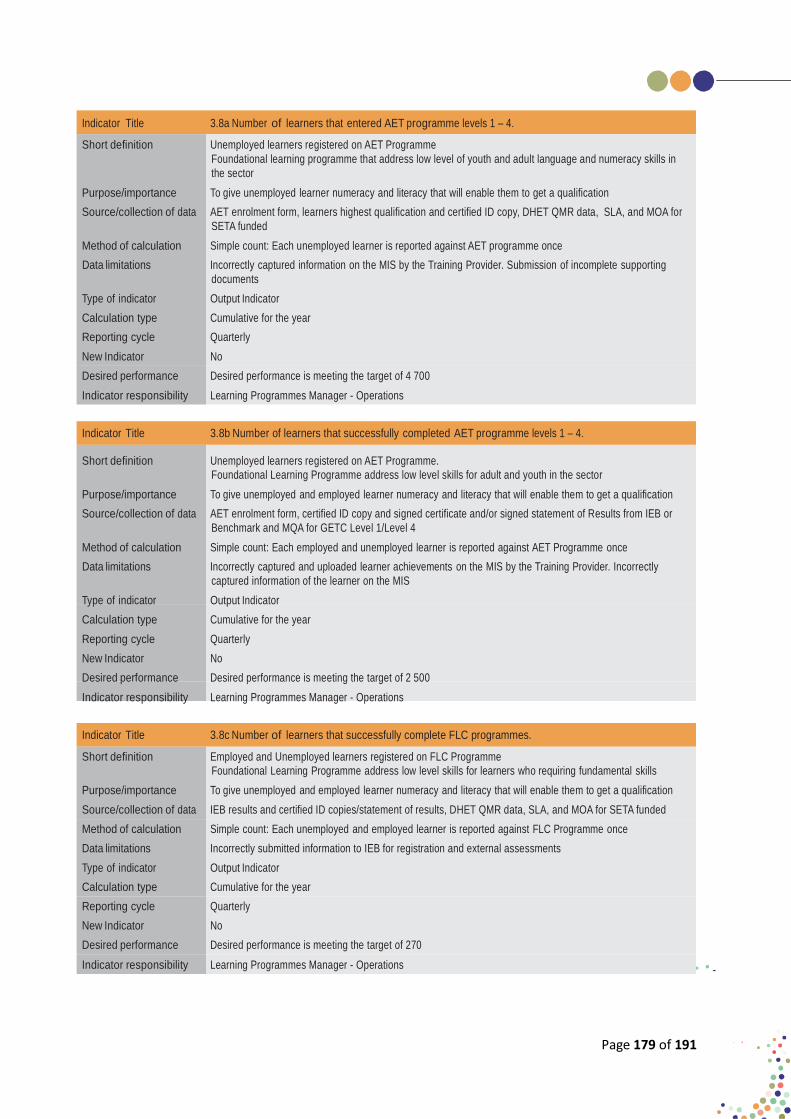
Page 179 of 191
Indicator Title 3.8a Number of learners that entered AET programme levels 1 – 4.
Short definition Unemployed learners registered on AET Programme
Foundational learning programme that address low level of youth and adult language and numeracy skills in
the sector
Purpose/importance To give unemployed learner numeracy and literacy that will enable them to get a qualification
Source/collection of data AET enrolment form, learners highest qualification and certified ID copy, DHET QMR data, SLA, and MOA for
SETA funded
Method of calculation Simple count: Each unemployed learner is reported against AET programme once
Data limitations Incorrectly captured information on the MIS by the Training Provider. Submission of incomplete supporting
documents
Type of indicator Output Indicator
Calculation type Cumulative for the year
Reporting cycle Quarterly
New Indicator No
Desired performance Desired performance is meeting the target of 4 700
Indicator responsibility Learning Programmes Manager - Operations
Indicator Title 3.8b Number of learners that successfully completed AET programme levels 1 – 4. Short definition Unemployed learners registered on AET Programme.
Foundational Learning Programme address low level skills for adult and youth in the sector
Purpose/importance To give unemployed and employed learner numeracy and literacy that will enable them to get a qualification
Source/collection of data AET enrolment form, certified ID copy and signed certificate and/or signed statement of Results from IEB or
Benchmark and MQA for GETC Level 1/Level 4
Method of calculation Simple count: Each employed and unemployed learner is reported against AET Programme once
Data limitations Incorrectly captured and uploaded learner achievements on the MIS by the Training Provider. Incorrectly
captured information of the learner on the MIS
Type of indicator Output Indicator
Calculation type Cumulative for the year
Reporting cycle Quarterly
New Indicator No
Desired performance Desired performance is meeting the target of 2 500
Indicator responsibility Learning Programmes Manager - Operations
Indicator Title 3.8c Number of learners that successfully complete FLC programmes.
Short definition Employed and Unemployed learners registered on FLC Programme
Foundational Learning Programme address low level skills for learners who requiring fundamental skills
Purpose/importance To give unemployed and employed learner numeracy and literacy that will enable them to get a qualification
Source/collection of data IEB results and certified ID copies/statement of results, DHET QMR data, SLA, and MOA for SETA funded
Method of calculation Simple count: Each unemployed and employed learner is reported against FLC Programme once
Data limitations Incorrectly submitted information to IEB for registration and external assessments
Type of indicator Output Indicator
Calculation type Cumulative for the year
Reporting cycle Quarterly
New Indicator No
Desired performance Desired performance is meeting the target of 270
Indicator responsibility Learning Programmes Manager - Operations

Page 180 of 191
Indicator Title 3.3a Number of Employees that enter the Occupational Health and Safety Representatives skills programme per annum
Short definition Employed learners registered on OHS Programme
It’s a core contextualised unit standards that addresses Health and Safety in the sector
Purpose/importance To give employed learner a credit bearing Health and Safety certificate
Source/collection of data Skills Programmes Enrolment form, signed certificate/signed statement of results and certified ID copy, DHET
QMR data, LA, and MOA for SETA funded
Method of calculation Simple count: Each employed learner is reported against OHS Programme once
Data limitations Incorrectly captured information on the MIS by the Training Provider. Submission of incomplete supporting
documents
Type of indicator Output Indicator
Calculation type Cumulative for the year
Reporting cycle Quarterly
New Indicator No
Desired performance Desired performance is meeting the target of 6 200
Indicator responsibility Learning Programmes Manager - Operations
Indicator Title 3.3b Number of Employees that successfully complete the Occupational Health and Safety Representatives skills programme per annum
Short definition Employed learners completing OHS Programme
It’s a core contextualised unit standards that addresses Health and Safety in the sector
Purpose/importance To give employed learner a credit bearing Health and Safety certificate
Source/collection of data Skills Programmes Enrolment form, signed certificate/signed statement of results and certified ID copy, DHET
QMR data, SLA and MOA for SETA funded
Method of calculation Simple count: Each employed learner is reported against OHS Programme once.
Data limitations Incorrectly captured information on the MIS by the Training Provider. Submission of incomplete supporting
documents
Type of indicator Output Indicator
Calculation type Cumulative for the year
Reporting cycle Quarterly
New Indicator No
Desired performance Desired performance is meeting the target of 6 200
Indicator responsibility Learning Programmes Manager - Operations

Page 181 of 191
Indicator Title 3.11a Number of undergraduates that enter a workplace experience programme per annum.
Short definition Number of learners placed for P1 and P2 in the financial year pursuing careers within the MMS in the
following disciplines:
• Jewellery Design Manufacturing
• Metallurgical Engineering
• Geology
• Mining Engineering
• Mechanical Engineering
• Mine Surveying
• Electrical Engineering
• Chemical Engineering (Mineral Processing)
• Environmental Health and Management
• Analytical Chemistry
• Electro Mechanical Engineering
• Industrial Engineering
Purpose/importance To provide structured work experience to students in order to obtain mining related qualifications from
universities of technologies.
Source/collection of data Host employers provide MQA with the list of students placed or to be placed for structured work experience
with their work experience application forms, id copies certified and academic records certified , signed
tripartite agreements and signed Memorandum of Agreements
Method of calculation Simple count of total number of students entered work experience programmes within the financial year Data
limitations Host employers not adhering to set timelines for reporting and submitting accurate total number of students placed
Type of indicator Output-students entering their structured work experience programme
Calculation type Cumulative
Reporting cycle Quarterly- reporting within a financial year to the Department of High Education and Training
New Indicator No significant change from previous year
Desired performance Students graduating after completing structured work experience programme
Indicator responsibility Learning Programmes Unit Manager (Strategic Projects)
Indicator Title 3.11b Number of undergraduates that complete a work place experience programme per annum.
Short definition Number of learners completing P1 and P2 programmes with the intention of attaining their qualifications in the
following disciplines:
• Jewellery Design Manufacturing
• Metallurgical Engineering
• Geology
• Mining Engineering
• Mechanical Engineering
• Mine Surveying
• Electrical Engineering
• Chemical Engineering (Mineral Processing)
• Environmental Health and Management
• Analytical Chemistry
• Electro Mechanical Engineering
• Industrial Engineering
Purpose/importance To provide structured work experience to students in order for them to obtain mining related qualifications from
universities of technology
Source/collection of data Host employers provide MQA with a list of students who completed structured work experience programmes.
ID copies certified and academic records certified, signed tripartite agreements and signed Memorandum of
Agreements. Signed letters from the host employers confirming the completions of the work experience
programme by the students
Method of calculation Simple count of total number of students completed Work Experience (WE) programme in the current financial year.
Data limitations Host employers not adhering to set timelines for reporting and submitting letters and list of accurate total
number of students that completed the WE programme
Type of indicator Output- students completing their structured work experience programme
Calculation type Cumulative
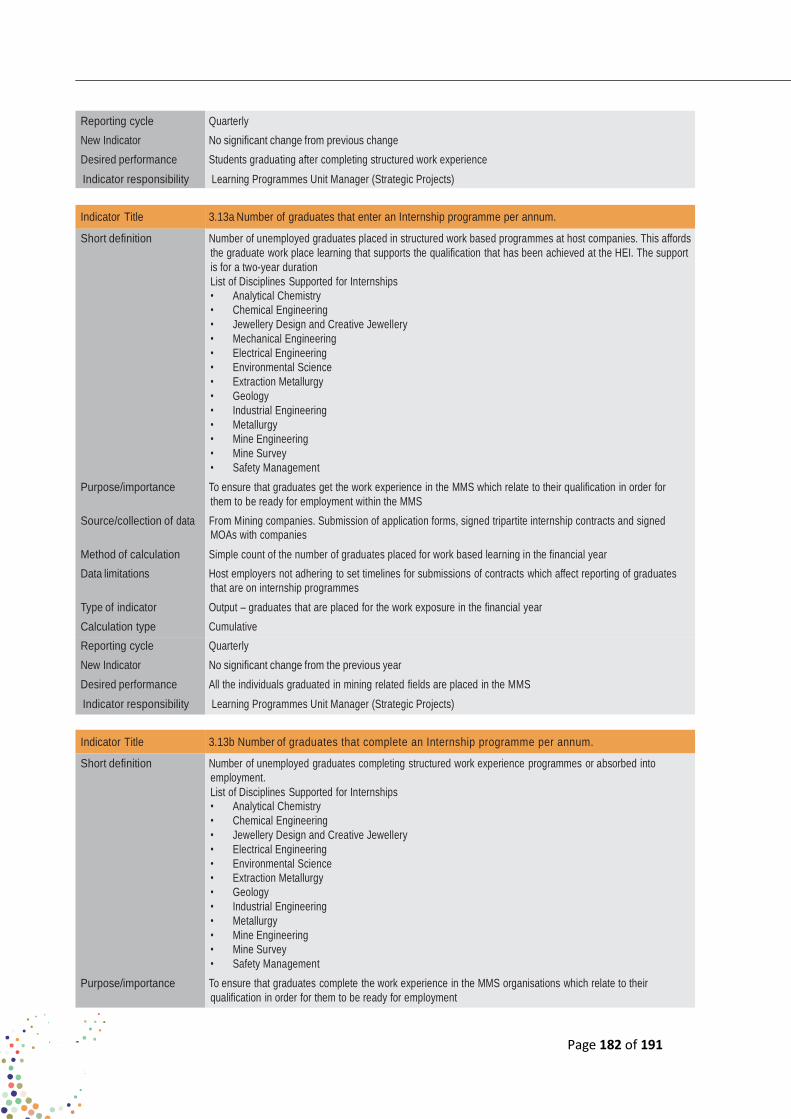
Page 182 of 191
Reporting cycle Quarterly
New Indicator No significant change from previous change
Desired performance Students graduating after completing structured work experience
Indicator responsibility Learning Programmes Unit Manager (Strategic Projects)
Indicator Title 3.13a Number of graduates that enter an Internship programme per annum.
Short definition Number of unemployed graduates placed in structured work based programmes at host companies. This affords
the graduate work place learning that supports the qualification that has been achieved at the HEI. The support
is for a two-year duration
List of Disciplines Supported for Internships
• Analytical Chemistry
• Chemical Engineering
• Jewellery Design and Creative Jewellery
• Mechanical Engineering
• Electrical Engineering
• Environmental Science
• Extraction Metallurgy
• Geology
• Industrial Engineering
• Metallurgy
• Mine Engineering
• Mine Survey
• Safety Management
Purpose/importance To ensure that graduates get the work experience in the MMS which relate to their qualification in order for
them to be ready for employment within the MMS
Source/collection of data From Mining companies. Submission of application forms, signed tripartite internship contracts and signed
MOAs with companies
Method of calculation Simple count of the number of graduates placed for work based learning in the financial year
Data limitations Host employers not adhering to set timelines for submissions of contracts which affect reporting of graduates
that are on internship programmes
Type of indicator Output – graduates that are placed for the work exposure in the financial year
Calculation type Cumulative
Reporting cycle Quarterly
New Indicator No significant change from the previous year
Desired performance All the individuals graduated in mining related fields are placed in the MMS
Indicator responsibility Learning Programmes Unit Manager (Strategic Projects)
Indicator Title 3.13b Number of graduates that complete an Internship programme per annum.
Short definition Number of unemployed graduates completing structured work experience programmes or absorbed into
employment.
List of Disciplines Supported for Internships
• Analytical Chemistry
• Chemical Engineering
• Jewellery Design and Creative Jewellery
• Electrical Engineering
• Environmental Science
• Extraction Metallurgy
• Geology
• Industrial Engineering
• Metallurgy
• Mine Engineering
• Mine Survey
• Safety Management
Purpose/importance To ensure that graduates complete the work experience in the MMS organisations which relate to their
qualification in order for them to be ready for employment
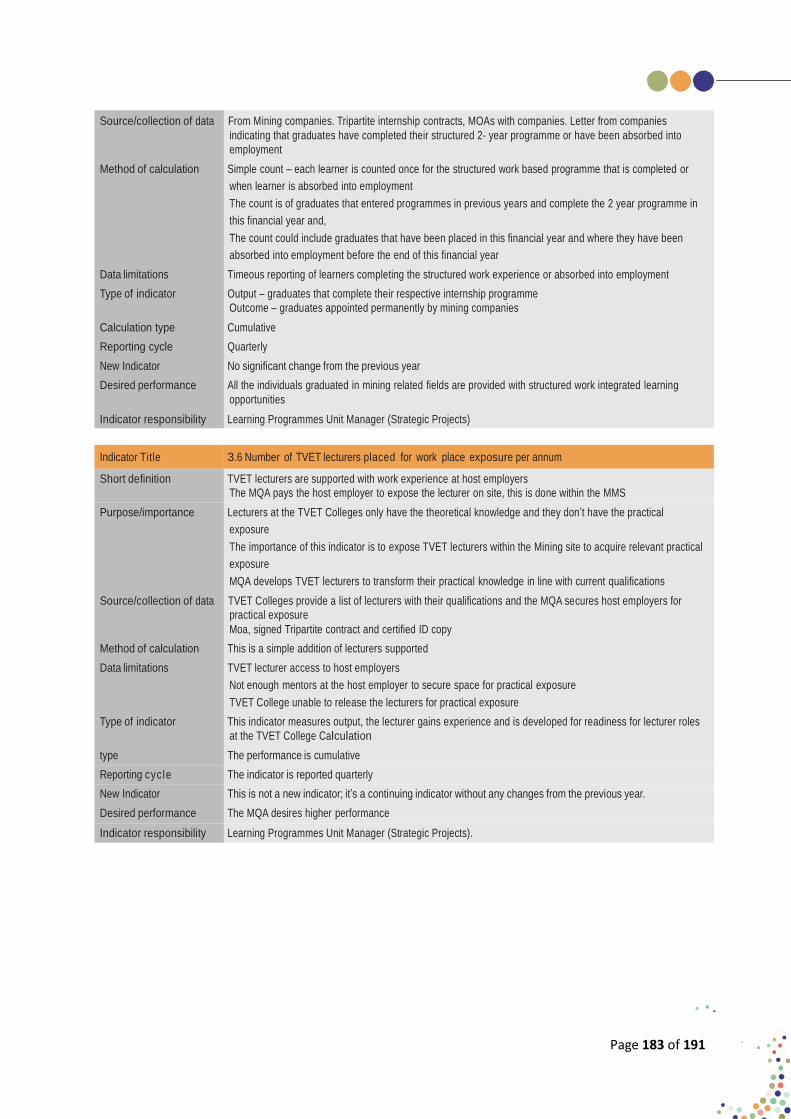
Page 183 of 191
Source/collection of data From Mining companies. Tripartite internship contracts, MOAs with companies. Letter from companies
indicating that graduates have completed their structured 2- year programme or have been absorbed into
employment
Method of calculation Simple count – each learner is counted once for the structured work based programme that is completed or
when learner is absorbed into employment
The count is of graduates that entered programmes in previous years and complete the 2 year programme in
this financial year and,
The count could include graduates that have been placed in this financial year and where they have been
absorbed into employment before the end of this financial year
Data limitations Timeous reporting of learners completing the structured work experience or absorbed into employment
Type of indicator Output – graduates that complete their respective internship programme
Outcome – graduates appointed permanently by mining companies
Calculation type Cumulative
Reporting cycle Quarterly
New Indicator No significant change from the previous year
Desired performance All the individuals graduated in mining related fields are provided with structured work integrated learning
opportunities
Indicator responsibility Learning Programmes Unit Manager (Strategic Projects)
Indicator Title 3.6 Number of TVET lecturers placed for work place exposure per annum
Short definition TVET lecturers are supported with work experience at host employers
The MQA pays the host employer to expose the lecturer on site, this is done within the MMS
Purpose/importance Lecturers at the TVET Colleges only have the theoretical knowledge and they don’t have the practical
exposure
The importance of this indicator is to expose TVET lecturers within the Mining site to acquire relevant practical
exposure
MQA develops TVET lecturers to transform their practical knowledge in line with current qualifications
Source/collection of data TVET Colleges provide a list of lecturers with their qualifications and the MQA secures host employers for
practical exposure
Moa, signed Tripartite contract and certified ID copy
Method of calculation This is a simple addition of lecturers supported
Data limitations TVET lecturer access to host employers
Not enough mentors at the host employer to secure space for practical exposure
TVET College unable to release the lecturers for practical exposure
Type of indicator This indicator measures output, the lecturer gains experience and is developed for readiness for lecturer roles
at the TVET College Calculation
type The performance is cumulative
Reporting cycle The indicator is reported quarterly
New Indicator This is not a new indicator; it’s a continuing indicator without any changes from the previous year.
Desired performance The MQA desires higher performance
Indicator responsibility Learning Programmes Unit Manager (Strategic Projects).
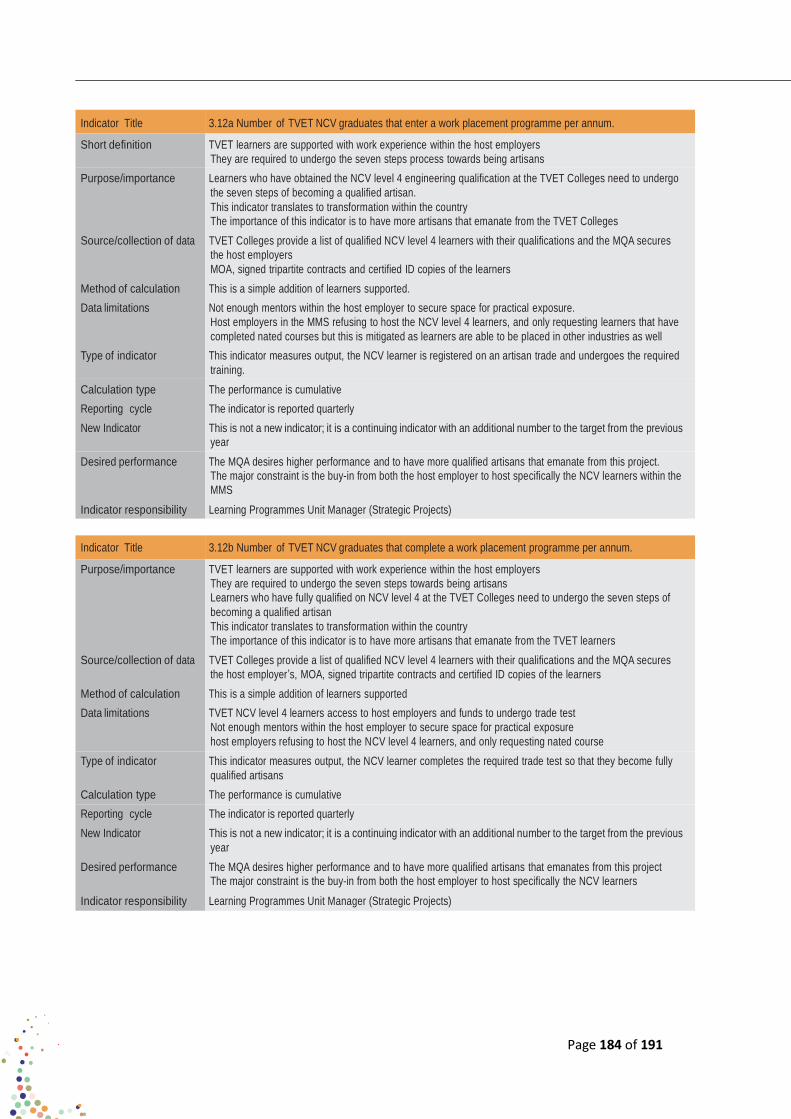
Page 184 of 191
Indicator Title 3.12a Number of TVET NCV graduates that enter a work placement programme per annum.
Short definition TVET learners are supported with work experience within the host employers
They are required to undergo the seven steps process towards being artisans
Purpose/importance Learners who have obtained the NCV level 4 engineering qualification at the TVET Colleges need to undergo
the seven steps of becoming a qualified artisan.
This indicator translates to transformation within the country
The importance of this indicator is to have more artisans that emanate from the TVET Colleges
Source/collection of data TVET Colleges provide a list of qualified NCV level 4 learners with their qualifications and the MQA secures
the host employers
MOA, signed tripartite contracts and certified ID copies of the learners
Method of calculation This is a simple addition of learners supported.
Data limitations Not enough mentors within the host employer to secure space for practical exposure.
Host employers in the MMS refusing to host the NCV level 4 learners, and only requesting learners that have
completed nated courses but this is mitigated as learners are able to be placed in other industries as well
Type of indicator This indicator measures output, the NCV learner is registered on an artisan trade and undergoes the required
training.
Calculation type The performance is cumulative
Reporting cycle The indicator is reported quarterly
New Indicator This is not a new indicator; it is a continuing indicator with an additional number to the target from the previous
year
Desired performance The MQA desires higher performance and to have more qualified artisans that emanate from this project.
The major constraint is the buy-in from both the host employer to host specifically the NCV learners within the
MMS
Indicator responsibility Learning Programmes Unit Manager (Strategic Projects)
Indicator Title 3.12b Number of TVET NCV graduates that complete a work placement programme per annum.
Purpose/importance TVET learners are supported with work experience within the host employers
They are required to undergo the seven steps towards being artisans
Learners who have fully qualified on NCV level 4 at the TVET Colleges need to undergo the seven steps of
becoming a qualified artisan
This indicator translates to transformation within the country
The importance of this indicator is to have more artisans that emanate from the TVET learners
Source/collection of data TVET Colleges provide a list of qualified NCV level 4 learners with their qualifications and the MQA secures
the host employer’s, MOA, signed tripartite contracts and certified ID copies of the learners
Method of calculation This is a simple addition of learners supported
Data limitations TVET NCV level 4 learners access to host employers and funds to undergo trade test
Not enough mentors within the host employer to secure space for practical exposure
host employers refusing to host the NCV level 4 learners, and only requesting nated course
Type of indicator This indicator measures output, the NCV learner completes the required trade test so that they become fully
qualified artisans
Calculation type The performance is cumulative
Reporting cycle The indicator is reported quarterly
New Indicator This is not a new indicator; it is a continuing indicator with an additional number to the target from the previous
year
Desired performance The MQA desires higher performance and to have more qualified artisans that emanates from this project
The major constraint is the buy-in from both the host employer to host specifically the NCV learners
Indicator responsibility Learning Programmes Unit Manager (Strategic Projects)
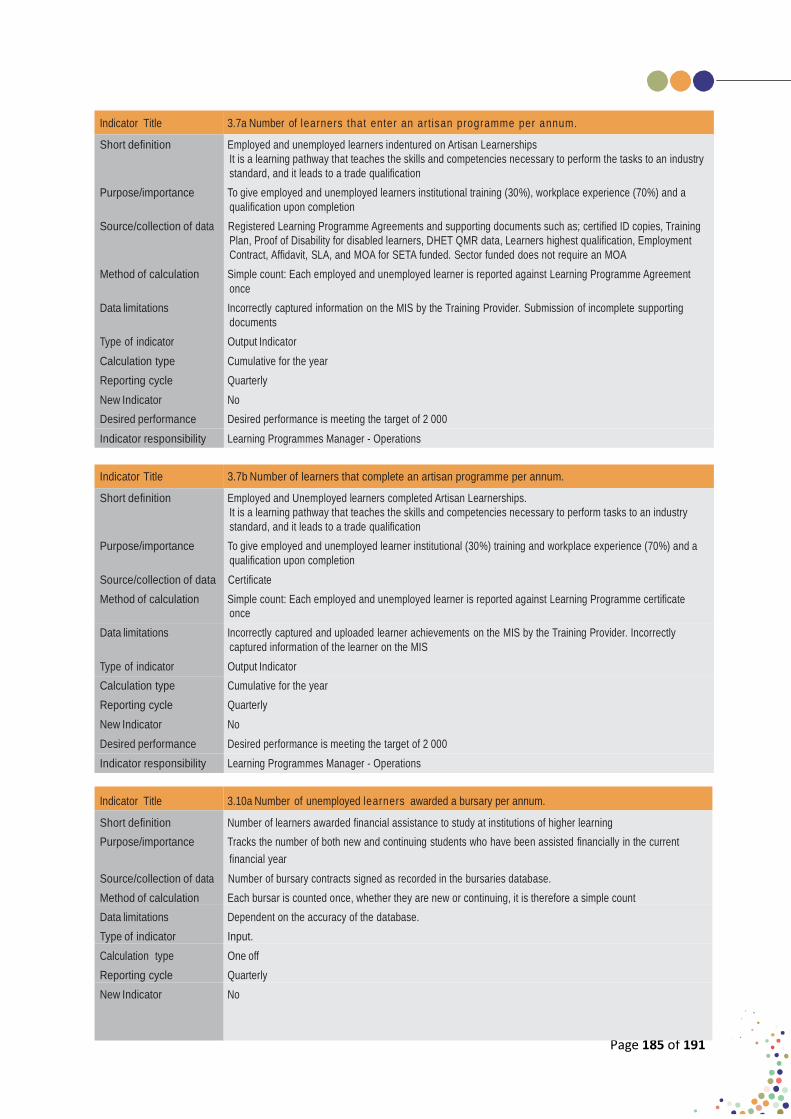
Page 185 of 191
Indicator Title 3.7a Number of learners that enter an artisan programme per annum.
Short definition Employed and unemployed learners indentured on Artisan Learnerships
It is a learning pathway that teaches the skills and competencies necessary to perform the tasks to an industry
standard, and it leads to a trade qualification
Purpose/importance To give employed and unemployed learners institutional training (30%), workplace experience (70%) and a
qualification upon completion
Source/collection of data Registered Learning Programme Agreements and supporting documents such as; certified ID copies, Training
Plan, Proof of Disability for disabled learners, DHET QMR data, Learners highest qualification, Employment
Contract, Affidavit, SLA, and MOA for SETA funded. Sector funded does not require an MOA
Method of calculation Simple count: Each employed and unemployed learner is reported against Learning Programme Agreement
once
Data limitations Incorrectly captured information on the MIS by the Training Provider. Submission of incomplete supporting
documents
Type of indicator Output Indicator
Calculation type Cumulative for the year
Reporting cycle Quarterly
New Indicator No
Desired performance Desired performance is meeting the target of 2 000
Indicator responsibility Learning Programmes Manager - Operations
Indicator Title 3.7b Number of learners that complete an artisan programme per annum.
Short definition Employed and Unemployed learners completed Artisan Learnerships.
It is a learning pathway that teaches the skills and competencies necessary to perform tasks to an industry
standard, and it leads to a trade qualification
Purpose/importance To give employed and unemployed learner institutional (30%) training and workplace experience (70%) and a
qualification upon completion
Source/collection of data Certificate
Method of calculation Simple count: Each employed and unemployed learner is reported against Learning Programme certificate
once
Data limitations Incorrectly captured and uploaded learner achievements on the MIS by the Training Provider. Incorrectly
captured information of the learner on the MIS
Type of indicator Output Indicator
Calculation type Cumulative for the year
Reporting cycle Quarterly
New Indicator No
Desired performance Desired performance is meeting the target of 2 000
Indicator responsibility Learning Programmes Manager - Operations
Indicator Title 3.10a Number of unemployed learners awarded a bursary per annum.
Short definition Number of learners awarded financial assistance to study at institutions of higher learning
Purpose/importance Tracks the number of both new and continuing students who have been assisted financially in the current
financial year
Source/collection of data Number of bursary contracts signed as recorded in the bursaries database.
Method of calculation Each bursar is counted once, whether they are new or continuing, it is therefore a simple count
Data limitations Dependent on the accuracy of the database.
Type of indicator Input.
Calculation type One off
Reporting cycle Quarterly
New Indicator No

Page 186 of 191
Desired performance The aim is to ensure we achieve bursary allocations of 100% as per the APP and the SLA Indicator responsibility Operations Process Manager
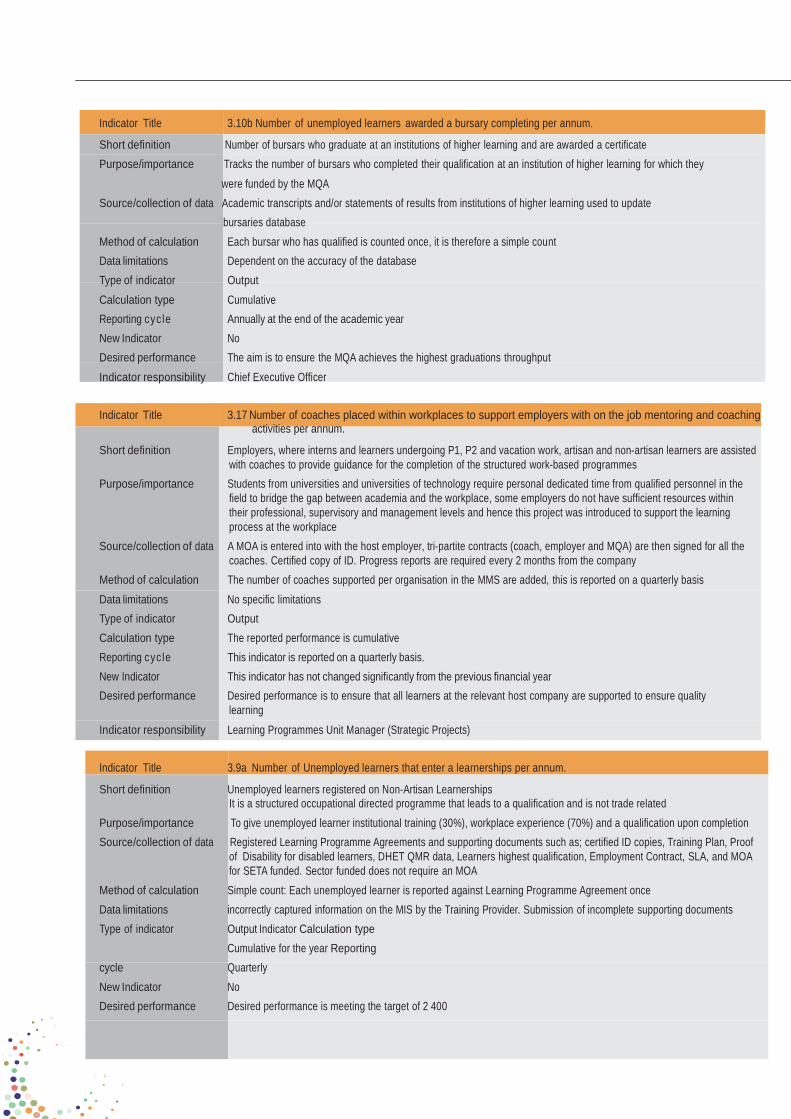
Page 187 of 191
Indicator Title 3.10b Number of unemployed learners awarded a bursary completing per annum.
Short definition Number of bursars who graduate at an institutions of higher learning and are awarded a certificate
Purpose/importance Tracks the number of bursars who completed their qualification at an institution of higher learning for which they
were funded by the MQA
Source/collection of data Academic transcripts and/or statements of results from institutions of higher learning used to update
bursaries database
Method of calculation Each bursar who has qualified is counted once, it is therefore a simple count
Data limitations Dependent on the accuracy of the database
Type of indicator Output
Calculation type Cumulative
Reporting cycle Annually at the end of the academic year
New Indicator No
Desired performance The aim is to ensure the MQA achieves the highest graduations throughput
Indicator responsibility Chief Executive Officer
Indicator Title 3.17 Number of coaches placed within workplaces to support employers with on the job mentoring and coaching activities per annum.
Short definition Employers, where interns and learners undergoing P1, P2 and vacation work, artisan and non-artisan learners are assisted
with coaches to provide guidance for the completion of the structured work-based programmes
Purpose/importance Students from universities and universities of technology require personal dedicated time from qualified personnel in the
field to bridge the gap between academia and the workplace, some employers do not have sufficient resources within
their professional, supervisory and management levels and hence this project was introduced to support the learning
process at the workplace
Source/collection of data A MOA is entered into with the host employer, tri-partite contracts (coach, employer and MQA) are then signed for all the
coaches. Certified copy of ID. Progress reports are required every 2 months from the company
Method of calculation The number of coaches supported per organisation in the MMS are added, this is reported on a quarterly basis
Data limitations No specific limitations
Type of indicator Output
Calculation type The reported performance is cumulative
Reporting cycle This indicator is reported on a quarterly basis.
New Indicator This indicator has not changed significantly from the previous financial year
Desired performance Desired performance is to ensure that all learners at the relevant host company are supported to ensure quality
learning
Indicator responsibility Learning Programmes Unit Manager (Strategic Projects)
Indicator Title 3.9a Number of Unemployed learners that enter a learnerships per annum.
Short definition Unemployed learners registered on Non-Artisan Learnerships
It is a structured occupational directed programme that leads to a qualification and is not trade related
Purpose/importance To give unemployed learner institutional training (30%), workplace experience (70%) and a qualification upon completion
Source/collection of data Registered Learning Programme Agreements and supporting documents such as; certified ID copies, Training Plan, Proof
of Disability for disabled learners, DHET QMR data, Learners highest qualification, Employment Contract, SLA, and MOA
for SETA funded. Sector funded does not require an MOA
Method of calculation Simple count: Each unemployed learner is reported against Learning Programme Agreement once
Data limitations incorrectly captured information on the MIS by the Training Provider. Submission of incomplete supporting documents
Type of indicator Output Indicator Calculation type
Cumulative for the year Reporting
cycle Quarterly
New Indicator No
Desired performance Desired performance is meeting the target of 2 400

Page 188 of 191
Indicator responsibility Learning Programmes Manager - Operations
Indicator Title 3.9b Number of Unemployed learners that complete a learnership per annum.
Short definition Unemployed learners completed Non-Artisan Learnerships
It is a structured, occupational directed programme that leads to a qualification and is not trade related
Purpose/importance To give unemployed learner institutional training (30%), workplace experience (70%) and a qualification upon
completion
Source/collection of data Signed certificate and/or signed statement of results
Method of calculation Simple count: Each unemployed learner is reported against Learning Programme certificate once
Data limitations incorrectly captured and uploaded learner achievements on the MIS by the Training Provider. Incorrectly
captured information of the learner on the MIS
Type of indicator Output Indicator
Calculation type Cumulative for the year
Reporting cycle Quarterly
New Indicator No
Desired performance Desired performance is meeting the target of 1 000
Indicator responsibility Learning Programmes Manager - Operations
Indicator Title 3.1a Number of employees entering a learnership per annum.
Short definition Employed learners registered on Non-Artisan Learnerships
It is a structured, occupational directed programme that leads to a qualification and is not trade related
Purpose/importance To give employed learner institutional training (30%), practical experience (70%) and a qualification upon
completion
Source/collection of data Registered Learning Programme Agreements and supporting documents such as; certified ID copies, Training
Plan, Proof of Disability for disabled learners, DHET QMR data, Learners highest qualification, Employment
Contract/Record of Service, SLA, and MOA for SETA funded. Sector funded does not require an MOA.
Method of calculation Simple count: Each employed learner is reported against Learning Programme Agreement once
Data limitations Incorrectly captured information on the MIS by the Training Provider. Submission of incomplete supporting
documents
Type of indicator Output Indicator
Calculation type Cumulative for the year
Reporting cycle Quarterly
New Indicator No
Desired performance Desired performance is meeting the target of 3 000
Indicator responsibility Learning Programmes Manager - Operations
Indicator Title 3.1b Number of employees completing a learnership per annum.
Short definition Employed learners completed Non-Artisan Learnerships
It is a structured, occupational directed programme that leads to a qualification and is not trade related
Purpose/importance To give Employed learner institutional training (30%), practical experience (70%) and a qualification upon
completion
Source/collection of data Certificate and/or statement of results
Method of calculation Simple count: Each employed learner is reported against Learning Programme certificate once
Data limitations incorrectly captured and uploaded learner achievements on the MIS by the Training Provider. Incorrectly
captured information of the learner on the MIS
Type of indicator Output indicator
Calculation type Cumulative for the year
Reporting cycle Quarterly
New Indicator No
Desired performance Desired performance is meeting the target of 1 500

Page 189 of 191
Indicator Title 3.1c Number of learners t h a t c o m p l e t e RPL for Learnerships
Short definition To recognise prior skills and competencies attained
Purpose/importance To give employed learners institutional training and a qualification upon completion
Source/collection of data Registered Learning Programme Agreements and supporting documents such as; certified ID copies, Training
Plan, Proof of Disability for disabled learners, DHET QMR data, Learners highest qualification, Employment
Contract, SLA, and MOA for SETA funded. Sector funded does not require an MOA
Method of calculation Simple count: Each employed learner is reported against Learning Programme Agreement once
Data limitations Incorrectly captured information on the MIS by the Training Provider. Submission of incomplete supporting
documents
Type of indicator Output Indicator
Calculation type Cumulative for the year
Reporting cycle Quarterly
New Indicator No
Desired performance Desired performance is meeting the target of 200
Indicator responsibility Learning Programmes Manager - Operations
Indicator Title
1.6 Annual international literacy day event hosted .
Short definition Number of delegates that attended the event
Purpose/importance To celebrate AET achievements
Source/collection of data Signed attendance registers
Method of calculation Simple count: Each learner, company group and delegates are counted
Data limitations Delays in Learning Programmes unit identifying learners in the region, NUM and task team repre-sentatives
not sourcing appropriate learners
Type of indicator Output Indicator – Improve relationships with sector, labour and AET learners
Calculation type Once off annually
Reporting cycle Bi-annually
New Indicator No
Desired performance Sourcing AET learners in partnership with LP Unit extend invitations to identify target audience. Promote the
event and ensure to the MMS and successfully co-host a successful one day event Inter-national Literacy Day
event annually on the first Saturday of September to AET celebrate achieve-ments
Indicator responsibility Executive Manager Corporate Services
Indicator Title 4.2 Review: Number of updated/amended qualifications, Skills programmes, learning materials and learnerships as per sector needs.
Short definition Review: Number of updated/amended qualifications, Skills programmes, learning materials and learnerships
as per sector needs
Purpose/importance Provide quality support to the sector for delivery quality learning programmes and alignment updated
legislations, qualifications and SSP
Source/collection of data Access records on SSP, Mining Qualifications Frameworks, registered qualifications (including NLRD) and
amended legislation; the DHET list of occupations in high demand
Method of calculation Continuous alerts from the SAQA NLRD data loads team and legislation amendments. Continuous updated
information through SSP, OFO Codes and MQF
Data limitations Inaccuracy of the records provided through the SSP and structure of the legislation. Insufficient subject matter
experts in various areas. Approval of applications for qualification development at QCTO
Type of indicator Output Indicator
Calculation type Cumulative for the year
Reporting cycle Quarterly
New Indicator No
Desired performance Development of "Fit for Purpose" quality developed learning programmes and materials that meet the needs
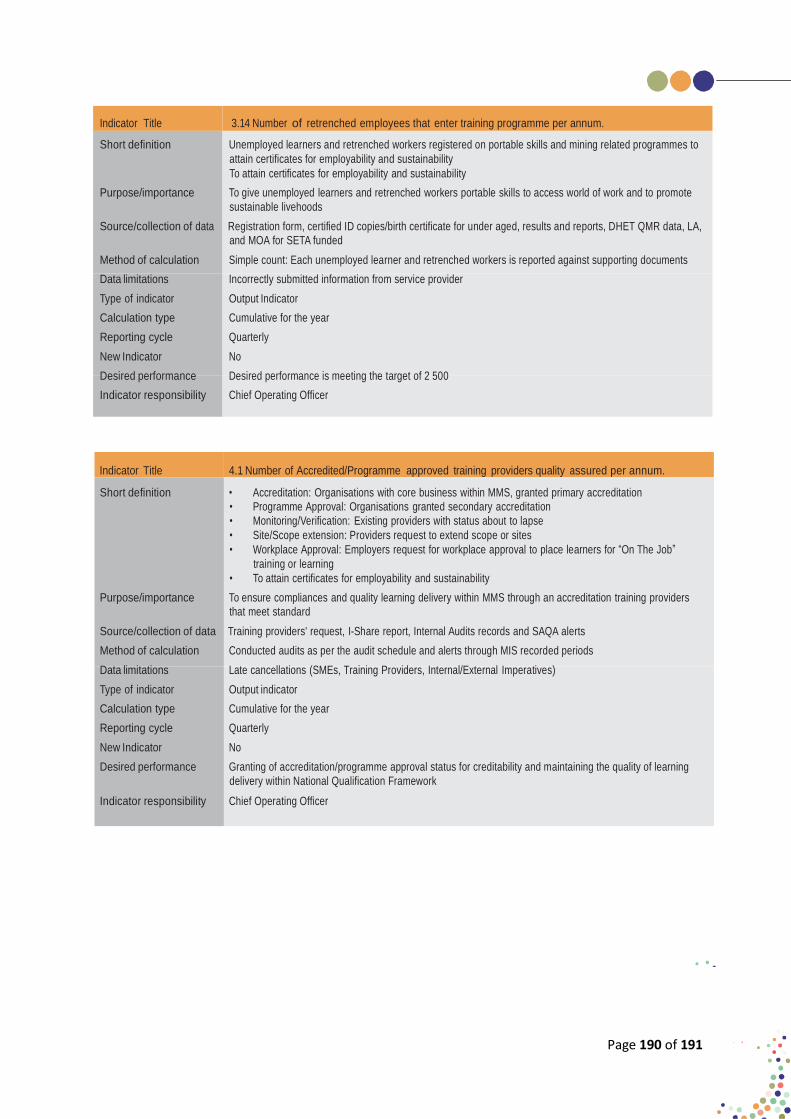
Page 190 of 191
Indicator Title 3.14 Number of retrenched employees that enter training programme per annum.
Short definition Unemployed learners and retrenched workers registered on portable skills and mining related programmes to
attain certificates for employability and sustainability
To attain certificates for employability and sustainability
Purpose/importance To give unemployed learners and retrenched workers portable skills to access world of work and to promote
sustainable livehoods
Source/collection of data Registration form, certified ID copies/birth certificate for under aged, results and reports, DHET QMR data, LA,
and MOA for SETA funded
Method of calculation Simple count: Each unemployed learner and retrenched workers is reported against supporting documents
Data limitations Incorrectly submitted information from service provider
Type of indicator Output Indicator
Calculation type Cumulative for the year
Reporting cycle Quarterly
New Indicator No
Desired performance Desired performance is meeting the target of 2 500
Indicator responsibility Chief Operating Officer
Indicator Title 4.1 Number of Accredited/Programme approved training providers quality assured per annum.
Short definition • Accreditation: Organisations with core business within MMS, granted primary accreditation
• Programme Approval: Organisations granted secondary accreditation
• Monitoring/Verification: Existing providers with status about to lapse
• Site/Scope extension: Providers request to extend scope or sites
• Workplace Approval: Employers request for workplace approval to place learners for “On The Job”
training or learning
• To attain certificates for employability and sustainability
Purpose/importance To ensure compliances and quality learning delivery within MMS through an accreditation training providers
that meet standard
Source/collection of data Training providers' request, I-Share report, Internal Audits records and SAQA alerts
Method of calculation Conducted audits as per the audit schedule and alerts through MIS recorded periods
Data limitations Late cancellations (SMEs, Training Providers, Internal/External Imperatives)
Type of indicator Output indicator
Calculation type Cumulative for the year
Reporting cycle Quarterly
New Indicator No
Desired performance Granting of accreditation/programme approval status for creditability and maintaining the quality of learning
delivery within National Qualification Framework
Indicator responsibility Chief Operating Officer

Page 191 of 191
Indicator Title 4.3 Number of HDSA training providers accredited.
Short definition Support new applicant HDSA training providers to access accreditation
Purpose/importance To ensure that the Mining and Minerals Sector has sufficient skilled and competent HDSA to conduct quality
training
To support transformation for the Mining and Mineral Sector
Source/collection of data Training Providers submitted application forms, Letter of Intent
Method of calculation Number of HDSA accredited
Data limitations Incorrect information and business access in the sector
Type of indicator Output Indicator
Calculation type Cumulative for the
year Reporting cycle Quarterly
New Indicator No
Desired performance To increase the number for HDSA training providers within the MMS
Indicator responsibility Chief Operating Officer