Mining Associations Using Directed Hypergraphs
43
Introduction Theory Experimentation Conclusion Mining Associations Using Directed Hypergraphs Ramanuja Simha (University of Delaware), Rahul Tripathi (Wallmart, Information Services), Mayur Thakur (Google Inc.) ICDE 2012 Simha et al Mining Associations Using Directed Hypergraphs 1 of 43
Transcript of Mining Associations Using Directed Hypergraphs
IntroductionTheory
ExperimentationConclusion
Mining Associations Using Directed Hypergraphs
Ramanuja Simha (University of Delaware),Rahul Tripathi (Wallmart, Information Services),
Mayur Thakur (Google Inc.)
ICDE 2012
Simha et al Mining Associations Using Directed Hypergraphs 1 of 43
IntroductionTheory
ExperimentationConclusion
1 IntroductionMotivationDirected Hypergraphs
2 TheoryDatabase ModelingAssociation-Based SimilarityComputational Problems
3 ExperimentationAssociation CharacteristicsAssociation-Based SimilarityComputational Problems
4 ConclusionConclusions and Future Work
Simha et al Mining Associations Using Directed Hypergraphs 2 of 43
IntroductionTheory
ExperimentationConclusion
MotivationDirected Hypergraphs
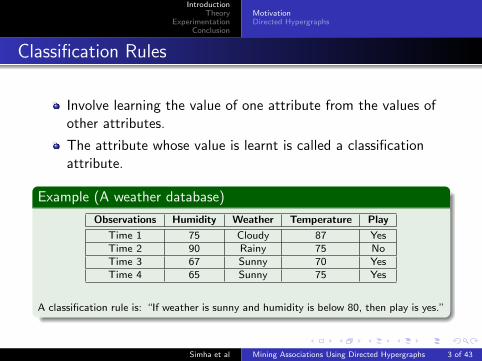
Classification Rules
Involve learning the value of one attribute from the values ofother attributes.
The attribute whose value is learnt is called a classificationattribute.
Example (A weather database)
Observations Humidity Weather Temperature Play
Time 1 75 Cloudy 87 YesTime 2 90 Rainy 75 NoTime 3 67 Sunny 70 YesTime 4 65 Sunny 75 Yes
A classification rule is: “If weather is sunny and humidity is below 80, then play is yes.”
Simha et al Mining Associations Using Directed Hypergraphs 3 of 43
IntroductionTheory
ExperimentationConclusion
MotivationDirected Hypergraphs
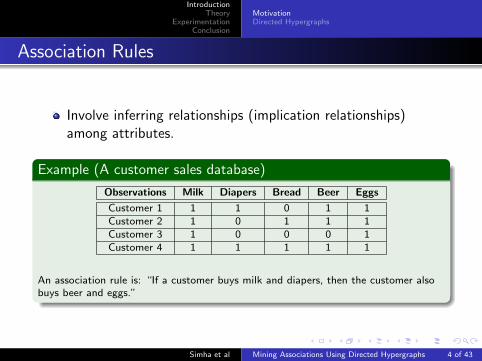
Association Rules
Involve inferring relationships (implication relationships)among attributes.
Example (A customer sales database)
Observations Milk Diapers Bread Beer Eggs
Customer 1 1 1 0 1 1Customer 2 1 0 1 1 1Customer 3 1 0 0 0 1Customer 4 1 1 1 1 1
An association rule is: “If a customer buys milk and diapers, then the customer alsobuys beer and eggs.”
Simha et al Mining Associations Using Directed Hypergraphs 4 of 43
IntroductionTheory
ExperimentationConclusion
MotivationDirected Hypergraphs
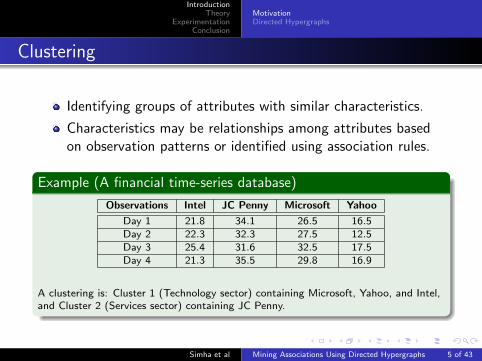
Clustering
Identifying groups of attributes with similar characteristics.
Characteristics may be relationships among attributes basedon observation patterns or identified using association rules.
Example (A financial time-series database)
Observations Intel JC Penny Microsoft Yahoo
Day 1 21.8 34.1 26.5 16.5Day 2 22.3 32.3 27.5 12.5Day 3 25.4 31.6 32.5 17.5Day 4 21.3 35.5 29.8 16.9
A clustering is: Cluster 1 (Technology sector) containing Microsoft, Yahoo, and Intel,and Cluster 2 (Services sector) containing JC Penny.
Simha et al Mining Associations Using Directed Hypergraphs 5 of 43
IntroductionTheory
ExperimentationConclusion
MotivationDirected Hypergraphs
Goals of This Project
Building a model that inherently handles many-to-manyrelationships.
Many of the relationships exhibited in real world are notrestricted to be one-to-one.Directed hypergraphs model many-to-many relationships.
Enabling to capture these relationships among attributes of adatabase more accurately.
Handling problems such as similarity, clustering, leadingindicators, and construction of classification rules.
Displaying versatility in the model’s usage by addressingvarious problems and carrying out experiments.
Simha et al Mining Associations Using Directed Hypergraphs 6 of 43
IntroductionTheory
ExperimentationConclusion
MotivationDirected Hypergraphs
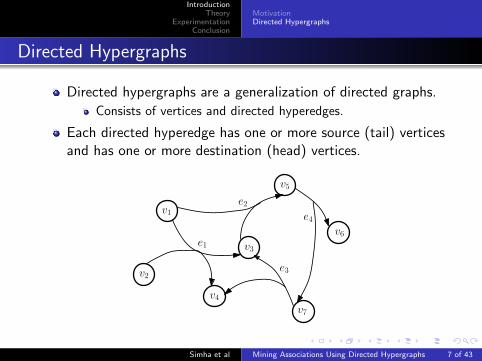
Directed Hypergraphs
Directed hypergraphs are a generalization of directed graphs.
Consists of vertices and directed hyperedges.
Each directed hyperedge has one or more source (tail) verticesand has one or more destination (head) vertices.
v1
v2
v3
v4
v5
v6
v7
e1
e2
e3
e4
Simha et al Mining Associations Using Directed Hypergraphs 7 of 43
IntroductionTheory
ExperimentationConclusion
Database ModelingAssociation-Based SimilarityComputational Problems
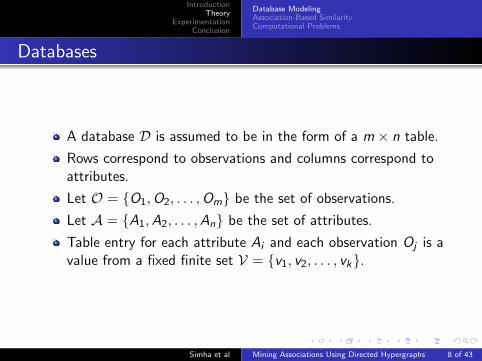
Databases
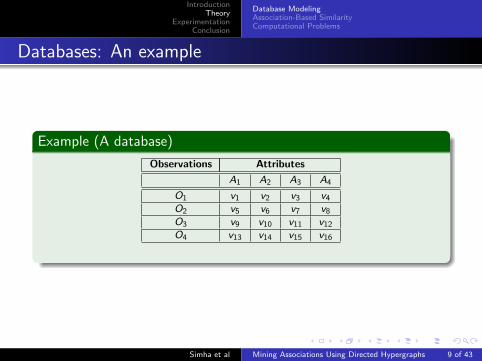
A database D is assumed to be in the form of a m × n table.
Rows correspond to observations and columns correspond toattributes.
Let O = {O1,O2, . . . ,Om} be the set of observations.
Let A = {A1,A2, . . . ,An} be the set of attributes.
Table entry for each attribute Ai and each observation Oj is avalue from a fixed finite set V = {v1, v2, . . . , vk}.
Simha et al Mining Associations Using Directed Hypergraphs 8 of 43
IntroductionTheory
ExperimentationConclusion
Database ModelingAssociation-Based SimilarityComputational Problems
Databases: An example
Example (A database)
Observations Attributes
A1 A2 A3 A4
O1 v1 v2 v3 v4
O2 v5 v6 v7 v8
O3 v9 v10 v11 v12
O4 v13 v14 v15 v16
Simha et al Mining Associations Using Directed Hypergraphs 9 of 43

IntroductionTheory
ExperimentationConclusion
Database ModelingAssociation-Based SimilarityComputational Problems
Association Rules for Multi-Valued Attributes
Consider attributes that can take value from a finite setV = {v1, v2, . . . , vk}.Generalize association rules among 0/1-valuedattributes [SA96].
Definition (Mva-type association rules)
An association rule for multi-valued attributes (in short, mva-typeassociation rule) in a database D(A,O,V) is an implication
relationship of the form Xmva=⇒Y , where X ,Y ⊆ A× V and π1(X )
and π1(Y ) are disjoint subsets of A.
Simha et al Mining Associations Using Directed Hypergraphs 10 of 43
IntroductionTheory
ExperimentationConclusion
Database ModelingAssociation-Based SimilarityComputational Problems
Association Rules for Multi-Valued Attributes
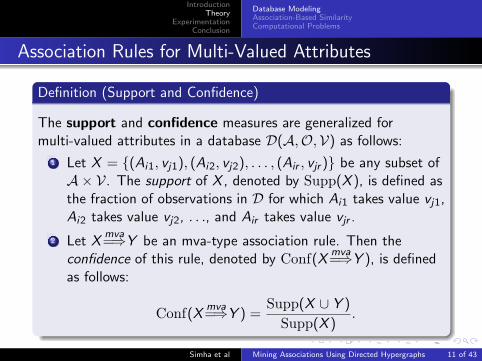
Definition (Support and Confidence)
The support and confidence measures are generalized formulti-valued attributes in a database D(A,O,V) as follows:
1 Let X = {(Ai1, vj1), (Ai2, vj2), . . . , (Air , vjr )} be any subset ofA× V. The support of X , denoted by Supp(X ), is defined asthe fraction of observations in D for which Ai1 takes value vj1,Ai2 takes value vj2, . . ., and Air takes value vjr .
2 Let Xmva=⇒Y be an mva-type association rule. Then the
confidence of this rule, denoted by Conf(Xmva=⇒Y ), is defined
as follows:
Conf(Xmva=⇒Y ) =
Supp(X ∪ Y )
Supp(X ).
Simha et al Mining Associations Using Directed Hypergraphs 11 of 43
IntroductionTheory
ExperimentationConclusion
Database ModelingAssociation-Based SimilarityComputational Problems
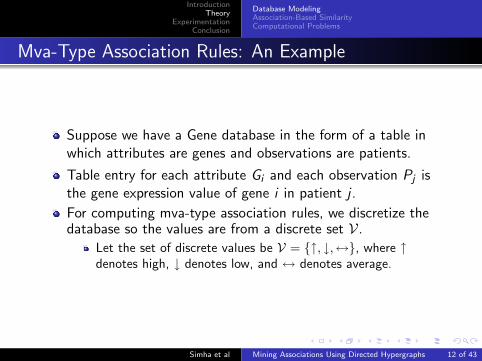
Mva-Type Association Rules: An Example
Suppose we have a Gene database in the form of a table inwhich attributes are genes and observations are patients.
Table entry for each attribute Gi and each observation Pj isthe gene expression value of gene i in patient j .
For computing mva-type association rules, we discretize thedatabase so the values are from a discrete set V.
Let the set of discrete values be V = {↑, ↓,↔}, where ↑denotes high, ↓ denotes low, and ↔ denotes average.
Simha et al Mining Associations Using Directed Hypergraphs 12 of 43
IntroductionTheory
ExperimentationConclusion
Database ModelingAssociation-Based SimilarityComputational Problems
Mva-Type Association Rules: An Example
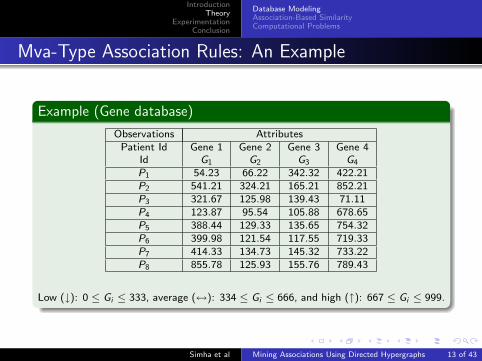
Example (Gene database)
Observations AttributesPatient Id Gene 1 Gene 2 Gene 3 Gene 4
Id G1 G2 G3 G4
P1 54.23 66.22 342.32 422.21P2 541.21 324.21 165.21 852.21P3 321.67 125.98 139.43 71.11P4 123.87 95.54 105.88 678.65P5 388.44 129.33 135.65 754.32P6 399.98 121.54 117.55 719.33P7 414.33 134.73 145.32 733.22P8 855.78 125.93 155.76 789.43
Low (↓): 0 ≤ Gi ≤ 333, average (↔): 334 ≤ Gi ≤ 666, and high (↑): 667 ≤ Gi ≤ 999.
Simha et al Mining Associations Using Directed Hypergraphs 13 of 43
IntroductionTheory
ExperimentationConclusion
Database ModelingAssociation-Based SimilarityComputational Problems
Mva-Type Association Rules: An Example
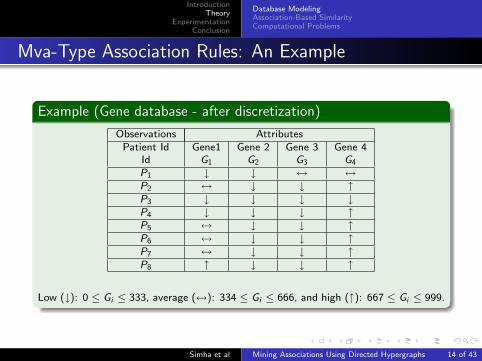
Example (Gene database - after discretization)
Observations AttributesPatient Id Gene1 Gene 2 Gene 3 Gene 4
Id G1 G2 G3 G4
P1 ↓ ↓ ↔ ↔P2 ↔ ↓ ↓ ↑P3 ↓ ↓ ↓ ↓P4 ↓ ↓ ↓ ↑P5 ↔ ↓ ↓ ↑P6 ↔ ↓ ↓ ↑P7 ↔ ↓ ↓ ↑P8 ↑ ↓ ↓ ↑
Low (↓): 0 ≤ Gi ≤ 333, average (↔): 334 ≤ Gi ≤ 666, and high (↑): 667 ≤ Gi ≤ 999.
Simha et al Mining Associations Using Directed Hypergraphs 14 of 43
IntroductionTheory
ExperimentationConclusion
Database ModelingAssociation-Based SimilarityComputational Problems
Mva-Type Association Rules: An Example
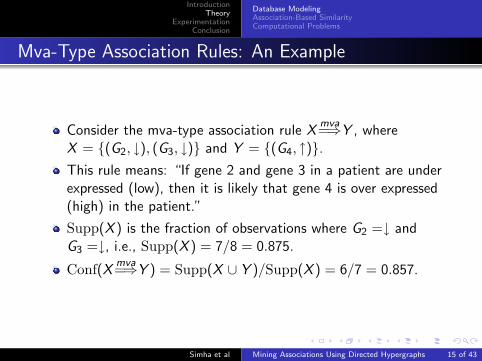
Consider the mva-type association rule Xmva=⇒Y , where
X = {(G2, ↓), (G3, ↓)} and Y = {(G4, ↑)}.This rule means: “If gene 2 and gene 3 in a patient are underexpressed (low), then it is likely that gene 4 is over expressed(high) in the patient.”
Supp(X ) is the fraction of observations where G2 =↓ andG3 =↓, i.e., Supp(X ) = 7/8 = 0.875.
Conf(Xmva=⇒Y ) = Supp(X ∪ Y )/Supp(X ) = 6/7 = 0.857.
Simha et al Mining Associations Using Directed Hypergraphs 15 of 43
IntroductionTheory
ExperimentationConclusion
Database ModelingAssociation-Based SimilarityComputational Problems
Association Hypergraphs
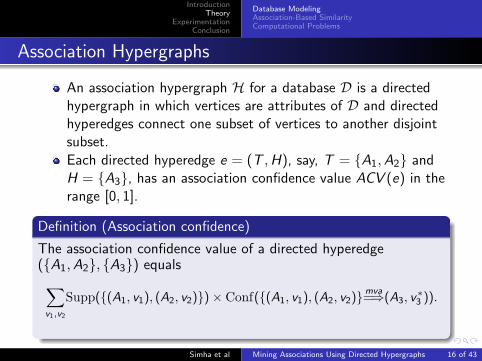
An association hypergraph H for a database D is a directedhypergraph in which vertices are attributes of D and directedhyperedges connect one subset of vertices to another disjointsubset.
Each directed hyperedge e = (T ,H), say, T = {A1,A2} andH = {A3}, has an association confidence value ACV (e) in therange [0, 1].
Definition (Association confidence)
The association confidence value of a directed hyperedge({A1,A2}, {A3}) equals∑
v1,v2
Supp({(A1, v1), (A2, v2)})× Conf({(A1, v1), (A2, v2)}mva=⇒(A3, v
∗3 )).
Simha et al Mining Associations Using Directed Hypergraphs 16 of 43
IntroductionTheory
ExperimentationConclusion
Database ModelingAssociation-Based SimilarityComputational Problems
Association Tables
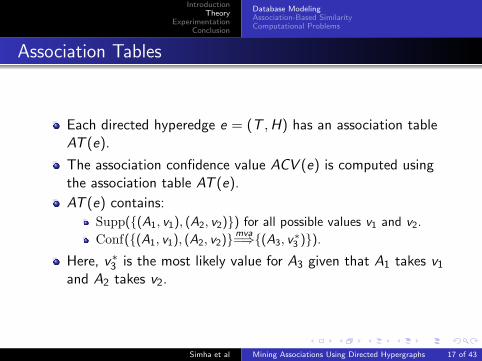
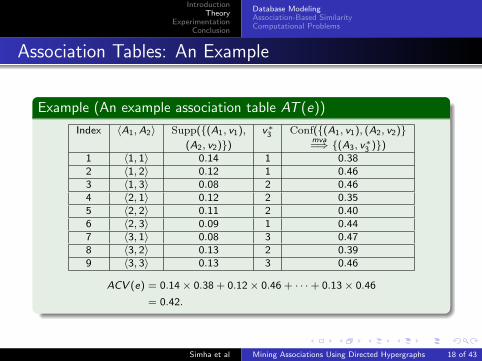
Each directed hyperedge e = (T ,H) has an association tableAT (e).
The association confidence value ACV (e) is computed usingthe association table AT (e).
AT (e) contains:
Supp({(A1, v1), (A2, v2)}) for all possible values v1 and v2.
Conf({(A1, v1), (A2, v2)}mva=⇒{(A3, v
∗3 )}).
Here, v∗3 is the most likely value for A3 given that A1 takes v1
and A2 takes v2.
Simha et al Mining Associations Using Directed Hypergraphs 17 of 43
IntroductionTheory
ExperimentationConclusion
Database ModelingAssociation-Based SimilarityComputational Problems
Association Tables: An Example
Example (An example association table AT (e))
Index 〈A1, A2〉 Supp({(A1, v1), v∗3 Conf({(A1, v1), (A2, v2)}(A2, v2)}) mva
=⇒ {(A3, v∗3 )})1 〈1, 1〉 0.14 1 0.382 〈1, 2〉 0.12 1 0.463 〈1, 3〉 0.08 2 0.464 〈2, 1〉 0.12 2 0.355 〈2, 2〉 0.11 2 0.406 〈2, 3〉 0.09 1 0.447 〈3, 1〉 0.08 3 0.478 〈3, 2〉 0.13 2 0.399 〈3, 3〉 0.13 3 0.46
ACV (e) = 0.14× 0.38 + 0.12× 0.46 + · · ·+ 0.13× 0.46
= 0.42.
Simha et al Mining Associations Using Directed Hypergraphs 18 of 43
IntroductionTheory
ExperimentationConclusion
Database ModelingAssociation-Based SimilarityComputational Problems
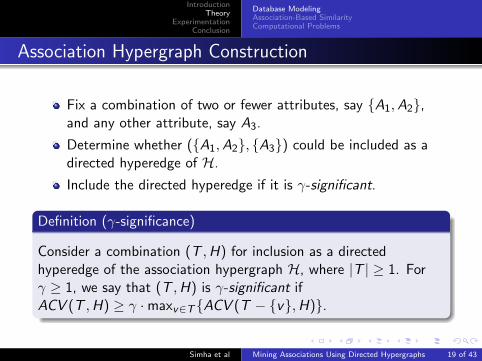
Association Hypergraph Construction
Fix a combination of two or fewer attributes, say {A1,A2},and any other attribute, say A3.
Determine whether ({A1,A2}, {A3}) could be included as adirected hyperedge of H.
Include the directed hyperedge if it is γ-significant.
Definition (γ-significance)
Consider a combination (T ,H) for inclusion as a directedhyperedge of the association hypergraph H, where |T | ≥ 1. Forγ ≥ 1, we say that (T ,H) is γ-significant ifACV (T ,H) ≥ γ ·maxv∈T{ACV (T − {v},H)}.
Simha et al Mining Associations Using Directed Hypergraphs 19 of 43
IntroductionTheory
ExperimentationConclusion
Database ModelingAssociation-Based SimilarityComputational Problems
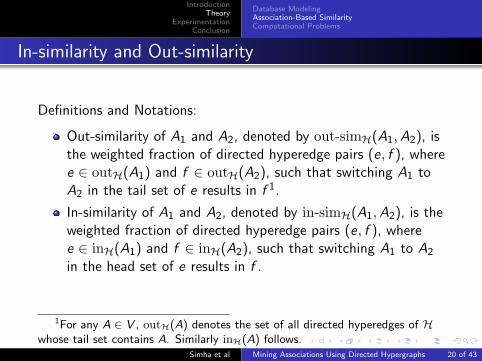
In-similarity and Out-similarity
Definitions and Notations:
Out-similarity of A1 and A2, denoted by out-simH(A1,A2), isthe weighted fraction of directed hyperedge pairs (e, f ), wheree ∈ outH(A1) and f ∈ outH(A2), such that switching A1 toA2 in the tail set of e results in f 1.
In-similarity of A1 and A2, denoted by in-simH(A1,A2), is theweighted fraction of directed hyperedge pairs (e, f ), wheree ∈ inH(A1) and f ∈ inH(A2), such that switching A1 to A2
in the head set of e results in f .
1For any A ∈ V , outH(A) denotes the set of all directed hyperedges of Hwhose tail set contains A. Similarly inH(A) follows.
Simha et al Mining Associations Using Directed Hypergraphs 20 of 43
IntroductionTheory
ExperimentationConclusion
Database ModelingAssociation-Based SimilarityComputational Problems
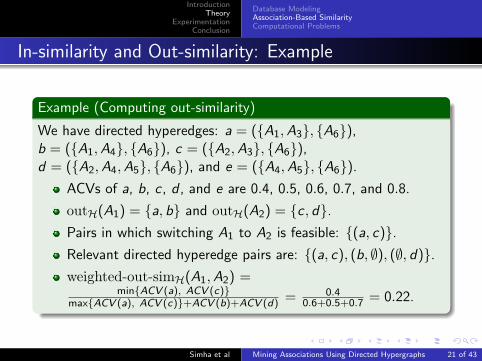
In-similarity and Out-similarity: Example
Example (Computing out-similarity)
We have directed hyperedges: a = ({A1,A3}, {A6}),b = ({A1,A4}, {A6}), c = ({A2,A3}, {A6}),d = ({A2,A4,A5}, {A6}), and e = ({A4,A5}, {A6}).
ACVs of a, b, c , d , and e are 0.4, 0.5, 0.6, 0.7, and 0.8.
outH(A1) = {a, b} and outH(A2) = {c , d}.Pairs in which switching A1 to A2 is feasible: {(a, c)}.Relevant directed hyperedge pairs are: {(a, c), (b, ∅), (∅, d)}.weighted-out-simH(A1,A2) =
min{ACV (a), ACV (c)}max{ACV (a), ACV (c)}+ACV (b)+ACV (d) = 0.4
0.6+0.5+0.7 = 0.22.
Simha et al Mining Associations Using Directed Hypergraphs 21 of 43
IntroductionTheory
ExperimentationConclusion
Database ModelingAssociation-Based SimilarityComputational Problems
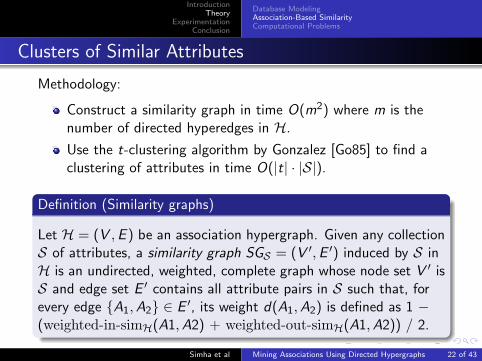
Clusters of Similar Attributes
Methodology:
Construct a similarity graph in time O(m2) where m is thenumber of directed hyperedges in H.
Use the t-clustering algorithm by Gonzalez [Go85] to find aclustering of attributes in time O(|t| · |S|).
Definition (Similarity graphs)
Let H = (V ,E ) be an association hypergraph. Given any collectionS of attributes, a similarity graph SGS = (V ′,E ′) induced by S inH is an undirected, weighted, complete graph whose node set V ′ isS and edge set E ′ contains all attribute pairs in S such that, forevery edge {A1,A2} ∈ E ′, its weight d(A1,A2) is defined as 1 −(weighted-in-simH(A1,A2) + weighted-out-simH(A1,A2)) / 2.
Simha et al Mining Associations Using Directed Hypergraphs 22 of 43
IntroductionTheory
ExperimentationConclusion
Database ModelingAssociation-Based SimilarityComputational Problems
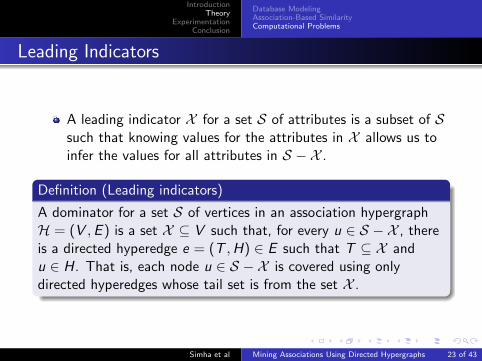
Leading Indicators
A leading indicator X for a set S of attributes is a subset of Ssuch that knowing values for the attributes in X allows us toinfer the values for all attributes in S − X .
Definition (Leading indicators)
A dominator for a set S of vertices in an association hypergraphH = (V ,E ) is a set X ⊆ V such that, for every u ∈ S − X , thereis a directed hyperedge e = (T ,H) ∈ E such that T ⊆ X andu ∈ H. That is, each node u ∈ S − X is covered using onlydirected hyperedges whose tail set is from the set X .
Simha et al Mining Associations Using Directed Hypergraphs 23 of 43
IntroductionTheory
ExperimentationConclusion
Database ModelingAssociation-Based SimilarityComputational Problems
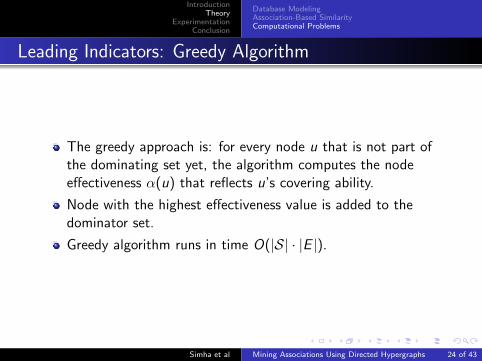
Leading Indicators: Greedy Algorithm
The greedy approach is: for every node u that is not part ofthe dominating set yet, the algorithm computes the nodeeffectiveness α(u) that reflects u’s covering ability.
Node with the highest effectiveness value is added to thedominator set.
Greedy algorithm runs in time O(|S| · |E |).
Simha et al Mining Associations Using Directed Hypergraphs 24 of 43
IntroductionTheory
ExperimentationConclusion
Database ModelingAssociation-Based SimilarityComputational Problems
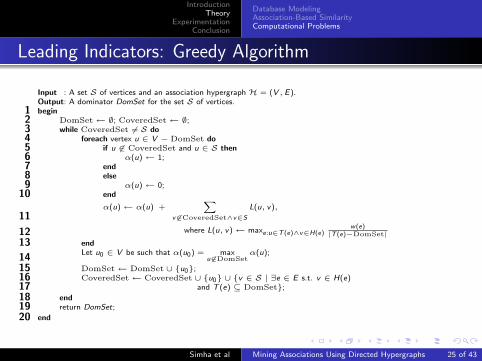
Leading Indicators: Greedy Algorithm
Input : A set S of vertices and an association hypergraph H = (V , E).Output: A dominator DomSet for the set S of vertices.begin1
DomSet← ∅; CoveredSet← ∅;2while CoveredSet 6= S do3
foreach vertex u ∈ V − DomSet do4if u 6∈ CoveredSet and u ∈ S then5
α(u)← 1;6end7else8
α(u)← 0;9end10α(u)← α(u) +
Xv 6∈CoveredSet∧v∈S
L(u, v),11
where L(u, v)← maxe:u∈T (e)∧v∈H(e)w(e)
|T (e)−DomSet|12end13Let u0 ∈ V be such that α(u0) = max
u 6∈DomSetα(u);
14DomSet← DomSet ∪ {u0};15CoveredSet← CoveredSet ∪ {u0} ∪ {v ∈ S | ∃e ∈ E s.t. v ∈ H(e)16
and T (e) ⊆ DomSet};17end18return DomSet;19
end20
Simha et al Mining Associations Using Directed Hypergraphs 25 of 43
IntroductionTheory
ExperimentationConclusion
Database ModelingAssociation-Based SimilarityComputational Problems
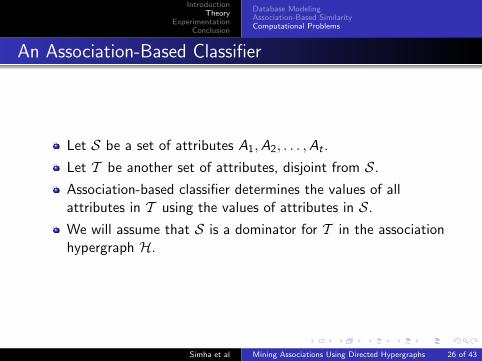
An Association-Based Classifier
Let S be a set of attributes A1,A2, . . . ,At .
Let T be another set of attributes, disjoint from S.
Association-based classifier determines the values of allattributes in T using the values of attributes in S.
We will assume that S is a dominator for T in the associationhypergraph H.
Simha et al Mining Associations Using Directed Hypergraphs 26 of 43
IntroductionTheory
ExperimentationConclusion
Database ModelingAssociation-Based SimilarityComputational Problems
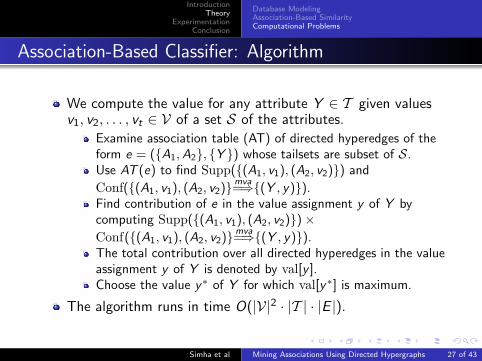
Association-Based Classifier: Algorithm
We compute the value for any attribute Y ∈ T given valuesv1, v2, . . . , vt ∈ V of a set S of the attributes.
Examine association table (AT) of directed hyperedges of theform e = ({A1,A2}, {Y }) whose tailsets are subset of S.Use AT (e) to find Supp({(A1, v1), (A2, v2)}) and
Conf({(A1, v1), (A2, v2)}mva=⇒{(Y , y)}).
Find contribution of e in the value assignment y of Y bycomputing Supp({(A1, v1), (A2, v2)})×Conf({(A1, v1), (A2, v2)}mva
=⇒{(Y , y)}).The total contribution over all directed hyperedges in the valueassignment y of Y is denoted by val[y ].Choose the value y∗ of Y for which val[y∗] is maximum.
The algorithm runs in time O(|V|2 · |T | · |E |).
Simha et al Mining Associations Using Directed Hypergraphs 27 of 43
IntroductionTheory
ExperimentationConclusion
Database ModelingAssociation-Based SimilarityComputational Problems
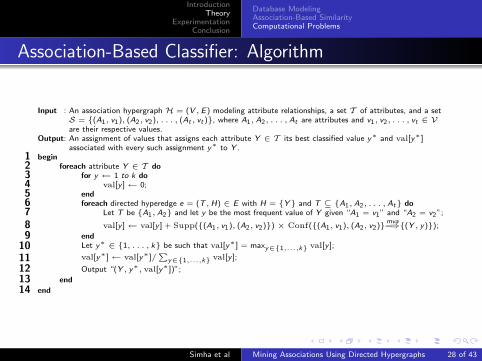
Association-Based Classifier: Algorithm
Input : An association hypergraph H = (V , E) modeling attribute relationships, a set T of attributes, and a setS = {(A1, v1), (A2, v2), . . . , (At , vt )}, where A1, A2, . . . , At are attributes and v1, v2, . . . , vt ∈ Vare their respective values.
Output: An assignment of values that assigns each attribute Y ∈ T its best classified value y∗ and val[y∗]associated with every such assignment y∗ to Y .
begin1foreach attribute Y ∈ T do2
for y ← 1 to k do3val[y ]← 0;4
end5foreach directed hyperedge e = (T ,H) ∈ E with H = {Y} and T ⊆ {A1, A2, . . . , At} do6
Let T be {A1, A2} and let y be the most frequent value of Y given “A1 = v1” and “A2 = v2”;7val[y ]← val[y ] + Supp({(A1, v1), (A2, v2)}) × Conf({(A1, v1), (A2, v2)}mva
=⇒{(Y , y)});8end9Let y∗ ∈ {1, . . . , k} be such that val[y∗] = maxy∈{1,...,k} val[y ];10val[y∗]← val[y∗]/
Py∈{1,...,k} val[y ];11
Output “(Y , y∗, val[y∗])”;12end13
end14
Simha et al Mining Associations Using Directed Hypergraphs 28 of 43
IntroductionTheory
ExperimentationConclusion
Association CharacteristicsAssociation-Based SimilarityComputational Problems
Experimental Data
Experimental analysis is based on financial time-series datafrom January 1, 1995 to December 31, 2009, since a numberof companies in S&P 500 started trading in the mid 90s. Thenumber of financial time-series in our analysis is 346.
Financial time-series data belongs to industrial sectors such asBasic Materials (BM), Capital Goods (CG), Conglomerates(C), Consumer Cyclical (CC), Consumer Noncyclical (CN ),Energy (E), Financial (F), Healthcare (H), Services (SV),Technology (T ), Transportation (T P), and Utilities (U).
Simha et al Mining Associations Using Directed Hypergraphs 29 of 43
IntroductionTheory
ExperimentationConclusion
Association CharacteristicsAssociation-Based SimilarityComputational Problems
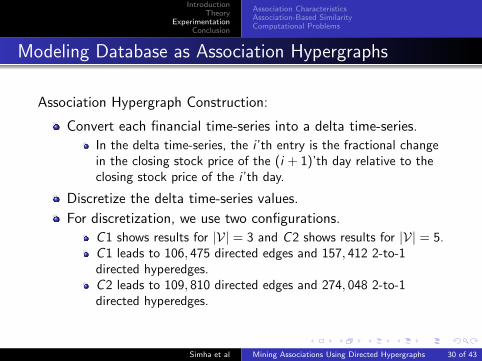
Modeling Database as Association Hypergraphs
Association Hypergraph Construction:
Convert each financial time-series into a delta time-series.
In the delta time-series, the i ’th entry is the fractional changein the closing stock price of the (i + 1)’th day relative to theclosing stock price of the i ’th day.
Discretize the delta time-series values.
For discretization, we use two configurations.
C 1 shows results for |V| = 3 and C 2 shows results for |V| = 5.C 1 leads to 106, 475 directed edges and 157, 412 2-to-1directed hyperedges.C 2 leads to 109, 810 directed edges and 274, 048 2-to-1directed hyperedges.
Simha et al Mining Associations Using Directed Hypergraphs 30 of 43
IntroductionTheory
ExperimentationConclusion
Association CharacteristicsAssociation-Based SimilarityComputational Problems
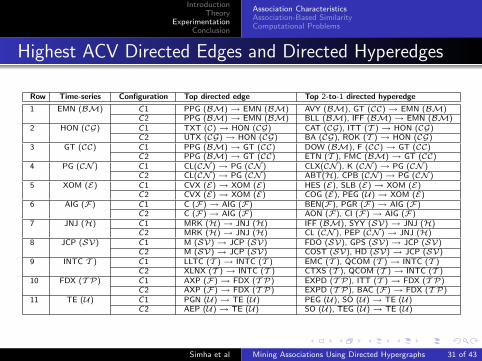
Highest ACV Directed Edges and Directed Hyperedges
Row Time-series Configuration Top directed edge Top 2-to-1 directed hyperedge
1 EMN (BM) C1 PPG (BM)→ EMN (BM) AVY (BM), GT (CC)→ EMN (BM)C2 PPG (BM)→ EMN (BM) BLL (BM), IFF (BM)→ EMN (BM)
2 HON (CG) C1 TXT (C)→ HON (CG) CAT (CG), ITT (T )→ HON (CG)C2 UTX (CG)→ HON (CG) BA (CG), ROK (T )→ HON (CG)
3 GT (CC) C1 PPG (BM)→ GT (CC) DOW (BM), F (CC)→ GT (CC)C2 PPG (BM)→ GT (CC) ETN (T ), FMC (BM)→ GT (CC)
4 PG (CN ) C1 CL(CN )→ PG (CN ) CLX(CN ), K (CN )→ PG (CN )C2 CL(CN )→ PG (CN ) ABT(H), CPB (CN )→ PG (CN )
5 XOM (E) C1 CVX (E)→ XOM (E) HES (E), SLB (E)→ XOM (E)C2 CVX (E)→ XOM (E) COG (E), PEG (U)→ XOM (E)
6 AIG (F) C1 C (F)→ AIG (F) BEN(F), PGR (F)→ AIG (F)C2 C (F)→ AIG (F) AON (F), CI (F)→ AIG (F)
7 JNJ (H) C1 MRK (H)→ JNJ (H) IFF (BM), SYY (SV)→ JNJ (H)C2 MRK (H)→ JNJ (H) CL (CN ), PEP (CN )→ JNJ (H)
8 JCP (SV) C1 M (SV)→ JCP (SV) FDO (SV), GPS (SV)→ JCP (SV)C2 M (SV)→ JCP (SV) COST (SV), HD (SV)→ JCP (SV)
9 INTC T ) C1 LLTC (T )→ INTC (T ) EMC (T ), QCOM (T )→ INTC (T )C2 XLNX (T )→ INTC (T ) CTXS (T ), QCOM (T )→ INTC (T )
10 FDX (T P) C1 AXP (F)→ FDX (T P) EXPD (T P), ITT (T )→ FDX (T P)C2 AXP (F)→ FDX (T P) EXPD (T P), BAC (F)→ FDX (T P)
11 TE (U) C1 PGN (U)→ TE (U) PEG (U), SO (U)→ TE (U)C2 AEP (U)→ TE (U) SO (U), TEG (U)→ TE (U)
Simha et al Mining Associations Using Directed Hypergraphs 31 of 43
IntroductionTheory
ExperimentationConclusion
Association CharacteristicsAssociation-Based SimilarityComputational Problems
Highest ACV Directed Edges and Directed Hyperedges
Best prediction directed edge for GT (The Goodyear Tire &Rubber Company) - PPG (BM) → GT (CC).
Interpreted in terms of GT procuring raw materials (e.g.,precipitated silicas) from PPG for the manufacturing orprocessing of rubber [PP10].
Best prediction 2-to-1 directed hyperedge for GT - DOW(BM), F (CC) → GT (CC).
Interpreted in terms of GT procuring raw materials (e.g.,polyurethane polymer) from DOW [HR01, Do10], whereas therelationship with F may be attributed towards F utilizing theproducts (e.g., tires) from GT [Wa01].
Simha et al Mining Associations Using Directed Hypergraphs 32 of 43
IntroductionTheory
ExperimentationConclusion
Association CharacteristicsAssociation-Based SimilarityComputational Problems
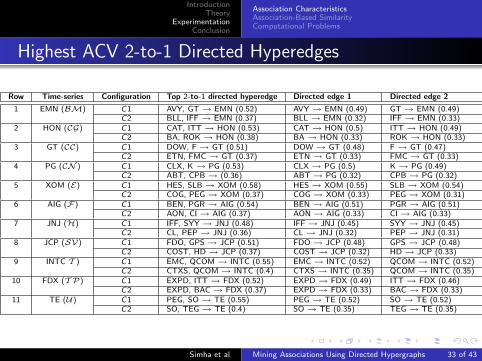
Highest ACV 2-to-1 Directed Hyperedges
Row Time-series Configuration Top 2-to-1 directed hyperedge Directed edge 1 Directed edge 2
1 EMN (BM) C1 AVY, GT→ EMN (0.52) AVY→ EMN (0.49) GT→ EMN (0.49)C2 BLL, IFF→ EMN (0.37) BLL→ EMN (0.32) IFF→ EMN (0.33)
2 HON (CG) C1 CAT, ITT→ HON (0.53) CAT→ HON (0.5) ITT→ HON (0.49)C2 BA, ROK→ HON (0.38) BA→ HON (0.33) ROK→ HON (0.33)
3 GT (CC) C1 DOW, F→ GT (0.51) DOW→ GT (0.48) F→ GT (0.47)C2 ETN, FMC→ GT (0.37) ETN→ GT (0.33) FMC→ GT (0.33)
4 PG (CN ) C1 CLX, K→ PG (0.53) CLX→ PG (0.5) K→ PG (0.49)C2 ABT, CPB→ (0.36) ABT→ PG (0.32) CPB→ PG (0.32)
5 XOM (E) C1 HES, SLB→ XOM (0.58) HES→ XOM (0.55) SLB→ XOM (0.54)C2 COG, PEG→ XOM (0.37) COG→ XOM (0.33) PEG→ XOM (0.31)
6 AIG (F) C1 BEN, PGR→ AIG (0.54) BEN→ AIG (0.51) PGR→ AIG (0.51)C2 AON, CI→ AIG (0.37) AON→ AIG (0.33) CI→ AIG (0.33)
7 JNJ (H) C1 IFF, SYY→ JNJ (0.48) IFF→ JNJ (0.45) SYY→ JNJ (0.45)C2 CL, PEP→ JNJ (0.36) CL→ JNJ (0.32) PEP→ JNJ (0.31)
8 JCP (SV) C1 FDO, GPS→ JCP (0.51) FDO→ JCP (0.48) GPS→ JCP (0.48)C2 COST, HD→ JCP (0.37) COST→ JCP (0.32) HD→ JCP (0.33)
9 INTC T ) C1 EMC, QCOM→ INTC (0.55) EMC→ INTC (0.52) QCOM→ INTC (0.52)C2 CTXS, QCOM→ INTC (0.4) CTXS→ INTC (0.35) QCOM→ INTC (0.35)
10 FDX (T P) C1 EXPD, ITT→ FDX (0.52) EXPD→ FDX (0.49) ITT→ FDX (0.46)C2 EXPD, BAC→ FDX (0.37) EXPD→ FDX (0.33) BAC→ FDX (0.33)
11 TE (U) C1 PEG, SO→ TE (0.55) PEG→ TE (0.52) SO→ TE (0.52)C2 SO, TEG→ TE (0.4) SO→ TE (0.35) TEG→ TE (0.35)
Simha et al Mining Associations Using Directed Hypergraphs 33 of 43
IntroductionTheory
ExperimentationConclusion
Association CharacteristicsAssociation-Based SimilarityComputational Problems
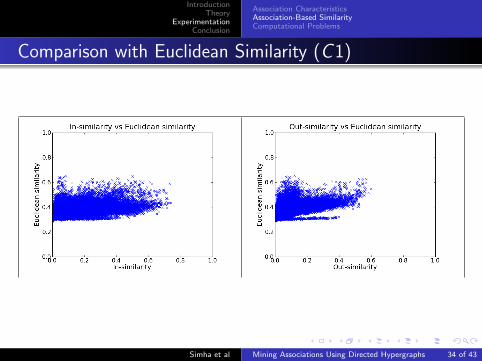
Comparison with Euclidean Similarity (C1)
Simha et al Mining Associations Using Directed Hypergraphs 34 of 43

IntroductionTheory
ExperimentationConclusion
Association CharacteristicsAssociation-Based SimilarityComputational Problems
Clusters of Financial Time-Series (C1)
Simha et al Mining Associations Using Directed Hypergraphs 35 of 43
IntroductionTheory
ExperimentationConclusion
Association CharacteristicsAssociation-Based SimilarityComputational Problems
Association-Based Classifier
Methodology:
Construct an association hypergraph using training data set.
Discretize the test data set.
Choose a subset S (dominator) and fix values of everyfinancial time-series in S to the value in the test data set.
Use the association-based classifier to obtain a prediction forall financial time-series that are not part of the dominator.
Classification confidence for any financial time-series A is thefraction of days the predicted value of A matches the value inthe discretized representation of A in the test data set.
Simha et al Mining Associations Using Directed Hypergraphs 36 of 43
IntroductionTheory
ExperimentationConclusion
Association CharacteristicsAssociation-Based SimilarityComputational Problems
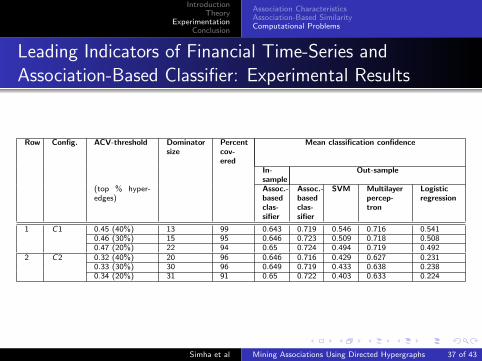
Leading Indicators of Financial Time-Series andAssociation-Based Classifier: Experimental Results
Row Config. ACV-threshold Dominatorsize
Percentcov-ered
Mean classification confidence
In-sample
Out-sample
(top % hyper-edges)
Assoc.-basedclas-sifier
Assoc.-basedclas-sifier
SVM Multilayerpercep-tron
Logisticregression
1 C1 0.45 (40%) 13 99 0.643 0.719 0.546 0.716 0.5410.46 (30%) 15 95 0.646 0.723 0.509 0.718 0.5080.47 (20%) 22 94 0.65 0.724 0.494 0.719 0.492
2 C2 0.32 (40%) 20 96 0.646 0.716 0.429 0.627 0.2310.33 (30%) 30 96 0.649 0.719 0.433 0.638 0.2380.34 (20%) 31 91 0.65 0.722 0.403 0.633 0.224
Simha et al Mining Associations Using Directed Hypergraphs 37 of 43
IntroductionTheory
ExperimentationConclusion
Association CharacteristicsAssociation-Based SimilarityComputational Problems
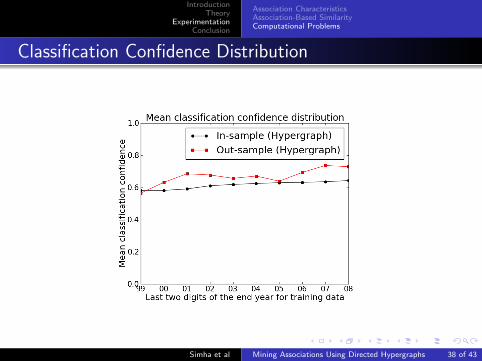
Classification Confidence Distribution
Simha et al Mining Associations Using Directed Hypergraphs 38 of 43
IntroductionTheory
ExperimentationConclusion
Conclusions and Future Work
Conclusions and Future Work
We proposed a directed hypergraph based model to captureattribute-level associations for any database using which weaddressed problems such as similarity, clustering, leadingindicators, and classification.
We tested the model on a financial time-series data set (S&P500) and demonstrated its consistency through theexperimental results.
Future work includes:
Understanding how the different parameters (|V|, γ, and thesizes of head and tail sets) affect the model.Exploring associations in various domains by applying thedirected hypergraph model on data sets such as genedatabases, social network data sets, and medical databases.
Simha et al Mining Associations Using Directed Hypergraphs 39 of 43
IntroductionTheory
ExperimentationConclusion
Conclusions and Future Work
References
[BZ07] B. Bringmann and A. ZimmermannThe Chosen Few: On Identifying Valuable Patterns.ICDM 07 63-72.
[Do10] The Dow Chemical CompanyDow Chemical Products.http://www.dow.com/products services/division/auto.htm.
[Go85] T. GonzalezClustering to Minimize the Maximum Intercluster Distance.Theoretical Computer Science 38:293-306.
[HK98] E. Han and G. Karypis and V. Kumar and B. MobasherHypergraph Based Clustering in High-Dimensional Data Sets: A Summary ofResults.IEEE Data Eng. Bull. 21(1):15-22.
[HR01] Highbeam ResearchGoodyear revisits PU tyre.http://www.highbeam.com/doc/1G1-81891336.html.
Simha et al Mining Associations Using Directed Hypergraphs 40 of 43
IntroductionTheory
ExperimentationConclusion
Conclusions and Future Work
References
[KH06] A. Knobbe and E. HoMaximally Informative k-Itemsets and Their Efficient Discovery.KDD 06 237-244.
[LS97] B. Lent and A. Swami and J. WidomClustering Association Rules.ICDE 97 220-231.
[OA04] M. Ozdal and C. AykanatHypergraph Models and Algorithms for Data-Pattern-Based ClusteringData Mining and Knowledge Discovery 9(1):29-57.
[PP10] PPG Industries IncPPG Silica Products.http://corporateportal.ppg.com/na/silicas/EN.
[SA96] R. Srikant and R. AgrawalMining Quantitative Association Rules in Large Relational Tables.SIGMOD 96 1-12.
Simha et al Mining Associations Using Directed Hypergraphs 41 of 43

IntroductionTheory
ExperimentationConclusion
Conclusions and Future Work
References
[SV06] A. Siebes and J. Vreeken and M. LeeuwenItem Sets that Compress.SDM 06.
[Ya10] Yahoo.comYahoo Finance.http://finance.yahoo.com/.
[Wa01] Wardsdealer.comFord and Goodyear Band Together to Replace Tires.http://wardsdealer.com/ar/auto ford goodyear band/.
Simha et al Mining Associations Using Directed Hypergraphs 42 of 43

IntroductionTheory
ExperimentationConclusion
Conclusions and Future Work
Questions?
Simha et al Mining Associations Using Directed Hypergraphs 43 of 43