minimum wages in Mexico - CORE · Minimum Wages and Earnings Inequality in Urban Mexico Revisiting...
62
CEP Discussion Paper No 880 July 2008 Minimum Wages and Earnings Inequality in Urban Mexico Revisiting the Evidence Mariano Bosch and Marco Manacorda
Transcript of minimum wages in Mexico - CORE · Minimum Wages and Earnings Inequality in Urban Mexico Revisiting...

CEP Discussion Paper No 880
July 2008
Minimum Wages and Earnings Inequality in Urban Mexico
Revisiting the Evidence
Mariano Bosch and Marco Manacorda

Abstract This paper explores the contribution of the minimum wage to the well documented rise in earnings inequality in Mexico between the late 1980 and the late 1990s. In contrast to the view that sees minimum wages as an ineffective redistributive tool in developing countries, we find that the deterioration in the real bite of the minimum wage is responsible for the entire rise in inequality at the bottom of the distribution. Our result challenges the widespread perception that trade induced shocks are the single most important factor behind the recent rise in earnings inequality in several less developed economies. Keywords: Minimum Wage, Inequality, Informality, Mexico JEL Classification: O15, 017 This paper was produced as part of the Centre’s Labour Markets Programme. The Centre for Economic Performance is financed by the Economic and Social Research Council. Acknowledgements We are grateful to Richard Freeman, Pietro Garibaldi, Thomas Lemieux, William Maloney, Alan Manning, Justin McCrary, Guy Michaels, Rachel Ngai, Barbara Petrongolo, Steve Pischke, Chris Pissarides, Chris Woodruff and participants at the Labor Seminar at the LSE and the IZA/World Bank conference on Employment and Development, Berlin, May 2006 for many helpful comments. We thank Benjamin Aleman-Castilla for providing us with the data on tariffs. Mariano Bosch is a Lecturer in Economics at Universidad de Alicante, Spain. Marco Manacorda is a Research Associate at the Centre for Economic Performance, London School of Economics. He is also a Reader in Economics at Queen Mary University of London. Published by Centre for Economic Performance London School of Economics and Political Science Houghton Street London WC2A 2AE All rights reserved. No part of this publication may be reproduced, stored in a retrieval system or transmitted in any form or by any means without the prior permission in writing of the publisher nor be issued to the public or circulated in any form other than that in which it is published. Requests for permission to reproduce any article or part of the Working Paper should be sent to the editor at the above address. © M. Bosch and M. Manacorda, submitted 2008 ISBN 978-0-85328-287-7

1
1. Introduction
A very large number of papers analyze the trends in the earnings structure in Mexico,
especially following the liberalization episodes of the mid 1980s. A simple search on Econlit
for the keywords "inequality" and "Mexico" delivers 199 records. A search for "wage*" and
Mexico" delivers 475 records. It is well known that wage inequality and the returns to skills
increased markedly in Mexico since the mid 1980s up at least the mid 1990s. This evidence is
confirmed by a variety of data sets and samples. Hanson and Harrison (1999), using
manufacturing plant level data from the Secretariat of Trade and Industrial Promotion
(SECOFI), report that between 1984 and 1990 the ratio of average hourly white to blue-collar
wages increased from 1.93 to 2.55. Airloa and Juhn (2005), using data from the Encuesta
Nacional de Ingresos y Gastos de los Hogares (ENIGH), show that between 1984 and 1994,
the 90-10 log wage differential among men increased from 1.86 to 2.16, to decrease to 2 by
2000. This pattern of increase in inequality up to the mid 1990s, and decrease afterwards is
also found by Robertson (2004) and Duvall-Hernandez (2006) based on data from the
Encuesta Nacional de Empleo Urbano (ENEU), that only refers to urban workers. Verhoogen
(2007), using manufacturing plant data from the Encuesta Industrial Anual (EIA), documents
a rise in the white-blue collar wage differential of around 50 log points between 1984 and
1997, after which differentials taper down. Using population Census data for 1990 and 2000,
Hanson (2004) shows that the returns to education rose during the 1990s, although, at least
for men, this rise was largely concentrated among those with high levels of education.
Although these trends are incontrovertible, there is still no consensus about the
determinants of the fast rise in inequality in Mexico up at least to the mid 1990s. Starting in
the mid 1980s, the Mexican government pushed a strong agenda of trade and capital market
reforms (for all, see Hanson, 2004) and embarked on a massive privatization program

2
(Lopez-de-Silanes and La Porta, 1999), while labor market institutions were on the whole
weakened (see for example Popli, 2006). These changes happened at a time of rising internal
and international migration to the US, that affected the supply of labor in Mexico (Chiquiar
and Hanson, 2005; Mishra, 2007) and generated very sizeable remittance flows (Hanson and
Woodruff, 2003; Hanson, 2005). These changes also happened against the backdrop of
increasing outside competition from Asian economies in less-skilled intensive industries
(Hanson and Harrison, 1999), and a generalized trend toward rising wage inequality in
several OECD economies, perhaps induced by technological advancements (Katz and Autor,
1999). Because of this concurrence, disentangling the role of different factors is far from an
easy task.
Certainly the area where more and more convincing research has been produced
relates to the effect of trade and FDI (for an excellent survey see Hanson, 2004). Our Econlit
search delivers 168 records for research papers simultaneously including the keywords
"trade", "wage*" and "Mexico". Effectively, there is ample empirical evidence that returns to
education, overall inequality and regional wage differentials in Mexico responded to the
trends in trade openness and capital market liberalization, especially between the mid 1980s
and the mid 1990s. Feenstra and Hanson (1997) argue that intermediate production
outsourcing by US firms (via the so-called maquilladoras) raised the demand for workers
who - according to Mexican standards - were relatively skilled, hence increasing the demand
for skills in Mexico. The empirical evidence is consistent with this hypothesis, since the areas
where maquilladoras expanded most were also the ones that experienced the largest rise in
the demand for skills. As an additional channel, Hanson and Harrison (1999) argue that
Mexico offered relatively high trade protection to low-skill industries and that the unilateral
trade liberalization in 1985 exposed these industries to competition from China and other
countries with abundant supply of unskilled labor, hence leading to a rise in inequality. In a

3
companion paper, Harrison and Hanson (1999) additionally emphasize the role played by
export orientation and foreign direct investment in driving wage inequality in Mexico.1
Comparatively little attention has been devoted in the literature to the effect of labor
market institutions - and in particular the minimum wage - in shaping the wage distribution in
Mexico. For example an Econlit search for the keywords "minimum", "wage*" and "Mexico"
only delivers 24 records. Probably, this is not only to be imputed to the fact that US-based
researchers have long regarded Mexico as an ideal testing ground for theories of trade and
economic integration - a fact easily explained by the circumstance that close to 90% of
Mexican exports and 50% of its imports are traded with the United States and Canada -
somewhat overshadowing some of the specificities of its labor market, but also to the fact that
many economists hold a rather pessimistic view on the distributional effect of labor market
institutions in developing countries. One popular view is that these institutions are
responsible for severe labor market distortions (for an excellent discussion see Freeman,
2007; with specific reference to Latin America, see Heckman and Pages, 2004). An
admittedly simplistic summary of this argument is that excess labor market regulation in a
dualistic labor market – typical of many developing countries - leads to employment losses in
the covered sector and hence widespread informality, with workers moving to low
productivity jobs, in turn harming economic development. A corollary to this view is that the
minimum wage is potentially an ineffective re-distributive tool, since, with a covered and an
uncovered sector, its effect on the wage distribution gets "undone" by market forces, with
potential efficiency losses.
1 A different mechanism is highlighted by Verhoogen (2007) who shows that the exchange rate shock of 1994
(and 1985-87) led to differential quality upgrading across firms. Firms that were initially more productive were
the first to respond to the devaluation, by increasing exports and product quality with an ensuing increase in the
demand for skilled workers. Although potentially very interesting, this mechanism though, is - by the author's
own admission - unable to account for the trends in inequality in Mexico over the mid 1980s-early 2000s. Other
authors have dismissed explanations related to the effect of trade in favor of explanations based on of skill
biased technological change (Esquivel and Rodriguez-Lopez, 2003).

4
Indeed, Bell's (1997) seminal study on minimum wages in Mexico shows that
between 1984 and 1990 the minimum wage was too low to have an effect on the formal
(manufacturing) wage distribution. This early finding - together with evidence of widespread
non compliance - has sometimes been taken to imply that the minimum wage cannot be held
responsible for the trend in wage inequality in Mexico. Hanson and Harrison (1999, p.273)
for example read Bell’s (1997) results to suggest "that the decline in Mexican minimum
wages during the late 1980s cannot account for the increase in wage inequality" although in a
companion paper (Harrison and Hanson, 1999, p.143) they explicitly state that that
"alternative explanations for increasing wage inequality in Mexico include […] falling real
minimum wages […]".
Effectively, both causal observation and existing empirical evidence suggest that the
role of the minimum wage in shaping the trend in the earnings structure in Mexico since the
mid 1980s might have been underestimated. In Mexico (like elsewhere in Latin America)
minimum wages are an important institutional feature of the labor market and the economy as
a whole. Traditionally, not only wages but also pensions, prices, tax brackets and even fines
have been indexed to the minimum wage (Fairris at al., 2005). Interestingly, using ENEU
data, Bell (1997) finds some evidence that minimum wages create a floor to the distribution
of wages among all workers (formal plus informal). More recently, Maloney and Nunez
(2004), using the same data, show a pronounced spike at the minimum wage in Mexico (and
elsewhere in Latin America) among both formal and informal workers. Castellanos et al.
(2004) using social security data show that wage increases among formal workers are
strongly related to minimum wage increases, even among those workers with wages well
above the minimum wage (a phenomenon called "lighthouse" effect). A similar argument is
made by Fairris et al. (2005) who show that the cross-sectional distribution of wages among

5
all wage workers (formal plus informal) tends to bunch at multiples of the minimum wage,
with a large spike precisely at the minimum wage.
It is well known that - not very differently from the US - since at least the mid 1980s
the real bite of the Mexican minimum wage has been declining monotonically (Fairris et al.,
2005). The evidence that the minimum wage is a non-ignorable feature of the cross-sectional
distribution of wages in Mexico coupled with the observation that its decline throughout the
mid 1980s and 1990s happened at a time of rising wage dispersion begs for a more thorough
analysis of its effect on the trend in the wage structure. Although we do not dispute that other
forces might have shaped the distribution of wages - especially at the top, where the
minimum wage is deemed to have little or not effect - we show below that a significant share
of the increase in inequality in Mexico over the last decade is due to the decline in the real
bite of the minimum wage.
Despite the relative paucity of analysis, especially if compared to studies
concentrating on trade, admittedly, ours is not the first paper to analyze the effect of labor
market institutions - and in particular minimum wages - on the trend in the wage distribution
in Mexico. Fairris (2003) shows that the decline in unionization and trade unions’ reduced
ability to push for wage compression explain a non negligible proportion of the rise in
inequality among formal workers between the mid 1980s and the mid 1990s. Fairris et al.
(2005) show a clear correlation between the trend in inequality and the erosion in the real
value of the minimum wage while Popli (2005) argues that the timing of changes in the wage
structure in Mexico is more consistent with trends in labor market reforms than with other
reforms trends, notably trade and financial liberalization due to NAFTA.2 Although
suggestive, this evidence is far from conclusive, being based on a simple time series
correlation between policy reforms and inequality.
2 Cortez (2001) comes to different conclusions but admittedly the evidence in this paper is at most suggestive.
Other authors have focused on the effect of minimum wages on employment in Mexico. Feliciano (1998) finds
that the minimum wage has little effect on male employment with negative effects on female employment.

6
In order to estimate the effect of the minimum wage on the distribution of earnings in
Mexico, in this paper we borrow from the methodology proposed by Lee (1999) for the US.
Similar to Lee, we assume that inequality would have changed similarly across areas if not
for the effect of the minimum wage. Differences in average wages across areas - that are
assumed exogenous - induce useful variation in the real bite of the minimum wage that allow
the identification of its effect net of other confounding forces. We implement this strategy
using data from the Mexican Encuesta Nacional de Empleo Urbano (ENEU) from 1989 to
2001. Since minimum wages in Mexico can vary across municipalities in the same State, our
units of observation are individual municipalities. By using the variation at the municipality
level (as opposed to the variation by State, as in Lee, 1999) we are also able to account for
unrestricted State X time effects. This - among other things - allows us to control for the
differential exposure to trade and economic integration across Mexican States that has been
documented by others and sometimes used as source of identification for the effect of
globalization on the Mexican earnings structure. In the last part of the paper we account
explicitly in our regressions for trade reforms, and we run a "horse-race" between changes in
import tariffs and the real bite of the minimum wage.
The structure of the paper is as follows. Section 2 presents descriptive evidence on the
trend in inequality and its correlation with the real value of the minimum wage. Section 3
presents the identification strategy and additional evidence on the correlation between the real
minimum wage and inequality across municipalities. Section 4 presents the regression results
and Section 5 concludes.
2. Trends in Earnings Inequality and the Minimum Wage in Mexico
In this section we provide basic evidence on the trends in the distribution of earnings in

7
Mexico and the potential bite of the minimum wage. We present evidence of a broad time
series correlation between the rise in inequality between 1989 and 1997 and the fall in the
minimum wage. After 1997, the minimum wage follows its declining trend while inequality
reverts its trend, with some compression. The minimum wage hence is unable to account for
this subsequent fall in inequality.
For our analysis we use micro data from the Encuesta Nacional de Empleo Urbano
(ENEU) from 1989 to 2001.3 Our measure of earnings refers to actual monthly earnings. We
include all wage workers aged 16-60, with the exception of those respectively below the
bottom or above the top percentile in their municipality of residence. The ENEU is a
quarterly survey, and households stay for 5 consecutive quarters in the sample. We only use
data from the first quarter of each year.
We have combined these data with data on minimum wages. Minimum wages in
Mexico are set centrally and cover all workers.4 First, each municipality is assigned to a
group (A, B or C). For each group of municipalities, a different level of the minimum wage is
set that is meant to broadly deliver the same relative bite of the minimum wage (with A being
the highest wage - and hence the highest minimum wage - area and C being the lowest wage
area). The classification of municipalities into each group does not change over time.
We restrict in the rest to the 63 municipalities that are consistently present in the
ENEU throughout the period of observation. This comprises 23 zone A municipalities, 13
zone B municipalities and 27 zone C municipalities. Although, over time, more
3 Although the survey has been available since 1987, we restrict to the data from 1989 since over the first two
survey years wages of informal workers change dramatically and we have no clear explanation for this. It is
reassuring though that our estimates of the effect of minimum wages are essentially unaffected by the exclusion
of these two years (results available upon request). 4 Minimum wages in Mexico were first introduced in 1917 following the adoption of a new Constitution. At the
beginning minimum wages were set at the municipal level, being highly decentralized. Progressively, the system
evolved into a regional system of minimum wage determination with central coordination, until finally in 1986
the regional commissions were abolished, with responsibility for the minimum wage set at the central level. For
a summary of the institutional features of minimum wage legislation in Mexico see Feliciano (1998).

8
municipalities were added to the sample, we restrict to the municipalities that are present
throughout the period of observation in order to avoid the risk that the estimated trends in
inequality are affected by compositional changes. These are also the largest municipalities, so
an additional advantage of restricting to this sample is that estimates of the wage distribution
by municipality are relatively more precise. The municipalities in the sample account for 70%
of the urban population as of 2000. We have approximately 36,000 individual observations
per year and the average number of individuals in each year-municipality cell is 565 (with
90% of the cells including more than 50 observations). Table A1 in the appendix reports the
list of the municipalities included, the State and the minimum wage area they belong to. One
can see that municipalities within the same state can belong to different minimum wage
zones.
The labor earnings variable in our analysis refers to usual pay from the primary job
and includes overtime premia and other bonuses. Since the minimum wage is given in daily
pesos, whereas labor income in the ENEU is monthly, we transform the daily official
minimum wage into a monthly minimum wage equivalent multiplying it by a factor of 30.5
The top panel of Figure 1 reports the evolution of the wage structure in Mexico as
measured by the difference between the first, third, seventh and ninth deciles and the median
of the log wage distribution. All series are standardized to their value in 1989. Alongside, we
also report a measure of the difference between the minimum wage and the median wage (the
Kaitz index).6 Unless otherwise noted, the data in this and the following figures refer to both
men and women and include all employees, irrespective of whether they declare contributing
to social security or not.
5 To obtain this number we have divided monthly earnings by the official daily minimum wage. This results in
the highest spike at 30 days in all three regional distributions. 6 These series are obtained from separate regressions of each different decile of the wage distribution by
municipality and year on municipality fixed effects and year dummies. The reported series contain the estimated
time effects relative to 1989. A similar procedure is used to estimate the trend in the real bite of the minimum
wage. Trends in inequality based on the unconditional (i.e. across all municipalities) distribution of earnings at
each point in time deliver remarkably similar results.

9
A few observations are in order. First, there is a clear fanning out of the wage
distribution throughout the period of analysis. Inequality rises markedly from both the top
and the bottom until around 1997. The first to fifth decile gap falls by around 20 p.p. between
1989 and 1997. At the top, the ninth to fifth decile gap rises by around 30 p.p. Over the
period 1989-1997 the differential between the top and bottom decile grows by around 50 p.p.
Similar to others' findings, the data show that inequality drops in the second half of the
1990s. The 10-50 percentile gap increases in the period 1997-2001 by 4 p.p. while the fall at
the top is in the order of 12 p.p. Overall between 1989 and 2001 inequality rises. We estimate
an annual average fall in the 10-50 percentile gap of 1.6 p.p. and a rise in the 90-10 decile gap
of around 1.8 p.p. As already mentioned in the introduction, we are not the first ones to note a
reversion in inequality in the second half of the 1990s. While some authors argue that this
was the result of the severe macroeconomic crisis and the 1995 devaluation of the Mexican
currency (Airloa and Juhn, 2005), others suggest that this was the result of Mexico entry into
NAFTA, that led to tariff reduction in more skill intensive industries (Robertson, 2004),
while an additional explanation is that the rise in inequality across several Latin American
countries - including Mexico - during the 1980s-1990s was just a temporary phenomenon,
due to the structural reforms of the 1980s whose effects dissipated in the course of a decade
(Behrman et al, 2000; Airloa and Juhn, 2005).7
A second feature that emerges from Figure 1 is the almost monotonic deterioration in
the real value of the minimum wage. Between 1989 and 1995 the value of minimum wage
relative to the median wage falls by approximately 37 p.p. Such fall is due to double digit
wage inflation in the face of only modest nominal increases in the minimum wage. After
1995, following the signing of NAFTA, in the middle of a severe recession followed by the
7 We have also computed inequality series based on alternative measures (the standard deviations of log wages)
or for other samples (all municipalities, irrespective of whether these are consistently present in the period of
observation). In all cases the trends in inequality are similar, with an initial pronounced rise and a reversion in
inequality from around 1997.

10
currency devaluation, and despite resurgent inflation, a marked increase in the nominal value
of the minimum wage generates a temporary rise in its bite (of around 20 p.p. in only two
years), after which the minimum wage rejoins its downward trend.
Although the top panel of Figure 1 clearly suggest that the trend in inequality is
somewhat correlated with the trend in the minimum wage bite, by concentrating on the
changes over time, this figure is unable to show where exactly the minimum wage locates
relative to the cross-sectional distribution of wages. In Figure 2 we report kernel density
estimates of the distribution of wages at three points in time: 1989, 1995 and 2001 and for the
three minimum wage areas (A, B and C). In order to get a visual impression of the time
changes in the wage distribution, in each of the figures we report the distribution of log
wages over two consecutive points in time (respectively 1989 and 1995, and 1995 and 2001).
All series are standardized to the contemporaneous median wage in that area. Alongside, two
vertical lines report the real value of the minimum wage in the two consecutive years. First,
note the general widening of the wage distribution between 1989 and 1995 and its substantial
stability afterwards. The minimum wage appears to create a support for the wage distribution
in the early years. One can see a clear spike in the distribution at the minimum wage although
compliance appears far from full. Between 1989 and 1995 the minimum wage declines
sharply. That is represented in the picture by a substantial shift of the vertical line leftwards.
One can clearly see that as the minimum wage declines, the distribution 'fattens up' at the
bottom tail while the bunching around the old minimum wage disappears. Interestingly there
are no pronounced changes at the top of the distribution. By 1995, the minimum wage is so
down the wage distribution that it offers little support to it. Changes in the minimum wage
between 1995 and 2001 are rather modest, as already shown above, and, if anything, one can
see a moderate decrease in inequality over this period.

11
In sum, the time series variation in the trends in inequality is roughly consistent with
the trend in the real bite of the minimum wage, until at least the mid 1990s. However, this
correlation is far from being a proof of any causal effect of the minimum wage on wage
inequality. In the next section we present empirical evidence confirming this hypothesis.
3. Empirical Model and Basic Evidence
In order to identify the effect of the minimum wage on the wage distribution, in this section
we concentrate on the wage distribution by municipality. Following Lee (1999), who uses
this strategy for different US states, we postulate that in the absence of minimum wage, the
wage structure would have been (or would have evolved) identical(ly) across municipalities.
We attribute any deviation around this common unobserved level (trend) to the effect of
minimum wages. In formulas we assume that:
wmtq
- wmtp= w*mt
q - w*mt
p if w*mt
q ≥MWmt
(1)
wmtq - wmt
p= MWmt - w*mt
p if w*mt
q<MWmt
where wmtq is the q-the quantile of the observed log wage distribution in municipality m at
time t, MWmt is the log of the nominal minimum wage in the same municipality, and a star
denotes latent variables, i.e. the ones that would have been observed in the absence of
minimum wages.
Equation (1) assumes that the differential between the q-th and the p-th percentile of
the actual log wage distribution in municipality m equals the latent differential if the latent
level of wages at percentile q is above the minimum wage, and equals the differential
between the minimum wage and the p-the percentile otherwise. This is a simple censoring

12
model, implying - as said - that in the absence of minimum wages, wage dispersion would be
the same across municipalities, although the average wage level (denoted by p) could still
differ across municipalities.
To achieve identification we make two hypotheses. First, that wages at percentile p
and above are unaffected by the minimum wage, so that actual and latent quantile above p are
the same (wmts= w*mt
s, s≥p). Second, that the difference between the q-the and the p-the
quantile of the latent wage distribution is the same across municipalities (w*mtq-w*mt
p =
w*m'tq-w*m't
p). It follows that model (1) can be written as:
wmtq- wmt
p= Dt
q if w*mt
q ≥MWmt
(2)
wmtq- wmt
p= MWmt - wmt
p if w*mt
q <MWmt
where Dtq is the latent differential between the q-the and p-the quantile that we assume being
the same across municipalities (and hence not carrying the subscript m).
A useful feature of the model (2) is that for sufficiently high s (s≥q) one would expect
differentials across municipalities to be the same. This in turn implies that the model provides
an implicit falsification test for the identification assumption. In practice, we should not
observe any relationship between inequality at the top of the distribution and the minimum
wage.
In order to operationalize equation (2) we again follow Lee (1999) and write equation
(2) as
wmtq-wmt
p=dqt+βq
[MWmt-wmtp]+umqt, (3)
In practice, we let the dispersion of wages be a function of a measure of real bite of
the minimum wage, MWmt-wmtp, plus time dummies, dqt, and an error term umqt. The time
dummies pick up the evolution of wages at percentile q conditional on the minimum wage,

13
i.e. the latent level of inequality at time t (w*mt
q-wmt
p), while βq
picks up the effect of
minimum wages at percentile q.
Because, if not for the small differences across the three areas, the minimum wage is
effectively the same across municipalities (MWmt=MWt), its bite depends effectively on the
level of wages at quantile p in each area (wmtp). One will expect the minimum wage to affect
inequality in areas where wages are on average low. Effectively model (2) identifies the
effect of the minimum wages based on cross-sectional differences in inequality across
municipalities. The counterfactual distribution - i.e. the one that would be observed in the
absence of the minimum wage - is identified by municipalities with a high average wage and
hence where differentials are unaffected by the minimum wage itself.
Model (3) is fairly restrictive in that it assumes that the latent level of wages is exactly
the same in each municipality. A variant of specification (3) is to assume that the trends in
(but not the levels of) latent inequality are the same across municipalities. This effectively
consists in assuming that:
wmtq- wmt
p= Dt
q+Dm
q if w*mt
q ≥MWmt
(2')
wmtq- wmt
p= MWmt - wmt
p if w*mt
q <MWmt
which delivers the following empirical model:
wmtq-wmt
p=dqt+dqm+βq
[MWmt-wmtp]+u'mqt, (3')
where the dmq are municipalities X quantile dummies. The difference between model (3) and
model (3') is the latter only exploits the differential variation in the real bite of the minimum
wage within municipalities (in essence a simple diff-in diff model) while the former uses the
cross-sectional variation for identification. Omission of municipality fixed effects might lead
to biased estimates of the effect of interest if the level of average wages in a municipality is
systematically correlated with its latent level of inequality. Although a priori this needs not to

14
be the case, the inclusion of fixed effects should make the identification of the model more
credible.
Before presenting the regression results for models (3) and (3'), we present an
additional set of figures. Figures 3 plots the difference between the first and the ninth deciles
relative to the sixth decile (p=60 in our model) across municipalities (on the vertical axis) on
the minimum wage relative again to the sixth decile (on the horizontal axis). We plot these
series at the beginning (1990) and at the end (2001) of the period.8 The reason for using the
sixth decile (as opposed to the median, as it would appear natural and consistent with Lee,
1999) is that - as shown below - we find that wages up to the median appear to be affected by
the minimum wage. The solid line is a 45 degree line representing the log minimum wage
relative to the sixth decile of the wage distribution by municipality.
One can notice that at the beginning of the period the bite of the minimum wage
tracks remarkably well differences in the dispersion of wages at the bottom of the distribution
across municipalities, consistent with model (3). A large number of municipalities appear to
lie on the 45 degree line, suggesting a strong bite of the minimum wage. Also, consistent with
this model, one can notice that the dispersion at the top of the distribution is essentially
uncorrelated - or perhaps mildly negatively correlated - with the minimum wage.
After around a decade, and a substantial decline in the real value of the minimum
wage, the correlation between wage dispersion at the bottom and the minimum wage gets
weaker. The mass of the distribution shifts to the south-west, implying lower real minimum
wages and higher wage inequality at the bottom. Accordingly, most data points lie above the
45 degree line and essentially on a horizontal line. This is consistent with the minimum wage
having lost its bite and not creating any support for the wage distribution. The circumstance
that the first to sixth decile gap appears roughly uncorrelated with the minimum wage bite in
8 The figure for 1989 is similar to the one for 1990 but displays more variability across municipalities.

the later period is consistent with the identification hypothesis, that in the absence of
minimum wages, wage differentials are the same across municipalities. After a decade,
differentials at the top have increased too, although, consistent with model (2) they still show
no correlation with the minimum wage.
Figure 3 exploits the cross-sectional variation across municipalities. As said, one
might be worried that in high wage municipalities wage dispersion is different for reasons
other than the minimum wage itself. To account for this, Figure 4 reports the correlation
between yearly changes in wage differentials and yearly changes in the real bite of the
minimum wage over the entire period of observation. To obtain these series we have
regressed each differential on unrestricted year and municipality dummies and we have taken
residuals from these regression. These are effectively wage differentials net of permanent
differences across municipalities and nationwide trends in inequality. The left hand side panel
plots residuals for the first to sixth decile gap over the residuals for the differential between
the log minimum wage and the sixth decile. Again the solid line is the 45 degree line. One
can clearly see a very strong positive correlation between the two, with changes in the real
value of the minimum wage tracking well changes at the bottom of the distribution. The same
figure for the differential between the top and the sixth decile of the wage distribution in the
right hand side panel shows instead no correlation. This evidence is remarkably consistent
with model (3').
In sum, both the cross-sectional variation and the differential time series variation
across municipalities appear to show strong effects of the minimum wage at the bottom of the
distribution and no effects at the top.
4. Regression Results
15
In this section we report regression results for equations (3) and (3'). As in Figures 1 to 4, we
16
start by pooling men and women and we include both formal and informal workers.
Table 1 presents regressions where each wage differential relative to the sixth decile
is regressed on year dummies with no control for the minimum wage. Rather then reporting
individual coefficients on each year dummy, we report the average annual change that is
computed by regressing the coefficients on the year dummies on a linear trend, with
observations weighted by the reciprocal of the square of the standard error of each estimated
coefficient. These regressions effectively give an estimate of the actual changes in the wage
structure.
The table shows a clear widening of the wage distribution over time. The fist decile
for example grows at a lower rate than the sixth decile, with an annual average rise of about
1.9 p.p. over the entire period of observation. The top decile grows relative to the sixth decile
by approximately the same amount (0.016). Results with municipality fixed effects at the
bottom of the table (effectively those reported in the top panel of Figure 1) lead virtually to
the same results, suggesting that most of the changes in inequality take place within
municipalities.
Table 2 reports the estimate of equation (3). Standard errors are clustered by state.
One can see a clear effect of the minimum wage at the bottom of the distribution, with a 10
p.p. rise in the gap between the minimum wage and the sixth decile being associated to a rise
in the gap between the bottom decile and the sixth decile of around 4 p.p. (0.385 X 0.10).
Interestingly, the effect of the minimum wage appears positive at the bottom and negative at
the top, implying significant but decreasingly weaker effects at higher deciles of the
distribution. For example we estimate that a 10 p.p. rise in the gap between the minimum
wage and the sixth decile is associated to an annual fall in the gap between the top decile and
the sixth decile of around 3 p.p. This result is consistent with the mild negative correlation

17
between the dispersion at the top of the distribution and the minimum wage that is apparent in
Figure 3. These results would imply that the effect of the minimum wage propagates
throughout the wage distribution, with pronounced although decreasing effects at higher
percentiles.
Estimated latent trends in the same panel suggest that - had the minimum wage
remained unchanged - inequality would have risen at the bottom by around 0.7 p.p. a year
(column (1)), while inequality at the top would have risen by about 1 p.p. a year (column (8)).
Overall, this implies a latent trend in the ninth-to-first decile gap or around 1.7 p.p. a year.
This compares with an estimated actual trend in this gap of around 3.5 p.p. (this is 1.6, in
column (8), top panel of Table 1, plus 1.9, column (1) of the same table). The decline in the
real value of the minimum wage hence would be responsible for around half of the increase
in the ninth-to-first log decile gap.
Regressions in Table 2 suggest very pronounced spillover effects of the minimum
wage throughout the wage distribution. Although this is not necessarily an unreasonable
finding for Mexico, where - as said - it is known that minimum wages act as a nominal
anchor for entire earnings distribution (see Castellanos et al., 2004), it is perhaps hard to
believe that even very high wage workers gets affected by minimum wages.
An alternative explanation for these results is simply that model (3) is mis-specified.
As already mentioned, some spurious correlation between "average" wages and wage
inequality across municipalities might lead to estimates of the effect of interest that are
biased. In particular, if municipalities with higher average wages also display higher latent
inequality, one would find that in these municipalities the real bite of the minimum wage is
lower and inequality higher, leading to some spurious negative correlation between the
minimum wage bite and inequality.

18
As a way to check for this, in the bottom panel of Table 2 we report the same
regressions as in the top panel where municipality fixed effects are included (equation (3')). A
few observations are in order. First, the estimated coefficient on the minimum wage at each
percentile increases relative to the specification with no fixed effects. This is consistent with
the idea that municipalities with higher average wages (and hence lower bite of the minimum
wage) also display higher levels of inequality. The omission of municipality fixed effects
tends to underestimate the effect of the minimum wage at each decile. Similar to the
specification at the top of the Table, the effect of the minimum wage tends to be stronger at
the bottom of the distribution and to decline at higher deciles. For deciles above the fifth we
now find small and statistically insignificant effects of the minimum wage. This is precisely
consistent with model (3'). Trends in latent inequality suggest no significant changes at the
bottom of the wage distribution. For example, we find that the difference between the first
and the sixth decile would have actually risen by a 0.1 p.p. a year if the minimum wage had
not declined. This is a small and statistically insignificant change. Not surprisingly, latent
changes at the top of the distribution appear almost identical to the observed ones, since we
see no significant effect of the minimum wage there. Overall, these regressions point to the
circumstance that minimum wages are almost exclusively responsible for the rise in
inequality from the bottom (i.e. below the sixth decile) over the period of observation.
Although relative to the regressions in the top panel, these estimates provide a rather different
picture of the effect of the minimum wage at each decile, the basic conclusion on the effect of
minimum wages on the trend in the ninth-to-first decile gap remains unaffected. Estimates at
the bottom of Table 2 imply that the ninth-to-first decile gap would have risen by around 1.6
p.p. a year had the minimum wage remained unchanged in real terms. This is again just
below half of the actual increase (3.5 p.p. a year).

19
To get a visual impression of the estimated effects from the bottom panel of Table 2,
the middle panel of Figure 1 reports the estimated changes in inequality at each decile of the
wage distribution that can be attributed to the decline in the minimum wage. This is
effectively obtained by multiplying the estimated coefficients on the minimum wage in the
bottom panel of Table 2 times the trend in the minimum wage bite. In order to present a more
standard picture and one that is directly comparable to the top panel of Figure 1, we report the
estimated effects at each decile relative to the median. For example, for the first decile this is
computed as the coefficient in column (1), bottom panel of Table 2, minus the coefficient in
column (5) of the same table. The difference in these coefficients is then multiplied the
change in the Kaitz index (the minimum wage minus the median). One can clearly see a
pervasive effect of the minimum wage across the entire wage distribution, even when
municipality fixed effects are included. The decline in the real bite of the minimum wage is
responsible for a 22 p.p. fall in the differential between the bottom decile and the median over
the 13 years of observation. Not surprisingly, the minimum wage appears also to affect
inequality at the top relative to the median. This is because, even when municipality fixed
effects are introduced, we find spillover effects up to the median. This implies that part of the
observed fanning out at the top of the distribution in Figure 1 can be ascribed to the decline in
the minimum wage itself. In fact the data show that the decline in the minimum wage is
responsible for a rise of around 9 p.p. in the gap between the top decile and the median.
The latent variation in inequality is depicted in the bottom panel of Figure 1. This is
obtained based on the estimated year dummies from the regressions in Table 2, bottom panel.
The figure shows an overall stability in latent inequality at the bottom. There appears to be
some temporary widening up of the wage distribution around 1997. The most plausible
explanation is the turbulence in the labor markets following the 1994 devaluation of the
Mexican peso and the ensuing recession. Verhoogen (2007) in particular argues that

20
differential quality upgrading across plants following a currency devaluation could in
principle lead to a temporary increase in inequality, and he provides convincing evidence in
favor of this hypothesis following the 1994 peso devaluation. At the top, we see a
pronounced latent rise in inequality in the first years of observation and a reversion after
1997. For example, the picture shows a rise in the ninth to fifth latent decile gap of 25 p.p.
between 1989 and 1997 and a subsequent fall of around 15 p.p. In sum, regressions with
municipality fixed effects show pronounced - although declining - effects of the minimum
wage up to the median. When municipality fixed effects are accounted for, the data pass the
over-identification test implicit in model (3').9
In the rest of the analysis we present a battery of additional regressions to check the
robustness of our findings and to analyze the responses across different samples. Because of
the findings in this chapter, we always include in the model municipality fixed effects.
4.1 Robustness Checks
In Table 3 we report a number of robustness checks for our estimates in Table 2. As a first
check we have run the same regressions via GLS where we use the number of observations
by municipality as weights. Results are essentially unchanged. If anything, point estimates of
the effect of minimum wages fall slightly, suggesting a lower bite in larger municipalities.
Estimated trends in latent inequality remain virtually unaffected.
One problem with the regressions in Table 2 is that any measurement error in the
"average" level of earnings will lead to a positive mechanical correlation between different
measures of inequality and the real bite of the minimum wage, hence leading to an upward
9 Our results are somewhat different from Lee (1999) who finds that the inclusion of local (i.e. State in his
regressions) fixed effects leads to a rejection of the identification assumption. One explanation for his results is
that the residual variation in the minimum wage bite is disproportionately due to measurement error when state
fixed effects are included, leading to an attenuation bias in the estimates of the minimum wage effects. An
alternative explanation is that his model is slightly mis-specified.

21
biased estimate of the effect of the minimum wage. Lee (1999) also notes this problem, and
in an attempt to remedy it, he uses trimmed median wages as a measure of centrality. In our
setting, where mean cell sizes are not very large (on average 565 observations), sampling
error is potentially a serious source of concern, and this is likely to be exacerbated by the
inclusion of municipality fixed effects.
In order to account for this, in the second panel of Table 3 we report regressions
where we instrument the real bite of the minimum wage (the log minimum wage minus the
sixth decile of the log wage distribution) by the real bite of the minimum wage computed
using lagged wages (the log of the contemporary minimum wage minus the sixth decile of the
log wage distribution lagged one year). To the extent that sampling error is uncorrelated over
time within municipalities, this IV strategy will lead to estimates of the effect of the
minimum wage that are free of division bias. A comparison of the results in the second panel
of Table 3 - where we revert to unweighted regressions – with those in the bottom panel of
Table 2, effectively show that the IV estimates are slightly lower than the OLS estimates.
Results though are very similar. For example, the IV estimate at the bottom decile is 0.528,
compared to an OLS estimate of 0.604. Similarly the estimated trend in the latent first to sixth
decile gap is -0.002, compared to an OLS estimate of 0.001. Like in Table 2, the effect of the
minimum wage declines at higher deciles and disappears at deciles above the fifth. Sampling
error does not appear to drive our results.
As a third check we additionally control in our regressions for the interaction of year
dummies with State dummies. As said, the 63 municipalities in the sample belong to 15
States (out of the 32 Mexican States). These regressions effectively identify the effect of
minimum wages based on its differential variation across municipalities in the same State.
This appears important because, Mexico, like the US, is a federation of States, each with a
certain degree of autonomy, its constitution, governor and congress. Although - as said -

22
minimum wages are set at the federal level, State specific policies or macro economic factors
might induce a spurious correlation between the minimum wage bite in the municipalities
that make part of that State and trends in inequality. Effectively, others (see for example
Feenstra and Hanson, 1997 and Hanson, 2004, 2005) have exploited regional or State-level
variation to identify the effect of US production delocalization, FDI, and migration
opportunities on the Mexican wage structure and the distribution of income. Similarly,
distance to the US border appears to be an important predictor of changes in the wage
structure. By controlling for State X year fixed effects we make sure that our results are not
contaminated by unrestricted trends in omitted State factors that others have shown to be
important predictors of changes in the wage structure. Results from these regressions are
reported in the third panel of Table 3, where we revert to unweighted OLS regressions. For
brevity, here we only report the effect of the minimum wage, since the estimated trends in the
wage structure will by definition vary by State, and this would imply reporting fifteen
additional coefficients. It is remarkable again that the estimated effect of the minimum wage
is very similar to the one in Table 2, bottom panel. If anything, estimated coefficients are
slightly higher suggesting that that the decline in the real value of the minimum wage is
smaller in those States that experience a higher increase in inequality. State specific policies
or State specific macroeconomic shocks hence do not appear to explain the results in Table 2.
As a final check, in the bottom panel of Table 3, we present results where we
additionally control for municipality linear time trends. By adding these controls we
additionally purge our estimates of (linear) trends in inequality across municipalities that
might be correlated with the decline in the minimum wage. Identification here is based on the
differential growth in the minimum wage bite across municipality, net of municipality
specific trends and state specific macroeconomic shocks. Again, even with this extremely
saturated specification, we find essentially similar results.

23
4.2 Differences by Gender
So far we have pooled men and women together. Separate regressions for men and women
are reported in Tables 4A and 4B respectively. Table 4A reports the estimated trends in actual
and latent inequality alongside the estimated effect of the minimum wage at each decile of
the men's wage distribution. Specifications include fixed effects by municipality and time and
are unweighted (like in Tables 1 and 2, bottom panel). Notice that because we have
standardized all series to the sixth decile of the unconditional wage distribution, we can also
report effects for those at the sixth decile of the men's wage distribution (that is not by
construction equal to zero as in Tables 1 to 3). Similarly to the regressions that pool men and
women together, results for men at the top of the table show a remarkable rise in inequality
over the period. The ninth-to-first decile gap grows by around 3.4 p.p. a year with a widening
of the wage distribution from both the bottom and the top. Estimates the bottom of the table
show again an effect of the minimum wage that is the strongest at the lowest decile and
declining at higher deciles, with no effect at deciles above the fifth. It appears that inequality
at the bottom of the distribution would have remained constant if the minimum wage had
maintained its original bite while all of the rise of the top is due to changes in latent
inequality.
Results for women in Table 5B are similar. Inequality among women as measured by
the ninth to tenth decile gap rises through the period of observation by around 4.1 p.p. a year,
a larger rise than what found for men. Around two thirds of this rise (2.6 p.p., that is 0.027 in
column (9) minus 0.001 in column (1)) is due to changes in latent inequality. The residual
third is attributable to the effect of minimum wages, that appear to affect women at each
decile up to the sixth. This should be no surprise, since women have on average lower

24
earnings than men. Again, minimum wages explain the entire rise in inequality at the bottom
for women and no much of the variation at the top of the distribution. Interestingly, and
different from Lee (1999), the results in Tables 4A and 4B show that our model fits
remarkably well even when men and women are considered separately.
4.3 Formal and Informal Workers
Several analyses of wage determination and the effect of labor market institutions in Mexico
refer to formal workers only (e.g. Castellanos et al., 2004) or they provide separate results for
workers based on their formal status (e.g. Maloney and Nunez, 2004). This is sometimes due
to data limitations (like in the case of the studies that use social security data or many studies
that use data for registered firms) while in other instances this is due to the idea that formal
and informal workers are differently affected by labor market institutions.
Because of the circumstance that informal workers have fewer guarantees and are less
protected from unjustified firing, one might suspect that these workers are also less likely to
be affected by minimum wage legislation. Maloney and Nunez (2004) though find no
evidence in support of this hypothesis, and Bell (1997) actually reports that the minimum
wage has a stronger effect on informal than on formal workers. This is also apparent in
Figure 5 where we report kernel density estimates of log wages separately for formal and
informal workers in 1989, alongside the level of the minimum wage. Following most the
literature, we define informal workers as those who are not covered by social security
payments in their job.10
We only report the Figure for area B, although figures for the other
areas are similar. All series are standardized to the median of the unconditional (i.e. formal
10
Normally, when available, two criteria are used to assess the informal status of a worker: firm size and
contribution to social security. In practice these two criteria overlap substantially. The vast majority of workers
without social security coverage in their job work in small firms. A stricter definition of informality that restricts
to workers without social security coverage in small firms only leads to similar regression results.

25
plus informal workers') log wages in that area. Note that informal workers account for around
25% of employment and have on average lower earnings. Consistent with Maloney and
Nunez (2004), note that a spike at the minimum wage is apparent for both formal and
informal workers. Relatively speaking, a higher proportion of informal workers appear to be
in the neighborhood of the minimum wage. However, non-enforcement also appears to be
higher among informal workers (12% of informal workers report being below the minimum
wage compared to only 1% of formal workers).
The evidence that informal workers also appear to be affected by minimum wages
perhaps is not too surprising. As said, the minimum wage in many Latin American countries,
including Mexico, has long been used as an inflation index, so it is possible that informal
workers are also directly affected by it. Consistent with this view, Freeman (2007) argues that
in an economy where wages are very dispersed (as in many developing countries) minimum
wages might affect the reservation wage of all workers. This point is also made by Falk et al.
(2006) who present laboratory experimental evidence in favor of the minimum wage
affecting worker's reservation wages through an "entitlement effect".
In the rest of this section we investigate separately the effect of minimum wages for
formal and informal workers. One has to exert some caution in interpreting these results. In
the presence of a covered and an uncovered sector, minimum wages might spillover to the
uncovered sector through labor demand and supply adjustments. The idea, that dates back to
Harris-Todaro (1970), is that higher minimum wages might price some workers out of the
covered sector, hence raising the supply of labor to (and hence the wages in) the uncovered
sector. However, higher minimum wages might also attract workers from the uncovered
sector, who will queue for covered sector jobs, leading to unemployment and lowering the
labor supply to the uncovered sector, and hence increasing uncovered workers' wages. If the
labor demand elasticity is different in the two sectors, a rise in the minimum wage leads to

26
ambiguous predictions in terms of the uncovered sector wage and the uncovered-to-covered
sector wage differential (Mincer, 1976).11
In practice, even if informal workers (i.e. those not
covered by social security payments) are not directly covered by minimum wages, there are
theoretical reasons to believe that their wages respond (albeit indirectly) to minimum wages.
In this case though the effect of the minimum wage will also encompass an endogenous
compositional response, so analyzing separately formal and informal workers might be
inappropriate.12
With this caveat in mind, Figure 6 - similar to Figure 3 - reports the correlation
between different measures of wage dispersion and the bite of the minimum wage for formal
workers while Figure 8 reports the same information for informal workers. In order to obtain
these figures we have standardized each decile of the conditional wage distributions and the
minimum wage to the sixth decile of the unconditional (i.e. formal plus informal workers')
wage distribution.13
Again here we pool men and women.
Figure 6 shows an extremely clear bite of the minimum wage among formal workers
in the early years at the bottom of the distribution that fades away by the end of the period.
Compliance among formal workers appears almost perfect. Again, there is no correlation
between inequality at the top and the minimum wage. When residuals from a regressions of
the relevant series on municipality and year dummies are considered, in Figure 7 (similar to
11
Additional general equilibrium effects might arise due endogenous movements of capital across the two
sectors. 12
We have investigated this using a methodology similar to Card (1992) by regressing a number of employment
outcomes on the minimum wage bite, based on a specification similar to (3') (plus a lagged dependent variable,
estimated via GMM). Our results show that higher real minimum wages across municipalities and time are
effectively associated to higher informality. We are cautious though in interpreting this as a causal relationship
since we find no evidence of these effects being stronger among low paid workers, that is what one would
expect for minimum wages to explain informality. An alternative interpretation is that this higher average wages
(and hence lower real minimum wages) are associated to lower informality for reasons other than the minimum
wage. 13 The reason for this is that - as already apparent from Figure 5 - informal workers have on average low
earnings: median informal wages are around 50% lower than median formal wages and the sixth decile of the
unconditional wage distribution corresponds approximately to the eight decile of the informal wage distribution.
Were we to standardize each group of worker's wages to the sixth decile of their own wage distribution this
would (and indeed does) lead to a clear rejection of the exclusion restriction among informal workers.

27
Figure 4), we see again an extremely precise correlation between changes in inequality at the
bottom and changes in the minimum wage that disappears at the top of the distribution.
Perhaps these results are not very surprising given that formal workers account for
around 75% of the sample, so anything that is true for the unconditional wage distribution is
likely to hold for the formal wage distribution too. Potentially more interesting is the
evidence on informal workers in Figures 8 and 9. Notice that since these workers only
account for 25% of the sample, estimates are less precise. Still, the data show very clear
patterns. One can see that in the early period the bottom decile of the wage distribution for
informal workers lies generally below the minimum wage, implying imperfect compliance.
However, there is a clear positive correlation between minimum wages and inequality at the
bottom. The minimum wage appears to "pull" wages of low paid informal workers, consistent
with the idea that this acts as a nominal anchor for all workers in the economy, without
necessarily being a wage floor. By the end of the period, wages of informal workers at the
bottom decile essentially correspond to the (by now lower) minimum wage. Perhaps also
worth noticing is that the top decile of the informal wage distribution seems to be positively
correlated with the minimum wage bite at least in the early period, suggesting potentially
pronounced spillover effects of the minimum wages at high deciles of the informal wage
distribution. Results based on changes in inequality and the minimum wage in Figure 9
confirm the evidence above that low paid informal workers are affected by the minimum
wage.
The evidence in Figures 6 to 9 is confirmed by the regression estimates in Tables 5A
and 5B, that have the same structure as Tables 4A and 4B. Inequality among formal workers
grows over time, a fact that is also clear from an analysis of the top left-hand side panel of
Figure 10, that has the same structure as Figure 1. The ninth-to-first decile of the formal wage
distribution grows on average by 3 p.p. a year. This is due to a roughly equal rise in the ninth

28
to fifth decile and the first to fifth decile gaps. Again the minimum wage seems to affect
workers at the bottom of the distribution with pronounced spillover effects up to the median
of the formal wage distribution.14
Latent inequality grows considerably at the top. We estimate that the ninth to fifth
decile of the formal distribution would have risen by around 1.5 p.p. a year over the period of
observation had minimum wages not declined (this is 0.29 in column (9) minus 0.14 in
column (6)). This is effectively equal to the observed changes (in the order of 1.7 p.p.).
Changes at the bottom of the latent distribution by converse are negligible. We estimate that
the gap between the first and the fifth decile of the latent distribution remains constant over
this period (this is 0.14 in column (5) minus 0.14 in column (1)). Again this is confirmed
visually in left-hand side panels of Figure 10. The entire rise in inequality at the top of the
distribution for formal workers is due to latent trends, while the minimum wage accounts for
almost the entire rise in inequality at the bottom.
Regression results for informal workers also confirm the evidence in Figure 9. First
note a substantial increase in inequality among informal workers. Table 5B, top panel, shows
an overall increase in the ninth-to-first decile gap of around 1.8 p.p. a year. This is largely
due to a rise in inequality at the top of the informal wage distribution, with the actual ninth to
fifth decile gap rising by 1.3 p.p. Again this is confirmed visually in Figure 10, top right hand
panel. What is potentially more interesting is that that the minimum wage seems to affect up
to around the eight decile of the informal wage distribution. This should be no surprise since
this roughly corresponds to the sixth decile of the unconditional wage distribution. Latent
changes in inequality, that are also plotted in Figure 10, right-hand side panel, are essentially
14
Note that latent differentials seem to grow at almost each decile of the formal wage distribution. This depends
on the circumstance that we have standardized formal workers’ wages to the sixth decile of the unconditional
(i.e. formal plus informal) wage distribution. The erosion of the real value of the minimum wage is associated to
a rise in the average wage gap between formal and informal workers, with an overall rise in the gap between
each decile of the formal wage distribution and the sixth decile of the unconditional wage distribution.

29
flat. The minimum wage appears to explain essentially all of the rise in inequality among
informal workers.
In sum, we find wages of both formal and informal workers in Mexico being
responsive to minimum wages. Compliance among formal workers is almost perfect and the
minimum wage has the potential to explain most if not all of the rise in inequality at the
bottom of the formal wage distribution over the thirteen years of observation. Still the data
show that latent inequality at the top of the distribution for formal workers first rose and then
fell over the period of observation, something that cannot be explained by the minimum
wage.
It appears that although the minimum wage does not necessarily act as a wage floor
for informal workers, due to widespread non compliance, its effect on the informal wage
distribution is substantial. Low wage informal workers appear to respond to minimum wage
changes. Effectively, our data show that the erosion in the minimum wage bite over this
period can essentially explain all of the rise in inequality among informal workers.
4.4 Explicit Controls for Tariffs
Perhaps one of the major sources of concern for the results in the previous tables is that the
correlation between wage inequality and the minimum wage might be contaminated by the
opening of the Mexican economy throughout the 1980s and 1990s. As discussed in the
introduction, others before us have shown that trade opening contributed substantially to
shaping the trends in the earnings distribution in Mexico. If the impact of the trade reforms
affected different municipalities differently, so that municipalities with higher growth in
average wages - and hence a greater reduction in the real value of the minimum wage - also
happened to be relatively more affected by trade liberalization (and assuming that trade

30
openness increases inequality as generally argued), one might end up overestimating the role
played by the deterioration in the real value of the minimum wage on inequality.
In order to assess the influence of trade liberalization vis à vis the minimum wage, in
the rest of this section we present regressions that explicitly control for import tariffs in
addition (or in alternative) to the minimum wage.
Before proceeding to the analysis, it is important to remark on some substantial
differences between our analysis and other papers in the area. First, our data come from a
household survey for urban areas, while several existing studies (Revenga, 1997; Hanson and
Harrison, 1999; Feenstra and Hanson, 1997 and Verhoogen, 2007) used plant or firm level
data for the entire country. Although this latter approach has the advantage of allowing the
researcher to control for unobserved time invariant plant characteristics, these data only refer
to manufacturing and exclude other (tradable and non tradable) industries. By converse, most
other studies do not impose any restrictions on the location of firms and workers, while - as
said - our data refer to urban areas only. In addition, typically, plant level data refer to large
formal enterprises, while our data include all wage employees in all firm sizes, irrespective of
their or their firm formal status. These are all margins of potential selection that might affect
the results and make our analysis not directly comparable to others. Second, most studies
refer to inter-industry wage differentials while we are interested in within municipality
inequality. Third, we only have information on tariff barriers but we have no information on
non-trade barriers (import licenses and quotas) or FDI, that often are claimed to be important
determinants of wage inequality in Mexico.15
Finally, since the ENEU data are not available
until the second half of the 1980s, when the first liberalization episode occurred, we are
missing in our analysis the large opening of the Mexican economy that others have suggested
15
Our attempts to recover information on import licenses over the period of observation have been unsuccessful.
Potentially reassuringly, Goldberg and Pavcnik (2007) claim that trade and non trade barrier reforms are
generally used as complements as opposed to substitutes, implying that these two variables varied similarly.

31
led to a massive increase in inequality (Revenga, 1997; Hanson and Harrison 1999;
Robertson, 2004).
Figure 11 reports the trend in average import tariffs over the period of observation.
These figures are obtained from ad valorem tariffs by 4-digit industries as reported in the
Diario Official de la Federacion (various issues) and used in Aleman-Castilla (2006).16
These data only refer to tariffs for trade with the US. The figure reports the employment
weighted average tariff with weights given by the employment share of each 4-digit industry.
We use the time-average of these shares in order to abstract from compositional effects. We
report two series. The first is the average tariff across all tradable sectors. The second also
includes non tradable sectors, with tariffs set equal to zero for these sectors. In either case, the
two series convey the same message: tariffs remained unchanged between 1989 and 1993. In
1994, following the signing of NAFTA, tariffs fell abruptly, after which some further
reduction took place. Tariff reduction was not uniform across industries. Aleman-Castilla
(2006) reports that the Textiles and Food, Beverages, and Tobacco industries experienced the
largest reductions while Machinery and Equipment the lowest. This is potentiality useful for
our analysis since municipalities with different industrial structures were potentially
differentially exposed to trade liberalization.
In order to ascertain the role played by tariff reduction in shaping the trend in the
wage structure over the period of observation, we have computed for each municipality an
employment weighted average tariff. Similarly to the series in Figure 11, we use the
industrial employment structure (by municipality, in this case) to compute the average tariff
by municipality. Again, to avoid potential confounding compositional effects and to enhance
16
We have compared our import tariffs for trade with the US with data on average import tariffs (irrespective of
the origin country) for the period 1988 to 1995. This last series was kindly provided to us by Raymond
Robertson. The two series are remarkably similar up to 1993, after which we see a fall in import tariffs from the
US but not from other countries. This is the result of Mexico signing NAFTA.

32
the precision of the estimates, we use the average industrial structure across the thirteen years
of observation to weight the tariff data.
Table 6 reports regressions of within municipality inequality on average tariffs by
municipality. We use the average level of tariffs including non tradable sectors as a
regressor.17
Similarly to the bottom panel of Table 2, we report regressions with municipality
fixed effects in addition to year fixed effects, and again we pool men and women. Notice that
because tariffs stayed unchanged between 1989 and 1993, they cannot explain the
pronounced rise in inequality observed over the early years. Regressions results reported in
the top panel show that municipalities that experienced larger tariffs reductions also happened
to experience a smaller increase in inequality. The regression coefficient for the differential
between the bottom and sixth decile in column 1 is -0.042, implying that a reduction in tariffs
of 8 p.p. - that is the gap between the highest and the lowest change in tariffs across the
municipalities in the sample - is responsible for an increase in the tenth to sixth decile gap of
about 30 p.p. over the period of observation. This is a sizeable and precisely estimated effect.
The estimated effect of tariffs increases monotonically at each decile. For example, the effect
of a 1 p.p. reduction in average ad valorem tariffs on the differential between the top and the
sixth decile in column (8) is estimated to be in the order of 0.031. Overall, and contrary to the
widespread evidence that trade liberalization led to a rise in inequality in Mexico as
elsewhere in Latin America (see Goldberg and Pavcnik, 2007 for a very careful review of the
studies in this area), the regression estimates in this table suggest that the opposite happened
in Mexico over the second half of the 1990s. This result is remarkably consistent with
Robertson (2004), who finds that - different from the first episode of trade liberalization in
the mid 1980s - NAFTA led to a fall in the relative price of skill-intensive goods with an
ensuing fall in the skilled to unskilled wage gap. The estimated trend in latent inequality is
17
Results that include average tariffs by municipality for traded sectors only lead to different conclusions on the
effect of trade on inequality. Coefficients are consistently small and statistically insignificant. The estimated
effect of the minimum wage though is unaffected.

33
reported in the top row of the table. It appears that the ninth to first decile gap would have
risen by about 5.8 p.p. a year (0.027+0.031) in the absence of trade liberalization. This
compares to an actual change, in Table 2, of about 3.5 p.p. a year.
The bottom part of Table 6 reports regressions that control jointly for the minimum
wage and tariffs. Results on tariffs are similar to those found at the top of the table (where the
minimum wage is not included). It appears that the effect of a 1 p.p. reduction in average ad
valorem tariffs is responsible for a fall in the ninth to first decile gap of about 0.062 p.p. a
year. This compares with an estimate at the top of the table of 0.073 p.p. Perhaps more
remarkable is the observation that the coefficient on the minimum wage remains essentially
unaltered after the inclusion of explicit controls for tariffs. For example, the coefficient for
the bottom decile in column (1) is 0.587. This compares to an estimated effect when tariffs
are excluded of 0.604 (Table 2, column 2, bottom panel). Regression estimates in Table 6
overwhelmingly suggest that the estimated impact of the minimum wage cannot be ascribed
to the omission of trade variables. When both minimum wages and tariffs are included, the
estimated increase in the latent ninth to first decile gap is in the order of 3.9 p.p. a year.
In brief, omission of explicit controls for trade reforms does not appear to affect the
main conclusion of the paper, i.e. that the minimum wage is responsible for a significant
share of the increase in inequality in Mexico over the 1990s, especially at the bottom of the
distribution.
5. Discussion and Conclusions
In this paper we use household micro data to analyze the contribution of the decline in the
real value of the minimum wage to the well-documented rise in earnings inequality in Mexico

34
between the late 1980s and the early 2000s. Consistent with findings elsewhere in the
literature, we show that wages of a large proportion of Mexican workers are indexed to the
minimum wage: the impact of the minimum wage in Mexico propagates to at least the
median of the earnings distribution. This effect is increasingly less important at higher deciles
and disappears for deciles above the sixth. Contrary to what we read as a widespread
perception that the minimum wage is de facto a non important redistributive feature of the
labor market in Mexico - as in other less developed economies -, we show that the decline in
the real value of the minimum wage is able to explain most - if not all - of the rise in urban
inequality at the bottom of the earnings distribution that is observed between the late 1980s
and the late 1990s. A temporary increase in the real value of the minimum wage in the mid
1990s - corresponding to the signing of NAFTA - appears to have no effect on the earnings
distribution: by then the minimum wage was already too low in real terms to have any effect
on the wages of low paid workers.
Our results are extremely robust, and they hold even when we condition on
municipality-specific linear time trends and for unrestricted State-specific time effects. IV
estimates that attempt to control for potential division bias in the OLS estimates also lead to
remarkably similar results. We find a qualitatively similar effect for men and women,
although, the effect is stronger for the latter group, consistent with the observation that
women earn on average lower salaries. We finally account explicitly for trade-induced
changes in the labor market, by computing an index of trade openness by municipality that is
an employment weighted average of import tariffs. The signing of NAFTA in 1994 led to a
massive reduction in import tariffs from the US. The estimated effect of the minimum wage
on the wage distribution is essentially unaltered by explicit controls for tariffs. As an aside
finding, our regressions show that NAFTA led to a compression in wage inequality. This is
contrary to most of the existing evidence on the effect of trade liberalization on earnings

35
inequality (see Goldberg and Pavcnik, 2007) but consistent with what was found by others
for post NAFTA Mexico (Robertson, 2004; see also Goldberg and Pavcnik, 2007).
Our finding that the minimum wage explains a significant share of the increase in
inequality observed in Mexico over the late 1980 to late 1990s is surprisingly consistent with
what others argue has happened in the US. Although not undisputed (Autor et al., 2007), a
recent body of research (DiNardo and Card, 2002; Lemieux, 2006), building on the work of
Lee (1999), emphasizes the role played by the minimum wage in shaping inequality in the
US. These papers show a very clear time series correlation between trends in total and within
wage inequality and the real bite of the minimum wage. This correlation is particularly
evident in the 1980s, when the real value of the minimum wage declined, while inequality
rose substantially. After that, no clear time trend is appreciable in either series, so that these
authors conclude that the rise in inequality in the 1980s was largely an "episodic
phenomenon" potentially linked to the erosion of the real value of the minimum wage (Card
and DiNardo, 2002).
Once we account for changes in the minimum wage, we still find evidence that
inequality at the top of the distribution would have risen, leaving space for other explanations
linked to trade, FDI, outsourcing or even skill-biased technological change. Unfortunately we
have no data to test directly the effect of these forces. Others before us though have
documented convincingly the contribution of these factors over the late 1980s-mid 1990s.
Our results do not necessarily dispute these findings but intend to complement them. Again,
our finding is not dissimilar to what others suggest has happened in the US, where other
forces – such as falling unionization and the reallocation of labor induced by the 1982
recession, have likely contributed to increasing inequality, especially at the top of the
distribution (DiNardo and Card, 2002; Lemieux, 2006).

36
The monotonic decline in the real value of the minimum wage over the thirteen years
of analysis is also obviously unable to account for the reversion in inequality that is observed
at the top of the earnings distribution starting in 1997. Again, others before us have noted
this, although the interpretations vary as to what might have produced it. In the paper we
remain agnostic as to which of these explanations - if any - is relatively more important.
In the paper we report separate analyses for formal and informal wage workers, where
the latter are defined as those not contributing to social security in their job. Informal workers
account for around one fourth of salaried employment in Mexico. While we report separate
results for the two groups primarily for consistency with previous analyses, we are aware that
this approach lends its flank to potential criticism. To the extent that minimum wages create
an incentive for employers to move workers to the uncovered sector (for which the evidence
is admittedly weak), hence creating informality, these estimates are obviously affected by a
margin of endogenous selection. In this circumstance - and ignoring general equilibrium
effects - one might presumably expect that a minimum wage rise will increase inequality
among informal workers. This is because workers whose productivity is below the minimum
wage will all be informal and the marginal informal worker will hence be paid more than
existing informal workers. Contrary to this prediction, the minimum wage appears to
compress earnings of informal workers, and is able to explain the entire rise in earnings
inequality among these workers that is observed over the period of observation. Effectively,
although we find widespread non compliance among informal workers, with a significant
proportion of them earning less than the minimum wage, we also find that workers at the
bottom of the informal wage distribution still respond to minimum wage increases. Again,
this is consistent with the minimum wage acting as a nominal anchor for wages in Mexico, a
fact that is well known to be true in several Latin American countries and presumably the
inheritance of the periods of hyperinflation of the 1970s and 1980s. This is consistent with

37
the notion that minimum wages have the potential to affect the reservation wages of all
workers in the economy, whether covered by minimum wages or not (Falk et al., 2006;
Freeman, 2007).
Among formal workers, we find very clear compliance with the minimum wage:
effectively the minimum wage acts as a floor to the formal earnings distribution not
dissimilar to what found in the US.
Whether the estimated effect of the minimum wage on the informal wage distribution
is a genuinely direct effect or an effect mediated through labor supply and demand responses,
and hence whether one is willing to accept separate estimates for the two groups as being
truly "causal", it still remains true that the minimum wage appears to affect the entire
unconditional (i.e. formal plus informal workers’) distribution of wages in Mexico. Not only
does this finding reject a simplistic picture of the labor markets in less developed economies,
where widespread informality and poor compliance are often suspected of ‘undoing’ the
redistributive impact of labor market institutions, but it also provides a guidance on how
minimum wages might work elsewhere.
A recurrent problem with the finding that the minimum wage tends to compress the
wage distribution in more developed economies - where non compliance is certainly less of
an issue - is that the evidence that minimum wages create a support to the wage distribution
(i.e. wage censoring) cannot be observationally told apart from the circumstance that some
workers might lose their job in response to minimum wage rises (i.e. wage truncation). In this
literature, truncation is generally ruled out by assumption (see for example DiNardo et al.,
1996). Ultimately, with cross-sectional wage data, censoring cannot be separately identified
from truncation, since the market wages of those out of work cannot be observed.18
However,
if for many developed countries, there are good theoretical reasons - linked to the existence of
18
Additionally, it is well known that direct evidence on the dis-employment effect of the minimum wage is at
the very least controversial (Card and Kruger, 1994; Neumark and Wascher, 1992).

38
social insurance systems (e.g. unemployment insurance) - to believe that low productivity
workers might afford to remain unemployed as a result of minimum wage increases, this is
not the case in many poorer countries, where de facto formal welfare is not existent and work
- perhaps casual, unprotected and often informal - is the only way to meet ends. In Mexico,
for example, unemployment has traditionally been very low: except during the severe
financial crisis of the mid 1990s, the unemployment rate has been in the order of 2-2.5 p.p.
Unemployment apparently is not a viable option for Mexican workers. From the perspective
of a researcher, this means that one can effectively measure market wages of those who are
not in formal employment. By showing that wages of all workers (formal plus informal)
bunch at the minimum wage, our paper tends to reject a simple model of wage truncation in
the face of minimum wages, and adds some additional evidence in favor of modest dis-
employment effects of the minimum wage.
Although, admittedly, our paper does not innovate on methodology, largely using a
strategy devised by Lee (1999), from a substantive point of view our finding seems to suggest
that the emphasis on the role of trade in shaping trends in the wage structure in developing
countries might have been exaggerated, and that more research is needed to understand the
role of labor market institutions in countries other that the USA.
In closing, at least two caveats that apply to our conclusions are worth mentioning.
First, we have treated the real bite of the minimum wage as an exogenous variable. Perhaps,
though, the Mexican government let the minimum wage deteriorate - by simply leaving its
nominal value unchanged in the face of inflation - for fear that this might impede
readjustment in the face of macroeconomic shocks, or because of increasing pressure towards
inequality in market wages. As noted by Freeman (2007), the fact that many less developed
countries experienced a deterioration in the real bite of the minimum wage in the 1990s is

39
possibly not a mere accident. The link between labor market institutions and market forces -
especially in developing countries - is far from being fully understood.
A second caveat to our conclusions is that our analysis refers only to urban workers
hence ignoring the potential general equilibrium effects that arise in a Harris-Todaro model
when a rural uncovered sector is present. Understanding the functioning of minimum wages
in an economy with a rural sector and mobility of labor, as is the case of Mexico, is next on
the agenda.

Table 1
Actual trends in inequality
Males plus females, 1989-2001
(1) (2) (3) (4) (5) (6) (7) (8)
Percentile
10 20 30 40 50 70 80 90
Without municipality
fixed effects
Actual trend -0.019*** -0.013*** -0.010*** -0.007*** -0.003*** 0.006*** 0.012*** 0.016***
(0.004) (0.003) (0.002) (0.001) (0.001) (0.001) (0.002) (0.003)
R-squared 0.68 0.71 0.76 0.77 0.64 0.77 0.81 0.72
With municipality
fixed effects
Actual trend -0.020*** -0.014*** -0.011*** -0.007*** -0.003*** 0.006*** 0.013*** 0.016***
(0.004) (0.003) (0.002) (0.001) (0.001) (0.001) (0.002) (0.003)
R-squared 0.71 0.74 0.77 0.79 0.65 0.78 0.85 0.76
Notes: The table reports the estimated trend in each decile relative to the sixth decile of the log wage distribution by
municipality and year. The top and bottom panels report results without and with municipality fixed effects respectively.
Coefficients on trend are obtained in two steps. First, log differentials are regressed on year dummies. Second, coefficients on
year dummies are regressed on a linear trend with weights equal to the reciprocal of the standard error of each coefficient.
Standard errors (in brackets) in this second regression are clustered by year. ***: significant at 1%, ** significant at 5%, *:
significant at 10%. Number of observations: 819.

Table 2
Latent trends in inequality and the effect of the minimum wage
Males plus females, 1989-2001
(1) (2) (3) (4) (5) (6) (7) (8)
Percentile
10 20 30 40 50 70 80 90
Without municipality
fixed effects
Latent trend -0.007 -0.001 -0.000 0.000 0.000 0.003** 0.007** 0.010**
(0.004) (0.003) (0.002) (0.002) (0.001) (0.001) (0.002) (0.004)
MW 0.385** 0.350*** 0.287*** 0.215*** 0.109*** -0.088** -0.182* -0.288*
(0.163) (0.109) (0.070) (0.059) (0.033) (0.038) (0.095) (0.155)
R-squared 0.71 0.74 0.77 0.79 0.65 0.78 0.85 0.76
With municipality
fixed effects
Latent trend 0.001 0.003 0.003 0.003 0.002* 0.004*** 0.011*** 0.017***
(0.004) (0.003) (0.003) (0.002) (0.001) (0.001) (0.002) (0.003)
MW 0.604*** 0.485*** 0.388*** 0.293*** 0.174*** -0.023 -0.029 0.007
(0.080) (0.049) (0.034) (0.036) (0.015) (0.033) (0.065) (0.116)
R-squared 0.73 0.71 0.64 0.55 0.35 0.32 0.52 0.62
Notes: The table reports the estimated effect of minimum wages and the estimated residual (i.e. latent) trend in each decile
relative to the sixth decile (equations 3 and 3' in the text) of the log wage distribution by municipality and time. Standard
errors on the MW variable are clustered by state. Standard errors on linear trend are obtained in two steps and are clustered by
year. The top and bottom panels report results without and with municipality fixed effects respectively. See also notes to Table
1.

Table 3
Robustness checks
Males plus females, 1989-2001
(1) (2) (3) (4) (5) (6) (7) (8)
Percentile
10 20 30 40 50 70 80 90
With municipality
fixed effects
Weighted by number of
observations
Latent trend 0.000 0.003 0.003 0.002 0.001 0.006*** 0.014*** 0.017***
(0.004) (0.003) (0.002) (0.002) (0.001) (0.001) (0.002) (0.004)
MW 0.509*** 0.400*** 0.297*** 0.213*** 0.128*** 0.035 0.095 0.061
(0.083) (0.060) (0.053) (0.039) (0.033) (0.035) (0.068) (0.093)
R-squared 0.81 0.78 0.69 0.62 0.40 0.44 0.64 0.72
With municipality
fixed effects - IV estimates
Latent trend -0.002 0.001 0.001 0.003 0.002 0.007*** 0.012*** 0.019***
(0.004) (0.003) (0.002) (0.002) (0.001) (0.001) (0.002) (0.003)
MW 0.528*** 0.420*** 0.319*** 0.294*** 0.151*** 0.048 -0.001 0.065
(0.085) (0.063) (0.041) (0.028) (0.022) (0.056) (0.119) (0.174)
R-squared 0.73 0.70 0.63 0.55 0.35 0.31 0.52 0.62
With municipality
fixed effects and
state X year dummies
MW 0.659*** 0.531*** 0.429*** 0.337*** 0.198*** -0.020 -0.025 0.018
(0.086) (0.049) (0.031) (0.057) (0.030) (0.037) (0.070) (0.133)
R-squared 0.83 0.80 0.75 0.66 0.48 0.45 0.63 0.69
With municipality
fixed effects,
state X year dummies
and municipality trends
MW 0.691*** 0.571*** 0.471*** 0.375*** 0.231*** -0.004 -0.019 -0.005
(0.091) (0.063) (0.036) (0.047) (0.032) (0.034) (0.071) (0.184)
R-squared 0.86 0.84 0.80 0.73 0.55 0.51 0.69 0.72

Notes: The table reports similar regressions to those in the bottom panel of Table 2. Regressions in the top panel are weighted
by number of observations. Results in the second panel report unweighted IV regressions where the real bite of the minimum wage
(the log minimum wage minus the sixth decile of the log wage distribution) is instrumented by the real bite of the minimum wage
computed using lagged wages (the log of the contemporary minimum wage minus the sixth decile of the log wage distribution lagged
one year). The regressions in the third panel are again unweighted and include additionally the interaction of year dummies with
state dummies. Regressions in the bottom panel further include the interaction of municipality dummies with a linear trend. See
also notes to Table 1.
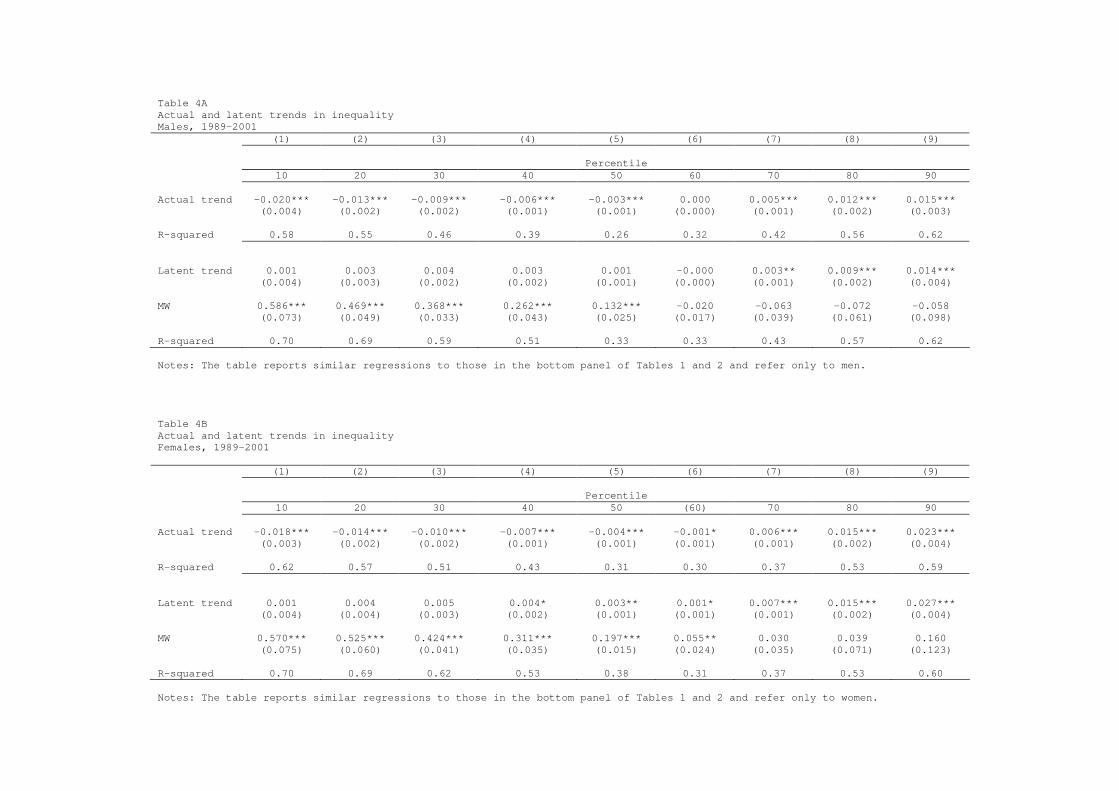
Table 4A
Actual and latent trends in inequality
Males, 1989-2001
(1) (2) (3) (4) (5) (6) (7) (8) (9)
Percentile
10 20 30 40 50 60 70 80 90
Actual trend -0.020*** -0.013*** -0.009*** -0.006*** -0.003*** 0.000 0.005*** 0.012*** 0.015***
(0.004) (0.002) (0.002) (0.001) (0.001) (0.000) (0.001) (0.002) (0.003)
R-squared 0.58 0.55 0.46 0.39 0.26 0.32 0.42 0.56 0.62
Latent trend 0.001 0.003 0.004 0.003 0.001 -0.000 0.003** 0.009*** 0.014***
(0.004) (0.003) (0.002) (0.002) (0.001) (0.000) (0.001) (0.002) (0.004)
MW 0.586*** 0.469*** 0.368*** 0.262*** 0.132*** -0.020 -0.063 -0.072 -0.058
(0.073) (0.049) (0.033) (0.043) (0.025) (0.017) (0.039) (0.061) (0.098)
R-squared 0.70 0.69 0.59 0.51 0.33 0.33 0.43 0.57 0.62
Notes: The table reports similar regressions to those in the bottom panel of Tables 1 and 2 and refer only to men.
Table 4B
Actual and latent trends in inequality
Females, 1989-2001
(1) (2) (3) (4) (5) (6) (7) (8) (9)
Percentile
10 20 30 40 50 (60) 70 80 90
Actual trend -0.018*** -0.014*** -0.010*** -0.007*** -0.004*** -0.001* 0.006*** 0.015*** 0.023***
(0.003) (0.002) (0.002) (0.001) (0.001) (0.001) (0.001) (0.002) (0.004)
R-squared 0.62 0.57 0.51 0.43 0.31 0.30 0.37 0.53 0.59
Latent trend 0.001 0.004 0.005 0.004* 0.003** 0.001* 0.007*** 0.015*** 0.027***
(0.004) (0.004) (0.003) (0.002) (0.001) (0.001) (0.001) (0.002) (0.004)
MW 0.570*** 0.525*** 0.424*** 0.311*** 0.197*** 0.055** 0.030 0.039 0.160
(0.075) (0.060) (0.041) (0.035) (0.015) (0.024) (0.035) (0.071) (0.123)
R-squared 0.70 0.69 0.62 0.53 0.38 0.31 0.37 0.53 0.60
Notes: The table reports similar regressions to those in the bottom panel of Tables 1 and 2 and refer only to women.

Table 5A
Males plus females, 1989-2001
Formal workers only
(1) (2) (3) (4) (5) (6) (7) (9) (9)
Percentile
10 20 30 40 50 60 70 80 90
Actual trend -0.010*** -0.005* -0.002 0.001 0.003*** 0.008*** 0.013*** 0.018*** 0.020***
(0.003) (0.003) (0.002) (0.001) (0.001) (0.001) (0.002) (0.003) (0.003)
R-squared 0.60 0.56 0.59 0.59 0.59 0.56 0.52 0.51 0.54
Latent trend 0.014*** 0.014*** 0.012*** 0.014*** 0.014*** 0.017*** 0.021*** 0.026*** 0.029***
(0.002) (0.002) (0.001) (0.001) (0.001) (0.002) (0.003) (0.004) (0.004)
MW 0.721*** 0.559*** 0.420*** 0.370*** 0.298*** 0.254** 0.232 0.254 0.256
(0.081) (0.071) (0.059) (0.082) (0.096) (0.114) (0.156) (0.176) (0.157)
R-squared 0.76 0.69 0.69 0.68 0.65 0.60 0.55 0.53 0.55
Notes: The table reports similar regressions to those in the bottom panel of Tables 1 and 2 and refer only to formal workers.
Table 5B
Males plus females, 1989-2001
Informal workers only
(1) (2) (3) (4) (5) (6) (7) (8) (9)
Percentile
10 20 30 40 50 60 70 80 90
Actual trend -0.020*** -0.021*** -0.019*** -0.017*** -0.015*** -0.012*** -0.010*** -0.007* -0.002
(0.004) (0.003) (0.003) (0.002) (0.003) (0.003) (0.003) (0.003) (0.004)
R-squared 0.54 0.64 0.63 0.65 0.64 0.64 0.66 0.66 0.57
Latent trend 0.003 0.002 0.004 0.003 0.004 0.003 -0.001 -0.001 0.000
(0.007) (0.006) (0.005) (0.004) (0.005) (0.005) (0.005) (0.005) (0.004)
MW 0.739*** 0.706*** 0.689*** 0.601*** 0.556*** 0.491*** 0.328*** 0.241*** 0.140
(0.074) (0.070) (0.065) (0.046) (0.045) (0.057) (0.055) (0.067) (0.143)
R-squared 0.61 0.74 0.75 0.76 0.74 0.71 0.68 0.67 0.58
Notes: The table reports similar regressions to those in the bottom panel of Tables 1 and 2 and refer only to informal workers.

Table 6
Actual and latent trends in inequality - controlling for import tariffs
Males plus females, 1989-2001
(1) (2) (3) (4) (5) (6) (7) (8)
Percentile
10 20 30 40 50 70 80 90
latent trend -0.031*** -0.023*** -0.018*** -0.015*** -0.006*** 0.010*** 0.021*** 0.027***
(0.007) (0.005) (0.003) (0.002) (0.001) (0.001) (0.003) (0.005)
Tariffs -0.042*** -0.033*** -0.027** -0.022*** -0.010*** 0.014** 0.027*** 0.031*
(0.013) (0.011) (0.009) (0.006) (0.002) (0.005) (0.009) (0.014)
R-squared 0.63 0.59 0.52 0.44 0.26 0.34 0.53 0.62
Latent trend -0.013** -0.009** -0.007** -0.007** -0.001 0.009*** 0.020*** 0.026***
(0.005) (0.004) (0.003) (0.003) (0.002) (0.001) (0.003) (0.004)
MW 0.587*** 0.472*** 0.377*** 0.284*** 0.171*** -0.015 -0.014 0.024
(0.075) (0.041) (0.028) (0.028) (0.014) (0.028) (0.055) (0.098)
Tariffs -0.031*** -0.024*** -0.019*** -0.017*** -0.006 0.014** 0.027*** 0.031**
(0.008) (0.008) (0.006) (0.004) (0.004) (0.005) (0.009) (0.014)
819 819 819 819 819 819 819 819
R-squared 0.74 0.71 0.65 0.56 0.35 0.34 0.53 0.62
Notes: The top panel reports regressions similar to those in the bottom panel of Table 1 with additional controls for the average
level of import tariffs by municipality. The bottom panel reports regressions similar to those in the bottom panel of Table 2
with additional controls for the average level of import tariffs by municipality.

Figure 1. Actual and latent trends in inequality and the effect of Minimum wages
Actual
-.5
-.2
50
.25
.5
1989 1992 1995 1998 2001year
10 30
70 90
MW
MW effect
-.25
0.2
5.5
1989 1992 1995 1998 2001year
10 30
70 90
Latent
-.2
50
.25
.5
1989 1992 1995 1998 2001year
10 30
70 90
Notes: The top panel depicts the evolution of the gap between different deciles of the log wage
distribution and the median. An additional line reports the differential between the log minimum wage
and the median. The middle panel figure depicts the estimated effect of the minimum wage and the bottom
panel depicts the estimated trend at each decile conditional on the minimum wage. Results refer to
regression in Table 2, bottom panel. All series are standardized to their values in 1989. Source: ENEU.

Figure 2: Changes in inequality and the Minimum Wage - Mexico 1989-2001
Notes: The figure depicts the distribution of earnings between two years (1989 and 1995 and 1995 and
2001 respectively). A vertical line refers to the level of minimum wages in the two years. Separate
graphs refer to different areas, each one corresponding a different level of the minimum wage. Source:
ENEU.
0
.3
.6
.9
1.2
-1.5 -1 -.5 0 .5 1 1.5Log(Wage)-Log(Median)
1989 1995
Zone A: 1989 vs. 1995
MW 1995
MW 1989
0
.3
.6
.9
1.2
-1.5 -1 -.5 0 .5 1 1.5Log(Wage)-Log(Median)
1989 1995
Zone B: 1989 vs. 1995
MW 1989
MW 1995
0
.3
.6
.9
1.2
-1.5 -1 -.5 0 .5 1 1.5Log(Wage)-Log(Median)
1989 1995
Zone C: 1989 vs. 1995
MW 1989
MW 1995
0
.3
.6
.9
1.2
-1.5 -1 -.5 0 .5 1 1.5Log(Wage)-Log(Median)
1995 2001
Zone A: 1995 vs. 2001
MW 1995
MW 2001
0
.3
.6
.9
1.2
-1.5 -1 -.5 0 .5 1 1.5Log(Wage)-Log(Median)
1995 2001
Zone B: 1995 vs. 2001
MW 1995
MW 2001
0
.3
.6
.9
1.2
-1.5 -1 -.5 0 .5 1 1.5Log(Wage)-Log(Median)
1995 2001
Zone C: 1995 vs. 2001
MW 1995
MW 2001

Figure 3. Inequality and the minimum wage by municipality
-2-1
.5-1
-.5
0.5
11
.52
-1.75 -1.5 -1.25 -1 -.75 -.5 -.25 0MW-60
MW-60 10-60
90-60
1990
-2-1
.5-1
-.5
0.5
11
.52
-1.75 -1.5 -1.25 -1 -.75 -.5 -.25 0MW-60
MW-60 10-60
90-60
2001
Notes: the figure depicts the 10th and 90
th percentile of the log wage distribution by municipality and
year over the log minimum wage. All series are standardized to the 60th percentile of the log wage
distribution by municipality and year. The solid line is a 45 degree line.
Figure 4. Changes in inequality and the minimum wage by municipality
-2-1
.5-1
-.5
0.5
11
.52
-.75 -.5 -.25 0 .25 .5MW-60
MW-60 10-60
10-60
-2-1
.5-1
-.5
0.5
11
.52
-.75 -.5 -.25 0 .25 .5MW-60
MW-60 90-60
90-60
Notes: the left hand side panel plots on the vertical axis the residual from a regression of the 10-60
percentile gap of the log wage distribution by municipality and year on year and municipality dummies.
The horizontal axis reports the residual of a similarly specified regression where the dependent
variable is the log minimum wage minus the 60th percentile of the log wage distribution. The solid line
is a 45 degree line. The right hand panel reports the same picture for the 90-60th percentile gap.

Figure 5. Formal and informal wage distribution: 1989 - Area B
0.3
.6.9
1.2
-1.5 -1 -.5 0 .5 1 1.5Log(Wage)-Log(Median)
Formal Informal
Zone B: Formal and Informal wages
Notes: The Figure reports kernel density estimates of the log wage distribution separately for formal
and informal workers in zone B in 1989. The vertical line refers to the minimum wage.

Figure 6. Inequality and the minimum wage by municipality
Formal workers only
-2-1
.5-1
-.5
0.5
11
.52
-1.75 -1.5 -1.25 -1 -.75 -.5 -.25 0MW-60
MW-60 10-60
90-60
1990
-2-1
.5-1
-.5
0.5
11
.52
-1.75 -1.5 -1.25 -1 -.75 -.5 -.25 0MW-60
MW-60 10-60
90-60
2001
Notes: see notes to Figure 3.
Figure 7. Changes in inequality and the minimum wage by municipality
Formal workers only
-2-1
.5-1
-.5
0.5
11
.52
-.75 -.5 -.25 0 .25 .5MW-60
MW-60 10-60
10-60
-2-1
.5-1
-.5
0.5
11
.52
-.75 -.5 -.25 0 .25 .5MW-60
MW-60 90-60
90-60
Notes: see notes to Figure 4.

Figure 8. Inequality and the minimum wage by municipality
Informal workers only
-2-1
.5-1
-.5
0.5
11
.52
-1.75 -1.5 -1.25 -1 -.75 -.5 -.25 0MW-60
MW-60 10-60
90-60
1990
-2-1
.5-1
-.5
0.5
11
.52
-1.75 -1.5 -1.25 -1 -.75 -.5 -.25 0MW-60
MW-60 10-60
90-60
2001
Notes: see notes to Figure 3.
Figure 9. Changes in inequality and the minimum wage by municipality
Informal workers only
-2-1
.5-1
-.5
0.5
11
.52
-.75 -.5 -.25 0 .25 .5MW-60
MW-60 10-60
10-60
-2-1
.5-1
-.5
0.5
11
.52
-.75 -.5 -.25 0 .25 .5MW-60
MW-60 90-60
90-60
Notes: see notes to Figure 4.

Figure 10. Actual and latent trends in inequality and the effect of Minimum wages separately for formal
and informal workers
Formal workers Informal workers
Actual
-.25
0.2
5.5
1989 1992 1995 1998 2001year
10 30
70 90
-.25
0.2
5.5
1989 1992 1995 1998 2001year
10 30
70 90
MW effect
-.25
0.2
5.5
1989 1992 1995 1998 2001year
10 30
70 90
-.25
0.2
5.5
1989 1992 1995 1998 2001year
10 30
70 90
Latent
-.25
0.2
5.5
1989 1992 1995 1998 2001year
10 30
70 90
-.25
0.2
5.5
1989 1992 1995 1998 2001year
10 30
70 90
Notes: see notes to Figure 5.

Figure 11. Trends in import tariffs - Mexico
Notes. The graph reports the employment weighted average of ad valorem import tariff from the US.
Employment weights are averages across the period of observation. Two series are reported: one that
refers only to tradable industries and another that includes non tradable industries with tariffs set
to zero. Source: Diario Official de la Federacion (various issues).
05
10
15
1989 1995 2001year
mean tariff - excl. NT mean tariff - incl. NT

Table A1
List of municipalities in the sample
Municipality State MW zone
Tijuana Baja California A
Torreón Coahuila C
Chihuahua Chihuahua C
Juárez Chihuahua A
Azcapotzalco Distrito Federal A
Coyoacán Distrito Federal A
Gustavo A. Madero Distrito Federal A
Iztacalco Distrito Federal A
Iztapalapa Distrito Federal A
Magdalena Contreras Distrito Federal A
Alvaro Obregón Distrito Federal A
Tláhuac Distrito Federal A
Tlalpan Distrito Federal A
Xochimilco Distrito Federal A
Benito Juárez Distrito Federal A
Cuauhtémoc Distrito Federal A
Miguel Hidalgo Distrito Federal A
Venustiano Carranza Distrito Federal A
Gómez Palacio Durango C
Lerdo Durango C
León Guanajuato C
San Francisco del Rincón Guanajuato C
Guadalajara Jalsico B
Tlaquepaque Jalisco B
Tonalá Jalisco B
Zapopan Jalisco B
Atizapán de Zaragoza Estado de Mexico A
Ecatepec de Morelos Estado de Mexico A
Naucalpan de Juárez Estado de Mexico A
Nezahualcóyotl Estado de Mexico C
Tlalnepantla de Baz Estado de Mexico A
Cuautitlán Izcalli Estado de Mexico A
Apodaca Nuevo Leon B
San Pedro Garza García Nuevo Leon B
General Escobedo Nuevo Leon B
Guadalupe Nuevo Leon B
Monterrey Nuevo Leon B
San Nicolás de los Garza Nuevo Leon B
Santa Catarina Nuevo Leon B
Amozoc Puebla C
Cuautlancingo Puebla C
Puebla Puebla C
San Andrés Cholula Puebla C
San Pedro Cholula Puebla C
San Luis Potosí San Luis Potosí C
Soledad de Graciano Sánchez San Luis Potosí C
Ciudad Madero Tamaulipas B
Matamoros Tamaulipas A
Nuevo Laredo Tamaulipas A
Tampico Tamaulipas B
San Pablo del Monte Tlaxcala C
Boca del Río Veracruz C
Camerino Z. Mendoza Veracruz C
Córdoba Veracruz C
Fortín Veracruz C
Ixtaczoquitlán Veracruz C
Nogales Veracruz C
Orizaba Veracruz C
Rafael Delgado Veracruz C
Río Blanco Veracruz C
Veracruz Veracruz C
Mérida Yucatan C
Progreso Yucatan C
Notes: the table reports the list of municipalities in the sample, with the State and the Minimum wage
area (A, B and C, with A being the highest minimum wage area and C being the lowest) they belong to.

References
Airola, J. and Juhn, C. (2005), "Wage Inequality in Post-Reform Mexico", IZA Discussion Paper, No.
1525, 2005.
Aleman-Castilla, Benjamin (2006), "The Effect of Trade Liberalization on Informality and Wages:
Evidence from Mexico", CEP Discussion Papers, No. 763, London School of Economics, December
2006.
Autor, D, Lawrence F. Katz, and Melissa S. Kearney (2007), Trends in U.S. Wage Inequality: Revising
the Revisionists, mimeo, Department of Economics, Harvard University, March 2007.
Behrman, J., Birdsall, N. and Székely, M. (2000), "Economic Reform and Wage Differentials in Latin
America", RES Working Paper Series, No. 435, Research Department, Inter American Development
Bank, October, 2000.
Bell, L. (1997), "The Impact of Minimum Wages in Mexico and Colombia", Journal of Labor
Economics, 15(3), 102-135, 1997.
Card, D. (1992), "Do Minimum Wages Reduce Employment? A Case Study of California, 1987-1989",
Industrial and Labor Relations Review, 46(1), 38-54, 1992.
Card, David and Alan B. Krueger. (1994),"Minimum Wages and Employment: A Case Study of the
Fast-Food Industry in New Jersey and Pennsylvania", American Economic Review, September, 84(4),
772-93, 1994.
Castellanos, S., García-Verdú, R. and Kaplan, D.S. (2004), "Nominal Wage Rigidities in Mexico:
Evidence from Social Security Records", Journal of Development Economics, Vol. 75, 2, 507-533,
2004.
Chiquiar, D. and Hanson, G. (2005), "International migration, self-selection, and the distribution of
wages: Evidence from Mexico and the United States", Journal of Political Economy, 113, 2, 239-81,
2005.
Cortez, W. W., (2001). What is Behind Increasing Wage Inequality in Mexico? World Development,
29 (11), 1905-1922, 2001.
Di Nardo J., and D. Card. (2002), "Skill Biased Technological Change and Rising Wage Inequality:
Some Problems and Puzzles”, Journal of Labor Economics, October 2002.
Di Nardo J., Fortin, N.M. and Lemieux, T. (1996), "Labor Market Institutions and the Distribution of
Wages, 1973-1992: A Semiparametric Approach", Econometrica, 64, 1001-1044, 1996.
Duval-Hernandez, R. (2006), Dynamics of Labor Market Earnings in Urban Mexico, 1987-2002",
Center for U.S.-Mexican Studies University of California, San Diego, 2006.
Esquivel, G. and Rodriguez-Lopez, J. A. (2003), "Technology, Trade, and Wage Inequality in Mexico
before and after NAFTA", Journal of Development Economics, 72, 543-65, 2003.

Fairris, D. (2003), "Unions and Wage Inequality in Mexico", Industrial and Labor Relations Review,
72 (3), 481-97, 2003.
Fairris, D., Popli, G. and Zepeda, E. (2005), Minimum wages and the wage structure in Mexico.
Mimeo, Department of Economics, UC Riverside, 2005.
Falk A, E. Fehr and C. Zehnder (2006), "Fairness Perceptions and Reservation Wages- The Behavioral
Effects of Minimum Wage Laws", Quarterly Journal of Economics, November 2006, Vol. 121, No. 4,
1347-1381.
Feenstra, R. C. and Hanson, G. H. (1997) "Foreign Investment, Outsourcing, and Relative Wages,
Evidence from Mexico’s Maquiladoras", Journal of International Economics, 42(3-4), 371-93 , 1997.
Feliciano, Z. M. (1998) "Does the Minimum Wage Affect Employment in Mexico," Eastern Economic
Journal, 24 (2), 165-180, 1998.
Freeman R. B. (2007), "Labor Regulations, Unions, and Social Protection in Developing Countries:
Market Distortions or Efficient Institutions", forthcoming, Handbook of Development Economics,
2007.
Goldberg P.N. and N. Pavcnik (2007) "Distributional Effects of Globalization in Developing
Countries", Journal of Economic Literature, March 2007, 45(1), pp. 39-82.
Hanson, G. (2004), "What Has Happened to Wages in Mexico since NAFTA?", in Toni Estevadeordal,
Dani Rodrick, Alan Taylor, Andres Velasco, eds., FTAA and Beyond: Prospects for Integration in the
Americas, Cambridge, Harvard University Press, 2004.
Hanson, G. (2005), Emigration, Remittances, and Labor-Force Participation in Mexico, Mimeo,
University of California, San Diego, 2005.
Hanson, G. and Harrison, A. (1999), "Trade Liberalization and Wage Inequality in Mexico", Industrial
and Labor Relations Review, 2(2), 271-288, 1999.
Hanson, G and Woodruff, C. (2003), Emigration and Educational Attainment in Mexico, Mimeo
University of California, San Diego, 2003.
Harris, J.R. and Todaro, M.P. (1970), "Migration, Unemployment and Development: A Two-Sector
Analysis", American Economic Review, 60(1), 126-142, 1970.
Harrison, A. and Hanson G. (1999), "Who Gains from Trade Reform? Some Reaming Puzzles",
Journal of Development Economics 59, 125-154, 1999.
Heckman, J. and Pagés, C. (2004), "Introduction to Law and Employment: Lessons from Latin
America and the Caribbean", in Law and Employment: Lessons from Latin America and the
Caribbean, J. Heckman and C. Pagés, (eds.), National Bureau of Economic Research University of
Chicago Press, Chicago, 2004.
Instituto Nacional de Estadística, Geografía e Informática (INEGI). Encuesta Nacional de Empleo
Urbano (ENEU) 1989-2001.

Katz L. F. and Autor, D. H. (1999) "Changes in the Wage Structure and Earnings Inequality", in O.
Ashenfelter and D. Card, (eds.), Handbook of Labor Economics, volume 3, North Holland, 1999.
Lee, D. (1999), ",Wage Inequality in the United States during the 1980s: Rising Dispersion or Falling
Minimum Wage?", Quarterly Journal of Economics, 114(3), 977-1023, 1999.
Lemieux, T. ,"Increasing Residual Wage Inequality: Composition Effects, Noisy Data, or Rising
Demand for Skill?", American Economic Review, 2006, 1- 64.
Lopez-de-Silanes, F. and R. La Porta (1999), "The Benefits of Privatization: Evidence from Mexico",
Quarterly Journal of Economics, CXIV , 1999, 1193-1242.
Mishra, P. (2007), "Emigration and Wages in Source Countries: Evidence from Mexico", Journal of
Development Economics, 82(1), 180-99, 2007.
Maloney, W.F. and Nunez, J. (2004), "Measuring the Impact of Minimum Wages, Evidence from Latin
America", In Pagés, C. and Heckman, J.J. (eds.), Law and Employment: Lessons from Latin America
and the Caribbean, National Bureau of Economic Research and University of Chicago Press, Chicago,
IL, 2006.
Mincer, J. (1976), "Unemployment Effects of Minimum Wages", Journal of Political Economy, 84, 87-
104.
Neumark, David and William Wascher, 1992, "Evidence on Employment Effects of Minimum and
Subminimum Wage: Panel Data on State Minimum Laws", Industrial and Labor Relations Review, pp.
55-81, 1992.
Popli, G. (2005), "Rising Wage Inequality in Mexico: Structural Reforms or Changing Labor Market
Institutions?", University of Sheffield Economic Research Paper, 2005.
Revenga, A. (1997), "Employment and Wage Effects of Trade Liberalization: The Case of Mexican
Manufacturing", Journal of Labor Economics,153 (2), S20-S43.
Roberston, R. (2004), "Relative prices and wage inequality: evidence from Mexico", Journal of
International Economics, 64(2), 387-409, 2004.
Verhoogen, E. (2007), "Trade, Quality Upgrading and Wage Inequality in the Mexican Manufacturing
Sector", forthcoming, Quarterly Journal of Economics.

CENTRE FOR ECONOMIC PERFORMANCE Recent Discussion Papers
879 Alejandro Cuñat Christian Fons-Rosen
Relative Factor Endowments and International Portfolio Choice
878 Marco Manacorda The Cost of Grade Retention
877 Ralph Ossa A ‘New Trade’ Theory of GATT/WTO Negotiations
876 Monique Ebell Albrecht Ritschl
Real Origins of the Great Depression: Monopoly Power, Unions and the American Business Cycle in the 1920s
875 Jang Ping Thia Evolution of Locations, Specialisation and Factor Returns with Two Distinct Waves of Globalisation
874 Monique Ebell Christian Haefke
Product Market Deregulation and the U.S. Employment Miracle
873 Monique Ebell Resurrecting the Participation Margin
872 Giovanni Olivei Silvana Tenreyro
Wage Setting Patterns and Monetary Policy: International Evidence
871 Bernardo Guimaraes Vulnerability of Currency Pegs: Evidence from Brazil
870 Nikolaus Wolf Was Germany Ever United? Evidence from Intra- and International Trade 1885 - 1993
869 L. Rachel Ngai Roberto M. Samaniego
Mapping Prices into Productivity in Multisector Growth Models
868 Antoni Estevadeordal Caroline Freund Emanuel Ornelas
Does Regionalism Affect Trade Liberalization towards Non-Members?
867 Alex Bryson Harald Dale-Olsen
A Tale of Two Countries: Unions, Closures and Growth in Britain and Norway
866 Arunish Chawla Multinational Firms, Monopolistic Competition and Foreign Investment Uncertainty
865 Niko Matouschek Paolo Ramezzana Frédéric Robert-Nicoud
Labor Market Reforms, Job Instability, and the Flexibility of the Employment Relationship
864 David G. Blanchflower Alex Bryson
Union Decline in Britain

863 Francesco Giavazzi Michael McMahon
Policy Uncertainty and Precautionary Savings
862 Stephen Hansen Michael F. McMahon
Delayed Doves: MPC Voting Behaviour of Externals
861 Alex Bryson Satu Nurmi
Private Sector Employment Growth, 1998-2004: A Panel Analysis of British Workplaces
860 Alejandro Cuñat Szabolks Deak Marco Maffezzoli
Tax Cuts in Open Economies
859 Bernd Fitzenberger Karsten Kohn Alexander Lembcke
Union Density and Varieties of Coverage: The Anatomy of Union Wage Effects in Germany
858 Dimitra Petropoulou International Trade, Minimum Quality Standards and the Prisoners’ Dilemma
857 Andreas Georgiadis Efficiency Wages and the Economic Effects of the Minimum Wage: Evidence from a Low-Wage Labour Market
856 L. Rachel Ngai Christopher A. Pissarides
Employment Outcomes in the Welfare State
855 Carlo Rosa Talking Less and Moving the Market More: Is this the Recipe for Monetary Policy Effectiveness? Evidence from the ECB and the Fed
854 Dimitra Petropoulou Competing for Contacts: Network Competition, Trade Intermediation and Fragmented Duopoly
853 Barbara Petrongolo Christopher A Pissarides
The Ins and Outs of European Unemployment
852 Mirko Draca Steve Machin Robert Witt
Panic on the Streets of London: Police, Crime and the July 2005 Terror Attacks
851 Augustin de Coulon Jonathan Wadsworth
On the Relative Gains to Immigration: A Comparison of the Labour Market Position of Indians in the USA, the UK and India
850 Andreas Georgiadis HRM Practices and Knowledge Processes Outcomes: Empirical Evidence from a Quasi-Experiment on UK SMEs in the Tourism Hospitality and Leisure Sector
The Centre for Economic Performance Publications Unit Tel 020 7955 7673 Fax 020 7955 7595 Email [email protected]
Web site http://cep.lse.ac.uk