Minimum Wage Impact Study Report - Washington, D.C.
50
A November 2017
Transcript of Minimum Wage Impact Study Report - Washington, D.C.

A
November 2017

Minimum Wage Economic Impact Study
II
SUBMITTED TO
District of Columbia GovernmentDepartment of Employment Services
Office of Wage and Hour4058 Minnesota Avenue NE, Suite 3600
Washington, D.C. 20019
Project Officer: Michael I. Watts, Jr.
SUBMITTED BY
IMPAQ International, LLC
10420 Little Patuxent Parkway, Suite 300
Columbia, MD 21044
Project Director: Ye Zhang
AUTHORSMason Miller
Paula Mian
Ye Zhang
The findings, interpretations, and conclusions expressed herein are entirely those of the authors.
They do not necessarily represent the views of IMPAQ International, LLC or the
Department of Employment Services of the District of Columbia.

III
November 2017
Table of ContentsTable of Contents iii
Table of Exhibits iv
Acronym List v
Executive Summary 1
Introduction 4
1.1 Background 5
2. Objectives and Research Questions 7
2.1 Objectives 7
2.2 Research Questions 7
3. Methodology 9
3.1 Data Sources 9
3.2 Operationalized Definitions 10
4. Study Findings 12
4.1 Addressing The Research Questions 12
4.2 Additional Characteristics Of The Target Population 25
4.3 Estimating Noncompliance 38
5. Conclusion 43
6. Appendix A – Minimum Wage Rates across U.S. States and Jurisdictions 44

Minimum Wage Economic Impact Study
IV
Table of Exhibits Exhibit 1: Research Questions, Data Sources, and Answers 2Exhibit 2: Research Questions 8Exhibit 3: Research Questions and Answers 12Exhibit 4: Wage Category Breakdown of D.C. Workforce 14Exhibit 5: Average hourly wage of D.C. workforce by Industry 15Exhibit 6: Exempt v. Nonexempt Workers, D.C. Workforce & Residents 17Exhibit 7: Minimum wage categories of D.C. Residents working in D.C. 18Exhibit 8: Workers in Tipped Occupations by Category, D.C. Workforce 20Exhibit 9: Poverty Rates by Wage Category, D.C. Workforce 21Exhibit 10: Average Wage and Tip Rates of Tipped Workers. D.C. Workforce 23Exhibit 11: Wage Categories of Tipped Workers 24Exhibit 12: D.C. Residents and D.C. Workforce in Relation to U.S. Population 26Exhibit 13: Minimum wage Workers by Residence and Place of Work 26Exhibit 14: Wage Distribution by Gender, D.C. Workforce 27Exhibit 15: Wage Distribution by Gender, D.C. Residents 27Exhibit 16: Minimum Wage and Total Workforce Populations by Age Group 28Exhibit 17: Minimum wage Workers by Age, D.C Workforce 29Exhibit 18: Minimum wage Workers by Age, D.C Residents 29Exhibit 19: Race/Ethnicity Breakdown among Wage categories, D.C. Workforce 30Exhibit 20: Race/Ethnicity Breakdown among Wage categories, D.C. Resident 31Exhibit 21: Minimum Wage and Total Workforce Populations by Race/Ethnicity 31Exhibit 22: Worker Education by Wage Category, D.C. Workforce 32Exhibit 23: Worker Education by Wage Category, D.C. Residents 32Exhibit 24: Full Time v. Part Time by Hourly Wage Category 33Exhibit 25: Average hours worked by Wage Category 33Exhibit 26: Poverty Status of Workers by Wage Category, D.C. Workforce 34Exhibit 27: Poverty Status of Workers by Wage Category, D.C. Residents 34Exhibit 28: Class of Worker Breakdown for D.C. Workforce and D.C. Resident Workforce 35Exhibit 29: Class of Worker Breakdown for D.C. Minimum Wage Workforce 36Exhibit 30: Industry Employment by Wage Category, Total D.C. Workforce 38Exhibit 31: Class of Worker Breakdown for Below $8.25/hour Population 39Exhibit 32: Wage Theft Population by Weeks Worked Discrete Variable 40Exhibit 33: Wage Theft Population by Industry 42Exhibit 34: Wage Category Breakdown of D.C. Workforce 44

V
November 2017
Acronym List
ACS American Community Survey
BLS Bureau of Labor Statistics
C2ER Council for Community and Economic Research
COLI Cost of Living Index
CPI Consumer Price Index
CPS ASEC Current Population Survey Annual Social and
Economic Supplement
CPS MORG Current Population Survey Merged Outgoing Rotation Group
D.C. District of Columbia
DOES Department of Employment Services
FLSA Fair Labor Standards Act
IMPAQ IMPAQ International, LLC
NBER National Bureau of Economic Research
OES BLS Occupational Employment Statistics

1
November 2017Minimum Wage Economic Impact Study
1
Executive Summary
IMPAQ International, LLC was contracted by the District of Columbia’s Department of Employment Services (DOES) to describe the impact of legislated increases in both the minimum wage and the tipped minimum wage. We used several Census-based datasets—primarily the American Community Survey (ACS) and the Current Population Survey Merged Outgoing Rotation Group (CPS MORG)—that feature individual-level data on employment status, demographics, income, job type, and numerous other variables, to provide a summary of the low- and minimum-wage D.C. workforce. This group will be affected most directly by the scheduled minimum wage increases. DOES specified a set of research questions that guided our analysis.
Of the many variables provided by the ACS and CPS, IMPAQ identified and summarized the D.C. low-wage population in terms of the following: residence, gender, age, race/ethnicity, education, full-time or part-time status, poverty status, type of establishment the employee works for, and the employee’s industry. We found that the typical minimum wage or low-wage D.C. worker is likely to be:
• A resident of D.C. rather than a commuter• Female rather than male• Younger rather than older, although roughly 75% of minimum wage workers are 25 and older• Black, Hispanic, or other non-White rather than White• Less educated than higher wage workers—71% of workers making under $15.00/hour have less than a Bachelor’s degree• Part-time rather than full-time, although minimum wage earners worked an average of
37.5 hours per week• Far more likely to live in an impoverished household than higher wage workers• Concentrated in the retail, wholesale, restaurant and food services, health care and
social services, and art, entertainment, and recreation industries.
Thus, the legislated minimum wage increases will disproportionately affect women, minorities, younger, less educated, and impoverished workers. Many workers with these characteristics are scheduled to receive significant wage raises until July 2020, which will slightly narrow the income gap between these minorities and their respective majorities.

Minimum Wage Economic Impact Study
2
November 2017
Exhibit 1: Research Questions, Data Sources, and Answers
However, any negative effects of the D.C. minimum wage policy are likely to fall on this population as well. Exhibit 1 shows the DOES research questions and our answers.
3
November 2017
Certain industries with high concentrations of low-wage jobs will experience a labor cost shock for a significant percentage of their workforce. Ranked in order of the share of their workforce earning below $12.50 per hour, the highest legal wage floor over the analysis period, are:
• Restaurant and Food Services (52.4%)• Retail trade (40.5%)• Art, Entertainment, and Recreation (37.6%)• Health Care and Social Assistance (23.8%)• Wholesale trade (18.9%)• Construction (18.1%)• Education (17.6%)
Rising minimum wages have special implications for the District’s tipped workers. The tipped minimum wage rises along with the standard minimum wage—increasing to $5.00 by 2020—which will benefit tipped workers by putting more cash in their pockets. But another interaction between wage and hour policies may benefit tipped workers even more. Employers of tipped workers in D.C. are required to fill any gaps between an employee’s weekly earnings and the amount they would have made had they earned the standard minimum wage. If paid, this provides two benefits to workers: 1) boosts their incomes, and 2) smooths their incomes from week to week to allow for smoother spending patterns over time. As the minimum wage progressively outpaces the earnings growth of tipped employees, increasing numbers of workers will have weekly earnings less than the statutory minimum wage. Meanwhile, there is no guarantee that employers will actually fill the gaps between average hourly earnings and the minimum wage in a given week. We recommend that special attention and effort be expended going forward to help ensure that employers of tipped workers comply with this requirement.
Our analysis revealed that many workers earned hourly wages below any of the legal minima during the analysis period. After a careful consideration of our sources of statistical error, we conclude that there is significant noncompliance with minimum wage laws among the private for-profit sector in D.C. Our estimates suggest that 4.83% of all jobs in D.C. during 2011-2015 involved some element of wage theft.
Minimum Wage Economic Impact Study
4
Introduction
Against a backdrop of rapidly divergent minimum wage policies across the country, the D.C. government chose to follow the lead of other large, high cost-of-living business hubs such as Seattle and San Francisco in raising its minimum wage. The D.C. Council enacted a series of legislative acts that incrementally raise its minimum wage from $8.25 in 2010—only $1 above the federal minimum—to $15.00 by 2020. After 2020, the minimum wage is set to increase with the Consumer Price Index (CPI) on a yearly basis.
Such a drastic increase over 10 years had two aims: to restore the value of the minimum wage to its past levels, as inflation has eroded that value in real terms; and to help The District’s residents keep pace with its rapidly increasing costs of living. Washington, D.C. is a high-road economy, where: 1) employers choose to locate to attract high-end talent, 2) market-set wages and benefits increase due to competition, and 3) businesses in all industries are constantly innovating to gain a comparative edge. The D.C. Council felt the need to set its wage floor to match the fast pace of its economy—rather than defaulting to the federal minimum, which was designed to be adequate in lower-road, less competitive economies.
The D.C. Department of Employment Services (DOES) contracted IMPAQ International (IMPAQ) to study the District’s minimum wage population, with the goal of better understanding the workers, families, businesses, and industries the legislation will impact. The IMPAQ team used a range of publicly available datasets to identify, analyze, and describe the low-wage population in D.C.
This study is organized as follows. In the rest of this chapter, we provide a brief overview of minimum wage legislation in Washington, D.C. We lay out this study’s objectives in Chapter 2, and the methodology used to reach these objectives in Chapter 3. In Chapter 4 we present our findings. In Chapter 5 we make concluding remarks.

5
November 2017
1.1 BACKGROUND
Passage of the Minimum Wage Act Revision of 1992 set the hourly minimum wage in the District of Columbia at $1.00 above the federal base pay, making D.C.’s rate the highest in the country that year.
This provision remained a reference for the D.C. minimum wage for the next 21 years, until the Minimum Wage Amendment Act of 2013 set further rate hikes to be gradually implemented in the three years following—with the District’s minimum wage then rising to $9.50 in July 2014, $10.50 in 2015, and $11.50 in 2016. After 2016, the minimum wage was to be tied to CPI, increasing every subsequent July. The 2013 amendment reasserted the requirement that employers of tipped workers, who can legally be paid below the minimum wage if they are regularly tipped by customers, make up the difference between a tipped worker’s actual earnings in a given week and what s/he would earn if paid the minimum wage. Employers of tipped workers were newly required to submit quarterly reports to DOES showing compliance with this requirement.
To continue this rising trend, the D.C. Council passed the Fair Shot Minimum Wage Amendment Act of 2016, to become effective in September 2016. This legislation established further minimum wage hikes, gradually raising the wage floor to $15.00 in July 2020. After this date, subsequent increases will be tied to CPI and occur automatically each year. Furthermore, the Act gradually raises the tipped minimum wage up from $2.77 to $5.00 by 2020.
The District is not alone in changing its minimum wage policy during this timeframe. The neighboring state of Maryland increased its minimum wage above the federal base pay for the first time in 2015, with scheduled hikes to reach $10.10 per hour in July 2018. Additionally, in Prince George and Montgomery counties—which border DC to the east
Title 32. Labor, Chapter 10. Minimum Wages: https://does.dc.gov/sites/default/files/dc/sites/does/publication/attachments/DOES_DC_Code_Sec_32_1001.pdfExceptions include tipped workers, students in high school and college, and certain disabled workers with certificates from DOL.Changes in basic minimum wages in non-farm employment under state law: selected years 1968 to 2016. https://www.dol.gov/whd/state/stateMinWageHis.htm Minimum Wage Amendment Act of 2013: http://dcclims1.dccouncil.us/images/00001/20131219112909.pdfFair Shot Minimum Wage Amendment Act of 2016: https://beta.code.dccouncil.us/dc/council/laws/21-144.html

Minimum Wage Economic Impact Study
6
and north, respectively—the minimum wage was set to $11.50 in July 2017. Virginia, in contrast, continues to adopt the federal minimum wage rate, which has been fixed at $7.25 per hour since 2008.
The D.C. minimum wage has increasingly distanced itself from the federal wage floor—a trend observable in several other states and localities with high costs of living and pro-worker governments (see Appendix A). According to the Cost of Living Index (COLI) of the Council for Community and Economic Research (C2ER), D.C. ranked as the fifth most expensive city in the United States in the second quarter of 2017. New York City, San Francisco, and Seattle ranked first, second, and ninth, respectively. Each has also recently passed legislation to increase the minimum wage to $15.00 per hour, scheduled to be effective as early as 2018.Based on the after-tax cost of a basket of goods for a professional’s standard of living, the COLI shows living expenses in D.C. to be about 53 percent higher than the urban national average, which covers 253 urban areas in the country. The gap is comparably high for individuals in the lowest fifth of the income distribution as well.
It is clear that D.C., along with other states and localities, is setting minimum wage policy to boost the incomes of low-wage workers. To inform D.C. policymakers on which income groups their new minimum wage policies will affect, this report provides a thorough description of minimum-wage earners in the District—not only the number of individuals, but also their place of residence and their demographics (including gender, education, and race/ethnicity). In the next chapters, we lay out the objectives and research questions driving the study, describe the methodology used to answer them, and report our findings and conclusions
Maryland Minimum Wage for 2016, 2017: ttps://www.minimum-wage.org/marylandUpcoming Minimum Wage increases [in New York state]: https://labor.ny.gov/workerprotection/laborstandards/workprot/minwage.shtmMinimum Wage Ordinance [in San Francisco]: http://sfgov.org/olse/minimum-wage-ordinance-mwoOffice of the Mayor, $15 Minimum Wage [in Seattle]: http://murray.seattle.gov/minimumwage/Cost of Living Index, Quarterly Update: http://coli.org/quarter-2-2017-cost-of-living-index-release/The basket of goods and services used to construct the composite index is based on expenses of six types: housing, utilities, grocery items, transportation, healthcare, and miscellaneous goods and services.

7
November 2017
2. Objectives and Research Questions
2.1 OBJECTIVES
While DOES has jurisdiction over the entire D.C. workforce, it is particularly interested in the specific population that works and resides in D.C., as these workers generally face higher costs of living than commuters. D.C. residents are also more likely to hold the District’s low-wage jobs, as shown in the data we present below. Therefore, per DOES’ request, we present two versions of each demographic breakdown we show in the report:
• The entire D.C. workforce, which includes all individuals currently working for an employer based in D.C., regardless of residence;
• The D.C. resident workforce—that is, all individuals currently living in the District of Columbia who also work for a D.C. employer.
To address the questions of interest to DOES, we make direct use of two data sources, as relevant to each question (see Exhibit 2 below):’
• American Community Survey (ACS)• Current Population Survey Merged Outgoing Rotation Group (CPS MORG)
In addition, we use the Current Population Survey Annual Social and Economic Supplement (CPS ASEC) for wage rate estimation.
2.2 RESEARCH QUESTIONS
Exhibit 2 summarizes the research questions this study answers in describing the D.C. minimum wage population, along with the data source we use for each. Topics of particular interest to DOES are: 1) wage and hour issues of the tipped workforce, 2) poverty and its ties to minimum wage rates, 3) the overtime exemption, and 4) how minimum wage increases will affect specific industries.

Minimum Wage Economic Impact Study
8
Exhibit 2: Research Questions

9
November 2017
3. Methodology
This study relies on descriptive methods to identify and describe in detail the two D.C. minimum wage populations of interest. To accomplish this, the IMPAQ team analyzed data from five different sources and generated the empirical results presented in Chapter 4. In the remainder of this chapter, we describe in detail the data sources we used (Section 3.1), as well as the operationalized definitions of key indicators (Section 3.2).
3.1 DATA SOURCES
To accurately capture the characteristics of current minimum wage workers in D.C., IMPAQ made direct use of two data sources (as shown in Exhibit 2 above):
American Community Survey (ACS), 2011-2015. The ACS is a nationally representative survey conducted by the U.S. Census Bureau. It is designed to collect up-to-date, yearly information at the community level and draws from an extremely large sample: nearly 3.5 million housing unit addresses throughout the United States are selected per year, 6,000 of which are in D.C. Such a large sample size enables us to generate estimates with high precision, especially for subgroup analyses, such as summary statistics by occupation and industry within a given geographical zone. Additionally, the ACS strives to minimize non-response bias by conducting in-person interviews of approximately one-third of those who did not complete the survey via mail or telephone, almost all of whom respond, for a response rate of 98 percent.
The ACS is key to our analysis, as it is the only Census-based dataset that includes an indicator for place of work. This allows us to identify the population that works in D.C., as distinct from the population that lives in D.C. without knowing whether they work there. As such, each of our estimates in Chapter 4 stems directly from the ACS—with other publicly available datasets, described below, filling in necessary variables the ACS lacks.
ACS offers single-year files, three-year files, and five-year files. As this analysis is concerned only with workers in D.C., our analysis requires a larger sample than the single-year files provide. We chose the 2011-2015 ACS five-year file, as it allows for
Minimum Wage Economic Impact Study
10
greatest statistical power of the three possibilities. Additionally, it has the most recent data offered by the ACS—the 2016 ACS single-year file has yet to be released at this writing. The Census Bureau reweights the 2011-2015 ACS file so that it represents the population in D.C. of 2015, even though the data points reflect respondents as they were at the time they were surveyed. Thus, all estimates in this report reflect the D.C. population size as it was in 2015.
Current Population Survey Merged Outgoing Rotation Group (CPS MORG), 2014, 2015, 2016. The CPS is a nationally representative survey administered by the U.S. Bureau of Labor Statistics (BLS) to U.S. households. Each household is surveyed monthly for four consecutive months, dropped for eight months, and then surveyed monthly again for another four-month period before being permanently dropped from the sample. The 2016 CPS MORG’s sample size is 200,000 individuals (one from each household surveyed), from which 2,500 reside in the District. We use the CPS MORG to add to our ACS estimates an indicator for whether an individual is paid by the hour or is salaried. This is required to determine whether a worker is exempt from overtime pay as specified in the Fair Labor Standards Act.
3.2 OPERATIONALIZED DEFINITIONS
Based on the research questions and the data sources described so far, the IMPAQ team used the following strategies to define key indicators of this study:
Hourly Earnings. The ACS provides variables on total wage and salary income in the reference year, typical hours worked per week, and weeks worked per year. Together, these allow the calculation of average hourly earnings for each survey respondent. The only caveat is that the weeks worked per year variable is not continuous, but divided into six response categories: less than 13 weeks, 14 to 26 weeks, 27 to 39 weeks, 40 to 47 weeks, 48 to 49 weeks, and 50 to 52 weeks.
To estimate hourly earnings, therefore, we must assign a specific number of weeks worked to each survey respondent, based on the range they reported to the ACS. To do so, we use data from the CPS ASEC. This is conducted in the spring of each year and provides information on work and income in the prior calendar year—including the information on total wages, weeks of work, and usual hours worked per week needed
11
November 2017
for calculation of estimated hourly earnings. We combine data from the 2011, 2012, 2013, 2014, and 2015 CPS ASEC to match the data collection years of the ACS used in our analysis.
We assign a specific number of weeks of work to workers in the ACS using cumulative probabilities developed from the CPS ASEC. We treat wage and self-employed workers the same, as the sample size is insufficient to develop separate estimates. The cumulative probabilities vary by weeks of work range (e.g., 1 to 13 weeks) and minimum hourly earnings range. This allows us to capture a worker with higher minimum hourly earnings because s/he worked more weeks within a given range than a worker in the same range with lower minimum hourly earnings. The minimum hourly earnings ranges, which vary by weeks of work range, are defined in such a way as to provide sufficient sample size for estimation while, to the extent possible, providing different probabilities for workers with minimum hourly earnings in the range most likely to be affected by the minimum wage increases. After imputing the number of weeks worked per year for each of our ACS respondents, calculating their average hourly earnings is straightforward.
Wage Categories. We divide individuals’ hourly wages into five categories:
• Less than $8.25 per hour• Between $8.25 and $12.50 per hour• Less than $12.50 per hour (the sum of the previous categories)• Between $12.50 and $15.00 per hour• More than $15.00 per hour
We chose these wage categories to reflect the multiplicity of the District’s minimum wage increases, starting from the span of ACS data collection in 2011 up to the runout of the Fair Shot Minimum Wage Amendment Act’s legislated increases to $15.00 in July 2020. Since the current minimum wage sits at $12.50, we refer to workers making less than this amount per hour as the below-minimum wage population. We define the minimum wage population in D.C. as workers making $15.00 per hour or less, whose wages will be most directly affected by the scheduled increases.
Minimum Wage Economic Impact Study
12
4. Study Findings
Section 4.1 of this chapter displays exhibits and analyses that answer each research question from DOES. The second section (4.2) describes the minimum wage workforce in D.C. to the fullest extent allowed by the ACS and CPS MORG.
4.1 ADDRESSING THE RESEARCH QUESTIONS
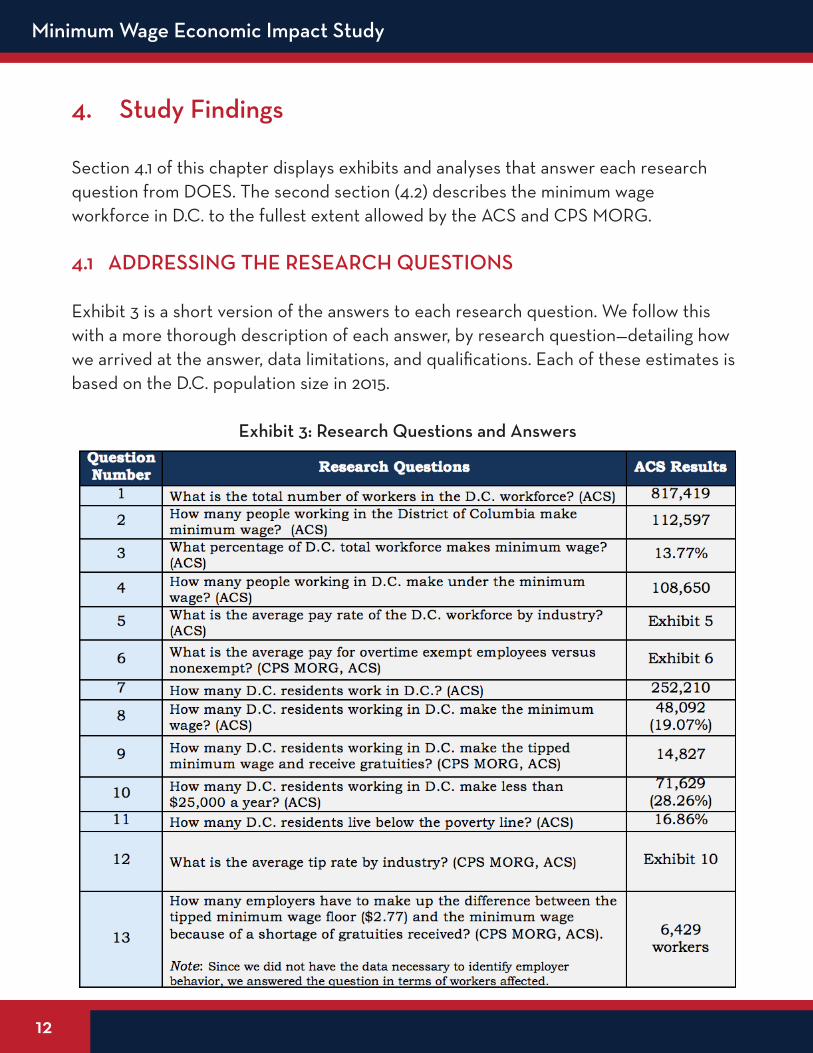
Exhibit 3 is a short version of the answers to each research question. We follow this with a more thorough description of each answer, by research question—detailing how we arrived at the answer, data limitations, and qualifications. Each of these estimates is based on the D.C. population size in 2015.
Exhibit 3: Research Questions and Answers

13
November 2017
Research Question #1: What is the total number of workers in the D.C. workforce?
The D.C. workforce in 2015 numbered 817,419 people. We estimated this number by using the place of work variable POWSP, which provides the state in which a survey respondent works. This number differs from the BLS estimate of the D.C. workforce, which was 769,258 in 2015. The reason for this difference is that BLS uses an establishment-level survey, which misses self-employed workers and those working without pay. The ACS estimates this group of workers to be 46,191 in 2015. Adding this number to the BLS private- and public-sector employment estimate yields 815,449, very close to our ACS estimate—which gives us high confidence in the reliability of the ACS number.
Research Question #2: How many people working in the District of Columbia make the minimum wage?
Census-based datasets, including the ACS, do not provide the specific hourly wage an individual makes. So, to answer this question, we estimated an individual’s average hourly wage by dividing self-reported income over the past year by our imputed numbers of weeks worked in the past year and the reported number of usual hours worked per week.
Among the entire D.C. workforce during the 2011-2015 period, adjusted to reflect the 2015 total, around 112,597 people were making $12.50 per hour or less (i.e., our definition of the below-minimum wage population) in 2015. But, since the hourly minimum wage in 2016 was still only $11.50, some portion of these employees were legally paid below our $12.50 cut-off point. Even so, as Exhibit 4 shows, a significant percentage of workers were earning an average hourly wage far below what was the legal minimum in 2011, the start of our measurement period.
12Bureau of Labor Statistics. “Economy at a Glance: District of Columbia.” https://data.bls.gov/timeseries/ SMS11000000000000001?amp%253bdata_tool=XGtable&output_view=data&include_graphs=true

Minimum Wage Economic Impact Study
14
Exhibit 4: Wage Category Breakdown of D.C. Workforce
Research Question #3: What percentage of the D.C. total workforce makes the minimum wage?
About 112,597 workers, or 13.77%, of the D.C. workforce made the current minimum wage or less between 2011 and 2015. Again, the majority of these workers were paid legally given the prevailing minimum wage at the time they were surveyed.
Research Question #4: How many people working in D.C. make under the minimum wage on average?
Approximately 108,650 workers averaged under $12.50 per hour from 2011-2015. This figure is estimated by taking the total of 112,597 workers making the minimum wage or less and subtracting the number of workers making exactly $12.50 per hour.
Research Question #5: What is the average pay rate of D.C. workforce by industry?
Exhibit 5 shows the average hourly pay rates of all D.C. workers by industry. Our industry categories come from the 2012 Bureau of Labor Statistics (BLS) industry codes, which are used in the most recent Census-based datasets.

15
November 2017
Exhibit 5: Average hourly wage of D.C. workforce by Industry
Research Question #6: What is the average rate of pay for nonexempt employees, and the average rate of pay for exempt employees?
Identifying the exempt and nonexempt populations of the D.C. workforce proved difficult, as there is no publicly available dataset that identifies workers by overtime exempt status. The ACS, which includes the place of work information required to describe the D.C. workforce, does not allow for direct imputation of a worker’s Fair Labor Standards Act (FLSA) overtime exempt status. We turned to the CPS MORG, which
Minimum Wage Economic Impact Study
16
includes variables that enable imputation of exempt status.
The situation is further complicated by the fact that overtime exempt qualifications have recently been in flux. The Obama Administration’s Department of Labor (DOL) passed a rule raising the salary threshold for overtime exemption to $913 per week, up from the previous standard of $455. But after an initial injunction blocking that rule’s implementation, it was permanently defeated in court on September 5th, 2017. At this writing, the Trump administration has not signaled any intent to issue a new rule, despite the Labor Secretary’s comments suggesting such an action.
Our methodology mirrors that of DOL, in a Notice for Proposed Rulemaking (NPRM), regarding the Obama Administration’s overtime threshold rule.
To qualify for overtime exempt status under FLSA, three requirements must all be satisfied. First, an exempt worker must be salaried rather than paid hourly. Second, this salary must amount to at least $455 per week. From there, the worker must have job duties that qualify him/her for one of DOL’s allowed exemptions: executive, for managers of other employees; administrative, for employees that do business support and use independent judgment; professional, for work that requires advanced knowledge in a field of science or learning; computer, for those who work with software or hardware of a computer network; outside sales, for those who have sales jobs away from the main office area; and highly compensated, for those making over $100,000 per year. In addition, DOL stipulates that only white collar employees may be classified as overtime exempt.
If a worker can be FLSA overtime exempt, s/he must be subject to FLSA in the first place. Many occupations are exempt from FLSA due to the nature of their work. These include, but are not restricted to, some agricultural occupations, fishermen, and workers on international waters. The ACS includes BLS occupational codes, so we determine FLSA status by excluding the same categories as does DOL in its NPRM on the overtime threshold.
13 Bloomberg BNA: https://www.bna.com/texas-judge-kills-n73014463988/14 U.S. Department of Labor, Wage and Hour Division. 2015a. “Defining and Delimiting the Exemptions for Executive, Administrative, Professional, Outside Sales and Computer Employees.” (Notice of Proposed Rulemaking, pdf). 29 CFR Part 541.

17
November 2017
The CPS MORG has a variable showing whether an individual is salaried, which is key to determining exempt status. We use the CPS MORG to determine what percentage of a given Census occupational code is salaried, as follows. After matching the CPS occupational codes to those of the ACS, we use the percentages acquired from the CPS to randomly designate individuals in the ACS as salaried or paid hourly, by occupational code.
In its methodology description, DOL also provides a list of probability codes, by occupational category, for whether a worker is FLSA overtime exempt. To determine the salaried status of individual workers, we applied these probability codes to all workers in our ACS sample whom we determined to be candidates for exemption—defined by being covered by FLSA, salaried, and earning at least $455 per week. We then randomly assigned exempt status to our ACS workers based on these codes.
Due to the interaction of random assignment with the weighting of the ACS, each iteration of the randomization produces slightly different results for the number of exempt versus nonexempt workers and their average pay. But all estimates fall into a tight enough range for statistically powerful conclusions to be drawn. Exhibit 6 shows our best estimates and their ranges for the total number and average pay by worker residence and exempt status.
Exhibit 6: Exempt v. Nonexempt Workers, D.C. Workforce & Residents
Of the D.C. workforce, about one in every five workers is overtime exempt—amounting

Minimum Wage Economic Impact Study
18
to roughly 162,584 overtime exempt and 654,887 nonexempt workers. Average pay for exempt D.C. workers is $113,592 per year, and for nonexempt workers is $70,235. The D.C. resident workforce averages lower average pay regardless of exempt status.
Research Question #7: How many D.C. residents work in D.C.?
Around 252,210 D.C. residents also work in D.C., according to the ACS variable for place of residence.
Research Question #8: How many D.C. residents working in D.C. make the minimum wage?
D.C. residents make up nearly one-third (30.85%) of the D.C. total workforce, of whom around 48,092 (19.07% of the total D.C. resident workforce) made $12.50 an hour or less. See Exhibit 7 for a more detailed breakdown.
Since this percentage is higher than the percentage of the total D.C. workforce making at or below $12.50 (13.77%), increasing the D.C. minimum wage will disproportionally affect D.C. resident workers compared to out-of-state commuters.
Exhibit 7: Minimum wage categories of D.C. Residents working in D.C
Research Question #9: How many D.C. residents working in D.C. make sub-minimum wage and receive gratuities?

19
November 2017
The tipped wage population is difficult to identify via Census-based datasets. The ACS does not provide a variable indicating whether or not an individual is paid in tips, or whether s/he makes the tipped minimum wage instead of the standard minimum wage. It does, however, provide an occupational code shared across all Census databases. The CPS MORG includes a variable asking if the individual usually receives overtime, tips, or commission while on the job, enabling us to estimate the D.C. tipped wage workforce as follows. We identified which Census occupational codes are likely to receive tips, and checked CPS MORG data to see if individuals with these codes reported that they often received tips as part of their job. The following occupations were identified:
• Bartenders• Counter attendants, cafeteria, food concession, and coffee shop• Waiters and waitresses• Food servers, non-restaurant (food delivery)• Miscellaneous food preparation and serving related workers (e.g. bartender
assistants)• Hosts & hostesses• Barbers• Hairdressers• Bellhops• Nail salon workers• Parking lot attendants
We counted each individual working in D.C. with one of these occupational codes to derive our ACS estimate of the D.C. tipped wage population.Note, however, that not every worker in these occupations was paid the tipped minimum wage. Nearly every waiter and waitress is tipped, for example, but a much smaller proportion of parking lot attendants receive tips. Valets and parking lot booth workers are both included in this category, but only valets are paid in tips—and the ACS provides no way to distinguish between the two. Given these data limitations, we report the total amount of employment for each tipped occupation, rather than our more unreliable direct estimates of tipped workers within each tipped occupation.To further complicate the analysis, the ACS sample sizes shrink drastically at this highly specific level of inquiry, producing estimates of the number of workers in each tipped occupation that are significantly lower than those the BLS Occupational Employment Statistics (OES) reports. OES, an establishment level survey reporting employment

Minimum Wage Economic Impact Study
20
totals by industry and occupation at various geographical distinctions, is better than the ACS for reporting employment by occupation at this level of analysis. Exhibit 8 shows the OES estimates of employment in tipped occupations in the D.C. workforce as of May 2016.
Exhibit 8: Workers in Tipped Occupations by Category, D.C. Workforce
*This figure does not include the employment total of massage therapists and barbers, as the OES does not have estimates for these occupations in its May 2016 release.
Waiters and waitresses make up the largest single category within the tipped workforce in D.C.—not surprising, given that this occupational category surely has the highest amount of workers that actually receive tips. The food and drinking services category alone accounts for 79.5% of the tipped workforce. This industry should be targeted first if any noncompliance issues crop up with employers of tipped workers.
15BLS Occupational Employment Statistics, Washington, D.C. May 2016 Estimates: https://www.bls.gov/oes/ current/oes_dc.htm

21
November 2017
Research Question #10: How many D.C. residents working in D.C. make less than $25,000 a year?
Approximately 71,629 D.C. resident workers (28.26% of this population) make less than $25,000 a year.
Research Question #11: What is the number of D.C. residents living below the poverty line?
Poverty in D.C. is a persistent and pervasive problem. The 2011-2015 ACS, weighted to reflect population numbers in 2015, puts the 2015 resident D.C. population at 647,484 individuals. Of these, about 108,337 (16.73%) live below the poverty line for their household—higher than the national rate of 15.5%. The poverty status of D.C. workers rather than residents, as described in this section, provides insight into how poverty rates are likely to change as average hourly wages increase.
Of the D.C. resident population, 5.75% live in an impoverished household, which is higher than the 2.26% poverty rate of commuters to the District. Two factors explain this difference: commuters are more highly paid than D.C. resident workers on average, and the cost of living is higher in D.C. than its surrounding areas.
Exhibit 9 shows a detailed breakdown of poverty rates within each hourly wage category of the D.C. workforce. This is the universe of workers who will be directly affected by minimum wage increases. In Section 3.4, as appropriate, we compare the poverty landscape for D.C. resident workers with that for the D.C. workforce as a whole. Exhibit 9: Poverty Rates by Wage Category, D.C. Workforce

Minimum Wage Economic Impact Study
22
Working poverty is, as to be expected, concentrated in the very-low wage workforce. A little over 29% of workers earning below $8.25 per hour live in an impoverished household, while 18.2% of those making below $12.50 an hour are impoverished. Their spouses, children, and any other dependents in their household live in poverty as well—making questions about the legality of wage payments to the low-wage workforce even more pressing.
If anything encouraging can be found in this chart, it’s that poverty rates decline dramatically as wages increase—suggesting that poverty will decline as subsequent minimum wage hikes boost workers to higher income categories. In particular, those 4,794 workers making between $8.50 and $12.50 per hour should have seen significant raises due to the increasing wage floors. But for workers earning under $8.25 per hour on average, it is doubtful that they will see any income gains at all. If their employers were denying them the minimum wage before these increases, there is no reason to think these employers will be more likely to comply as the legal minimum increases.
Research Question #12: What is the average tip rate in the Food & Restaurant and Leisure & Hospitality Industries?
The tip rate is defined as the average hourly amount earned in tips by a given employee. If we base the tip rate on imputed average hourly earnings, the tip rate will be simply average hourly earnings minus the employee’s base wage. However, not all tipped employees are paid the sub-minimum rate of $2.77 per hour. Since bus boys, for example, do not usually make a significant amount in tips, their employers pay them a base rate higher than $2.77 to avoid having to make up the weekly difference between their earnings and the statutory minimum wage. But since waiters and waitresses regularly make enough tips to put them over the weekly earnings minimum, their employers pay only the minimum base rate.
Furthermore, not every worker in these occupational categories is paid a tipped minimum wage in the first place. Take the hosts and hostesses category for example—the vast majority of these workers are paid the minimum wage or more, but they are counted as tipped workers because many are involved in a tip share system within the establishment. It would be dishonest and unhelpful to report tip rates for occupations where most workers are paid the statutory minimum wage rather than the lower tipped wage. Therefore, we choose to report tip rates only for occupations that have a significant majority of workers actually receiving the tipped minimum wage.

23
November 2017
Exhibit 10 summarizes the average hourly wage and tip rates of these occupations, as reported in the OES May 2016 release, on the assumption that all employees in those occupations earn the tipped minimum wage of $2.77. Each tipped occupation has an average hourly wage lower than the average wage of its corresponding industry. Tipped occupations are lower-paid in general, and they are more susceptible to wage theft than other occupations if only for the reason that there are more possible ways for employers to withhold proper pay. It would be very easy for employers to neglect in filling gaps between weekly earnings and the minimum wage, and even more so as the minimum wage increases.
Exhibit 10: Average Wage and Tip Rates of Tipped Workers. D.C. Workforce
Research Question #13: How many employers have to make up the difference between the sub-minimum wage floor ($2.77) and the minimum wage with additional wages because of a shortage of gratuities received?
Since we do not have the data necessary to focus on employers, we answer this question in terms of the number of employees affected. We interpret this question to be asking the number of employers who would have to fill gaps in weekly earnings with any amount of regularity. This includes all tipped workers averaging less than $12.50 on

Minimum Wage Economic Impact Study
24
average, and we estimate roughly 50% of tipped workers earning between $12.50 and $15.00, as their tip earnings vary week to week.
Our reasoning is the following: For tipped workers who averaged below $12.50 per hour in weekly earnings, simple arithmetic requires that their employers should have filled gaps in their pay for at least one week out of the year, but likely far more than that, depending on the volatility of their tip earnings. Even workers averaging slightly more than $12.50 per hour would likely legally require this from their employers as well, if they have any weekly volatility in earned tips. Only tipped workers who averaged above, say, $15.00 per hour would be unlikely to average less than $12.50 per hour in any given week.
This question requires use of the ACS for its microdata, as OES only offers aggregate statistics. A problem with using ACS data, as noted, is that sample sizes are too small to make reliable estimates of D.C. averages at the occupation level. This sample size issue is mitigated when we look at the wage distribution of the entire tipped population, however. Therefore, we assume that the distribution of workers among wage categories in the ACS sample is similar to the actual distribution as represented by the OES figures. Exhibit 11 breaks down the tipped population by wage category under these assumptions, estimating the number and proportion of workers in each category whose employers should legally fill weekly wage gaps.
Exhibit 11: Wage Categories of Tipped Workers
16 An amount of 900 Barbers was assumed only for the purposes of calculating this weighted average.
25
November 2017
Roughly 15,647 workers (56.6% of the tipped workforce), made less than the minimum wage on an average in at least one week of the reference year. This amount is expected to increase over time, as tipped worker earnings are unlikely to scale up commensurately with future minimum wage hikes given that each increase in the tipped wage is smaller than the corresponding minimum wage increase.
Raising minimum wages have already had important implications for tipped workers in D.C. Back when the D.C. minimum wage was still $8.25, for example, significantly fewer employees needed their weekly pay supplemented, as the gap between their hourly earnings and the minimum wage was much narrower. Now that the minimum wage will have doubled by 2020, many more tipped employees will need their weekly wages supplemented.
Currently, DOES requires that employers of tipped workers send quarterly reports of hours worked and employee earnings to show they are in compliance with wage and hour laws. In light of this backdrop, DOES should perform a full review of the process by which it requests, tracks, and enforces the requirement of employers to fill weekly earnings gaps—because it is likely that this reporting requirement only became relevant to many establishments, particularly restaurant establishments, once the minimum wage began to ramp up. Education and outreach efforts to the restaurant sector generally would be prudent. Investigations could be focused on lower-end restaurants, to focus on increasing compliance among establishments that have only recently been legally obligated to fill wage gaps.
4.2 ADDITIONAL CHARACTERISTICS OF THE TARGET POPULATION
Residence and Work Location
Taking a deeper look at the residency breakdown via the ACS, we see that there are 817,419 people working in D.C. and 647,484 people living in D.C., while the overlap between these two groups is 252,210. About 130,869 D.C. residents (39%) work in other states, and 565,251 D.C. workers (69.1%) live outside D.C.—mainly in Virginia and Maryland. Those D.C. residents working in other states are obviously not covered by the new minimum wage legislation, leaving them outside the target group we seek to describe.

Minimum Wage Economic Impact Study
26
Exhibit 12: D.C. Residents and D.C. Workforce in Relation to U.S. Population
The first thing to note is that, during the 2011-2015 period a higher proportion of D.C. resident workers made the minimum wage or lower (19.16%) than non-D.C. residents who commuted to the District (11.41%). The less favorable work circumstances of the D.C. resident workforce run through the comparisons described below.
Exhibit 13 shows that District residents make up 30.9% of the D.C. workforce, but hold up to 43.0% of District jobs paying less than $12.50 hourly. Among D.C. workers making over $15.00 per hour, only 28.5% are D.C. residents. Raising the minimum wage will disproportionately affect D.C. residents, which is encouraging, as the cost of living in D.C. is generally higher than in the surrounding area.
Exhibit 13: Minimum wage Workers by Residence and Place of Work

27
November 2017
Gender
When we break down the D.C. workforce by hourly wage and gender, we find that there are slightly more female (52.1%) than male workers making at or under the minimum wage. Comparing this to the fact that only 48% of the D.C. workforce is female shows that women are highly overrepresented at the low end of the wage distribution—a lack of gender balance that likely plays a significant role in the gender disparity in poverty. The scheduled minimum wage raises is likely, therefore, to disproportionately affect female low-wage workers, somewhat narrowing D.C.’s gender inequality in pay and poverty rates.
Exhibit 14: Wage Distribution by Gender, D.C. Workforce
Exhibit 15: Wage Distribution by Gender, D.C. Residents
Even though more female D.C. residents have D.C. jobs than do male D.C. residents,

Minimum Wage Economic Impact Study
28
male workers occupy higher wage categories disproportionately compared to their overall representation.
Age
It is helpful to examine the age range of the D.C. minimum wage population, to see the breakdown of what ages of workers will benefit from a wage hike. As shown, the commonly repeated assertion in the national minimum wage debate that the vast majority of minimum wage workers are teenagers or young people (who are assumed to be either supporting their primary family income or working for spending money) is a fallacy. Exhibit 16 shows the age breakdown into categories of the minimum wage population and the larger workforce for both the overall D.C. workforce and the D.C. resident workforce.
Exhibit 16: Minimum Wage and Total Workforce Populations by Age Group

29
November 2017
Only 4.2% of all minimum wage D.C. workers are teenagers (upper left pie chart); and 75.2% are 25 or older. For the D.C. worker resident population, 65.6% of all minimum wage workers are at least 25 years old. While younger workers are overrepresented in the minimum wage D.C. workforce when compared to their distribution in the overall workforce, the vast majority of the D.C. minimum wage workforce is over 25, and thus far more likely to be a primary income earner for their household than the younger workers. At least in this sense, minimum wage increases are not poorly targeted when it comes to helping those who need it.
Exhibits 17 and 18 break down each age group by wage category for both the D.C. workforce and the D.C. resident workforce. For both populations, the percentage of workers making the minimum wage drops as age increases. This is as expected, as people often achieve pay increases via job switching as they get older.
When compared to the entire D.C. workforce, D.C. resident workers have a higher percentage earning the minimum in every age category other than 16-19 year olds. It follows that minimum wage increases will disproportionately affect D.C. residents in each wage category except the youngest, and even for that group the difference is very small.
Exhibit 17: Minimum wage Workers by Age, D.C Workforce
Exhibit 18: Minimum wage Workers by Age, D.C Residents

Minimum Wage Economic Impact Study
30
Race/Ethnicity
Since Whites, Blacks, and Hispanics make up the majority of the D.C. workforce, we focus on these population groups in our description of the minimum wage D.C. workforce. Exhibit 19 gives a sense of how each racial/ethnic category cuts across our wage categories for the D.C. workforce population.
Exhibit 19: Race/Ethnicity Breakdown among Wage categories, D.C. Workforce
While the majority of workers in each of the three race/ethnicity groups makes more than $15 per hour, Blacks, Hispanics, and mixed race or workers of other races have much higher percentages of their D.C. working populations earning lower wages than does the white D.C. working population. Non-white D.C. workers are more than twice as likely to hold low-wage jobs as their white counterparts. Only 7.1% of white workers had jobs paying below the minimum wage in D.C., while this share is more than tripled for African American workers, nearly a quarter of whom earn the minimum wage or below.
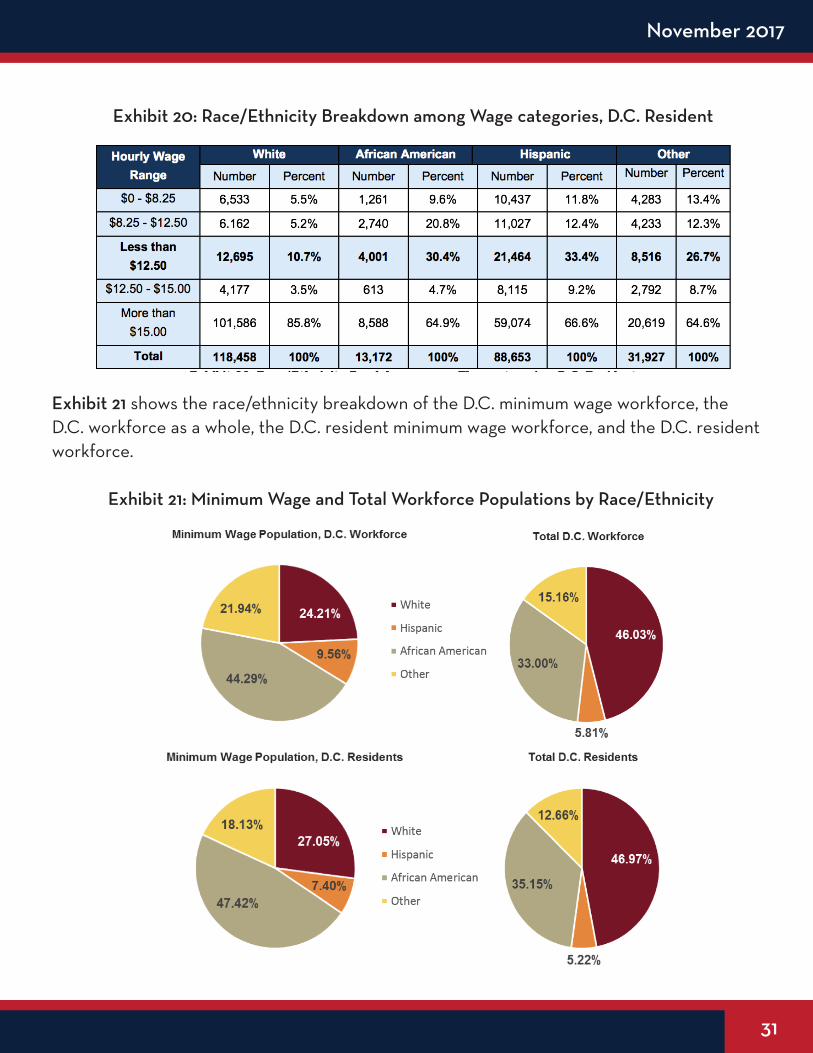
Exhibit 20 shows that these inequalities are even slightly greater for the D.C. resident workforce, particularly for Hispanics, one-third of whom hold low-wage jobs compared to only 17% of D.C. Hispanic workers. In addition, every race/ethnicity category has a higher share of low-wage workers than the D.C. workforce, reflecting the fact that D.C. resident workers average lower paying jobs than commuters.
31
November 2017
Exhibit 20: Race/Ethnicity Breakdown among Wage categories, D.C. Resident
Exhibit 21 shows the race/ethnicity breakdown of the D.C. minimum wage workforce, the D.C. workforce as a whole, the D.C. resident minimum wage workforce, and the D.C. resident workforce.
Exhibit 21: Minimum Wage and Total Workforce Populations by Race/Ethnicity
Education

Minimum Wage Economic Impact Study
32
Education
Exhibits 22 and 23 show how education levels are distributed among wage categories within the D.C. workforce. As education levels increases, the share of minimum wage workers decreases drastically. About 41% of workers without a high school diploma or GED make the $12.50 minimum wage level, compared to only 8.2% for workers with a Bachelor’s degree. In fact, 73% of all D.C. workers making under $12.50 per hour have an Associate’s degree or lower. A rising minimum wage will raise wage levels for less educated D.C. workers in higher proportions than for their counterparts with a Bachelor’s degree or higher.
Exhibit 22: Worker Education by Wage Category, D.C. Workforce
Exhibit 23: Worker Education by Wage Category, D.C. Residents
Full Time versus Part Time
We would like to know which workers are full time, defined as whether or not they work at

33
November 2017
least 35 hours per week, on the assumption that full-time workers are more likely to be working to support themselves and others than those who work less than full time. Exhibit 24 shows that low-wage workers are more likely to work fewer than 35 hours per week than those in higher wage categories. This is probably tied to the age distribution among the wage categories—with younger workers, who don’t necessarily rely on their earnings to live and support others, more likely to hold low-wage jobs. Still, almost 70% of the below-minimum wage workforce work full time, meaning that further wage hikes will significantly boost their incomes.
Exhibit 24: Full Time v. Part Time by Hourly Wage Category
Looking at the average of hours worked per week by wage category is also relevant in considering the impact of minimum wage increases, because individuals tend to work more hours if they can get a higher marginal return for each hour worked. While lower wage categories work fewer weekly hours on average, even the lowest paid workers put in an average of 36 hours per week. This suggests they rely heavily on their income.
Exhibit 25: Average hours worked by Wage Category
Poverty
An individual’s poverty status is determined by the Census Bureau by his/her
Minimum Wage Economic Impact Study
34
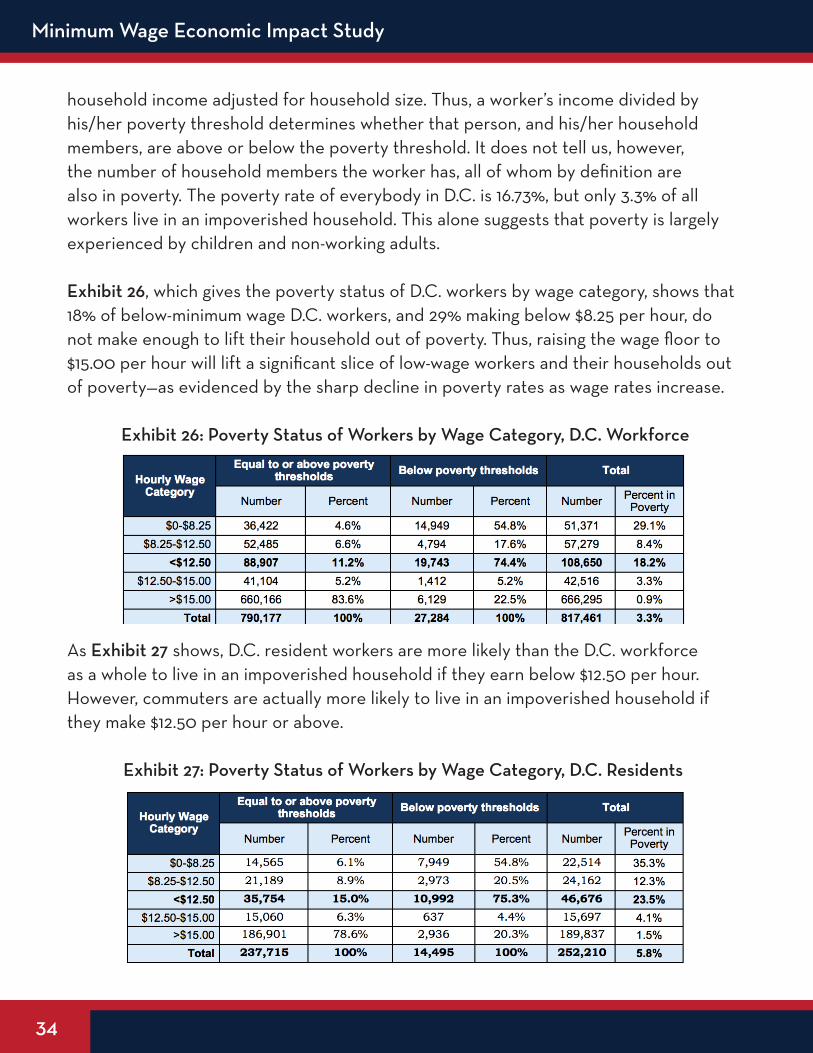
household income adjusted for household size. Thus, a worker’s income divided by his/her poverty threshold determines whether that person, and his/her household members, are above or below the poverty threshold. It does not tell us, however, the number of household members the worker has, all of whom by definition are also in poverty. The poverty rate of everybody in D.C. is 16.73%, but only 3.3% of all workers live in an impoverished household. This alone suggests that poverty is largely experienced by children and non-working adults.
Exhibit 26, which gives the poverty status of D.C. workers by wage category, shows that 18% of below-minimum wage D.C. workers, and 29% making below $8.25 per hour, do not make enough to lift their household out of poverty. Thus, raising the wage floor to $15.00 per hour will lift a significant slice of low-wage workers and their households out of poverty—as evidenced by the sharp decline in poverty rates as wage rates increase.
Exhibit 26: Poverty Status of Workers by Wage Category, D.C. Workforce
As Exhibit 27 shows, D.C. resident workers are more likely than the D.C. workforce as a whole to live in an impoverished household if they earn below $12.50 per hour. However, commuters are actually more likely to live in an impoverished household if they make $12.50 per hour or above.
Exhibit 27: Poverty Status of Workers by Wage Category, D.C. Residents

35
November 2017
Class of Worker
The ACS includes a variable for “Class” of worker—which, in essence, delineates whether they work for a for-profit, a non-profit, some element of the government, or are self-employed. Exhibit 28 breaks down the D.C. workforce and D.C. resident workforce by these employer categories. As can been seen, D.C. is an atypical labor market because of its high concentration of federal government jobs.
Exhibit 28: Class of Worker Breakdown for D.C. Workforce and D.C. Resident Workforce
Percentages in each worker class are fairly similar between the D.C. resident worker population and the D.C. workforce as a whole. The only difference worth noting is that fewer D.C. residents work for the federal government, which tends to be a more generous employer than those in the private sector. Exhibit 29, which shows the employer class breakdown for the D.C. minimum wage population, is further evidence that higher shares of workers employed by private, for-profit employers are associated with lower wages––with nearly 82% of all minimum wage D.C. workers employed by private (for-profit or not-for-profit) employers. The discussion of noncompliance later in the report confirms that the vast majority of D.C. workers making below the legal minimums in effect over 2011-2015 were employed by the private sector.

Minimum Wage Economic Impact Study
36
Exhibit 29: Class of Worker Breakdown for D.C. Minimum Wage Workforce
Industry
The D.C. workforce cut by ACS industry categories is shown in Exhibit 30. These categories, taken from the ACS variable INDP, correspond to BLS 2012 industry codes.
Exhibit 30: Industry Employment by Wage Category, Total D.C. Workforce
17See the data dictionary for more detail on which sub-industries are in our industry categories. ACS PUMS 2011-2015 Data Dictionary: https://www2.census.gov/programs-surveys/acs/tech_docs/pums/ data_dict/PUMS_Data_Dictionary_2011-2015.pdf

37
November 2017
More than half (52.4%) of restaurant workers averaged below $12.50 an hour. Retail (which includes workers at grocery, clothing, liquor, and other types of consumer goods stores) has the second-highest proportion of workers making below $12.50, at 41%. The art, entertainment, and recreation industry (which includes workers at museums, performing arts or sports centers, bowling allies, and casinos) is in third place, at 37.6%. And almost a quarter (23.8%) of health care and social assistance workers (which include child day care and vocational rehabilitation workers) worked for less than $12.50 an hour. Although nearly all industries have some workers earning at these low levels, further minimum wage hikes will primarily burden businesses in the industry categories with the highest proportions of low wage workers.

Minimum Wage Economic Impact Study
38
4.3 ESTIMATING NONCOMPLIANCE
The detailed description of the D.C. workforce featured in the previous sections of this chapter are also helpful for estimating the incidence of wage theft—that is, noncompliance with wage and hour regulations—in the D.C. workforce. In this section, we use the ACS to whittle down the total workforce into the very low-wage population, which is most likely to be subject to wage theft. Analysis of this type (using Census-based datasets to estimate wage and hour noncompliance) has an established precedent. In 2014, as noted, the Eastern Research Group published a report sponsored by DOL that estimated the amounts and economic costs of wage and hour violations in California and New York, using a variety of Census-based datasets. They find that about 3.5% to 3.9% of FLSA covered, non-overtime exempt workers experienced wage theft in California, while the figure for New York is north of 4%. The situation is unlikely to be much different in D.C.
The lowest legal amount a D.C. employee could be paid per hour on a weekly basis was $8.25 during the 2011-2015 period. While employers of tipped workers could pay only the tipped minimum wage to their employees, they nevertheless were, and currently still are, required to make up the difference between their employees’ weekly earnings and what they would have earned if they had worked their weekly hours for the statutory minimum wage. As a result, there should be no workers who earned under $8.25 per hour on average in a given year. However, our hourly wage imputations suggest that 51,371 workers failed to average this amount.
One possible explanation for such a high number of workers making under the legal minimum wage could be that they are self-employed, and thus are not bound to pay themselves any certain amount. If they work for a private, for-profit employee, however, they are certainly subject to wage and hour regulations. Exhibit 31 breaks down the below-$8.25 D.C. workforce by class of worker.
Note, first, that only 5.4% of the D.C. very low-wage workforce is self-employed or working without pay. Interestingly, the distribution of below-$8.25 workers by class of worker is very similar to that for the sub-$12.50 population. Approximately two-thirds
18 The Social and Economic Effects of Wage Violations: Estimates for California and New York.” https://www.dol.gov/asp/evaluation/completed-studies/WageViolationsReportDecember2014.pdf This analysis uses the CPS and SIPP, while we are restricted to the ACS for its place of work variable. Regardless, the framework of estimation is very similar.
39
November 2017
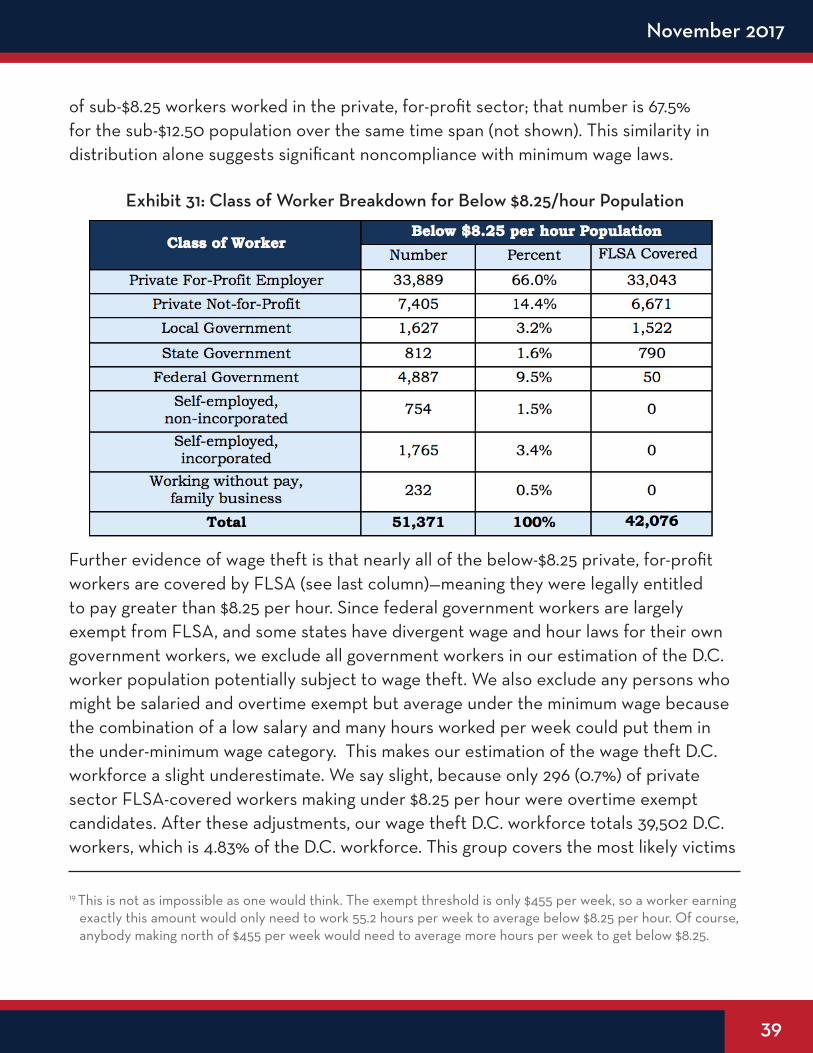
of sub-$8.25 workers worked in the private, for-profit sector; that number is 67.5% for the sub-$12.50 population over the same time span (not shown). This similarity in distribution alone suggests significant noncompliance with minimum wage laws.
Exhibit 31: Class of Worker Breakdown for Below $8.25/hour Population
Further evidence of wage theft is that nearly all of the below-$8.25 private, for-profit workers are covered by FLSA (see last column)—meaning they were legally entitled to pay greater than $8.25 per hour. Since federal government workers are largely exempt from FLSA, and some states have divergent wage and hour laws for their own government workers, we exclude all government workers in our estimation of the D.C. worker population potentially subject to wage theft. We also exclude any persons who might be salaried and overtime exempt but average under the minimum wage because the combination of a low salary and many hours worked per week could put them in the under-minimum wage category. This makes our estimation of the wage theft D.C. workforce a slight underestimate. We say slight, because only 296 (0.7%) of private sector FLSA-covered workers making under $8.25 per hour were overtime exempt candidates. After these adjustments, our wage theft D.C. workforce totals 39,502 D.C. workers, which is 4.83% of the D.C. workforce. This group covers the most likely victims
19 This is not as impossible as one would think. The exempt threshold is only $455 per week, so a worker earning exactly this amount would only need to work 55.2 hours per week to average below $8.25 per hour. Of course, anybody making north of $455 per week would need to average more hours per week to get below $8.25.

Minimum Wage Economic Impact Study
40
of wage and hour noncompliance.
Before we discuss the statistics, we should note two sources of potential error in our estimates. First, every variable we rely on for this calculation is self-reported by survey respondents. The Census survey collection process follows a rigorous methodology to ensure accuracy, but the possibility of respondents misremembering or even lying on a survey question about income, hours of work, or weeks worked per year cannot be ignored. Another concern is that more respondents may round up their incomes than round down, leading to a slight underestimate of the wage theft population. Most average earnings estimates are far too low to be attributable to rounding errors, however.
The second error source is our imputation of weeks worked per year. Survey respondents are asked how many weeks they worked in the reference year, but their answers are reported in discrete categories. We used cumulative probabilities from the CPS ASEC to assign workers a continuous number for weeks worked per year, within the discrete categories established by the ACS. The concern here is that our imputation of weeks worked misestimates the actual number of weeks a survey respondent worked, which would result in our estimates of wages being higher or lower than actual hourly earnings. Our imputation process was designed to mitigate the effects of this bias, but the process still introduces variance into our estimates of weeks worked per year, which is magnified when dealing with a population as small as the D.C. wage theft population.
Exhibit 32 shows our estimated D.C. wage theft workforce broken down by respondents’ estimated number of weeks they worked in the reference year.
Exhibit 32: Wage Theft Population by Weeks Worked Discrete Variable

41
November 2017
While our imputed number of weeks worked varies from the actual number of weeks worked due to our estimation process, each of our estimates falls within the range reported by the survey respondent. This enables us to cut down on the variance in our imputations of weeks worked by looking only at the tightest ranges of the discrete weeks worked variable. The top two categories only range between three and two weeks, respectively. Thus, if our imputation process is wrong on the number of weeks worked, our wage estimates will still not be affected much, because the range of possible estimates is so small. We illustrate this below.
There were 25,135 workers in our wage theft population who worked 48 hours or more in the reference year. To make a conservative estimate of the error in our weeks worked imputation, we might estimate 1.5 weeks more or less than were actually worked. This would only move our hourly wage estimate by about 3%, however, which translates to $0.25 for a worker making $8.25 per hour. Of our 25,135 workers in the wage theft population who worked at least 48 weeks, 23,009 (91.6%) of them made an imputed hourly wage of $8 per hour or less. Even under the assumption that every worker within $0.25 of the legal minimum was not a victim of wage theft, we would still find 23,009 instances of it—and that’s only among employees who worked at least 48 weeks in a year. Statistical error in imputed weeks worked is clearly far too small to significantly increase or decrease our estimates of the number of workers experiencing wage theft.
Another concern relates the sample size and the weights that the ACS uses to turn individual respondents into statistics that represent the population. Our estimates of the wage theft population are based on the 2,372 actual survey respondents who earned below $8.25 per hour on average. For perspective, the ACS figures for the D.C. workforce as a whole are based on 40,388 actual survey respondents. This isn’t a case where the sample has too few actual survey respondents to extrapolate to the larger population.
One thing to note is the salaried/hourly status of the wage theft population. About 28,254 (71.5%) is paid hourly, while the other 11,248 (28.5%) is salaried. While wage and hour victims are usually thought of as hourly workers, salaried employees are subject to FLSA protections as well. Wage theft comes in many forms. Just as an hourly worker can be paid at a fixed rate that is below the minimum, so can a salaried worker’s hourly earnings average lower than the minimum wage if s/he works enough hours. Both hourly and nonexempt salary workers can be denied overtime pay as well, which is another common form of wage theft.

Minimum Wage Economic Impact Study
42
Additionally, it should be noted that nearly 64% of sub-$8.25 employees worked 48 weeks or more in the reference year. This suggests that a significant portion of the wage theft population relies on their income to support themselves and/or family members. The Eastern Research Group, in doing a more thorough analysis of wage theft with different Census-based datasets, concluded that minimum wage violations in California and New York led to the impoverishment of tens of thousands of individuals and children that would be above the poverty line had employers paid fair wages. Those numbers will be scaled down because of the District’s smaller workforce, but they nonetheless show that wage theft has disastrous effects on American families.
Exhibit 33 below breaks down the wage theft D.C. population by industry to determine which industries, if any, are especially problematic. No instances of wage theft were found in agriculture, mining, administration, and the military. Wage theft is concentrated in construction; retail; finance and insurance; professional, scientific, and technical Services; education; medical; restaurant; and other services. Importantly, the wage theft population makes up 21% of total Retail trade employment and 25% for the Restaurant industry. Together, they combine to cover 34% of the total wage theft population. For efficiency in enforcement resources, enforcement efforts should concentrate initially on the sectors estimated to have the densest concentration of noncompliant firms.
Exhibit 33: Wage Theft Population by Industry

43
November 2017
Within the restaurant sector specifically, a fair amount of noncompliance is likely to stem from employers failing to fill the gaps in the pay of their tipped workers. There are 3,047 (7.8%) tipped workers in the wage theft D.C. workforce, and 2,405 (78.9%) of these are in the restaurant sector alone. Current D.C. minimum wage law requires that employers of tipped workers submit quarterly payroll reports to DOES to prove they are in compliance with the weekly pay stipulation, as well as wage and hour laws generally. It appears that this process allows some restaurant sector employers to slip through the cracks—particularly, as noted earlier, because at least some of these have only recently been subjected to this requirement and may simply be ignorant of it.
5. Conclusion
In summarizing and describing the Washington, D.C. minimum wage population, this report delineates who will be affected by the progressive increases in the D.C. minimum wage to $15 per hour by July 2020. Our breakdowns of the minimum wage population by wage categories and demographics reveal that these scheduled increases will disproportionally boost wages of women, Blacks and Hispanics, younger workers, impoverished households, and D.C. resident workers (compared to the entire D.C. workforce).
Jobs paying below $12.50 per hour are found in every industry in D.C., but the retail; health care and social assistance; art, entertainment, and recreation; wholesale; construction; and education industries are the most conspicuous—having one-sixth or more of their jobs paying $12.50 or less over the 2011-2015 period. The retail and restaurant sectors especially will experience the biggest cost shock in the form of rising wages, with over 40% of their employment paid below $12.50 per hour.
Workers earning under $12.50 per hour are far more likely to live in an impoverished household than workers making over $15 per hour. Poverty is highly concentrated in households featuring workers that make under $8.25 per hour, many of whom are subject to wage theft. Raising the minimum wage to $15 per hour will provide modest relief for the many impoverished households that include low-wage workers. However, we estimate that noncompliance with minimum wage laws currently results in thousands of workers being impoverished who would not be if they in fact earned a legal wage. Obviously, legislated pay increases will only be effective to the extent that employer compliance can be enforced. Exhibit 34 shows the situation.
Minimum Wage Economic Impact Study
44
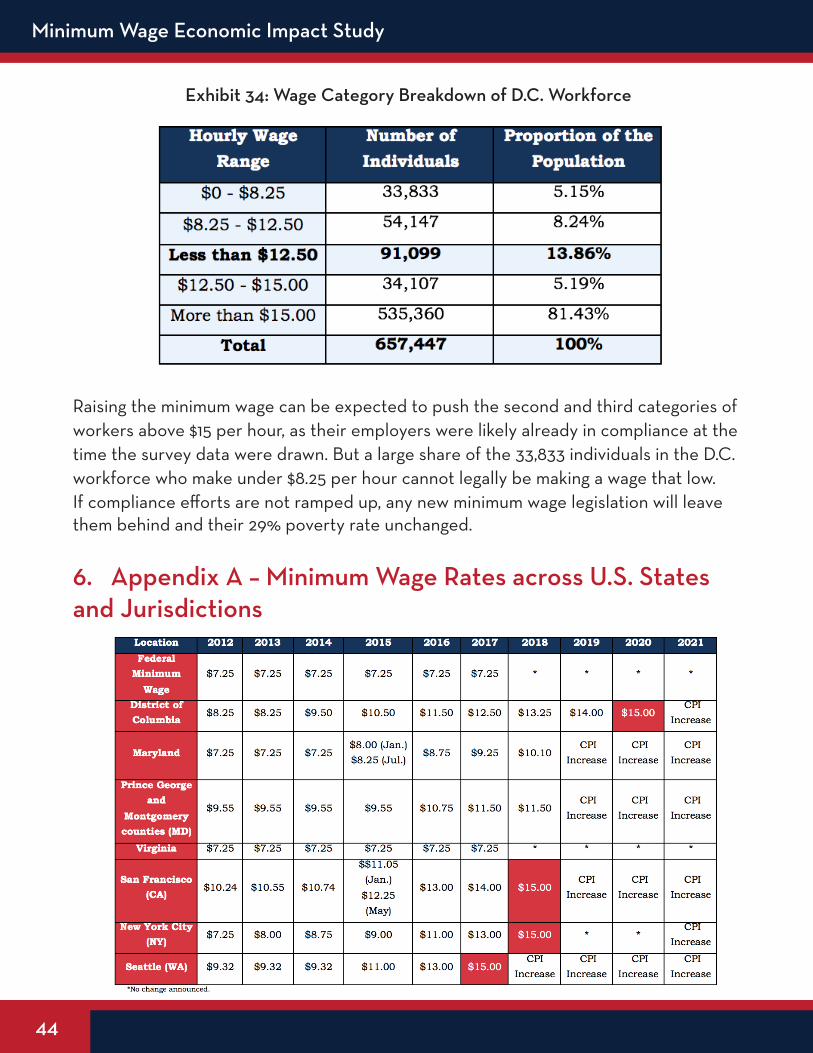
Exhibit 34: Wage Category Breakdown of D.C. Workforce
Raising the minimum wage can be expected to push the second and third categories of workers above $15 per hour, as their employers were likely already in compliance at the time the survey data were drawn. But a large share of the 33,833 individuals in the D.C. workforce who make under $8.25 per hour cannot legally be making a wage that low. If compliance efforts are not ramped up, any new minimum wage legislation will leave them behind and their 29% poverty rate unchanged.
6. Appendix A – Minimum Wage Rates across U.S. States and Jurisdictions

45
November 2017